Attached files
UNITED STATES
SECURITIES AND EXCHANGE COMMISSION
Washington, D.C. 20549
FORM 10-K
(Mark One)
☒ | ANNUAL REPORT PURSUANT TO SECTION 13 OR 15(d) OF THE SECURITIES EXCHANGE ACT OF 1934 |
For the fiscal year ended June 30, 2016
or
☐ | TRANSITION REPORT PURSUANT TO SECTION 13 OR 15(d) OF THE SECURITIES EXCHANGE ACT OF 1934 |
For the transition period from to
Commission file number: 001-34720
TELENAV, INC.
(Exact name of registrant as specified in its charter)
Delaware | 77-0521800 | |
(State or other jurisdiction of incorporation or organization) | (I.R.S. Employer Identification Number) | |
4655 Great America Parkway, Suite 300
Santa Clara, California 95054
(Address of principal executive offices) (Zip Code)
(408) 245-3800
(Registrant’s telephone number, including area code)
Securities registered pursuant to Section 12(b) of the Act:
Title of each class | Name of each exchange on which registered |
Common Stock, $.001 Par Value per Share | The NASDAQ Global Market |
Securities registered pursuant to Section 12(g) of the Act:
None
Indicate by check mark if the registrant is a well-known seasoned issuer, as defined in Rule 405 of the Securities Act of 1933, as amended. Yes ☐ No ☒
Indicate by check mark if the registrant is not required to file reports pursuant to Section 13 or Section 15(d) of the Securities Exchange Act of 1934, as amended. Yes ☐ No ☒
Indicate by check mark whether the registrant (1) has filed all reports required to be filed by Section 13 or 15(d) of the Securities Exchange Act of 1934 during the preceding 12 months (or for such shorter period that the registrant was required to file such reports), and (2) has been subject to such filing requirements for the past 90 days. Yes ☒ No ☐
Indicate by check mark whether the registrant has submitted electronically and posted on its corporate Web site, if any, every Interactive Data File required to be submitted and posted pursuant to Rule 405 of Regulation S-T during the preceding 12 months (or for such shorter period that the registrant was required to submit and post such files). Yes ☒ No ☐
Indicate by check mark if disclosure of delinquent filers pursuant to Item 405 of Regulation S-K is not contained herein, and will not be contained, to the best of the registrant’s knowledge, in definitive proxy or information statements incorporated by reference in Part III of this Form 10-K or any amendment to this Form 10-K. ☐
Indicate by check mark whether the registrant is a large accelerated filer, an accelerated filer, a non-accelerated filer, or a smaller reporting company. See the definitions of “large accelerated filer,” “accelerated filer” and “smaller reporting company” in Rule 12b-2 of the Exchange Act.
Large accelerated filer | ☐ | Accelerated filer | ☒ | |||
Non-accelerated filer | ☐ (Do not check if a smaller reporting company) | Smaller reporting company | ☐ | |||
Indicate by check mark whether the registrant is a shell company (as defined in Rule 12b-2 of the Exchange Act). Yes ☐ No ☒
The aggregate market value of voting and non-voting common equity held by non-affiliates of the registrant as of December 31, 2015, the last business day of the registrant’s most recently completed second fiscal quarter, was approximately $156 million (based on a closing sale price of $5.69 per share as reported for the NASDAQ Global Market on December 31, 2015). For purposes of this calculation, shares of common stock held by officers and directors and shares of common stock held by persons who hold more than 10% of the outstanding common stock of the registrant have been excluded from this calculation because such persons may be deemed to be affiliates. This determination of executive officer or affiliate status is not necessarily a conclusive determination for other purposes.
The number of shares of the registrant’s Common Stock, $.001 par value per share, outstanding as of June 30, 2016 was 42,707,692.
DOCUMENTS INCORPORATED BY REFERENCE
Portions of the registrant’s definitive Proxy Statement relating to its 2016 Annual Meeting of Stockholders are incorporated by reference into Part III of this Form 10-K where indicated.
TELENAV, INC.
FORM 10-K
TABLE OF CONTENTS
Page | ||
PART I | ||
ITEM 1. | ||
ITEM 1A. | ||
ITEM 1B. | ||
ITEM 2. | ||
ITEM 3. | ||
ITEM 4. | ||
PART II | ||
ITEM 5. | ||
ITEM 6. | ||
ITEM 7. | ||
ITEM 7A. | ||
ITEM 8. | ||
ITEM 9. | ||
ITEM 9A. | ||
ITEM 9B. | ||
PART III | ||
ITEM 10. | ||
ITEM 11. | ||
ITEM 12. | ||
ITEM 13. | ||
ITEM 14. | ||
PART IV | ||
ITEM 15. | ||
Special Note Regarding Forward-looking Statements and Industry Data
This Form 10-K contains forward-looking statements that are based on our management's beliefs and assumptions and on information currently available to our management. The forward-looking statements are contained principally in the sections entitled “Risk factors,” “Management's discussion and analysis of financial condition and results of operations,” and “Business.” Forward-looking statements include information concerning our possible or assumed future results of operations, business strategies, financing plans, competitive position, industry environment, potential growth opportunities and the effects of competition. Forward-looking statements include statements that are not historical facts and can be identified by terms such as “anticipates,” “believes,” “could,” “seeks,” “estimates,” “expects,” “intends,” “may,” “plans,” “potential,” “predicts,” “projects,” “should,” “will,” “would” or similar expressions and the negatives of those terms.
Forward-looking statements involve known and unknown risks, uncertainties and other factors that may cause our actual results, performance or achievements to be materially different from any future results, performance or achievements expressed or implied by the forward-looking statements. We discuss these risks in greater detail in “Risk factors” and elsewhere in this Form 10-K. Given these uncertainties, you should not place undue reliance on these forward-looking statements. Also, forward-looking statements represent our management's beliefs and assumptions only as of the date of this Form 10-K.
Except as required by law, we assume no obligation to update these forward-looking statements, or to update the reasons actual results could differ materially from those anticipated in these forward-looking statements, even if new information becomes available in the future. You should read this Form 10-K completely and with the understanding that our actual future results may be materially different from what we expect.
Corporate information
Our predecessor company, TeleNav, Inc., incorporated in the State of Delaware in 1999 and we incorporated in the State of Delaware in 2009 as TNAV Holdings, Inc. Pursuant to stockholder approvals received in December 2009, our predecessor company merged with and into us on April 15, 2010. As the entity surviving the merger, upon completion of the merger, we changed our name to TeleNav, Inc. In November 2012, we changed our name to Telenav, Inc. Our executive offices are located at 4655 Great America Parkway, Suite 300, Santa Clara, California 95054, and our telephone number is (408) 245-3800. Our website address is www.telenav.com. The information on, or that can be accessed through, our website is not part of this Form 10-K.
We file or furnish periodic reports, including our annual reports on Form 10-K, our quarterly reports on Form 10-Q and our current reports on Form 8-K, our proxy statements and other information with the Securities and Exchange Commission, or the SEC. Such reports, proxy statements and other information may be obtained by visiting the Public Reference Room of the SEC at 100 F Street, NE, Washington, D.C. 20549, by calling the SEC at 1-800-SEC-0330 or by sending an electronic message to the SEC at publicinfo@sec.gov. In addition, the SEC maintains a website (www.sec.gov) that contains reports, proxy and information statements and other information regarding issuers that file electronically. Our reports, proxy statements and other information are also made available, free of charge, on our investor relations website at http://investor.telenav.com/financials.cfm as soon as reasonably practicable after we electronically file such information with the SEC. The information posted on our website is not incorporated into this Form 10-K.
In this Form 10-K, “we,” “us” and “our” refer to Telenav, Inc. and its subsidiaries.
The names Always There Navigation™, Chatbaka™, Drive with Friends™, Evie™, Geobehavioral™, Geocookie®, … gets you and gets you there™, HopOver™, LivingMap™, Location Index ™, Location Score ™, MyTies™, MyMileage™, ONMYWAY®, PickMeUp™, RealReach™, RoadAssist™, Scout®, Scout GPS Link™, Sipity®, skobbler®, Situational Targeting™, Smart Planner™, Telenav®, Telenav Connected Service™, Telenav GPS Navigator™, Telenav Navigator™, Telenav Scout™ , Telenav Shotgun™, Thinknear®, Thinknear GeoVideo™, ThinkPolitical™TrueDelta™, and Whereboutz®, as well as the Telenav, Scout, skobbler and Thinknear logos are our trademarks. All other trademarks and trade names appearing in this Form 10-K are the property of their respective owners.
ii
PART I.
ITEM 1. | BUSINESS |
Overview
Telenav is a leading provider of connected car and location-based platform services. These services consist of our automotive and mobile navigation platform and our advertising delivery platform. Our automotive and mobile navigation platform allows Telenav to deliver enhanced location-based services to auto manufacturers, developers and end users through various distribution channels. Our advertising delivery platform delivers highly targeted advertising services leveraging our location expertise. We report operating results in three business segments: automotive, advertising and mobile navigation.
For our automotive segment customers, we offer our automotive and mobile navigation platform services to vehicle manufacturers and original equipment manufacturers, or OEMs, for distribution with their vehicles. We believe our history as a supplier of cloud-based navigation services provides a unique advantage in the automotive navigation marketplace over our competitors.
Our primary automotive customer to date, Ford Motor Company, or Ford, currently distributes our embedded, or on-board, product as a standard or optional feature with all of its models in the United States. Our automotive products are now included on models manufactured in North America, Europe and China, as well as in models in South America, Australia and New Zealand. In addition, in July 2015, Ford Australia and New Zealand adopted a map update program for its SYNC 2 generation of vehicles. Under this program, Ford owners with SYNC 2 or SYNC 3 in Australia and New Zealand are eligible to receive annual map updates at no additional cost through December 2023.
In January 2014, we entered into an agreement with General Motors Corporation, or GM, for integration of our on-board and connected navigation solutions in its vehicles, which we expect to launch in model year 2017. Our relationship with GM also includes our mobile phone-based wireless connectivity, or brought-in, services for vehicles including GM's OnStar RemoteLink® mobile application powered by our location-based services platform, which includes mapping and one-box search. In November 2015, the localized version of GM's OnStar RemoteLink® was launched in Europe for GM's Opel and Vauxhall brands.
In July 2015, we and Toyota Motor Corporation, or Toyota, announced a partnership for brought-in navigation services where our Scout GPS Link is available in Entune™ Audio Plus equipped model year 2016 and later Toyota vehicles in the United States. In August 2015, Toyota began shipping vehicles enabled to connect with our Scout® GPS Link mobile application, and as of June 2016, the ability to connect to our mobile application is a standard feature or is available as an option on more than 75% of 2016 Toyota models in the United States.
For our advertising segment customers, we believe our advertising delivery platform offers significant audience reach, sophisticated targeting capabilities and the ability to deliver interactive and engaging ad experiences to consumers on their mobile devices. We are experts in location-based advertising and believe we offer unique value to brick-and-mortar and brand advertisers through our location targeting capabilities. Our technology focuses on managing the complexity and scale associated with mobile location data to deliver better mobile campaigns for our advertising partners. We deliver mobile advertisements by leveraging our proprietary in-house ad serving technology. Our inventory, or accessible market, is comprised of thousands of mobile applications and mobile websites that are accessed through programmatic real-time bidding, or RTB, tools.
We derive revenue primarily from automobile manufacturers and OEMs and advertisers and advertising agencies. We receive revenue from automobile manufacturers whose vehicles contain our proprietary software and are able to access our personalized navigation services. These manufacturers have typically not provided us with any volume or revenue guarantees. In addition, we have a growing business in mobile advertising where our customers are primarily advertising agencies, which represent national and regional brands, and channel partners, which work closely with local and small business advertisers. We also derive a declining portion of revenue from our partnerships with wireless carriers, who pay us to enable their subscribers to use our mobile navigation services.
We generate revenue from the delivery of customized software and royalties from the distribution of this customized software in automotive navigation applications. For example, Ford utilizes our on-board automotive navigation product in its Ford SYNC platform. Ford pays us a royalty fee on SYNC 2 on-board solutions as the software is reproduced for installation in
1
vehicles with our automotive navigation solutions and pays us a royalty fee on SYNC 3 on-board solutions as our software is installed in the vehicle. In addition, we earn a one-time royalty for each new vehicle owner who downloads the GM OnStar RemoteLink® application, whereby we provide enhanced search capabilities for contracted service periods. We also earn a one-time royalty for each new Toyota vehicle enabled to connect with our Scout® GPS Link mobile application.
We generate revenue from advertising network services through the delivery of search and display advertising impressions based on the specific terms of the advertising contract.
We also generate a declining portion of our revenue from subscriptions to our mobile navigation services. End users with subscriptions for our services are generally billed for our services through their wireless carrier or through mobile application stores and marketplaces. Our wireless carrier customers pay us based on several different revenue models, including (1) a revenue sharing arrangement that may include a minimum fee per end user, (2) a monthly or annual subscription fee per end user, or (3) based on usage.
Our fiscal year ends June 30. In this Form 10-K, we refer to the fiscal years ended June 30, 2014, 2015 and 2016 and ending June 30, 2017 as fiscal 2014, fiscal 2015, fiscal 2016 and fiscal 2017, respectively. Our total revenue was $150.3 million in fiscal 2014, $160.2 million in fiscal 2015 and $183.3 million in fiscal 2016. Our net loss was $29.5 million in fiscal 2014, $23.1 million in fiscal 2015 and $35.3 million in fiscal 2016.
Navigation Services Platform
We have developed proprietary technologies that enable us to provide location-based mapping and navigation services. These technologies include both client-based and cloud-based services. Our client technologies include a navigation and guidance engine and tools allowing us to efficiently develop and deploy new applications for vehicles and mobile phones. Our back-end cloud services technologies allow us to deliver real-time location-based data for users and third party software developers that adopt our software development kit, or SDK, and application protocol interfaces, or APIs. We have developed a flexible platform that allows us to use multiple data providers for navigation, maps, points of interest, or POIs, traffic and other location-based content services. More recently, we have been expanding our offering of automotive solutions that utilize navigation to also enhance automotive OEM offerings of Advanced Driver Assistance Systems, or ADAS, and semi-autonomous capabilities. Such ADAS features use map attributes to tell the vehicle about upcoming road characteristics such as curvature and elevation. This information is used by the vehicle to improve fuel economy and safety.
In January 2014, we acquired skobbler GmbH, or skobbler, a leading provider of technologies that enhance the Open Street Map, or OSM, mapping data. By combining these technologies with other proprietary Telenav technologies, we have developed a range of OSM capabilities that allow us to use these crowd sourced maps for more advanced services such as navigation. We deployed OSM as part of our Toyota solution, whereby Toyota’s Entune™ Audio Plus equipped vehicles are enabled to connect with our Scout® GPS Link mobile application. We believe that focusing our efforts on OSM will better position us relative to our competitors and expand the nature and extent of our product offerings.
Our software and client application development processes, which include design, porting and publication processes, allow us to extend our services effectively and efficiently to different automobiles across various automotive platforms and in-car electronic systems to meet the requirements of automobile manufacturers and OEMs for our on-board and brought-in automotive products.
Our back-end cloud technologies include our Geographic Information System, or GIS, engines for local search, voice recognition, geo alert and advanced geo data aggregation, traffic and a local advertising platform. We have developed customized voice recognition technology built upon a third party voice recognition engine to serve the specific needs of navigation services customers. We leverage our existing back-end cloud technologies for deployment to automobile manufacturer and OEM solution applications. We utilize existing technology to expand the connectivity and service offerings for in-car experiences, including seamless interaction between end users' mobile devices and on-board automobile systems such as displays, sensors and audio for our automotive brought-in navigation solutions.
We have developed a search technology that focuses on information with localized relevance and accuracy to address the needs of automotive and mobile phone users. Our proprietary GIS provides fast route and map generation while optimizing the route based on current traffic conditions. Because our proprietary GIS efficiently uses computing resources, these efficiencies enable us to scale our servers more economically for our automotive brought-in solutions.
2
Advertising Delivery Platform
Our advertising platform allows us to deliver mobile advertisements on behalf of our advertising clients to consumers based specifically on the location of the consumer. We have developed proprietary technologies that enable us to deliver location-based advertising across all types of mobile devices at scale. Our platform integrates location-enabled mobile advertising inventory with a number of contextual and location-based triggers to allow us to target mobile users based on rich location data. We have demonstrated that targeting based on location data is more likely to engage consumers. Our platform permits us to bid and deliver ad impressions through advertising exchanges in less than 30 milliseconds and to do so on billions of potential impressions every day. In addition, we have the ability to target our mobile campaigns based on a variety of criteria beyond location. Our platform was built to provide scalability through the use of machine-based decision processes, which allows us to execute thousands of campaigns, each with complex targeting criteria across multiple inventory sources.
Services and Products
Automotive Navigation Services and Products
Industry background
We believe the automobile industry is undergoing a significant change in the way that it develops and acquires technology for vehicles. This shift is impacting both the OEMs and the tier one suppliers to automobile manufacturers. Historically a car included a collection of relatively distinct functional capabilities, for example the radio, the air conditioning system and the braking system. Each system operated independently and thus could be provided by a different third party supplier. More recently, this piece-by-piece approach to assembling cars has been replaced with a much more comprehensive and systematic approach, which integrates a number of technology solutions within a vehicle. This transition is evident in the changes to in-car infotainment solutions, of which consumers are demanding better integrated and more feature rich experiences. This transition has impacted the delivery of navigation services in the vehicle. For instance, automobile manufacturers have begun introducing lower priced navigation units as a central component of on-board entertainment and information systems rather than as standalone units and are making navigation standard on more vehicles. These integrated units extend beyond traditional navigation units by combining audio and voice capabilities with wireless network connectivity to deliver real time location services, such as traffic, weather information and other connected data.
Automotive navigation systems are typically on-board or brought-in. On-board services are the traditional service type with all key navigation elements of the system residing in the car as a self-contained service along with the related software and content, with the system not requiring access to the Internet or wireless networks to function. Brought-in systems are delivered wirelessly through a mobile phone or other device, such as a wireless modem, but use the car's internal electronic systems including the video screen and audio capabilities. In some cases, the on-board service is enhanced by the delivery of certain “live” data, such as current traffic conditions delivered wirelessly to the on-board system for display, which results in a type of hybrid service capability.
Industry challenges
The automobile industry is experiencing significant consumer demand for in-car connected services resulting from the availability of mobile phone-based Internet services which have reset consumer expectations. For example, current on-board navigation systems, or navigation systems that do not communicate with the Internet, are limited to the vehicle in which they are installed. The mapping and POI data is static, requiring time, cost and effort to update. Traditionally such systems have been sold as an optional feature for a one-time charge and as a result suffer from relatively low rates of adoption by consumers. Automobile manufacturers that can enhance the in-car experience with mobile connectivity and improved infotainment capabilities are finding greater acceptance from consumers, but the delivery of these capabilities is technically challenging and not a traditional part of the automobile manufacturer's capabilities. This challenge is driving automobile manufacturers to seek new partners to create differentiated in-car experiences. Automobile manufacturers and OEMs want to provide connected navigation services in a way that they can be used safely by the driver “keeping hands on the wheel and eyes on the road” and effectively integrate with large in-vehicle display or vehicle speakers, voice recognition and location sensors. In addition, the automobile industry has seen the recent introduction of in-car platforms and products such as Apple's CarPlay and Google's auto initiatives, including Open Automotive Alliance, which take control of the product and platform away from the automobile manufacturer or OEM and could diminish brand loyalty to the automobile manufacturer.
Our competitive strengths
Automobile manufacturers procure the various elements of each car that they manufacture from a number of suppliers directly and through OEMs. We work directly with automobile manufacturers such as Ford, GM and Toyota, as well as through
3
OEMs. Our strong track record as a connected and personalized navigation services provider to mobile phones and our history of working with large wireless carriers have provided us with skills and technology that are well suited to meet the demands faced by today's automobile manufacturers. The sales cycle related to automobile manufacturers is long and consultative and requires direct and continuous engagement with the automobile manufacturer and OEM providers to succeed in securing business. Often the automobile manufacturer uses the sales process to help it to define the ultimate product that it chooses to deliver to its end users in a way that not only enhances customer experience but also allows the automobile manufacturer to differentiate itself from the competition. Our success with brought-in and on-board navigation at Ford, GM and Toyota, and the continuing shift in emphasis to connected services has demonstrated the strength of our offerings to other automobile manufacturers and OEMs. It is our ability to bring innovative in-car user experiences that are optimized for the driving experience that sets us apart from other providers of phone based offerings, such as Apple's CarPlay and Google's auto initiatives.
Our automotive services and products
We entered the automotive navigation services business in fiscal 2008, initially with Ford, and our first brought-in navigation product was launched in Ford's model year 2010 vehicles. Since that time we have been working with automobile manufacturers and OEMs to provide our mobile navigation services and products worldwide through on-board and brought-in systems. Our technology powers automotive navigation services and products that provide accurate, easy to use and connected navigation services to drivers at a low cost. We currently provide our on-board GPS navigation software for Ford's second and third generation SYNC system under an agreement with Ford that expires in December 2017. The SYNC products are enhanced by Ford with the delivery of real-time traffic and historical information to help drivers search, find and drive to places more reliably and efficiently.
In January 2014, we announced that we entered into a contract with GM to provide worldwide embedded and connected navigation services beginning with select model year 2017 vehicles. The agreement covers an initial three-year production cycle, which we expect to commence with select model year 2017 vehicles. Our relationship with GM also includes brought-in services for vehicles. In January 2015, GM launched the new version of its OnStar RemoteLink® mobile application powered by our location-based services platform, which includes mapping and one-box search. Under the terms of the GM agreement, we expect our on-board and brought-in services to support navigation in more than 100 countries.
In July 2015, we and Toyota Motor Corporation, or Toyota, announced a partnership for brought-in navigation services where our Scout GPS Link is available in Entune™ Audio Plus equipped model year 2016 and later Toyota vehicles in the United States. In August 2015, Toyota began shipping vehicles enabled to connect with our Scout® GPS Link mobile application, and as of June 2016, the ability to connect to our mobile application is a standard feature or is available as an option on more than 75% of model year 2016 Toyota models in the United States.
Our services and products allow our automobile manufacturers and OEMs the flexibility to use the full range of technologies to deliver on-board or brought-in services, as well as to enhance our on-board navigation services with live data such as traffic, fuel prices, fresh maps and POIs for enhanced user experiences by drivers. In addition, as the market transitions to cars that are “always connected,” we expect our service offerings to become more personalized.
Platform and architecture
Our offerings for on-board or brought-in automotive navigation services are tailored to meet the requirements of the automobile manufacturers and OEMs while leveraging our expertise with respect to client design and functionality. Our automotive navigation products also offer the capability to connect to our auto and mobile navigation platform for updated data and services. We have created an automotive reference product, or ARP, which allows us to show auto manufacturers and OEMs our entire product portfolio capabilities. Auto manufacturers or OEMs may then elect to configure the ARP to meet their needs as an on-board system or an on-board system with connectivity to live data services. In addition, we have designed custom versions of our navigation products to be exclusively cloud-based solutions for those manufacturers or OEMs seeking connected solution only services.
Advertising Network Services
Industry background
The convergence of several factors is fundamentally changing the way mobile users consume content on their mobile devices and has created a significant opportunity for mobile advertising. It has become possible to deliver innovative, interactive and engaging consumer media experiences on a wide variety of mobile devices. Consumers are increasingly using their mobile devices instead of their personal computers and other traditional media to access content, particularly while they
4
are on the go. The convergence of powerful mobile devices and faster connectivity has enabled developers to create, and consumers to interact with, content that is instantly delivered to mobile devices.
Mobile advertising provides advertisers with a number of benefits over traditional advertising media and PC-based online advertising, such as anytime, anywhere access, personalization, location targeting and relevance. The development of the mobile advertising ecosystem has mirrored the development for online PC-based advertising. However, a key differentiator of mobile advertising is the ability to identify the location of the user. Location is a powerful indicator of an individual's interests and likely actions. Therefore, advertising delivered to mobile devices has the potential to increase the impact and relevance of an ad to the user. With mobile advertising, an ad can be targeted to a consumer who is in close proximity to a specific location, such as a retail store, or to a consumer who may live in an area that advertisers wish to target based on demographics or other characteristics. Given the benefits of mobile advertising as compared to traditional offline advertising and PC-based online advertising, we expect and market studies indicate that marketers will continue to shift their advertising budgets to mobile.
Industry challenges
The mobile advertising marketplace is a dynamic, fast growing industry with many new participants. Advertisers are transitioning significant portions of their marketing budgets to the mobile marketplace where many of the traditional approaches to engaging customers are different and the means to reach their customers presents new challenges. These advertisers need to be able to conduct ad campaigns that achieve favorable return on investment, or ROI. ROI typically includes elements related to message reach, audience targeting capabilities and campaign effectiveness measurements. Advertisers are particularly focused on measures of effectiveness for mobile which are much less mature and defined than other advertising options. The mobile advertising marketplace is comprised of application developers, advertising networks, mobile agencies, advertising exchanges and demand-side platforms, among others. This environment is becoming nearly exclusively “programmatic,” meaning that advertisers are buying impressions across exchanges in real time based on their desired audience. The various market participants tend to focus on specific elements of the marketplace and each try to deliver unique technology offerings to assist advertisers. Some focus on targeting, others audience data and still others, including Thinknear, on the location information that makes the mobile marketplace distinct from all other advertising opportunities. Tracking the performance of ads in applications and user interactions with those ads is difficult and requires significant technological capabilities and know-how.
Our competitive strengths
Our mobile advertising solution combines the large and growing pool of mobile impressions marked with location information, a unique ability to focus on particular audiences, and dynamic user content customizable based on location.
We have developed a number of techniques that allow us to differentiate between ad impressions that include highly-accurate location data and those that are inaccurate. Our proprietary Location Score Index measures the accuracy of location information within advertising impressions and the most recent index showed that only 32% of impressions were highly accurate. Our ability to effectively filter out inaccurate data is a key competitive advantage in the rapidly shifting mobile advertising space.
Because of our ability to identify real-time and historical location data, as well as our ability to ingest contextual targeting data, we can focus our ads on specified demographics and advertiser defined customer segments. For example, an ad delivered in a geographic area where it happens to be raining can provide a rain-related message. An ad for sunblock can be limited to areas with a high level of sunlight and ultraviolet radiation. In addition, it is our ability to do this at significant scale that allows advertisers to reach their target audience.
Our services and products
Our advertising services are built around the ability to provide sophisticated location-based advertising in a manner that allows advertisers to connect with consumers on mobile devices. For example:
Creatives - We run a wide range of creative ad units, including static, dynamic, mobile video and rich media content. Our creative allows national advertisers to easily “localize” their content without having to create thousands of individual campaigns. Our creative focuses on leveraging location data to incorporate local context such as distance to a store location, information on where to purchase a product or nearby events that could impact the potential consumer.
Targeting - We offer a variety of targeting tools to our advertising clients to improve the performance of the campaigns. Our targeting includes both audience-focused tools centered on reaching specific customer segments and proximity based tools focused on driving foot traffic to retail locations and other direct-response related metrics.
5
Reports and metrics - We offer clients a broad range of reporting that allows them to monitor all their advertising campaigns and explains clearly what is happening at any particular point in time with respect to any of the campaigns being run. Our platform provides advertisers with a rich set of analytics and insights.
Platform and architecture
Our mobile advertising platform is hosted in the cloud, primarily by Amazon Web Services, or AWS. We leverage the flexibility and scalability of these cloud service providers to meet our scale requirements.
Infrastructure and operations
Navigation Services
Our end users rely on our services primarily while on the road. As a result, we strive to ensure the continuous availability of our services through our high quality hosting platform and operational excellence.
Data center facilities. We developed our infrastructure with the goal of maximizing the availability of our applications, which are hosted on a highly scalable and available network located in AWS facilities in Oregon and Virginia.
We entered into hosted service agreements with AWS for primary resource capacity in addition to disaster recovery capacity. Pursuant to the service agreements, AWS provides leased facility space, power, cooling and Internet connectivity for a term of one year, and such agreements are subject to renewal.
Advertising network services
We developed our advertising network services infrastructure with the goal of maximizing the performance of our platform. Our platform is hosted on a highly scalable and available network provided by AWS. Our advertising platform has been designed to place significant focus on the location of any particular unit of display advertising made available for purchase on real time bidding ad exchanges. This focus on location provides our product with the speed and capability to more rapidly bid on the inventory that we believe is best suited for our customers' advertising needs. Our use of AWS provides significant flexibility with respect to service capability to meet any peaks in demand from our advertisers.
Research and development
Our research and development organization is responsible for the design, development and testing of our services and products. Our engineering team has deep expertise and experience in GPS and wireless and connected services and we have a number of personnel with longstanding experience with location services applications and scaling hosted service models. In addition, through our acquisition of Thinknear and our own internal efforts, we have developed expertise in real time bidding and advertising targeting capabilities.
Our current research and development efforts are focused on:
• | improving and expanding features, functionality and performance of our existing services; |
• | creating new applications, services and products for automobiles, mobile phones and mobile phone operating systems; |
• | developing key technology and content to reduce third party costs; |
• | developing innovative and engaging advertising products that allow for highly effective targeting of end users and provide for accurate measurement of behavior; and |
• | building features and functionality that allow OSM to be used as a substitute for commercial map services. |
Our development strategy is to identify features, services and products that are, or are expected to be, needed or desired by our end users.
As of June 30, 2016, our research and development team consisted of 451 people, 171 of whom are located in Santa Clara and Culver City, California and 280 of whom are located in Shanghai and Xi'an, China; Berlin, Germany; Cluj, Romania; and Incheon, South Korea. We have been successful in creating cross border capabilities in China, Germany and Romania for high value engineering at lower cost. Our U.S., China and Romanian research and development operations function together to
6
provide service and product development for our automotive customers. Our Romanian development efforts also focus on our OSM products. Our research and development expenses were $60.6 million, $68.1 million and $68.9 million for fiscal 2014, 2015 and 2016, respectively.
Marketing and sales
Automotive Navigation Services
In connection with sales efforts directed at auto manufacturers and OEMs, we employ a sales team that focuses on targeted customers and responds to requests for proposal and related sales opportunities.
The design and sales cycle for automotive navigation services and products is substantially longer than those associated with our advertising network services. The automotive sales cycle is long and consultative and requires direct and continuous management of the customer and OEM providers to succeed in securing business. Often the automobile manufacturer uses the sales process to help them to define the ultimate product that they choose to deliver to their end users. For example, design wins for vehicles may be awarded 12 to 36 months prior to the anticipated commercial launch of the vehicle. However, once we launch services with an automotive manufacturer, our application and services are typically bundled with the vehicles for multiple years because of the longer automotive product cycles.
Advertising Network Services
Marketing. We market our advertising services based upon our location expertise. We are building brand recognition and customer relationships based upon a consultative relationship with key advertising buyers, primarily advertising agencies. Given the mobile advertising marketplace is still in its infancy, we believe that we have an opportunity to influence the way buyers understand the advertising opportunity.
Sales. We are highly engaged in direct sales efforts to expand the reach of our mobile advertising solutions. We strive to improve the efficiency and productivity of our sales force, which may result in an increase in our advertising sales headcount during fiscal 2017; however, individual sales representatives typically take six to nine months to become fully productive.
Customers
We derive revenue primarily from automobile manufacturers and OEMs, and advertisers and advertising agencies. We derive our revenue primarily from automobile manufacturers and OEMs whose vehicles contain our proprietary software and are able to access our navigation services. In addition, we have a growing business in mobile advertising where our customers are primarily advertising agencies that represent national and regional brands, and channel partners that work closely with local and small business advertisers. We also derive a declining portion of our revenue from our partnerships with wireless carriers who sell our navigation services to their subscribers either as a standalone service or in a bundle with other data or voice services.
We generate revenue from automobile manufacturers and OEMs for delivery of customized software and royalties from the distribution of this customized software for on-board and brought-in automotive navigation solutions. In addition, we earn royalties from brought-in services for vehicle applications powered by our location-based services platform. We typically enter into long term supply arrangements with our auto customers to provide our solutions across multiple car models in multiple regions around the world.
We also generate revenue from advertisers and advertising agencies for the delivery of search and display advertising impressions based on the specific terms of the advertising contract.
Our revenue from customers located in the United States comprised 94%, 96% and 97% of our total revenue for fiscal 2014, 2015 and 2016, respectively.
We are substantially dependent on Ford for our revenue. In fiscal 2014, 2015 and 2016, Ford represented 46%, 61% and 71% of our revenue, respectively. We expect Ford to represent a significant portion of our revenue for the foreseeable future. We expect AT&T to continue to represent a declining portion of our revenue. In fiscal 2014, 2015 and 2016, AT&T represented 24%, 15% and 9% of our revenue, respectively.
We provide automotive-grade GPS navigation software to Ford pursuant to an agreement dated October 12, 2009. We are the preferred provider for GPS on-board navigation integrated with Ford's second-generation SYNC platform during the term of the agreement, which expires in December 2017. The agreement may be renewed for successive 12-month periods if either party provides notice of renewal at least 45 days prior to the expiration of the applicable term, and the other party agrees to
7
such renewal. Our agreement with Ford also allows either party to terminate the agreement if the other party is insolvent or materially breaches its obligations and fails to cure such breach.
Under our agreements with Ford, GM and Toyota, we have obligations to indemnify each of them against, among other things, losses arising out of or in connection with any claim that our technology or services infringe third party proprietary or intellectual property rights. Our agreement with Ford, GM and Toyota may be terminated in the event an infringement claim is made against us and it is reasonably determined that there is a possibility our technology or service infringed upon a third party's rights.
We employ administrative, physical and technical safeguards to prevent unauthorized collection, access, use and disclosure of our end users' private data and to comply with applicable federal, state and local laws, rules and regulations. We do not use any end user data for direct marketing or promotions without the consent of the user and do not store any user location information that is specifically identifiable with an end user except to deliver and support our services. We are also required to comply with our customers' stringent privacy policies and standards.
Intellectual property
We rely on a combination of patent, copyright, trademark and trade secret laws, as well as confidentiality procedures and contractual restrictions, to establish and protect our proprietary rights. These laws, procedures and restrictions provide only limited protection and the legal standards relating to the validity, enforceability and scope of protection of intellectual property rights are uncertain and still evolving. Furthermore, effective patent, trademark, copyright and trade secret protection may not be available in every country in which our services and products are available.
We seek to patent key concepts, components, protocols, processes and other inventions. As of July 31, 2016, we held 97 U.S. patents and 91 foreign patents expiring between April 11, 2020 and March 13, 2035, and have 94 U.S. and 74 foreign patent applications pending. Of the pending 94 U.S. patent applications, 93 are nonprovisional utility patent applications and one is a design patent application. These patents and patent applications may relate to features and functions of our services and the technology platforms we use to provide them. We have filed, and will continue to file, patent applications in the United States and other countries where there exists a strategic technological or business reason to do so. Any future patents issued to us may be challenged, invalidated or circumvented. Any patents that may issue in the future with respect to pending or future patent applications may not provide sufficiently broad protection or may not prove to be enforceable in actions against alleged infringers.
As of June 30, 2016, we owned the U.S. Patent and Trademark Office registered trademarks for Geocookie®, Goby®, ONMYWAY®, Scout®, skobbler®, Telenav®, Thinknear® and Whereboutz®, as well as the logos for Telenav, Scout and skobbler. We also own the Telenav registered trademark in Canada, China, the European Union, Mexico and the United Kingdom. We have several unregistered trademarks, including the marks Always There Navigation™, Chatbaka™, Drive with Friends™, Evie™, Geobehavioral™, … gets you and gets you there™, HopOver™, LivingMap™, Location Index ™, Location Score ™, MyTies™, MyMileage™, PickMeUp™, RealReach™, RoadAssist™, Scout GPS Link™, Situational Targeting™, Smart Planner™, Telenav Connected Service™, Telenav GPS Navigator™, Telenav Navigator™, Telenav Scout™ , Telenav Shotgun™, Thinknear GeoVideo™, ThinkPolitical™, and TrueDelta™, as well as the Thinknear logo.
We endeavor to enter into agreements with our employees and contractors and with parties with which we do business in order to limit access to and disclosure of our proprietary information. We cannot be certain that the steps we have taken will prevent unauthorized use or reverse engineering of our technology. Moreover, others may independently develop technologies that are competitive with ours or that infringe our intellectual property. The enforcement of our intellectual property rights also depends on the success of our legal actions against these infringers, but these actions may not be successful, even when our rights have been infringed.
We also enter into various types of licensing agreements to obtain access to technology or data that end users utilize in connection with our navigation services. Our contracts with certain licensors include minimum guaranteed royalty payments, which are payable regardless of the ultimate volume of revenue derived from the number of paying end users. Our most important agreements are with the providers of maps pursuant to which we generally pay a monthly fee per end user, a per transaction fee or a revenue sharing percentage for data provided based in each case upon a multi-tiered fee structure. We obtain map data from HERE North America, LLC, or HERE, pursuant to an agreement dated December 1, 2002. Our agreement with HERE was automatically renewed under its existing terms through January 31, 2017, and automatically renews for successive one year periods unless either party provides notice of non-renewal at least 180 days prior to the expiration of the applicable term. In addition, HERE is obligated to make available certain map data for our current automotive customers to fulfill their requirements as follows: for Ford (through December 2017); and for GM (through December 2019), which can be extended for an additional period of ten years and seven years, respectively. Our agreement with HERE also allows a party to terminate the
8
agreement if the other party materially breaches its obligations and fails to cure such breach. In late 2015, a consortium consisting of Audi AG, or Audi, BMW AG, or BMW, and Mercedes AG, or Mercedes, acquired Nokia’s HERE map business.
In addition, we obtain other data such as map, weather updates, gas prices, POI and traffic information from additional providers.
Competition
The markets for development, distribution and sale of location services and advertising services are highly competitive. Many of our competitors have greater name recognition, larger customer bases and significantly greater financial, technical, marketing, public relations, sales, distribution and other resources than we do.
We compete in the automotive navigation market with established automobile manufacturers and OEMs and providers of on-board navigation services such as AISIN AW CO., Ltd, or AISIN, Robert Bosch GmbH, or Bosch, Elektrobit Corporation, or Elektrobit, Garmin, HERE, TomTom and NNG LLC, or NNG, as well as other competitors such as Apple and Google.
We compete in the advertising network services business with mobile platform providers, including Google, Apple, Facebook, Inc., or Facebook, and Millennial Media, Inc., or Millennial Media, xAD, Inc., or xAD, Verve Wireless, Inc., or Verve Wireless, PlaceIQ, Inc., or PlaceIQ, and NinthDecimal, Inc., or NinthDecimal, among others.
Competition in our markets is based primarily on product placement and performance including features, functions, reliability, flexibility, scalability and interoperability; wireless carrier, automotive manufacturer and OEM and advertising agency relationships; technological expertise, capabilities and innovation; price of services and products and total cost of ownership; brand recognition; and size and financial stability of operations. We believe we compete favorably with respect to these factors based upon the performance, reliability and breadth of our services and products and our technical experience.
Some of our competitors and potential competitors enjoy advantages over us, either globally or in particular geographic markets, including with respect to the following:
• | significantly greater revenue and financial resources; |
• | ownership of mapping and other content allowing them to offer a more vertically integrated solution; |
• | stronger brand and consumer recognition in a particular market segment, geographic region or worldwide; |
• | the capacity to leverage their marketing expenditures across a broader portfolio of products; |
• | access to core technology and intellectual property, including more extensive patent portfolios; |
• | access to custom or proprietary content; |
• | quicker pace of innovation; |
• | stronger wireless carrier, automotive and handset manufacturer relationships; |
• | more financial flexibility and experience to make acquisitions; |
• | lower labor and development costs; and |
• | broader global distribution and presence. |
Our competitors’ and potential competitors’ advantages over us could make it more difficult for us to sell our navigation services and advertising network services, and could result in increased pricing pressures, reduced profit margins, increased sales and marketing expenses and failure to increase, or the loss of, market share or expected market share, any of which would likely cause harm to our business, operating results and financial condition.
Employees
As of June 30, 2016, we employed 583 people, including 451 in research and development, 51 in sales and marketing, 24 in customer support, data center operations, and advertising operations, and 57 in a general and administrative capacity. As of that date, we had 257 employees in the United States, 168 in China, 141 in Romania, 12 in Germany, three in Korea and two in
9
Japan. We also engage a number of temporary employees and consultants. None of our employees is represented by a labor union or is a party to a collective bargaining agreement.
Executive Officers of the Registrant
The following table sets forth the names, ages (as of June 30, 2016) and positions of our executive officers:
Name | Age | Position | ||
Dr. HP Jin | 52 | President, Chief Executive Officer and Chairman of the Board of Directors | ||
Michael Strambi | 54 | Chief Financial Officer and Treasurer | ||
Salman Dhanani | 43 | Co-President, Automotive Business Unit | ||
Loren Hillberg | 58 | General Counsel, Secretary, and President and General Manager, Thinknear | ||
Hassan Wahla | 44 | Co-President, Automotive Business Unit | ||
Dr. HP Jin is a cofounder of our company and has served as our president and a member of our board of directors since October 1999. Dr. Jin has also served as our chief executive officer and chairman of our board of directors from October 1999 to May 2001 and since December 2001. Prior to Telenav, Dr. Jin served as a senior strategy consultant at the McKenna Group, a strategy consulting firm. Prior to that time, Dr. Jin was a business strategy and management consultant at McKinsey & Company, a management consulting firm. Dr. Jin was also previously a technical director at Loral Integrated Navigation Communication Satellite Systems, or LINCSS, a division of Loral Space & Communications, Inc., a GPS service and engineering company. Dr. Jin holds a B.S. and M.S. in Mechanical Engineering from Harbin Institute of Technology in China and a Ph.D. in Guidance, Navigation and Control, with a Ph.D. minor in Electrical Engineering, from Stanford University.
Michael Strambi has served as our chief financial officer and treasurer since June 2012. From November 2009 to June 2012, Mr. Strambi served as our vice president of finance. From December 2008 to August 2009, Mr. Strambi served as vice president and chief accounting officer of Silver Spring Networks, Inc., a provider of smart grid services. From February 2008 to December 2008, Mr. Strambi served as chief financial officer of Metacafe, Inc., a provider of online video services. From February 2006 to February 2008, Mr. Strambi served as vice president of finance of MobiTV, Inc., a provider of mobile media solutions. From 2002 to 2006, Mr. Strambi served in various positions, the most recent of which was vice president, controller and treasurer, with Macromedia, Inc., a provider of web publishing products and solutions that was acquired by Adobe Systems Incorporated. Mr. Strambi holds a B.S. in Business Administration with a concentration in Accounting from California State University, Sacramento and an M.B.A. in Finance from the University of Southern California.
Salman Dhanani is a cofounder of our company and has served as co-president of our automotive business unit since January 2014. Mr. Dhanani served as our vice president, growth strategy and partnerships from July 2012 to January 2014, as our vice president, products from August 2010 to July 2012 and as our vice president, products and marketing from August 2009 to August 2010. Mr. Dhanani served as our executive director of marketing from March 2009 to July 2009 and as our senior director of marketing from November 1999 to February 2009. From January 1999 to November 1999, Mr. Dhanani served as a consultant at the McKenna Group, a strategy consulting firm. From July 1996 to December 1998, Mr. Dhanani served as an application engineer at Schlumberger Ltd., a technology consulting services company. Mr. Dhanani holds a B.S. in Electrical Engineering from the University of Washington.
Loren Hillberg has served as our general counsel and secretary since April 2009 and president and general manager, Thinknear since October 2014. From January 2013 to October 2014, Mr. Hillberg served as general manager, mobile business unit. From September 2007 to September 2008, Mr. Hillberg served as vice president and general counsel at Force10 Networks, a privately held communications and networks company. From April 2005 to May 2007, Mr. Hillberg held various management positions, including executive vice president and general counsel at Macrovision Corporation (now Rovi Corporation), a publicly traded digital entertainment company. From May 1998 to March 2005, Mr. Hillberg served as senior vice president and general counsel at Macromedia, Inc., a provider of web publishing products and solutions that was acquired by Adobe Systems Incorporated. Mr. Hillberg holds a B.A. in Economics from Stanford University and a J.D. from the University of California, Hastings College of Law.
Hassan Wahla has served as co-president of our automotive business unit since January 2014. Mr. Wahla served as our vice president, business development and carrier sales from August 2009 to January 2014 and served as our executive director of business development from May 2005 to August 2009. From April 2003 to May 2005, Mr. Wahla served as a senior product manager at Nextel Communications, a wireless communications company that merged with Sprint. From February 2002 to April 2003, Mr. Wahla served as vice president of business development of Wireless Multimedia Solutions, a privately held wireless software platform company. From September 1999 to February 2002, Mr. Wahla served as director of business
10
development at MicroStrategy, Inc., a business intelligence software company. Prior to that time, Mr. Wahla served as a senior consultant at Maritime Power, a maritime equipment company. Mr. Wahla holds a B.S. in Industrial Engineering from Virginia Tech, an M.S. in Management from Stevens Institute of Technology and a Masters of International Affairs from Columbia University.
ITEM 1A. | RISK FACTORS |
We operate in a rapidly changing environment that involves numerous uncertainties and risks. The following risks and uncertainties may have a material and adverse effect on our business, financial condition or results of operations. You should consider these risks and uncertainties carefully, together with all of the other information included or incorporated by reference in this Form 10-K. If any of the risks or uncertainties we face were to occur, the trading price of our securities could decline, and you may lose all or part of your investment.
Risk related to our business
We incurred losses in fiscal 2014, 2015 and 2016. We expect that we will continue to incur losses in fiscal 2017 and we do not know when, or if, we will return to profitability, as we make further expenditures to enhance and expand our operations in order to support growth and diversification of our business.
As a percentage of revenue, our net loss was 19%, 14% and 20% in fiscal 2016, 2015 and 2014, respectively. Our revenue from paid wireless carrier mobile navigation has substantially declined and we expect it to continue to do so. Our gross margin declined to 45% in fiscal 2016 from 51% in fiscal 2015 due primarily to the continuing increased proportion of product revenue contributed from our on-board automotive navigation solutions provided to our automotive customers and advertising services revenue, which generally have higher associated costs and resulting lower gross margins than our mobile navigation services provided through our wireless carrier customers. We anticipate that even if we achieve profitability in the future, our gross margin will continue to decline.
We anticipate that we will continue to incur net operating losses in fiscal 2017, as we anticipate increased expenditures to operate our business. These expected losses are also due to the expected continued decline in our higher margin mobile navigation revenue. Furthermore, there has been a lengthy delay between the time we secured the award of a new contract with GM, and the timing of revenue thereunder, as well as a substantial required upfront investment in research and development resources for this new contract and contracts with other auto manufacturers and OEMs. We also believe continued investments are necessary due to the early nature of our advertising business.
Although we are working to replace the continued decline in wireless carrier revenue, our efforts to develop new services and products and attract new customers require investments in anticipation of longer term revenue. For example, the design cycle for automotive navigation products and services is 18 to 24 months and in order to win designs and achieve revenue from this growth area, we typically have to make investments two to four years before we anticipate receiving revenue, if any. This is the case for our relationship with GM. In addition, the revenue commencement at initial launch may not be significant depending on the auto manufacturer's or OEM's launch timing schedule across vehicle models and regions. Once we are able to recognize revenue from new automotive products, we may be required to recognize that revenue over time if there are contractual service periods or other obligations to fulfill. Certain contractual service periods or other obligations currently extend up to ten years. We intend to make additional investments in systems and continue to expand our operations to support diversification of our business, but it is likely that these efforts at diversification will not replace our declining wireless carrier revenue in the short-term, if at all. As a result of these factors, we believe we will incur a net operating loss and that we will incur net losses at least through fiscal 2017 and we cannot predict when, or if, we will return to profitability. Our investments and expenditures may not result in the growth that we anticipate.
Our quarterly revenue and operating results have fluctuated in the past and may fluctuate in the future due to a number of factors. As a result, we may fail to meet or exceed the expectations of securities analysts or investors, which could cause our stock price to decline.
Our quarterly revenue and operating results may vary significantly in the future. Therefore, you should not rely on the results achieved in any one quarter as an indication of future performance. Period to period comparisons of our revenue and operating results may not be meaningful. Our quarterly results of operations may fluctuate as a result of a variety of factors, including, but not limited to, those listed below, many of which are outside of our control:
• | the ability of automobile manufacturers to sell automobiles equipped with our products; |
• | the introduction of competitive in-car platforms and products, such as Apple's CarPlay and Google's auto initiatives; |
• | changes made to existing contractual obligations with a customer that may affect the nature and timing of revenue recognition, such as the transition by Ford to its SYNC 3 platform, for which we have different revenue recognition criteria; |
11
• | the seasonality of new vehicle model introductions and consumer buying patterns, as well as the effects of economic uncertainty on vehicle purchases, particularly outside of the United States; |
• | the effectiveness of our entry into new business areas, such as advertising; |
• | the loss of our relationship, a change in our revenue model, or a change in pricing with any particular customer; |
• | poor reviews of automotive service offerings into which our navigation solutions are integrated resulting in limited uptake of navigation options by car buyers; |
• | warranty claims based on the performance of our products and the potential impact on our reputation with navigation users and automotive OEMs; |
• | the timing and quality of information we receive from our customers; |
• | the inability of our auto manufacturer customers to attract new end users; |
• | the amount and timing of operating costs and capital expenditures related to the expansion of our operations and infrastructure through acquisitions or organic growth; |
• | the timing of expenses related to the development or acquisition of technologies, products or businesses; |
• | the timing and success of new product or service introductions by us or our competitors; |
• | the timing and success of marketing expenditures for our products; |
• | the extent of any interruption in our services; |
• | potential foreign currency exchange gains and losses associated with expenses and sales denominated in currencies other than the U.S. dollar; |
• | general economic, industry and market conditions that impact expenditures for new vehicles, smartphones and mobile location services in the United States and other countries where we sell our services and products; |
• | changes in interest rates and our mix of investments, which would impact our return on our investments in cash and marketable securities; |
• | changes in our effective tax rates; and |
• | the impact of new accounting pronouncements. |
Fluctuations in our quarterly operating results might lead analysts and investors to change their models for valuing our common stock. As a result, our stock price could decline rapidly and we could face costly securities class action lawsuits or other unanticipated issues.
We are dependent on Ford for a substantial and increasing portion of our revenue and our business, financial condition and results of operations will be harmed if our revenue from Ford does not continue to grow or declines.
Ford represented approximately 71%, 61% and 46% of our revenue in fiscal 2016, 2015 and 2014, respectively. We expect that Ford, other automobile manufacturers and OEMs will account for an increasing portion of our revenue, as our revenue from paid wireless carrier provided navigation continues to decline. However, our revenue could potentially decline if Ford increases the cost to consumers of our navigation product, reduces the number of vehicles or the geographies in which vehicles with our product as an option are sold, or its sales of vehicles fall below forecast due to competition or global macro-economic conditions. Ford recently announced that it would open its SYNC 3 product to Apple's CarPlay and Google's Android Auto, which may reduce the number of vehicle purchasers who purchase built-in navigation services. We may not successfully increase our revenue from Ford if our products are replaced within vehicles by Ford with our competitors' products or from price competition from third parties.
In addition, Ford is in the process of completing a global transition from SYNC 2 to SYNC 3. Since the timing of title transfer on SYNC 3 has changed and thereby impacted how revenue is recognized, revenue derived from Ford could fluctuate or be reduced in any given period across multiple geographies. Our agreement with Ford expires in December 2017 and also allows either party to terminate the agreement if the other party is insolvent or materially breaches its obligations and fails to cure such breach. In the event that Ford does not elect to renew our contract after December 2017, or chooses to renegotiate our contract on less favorable terms, our revenue may decline and our business operating results and financial condition could be harmed. The agreement may be renewed for successive 12-month periods if either party provides notice of renewal at least 45 days prior to the expiration of the applicable term, and the other party agrees to such renewal.
We have limited experience managing, supporting and retaining automobile manufacturers and OEMs as customers and if we are not able to maintain Ford as a customer our revenue will decline.
12
Our automotive revenue could fluctuate due to the complexities of revenue recognition.
Due to the complexities of revenue recognition in accordance with GAAP, when and if we generate revenue we may be required to recognize certain revenue over extended periods. For example, our contractual arrangements with GM for its OnStar RemoteLink, Ford Australia and New Zealand for its map update program, and Toyota for its Entune™ Audio Plus equipped vehicles require that we defer revenue and recognize revenue over the term of the connected services or contractual obligation.
Revenue recognition could also be impacted by changes in procurement patterns, shipping terms and title transfer. For on-board automotive navigation, we recognize revenue as the related customized software is delivered to and accepted by our customers. In addition we recognize royalties earned from our on-board solutions. For example, we recognize revenue from our Ford SYNC 2 on-board solutions as the software is reproduced for installation in vehicles; however, we recognize revenue from Ford SYNC 3 on-board solutions as our software is installed in the vehicle. Accordingly, the timing of our revenue recognition is changing during Ford's global transition from SYNC 2 to SYNC 3. This transition has occurred in North America and China and has begun in Europe, and the nominal effect on revenue recognition was reflected in our consolidated financial statements for fiscal 2016. We anticipate that as Ford completes its transition to SYNC 3 in Europe and other international markets in the three months ending September 30, 2016, we will experience a lower level of orders as Ford uses its existing inventory of SYNC 2 product in conjunction with its transition to SYNC 3. As our solutions encompass greater value-added services, there is potential for changes in the timing of revenue recognition.
In addition, given the length of our contractual obligations, which often extend beyond the manufacture and sale of the vehicle when the royalty is determined and paid, we may have significant post-production obligations to provide on-board services or other services such as map compilation over an extended period of time. Such extended obligations can result in a delay in recognition of revenue, or the need to defer and recognize revenue over an extended period of time.
We may also incur significant expense to develop products for automobile manufacturers, such as under our worldwide connected navigation services agreement with GM, without ever receiving any revenue related to the sale of vehicles with our navigation services. Our ability to attract automobile manufacturers may also be limited if the OEMs chosen to provide navigation services have existing relationships with other navigation vendors or provide their own solutions. As our offerings in automobile navigation expand to brought-in, as well as built-in, we may not correctly anticipate the financial accounting treatment for the various products. We could be required to amortize revenue from products over time although we previously recognized revenue for similar products when the applicable vehicle was sold.
We may not be successful in generating material revenue from automotive manufacturers and OEMs other than Ford. As a result, our business, financial condition and results of operations will be harmed if we are unable to diversify our automotive revenue.
Although we have attempted to mitigate our dependence on Ford by establishing relationships with other automobile manufacturers and OEMs, these relationships may not produce significant revenue if the products are launched in limited models or due to competition from third parties. Even if we are able to diversify our automotive navigation business through new arrangements, such as our more recently established relationships with GM and Toyota, customers may not elect to purchase automobile manufacturer and OEM navigation offerings that include our software and/or services for reasons unrelated to performance of our software or services. If customer purchase rates are less than anticipated, we may be unable to effectively diversify our automotive navigation revenue and our business, financial condition and results of operations may be harmed.
We may be unable to enter into agreements to provide automobile navigation products if we do not offer navigation products that serve geographies throughout the world or automobile manufacturers and OEMs are uncomfortable with our ability to support markets outside of the United States. Our automobile manufacturer and OEM customers may choose to partner with providers of location services with extensive international operations. We may be at a disadvantage to attracting such customers due to our business being concentrated in the United States and we may not be successful in other geographies if customers are uncomfortable with the look and feel of our solutions. If we are unable to attract or retain such automobile manufacturer and OEM customers, our revenue and operating results will be negatively affected.
We may incur substantial costs when engaging with a new automotive navigation customer and may not realize substantial revenue from that new customer in the short-term, if at all.
The design and sales cycle for on-board or brought-in automotive navigation services and products is substantially longer than those associated with our mobile navigation services to customers of wireless carriers or our advertising platform services. As a result, we may not be able to achieve significant revenue growth with new customers from the automotive navigation business in a short period of time, or at all. In addition, these lengthy cycles make it difficult to predict when we will generate revenue from new customers, if at all. For example, design wins for vehicles may be awarded 12 to 36 months prior to the anticipated commercial launch of the vehicle. Our relationship with GM includes brought-in services for vehicles and in January 2015 GM launched the new version of its OnStar RemoteLink® mobile application, but we cannot assure you that the RemoteLink® project will lead to us receiving significant revenue in the short-term, if at all. We also entered into a contract
13
with GM to provide its worldwide connected navigation services beginning with select model year 2017 vehicles. We do not expect to receive any revenue from the launch of those vehicles until fiscal 2017 at the earliest, and in the course of the development of those vehicles we may be designed out altogether. We cannot assure you that when and if our products go into production and launch in GM vehicles and become available for sale, they will be in a wide variety of geographic markets in which GM sells vehicles in or across a variety of models and brands. GM has not provided us with any volume or revenue guarantees.
In July 2015, we and Toyota announced a partnership for brought-in navigation services where our Scout GPS Link is available in Entune™ Audio Plus equipped model year 2016 Toyota vehicles in the United States. In August 2015, Toyota began shipping vehicles enabled to connect with our Scout GPS Link mobile application, and as of June 30, 2016, the ability to connect to our mobile application is a standard feature or is available as an option on more than 75% of model year 2016 Toyota vehicles in the United States. We cannot assure you that we will receive significant revenue from the Scout GPS Link project for Toyota in the long-term, if at all.
As we have limited experience in the automotive navigation market, we also may not price our solutions in such a way that is profitable for us and enables us to recoup the development expenses we incurred to provide such solutions in the time we expect or at all. Development schedules for automotive navigation products are difficult to predict, and there can be no assurance that we will achieve timely delivery of these products to our customers. To the extent that we charge service fees beyond an initial fee at the time the vehicle is purchased, we may not be successful in gaining traction with customers to provide services and charge ongoing monthly or annual fees outside of the traditional on-board navigation service model. Our map, POI and other content costs for our automobile navigation solutions are higher than those we have historically paid for our mobile phone-based navigation services and to date we have not been able to use OSM offerings for automotive navigation, other than our Scout® GPS Link mobile application for Toyota. If we are unable to improve our margins, we may not be able to operate our automobile navigation business profitably. If we fail to achieve revenue growth in any of our automotive navigation solutions (whether on-board, brought-in or other), we may be unable to achieve the benefits of revenue diversification. In addition, our third party automotive and mobile navigation content suppliers, HERE and TomTom, are also becoming competitors with their own automotive navigation services offerings.
Our ability to build demand for our automobile navigation products is also dependent upon our ability to provide the products in a cost effective manner, which may require us to renegotiate map and POI content relationships to address the specific demands of on-board navigation applications.
Our multi-platform products are new and may not find market acceptance.
We introduced Scout, a service that end users can access for navigation and planning with their mobile phones and cars. We have not previously offered a planning service or a service that spans different platforms. We cannot assure you that automobile manufacturers and end users will accept our Scout service or, even if they do, that end users will adopt and use this service, which encompasses services different than our historical strength in navigation, or that we will be able to generate sufficient revenue from Scout to offset its costs. If we fail to develop innovative products that automobile manufacturers and end users adopt, our operating results and financial condition could be harmed. Further, Google and Apple have each developed technology platforms that they are marketing to auto manufacturers. If auto manufacturers adopt these platforms, they may also adopt Google and Apple’s navigation services that run on these platforms or offer Google and Apple's navigation services as one of a variety of alternatives and if so, consumers may elect to use these free service offerings rather than pay for our products which are currently sold as new car features with substantial cost to the consumer.
The success of our automotive navigation products may be affected by the number of vehicle models offered with our navigation solutions, as well as overall demand for new vehicles.
Our ability to succeed long term in the automotive industry depends on our ability to expand the number of models offered with our navigation solutions by our current automobile manufacturers. We are also dependent upon our ability to attract new automobile manufacturers and OEMs. For automobile manufacturers with whom we have established relationships, such as Ford, our success depends on continued production and sale of new vehicles with, and adoption by, end users of our products offered by such automobile manufacturers, when our product are not standard features. Our on-board solutions may not satisfy automotive manufacturers’ or end customers’ expectations for those solutions. If automobile manufacturers and OEMs do not believe that our services meet their customers’ needs, our products and services may not be designed in to future model year vehicles. As we move forward, our existing automobile manufacturers and OEMs may not include our solutions in future year vehicles or territories, which would negatively affect our revenue from these products. Production and sale of new vehicles are subject to delay from forces outside of our control, such as natural disasters, parts shortages and work stoppages, as well as general economic conditions.
14
Strategic transactions in the mapping and automotive industries could jeopardize our map pricing and, in turn, our competitive pricing for our automotive customers.
A consortium consisting of Audi, BMW and Mercedes completed its acquisition of Nokia’s HERE map business in late 2015. Though the auto manufacturers have stated that HERE's map business will remain autonomous and continue to serve other auto manufacturers, there is a risk that HERE will increase its prices for maps to competitors of the group of companies that owns the consortium that acquired HERE. If HERE increases the price of maps, our gross margins, most notably in our automotive business, may be adversely affected by such increase in map costs.
We may not successfully generate advertising revenue as a result of our acquisition of Thinknear if we are unable to attract and retain advertisers.
Although our revenue represented by advertising has grown, advertising was 12% and 11% of our total revenue during fiscal 2016 and 2015, respectively, and may not grow as a percentage of revenue in fiscal 2017. In October 2012, we acquired Thinknear, a privately held California-based hyper-local mobile advertising company. Historically, the margins of our advertising business have been well below those we experience in our automotive navigation and mobile navigation businesses. We believe the advertising business is subject to varying buying patterns and seasonality which can impact our ability to grow our revenue. For example, in the three months ended December 31, 2015, we experienced higher advertising revenue as the second quarter is traditionally stronger due to seasonality; however, advertising revenue subsequently declined sequentially in both the three months ended March 31, 2016 and June 30, 2016. In order to grow our advertising business, we need to identify and attract a significant number of advertisers through our Thinknear platform. The mobile advertising market is highly competitive, and advertisers have many options through which to purchase mobile advertising. Our business will require us to attract and retain a large number of advertisers and will also require us to maintain the ability to purchase a large volume of inventory at competitively attractive rates. Increased competition from other mobile advertising companies and technology developers could impair our ability to secure advertiser revenue. Increased competition could also limit our ability to purchase inventory for advertising placements at an economically attractive rate. We do not have substantial experience in selling advertising and supporting advertisers and may not be able to develop these capabilities successfully. We may not be successful recruiting the number of sales personnel we need to scale or effectively train them to sell mobile advertising. Sales personnel may also be slow to ramp up their sales pipelines, negatively impacting our ability to grow. We may not succeed in attracting and retaining a critical mass of advertisers and ad placements and may not be successful in demonstrating the value of mobile advertising. If we fail to do so, we may be unable to generate a material level of revenue from advertising to offset the costs of providing free navigation. Even if we are able to increase our advertising revenue, we may not be able to improve the margins of our advertising business if we do not generate additional ad impression space within our own applications, such as Scout. If we are unable to improve the margins of our advertising business, it may not become profitable and may impair our ability to become profitable as a whole and invest in new opportunities.
Our legacy wireless carrier mobile navigation business is declining and as it continues to decline, our revenue and net income or loss will continue to be adversely affected.
We have historically been substantially dependent on two wireless carrier customers for a large portion of our revenue. Sprint ceased paying us for mobile navigation provided to its subscribers in bundles on September 30, 2013. Our other large wireless carrier customers have also experienced declines in monthly recurring revenue from subscriptions for mobile navigation. In fiscal 2016, 2015 and 2014, AT&T represented 9%, 15% and 24% of our total revenue, respectively. In the last three fiscal years, AT&T subscribers have materially decreased their subscriptions for, and usage of, our paid navigation services and our revenue from our relationship with AT&T has declined accordingly. We anticipate that AT&T subscribers, and subscribers of other carriers who pay monthly recurring charges for our services, will continue to decrease their subscriptions for paid navigation services in favor of free or freemium offerings and that our revenue from our relationship with AT&T will continue to decline. In addition, as AT&T shifts the manner in which our applications are loaded on their devices to one where users are directed to an application store, the rate of decline in our revenue from AT&T may increase as those subscribers may then search for free alternatives. AT&T may determine that the cost of offering our service to its subscribers outweighs the benefits if the drop off of subscribers continues. Our failure to maintain our relationship with AT&T would substantially harm our business and we cannot assure you that we and AT&T will be able to reduce subscriber erosion. We anticipate that even if AT&T remains a wireless carrier customer, our revenue from AT&T will continue to decline substantially during fiscal 2017 and beyond.
Our experience has been that subscribers do not opt to pay monthly recurring charges for mobile navigation products and instead use free or freemium offerings. We have sought to develop other sources of revenue from our location-based platforms, including automotive navigation and location-based advertising, but those sources of revenue have substantially lower margins than wireless carrier mobile navigation revenue and, as a result, we would have to generate substantially more revenue from those services to replace the declining wireless carrier revenue. Our other sources of revenue have only recently begun to grow as fast as the declines in mobile wireless carrier revenue and we cannot assure you that this recent growth will continue. As a result of the lower margins on automobile navigation and advertising revenue, we anticipate that we will continue to incur net
15
losses in fiscal 2017 and possibly future periods. If we are unable to demonstrate to investors that we have developed stable, long-term revenue streams, the trading prices of our common stock may decline further and the trading volumes for our common stock may be low, adding to price volatility.
Our customer requirements and content management are complex. If we inadvertently include content for which we have liability to the vendor but may not be entitled to payment from our customer, our financial condition and results of operation could be harmed.
The nature and extent of content that is delivered as part of our navigation solutions is complex to manage. Matching the requirements of our customers with the content offered by our vendors may result in our inclusion of content which we believe is necessary to meet our customers’ requirements for which the customer may not have agreed to make payment to us. In addition, our customers speak directly to our vendors and often those conversations influence the expected content for our end products; however, customers may not be fully informed as to the license costs associated with the various components. Therefore, there is some risk that we may include content for which we have liability to the vendor but may not be entitled to payment from our customer. If these situations were to occur, our business, financial condition and results of operations could be adversely affected.
Mobile connected device users may choose not to allow tracking of their location information and therefore local advertising may not be feasible on their devices.
The growth of our advertising revenue will depend on our ability to deliver location targeted, highly relevant ads to consumers on their mobile connected devices. Our targeted advertising is highly dependent on the consumers allowing applications to have access to their location data. Users may elect not to allow location data sharing for a number of reasons, including personal privacy concerns. Mobile operating systems vendors and application developers are also promoting features that allow device users to disable device functionality that consumers may elect to invoke. In addition, companies may develop products that enable users to prevent ads from appearing on their mobile device screens. If any of these developments were to become widely used by consumers, our ability to deliver effective advertising campaigns on behalf of our advertiser clients would suffer, which could hurt our ability to generate advertising revenue.
Our business practices with respect to data could give rise to liabilities or reputational harm as a result of governmental regulation, legal requirements or industry standards relating to consumer privacy and data protection.
Our advertising services depend on our ability to collect, store and use information related to mobile devices and the ads we place, including a device's geographic location for the purpose of targeting ads to the user of the device. Federal, state and international laws and regulations govern the collection, use, retention, sharing and security of data that we collect across our mobile advertising platform. We strive to comply with all applicable laws, regulations, policies and legal obligations relating to privacy and data protection. However, it is possible that these requirements may be interpreted and applied in a manner that is inconsistent with our practices. Any failure, or perceived failure, by us to comply with such laws could result in proceedings or actions against us by governmental entities, consumers or others. Such proceedings or actions could hurt our reputation, force us to spend significant amounts to defend ourselves, distract our management, increase our costs of doing business, require us to change our advertising services or disclosures, adversely affect the demand for our services and ultimately result in the imposition of monetary liability. We may also be contractually liable to indemnify and hold harmless our users from the costs or consequences of inadvertent or unauthorized disclosure of data that we store or handle as part of providing our services.
The regulatory framework for privacy issues worldwide is evolving, and various government and consumer agencies and public advocacy groups have called for new regulation and changes in industry practices, including some directed at the mobile and advertising industries in particular. It is possible that new laws, regulations, standards, recommendations, best practices or requirements will be adopted that would affect our business, particularly with regard to location-based services, collection or use of data to target ads and communication with consumers via mobile devices. To the extent that we or our clients are subject to new laws or recommendations or choose to adopt new standards, recommendations, or other requirements, we may have greater compliance burdens. If we are perceived as not operating in accordance with industry best practices or any such guidelines or codes with regard to privacy, our reputation may suffer and we could lose relationships with advertiser or developer partners.
We operate in a highly competitive market, including competitors that offer their services for free, which could make it difficult for us to acquire and retain customers and end users.
The market for development, distribution and sale of location services is highly competitive. Many of our competitors have greater name recognition, larger customer bases and significantly greater financial, technical, marketing, public relations, sales, distribution and other resources than we do. Competitors may offer mobile location services that have at least equivalent functionality to ours for free. For example, Google offers free voice-guided turn by turn navigation as part of its Google Maps and Waze products for mobile devices, including those based on the Android and iOS operating system platforms, and Apple offers proprietary maps and voice-guided turn by turn directions. Microsoft also provides a free voice-guided turn by turn navigation solution on its Windows Mobile and Windows Phone operating systems. Competition from these free offerings may
16
reduce our revenue, result in our incurring additional costs to compete and harm our business. If our wireless carrier customers can offer these mobile location services to their subscribers for free, they may elect to cease their relationships with us, like Sprint did, or alter or reduce the manner or extent to which they market or offer our services or require us to substantially reduce our fees or pursue other business strategies that may not prove successful. In addition, new car buyers may not value navigation solutions built in to their vehicles if they believe that free (brought-in) offerings, for example Apple CarPlay or Google's auto initiatives are adequate and may not purchase our solutions with their new cars.
Our primary competitors include location service providers such as Apple, Google (including Waze), Microsoft, HERE and TomTom; PND providers such as Garmin and TomTom; providers of Internet and mobile based maps and directions such as AOL, Apple, MapQuest, Google, Microsoft, Yahoo, Yelp, Foursquare and Fullpower; and wireless carriers and communication solutions providers developing their own location services. In the automotive navigation market, we compete with established automotive OEMs and providers of on-board navigation services such as AISIN, AW CO, Ltd, Bosch, Elektrobit, Garmin, HERE, TomTom and NNG, as well as other competitors such as Apple, Google, Microsoft and TCS. In our advertising business, we compete against Google, Apple, Millennial Media, xAD, Verve Wireless, PlaceIQ and NinthDecimal, among others. Some of our competitors’ and our potential competitors’ advantages over us, either globally or in particular geographic markets, include the following:
• | the provision of their services at no or low cost to consumers; |
• | significantly greater revenue and financial resources; |
• | stronger brand and consumer recognition regionally or worldwide; |
• | the capacity to leverage their marketing expenditures across a broader portfolio of mobile and non-mobile products; |
• | access to core technology and intellectual property, including more extensive patent portfolios; |
• | access to custom or proprietary content; |
• | quicker pace of innovation; |
• | stronger wireless carrier, automotive, handset manufacturer and advertising agency relationships; |
• | stronger international presence may make our larger competitors more attractive partners to automotive manufacturers and OEMs; |
• | greater resources to make and integrate acquisitions; |
• | lower labor and development costs; and |
• | broader global distribution and presence. |
Our competitors’ and potential competitors’ advantages over us could make it more difficult for us to sell our navigation services, and could result in increased pricing pressures, reduced profit margins, increased sales and marketing expenses and failure to increase, or the loss of, market share or expected market share, any of which would likely cause harm to our business, operating results and financial condition.
If we are unable to integrate future acquisitions successfully, our operating results and prospects could be harmed.
In the future, we may make acquisitions to improve our navigation services offerings or expand into new markets. Our future acquisition strategy will depend on our ability to identify, negotiate, complete and integrate acquisitions and, if necessary, to obtain satisfactory debt or equity financing to fund those acquisitions. Mergers and acquisitions are inherently risky, and any mergers and acquisitions we complete may not be successful. Future mergers and acquisitions we may pursue would involve, numerous risks, including the following:
• | difficulties in integrating and managing the operations, technologies and products of the companies we acquire, which is geographically remote from our existing operations; |
• | diversion of our management’s attention from normal daily operation of our business; |
• | our inability to maintain the key business relationships and the reputations of the businesses we acquire; |
• | our inability to retain key personnel of the acquired company; |
• | uncertainty of entry into markets in which we have limited or no prior experience and in which competitors have stronger market positions; |
• | our dependence on unfamiliar affiliates and customers of the companies we acquire; |
• | insufficient revenue to offset our increased expenses associated with acquisitions; |
• | our responsibility for the liabilities of the businesses we acquire, including those which we may not anticipate; and |
17
• | our inability to maintain internal standards, controls, procedures and policies. |
We may be unable to secure the equity or debt funding necessary to finance future acquisitions on terms that are acceptable to us. If we finance acquisitions by issuing equity or convertible debt securities, our existing stockholders will likely experience dilution, and if we finance future acquisitions with debt funding, we will incur interest expense and may have to comply with financial covenants and secure that debt obligation with our assets.
We may be required to recognize a significant charge to earnings if our goodwill or other intangible assets become impaired.
We have recorded goodwill related to our prior acquisitions, and may do so in connection with any potential future acquisitions. Goodwill and other intangible assets with indefinite lives are not amortized, but are reviewed for impairment annually or on an interim basis whenever events or changes in circumstances indicate that the carrying value of these assets may not be recoverable. Factors that may indicate that the carrying value of our goodwill or other intangible assets may not be recoverable include a persistent decline in our stock price and market capitalization, reduced future cash flow estimates and slower growth rates in our industry. We may be required to record a significant charge in our financial statements during the period in which any impairment of our goodwill or other intangible assets is determined, which would adversely impact our results of operations. Furthermore, in fiscal 2015 we began to report results in three business segments, which requires the allocation of goodwill and intangibles to each of these segments. As a result, our impairment review each year or on an interim basis shall be conducted by segment, which can result in a different outcome than if assessed on an overall consolidated basis. Revenue from our mobile navigation business has been declining substantially over the last few years and continued deterioration of this revenue base can result in an impairment of the goodwill and intangibles assigned to this reporting unit. In addition, in January 2016 we decided to shift our focus in our advertising business from growth to profitability. In the near-term, we are taking actions to reduce our operating costs. We have not recognized any impairment of goodwill in the three year period ended June 30, 2016. However, our mobile navigation revenue continues to decline, our efforts to focus on profitability for our advertising business may not be effective, and losses may continue beyond our expectations. As such, we may experience future write-downs of goodwill or other intangible assets.
Warranty claims, product liability claims and product recalls could subject us to significant costs and adversely affect our financial results.
We warrant our automotive navigation products to be free from defects in materials, workmanship and design for periods ranging from three months to seven years. If our navigation services or products contain defects, there are errors in the maps supplied by third party map providers or if our end users do not heed our warnings about the proper use of these products, collisions or accidents could occur resulting in property damage, personal injury or death. If any of these events occurs, we could be subject to significant liability for personal injury and property damage and under certain circumstances could be subject to a judgment for punitive damages. In addition, if any of our designed products are defective or are alleged to be defective, we may be required to participate in a recall campaign. These recall and warranty costs could be exacerbated to the extent they relate to global platforms. Furthermore, recall actions could adversely affect our reputation or market acceptance of our products, particularly if those recall actions cause consumers to question the safety or reliability of our products. Warranty claims, a successful product liability claim or a requirement that we participate in a product recall campaign may adversely affect our results of operations and financial condition.
We accrue costs related to warranty claims when they are probable of being incurred and reasonably estimable. Our warranty costs have historically not been material. From time to time, we experience incidents where it may be necessary for us to expend resources to investigate and remedy a potential warranty claim.
We maintain limited insurance against accident related risks involving our products. However, we cannot assure you that this insurance would be sufficient to cover the cost of damages to others or will continue to be available at commercially reasonable rates. In addition, we may be named as a defendant in litigation by consumers individually or on behalf of a class if their handsets or automobiles suffer problems from software downloads from our customers. If we are unable to obtain indemnification from our customer for any damages or legal fees we may incur in connection with such complaints, our financial position may be adversely impacted. In addition, insurance coverage generally will not cover awards of punitive damages and may not cover the cost of associated legal fees and defense costs. If we are unable to maintain sufficient insurance to cover product liability costs or if our insurance coverage does not cover an award, our business, financial condition and results of operations could be adversely affected.
Indemnity provisions in various agreements potentially expose us to substantial liability for intellectual property infringement, damages caused by defective software and other losses.
Our agreements with our customers include indemnification provisions. We agree to indemnify them for losses suffered or incurred in connection with our navigation services or products, including as a result of intellectual property infringement, damages caused by defects and damages caused by viruses, worms and other malicious software. The term of these indemnity provisions is generally perpetual after execution of the corresponding agreement, and the maximum potential amount of future payments we could be required to make under these indemnification provisions is generally substantial and may be unlimited.
18
In addition, some of these agreements permit our indemnitees to terminate their agreements with us if they determine that the use of our navigation services or products infringes third party intellectual property rights.
We have received, and expect to receive in the future, demands for indemnification under these agreements. These demands can be very expensive to settle or defend, and we have in the past incurred substantial legal fees and settlement costs in connection with certain of these indemnity demands. Furthermore, we have been notified by several customers that they have been named as defendants in certain patent infringement cases for which they may seek indemnification from us. See Part I, Item 3 “Legal Proceedings” for a description of these matters. These indemnity demands remain outstanding and unresolved as of the date of this Form 10-K. Large future indemnity payments and associated legal fees and expenses, including potential indemnity payments and legal fees and expenses relating to the current or future notifications, could materially harm our business, operating results and financial condition.
We may in the future agree to defend and indemnify our customers in connection with the pending notifications or future demands, irrespective of whether we believe that we have an obligation to indemnify them or whether we believe that our services and products infringe the asserted intellectual property rights. Alternatively, we may reject certain of our customers’ indemnity demands, which may lead to disputes with our customers and may negatively impact our relationships with them or result in litigation against us. Our customers may also claim that any rejection of their indemnity demands constitutes a material breach of our agreements with them, allowing them to terminate such agreements. Our agreements with certain customers may be terminated in the event an infringement claim is made against us and it is reasonably determined that there is a possibility our technology or services infringed upon a third party’s rights. If, as a result of indemnity demands, we make substantial payments, our relationships with our customers are negatively impacted or if any of our customer agreements is terminated, our business, operating results and financial condition could be materially adversely affected.
Our investment portfolio may become impaired by deterioration of the financial markets.
Our cash equivalent and short-term investment portfolio as of June 30, 2016 consisted of corporate and agency bonds, asset-backed securities, municipal securities, U.S. treasury securities, commercial paper and money market mutual funds. We follow an established investment policy and set of guidelines to monitor and help mitigate our exposure to interest rate and credit risk. The policy sets forth credit quality standards and limits our exposure to any one issuer, as well as our maximum exposure to various asset classes.
Should financial market conditions worsen in the future, investments in some financial instruments may pose risks arising from market liquidity and credit concerns. In addition, any deterioration of the capital markets could cause our other income and expense to vary from expectations. As of June 30, 2016, we had no material impairment charges associated with our short-term investment portfolio, and although we believe our current investment portfolio has little risk of material impairment, we cannot predict future market conditions or market liquidity, or credit availability, and can provide no assurance that our investment portfolio will remain materially unimpaired.
We may be required to recognize a significant charge to earnings if our strategic private equity investments become impaired.
We have in the past and may in the future enter into investments in businesses in order to complement or expand our current business or enter into new markets. Private equity investments are inherently risky and subject to factors outside of our control and no assurance can be given that our previous or future investments will be successful, will deliver the intended benefits, and will not materially harm our business, operating results or financial condition. We may be required to record a significant charge in our financial statements during the period in which any impairment of our private equity investments is determined, which could adversely impact our results of operations. We recorded impairment charges of $1.0 million, $1.3 million and $0.3 million for cost-basis and equity method investments during fiscal 2016, 2015 and 2014, respectively.
Our effective tax rate may fluctuate, which could reduce our anticipated income tax benefit in the future.
Our effective tax rate could be adversely affected by several factors, many of which are outside of our control. Our effective tax rate may be affected by the proportion of our revenues and income (loss) before taxes in the various domestic and international jurisdictions in which we operate. Our revenue and operating results are difficult to predict and may fluctuate substantially from quarter to quarter. We are also subject to changing tax laws, regulations and interpretations in multiple jurisdictions in which we operate, as well as the requirements of certain tax and other accounting body rulings. Since we must estimate our annual effective tax rate each quarter based on a combination of actual results and forecasted results of subsequent quarters, any significant change in our actual quarterly or forecasted annual results may adversely impact the effective tax rate for the period. Our estimated annual effective tax rate may fluctuate for a variety of reasons, including:
• | impact from our inability to benefit from the carryback of net losses expected to be incurred in fiscal 2016 and thereafter due to the limitations of the two year loss carryback for federal tax purposes. |
• | changes in forecasted annual operating income or loss by jurisdiction; |
19
• | changes in relative proportions of revenue and income or loss before taxes in the various jurisdictions in which we operate; |
• | changes to the valuation allowance on net deferred tax assets; |
• | changes to actual or forecasted permanent differences between book and tax reporting, including the tax effects of purchase accounting for acquisitions and non-recurring charges which may cause fluctuations between reporting periods; |
• | impact from any future tax settlements with state, federal or foreign tax authorities; |
• | impact from increases or decreases in tax reserves due to new assessments of risk, the expiration of the statute of limitations or the completion of government audits; |
• | impact from changes in tax laws, regulations and interpretations in the jurisdictions in which we operate, as well as the requirements of certain tax rulings; |
• | impact from withholding requirements in various non-U.S. jurisdictions and our ability to recoup those withholdings, which may depend on how much revenue we have in a particular jurisdiction to offset the related expenses; |
• | impact from acquisitions and related integration activities; or |
• | impact from new FASB requirements. |
Although we believe our estimates are reasonable, the ultimate tax outcome may differ from the amounts recorded in our financial statements and may materially affect our financial results in future periods. In fiscal 2014, we recorded a valuation allowance on the majority of our deferred tax assets, net of liabilities since the assets are not more likely than not to be realized based upon our assessment of all positive and negative evidence. Realization of deferred tax assets is dependent upon future taxable earnings, the timing of which is uncertain. Due to losses in fiscal 2014, 2015 and 2016 and potentially future years in the United States, we maintained a full valuation allowance on deferred tax assets in the United States. Due to foreign operating losses in previous years and continued foreign earnings volatility, we continued to maintain a full valuation allowance for our foreign deferred tax assets in China and the United Kingdom. In the event deferred tax assets in Germany cannot be realized based upon the ability to generate future income in Germany, our effective tax rate would be negatively impacted.
Changes in accounting principles, or interpretations thereof, could have a significant impact on our financial position and results of operations.
We prepare our consolidated financial statements in accordance with accounting principles generally accepted in the United States of America, or GAAP. These principles are subject to interpretation by the SEC and various bodies formed to interpret and create appropriate accounting principles. A change in these principles can have a significant effect on our reported results and may even retroactively affect previously reported transactions. Additionally, the adoption of new or revised accounting principles may require that we make significant changes to our systems, processes and controls.
For example, the Financial Accounting Standards Board, or FASB, is currently working together with the International Accounting Standards Board, or IASB, on several projects to further align accounting principles and facilitate more comparable financial reporting between companies who are required to follow GAAP under SEC regulations and those who are required to follow International Financial Reporting Standards outside of the United States. These efforts by the FASB and IASB may result in different accounting principles under GAAP that may result in materially different financial results for us in areas including, but not limited to, principles for recognizing revenue and lease accounting. Additionally, significant changes to GAAP resulting from the FASB’s and IASB’s efforts may require that we change how we process, analyze and report financial information and that we change financial reporting controls.
It is not clear if or when these potential changes in accounting principles may become effective, whether we have the proper systems and controls in place to accommodate such changes and the impact that any such changes may have on our financial position and results of operations.
We rely on our customers for timely and accurate subscriber and vehicle sales information. A failure or disruption in the provisioning of this data to us would materially and adversely affect our ability to manage our business effectively.
We rely on our automotive and OEM customers to provide us with reports on the number of vehicles they sell with our on-board and brought-in navigation services included and to remit royalties for those sales to us. We also rely on our wireless carrier customers to bill subscribers and collect monthly fees for our mobile navigation services, either directly or through third party service providers. If our customers or their third party service providers provide us with inaccurate data or experience errors or outages in their own billing and provisioning systems when performing these services, our revenue may be less than anticipated or may be subject to adjustment with the customer. In the past, we have experienced errors in reporting from auto
20
manufacturers and wireless carriers. If we are unable to identify and resolve discrepancies in a timely manner, our revenue may vary more than anticipated from period to period and this could harm our business, operating results and financial condition.
We rely on a proprietary provisioning and reporting system to track end user activation, deactivation and usage data and any material failures in this system could harm our revenue, affect our costs and impair our ability to manage our business effectively.
Our provisioning and reporting system that authenticates end users and tracks the number of end users and their use of our services is a proprietary and customized system that we developed internally. Although we believe that the flexibility of this service to integrate tightly with auto manufacturers' and wireless carriers’ reporting and provisioning systems gives us a competitive advantage, we might lose revenue and the ability to manage our business effectively if the system were to experience material failures or be unable to scale as our business grows. In addition, we may not be able to report our financial results on a timely basis if our customers question the accuracy of our records or we experience significant discrepancies between the data generated by our provisioning and reporting systems and data generated by their systems, or if our systems fail or we are unable to report timely and accurate information to our third party data providers. The inability to timely report our financial results would impair the quality of our financial reporting and could result in the delisting of our common stock.
If our end users increase their usage of our services, our operating loss may increase, or we may incur larger losses because we offer the service as a free offering or usage for paid offerings outpaces our expectations.
With limited exceptions, fees for the use of our services do not vary depending on whether or how often an end user uses our services, and we offer certain of our mobile phone based navigation services for free. Historically, end users using certain mobile phones or under certain service plans tended to use our services more than other end users. We budget and operate our services by making certain assumptions about usage patterns. If our end users were to further increase their usage of our services substantially or more end users access our services for free through a freemium model, we would incur additional expenses to expand our server capacity through our use of third party hosted services and pay additional third party content fees. These additional costs would harm our operating results and financial condition.
We rely on third party data and content to provide our services and if we were unable to obtain content at reasonable prices, or at all, our gross margins and our ability to provide our services would be harmed.
We rely on third party data and content to provide our services, including map data, POI, traffic information, gas prices and weather information. If our suppliers of this data or content were to enter into exclusive relationships with other providers of location services or were to discontinue providing such information and we were unable to replace them cost effectively, or at all, our ability to provide our services would be harmed. Our gross margins may also be affected if the cost of third party data and content increases substantially. Although we have recently announced efforts to use OSM data to reduce the expenses we incur for third party map data, we may not be successful at integrating OSM data into our products and may experience difficulty with customer acceptance if the quality of the consumer generated data within OSM is lower than that of paid maps. We introduced mobile phone-based navigation with OSM and launched our first brought-in automotive navigation service with OSM in 2015. As a result, we may not have sufficient data for automotive manufacturers and OEMs to feel comfortable electing to use OSM in the products and services we provide them.
We obtain map data from TomTom and HERE, which are companies owned by our current and potential competitors. Accordingly, these third party data and content providers may act in a manner that is not in our best interest. For example, they may cease to offer their map and POI data to us. We entered into a new TomTom agreement effective as of January 1, 2016 to license TomTom map data for voice-guided turn by turn GPS navigation service for our existing mobile navigation products through December 31, 2016. The term of our TomTom agreement automatically renews for additional one-year periods until December 31, 2018, by which time the term of our TomTom agreement shall not be further renewed. Our agreement with HERE was automatically renewed under its existing terms through January 31, 2017, and automatically renews for successive one year periods unless either party provides notice of non-renewal at least 180 days prior to the expiration of the applicable term. HERE was acquired by a consortium of German automobile manufacturers in late 2015, and the sale of HERE may increase our costs if HERE does not agree to the automatic renewal of our existing agreement in the future.
We may identify other requisite content and content-related technologies, including certain geocoding data necessary for our OSM products, that we may be unable to license or develop internally. If we are unsuccessful in these endeavors, we may be unable to successfully launch our OSM-based products globally and across all desired product offerings.
We may not be able to upgrade our navigation services platform to support certain advanced features and functionality without obtaining technology licenses from third parties. Obtaining these licenses may be costly and may delay the introduction of such features and functionality, and these licenses may not be available on commercially favorable terms, or at all. The inability to offer advanced features or functionality, or a delay in our ability to upgrade our navigation services platform, may adversely affect consumer demand for our navigation services and, consequently, harm our business.
21
We also use our proprietary provisioning and reporting system to record and report royalties we owe to third party providers of content used by end users in connection with our services. Certain of the third party content providers have the right to audit our use of their services and, if we were found to have under or incorrectly reported usage, we may be required to pay the third party content providers for the actual usage, as well as interest and the cost of the audit. Any significant error in our recording and payment of royalties to our third party content providers could have a material and adverse effect on our financial results. We may also incur losses as a result of any significant error.
Network failures, disruptions or capacity constraints in our third party hosted data center facilities could affect the performance of our navigation services and harm our reputation and our revenue.
We use hosted services provided by AWS and wireless carrier networks to deliver our navigation and advertising platform services. Our operations rely to a significant degree on the efficient and uninterrupted operation of the third party data centers we use. In the event that AWS experiences a disruption in services or a natural disaster, our ability to continue providing our services would be compromised. Depending on the growth rate in the number of our end users and their usage of our services, if we do not timely complete the negotiation for and scale of additional hosting services, we may experience capacity issues, which could lead to service failures and disruptions. In addition, if we are unable to secure third party hosting services with appropriate power, cooling and bandwidth capacity, we may be unable to efficiently and effectively scale our business to manage the addition of new wireless carrier customers, increases in the number of our end users or increases in data traffic.
AWS hosting services are potentially vulnerable to damage or interruption from a variety of sources, including fire, flood, earthquake, power loss, telecommunications or computer systems failure, human error, terrorist acts or other events. We have not yet completed a comprehensive business continuity plan and there can be no assurance that the measures implemented by us to date, or measures implemented by us in the future, to manage risks related to network failures or disruptions in our data centers will be adequate, or that the redundancies built into our servers will work as planned in the event of network failures or other disruptions. In particular, if we experienced damage or interruptions to AWS hosting services our ability to provide efficient and uninterrupted operation of our services would be significantly impaired.
We could also experience failures of our data centers or interruptions of our services, or other problems in connection with our operations, as a result of:
• | damage to or failure of our computer software or hardware or our connections and outsourced service arrangements with third parties; |
• | errors in the processing of data; |
• | computer viruses or software defects; |
• | physical or electronic break-ins, sabotage, intentional acts of vandalism and similar events; or |
• | errors by our employees or third party service providers. |
Poor performance in or disruptions of our services could harm our reputation, delay market acceptance of our services and subject us to liabilities. Our wireless carrier agreements require us to meet at least 99.9% operational uptime requirements, excluding scheduled maintenance periods, or be subjected to penalties. Any outage in a network or system, or other unanticipated problem that leads to an interruption or disruption of our navigation services, could have a material adverse effect on our operating results and financial condition.
We may not be able to enhance our location services to keep pace with technological and market developments, or develop new location services in a timely manner or at competitive prices.
The market for location services is characterized by rapid technological change, evolving industry standards, frequent new product introductions and short product life cycles. To keep pace with technological developments, satisfy increasing customer requirements and achieve product acceptance, our future success depends upon our ability to enhance our current navigation services platform and advertising services platforms and to continue to develop and introduce new navigation services, advertising services and other location-based product offerings and enhanced performance features and functionality on a timely basis at competitive prices. Our inability, for technological or other reasons, to enhance, develop, introduce or deliver compelling services and products in a timely manner, or at all, in response to changing market conditions, technologies or consumer expectations could have a material adverse effect on our operating results or could result in our services becoming obsolete. Our ability to compete successfully will depend in large measure on our ability to maintain a technically skilled development and engineering team and to adapt to technological changes and advances in the industry, including providing for the continued compatibility of our services platform with evolving industry standards and protocols and competitive network operating environments.
22
A large percentage of our research and development operations are conducted in China and Romania, and our ability to introduce new services and support our existing services cost effectively depends on our ability to manage those remote development sites successfully.
Our success depends on our ability to enhance our current services and develop new services and products rapidly and cost effectively. A majority of our research and development personnel are in China and Romania. Although we have sought to retain certain key personnel, we may be unable to retain them over the long-term. In addition, we have been experiencing significant increases in compensation costs in China due to competitive market conditions for qualified staff, as well as higher risk of employee turnover in certain China markets.
We also expect that we may continue to consolidate certain of our operations or reduce our workforce if we are unable to continue to replace wireless carrier revenue with other sources of high gross margin revenue. These reorganizations or reductions in force could result in unexpected costs or delays in product development that could impair our ability to meet market windows or cause us to forego certain new product opportunities.
Because our long term success depends on our ability to increase the number of end users located outside of the United States, our business will be susceptible to risks associated with international operations.
As of June 30, 2016, we had international operations in China, Romania, Germany, Mexico, Japan and South Korea. Our experience with wireless carriers, automobile manufacturers and OEMs and advertisers outside the United States is limited. Our revenue from customers in the United States comprised 97% and 96% of our total revenue for fiscal 2016 and 2015, respectively. However, our product is distributed globally in many different regions outside the United States, including South America, Europe, Asia, Australia, China and New Zealand. Our limited experience in operating our business outside the United States increases the risk that our current and future international expansion efforts may not be successful. In particular, our business model may not be successful in particular countries or regions outside the United States for reasons that we currently do not anticipate. In addition, conducting international operations subjects us to risks that we have not generally faced in the United States. These include:
• | fluctuations in currency exchange rates; |
• | unexpected changes in foreign regulatory requirements; |
• | difficulties in managing the staffing of remote operations; |
• | potentially adverse tax consequences, including the complexities of foreign value added tax systems, foreign tax withholding, restrictions on the repatriation of earnings and changes in tax rates; |
• | dependence on foreign wireless carriers with different pricing models; |
• | roaming charges to end users; |
• | availability of reliable mobile networks in those countries; |
• | requirements that we comply with local telecommunication regulations and automobile hands free laws in those countries; |
• | the burdens of complying with a wide variety of foreign laws and different legal standards; |
• | increased financial accounting and reporting burdens and complexities; |
• | political, social and economic instability in some jurisdictions; |
• | terrorist attacks and security concerns in general; and |
• | reduced or varied protection for intellectual property rights in some countries. |
The occurrence of any one of these risks could negatively affect our international business and, consequently, our operating results. Additionally, operating in international markets requires significant management attention and financial resources. We cannot be certain that the investment and additional resources required to establish, acquire or integrate operations in other countries will produce desired levels of revenue or profitability and we may incur larger losses as a result.
We may not succeed in realizing the anticipated benefits of our joint venture in China.
In September 2015, we entered into an agreement with Ningbo Huazhong Holdings Company Limited, or Huazhong, a subsidiary of a publicly traded automotive OEM supplier in China, whereby we and Huazhong agreed to form a joint venture limited liability company in China for the development, manufacture and sales of connected navigation systems for the China automotive aftermarket and local OEMs. We have not made any capital contributions to the joint venture, and the parties are currently renegotiating the nature, timing and amounts of capital to be contributed.
In addition to the general risks associated with international operations, the joint venture, in which we expect to hold a 19.9% interest, is subject to a number of other risks and uncertainties, including the following:
23
• | Our reliance is, in part, on the operational skill of our joint venture partner. Additionally, because we will be the minority equity holder of the joint venture, we may not have the ability to exercise significant influence over the operating and financial policies of the entity. For these reasons, or as a result of other factors, we may not realize the anticipated benefits of the joint venture, and our participation in the joint venture could adversely affect the results of our operations. |
• | Our ability to operate the joint venture is dependent upon, among other things, our ability to attract personnel with the skills, knowledge and experience necessary to carry out the operations of the joint venture. We face intense competition for these individuals worldwide, including in China. We may not be able to attract qualified employees to operate the joint venture, which may negatively affect the value of our investment in the joint venture. |
• | Although we believe we have achieved a strong market position in China, many of our competitors who are significantly larger than we are and have substantially greater financial, distribution, marketing and other resources, more stable manufacturing resources and greater brand strength are also concentrating on growing their businesses in China. In addition, the number of competitors in the marketplace has increased significantly in recent years. Increased investment by our competitors in this market could decrease our market share and competitive position in China. |
We rely on our management team and need specialized personnel to grow our business, and the loss of one or more key employees or our inability to attract and retain qualified personnel could harm our business.
Our success and future growth depend on the skills, working relationships and continued services of our management team. Our future performance will depend on our ability to continue to retain our senior management, particularly in the growth areas of our business, such as automotive and advertising.
Our future success also will depend on our ability to attract, retain and motivate highly skilled personnel in the United States and internationally. All of our U.S. employees work for us on an at will basis. Competition for highly skilled personnel is intense, particularly in the software industry and for persons with experience with GPS and location services. The high degree of competition for personnel we experience has resulted in and may also continue to result in the incurrence of significantly higher compensation costs to attract, hire and retain employees. We have from time to time experienced, and we expect to continue to experience, difficulty in attracting, hiring and retaining highly skilled employees with appropriate qualifications. In addition, existing employees often consider the value of the stock awards they receive in connection with their employment. If our stock price performs poorly, it may adversely affect our ability to retain highly skilled employees. Our inability to attract and retain the necessary personnel could adversely affect our business and future growth prospects.
We may be required to incur unanticipated capital expenditures.
Circumstances may arise that require us to make unanticipated capital expenditures, including:
• | requirements to replace outsourced hosting with third party data centers for which we provide equipment due to cost, natural disasters or inadequate quality of services; |
• | the replacement of outdated or failing equipment; and |
• | the acquisition of key technologies to support or expand our products and services. |
We rely on network infrastructure provided by our wireless carrier customers, mobile phones and in-car wireless connections for the delivery of our mobile navigation services to end users.
We generally provide our navigation services from third party hosted servers, which require close integration with the wireless carriers’ networks. We may be unable to provide high quality services if the wireless carriers’ networks perform poorly or experience delayed response times. Our future success will depend on the availability and quality of our wireless carrier customers’ networks in the United States and abroad to run our mobile navigation services. This includes deployment and maintenance of reliable networks with the speed, data capacity and security necessary to provide reliable wireless communications services. We do not establish or maintain these wireless networks and have no control over interruptions or failures in the deployment and maintenance by wireless carrier customers of their network infrastructure. In addition, these wireless network infrastructures may be unable to support the demands placed on them if the number of subscribers increases, or if existing or future subscribers increase their use of limited bandwidth. Market acceptance of our mobile navigation services will depend in part on the quality of these wireless networks and the ability of our wireless carrier customers to effectively manage their subscribers’ expectations.
In addition, certain automobile navigation applications rely on wireless connections between the vehicle and our network. We have no influence or control over the vehicle’s wireless equipment and if it does not operate in a satisfactory manner, our ability to provide those services would be impaired and our reputation would be harmed.
24
Wireless communications have experienced a variety of outages and other delays as a result of infrastructure and equipment failures and could face outages and delays in the future. These outages and delays could affect our ability to provide our navigation services successfully. In addition, changes by a wireless carrier to its network infrastructure may interfere with the integration of our servers with their network and delivery of our navigation services and may cause end users to lose functionality for services they have already purchased. Any of the foregoing could harm our business, operating results and financial condition.
We cannot control the quality standards of our wireless carrier customers, their mobile phone providers, automobile manufacturers and other technology customers. We cannot guarantee that the mobile phones or in-car wireless equipment are free from errors or defects. If errors or defects occur in mobile phones or services offered by our wireless carrier customers, it could result in consumers terminating our services, damage to our reputation, increased customer service and support costs, warranty claims, lost revenue and diverted development resources, any of which could adversely affect our business, results of operations and financial condition.
Mergers, consolidations or other strategic transactions in the mapping data industry could weaken our competitive position, reduce the number of our map providers and adversely affect our business.
The mapping data industry continues to experience consolidation. Should one of our map providers consolidate or enter into an alliance with another navigation provider, this could have a material adverse impact on our business. Currently, two of our map suppliers are owned by competitors in the navigation space. Recently, Nokia sold its mobile phone business to Microsoft and sold HERE, its mapping business, to a consortium of German automobile manufacturers. Such a consolidation may cause us to lose a map supplier or require us to increase the royalties we pay to map vendors as a result of enhanced supplier leverage, which would have a negative effect on our business. We may be unable to replace our map suppliers, were we to lose a map supplier, and the remaining map supplier may increase license fees. In addition, as we continue to use more OSM-based maps and no longer purchase maps from those suppliers, we may be unable to purchase other data that is integral to our navigation products from our existing map suppliers.
Changes in business direction and market conditions could lead to charges related to structural reorganization and discontinuation of certain products or services, which may adversely affect our financial results.
In response to changing market conditions and the desire to focus on new and more potentially attractive opportunities, we may be required to strategically realign our resources and consider restructuring, eliminating, or otherwise exiting certain business activities. For example, in April 2013, we sold our enterprise business to a third party, which resulted in a net gain to us but also required us to provide transition services to the buyer. In the fourth quarters of fiscal 2013 and 2014, in order to better align and focus our resources we initiated restructuring plans resulting in reductions of approximately 83 and 108 full-time positions, respectively, and restructuring charges of $1.5 million and $2.4 million, respectively, related to severance and benefits for the positions eliminated. Any decision to reduce investment in, dispose of, or otherwise exit business activities may result in the recording of special charges, such as workforce reduction and excessive facility space costs.
Risks related to our intellectual property and regulation
We operate in an industry with extensive intellectual property litigation. Claims of infringement against us, our customers, or other business partners may cause our business, operating results and financial condition to suffer.
Our commercial success depends in part upon us, our partners and our customers not infringing intellectual property rights owned by others and being able to resolve claims of intellectual property infringement without major financial expenditures and/or need to alter our technologies or cease certain activities. We operate in an industry with extensive intellectual property litigation and it is not uncommon for our wireless carrier customers, handset manufacturing partners, automobile manufacturers and OEMs and competitors to be involved in infringement lawsuits by or against third parties. Many industry participants that own, or claim to own, intellectual property aggressively assert their rights, and our customers and other business partners, who we agree in certain circumstances to indemnify for intellectual property infringement claims related to our services, are often targets of such assertions. We cannot determine with certainty whether any existing or future third party intellectual property rights would require us to alter our technologies, obtain licenses or cease certain activities.
We have received, and may in the future receive, claims from third parties alleging infringement and other related claims. As of the date of this Annual Report on Form 10-K, we were named as a defendant in several cases alleging that our services infringe other parties' patents, as well as other matters. See Part I, Item 3, “Legal Proceedings,” for a description of these matters. These cases and future litigation may make it necessary to defend ourselves and our customers and other business partners by determining the scope, enforceability and validity of third party proprietary rights or to establish our proprietary rights. Some of our competitors may have substantially greater resources than we do and may be able to sustain the costs of complex intellectual property litigation to a greater degree and for longer periods of time than we could. In addition, patent holding companies that focus solely on extracting royalties and settlements by enforcing patent rights may target us, our wireless carrier customers or our other business partners. These companies typically have little or no product revenue and therefore our patents may provide little or no deterrence against such companies filing patent infringement lawsuits against us.
25
Regardless of whether claims that we are infringing patents or other intellectual property rights have any merit, these claims are time consuming and costly to evaluate and defend and could:
• | adversely affect our relationships with our current or future customers and other business partners; |
• | cause delays or stoppages in the shipment of Telenav enabled or preloaded mobile phones or vehicles, or cause us to modify or suspend the provision of our navigation services; |
• | cause us to incur significant expenses in defending claims brought against our customers, other business partners or us; |
• | divert management's attention and resources; |
• | subject us to significant damages or settlements; |
• | require us to enter into settlements, royalty or licensing agreements on unfavorable terms; or |
• | require us or our business partners to cease certain activities and/or modify our products or services. |
In addition to liability for monetary damages against us or, in certain circumstances, our customers, we may be prohibited from developing, commercializing or continuing to provide certain of our navigation services unless we obtain licenses from the holders of the patents or other intellectual property rights. We cannot assure you that we will be able to obtain any such licenses on commercially reasonable terms, or at all. If we do not obtain such licenses, our business, operating results and financial condition could be materially adversely affected and we could, for example, be required to cease offering our navigation services or be required to materially alter our navigation services, which could involve substantial costs and time to develop.
Unauthorized control or manipulation of our systems in vehicles may cause them to operate improperly or not at all, or compromise their safety and data security, which could result in loss of confidence in us and our products, cancellation of contracts with certain of our auto OEM customers and harm our business.
There have been reports of vehicles of certain automobile manufacturers being “hacked” to grant access and operation of the vehicles to unauthorized persons and would-be thieves. Modern vehicles are technologically advanced machines requiring the interoperation of numerous complex and evolving hardware and software systems, including the navigation system, and with respect to vehicles with autonomous driving features, control of the vehicle. We have agreed with some of our auto OEM customers to adopt certain security procedures and we may be subject to claims or our contracts with those OEMs may be terminated if we do not comply with our covenants or if our products are the source of access to the systems in their vehicles by intruders.
Although we have designed, implemented and tested security measures to prevent unauthorized access to our products when installed in vehicles, our information technology networks and communications with vehicles in which our products are installed may be vulnerable to interception, manipulation, damage, disruptions or shutdowns due to attacks by hackers or breaches due to errors by personnel who have access to our networks and systems. Any such attacks or breaches could result in unexpected control of or changes to the vehicles’ functionality and our products’ user interface and performance characteristics. Hackers may also use similar means to gain access to data stored in or generated by the vehicle, such as its current geographical position, previous and stored destination address history and web browser “favorites.” Any such unauthorized control of vehicles or access to or loss of information could result in legal claims or proceedings and negative publicity, which would negatively affect our brand and harm our business, prospects, financial condition and operating results.
Our business is subject to online security risks, including security and privacy breaches.
Our business involves the collection, storage, processing and transmission of users’ personal data including information about routes mapped and taken. An increasing number of organizations, including large online and offline merchants and businesses, other large Internet companies, financial institutions, and government institutions, have disclosed breaches of their security, some of which have involved sophisticated and highly targeted attacks, including on portions of their websites or infrastructure. We have been subject to such attacks in the past, although they have not, to our knowledge, resulted in the disclosure of user information and we work to evaluate and improve our security. A breach of security or privacy could have negative consequences to our reputation, which could result in users discontinuing or reducing their use of our products and our automotive OEM and advertising customers terminating their agreements with us, and could have significant out-of-pocket financial impact, which could harm our business. Similarly, a breach of security or privacy in vehicles in which our navigation products are installed could result in a reduction in adoption of our navigation products.
The techniques used to obtain unauthorized, improper or illegal access, disable or degrade service, or sabotage systems change frequently, may be difficult to detect quickly, and often are not recognized until launched against a target. Certain efforts may be state-sponsored and supported by significant financial and technological resources and may therefore be even more difficult to detect. As a result, we may be unable to anticipate these techniques or to implement adequate preventative measures. Unauthorized
26
parties also may attempt to gain access to our systems or facilities through various means, including hacking into our systems or facilities, fraud, trickery or other means of deceiving our employees, contractors and temporary staff. A party that is able to circumvent our security measures could misappropriate our, our customers’ or our employees’ personal or proprietary information, cause interruption in our operations and damage our computers and systems or those of our customers. In addition, our customers have been and likely will continue to be targeted by parties using fraudulent “spoof” and “phishing” emails to misappropriate user names, passwords, payment card numbers, GPS data or other personal information or to introduce viruses or other malware, including through “trojan horse” programs, to our users' phones and vehicles. Also, our information technology and infrastructure may be vulnerable to cyberattacks or security incidents, and third parties may be able to access our customers’ personal or proprietary information and payment card data that are stored on or accessible through our systems. Any security or privacy breach at a company providing services to us or our OEM customers, or integrated with our products and services, could have similar effects. We may also need to expend significant additional resources to protect against security or privacy breaches or to redress problems caused by breaches. These issues are likely to become more difficult and costly as we expand the number of markets where we operate. Additionally, our insurance policies carry low coverage limits, which may not be adequate to reimburse us for losses caused by security breaches, and we may not be able to collect fully, if at all, under these insurance policies.
Changes in government regulation of the wireless communications, the automobile and mobile advertising industries may adversely affect our business.
It is possible that a number of laws and regulations may be adopted in the United States and elsewhere that could restrict the wireless communications industry, further regulate the automobile industry or impair the mobile advertising industry, including laws and regulations regarding lawful interception of personal data, hands free use of mobile phones or navigation services within autos, autonomous driving or the control of such use, privacy, taxation, content suitability, copyright and antitrust. Furthermore, the growth and development of electronic storage of personal information may prompt calls for more stringent consumer protection laws that may impose additional burdens on companies such as ours that store personal information. We anticipate that regulation of the industries in which our products and services are used will increase and that we will be required to devote legal and other resources to address this regulation. In addition, governments have recently begun to consider and adopt laws regarding vehicles using ADAS systems and those laws may curtail or preclude using the services our products provide. Changes in current laws or regulations or the imposition of new laws and regulations in the United States or elsewhere regarding the wireless communications or automobile industries may make operation more costly, and may materially reduce our ability to increase or maintain sales of our products and services.
Government regulation designed to protect end user privacy may make it difficult for us to provide our services or adopt advertising based revenue models.
We transmit and store a large volume of personal information in the course of providing our products and services. This information is increasingly subject to legislation and regulations in numerous jurisdictions around the world. This government action is typically intended to protect the privacy and security of personal information that is collected, stored and transmitted in or from the governing jurisdiction.
Legislation may also be adopted in various jurisdictions that prohibits use of personal information and search histories to target end users with tailored advertising, or provide advertising at all. Although our advertising revenue to date is not significant, we anticipate we will continue to grow advertising revenue in the future to improve average revenue per user in certain markets.
We could be adversely affected if domestic or international legislation or regulations are expanded to require changes in our business practices or if governing jurisdictions interpret or implement their legislation or regulations in ways that negatively affect our business. For example, the USA PATRIOT Act provides certain rights to U.S. law enforcement authorities to obtain personal information in the control of U.S. persons and entities without notifying the affected individuals. If we are required to allocate significant resources to modify the delivery of our services to enable enhanced legal interception of the personal information that we transmit and store, our results of operations and financial condition may be adversely affected.
In addition, because various foreign jurisdictions have different laws and regulations concerning the storage and transmission of personal information, we may face unknown requirements that pose compliance challenges in new international markets that we seek to enter. Such variation could subject us to costs, delayed service launches, liabilities or negative publicity that could impair our ability to expand our operations into some countries and therefore limit our future growth.
As privacy and data protection have become more sensitive issues, we may also become exposed to potential liabilities as a result of differing views on the privacy of personal information. These and other privacy concerns could adversely impact our business, results of operations and financial condition.
27
If we are unable to protect our intellectual property and proprietary rights, our competitive position and our business could be harmed.
We rely primarily on a combination of patent laws, trademark laws, copyright laws, trade secrets, confidentiality procedures and contractual provisions to protect our proprietary technology. However, our issued patents and any future patents that may issue may not survive a legal challenge to their scope, validity or enforceability, or provide significant protection for us. The failure of our patents to adequately protect our technology might make it easier for our competitors to offer similar products or technologies. In addition, patents may not issue from any of our current or any future applications.
Monitoring unauthorized use of our intellectual property is difficult and costly. The steps we have taken to protect our proprietary rights may not be adequate to prevent misappropriation of our intellectual property. We may not be able to detect unauthorized use of, or take appropriate steps to enforce, our intellectual property rights. Our competitors may also independently develop similar technology. In addition, the laws of many countries do not protect our proprietary rights to as great an extent as do the laws of the United States. Any failure by us to meaningfully protect our intellectual property could result in competitors offering products that incorporate our most technologically advanced features, which could seriously reduce demand for our navigation services. In addition, we may in the future need to initiate infringement claims or litigation. Litigation, whether we are a plaintiff or a defendant, can be expensive, time consuming and may divert the efforts of our technical staff and managerial personnel, which could harm our business, whether or not such litigation results in a determination favorable to us.
Confidentiality agreements with employees and others may not adequately prevent disclosure of our trade secrets and other proprietary information.
We have devoted substantial resources to the development of our proprietary technology, including the proprietary software components of our navigation services and related processes. In order to protect our proprietary technology and processes, we rely in part on confidentiality agreements with our employees, licensees, independent contractors and other advisors. These agreements may not effectively prevent disclosure of our confidential information and may not provide an adequate remedy in the event of unauthorized disclosure of our confidential information. In addition, others may independently discover trade secrets and proprietary information, and in such cases we could not assert any trade secret rights against such parties. Costly and time consuming litigation could be necessary to enforce and determine the scope of our proprietary rights, and failure to obtain or maintain trade secret protection could adversely affect our competitive business position.
We use open source software in our navigation services platform and client applications and may use more open source software in the future. Use of open source software may subject our navigation services platform and client applications to general release or require us to re-engineer our navigation services platform and client applications, which may cause harm to our business. From time to time, there have been claims challenging the ownership of open source software against companies that incorporate open source software into their products. As a result, we could be subject to suits by parties claiming ownership of what we believe to be open source software. Some open source licenses contain requirements that we make available source code for modifications or derivative works we create based upon the open source software and that we license such modifications or derivative works under the terms of a particular open source license or other license granting third parties certain rights of further use. If we combine our proprietary software products with open source software in a certain manner, we could, under certain of the open source licenses, be required to release our proprietary source code. In addition to risks related to license requirements, usage of open source software can lead to greater risks than use of third party commercial software, as open source licensors generally do not provide warranties or controls on origin of the software. Open source license terms may be ambiguous and many of the risks associated with usage of open source cannot be eliminated, and could, if not properly addressed, negatively affect our business. If we were found to have inappropriately used open source software, we may be required to release our proprietary source code, re-engineer our navigation services platform and client applications, discontinue the sale of our service in the event re-engineering cannot be accomplished on a timely basis or take other remedial action that may divert resources away from our development efforts, any of which could adversely affect our business, operating results and financial condition.
Risks related to being a publicly traded company and holding our common stock
As a public company, we are obligated to develop and maintain effective internal control over financial reporting. We may not always complete our assessment of the effectiveness of our internal control over financial reporting in a timely manner, or such internal control may not be determined to be effective, which may adversely affect investor confidence in our company and, as a result, the value of our common stock.
The Sarbanes-Oxley Act requires that we test our internal control over financial reporting and disclosure controls and procedures annually. For example, as of June 30, 2016, we performed system and process evaluation and testing of our internal control over financial reporting to allow management and our independent registered public accounting firm to report on the effectiveness of our internal control over financial reporting, as required by Section 404 of the Sarbanes-Oxley Act. Our compliance with Section 404 requires that we incur substantial expense and expend significant management time on
28
compliance-related issues. Moreover, if we are not able to comply with the requirements of Section 404 in the future, or if we or our independent registered public accounting firm identify deficiencies in our internal control over financial reporting that are deemed to be material weaknesses, the market price of our stock may decline and we could be subject to sanctions or investigations by the NASDAQ Global Market, the SEC or other regulatory authorities, which would require significant additional financial and management resources.
We will continue to incur high costs and demands upon management as a result of complying with the laws and regulations affecting public companies, which could harm our operating results.
As a public company, we incur significant legal, accounting, investor relations and other expenses, including costs associated with public company reporting requirements. We also have incurred and will continue to incur costs associated with current corporate governance requirements, including requirements under Section 404 and other provisions of the Sarbanes-Oxley Act, as well as rules implemented by the SEC and the stock exchange on which our common stock is traded. We are generally not eligible to report under reduced disclosure requirements or benefit from longer phase in periods for “emerging growth companies” as such term is defined in the Jumpstart Our Business Act of 2012. The expenses incurred by public companies for reporting and corporate governance purposes have increased dramatically over the past several years. We expect these rules and regulations to continue to impact our legal and financial compliance costs substantially and to make some activities more time consuming and costly. We are unable currently to estimate these costs with any degree of certainty. We also expect that, over time, it may be more expensive for us to obtain director and officer liability insurance. As a result, it may be more difficult for us to attract and retain qualified individuals to serve on our board of directors or as our executive officers if we cannot provide a level of insurance coverage that they believe is adequate.
Regulations relating to investments in offshore companies by Chinese residents may subject our Chinese-resident beneficial owners or our Chinese subsidiaries to liability or penalties, limit our ability to inject capital into our Chinese subsidiaries, limit our Chinese subsidiaries’ ability to increase their registered capital or limit their ability to distribute profits to us.
On July 4, 2014, SAFE promulgated the Circular on Relevant Issues Concerning Foreign Exchange Control on Domestic Residents' Offshore Investment and Financing and Roundtrip Investment through Special Purpose Vehicles, or Circular 37, which replaced the former Circular on Issues Relating to the Administration of Foreign Exchange in Fund-Raising and Round Trip Investment Activities of Domestic Residents Conducted via Offshore Special Purpose Vehicles (commonly known as "SAFE Circular 75") promulgated by SAFE on October 21, 2005. Circular 37 requires Chinese residents to register with local branches of SAFE in connection with their direct establishment or indirect control of an offshore entity, for the purpose of overseas investment and financing, with such Chinese residents' legally owned assets or equity interests in domestic enterprises or offshore assets or interests, referred to in Circular 37 as a "special purpose vehicle." Circular 37 further requires amendment to the registration in the event of any significant changes with respect to the special purpose vehicle, such as increase or decrease of capital contributed by Chinese individuals, share transfer or exchange, merger, division or other material event. In the event that a Chinese shareholder holding interests in a special purpose vehicle fails to fulfill the required SAFE registration, the Chinese subsidiaries of that special purpose vehicle may be prohibited from making profit distributions to the offshore parent and from carrying out all subsequent cross-border foreign exchange activities in worst scenario, and the special purpose vehicle may be restricted in its ability to contribute additional capital into its Chinese subsidiary. Furthermore, failure to comply with the various SAFE registration requirements described above could result in liability under Chinese law for evasion of foreign exchange controls. On February 13, 2015, SAFE promulgated a Notice on Further Simplifying and Improving Foreign Exchange Administration Policy on Direct Investment, or Circular 13, which became effective on June 1, 2015. Pursuant to Circular 13, entities and individuals are required to apply for foreign exchange registration of overseas direct investment, including those required under Circular 37, with qualified banks, instead of SAFE. The qualified banks, under the supervision of SAFE, will directly review the applications and conduct the registration.
We attempt to comply, and attempt to ensure that our stockholders who are subject to Circular 37 and other related rules, comply with the relevant requirements under Circular 37. However, we cannot provide any assurances that all of our stockholders who are Chinese residents have complied or will comply with our request to make or obtain any applicable registrations or comply with other requirements required by Circular 37 or other related rules. Any failure or inability of any of our stockholders who is a Chinese resident to comply with relevant requirements under Circular 7 could subject such stockholders or our Chinese subsidiaries to fines and legal sanctions imposed by the Chinese government and may also limit our ability to contribute additional capital into our Chinese subsidiaries or receive dividends or other distributions from our Chinese subsidiaries. As a result, these risks may have a material adverse effect on our business, financial condition and results of operations.
29
If securities analysts do not publish research or reports about our business or if they publish negative evaluations of our stock, the price of our stock could decline.
We expect that the trading price for our common stock will be affected by any research or reports that industry or financial analysts publish about us or our business. If one or more of the analysts who may elect to cover us downgrade their evaluations of our stock, the price of our stock could decline. For example, in late July 2011, following our earnings release for the three months and fiscal 2011, several financial analysts published research reports lowering their price targets of our stock. After our announcement and the publication of these reports, our stock price fell more than 40%. If one or more of these analysts cease coverage of our company, our stock may lose visibility in the market, which in turn could cause its price to decline. As of June 30, 2016, only four research analysts published reports regarding our company. In addition, if our stock were to trade at prices below $5.00 per share for an extended period in the future, financial analysts may terminate coverage of our company due to internal policies within their investment banks, which could result in further stock price declines.
Our stock price has fluctuated significantly and may continue to fluctuate in the future.
Our common stock was sold in our IPO at $8.00 per share. Although our common stock has traded at prices as high as $22.07 per share, it has also traded at prices as low as $4.47 and has tended to have significant downward and upward price movements in a relatively short time period. Future fluctuations or declines in the trading price of our common stock may result from a number of events or factors, including those discussed in the preceding risk factors relating to our operations, as well as:
• | actual or anticipated fluctuations in our operating results; |
• | changes in the financial projections we may provide to the public or our failure to meet these projections; |
• | announcements by us or our competitors of significant technical innovations, relationship changes with key customers, acquisitions, strategic partnerships, joint ventures, capital raising activities or capital commitments; |
• | the public’s response to our press releases or other public announcements, including our filings with the SEC; |
• | lawsuits threatened or filed against us; and |
• | large distributions of our common stock by significant stockholders to limited partners or others who immediately resell the shares. |
General market conditions and domestic or international macroeconomic factors unrelated to our performance, such as the continuing unprecedented volatility in the financial markets, may also affect our stock price. For these reasons, investors should not rely on recent trends to predict future stock prices or financial results. Investors in our common stock may not be able to dispose of the shares they purchased at prices above the IPO price, or, depending on market conditions, at all.
In addition, if the market price of our common stock falls below $5.00 per share for an extended period of time, under stock exchange rules, our stockholders will not be able to use such shares as collateral for borrowing in margin accounts. Further, certain institutional investors are restricted from investing in shares priced below $5.00 per share. This inability to use shares of our common stock as collateral and the inability of certain institutional investors to invest in our shares may depress demand and lead to sales of such shares creating downward pressure on and increased volatility in the market price of our common stock.
Recently, the market price for our common stock has traded only slightly above the cash value of our common stock. If investors do not value our company as an ongoing business and only value it for the cash on our balance sheet, our stock price may decline if we continue to incur net losses and use our cash to fund operations. We may also attract investors who are looking for short-term gains in our shares rather than being interested in our long-term outlook. As a result, the price of our common stock may be volatile.
The concentration of ownership of our capital stock limits your ability to influence corporate matters.
Our executive officers, directors, current 5% or greater stockholders and entities affiliated with them beneficially owned (as determined in accordance with the rules of the SEC) approximately 33.3% of our common stock outstanding as of June 30, 2016. This significant concentration of share ownership may adversely affect the trading price for our common stock because investors often perceive disadvantages in owning stock in companies with controlling stockholders. Also, these stockholders, acting together, may be able to control our management and affairs and matters requiring stockholder approval, including the election of directors and the approval of significant corporate transactions, such as mergers, consolidations or the sale of substantially all of our assets. Consequently, this concentration of ownership may have the effect of delaying or preventing a change of control, including a merger, consolidation or other business combination involving us, or discouraging a potential acquirer from making a tender offer or otherwise attempting to obtain control, even if that change of control would benefit our other stockholders.
30
ITEM 1B. | UNRESOLVED STAFF COMMENTS |
None.
ITEM 2. | PROPERTIES |
Facilities
Our corporate headquarters are located at 4655 Great America Parkway, Suite 300, Santa Clara, California in an office consisting of approximately 55,000 square feet pursuant to a lease that expires in April 2021. This headquarters facility houses the majority of our U.S. research and development, support, marketing and general and administrative personnel. We lease approximately 32,000 square feet of space in Shanghai, China for our research and development, sales and support operations pursuant to a lease expiring in September 2019, approximately 9,000 square feet in Xi’an, China, for research and development operations pursuant to a lease expiring in September 2017, and approximately 22,000 square feet in Cluj, Romania, for research and development operations pursuant to leases that expire in October 2016. We lease approximately 12,000 square feet in Culver City, California for research and development and sales and marketing operations pursuant to a lease expiring in February 2019. We also lease office space of less than 5,000 square feet each in Reston, Virginia; Southfield, Michigan; Boston, Massachusetts; Chicago, Illinois; New York, New York; Atlanta, Georgia; Berlin, Germany, Tokyo, Japan and Incheon, South Korea for our sales, marketing and business development personnel located in those areas. We believe our current facilities will be adequate or that additional space will be available on commercially reasonable terms for the foreseeable future.
ITEM 3. | LEGAL PROCEEDINGS |
From time to time, we may be subject to legal proceedings and claims in the ordinary course of business. We have received, and may in the future continue to receive, claims from third parties asserting infringement of their intellectual property rights. Future litigation may be necessary to defend ourselves and our customers by determining the scope, enforceability and validity of third party proprietary rights or to establish our proprietary rights. From time to time we also may be subject to claims from our third party content providers that we owe them additional royalties and interest, which claims may result in litigation if we and the third party content provider are unable to resolve the matter. There can be no assurance with respect to the outcome of any current or future litigation brought against us or pursuant to which we have indemnification obligations and the outcome could have a material adverse impact on our business, operating results and financial condition.
On December 31, 2009, Vehicle IP, LLC, or Vehicle IP, filed a patent infringement lawsuit against us in the U.S. District Court for the District of Delaware, seeking monetary damages, fees and expenses and other relief. Verizon Wireless, or Verizon, was named as a co-defendant in the Vehicle IP litigation based on the VZ Navigator product and has demanded that we indemnify and defend Verizon against Vehicle IP. At this time, we have not agreed to defend or indemnify Verizon. AT&T was also named as a co-defendant in the Vehicle IP litigation based on the AT&T Navigator and Telenav Track products. AT&T has tendered the defense of the litigation to us and we are defending the case on behalf of AT&T. After the district court issued its claim construction ruling, the defendants filed motions for summary judgment of noninfringement. On April 10, 2013 the district court granted AT&T and our motion for summary judgment of noninfringement. Plaintiff appealed the district court's claim construction and summary judgment rulings to the U.S. Court of Appeals for the Federal Circuit. On November 18, 2014, the U.S. Court of Appeals for the Federal Circuit reversed the district court's claim construction and overturned the district court's grant of summary judgment of noninfringement. The case was sent back to the U.S. District Court for the District of Delaware and trial is currently scheduled for February 2017. During fiscal 2016, we accrued $850,000 related to this litigation. We believe that it is probable that we will incur a loss; however, beyond the amount accrued we cannot currently estimate a range of any possible losses we may experience in connection with this case. Accordingly, we are unable at this time to estimate the effects of this lawsuit on our financial condition, results of operations, or cash flows.
On July 28, 2016, Nathan Gergetz filed a putative class action complaint in the U.S, District Court for the Northern District of California, alleging that Telenav violated the Telephone Consumer Protection Act, or TCPA. The complaint purports to be filed on behalf of a class, and it alleges that Telenav caused unsolicited text messages to be sent to the plaintiff from July 6, 2016 to July 26, 2016. Plaintiffs seek statutory and actual damages under the TCPA law, attorneys’ fees and costs of the action, and an injunction to prevent any future violations. Due to the preliminary nature of this matter and uncertainties relating to litigation, we are unable at this time to estimate the effects of this lawsuit on our financial condition, results of operations, or cash flows.
In addition, we have received, and expect to continue to receive, demands for indemnification from our customers, which demands can be very expensive to settle or defend, and we have in the past offered to contribute to settlement amounts and
31
incurred legal fees in connection with certain of these indemnity demands. A number of these indemnity demands, including demands relating to pending litigation, remain outstanding and unresolved as of the date of this Form 10-K. Furthermore, in response to these demands we may be required to assume control of and bear all costs associated with the defense of our customers in compliance with our contractual commitments. At this time, we are not a party to the following cases; however our customers have requested that we indemnify them in connection with such cases:
In 2008, Alltel, AT&T, Sprint Corporation, or Sprint, and T-Mobile USA, or T-Mobile, each demanded that we indemnify and defend them against patent infringement lawsuits brought by patent holding companies EMSAT Advanced Geo-Location Technology LLC and Location Based Services LLC (collectively, EMSAT) in the U.S. District Court for the Northern District of Ohio. In March 2011, EMSAT and AT&T settled their claims. The PTO reexamined two of the patents in suit, confirming the validity of only two of the asserted claims from those patents. All patent claims that EMSAT alleged to be infringed by the Telenav GPS Navigator product were cancelled during reexamination. In the suits against T-Mobile, Alltel and Sprint, EMSAT amended its allegations to remove allegations of infringement of the patent claims that were cancelled during reexamination. EMSAT and T-Mobile stipulated to a dismissal and their case was dismissed on January 28, 2015. On March 20, 2015, the Court dismissed and closed the Alltel case and on April 10, 2015 the Court dismissed and closed the Sprint case. We have not yet determined the extent of our indemnification obligations to AT&T. We believe that it is reasonably possible that we will incur additional loss; however, we cannot currently estimate a range of other possible losses we may experience in connection with this matter. Accordingly, we are unable at this time to estimate the effects of this matter on our financial condition, results of operations, or cash flows.
In March 2009, AT&T demanded that we indemnify and defend them against a patent infringement lawsuit brought by Tendler Cellular of Texas LLC, or Tendler, in the U.S. District Court for the Eastern District of Texas. In June 2010, AT&T settled its claims with Tendler and we came to an agreement with AT&T as to the extent of our contribution towards AT&T's settlement and the amount of our contribution was not material; however, there continues to be a disagreement as to whether any additional amounts are owed to AT&T for legal fees and expenses related to the defense of the matter. We believe that it is reasonably possible that we will incur additional loss; however, we cannot currently estimate a range of other possible losses we may experience in connection with this matter. Accordingly, we are unable at this time to estimate the effects on our financial condition, results of operations, or cash flows.
On April 6, 2016, Venus Locations LLC, or Venus, filed patent infringement lawsuits against AT&T, Inc., T-Mobile and Sprint in the U.S. District Court for the Eastern District of Texas, alleging infringement of U.S. Patent Number 6,442,485 by AT&T Navigator, Telenav Navigator, and Sprint Navigator, respectively. AT&T, Inc., T-Mobile, and Sprint each demanded that we defend and indemnify them against the claims brought by Venus. On May 26, 2016, Venus filed Unopposed Motions for Dismissal in the cases against AT&T, Inc., T-Mobile, and Sprint. On May 27, 2016, the court closed each of those cases.
While we presently believe that the ultimate outcome of these proceedings, individually and in the aggregate, will not materially harm our financial position, cash flows or overall trends in results of operations, legal proceedings are subject to inherent uncertainties and unfavorable rulings could occur. Nevertheless, were unfavorable final outcomes to occur, there exists the possibility of a material adverse impact on our business, financial position, cash flows or overall trends in results of operations.
Large future indemnity payments and associated legal fees and expenses, including potential indemnity payments and legal fees and expenses relating to our wireless carrier and other customers’ indemnity demands with respect to pending litigation, could materially harm our business, operating results and financial condition. When we believe a loss or a cost of indemnification is probable and can be reasonably estimated, we accrue the estimated loss or cost of indemnification in our consolidated financial statements. Where the outcome of these matters is not determinable, we do not make a provision in our financial statements until the loss or cost of indemnification, if any, is probable and can be reasonably estimated or the outcome becomes known. Although to date we have not agreed to defend or indemnify our customers for outstanding and unresolved indemnity demands where we do not believe we have an obligation to do so or that our solution infringes on asserted intellectual property rights, we may in the future agree to defend and indemnify our customers in connection with demands for indemnification, irrespective of whether we believe that we have an obligation to indemnify them or whether we believe our solution infringes the asserted intellectual property rights. Alternatively, we may reject certain of our customers’ indemnity demands, including the outstanding demands, which may lead to disputes with our customers, negatively impact our relationships with them or result in litigation against us. Our wireless carrier or other customers may also claim that any rejection of their indemnity demands constitutes a material breach of our agreements with them, allowing them to terminate such agreements. If we make substantial payments as a result of indemnity demands, our relationships with our customers are negatively impacted, or any of our customer agreements is terminated, our business, operating results and financial condition could be materially harmed.
32
ITEM 4. | MINE SAFETY DISCLOSURES |
Not applicable.
PART II.
ITEM 5. | MARKET FOR REGISTRANT’S COMMON EQUITY, RELATED STOCKHOLDER MATTERS AND ISSUER PURCHASES OF EQUITY SECURITIES |
Our common stock began trading on the NASDAQ Global Market under the symbol “TNAV” on May 13, 2010. The following table sets forth the range of high and low closing sales prices of our common stock for the periods indicated:
Year ended June 30, 2016 | High | Low | ||||||
First Quarter | $ | 8.18 | $ | 6.65 | ||||
Second Quarter | $ | 7.71 | $ | 5.69 | ||||
Third Quarter | $ | 6.68 | $ | 5.17 | ||||
Fourth Quarter | $ | 6.06 | $ | 4.48 | ||||
Year ended June 30, 2015 | High | Low | ||||||
First Quarter | $ | 7.99 | $ | 4.73 | ||||
Second Quarter | $ | 7.22 | $ | 5.83 | ||||
Third Quarter | $ | 9.15 | $ | 6.47 | ||||
Fourth Quarter | $ | 9.76 | $ | 7.93 | ||||
We had approximately 52 stockholders of record as of July 31, 2016. A substantially greater number of holders of our common stock are “street name” or beneficial holders, whose shares are held by banks, brokers and other financial institutions. We have never declared or paid dividends on our common stock and do not expect to pay dividends on our common stock for the foreseeable future. Instead, we anticipate that all of our earnings in the foreseeable future will be used for the operation and growth of our business.
Unregistered Sales of Equity Securities and Use of Proceeds.
Not applicable.
STOCK PERFORMANCE GRAPH
This performance graph shall not be deemed “soliciting material” or to be “filed” with the Securities and Exchange Commission for purposes of Section 18 of the Securities Exchange Act of 1934, as amended, or the Exchange Act, or otherwise subject to the liabilities under that Section, and shall not be deemed to be incorporated by reference into any filing of Telenav, Inc. under the Securities Act or the Exchange Act.
The following graph shows a comparison from July 1, 2011 through June 30, 2016 of cumulative total return for our common stock, the NASDAQ Composite Index and the Russell 3000 Index. Such returns are based on historical results and are not intended to suggest future performance. Data for the NASDAQ Composite Index and the Russell 3000 Index assume reinvestment of dividends.
33
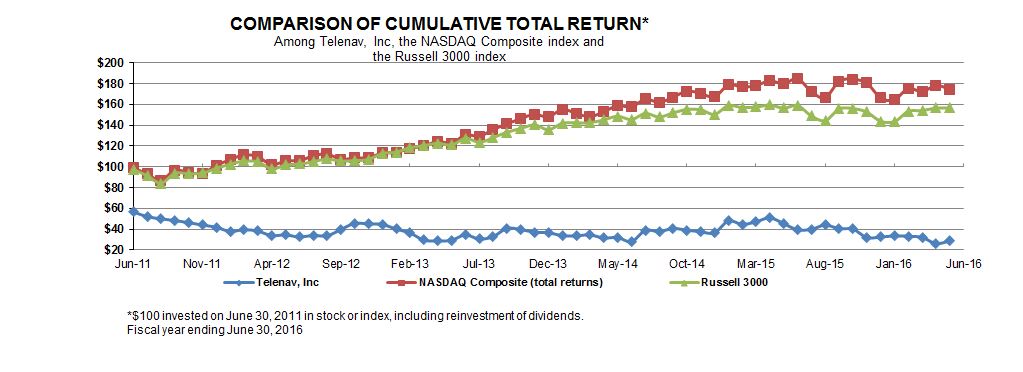
ITEM 6. | SELECTED FINANCIAL DATA |
The following selected financial data should be read in conjunction with the consolidated financial statements and related notes thereto appearing elsewhere in this Form 10-K. We have derived the statement of operations data for fiscal years ended June 30, 2016, 2015 and 2014 and the balance sheet data as of June 30, 2016 and 2015 from the audited consolidated financial statements included elsewhere in this Form 10-K. The statement of operations data for the fiscal years ended June 30, 2013 and 2012 and the balance sheet data as of June 30, 2014, 2013 and 2012 were derived from the audited consolidated financial statements that are not included in this Form 10-K. The consolidated financial statements have been prepared in accordance with U.S. generally accepted accounting principles, or GAAP. The results of operations of our enterprise business, which were previously presented as a component of our consolidated operating results, have been classified as discontinued operations in our statement of operations for all periods presented. We have not declared or distributed any cash dividends on our common stock. Historical results are not necessarily indicative of results to be expected for future periods.
34
Consolidated Statements of Operations Data: (in thousands, except per share data) | Fiscal Year Ended June 30, | |||||||||||||||||||
2016 | 2015 | 2014 | 2013 | 2012 | ||||||||||||||||
Revenue | $ | 183,346 | $ | 160,239 | $ | 150,313 | $ | 191,800 | $ | 205,522 | ||||||||||
Cost of revenue | 100,797 | 78,784 | 60,841 | 69,113 | 44,448 | |||||||||||||||
Gross profit | 82,549 | 81,455 | 89,472 | 122,687 | 161,074 | |||||||||||||||
Operating expenses: | ||||||||||||||||||||
Research and development | 68,911 | 68,060 | 60,573 | 60,349 | 65,764 | |||||||||||||||
Sales and marketing | 25,587 | 26,975 | 33,138 | 30,435 | 25,345 | |||||||||||||||
General and administrative | 23,994 | 23,606 | 26,176 | 24,765 | 26,084 | |||||||||||||||
Restructuring | (1,362 | ) | 1,150 | 4,412 | 1,671 | — | ||||||||||||||
Total operating expenses | 117,130 | 119,791 | 124,299 | 117,220 | 117,193 | |||||||||||||||
Operating income (loss) | (34,581 | ) | (38,336 | ) | (34,827 | ) | 5,467 | 43,881 | ||||||||||||
Other income (expense), net | (229 | ) | 2,267 | 1,288 | 1,207 | 1,484 | ||||||||||||||
Income (loss) from continuing operations before provision (benefit) for income taxes | (34,810 | ) | (36,069 | ) | (33,539 | ) | 6,674 | 45,365 | ||||||||||||
Provision (benefit) for income taxes | 511 | (13,006 | ) | (4,015 | ) | 1,093 | 13,559 | |||||||||||||
Income (loss) from continuing operations, net of tax | $ | (35,321 | ) | $ | (23,063 | ) | $ | (29,524 | ) | $ | 5,581 | $ | 31,806 | |||||||
Income (loss) from discontinued operations, net of tax | $ | — | $ | — | $ | — | $ | 7,486 | $ | 602 | ||||||||||
Net income (loss) | $ | (35,321 | ) | $ | (23,063 | ) | $ | (29,524 | ) | $ | 13,067 | $ | 32,408 | |||||||
Basic income (loss) per share: | ||||||||||||||||||||
Income (loss) from continuing operations | $ | (0.85 | ) | $ | (0.58 | ) | $ | (0.76 | ) | $ | 0.14 | $ | 0.77 | |||||||
Income from discontinued operations, net of tax | $ | — | $ | — | $ | — | $ | 0.18 | $ | 0.01 | ||||||||||
Net income (loss) | $ | (0.85 | ) | $ | (0.58 | ) | $ | (0.76 | ) | $ | 0.32 | $ | 0.78 | |||||||
Diluted income (loss) per share: | ||||||||||||||||||||
Income (loss) from continuing operations | $ | (0.85 | ) | $ | (0.58 | ) | $ | (0.76 | ) | $ | 0.13 | $ | 0.72 | |||||||
Income from discontinued operations, net of tax | $ | — | $ | — | $ | — | $ | 0.18 | $ | 0.02 | ||||||||||
Net income (loss) | $ | (0.85 | ) | $ | (0.58 | ) | $ | (0.76 | ) | $ | 0.31 | $ | 0.74 | |||||||
Weighted average shares used in computing net income (loss) per share applicable to common stockholders: | ||||||||||||||||||||
Basic | 41,567 | 39,991 | 38,796 | 40,310 | 41,406 | |||||||||||||||
Diluted | 41,567 | 39,991 | 38,796 | 41,919 | 43,944 | |||||||||||||||
Consolidated Balance Sheets Data: (in thousands) | June 30, | |||||||||||||||||||
2016 | 2015 | 2014 | 2013 | 2012 | ||||||||||||||||
Cash, cash equivalents and short-term investments | $ | 109,626 | $ | 119,916 | $ | 136,849 | $ | 191,685 | $ | 199,468 | ||||||||||
Working capital | 118,182 | 138,415 | 153,238 | 190,385 | 204,977 | |||||||||||||||
Total assets | 218,247 | 223,922 | 239,841 | 273,669 | 264,779 | |||||||||||||||
Common stock and additional paid-in capital | 149,818 | 140,447 | 129,318 | 118,233 | 118,897 | |||||||||||||||
Total stockholders’ equity | 149,685 | 176,183 | 192,405 | 214,464 | 216,518 | |||||||||||||||
35
ITEM 7. | MANAGEMENT’S DISCUSSION AND ANALYSIS OF FINANCIAL CONDITION AND RESULTS OF OPERATIONS |
The following discussion and analysis should be read together with our consolidated financial statements and the notes to those statements included elsewhere in this Form 10-K. This discussion contains forward-looking statements based on our current expectations, assumptions, estimates and projections about Telenav and our industry. These forward-looking statements involve risks and uncertainties. Our actual results could differ materially from those indicated in these forward-looking statements as a result of certain factors, as more fully described in “Risk factors” in Item 1A of this Form 10-K, Management’s Discussion and Analysis of Financial Condition and Results of Operations and elsewhere in this Form 10-K. We undertake no obligation to update publicly any forward-looking statements for any reason, even if new information becomes available or other events occur in the future.
Overview
Telenav is a leading provider of connected car and location-based platform services. These services consist of our automotive and mobile navigation platform and our advertising delivery platform. Our automotive and mobile navigation platform allows Telenav to deliver enhanced location-based services to auto manufacturers, developers and end users through various distribution channels. Our advertising delivery platform delivers highly targeted advertising services leveraging our location expertise. We report operating results in three business segments: automotive, advertising and mobile navigation.
For our automotive segment customers, we offer our automotive and mobile navigation platform services to vehicle manufacturers and OEMs for distribution with their vehicles. We believe our history as a supplier of cloud-based navigation services provides a unique advantage in the automotive navigation marketplace over our competitors.
Our primary automotive customer to date, Ford, currently distributes our embedded, or on-board, product as a standard or optional feature with all of its models in the United States. Our automotive products are now included on models manufactured in North America, Europe and China, as well as distributed in models sold in South America, Australia and New Zealand. In addition, in July 2015, Ford Australia and New Zealand adopted a map update program for its SYNC 2 generation of vehicles. Under this program, Ford owners with SYNC 2 or SYNC 3 in Australia and New Zealand are eligible to receive annual map updates at no additional cost through December 2023.
In January 2014, we entered into an agreement with GM for integration of our on-board and connected navigation solutions in its vehicles, which we expect to launch in model year 2017. Our relationship with GM also includes our mobile phone-based wireless connectivity, or brought-in, services for vehicles including GM's OnStar RemoteLink® mobile application powered by our location-based services platform, which includes mapping and one-box search. In November 2015, the localized version of GM's OnStar RemoteLink® was launched in Europe for GM's Opel and Vauxhall brands.
In July 2015, we and Toyota announced a partnership for brought-in navigation services where our Scout GPS Link is available in Entune™ Audio Plus equipped model year 2016 and later Toyota vehicles in the United States. In August 2015, Toyota began shipping vehicles enabled to connect with our Scout® GPS Link mobile application, and as of June 2016, the ability to connect to our mobile application is a standard feature or is available as an option on more than 75% of 2016 Toyota models in the United States.
For our advertising segment customers, we believe our advertising delivery platform offers significant audience reach, sophisticated targeting capabilities and the ability to deliver interactive and engaging ad experiences to consumers on their mobile devices. We are experts in location-based advertising and believe we offer unique value to brick-and-mortar and brand advertisers through our location targeting capabilities. Our technology focuses on managing the complexity and scale associated with mobile location data to deliver better mobile campaigns for our advertising partners. We deliver mobile advertisements by leveraging our proprietary in-house ad serving technology. Our inventory, or accessible market, is comprised of thousands of mobile applications and mobile websites that are accessed through programmatic real-time bidding, or RTB, tools.
We derive revenue primarily from automobile manufacturers and OEMs and advertisers and advertising agencies. We receive revenue from automobile manufacturers whose vehicles contain our proprietary software and are able to access our personalized navigation services. These manufacturers have typically not provided us with any volume or revenue guarantees. In addition, we have a growing business in mobile advertising where our customers are primarily advertising agencies, which represent national and regional brands, and channel partners, which work closely with local and small business advertisers. We also derive a declining portion of revenue from our partnerships with wireless carriers, who pay us to enable their subscribers to use our mobile navigation services.
36
We generate revenue from the delivery of customized software and royalties from the distribution of this customized software in automotive navigation applications. For example, Ford utilizes our on-board automotive navigation product in its Ford SYNC platform. Ford pays us a royalty fee on SYNC 2 on-board solutions as the software is reproduced for installation in vehicles with our automotive navigation solutions and pays us a royalty fee on SYNC 3 on-board solutions as our software is installed in the vehicle. In addition, we earn a one-time royalty for each new vehicle owner who downloads the GM OnStar RemoteLink® application, whereby we provide enhanced search capabilities for contracted service periods. We also earn a one-time royalty for each new Toyota vehicle enabled to connect with our Scout® GPS Link mobile application.
We generate revenue from advertising network services through the delivery of search and display advertising impressions based on the specific terms of the advertising contract.
We also generate a declining portion of our revenue from subscriptions to our mobile navigation services. End users with subscriptions for our services are generally billed for our services through their wireless carrier or through mobile application stores and marketplaces. Our wireless carrier customers pay us based on several different revenue models, including (1) a revenue sharing arrangement that may include a minimum fee per end user, (2) a monthly or annual subscription fee per end user, or (3) based on usage.
Recent Developments
In September 2015, we entered into an agreement with Ningbo Huazhong Holdings Company Limited, or Huazhong, a subsidiary of a publicly traded automotive OEM supplier in China, whereby we and Huazhong agreed to form a joint venture limited liability company in China for the development, manufacture and sales of auto entertainment systems. We agreed to invest RMB 9.95 million (approximately $1.5 million as of June 30, 2016) in cash, which is expected to represent 19.9% of the equity interests of the joint venture. We and Huazhong also agreed to negotiate a Technology License Agreement, or TLA, whereby we will license our existing navigation platform technologies to the joint venture in exchange for a RMB 5.0 million (approximately $0.8 million as of June 30, 2016) license fee.
We have not made any capital contributions to the joint venture, and the parties are currently renegotiating the nature, timing and amounts of capital to be contributed. Accordingly, the joint venture has not been formed. In December 2015, we and Huazhong completed the TLA with a term of ten years. In addition, we and Huazhong negotiated a Technology Development Service Agreement, whereby we will provide the joint venture with specified technical services in exchange for a non-refundable technical services fee, subject to the completion of a statement of work by the parties. The TLA and Technology Development Service Agreement will not be effective until the joint venture is formed.
In January 2016, we decided to shift our focus in our advertising business from growth to profitability. We anticipate that our quarter ended March 31, 2016, which was lower in revenue compared to the three months ended December 31, 2015 due primarily to seasonality, will be the peak quarter of losses for our advertising business. In the near-term, we are taking actions to reduce our operating costs and are targeting to achieve break-even on a cash basis for our advertising business by the end of calendar 2016. We use the adjusted EBITDA metric in measuring this performance. This shift in strategy from growth to profitability required us to evaluate the carrying value of our goodwill and intangible assets for impairment during the three months ended March 31, 2016 as well as in the ordinary course of practice during the last quarter of our fiscal year. Based on the results of our goodwill and intangible assets impairment test as of April 1, 2016, the estimated fair value of each of our reporting units exceeded its carrying value. We have not recognized any impairment of goodwill or intangible assets in the three year period ended June 30, 2016.
On December 31, 2009, Vehicle IP, LLC, or Vehicle IP, filed a patent infringement lawsuit against us in the U.S. District Court for the District of Delaware, seeking monetary damages, fees and expenses and other relief. Verizon Wireless, or Verizon, was named as a co-defendant in the Vehicle IP litigation based on the VZ Navigator product and has demanded that we indemnify and defend Verizon against Vehicle IP. At this time, we have not agreed to defend or indemnify Verizon. AT&T was also named as a co-defendant in the Vehicle IP litigation based on the AT&T Navigator and Telenav Track products. AT&T has tendered the defense of the litigation to us and we are defending the case on behalf of AT&T. After the district court issued its claim construction ruling the parties agreed to focus on early summary judgment motions, the defendants filed motions for summary judgment of noninfringement. On April 10, 2013 the district court granted AT&T and our motion for summary judgment of noninfringement. Plaintiff appealed the district court's claim construction and summary judgment rulings to the U.S. Court of Appeals for the Federal Circuit. On November 18, 2014, the U.S. Court of Appeals for the Federal Circuit reversed the district court's claim construction and overturned the district court's grant of summary judgment of noninfringement. The case has been sent back to the U.S. District Court for the District of Delaware and trial is currently scheduled for February 2017. During fiscal 2016, we accrued $850,000 related to this litigation and incurred legal expenses of $4.5 million, including expenses of $1.6 million incurred in the fourth quarter of fiscal 2016. We anticipate that as we prepare for the February 2017 trial, we will incur significant additional legal expenses in connection with the Vehicle IP case. In
37
addition, we may make additional accruals as we work to prepare for trial or settle the case. We believe that it is probable that we will incur a loss; however, beyond the amount accrued we cannot currently estimate a range of any possible losses we may experience in connection with this case. Accordingly, we are unable at this time to estimate the effects of this lawsuit on our financial condition, results of operations, or cash flows.
Key operating and financial performance metrics
We monitor the key operating and financial performance metrics set forth in the tables below to help us evaluate growth trends, establish budgets, measure the effectiveness of our sales and marketing efforts and assess our operational efficiencies. Certain of these measures, such as billings, change in deferred revenue, change in deferred costs, non-GAAP gross margin, non-GAAP net income (loss), net of tax, adjusted earnings before interest, taxes, depreciation and amortization, or adjusted EBITDA, and diluted non-GAAP net income (loss), per share, and free cash flow are not measures calculated in accordance with U.S. generally accepted accounting principles, or GAAP, and should not be considered as an alternative to any measure of financial performance calculated and presented in accordance with GAAP. In addition, these non-GAAP measures may not be comparable to similarly titled measures of other companies because other companies may not calculate them in the same manner that we do.
Fiscal Year Ended June 30, | ||||||||||||
2016 | 2015 | 2014 | ||||||||||
(in thousands, except percentages and per share amounts) | ||||||||||||
Revenue | $ | 183,346 | $ | 160,239 | $ | 150,313 | ||||||
Billings (Non-GAAP) | $ | 199,887 | $ | 164,631 | $ | 145,638 | ||||||
Increase (decrease) in deferred revenue | $ | 16,541 | $ | 4,392 | $ | (4,675 | ) | |||||
Increase (decrease) in deferred costs | $ | 8,935 | $ | 2,641 | $ | (2,495 | ) | |||||
Gross margin | 45 | % | 51 | % | 60 | % | ||||||
Non-GAAP gross margin | 46 | % | 53 | % | 62 | % | ||||||
Net loss | $ | (35,321 | ) | $ | (23,063 | ) | $ | (29,524 | ) | |||
Non-GAAP net loss | $ | (24,089 | ) | $ | (12,889 | ) | $ | (6,839 | ) | |||
Adjusted EBITDA | $ | (21,522 | ) | $ | (20,519 | ) | $ | (12,121 | ) | |||
Diluted net loss per share | $ | (0.85 | ) | $ | (0.58 | ) | $ | (0.76 | ) | |||
Diluted non-GAAP net loss per share | $ | (0.58 | ) | $ | (0.32 | ) | $ | (0.18 | ) | |||
Net cash used in operating activities | $ | (3,098 | ) | $ | (7,696 | ) | $ | (22,553 | ) | |||
Free cash flow (Non-GAAP) | $ | (7,102 | ) | $ | (8,904 | ) | $ | (23,606 | ) | |||
Billings measures revenue recognized plus the change in deferred revenue from the beginning to the end of the period. We consider billings to be a useful metric for management and investors because billings drives deferred revenue, which is an important indicator of the health and viability of our business. While we believe a disproportionately high degree of costs and value in the product or service has been incurred and provided at the time of billing to the customer, we are required under GAAP to defer revenue recognition over much longer periods, currently up to ten years. There are a number of limitations related to the use of billings versus revenue calculated in accordance with GAAP. First, billings include amounts that have not yet been recognized as revenue and may require additional services to be provided over contracted service periods. For example, billings related to certain on-board and brought-in solutions cannot be recognized as revenue in a given period due to requirements for ongoing provisioning of services such as hosting, monitoring and customer support. Second, we may calculate billings in a manner that is different from peer companies that report similar financial measures. When we use these measures, we compensate for these limitations by providing specific information regarding revenue and evaluating billings together with revenue calculated in accordance with GAAP. We have also provided a breakdown of the calculation of the change in deferred revenue by segment, which is added to revenue in calculating our non-GAAP metric of billings. In connection with our presentation of the change in deferred revenue, we have provided a similar presentation of the change in the related deferred costs. Such deferred costs primarily include costs associated with third party content and in connection with certain customized software solutions, the costs incurred to develop those solutions. As deferred revenue and deferred costs become larger components of our operating results, we believe these metrics are useful in evaluating cash flow.
Gross margin is our gross profit, or total revenue less cost of revenue, expressed as a percentage of our total revenue. Our gross margin has been and will continue to be impacted by the increasing percentage of our revenue base derived from
38
automotive navigation solutions and advertising network services, which generally have higher associated third party content costs and third party display ad inventory costs, respectively, than our mobile navigation offerings provided through wireless carriers.
Non-GAAP gross margin measures our gross margin, excluding the impact of stock-based compensation expense and capitalized software and developed technology amortization expenses. Non-GAAP net loss measures GAAP net loss, excluding the impact of stock-based compensation expense, capitalized software and developed technology amortization expenses, and other applicable items such as legal contingencies, certain unique tax matters, restructuring accruals and reversals, and deferred rent reversals due to lease termination, net of taxes or tax benefits. Stock-based compensation expense relates to equity incentive awards granted to our employees, directors, and consultants. Stock-based compensation expense has been and will continue to be a significant recurring non-cash expense for us that we exclude from non-GAAP net loss and non-GAAP net loss per share. Legal contingencies represent settlements and offers made to settle patent litigation cases in which we are defendants and royalty disputes. Deferred rent reversals represent the reversal of our deferred rent liability that is no longer required due to our facility lease termination. Capitalized software amortization expense represents internal software costs that were capitalized and are charged to expense as the software is used in our operations. Developed technology amortization expense relates to the amortization of acquired intangible assets. Our non-GAAP tax rate differs from the tax rate due to the elimination of any tax effect of stock-based compensation expense.
Adjusted EBITDA measures our GAAP net loss excluding the impact of stock-based compensation expense, depreciation, amortization, interest and other income (expense), provision (benefit) for income taxes, and other applicable items such as legal contingencies, restructuring accruals and reversals and deferred rent reversals due to lease termination, net of tax. Adjusted EBITDA, while generally a measure of profitability, can also represent a loss.
Non-GAAP gross margin, non-GAAP net loss and adjusted EBITDA are key measures used by our management and board of directors to understand and evaluate our core operating performance and trends, to prepare and approve our annual budget and to develop short- and long-term operational plans. In particular, we believe that the exclusion of the expenses eliminated in calculating non-GAAP gross margin, non-GAAP net loss and adjusted EBITDA can provide a useful measure for period-to-period comparisons of our core business. In addition, billings and adjusted EBITDA are key financial measures used by the compensation committee of our board of directors in connection with the development of incentive-based compensation for our executive officers. Accordingly, we believe that such metrics provide useful information to investors and others in understanding and evaluating our operating results in the same manner as our management and board of directors.
Diluted non-GAAP net loss per share is calculated as non-GAAP net loss divided by the diluted weighted average number of shares outstanding during the period.
Free cash flow is a non-GAAP financial measure we define as net cash provided by (used in) operating activities less purchases of property and equipment. We consider free cash flow to be a liquidity measure that provides useful information to management and investors about the amount of cash generated by our business after the purchases of property and equipment.
We determined that it would be meaningful to investors to develop a breakout of the operating results of the advertising business beyond the current GAAP segment reporting of revenue, cost of revenue and gross margin, and we are including such presentation in our non-GAAP reporting results. This presentation reflects operating expenses that are directly attributable to the advertising business. We are unable to provide a similar breakout of operating results for the automotive and mobile navigation businesses beyond the current GAAP segment reporting of revenue, cost of revenue and gross margin because these segments share many of the same technologies and resources and as such, comprise operating expenses which are not fully attributable to either. In addition, the reported non-GAAP operating results for the advertising business only include an allocation of certain shared corporate general and administrative costs that directly benefit the business, such as accounting and human resource services.
These non-GAAP measures have limitations as analytical tools, and you should not consider them in isolation or as substitutes for analysis of our financial results as reported under GAAP. Some of these limitations are:
• | although depreciation and amortization are non-cash charges, the assets being depreciated and amortized may have to be replaced in the future, and adjusted EBITDA does not reflect cash capital expenditure requirements for such replacements or for new capital expenditures; |
• | non-GAAP gross margin, non-GAAP net loss, and adjusted EBITDA do not reflect the potentially dilutive impact of equity-based compensation; |
• | non-GAAP net loss and adjusted EBITDA do not reflect the use of cash for net share settlements of RSUs; |
• | adjusted EBITDA does not reflect tax payments that historically have represented a reduction in cash available to us or tax benefits that may arise as a result of generating net losses; and |
• | other companies, including companies in our industry, may calculate adjusted EBITDA or similarly titled measures differently, which reduces its usefulness as a comparative measure. |
39
Because of these and other limitations, you should consider billings, non-GAAP gross margin, non-GAAP net loss, adjusted EBITDA, diluted non-GAAP net loss per share and free cash flow alongside other GAAP-based financial performance measures, including various cash flow metrics, net loss and our other GAAP financial results.
The following tables present reconciliations of revenue to billings, deferred revenue to the change in deferred revenue, deferred costs to the change in deferred costs, gross margin to non-GAAP gross margin, net loss to non-GAAP net loss, net loss to adjusted EBITDA and net loss to free cash flow for each of the periods indicated (dollars in thousands):
Automotive | Advertising | Mobile Navigation | Total | |||||||||||||||||||||||||||||||||||||||||||||
Fiscal Year Ended June 30, | Fiscal Year Ended June 30, | Fiscal Year Ended June 30, | Fiscal Year Ended June 30, | |||||||||||||||||||||||||||||||||||||||||||||
2016 | 2015 | 2014 | 2016 | 2015 | 2014 | 2016 | 2015 | 2014 | 2016 | 2015 | 2014 | |||||||||||||||||||||||||||||||||||||
Revenue | $ | 135,372 | $ | 103,100 | $ | 75,153 | $ | 21,744 | $ | 17,941 | $ | 11,699 | $ | 26,230 | $ | 39,198 | $ | 63,461 | $ | 183,346 | $ | 160,239 | $ | 150,313 | ||||||||||||||||||||||||
Adjustments: Change in deferred revenue | 16,961 | 5,062 | (225 | ) | — | — | — | (420 | ) | (670 | ) | (4,450 | ) | 16,541 | 4,392 | (4,675 | ) | |||||||||||||||||||||||||||||||
Billings (Non-GAAP) | $ | 152,333 | $ | 108,162 | $ | 74,928 | $ | 21,744 | $ | 17,941 | $ | 11,699 | $ | 25,810 | $ | 38,528 | $ | 59,011 | $ | 199,887 | $ | 164,631 | $ | 145,638 | ||||||||||||||||||||||||
Automotive | Advertising | Mobile Navigation | Total | |||||||||||||||||||||||||||||||||||||||||||||
Fiscal Year Ended June 30, | Fiscal Year Ended June 30, | Fiscal Year Ended June 30, | Fiscal Year Ended June 30, | |||||||||||||||||||||||||||||||||||||||||||||
2016 | 2015 | 2014 | 2016 | 2015 | 2014 | 2016 | 2015 | 2014 | 2016 | 2015 | 2014 | |||||||||||||||||||||||||||||||||||||
Deferred revenue, ending balance | $ | 22,153 | $ | 5,192 | $ | 130 | $ | — | $ | — | $ | — | $ | 1,216 | $ | 1,636 | $ | 2,306 | $ | 23,369 | $ | 6,828 | $ | 2,436 | ||||||||||||||||||||||||
Deferred revenue, beginning balance | 5,192 | 130 | 355 | — | — | — | 1,636 | 2,306 | 6,756 | 6,828 | 2,436 | 7,111 | ||||||||||||||||||||||||||||||||||||
Increase (decrease) in deferred revenue (Non-GAAP) | $ | 16,961 | $ | 5,062 | $ | (225 | ) | $ | — | $ | — | $ | — | $ | (420 | ) | $ | (670 | ) | $ | (4,450 | ) | $ | 16,541 | $ | 4,392 | $ | (4,675 | ) | |||||||||||||||||||
Deferred costs, ending balance | $ | 12,076 | $ | 3,141 | $ | 500 | $ | — | $ | — | $ | — | $ | — | $ | — | $ | — | $ | 12,076 | $ | 3,141 | $ | 500 | ||||||||||||||||||||||||
Deferred costs, beginning balance | 3,141 | 500 | 845 | — | — | — | — | — | 2,150 | 3,141 | 500 | 2,995 | ||||||||||||||||||||||||||||||||||||
Increase (decrease) in deferred costs (Non-GAAP) | $ | 8,935 | $ | 2,641 | $ | (345 | ) | $ | — | $ | — | $ | — | $ | — | $ | — | $ | (2,150 | ) | $ | 8,935 | $ | 2,641 | $ | (2,495 | ) | |||||||||||||||||||||
Automotive | Advertising | Mobile Navigation | Total | |||||||||||||||||||||||||||||||||
Fiscal Year Ended June 30, | Fiscal Year Ended June 30, | Fiscal Year Ended June 30, | Fiscal Year Ended June 30, | |||||||||||||||||||||||||||||||||
2016 | 2015 | 2014 | 2016 | 2015 | 2014 | 2016 | 2015 | 2014 | 2016 | 2015 | 2014 | |||||||||||||||||||||||||
Gross margin | 40 | % | 45 | % | 51 | % | 43 | % | 35 | % | 40 | % | 73 | % | 73 | % | 74 | % | 45 | % | 51 | % | 60 | % | ||||||||||||
Adjustments: | ||||||||||||||||||||||||||||||||||||
Capitalized software and developed technology amortization | 1 | % | 1 | % | — | % | 3 | % | 9 | % | 15 | % | — | % | 1 | % | 2 | % | 1 | % | 2 | % | 2 | % | ||||||||||||
Non-GAAP gross margin | 41 | % | 46 | % | 51 | % | 46 | % | 44 | % | 55 | % | 73 | % | 74 | % | 76 | % | 46 | % | 53 | % | 62 | % | ||||||||||||
40
Fiscal Year Ended June 30, | ||||||||||||
2016 | 2015 | 2014 | ||||||||||
Net loss | $ | (35,321 | ) | $ | (23,063 | ) | $ | (29,524 | ) | |||
Adjustments: | ||||||||||||
Legal contingencies | 935 | — | — | |||||||||
Changes in valuation allowance on deferred tax assets | — | (778 | ) | 7,398 | ||||||||
Benefit for income taxes due to changes in tax accounting method and amended tax returns | — | (4,061 | ) | — | ||||||||
Restructuring accrual (reversal) | (1,362 | ) | 1,150 | 4,412 | ||||||||
Deferred rent reversal due to lease termination | (1,242 | ) | — | — | ||||||||
Capitalized software and developed technology amortization | 1,535 | 3,275 | 3,588 | |||||||||
Stock-based compensation expense: | ||||||||||||
Cost of revenue | 143 | 98 | 100 | |||||||||
Research and development | 6,062 | 5,275 | 4,489 | |||||||||
Sales and marketing | 2,844 | 2,943 | 3,306 | |||||||||
General and administrative | 2,317 | 3,112 | 3,640 | |||||||||
Total stock-based compensation | 11,366 | 11,428 | 11,535 | |||||||||
Tax effect of adding back adjustments | — | (840 | ) | (4,248 | ) | |||||||
Non-GAAP net loss | $ | (24,089 | ) | $ | (12,889 | ) | $ | (6,839 | ) | |||
Non-GAAP net loss per share, basic and diluted | $ | (0.58 | ) | $ | (0.32 | ) | $ | (0.18 | ) | |||
Weighted average shares used in computing non-GAAP net loss per share, basic and diluted | 41,567 | 39,991 | 38,796 | |||||||||
Fiscal Year Ended June 30, | ||||||||||||
2016 | 2015 | 2014 | ||||||||||
Net loss | $ | (35,321 | ) | $ | (23,063 | ) | $ | (29,524 | ) | |||
Adjustments: | ||||||||||||
Legal contingencies | 935 | — | — | |||||||||
Restructuring accrual (reversal) | (1,362 | ) | 1,150 | 4,412 | ||||||||
Deferred rent reversal due to lease termination | (1,242 | ) | — | — | ||||||||
Stock-based compensation expense | 11,366 | 11,428 | 11,535 | |||||||||
Depreciation and amortization | 3,362 | 5,239 | 6,759 | |||||||||
Interest and other income, net | 229 | (2,267 | ) | (1,288 | ) | |||||||
Provision (benefit) for income taxes | 511 | (13,006 | ) | (4,015 | ) | |||||||
Adjusted EBITDA | $ | (21,522 | ) | $ | (20,519 | ) | $ | (12,121 | ) | |||
41
Fiscal Year Ended June 30, | ||||||||||||
2016 | 2015 | 2014 | ||||||||||
Net loss | $ | (35,321 | ) | $ | (23,063 | ) | $ | (29,524 | ) | |||
Adjustments to reconcile net loss to net cash provided by (used in) operating activities: | ||||||||||||
Increase (decrease) in deferred revenue (1) | 16,541 | 4,392 | (4,701 | ) | ||||||||
Increase (decrease) in deferred costs (2) | (8,935 | ) | (2,641 | ) | 2,495 | |||||||
Changes in other operating assets and liabilities | 7,774 | (4,999 | ) | (20,819 | ) | |||||||
Other adjustments (3) | 16,843 | 18,615 | 29,996 | |||||||||
Net cash provided by (used in) operating activities | (3,098 | ) | (7,696 | ) | (22,553 | ) | ||||||
Less: Purchases of property and equipment | (4,004 | ) | (1,208 | ) | (1,053 | ) | ||||||
Free cash flow (Non-GAAP) | $ | (7,102 | ) | $ | (8,904 | ) | $ | (23,606 | ) | |||
(1) Consists of royalties, customized software development fees and subscription fees. | ||||||||||||
(2) Consists primarily of third party content costs and customized software development expenses. | ||||||||||||
(3) Consists primarily of depreciation and amortization, stock-based compensation expense and other non-cash items. | ||||||||||||
42
Fiscal Year Ended June 30, 2016 | ||||||||||||||||||||||||
GAAP Consolidated | Non-GAAP Consolidated | Non-GAAP Advertising | Automotive (1) | Mobile Navigation (1) | Total Non-GAAP Automotive and Mobile Navigation (1) | |||||||||||||||||||
Revenue | $ | 183,346 | $ | 21,744 | $ | 135,372 | $ | 26,230 | $ | 161,602 | ||||||||||||||
Cost of revenue | 100,797 | 12,296 | 81,293 | 7,208 | 88,501 | |||||||||||||||||||
Gross profit | 82,549 | 9,448 | $ | 54,079 | $ | 19,022 | 73,101 | |||||||||||||||||
Operating expenses: | ||||||||||||||||||||||||
Research and development | 68,911 | 4,722 | (2) | 64,189 | ||||||||||||||||||||
Sales and marketing | 25,587 | 13,822 | (2) | 11,765 | ||||||||||||||||||||
General and administrative | 23,994 | 1,996 | (3) | 21,998 | ||||||||||||||||||||
Restructuring | (1,362 | ) | (230 | ) | (1,132 | ) | ||||||||||||||||||
Total operating expenses: | 117,130 | 20,310 | 96,820 | |||||||||||||||||||||
Loss from operations | (34,581 | ) | (10,862 | ) | (23,719 | ) | ||||||||||||||||||
Interest and other income (expense), net | (229 | ) | — | (4) | (229 | ) | ||||||||||||||||||
Loss before provision for income taxes | (34,810 | ) | (10,862 | ) | (23,948 | ) | ||||||||||||||||||
Provision for income taxes | 511 | — | (5) | 511 | ||||||||||||||||||||
Net loss | $ | (35,321 | ) | $ | (35,321 | ) | $ | (10,862 | ) | $ | (24,459 | ) | ||||||||||||
Adjustments: | ||||||||||||||||||||||||
Legal contingencies | 935 | — | 935 | |||||||||||||||||||||
Stock-based compensation expense | 11,366 | 1,150 | 10,216 | |||||||||||||||||||||
Restructuring accrual (reversal) | (1,362 | ) | (230 | ) | (1,132 | ) | ||||||||||||||||||
Deferred rent reversal due to lease termination | (1,242 | ) | (300 | ) | (942 | ) | ||||||||||||||||||
Depreciation and amortization expense | 3,362 | 810 | 2,552 | |||||||||||||||||||||
Interest and other (income) expense, net | 229 | — | (4) | 229 | ||||||||||||||||||||
Provision for income taxes | 511 | — | (5) | 511 | ||||||||||||||||||||
Adjusted EBITDA | $ | (21,522 | ) | $ | (9,432 | ) | $ | (12,090 | ) | |||||||||||||||
(1) Automotive and mobile navigation segments share many of the same technologies and resources. Accordingly, we are unable to fully attribute the operating expenses, interest and other income (expense), net and provision for income taxes to one segment versus the other. | ||||||||||||||||||||||||
For purposes of calculating the Non-GAAP net loss attributable to the advertising segment: | ||||||||||||||||||||||||
(2) These expenses represent research and development and sales and marketing costs directly attributable to the advertising segment. | ||||||||||||||||||||||||
(3) These expenses represent actual general and administrative costs directly attributable to the advertising segment as well as an allocation of certain shared corporate costs that directly benefit the advertising segment such as accounting and human resource services. | ||||||||||||||||||||||||
(4) Expenses or income cannot be directly allocated to the advertising segment. | ||||||||||||||||||||||||
(5) Income taxes are primarily from foreign operations which support the automotive and mobile navigation segments. | ||||||||||||||||||||||||
43
Fiscal Year Ended June 30, 2015 | ||||||||||||||||||||||||
GAAP Consolidated | Non-GAAP Consolidated | Non-GAAP Advertising | Automotive (1) | Mobile Navigation (1) | Total Non-GAAP Automotive and Mobile Navigation (1) | |||||||||||||||||||
Revenue | $ | 160,239 | $ | 17,941 | $ | 103,100 | $ | 39,198 | $ | 142,298 | ||||||||||||||
Cost of revenue | 78,784 | 11,710 | 56,319 | 10,755 | 67,074 | |||||||||||||||||||
Gross profit | 81,455 | 6,231 | $ | 46,781 | $ | 28,443 | 75,224 | |||||||||||||||||
Operating expenses: | ||||||||||||||||||||||||
Research and development | 68,060 | 6,146 | (2) | 61,914 | ||||||||||||||||||||
Sales and marketing | 26,975 | 14,173 | (2) | 12,802 | ||||||||||||||||||||
General and administrative | 23,606 | 2,111 | (3) | 21,495 | ||||||||||||||||||||
Restructuring | 1,150 | 398 | 752 | |||||||||||||||||||||
Total operating expenses: | 119,791 | 22,828 | 96,963 | |||||||||||||||||||||
Loss from operations | (38,336 | ) | (16,597 | ) | (21,739 | ) | ||||||||||||||||||
Interest and other income (expense), net | 2,267 | — | (4) | 2,267 | ||||||||||||||||||||
Loss before benefit from income taxes | (36,069 | ) | (16,597 | ) | (19,472 | ) | ||||||||||||||||||
Benefit from income taxes | (13,006 | ) | (4,324 | ) | (5) | (8,682 | ) | |||||||||||||||||
Net loss | $ | (23,063 | ) | $ | (23,063 | ) | $ | (12,273 | ) | $ | (10,790 | ) | ||||||||||||
Adjustments: | ||||||||||||||||||||||||
Stock-based compensation expense | 11,428 | 1,753 | 9,675 | |||||||||||||||||||||
Restructuring accrual | 1,150 | 398 | 752 | |||||||||||||||||||||
Depreciation and amortization expense | 5,239 | 2,058 | 3,181 | |||||||||||||||||||||
Interest and other (income) expense, net | (2,267 | ) | — | (4) | (2,267 | ) | ||||||||||||||||||
Benefit from income taxes | (13,006 | ) | (4,324 | ) | (5) | (8,682 | ) | |||||||||||||||||
Adjusted EBITDA | $ | (20,519 | ) | $ | (12,388 | ) | $ | (8,131 | ) | |||||||||||||||
(1) Automotive and mobile navigation segments share many of the same technologies and resources. Accordingly, we are unable to fully attribute the operating expenses, interest and other income (expense), net and benefit from income taxes to one segment versus the other. | ||||||||||||||||||||||||
For purposes of calculating the Non-GAAP net loss attributable to the advertising segment: | ||||||||||||||||||||||||
(2) These expenses represent research and development and sales and marketing costs directly attributable to the advertising segment. | ||||||||||||||||||||||||
(3) These expenses represent actual general and administrative costs directly attributable to the advertising segment as well as an allocation of certain shared corporate costs that directly benefit the advertising segment such as accounting and human resource services. | ||||||||||||||||||||||||
(4) Expenses or income cannot be directly allocated to the advertising segment. | ||||||||||||||||||||||||
(5) Benefit from income taxes for the advertising segment was allocated based upon its pro rata share of U.S. losses. | ||||||||||||||||||||||||
44
Key components of our results of operations
Sources of revenue
We classify our revenue as either product or services revenue. Product revenue consists primarily of revenue we receive from the delivery of customized software and royalties from the distribution of this customized software in certain automotive navigation applications. Services revenue consists primarily of revenue we derive from our brought-in automotive navigation services, advertising services and mobile navigation services.
We report revenue, cost of revenue and gross profit results in three business segments: Automotive, Advertising and Mobile Navigation. Our CEO, the chief operating decision maker, reviews revenue and gross margin information for each of our reportable segments. See " - Results of operations" and Note 12 to the financial statements in this Form 10-K for more information about our business segments.
Revenue from our automotive segment represented 74%, 64% and 50% of our revenue in fiscal 2016, 2015 and 2014, respectively. Ford represented 71%, 61% and 46% of our revenue in fiscal 2016, 2015 and 2014, respectively. Our contract with Ford expires in December 2017. The agreement may be renewed for successive 12-month periods if either party provides notice of renewal at least 45 days prior to the expiration of the applicable term, and the other party agrees to such renewal.
We provide both on-board and brought-in navigation solutions to Ford. Our on-board product solution consists of software, map and POI data loaded in the vehicle that provides voice-guided turn by turn navigation displayed on the vehicle screen. Our brought-in solution enables a mobile device that is paired with the vehicle to activate in-vehicle text-based and voice-guided turn by turn navigation. We recognize revenue from our brought-in solutions monthly based on annual subscriptions, which are subject to a maximum annual fee with Ford. This revenue is classified as services revenue and represented less than 5% of overall automotive navigation solutions revenue.
Our product revenue is primarily derived from our automotive on-board solutions as the related customized software is delivered to, and accepted by our customers. In addition, we recognize royalties earned from our Ford SYNC 2 on-board solutions as the software is reproduced for installation in vehicles; however, we recognize revenue from Ford SYNC 3 as our software is installed in the vehicle by Ford. Accordingly, the timing of our revenue recognition will change during Ford's global transition from SYNC 2 to SYNC 3. This transition has occurred in North America and China and has begun in Europe, and the nominal effect on revenue recognition was reflected in our consolidated financial statements for fiscal 2016. We anticipate that as Ford completes in transition in Europe and transitions to SYNC 3 in other international markets in the three months ending September 30, 2016, we will experience a lower level of orders as Ford uses its existing inventory of SYNC 2 product in conjunction with its transition to SYNC 3. As our solutions encompass greater value-added services, such as Ford’s Australia and New Zealand map update program, there is potential for changes in the timing of revenue recognition. We anticipate that we will continue to depend on Ford for a material portion of our revenue for the foreseeable future.
We have limited visibility into our customers’ inventory management processes and therefore at any particular point in time they may have more or less inventory than needed to meet their production process. However, when customers transition to new versions of our product, they will review their internal inventory levels and will attempt to estimate their requirements until the new versions are deployed into the production process. Given that these events are one time in nature, and they may not be able to exhaust their stock of inventory prior to the shift in production, they may seek to return excess inventory containing our software they have previously purchased from us, despite having no contractual right to do so. In these irregular circumstances we may be inclined to support their request for returns if all other means for using the stock has been exhausted by the customer. But as we do not have a detailed understanding of their inventory at any particular moment, we may not accurately estimate the quantity of inventory that a customer may have on hand and therefore we may not have accrued an appropriate reserve to reflect any such returns. If our estimate is materially inaccurate, our results could be impacted by the incorrect estimate.
We derive services revenue from our brought-in automotive navigation solutions and other automotive solutions, such as map update programs. Billings for these services are recorded as deferred revenue and amortized to revenue over the estimated service periods. In January 2015, GM launched the new version of its OnStar RemoteLink® mobile application powered by our location-based services platform. We earn a one-time royalty for each new vehicle owner who downloads the RemoteLink® application. In July 2015, Ford Australia and New Zealand adopted a map update program as part of its SYNC 2 product distribution. Under this program, Ford owners in Australia and New Zealand with SYNC 2 or SYNC 3 will be eligible to receive annual map updates at no additional cost through December 2023. We earn an annual fee and a per unit fee for these updates. In August 2015, Toyota began shipping vehicles enabled to connect with our Scout® GPS Link mobile application, and as of June 30, 2016, the ability to connect to our mobile application was a standard feature or was available as an option on more than 75% of 2016 Toyota models in the United States. We earn a one-time royalty for each new Toyota sold and equipped with Entune™ Audio Plus. Royalty revenue recognized related to Toyota was not material in fiscal 2016.
45
Revenue from our advertising segment, which includes the delivery of search and display, location-based ads, represented 12%, 11% and 8% of our revenue in fiscal 2016, 2015 and 2014, respectively. Our advertising revenue is derived from ad insertion orders contracted with advertising agencies, direct customers, and channel partners. Our ad search revenue is earned from the delivery of location-based ad impressions targeted to end users engaged in a specific search task utilizing our mobile navigation solutions. Such ad search revenue represented less than 10% of our overall advertising revenue. Our display revenue relates to the advertising business developed via our Thinknear acquisition that delivers targeted location-based impressions to end users of third party developer applications.
We also offer voice-guided, real-time, turn by turn, mobile navigation service under several brand names including Scout by Telenav and Telenav GPS as well as under wireless carrier brands (or “white label” brands). Revenue from our Mobile Navigation segment represented 14%, 25% and 42% of our revenue in fiscal 2016, 2015 and 2014, respectively. Subscription fee revenue from our mobile navigation service declined from fiscal 2014 through fiscal 2016, primarily due to a substantial decrease in the number of paying subscribers for navigation services provided through AT&T and others, including T-Mobile USA, or T-Mobile, U.S. Cellular Corporation, or USCC, and Comunicaciones Nextel de Mexico, S.A. de C.V., a subsidiary of NII Holdings, Inc., or NII Mexico. We anticipate that mobile navigation revenue will continue to decline.
AT&T represented 9%%, 15% and 24% of our revenue in fiscal 2016, 2015 and 2014, respectively. In March 2016, our agreement with AT&T was automatically renewed, under its existing terms through March 2017, and provides that we will continue to be the exclusive provider of white label GPS navigation services to AT&T. AT&T is not required to offer our navigation services. We have seen substantial declines in the number of paying subscribers for our services through AT&T over the past few years and we expect the number of subscribers and related revenue to continue to decline substantially. In addition, as AT&T shifts the manner in which our applications are loaded on their devices to one where users are directed to an application store, the rate of decline in our revenue from AT&T may increase as those subscribers may then search for free alternatives.
We derive services revenue primarily from our wireless carrier customers for their end users' subscriptions to our mobile navigation services. Our wireless carrier customers pay us based on several different revenue models, including (1) a revenue sharing arrangement that may include a minimum fee per end user, (2) a monthly or annual subscription fee per end user, or (3) based on usage. Certain of our contracts provide our wireless carrier customers with discounts based on the number of end users paying for our services in a given month. In general, our wireless carrier customers pay us a lower monthly fee per end user if an end user subscribes to our mobile navigation services as part of a bundle of mobile data or voice services than if an end user subscribes to our mobile navigation services on a standalone basis. We also offer our applications directly to end users through application stores such as the Apple App Store and the Google Play marketplace. Finally, we provide free versions of our services which can generate revenue through advertising supported arrangements, and subscriber upgrades to premium versions for a fee. We also derive services revenue from advertising network services through the delivery of search and display advertising impressions based on the specific terms of the advertising contract. In the future, we may have other revenue models.
For services that our subscribers purchase through our wireless carriers, our wireless carrier customers are responsible for billing and collecting the fees they charge their subscribers for the right to use our navigation services. When we are paid on a revenue sharing basis with our wireless carrier customers, the amount we receive varies depending on several factors, including the revenue share rate negotiated with the wireless carrier customer, the price charged to the subscriber by the wireless carrier customer, the specific sales channel of the wireless carrier customer in which the service is offered and the features and capability of the service. As a result of these factors, the amount we receive for a subscriber may vary considerably and is subject to change over time.
In addition, the amount we are paid per end user in our revenue sharing arrangements may also vary depending upon the metric used to determine the amount of the payment, including the number of end users at any time during a month, the average monthly paying end users, the number and timing of end user billing cycles and end user activity. Although our wireless carrier customers generally have sole discretion about how to price our mobile navigation services to their subscribers, our revenue sharing arrangements generally include monthly minimum fees per end user. To a much lesser extent, we also sell our services directly to consumers through application stores and marketplaces.
For fiscal 2017, we expect automotive and advertising revenue to represent the growing components of our revenue but our expectations may not be realized. We anticipate that the lower gross margins generally experienced with automotive and advertising revenue will result in an overall lower gross margin in fiscal 2017. We expect that services revenue from wireless carrier customers will continue to decline substantially in fiscal 2017 due to the continued decline in the number of monthly recurring subscribers.
46
In fiscal 2016, 2015 and 2014, we generated 97%, 96% and 94% of our revenue, respectively, in the United States. With respect to revenue we receive from automobile manufacturers and OEMs for sales of vehicles in other countries, we classify the majority of that revenue as being generated in the United States, because we provide deliverables to and receive compensation from the manufacturer's or OEM's United States' entity. It is possible that this classification may change in the future, as existing and new customers may elect to contract through subsidiaries.
Cost of revenue
We classify our cost of revenue as either cost of product revenue or cost of services revenue. Cost of product revenue consists primarily of the cost of third party content we incur in providing our on-board automotive navigation solutions and recognition of deferred development costs. Cost of services revenue consists primarily of the costs associated with third party content, third party exchange ad inventory, data center operations and outsourced hosting services, customer support, amortization of capitalized software, stock-based compensation and amortization of developed technology that we incur in providing our navigation and advertising network services.
We also capitalize and defer recognition of certain licensed map and POI content costs from third parties in a manner similar to deferred revenue for our on-board and brought-in automotive solutions. Such deferred costs are recognized over the requisite service period and amounted to $12.1 million as of June 30, 2016. As the deferred revenue and related deferred costs are recognized as the underlying services are provided, we will also incur ongoing costs of revenue for network operations, hosting and data center, and customer service support over time.
We primarily provide mobile navigation service customer support through a third party provider to whom we provide training and assistance with problem resolution. In addition, we use outsourced, hosting services and industry standard hardware to provide our navigation services. We generally offer to our wireless carrier customers and generally maintain at least 99.9% uptime every month, excluding designated periods of maintenance. Our internal targets for service uptime are even higher. We have in the past, and may in the future, not achieve our targets for service availability and may incur penalties for failure to meet contractual service availability requirements, including loss of a portion of subscriber fees for the month or termination of our wireless carrier customer agreement.
The largest component of cost of revenue for our advertising business is the cost of location-based, third party advertising inventory which we acquire from advertising exchanges. Our search ad inventory is generated from our user base of paid and freemium users of our Scout and Telenav branded and carrier branded mobile navigation solutions. Other notable costs of our advertising business are the cost of technologies that we license to deliver customized solutions, costs of ad delivery via contracted hosted relationships and the cost of our advertising operations.
While we expect that our services revenue from wireless carrier customers will continue to decline substantially in fiscal 2017 and beyond, we do not expect to be able to reduce our cost of services revenue at the same rate, if at all, as the decline in services revenue. Although we successfully transitioned to utilizing OSM content for the majority of our mobile user base resulting in notable cost savings, we expect to continue to incur significant costs, especially related to third party content as well as for outsourced hosting services. Cost of services revenue related to our advertising business will be impacted by our ability to grow advertising revenue, as well as the cost and availability of display ad inventory sourced from third party exchanges. While our product revenue is expected to increase in fiscal 2017 due to continued growth in automotive, much of this growth will be generated from increasing distribution of our automotive solution with Ford in North America, China and Europe. Consequently, we expect that our overall total cost of revenue will increase as a percentage of revenue as our costs of third party exchange ad inventory increase, and as we increase the percentage of our revenue from automotive navigation solutions and advertising network services, which generally have higher associated third party content costs and third party display ad costs, respectively, than our mobile navigation offerings provided through wireless carriers.
Operating expenses
We classify our operating expenses into three categories: research and development, sales and marketing and general and administrative. Our operating expenses consist primarily of personnel costs, which include salaries, bonuses, advertising sales commissions, payroll taxes, employee benefit costs and stock-based compensation expense. Other expenses include marketing program costs, third party contractor and temporary staffing services, facilities-related costs including rent expense, legal, audit and tax consulting and other professional service fees. We allocate stock-based compensation expense resulting from the amortization of the fair value of stock-based awards granted, based on the department in which the award holder works. We allocate overhead, such as rent and depreciation, to each expense category based on headcount. We anticipate continued investment of resources, including the hiring of additional headcount, or reallocation of employee personnel to automotive and advertising.
47
Research and development. Research and development expenses consist primarily of personnel costs for our development and product management employees and costs of outside consultants and temporary staffing. We have focused our research and development efforts on improving the ease of use and functionality of our existing and developing products and services. In addition to our U.S. employee base, a significant number of our research and development employees are located in our development centers in China and Romania; as a result, a portion of our research and development expense is subject to changes in foreign exchange rates, notably the Chinese Renminbi, or RMB, and the Romanian Leu.
Sales and marketing. Sales and marketing expenses consist primarily of personnel costs for our sales and marketing staff, commissions earned by our sales personnel and the cost of marketing programs, advertising and promotional activities. Historically, a majority of our revenue has been derived from wireless carriers, which bore much of the expense of marketing and promoting our services to their subscribers, as well as consumers acquired through open market application stores. More recently, automotive revenue has comprised the largest portion of our revenue and automotive and advertising revenue have represented the growing components of our revenue. Our sales and marketing activities supporting our automotive navigation solutions include the costs of our business development efforts. Our automotive manufacturer partners and OEMs also provide primary marketing for our on-board and brought-in navigation services.
General and administrative. General and administrative expenses consist primarily of personnel costs for our executive, finance, legal, human resources and administrative personnel; legal, audit and tax consulting; and other professional services and corporate expenses. We anticipate that legal expenses related to the Vehicle IP case will be substantial in fiscal 2017 as we prepare for and undertake the February 2017 trial. We believe these legal costs will have a material impact on general and administrative expenses during fiscal 2017. We may also be required to pay verdicts, indemnification claims or amounts reached in settlement, which we are unable to predict at this time.
Other income (expense), net. Other income (expense), net consists primarily of interest we earn on our cash and cash equivalents and short-term investments, gain or loss on investments and foreign currency transaction gains or losses.
Provision (benefit) for income taxes. Our provision (benefit) for income taxes primarily consists of corporate income taxes related to profits earned or losses incurred in the United States or corporate income tax refunds expected to be derived from losses incurred in the United States that may be carried back to prior fiscal years. Our effective tax rate could fluctuate significantly from year to year, particularly in those years in which we incur losses, due to our ability to benefit from the carryback of net operating losses within the carryback period and the available amount therein, if any. Furthermore, on a quarterly basis our tax rates can fluctuate and could be adversely affected by increases in nondeductible stock-based compensation or other nondeductible expenses, as well as changes in our tax reserves. Our effective tax rate could also fluctuate due to a change in our earnings or loss projections, changes in the valuation of our deferred tax assets or liabilities, or changes in tax laws, regulations, or accounting principles, as well as certain discrete items.
Critical accounting policies and estimates
We prepare our consolidated financial statements in accordance with GAAP. In many cases, the accounting treatment of a particular transaction is specifically dictated by GAAP and does not require our judgment in its application. In other cases, our judgment is required in selecting among available alternative accounting policies that allow different accounting treatment for similar transactions. The preparation of consolidated financial statements also requires us to make estimates and assumptions that affect the reported amounts of assets, liabilities, revenue, costs and expenses and related disclosures. We base our estimates on historical experience and various other assumptions that we believe are reasonable under the circumstances. In many instances, we could reasonably use different accounting estimates, and in some instances changes in the accounting estimates are reasonably likely to occur from period to period. Accordingly, actual results could differ significantly from the estimates made by our management. To the extent that there are differences between our estimates and actual results, our future financial statement presentation, financial condition, results of operations and cash flows will be affected. We believe that the accounting policies discussed below are critical to understanding our historical and future performance, as these policies relate to the more significant areas involving our judgments and estimates.
Revenue recognition. We generate revenue primarily from software licenses, service subscriptions and customized software development fees. We also generate revenue from the delivery of search and display advertising impressions. We recognize revenue when persuasive evidence of an arrangement exists, delivery of the product or service has occurred, the fee is fixed or determinable and collectability is reasonably assured. We evaluate whether it is appropriate to recognize revenue based on the gross amount billed to our customers or the net amount earned as revenue. When we are primarily obligated in a transaction, have latitude in establishing prices, are responsible for fulfillment of the transaction, have credit risk, or have several but not all of these indicators, we record revenue on a gross basis. While none of the factors individually are considered presumptive or determinative, in reaching conclusions on gross versus net revenue recognition, we place the most weight on the
48
analysis of whether or not we are the primary obligor in the arrangement. We report our automotive and advertising revenue on a gross basis.
We derive product revenue from the delivery of customized software and royalties earned from the distribution of this customized software in certain automotive navigation applications. We generally recognize customized software revenue using the completed contract method of contract accounting under which revenue is recognized upon delivery to, and acceptance by, the automobile manufacturer of our on-board navigation solutions. We generally recognize royalty revenue for our automotive on-board navigation solutions as the software is reproduced for installation in vehicles or as the software is installed in vehicles, assuming all other conditions for revenue recognition have been met.
We derive services revenue from our brought-in automotive navigation solutions and other automotive solutions, such as map update programs. Billings for these services are recorded as deferred revenue and amortized to revenue over the estimated service periods. In January 2015, GM launched the new version of its OnStar RemoteLink® mobile application powered by our location-based services platform. We earn a one-time royalty for each new vehicle owner who downloads the RemoteLink® application. In July 2015, Ford Australia and New Zealand adopted a map update program as part of its SYNC 2 product distribution. Under this program, Ford owners in Australia and New Zealand with SYNC 2 or SYNC 3 will be eligible to receive annual map updates at no additional cost through December 2023. We earn an annual fee and a per unit fee for these updates. In August 2015, Toyota began shipping vehicles enabled to connect with our Scout® GPS Link mobile application. We earn a one-time royalty for each new Toyota sold and equipped with Entune™ Audio Plus.
We derive services revenue from the delivery of search and display advertising impressions. We recognize revenue when the related advertising services are delivered based on the specific terms of the advertising contract, which are commonly based on the number of ad impressions delivered, or clicks, drives or actions by users on mobile advertisements.
We also derive services revenue from subscriptions to access our mobile navigation services, which are generally provided through our wireless carrier customers that offer our services to their subscribers or through application stores. Our wireless carrier customers pay us based on several different revenue models, including (1) a revenue sharing arrangement that may include a minimum fee per end user, (2) a monthly or annual subscription fee per end user, or (3) based on usage. Our end users who subscribe to our services through application stores pay us a monthly or annual subscription fee.
We recognize monthly fees related to our mobile navigation services in the month we provide the services. We defer amounts received or billed in advance of the service being provided and recognize the deferred amounts when the monthly service has been provided. We recognize revenue for fixed fees for any number of subscribers receiving our services as part of bundles monthly on a straight-line basis over the term of the agreement. Our agreements do not contain general rights of refund once the service has been provided. We also establish allowances for estimated credits subsequently issued to end users by our wireless carrier customers.
We recognize as services revenue the amount our wireless carrier customers report to us as we provide our services, which are net of any revenue sharing or other fees earned and deducted by our wireless carrier customers. We are not the principal provider when selling access to our mobile navigation services through our wireless carrier customers as the subscribers directly contract with our wireless carrier customers. In addition, we may earn a fixed fee or fixed percentage of fees charged by our wireless carrier customers and our wireless carrier customers have the sole ability to set the price charged to their subscribers for our service. Our wireless carrier customers have direct responsibility for billing and collecting those fees from their subscribers and we and our wireless carrier customers may offer subscribers a free trial for our service. For end users who purchase our mobile navigation services through application stores, we utilize the application store billing process. We provide tiered pricing to certain of our wireless carrier customers based on the number of paying end users in a given month, which may result in a discounted fee per end user depending on the number of end users. Revenue recognized is based on the discounted fees earned for a given period.
In certain instances, due to the nature and timing of monthly revenue and reporting from our customers, we may be required to make estimates of the amount of revenue to recognize from a customer for the current period. For example, certain of our wireless carrier customers do not provide us with sufficient monthly individual subscriber billing period details to allow us to compute the allocation of monthly service fees to the individual end user’s service period, and in such cases we make estimates of any required service period revenue cutoff. In addition, if we fail to receive an accurate revenue report from a wireless carrier customer for the month, we will need to estimate the amount of revenue that should be recorded for that month. These estimates may require judgment, and we consider certain factors and information in making these estimates such as:
• | subscriber data supplied by our wireless carrier customers or sales data provided by our auto manufacturer customers; |
• | customer specific historical subscription or unit sales trends and revenue reporting trends; |
• | end user subscription data from our internal systems; and |
• | data from comparable distribution channels of our other customers. |
49
If we are unable to reasonably estimate recognizable revenue from a customer for a given period, we defer recognition of revenue to the period in which we receive and validate the customer’s revenue report and all of our revenue recognition criteria have been met. If we have recorded an estimated revenue amount, we record any difference between the estimated revenue and actual revenue in the period when we receive the final revenue reports from our customer, which typically occurs within the following month. To date, actual amounts have not differed materially from our estimates.
Software development costs. We account for the costs of computer software we develop for internal use by capitalizing qualifying costs, which are incurred during the application development stage, and amortizing those costs over the application’s estimated useful life, which generally ranges from 18 months to 24 months depending on the type of application. Costs incurred and capitalized during the application development stage generally include the costs of software configuration, coding, installation and testing. Such costs primarily include payroll and payroll related expenses for employees directly involved in the application development, as well as third party developer fees. We expense preliminary evaluation costs as they are incurred before the application development stage, as well as post development implementation and operation costs, such as training, maintenance and minor upgrades. We begin amortizing capitalized costs when a project is ready for its intended use, and we periodically reassess the estimated useful life of a project considering the effects of obsolescence, technology, competition and other economic factors which may result in a shorter remaining life.
We did not capitalize any software development costs during fiscal 2016, 2015 or 2014. Amortization expense related to capitalized software costs, which was recorded in cost of revenue, totaled zero, $0.1 million and $1.0 million for fiscal 2016, 2015 and 2014, respectively.
We account for the costs of computer software we develop for customers requiring significant modification or customization by deferring qualifying costs under the completed contract method. All such development costs incurred are deferred until the related revenue is recognized. We deferred $0.6 million, $0.8 million and $0.9 million of software development costs during fiscal 2016, 2015 and 2014, respectively. Development costs expensed to cost of revenue totaled $0.7 million, $1.2 million and $0.9 million for fiscal 2016, 2015 and 2014, respectively.
Impairment of long-lived assets. We evaluate long-lived assets held and used for impairment whenever events or changes in circumstances indicate that their net book value may not be recoverable. We continually evaluate whether events and circumstances have occurred that indicate the balance of our property and equipment, long-term investments and intangible assets with definite lives may not be recoverable. Our evaluation is significantly impacted by our estimates and assumptions of future revenue, costs, and expenses and other factors. If an event occurs that would cause us to revise our estimates and assumptions used in analyzing the value of our property and equipment, that revision could result in a non-cash impairment charge that could have a material impact on our financial results. When these factors and circumstances exist, we compare the projected undiscounted future cash flows associated with the related asset or group of assets over their estimated useful lives against their respective carrying amounts. We base the impairment, if any, on the excess of the carrying amount over the fair value, based on market value when available, or discounted expected cash flows of those assets, and record it in the period in which we make the determination.
Goodwill. Goodwill represents the excess of the aggregate purchase price paid over the fair value of the net assets acquired. Goodwill is not amortized and is tested for impairment at least annually or whenever events or changes in circumstances indicate that the carrying value may not be recoverable. These tests are based on our operating segment and reporting unit structure. We first assess qualitative factors to determine whether it is necessary to perform the two-step quantitative goodwill impairment test. We are not required to calculate the fair value of our reporting units unless we determine, based on a qualitative assessment, that it is more likely than not that the fair value is less than our carrying amount. If we determine it is more likely than not that the fair value of the reporting unit is less than its carrying value, we perform a two-step quantitative goodwill impairment test. The first step of the impairment test involves comparing the fair value of the reporting unit to its net book value, including goodwill. If the net book value exceeds its fair value, then we would perform the second step of the goodwill impairment test to determine the amount of the impairment loss, if any. In assessing the fair value of our reporting units, we make assumptions regarding our estimated future cash flows, long-term growth rates, timing over which the cash flows will occur and, amongst other factors, the weighted average cost of capital. Application of the goodwill impairment test requires judgment, including the identification of reporting units, assignment of assets and liabilities to reporting units and determination of the fair value of each reporting unit.
Revenue from our mobile navigation business has been declining substantially over the last few years and continued deterioration of this revenue base can result in an impairment of the goodwill and intangibles assigned to this reporting unit. In addition, in January 2016 we decided to shift our focus in our advertising business from growth to profitability. In the near-term, we are taking actions to reduce our operating costs.
We tested goodwill for impairment on April 1, 2016 at the reporting unit level using a combination of a discounted cash flow analysis and market multiples based upon historical and projected financial information. The fair value of our automotive and advertising reporting units was estimated using the discounted cash flow approach. The fair value of our mobile navigation
50
reporting unit was estimated using a combined discounted cash flow and market multiple approach with equal weighting given to the two approaches. The market multiple approach utilized revenue multiples from guideline public companies operating in similar industries. The revenue multiples were applied to the projected financial information of the mobile navigation reporting unit to determine its fair value. We applied our best judgment when assessing the reasonableness of the financial projections used to determine the fair value of each reporting unit. Based on the results of our annual goodwill impairment test as of April 1, 2016, the estimated fair value of each of our reporting units exceeded its carrying value.
The estimates used to calculate the fair value of a reporting unit change from year to year based on operating results, market conditions and other factors. If our estimates or related assumptions change in the future, or if our net book value were to exceed our market capitalization, we may be required to record an impairment loss related to our goodwill. We have not recognized any impairment of goodwill in the three year period ended June 30, 2016. As of June 30, 2016, we had goodwill of $31.3 million.
Stock-based compensation expense. We account for stock-based employee compensation arrangements under the fair value recognition method, which requires us to measure the stock-based compensation costs of share-based compensation arrangements based on the grant date fair value, and recognize the costs in the financial statements over the employees’ requisite service period. We recognize compensation expense for the fair value of these awards with time based vesting on a straight-line basis over an employee’s requisite service period of each of these awards, net of estimated forfeitures.
Our stock-based compensation expense was as follows:
Fiscal Year Ended June 30, | ||||||||||||
2016 | 2015 | 2014 | ||||||||||
(in thousands) | ||||||||||||
Cost of revenue | $ | 143 | $ | 98 | $ | 100 | ||||||
Research and development | 6,062 | 5,275 | 4,489 | |||||||||
Selling and marketing | 2,844 | 2,943 | 3,306 | |||||||||
General and administrative | 2,317 | 3,112 | 3,640 | |||||||||
Total stock-based compensation expense | $ | 11,366 | $ | 11,428 | $ | 11,535 | ||||||
As of June 30, 2016, there was $4.5 million of unrecognized stock-based compensation expense related to unvested stock option awards, net of estimated forfeitures, that we expect to be recognized over a weighted average period of 2.97 years. At June 30, 2016, the total unrecognized stock-based compensation cost related to restricted stock units was $13.2 million, net of estimated forfeitures, and will be amortized over a weighted average period of 2.26 years.
We generally utilize the Black-Scholes option-pricing model to determine the fair value of our stock option awards, which requires a number of estimates and assumptions. In valuing share-based awards under the fair value accounting method, significant judgment is required in determining the expected volatility of our common stock and the expected term individuals will hold their share-based awards prior to exercising. The expected volatility of our stock is based on the historical volatility of various comparable companies, as we do not have sufficient historical data with regards to the volatility of our own stock. The expected term of options granted represents the period of time that options granted are expected to be outstanding. The expected term was based on an analysis of our historical exercise and cancellation activity. In the future, as we gain historical data for volatility in our own stock, the expected volatility and expected term may change which could substantially change the grant date fair value of future awards of stock options and ultimately the expense we record. In addition, the estimation of stock awards that will ultimately vest requires judgment, and to the extent actual results differ from our estimates, such amounts will be recorded as an adjustment in the period estimates are revised.
For fiscal 2016, 2015 and 2014, we calculated the fair value of options granted to employees with the following weighted average assumptions:
Fiscal Year Ended June 30, | |||||||||
2016 | 2015 | 2014 | |||||||
Expected volatility | 47 | % | 54 | % | 62 | % | |||
Expected term (in years) | 4.53 | 4.38 | 4.45 | ||||||
Risk-free interest rate | 1.35 | % | 1.60 | % | 1.44 | % | |||
Dividend yield | — | — | — | ||||||
51
We recognize the estimated stock-based compensation expense of restricted stock units, net of estimated forfeitures, over the vesting term. The estimated stock-based compensation expense is based on the fair value of our common stock on the date of grant.
Provision (benefit) for income taxes. We use the asset and liability method of accounting for income taxes. Under this method, income tax expense (benefit) is recognized for the amount of taxes payable or refundable for the current year. In addition, deferred tax assets and liabilities are recognized for the expected future tax effect of temporary differences between the financial reporting and tax bases of assets and liabilities, and for operating losses and tax credit carryforwards. We must make assumptions, judgments and estimates to determine our current provision for income taxes and also our deferred tax assets and liabilities and any valuation allowance to be recorded against a deferred tax asset.
Our assumptions, judgments and estimates relative to the current provision (benefit) for income taxes take into account current tax laws, our interpretation of current tax laws and possible outcomes of current and future audits conducted by foreign and domestic tax authorities. We have established reserves for income taxes to address potential exposures involving tax positions that could be challenged by tax authorities. In addition, we are subject to the periodic examination of our income tax returns by the Internal Revenue Service, or IRS, and other domestic and foreign tax authorities. Although we believe our assumptions, judgments and estimates are reasonable, changes in tax laws or our interpretation of tax laws and the resolution of the current and any future tax audits could significantly impact the amounts provided for income taxes in our consolidated financial statements.
Our assumptions, judgments and estimates relative to the value of a deferred tax asset take into account predictions of the amount and category of future taxable income, such as income from operations or capital gains income and predictions of the amount and category of future taxable loss that may be carried back for a tax refund. In assessing the realizability of deferred tax assets, we consider whether it is more likely than not that some portion or all of the deferred tax assets, on a jurisdiction by jurisdiction basis, will be realized. Actual operating results and the underlying amount and category of income in future years as well as expectations regarding the generation of operating losses could render our current assumptions, judgments and estimates of recoverable net deferred taxes inaccurate. Any of the assumptions, judgments and estimates mentioned above could cause our actual income tax obligations or refunds to differ from our estimates, thus materially impacting our financial position and results of operations.
Results of operations
The following tables set forth our results of operations for fiscal 2016, 2015 and 2014, as well as a percentage that each line item represents of our revenue for those periods. The period to period comparison of financial results is not necessarily indicative of financial results to be achieved in future periods.
Fiscal Year Ended June 30, | ||||||||||||
Consolidated Statements of Operations Data | 2016 | 2015 | 2014 | |||||||||
Revenue: | (in thousands) | |||||||||||
Product | $ | 132,454 | $ | 100,768 | $ | 72,747 | ||||||
Services | 50,892 | 59,471 | 77,566 | |||||||||
Total revenue | 183,346 | 160,239 | 150,313 | |||||||||
Cost of revenue: | ||||||||||||
Product | 79,165 | 55,270 | 36,775 | |||||||||
Services | 21,632 | 23,514 | 24,066 | |||||||||
Total cost of revenue | 100,797 | 78,784 | 60,841 | |||||||||
Gross profit | 82,549 | 81,455 | 89,472 | |||||||||
Operating expenses: | ||||||||||||
Research and development | 68,911 | 68,060 | 60,573 | |||||||||
Sales and marketing | 25,587 | 26,975 | 33,138 | |||||||||
General and administrative | 23,994 | 23,606 | 26,176 | |||||||||
Restructuring | (1,362 | ) | 1,150 | 4,412 | ||||||||
Total operating expenses | 117,130 | 119,791 | 124,299 | |||||||||
Loss from operations | (34,581 | ) | (38,336 | ) | (34,827 | ) | ||||||
Other income (expense), net | (229 | ) | 2,267 | 1,288 | ||||||||
Loss before provision (benefit) for income taxes | (34,810 | ) | (36,069 | ) | (33,539 | ) | ||||||
Provision (benefit) for income taxes | 511 | (13,006 | ) | (4,015 | ) | |||||||
Net loss | $ | (35,321 | ) | $ | (23,063 | ) | $ | (29,524 | ) | |||
52
Fiscal Year Ended June 30, | |||||||||
2016 | 2015 | 2014 | |||||||
Revenue: | (as a percentage of revenue) | ||||||||
Product | 72 | % | 63 | % | 48 | % | |||
Services | 28 | % | 37 | % | 52 | % | |||
Total revenue | 100 | % | 100 | % | 100 | % | |||
Cost of revenue: | |||||||||
Product | 43 | % | 34 | % | 24 | % | |||
Services | 12 | % | 15 | % | 16 | % | |||
Total cost of revenue | 55 | % | 49 | % | 40 | % | |||
Gross profit | 45 | % | 51 | % | 60 | % | |||
Operating expenses: | |||||||||
Research and development | 38 | % | 42 | % | 41 | % | |||
Sales and marketing | 14 | % | 17 | % | 22 | % | |||
General and administrative | 13 | % | 15 | % | 17 | % | |||
Restructuring | (1 | )% | 1 | % | 3 | % | |||
Total operating expenses | 64 | % | 75 | % | 83 | % | |||
Loss from operations | (19 | )% | (24 | )% | (23 | )% | |||
Other income (expense), net | — | % | 1 | % | 1 | % | |||
Loss before provision (benefit) for income taxes | (19 | )% | (23 | )% | (22 | )% | |||
Provision (benefit) for income taxes | — | % | (9 | )% | (2 | )% | |||
Net loss | (19 | )% | (14 | )% | (20 | )% | |||
Segments information. The information below is organized in accordance with our three reportable business segments (dollars in thousands):
Fiscal Year Ended June 30, | ||||||||||||
2016 | 2015 | 2014 | ||||||||||
Revenue | ||||||||||||
Automotive | $ | 135,372 | $ | 103,100 | $ | 75,153 | ||||||
Advertising | 21,744 | 17,941 | 11,699 | |||||||||
Mobile Navigation | 26,230 | 39,198 | 63,461 | |||||||||
Total revenue | 183,346 | 160,239 | 150,313 | |||||||||
Cost of revenue | ||||||||||||
Automotive | 81,293 | 56,319 | 37,135 | |||||||||
Advertising | 12,296 | 11,710 | 7,012 | |||||||||
Mobile Navigation | 7,208 | 10,755 | 16,694 | |||||||||
Total cost of revenue | 100,797 | 78,784 | 60,841 | |||||||||
Gross profit | ||||||||||||
Automotive | 54,079 | 46,781 | 38,018 | |||||||||
Advertising | 9,448 | 6,231 | 4,687 | |||||||||
Mobile Navigation | 19,022 | 28,443 | 46,767 | |||||||||
Total gross profit | $ | 82,549 | $ | 81,455 | $ | 89,472 | ||||||
Gross margin | ||||||||||||
Automotive | 40 | % | 45 | % | 51 | % | ||||||
Advertising | 43 | % | 35 | % | 40 | % | ||||||
Mobile Navigation | 73 | % | 73 | % | 74 | % | ||||||
Total gross margin | 45 | % | 51 | % | 60 | % | ||||||
53
Comparison of the fiscal years ended June 30, 2016 and 2015
Revenue, cost of revenue and gross profit.
Consolidated overview. Product revenue increased 31% to $132.5 million in fiscal 2016 from $100.8 million in fiscal 2015. The increase in product revenue was due primarily to an increase in royalty revenue from automotive navigation solutions we provide for our automotive customers. Services revenue decreased 14% to $50.9 million in fiscal 2016 from $59.5 million in fiscal 2015. The decrease in services revenue was due primarily to lower subscription fees resulting from decreases in the number of paying subscribers for mobile navigation services, partially offset by an increase in advertising revenue.
Our cost of product revenue increased 43% to $79.2 million in fiscal 2016 from $55.3 million in fiscal 2015. The increase was due primarily to an increase in third party content costs associated with automotive navigation solutions, as our business continued to shift from deriving a majority of revenue from mobile navigation services to deriving a majority of revenue from automobile navigation products and services. Furthermore, cost of product revenue increased at a higher rate than product revenue due primarily to an increase in third party content costs associated with increased royalty revenue and a higher percentage of revenue from Ford on vehicles sold in Europe and China, which generally have higher associated content costs. Our cost of services revenue decreased 8% to $21.6 million in fiscal 2016 from $23.5 million in fiscal 2015. The decrease was due primarily to a decrease in cost of mobile navigation revenue associated with the decline in such revenue, partially offset by an increase in cost of advertising revenue resulting from increases in third party ad exchange inventory costs and hosting services associated with the increased impressions delivered.
Our gross profit increased to $82.5 million in fiscal 2016 from $81.5 million in fiscal 2015. Our gross margin decreased to 45% in fiscal 2016 from 51% in fiscal 2015. The decrease in gross margin was primarily due to the continuing increased proportion of product revenue contributed from our on-board automotive navigation solutions provided to our automotive customers and advertising services revenue, which generally have higher associated costs and resulting lower gross margins than our mobile navigation services provided through our wireless carrier customers. We expect our gross margin to continue to decline as the percentage of our revenue from automotive and advertising offerings increases, and as a result of increased competition on our offering of mobile navigation services, especially from other freemium offerings. In addition, we expect that our gross margin will continue to be negatively impacted in the future by the amortization of developed technology acquired as part of our January 2014 acquisition of skobbler.
Revenue concentrations. In fiscal 2016 and 2015, revenue from Ford represented 71% and 61% of our total revenue, respectively, and revenue from AT&T represented 9% and 15% of our total revenue, respectively.
We primarily sell our services in the United States. In fiscal 2016 and 2015, revenue derived from U.S. sources represented 97% and 96% of our total revenue, respectively.
Segments information.
Automotive. Automotive revenue increased 31% to $135.4 million in fiscal 2016 from $103.1 million in fiscal 2015. The increase was due primarily to an increase in royalty revenue of $33.3 million. Automotive revenue included customized software and map content revenue of $3.2 million and $4.7 million in fiscal 2016 and 2015, respectively. Automotive revenue represented 74% and 64% of total revenue in fiscal 2016 and 2015, respectively. In addition, during fiscal 2016 and 2015, our deferred automotive revenue increased $17.0 million and $5.1 million, respectively, primarily related to royalties from GM's OnStar RemoteLink, the Ford Australia and New Zealand SYNC 2 map update program and Toyota Entune product. We may experience a lag in revenue as Ford transitions to SYNC 3 in various geographies. For SYNC 3, we recognize revenue when our software is installed in the vehicle, as compared to SYNC 2 for which we recognize revenue as the software is reproduced for installation in vehicles. The SYNC 3 transition has occurred in North America and China and has begun in Europe, and the nominal effect on revenue recognition was reflected in our consolidated financial statements for fiscal 2016. During the three months ending September 30, 2016, we anticipate that as Ford completes the transition in Europe and transitions to SYNC 3 in other international markets, we will experience a lower level of orders as Ford uses its existing inventory of SYNC 2 product in preparation for the transition to SYNC 3.
Cost of automotive revenue increased 44% to $81.3 million in fiscal 2016 from $56.3 million in fiscal 2015. The increase was due primarily to an increase in third party content costs of $25.1 million associated with the increased royalty revenue and a higher percentage of revenue from Ford for vehicles sold in Europe and China, which generally have higher associated content costs.
Automotive gross profit increased 16% to $54.1 million in fiscal 2016 from $46.8 million in fiscal 2015. Automotive gross margin decreased to 40% in fiscal 2016 from 45% in fiscal 2015. The decrease in gross margin was due primarily to the higher proportion of revenue from vehicles sold in Europe and China, which generally has higher associated content costs.
Advertising. Advertising revenue increased 21% to $21.7 million fiscal 2016 from $17.9 million in fiscal 2015. The increase was due primarily to an increase in the value of contracted insertion orders along with the number of impressions delivered. Advertising revenue represented 12% and 11% of total revenue in fiscal 2016 and 2015, respectively.
54
Cost of advertising revenue increased 5% to $12.3 million in fiscal 2016 from $11.7 million in fiscal 2015. The increase was due primarily to increased third party ad exchange inventory costs of $2.2 million, partially offset by a decrease in amortization of intangible assets of $1.2 million, as our advertising-related acquired intangibles were fully amortized during fiscal 2016.
Advertising gross profit increased 52% to $9.4 million in fiscal 2016 from $6.2 million in fiscal 2015. Advertising gross margin increased to 43% in fiscal 2016 from 35% in fiscal 2015. The increase in gross margin was due primarily to the increased value of contracted insertion orders, combined with the completion of amortization of advertising-related intangible assets.
Mobile Navigation. Mobile navigation revenue decreased 33% to $26.2 million in fiscal 2016 from $39.2 million in fiscal 2015. The decrease was primarily due to lower subscription revenue resulting from decreases in the number of paying subscribers for mobile navigation services provided through AT&T, Sprint, T-Mobile and USCC and a decrease in mobile navigation revenue internationally. Mobile navigation revenue represented 14% and 24% of total revenue in fiscal 2016 and 2015, respectively.
Cost of mobile navigation revenue decreased 33% to $7.2 million in fiscal 2016 from $10.8 million in fiscal 2015. The decrease was due primarily to decreases in data center and hosted services costs of $1.6 million, third party content costs of $0.9 million, amortization of intangibles of $0.2 million and compensation and benefits expense of $0.2 million.
Mobile navigation gross profit decreased 33% to $19.0 million in fiscal 2016 from $28.4 million in fiscal 2015. Mobile navigation gross margin was 73% in each of fiscal 2016 and 2015. The relatively consistent margins reflect the net impact of lower revenue levels, offset by the lower cost from our successful transition to OSM maps for the majority of our mobile user base.
Operating expenses
Research and development. Our research and development expenses increased 1% to $68.9 million in fiscal 2016 from $68.1 million in fiscal 2015. The increase was due primarily to increases in outside services of $1.0 million, stock-based compensation of $0.8 million and travel and entertainment expenses of $0.7 million, partially offset by a decrease of $0.9 million due to the reversal of deferred rent associated with our Sunnyvale, California facility lease termination and a decrease in severance pay of $0.9 million. As a percentage of revenue, research and development expenses decreased to 38% in fiscal 2016 from 42% in fiscal 2015. The total number of research and development personnel increased 9% to 451 at June 30, 2016 from 413 at June 30, 2015, with a significant portion of the increase attributable to employees in lower cost regions such as Romania and China. We believe that as we deliver our contracted customer requirements for our automotive customers, establish relationships with new automotive manufacturers and OEMs, enhance our service offerings around our OSM capabilities, and develop new services and products for advertisers, revenue from those investments and development efforts will lag the related research and development expenses.
Sales and marketing. Our sales and marketing expenses decreased 5% to $25.6 million in fiscal 2016 from $27.0 million in fiscal 2015. The decrease was primarily due to decreases in advertising and promotion of $1.0 million, recruiting of $0.3 million, compensation and benefits expense of $0.3 million and software license expense of $0.1 million, partially offset by an increase in commission expense of $0.7 million. As a percentage of revenue, sales and marketing expenses decreased to 14% in fiscal 2016 from 17% in fiscal 2015. The total number of sales and marketing personnel decreased 35% to 51 at June 30, 2016 from 78 at June 30, 2015.
General and administrative. Our general and administrative expenses increased 2% to $24.0 million in fiscal 2016 from $23.6 million in fiscal 2015. The increase was primarily due to an increase in legal expenses of $4.3 million related to current litigation and legal contingencies, that was partially offset by decreases in compensation and benefits expense of $1.5 million, stock-based compensation expense of $0.8 million, severance pay of $0.5 million, travel and entertainment expense of $0.4 million and a decrease of $0.5 million due to the reversal of deferred rent associated with our facility lease termination. During fiscal 2016, we incurred a total of $6.9 million in legal expenses, including legal contingencies. The total number of general and administrative personnel decreased 8% to 57 at June 30, 2016 from 62 at June 30, 2015. As a percentage of revenue, general and administrative expenses decreased to 13% in fiscal 2016 from 15% in fiscal 2015. We anticipate that our general and administrative expenses may vary substantially from period to period as our legal costs associated with ongoing intellectual property litigation and requests for indemnification related to intellectual property litigation proceedings.
Restructuring. Restructuring expense (reversal) for fiscal 2016 was $(1.4) million, primarily reflecting the reversal of a $1.5 million restructuring accrual related to our Sunnyvale facility at 920 De Guigne Drive, as this amount represents the fair value of our lease obligation from April 2016 through November 2019 that is no longer payable in connection with our office lease termination agreement. We incurred restructuring expense of $1.2 million in fiscal 2015 associated with facility lease impairment in connection with the consolidation of our Sunnyvale headquarters facilities in fiscal 2014.
55
Other income (expense), net. Our other income (expense), net was $(0.2) million in fiscal 2016 and $2.3 million in fiscal 2015. Other income (expense), net in fiscal 2016 included $1.1 million of interest income offset by a $1.0 million loss from the write-off of investments in privately-held companies. Other income, net in 2015 included foreign currency transaction gains of $1.6 million and interest income of $1.0 million, which were partially offset by a $1.3 million loss from the impairment of long-term equity investments. The impairment of long-term equity investments of $1.3 million included $0.8 million from an investment in connection with the spin off of a product line developed by our Shanghai, China team.
Provision (benefit) for income taxes. Our provision for income taxes increased to $0.5 million in fiscal 2016 from a benefit of $(13.0) million in fiscal 2015. Our effective tax rate, which resulted in the recognition of a tax expense, was 1% in fiscal 2016 compared to an effective tax rate, which resulted in the recognition of a tax benefit, of 36% in fiscal 2015. Our effective tax rate in fiscal 2016 was attributable primarily to income taxes in certain foreign jurisdictions where we have profit. Our effective tax rate in fiscal 2015 was attributable primarily to tax benefits recorded from the anticipated refund of $5.4 million (of which $4.1 million was recognized in fiscal 2015 and $1.3 million was recognized in fiscal 2014; a total of $4.8 million of this expected refund had been received by us as of June 30, 2016); the recognition of a state income tax refund of $3.0 million and a refund of $1.1 million from a change in tax accounting method, both related to prior years and received in fiscal 2015; and the reversal of tax reserves of $4.2 million due to loss carryback, expiration of the statute of limitations, and settlement of our California audit.
Due to the limitations of the two year loss carryback for federal tax purposes, we do not anticipate any refunds for losses incurred in fiscal 2016 or thereafter.
The usage of our remaining U.S. federal and state loss carryforwards at June 30, 2016 of approximately $41.9 million and $7.8 million, respectively, is limited by Section 382 of the Internal Revenue Code.
As of June 30, 2016, our cumulative unrecognized tax benefit was $6.7 million, of which $5.0 million was netted against deferred tax assets. Included in the other long-term liabilities are unrecognized tax benefits at June 30, 2016 of $1.6 million that, if recognized, would affect the annual effective tax rate.
We believe it is reasonably possible that the gross unrecognized tax benefits as of June 30, 2016 could decrease (whether by payment, release, or a combination of both) by approximately $4.0 million in the next 12 months. We recognize interest and penalties related to unrecognized tax benefits as part of our provision for income taxes. We had $0.6 million and $0.5 million accrued for the payment of interest and penalties at June 30, 2016 and 2015, respectively.
All available evidence, both positive and negative, was considered to determine whether, based upon the weight of the evidence, a valuation allowance for deferred tax assets is needed. In fiscal 2015, we released the valuation allowance of $0.8 million on deferred tax assets, net of liabilities, in Germany due to cumulative net income, expectation of continued profits, and continued growth and sustainability of the European business.
Due to operating losses in previous years and continued earnings volatility, we maintain a valuation allowance on the majority of our deferred tax assets, net of liabilities, since the assets are not more likely than not to be realized based upon our assessment of all positive and negative evidence. Realization of deferred tax assets is dependent upon future taxable earnings, the timing of which is uncertain. Due to losses in previous years, and expected losses in fiscal 2017 and potentially future years in the U.S., we maintained a valuation allowance on deferred tax assets in the U.S. Due to foreign operating losses in previous years and continued foreign earnings volatility, we continued to maintain a full valuation allowance for our foreign deferred tax assets in China, Brazil and the United Kingdom. Our valuation allowance increased from the prior fiscal year by approximately $12.1 million, $4.7 million and $10.1 million in fiscal 2016, 2015 and 2014, respectively.
On December 18, 2015, the Protecting Americans from Tax Hikes Act of 2015 became effective, which made several tax extender provisions permanent as well as extending others. Most notable was the permanent extension of the research and development credit which has been temporary since its enactment in 1981. Due to the inability to utilize the research and development credits, we currently do not expect this legislation to have a material impact on our financial statements.
We file income tax returns in the U.S. with the Internal Revenue Service, or IRS, California, various states and foreign tax jurisdictions in which we have subsidiaries. The statute of limitations remains open for fiscal 2012 through fiscal 2015 in the U.S., for fiscal 2010 through fiscal 2015 in state jurisdictions, and for fiscal 2011 through fiscal 2015 in foreign jurisdictions. Fiscal years outside the normal statute of limitations remain open to audit by tax authorities due to tax attributes generated in those early years which have been carried forward and may be audited in subsequent years when utilized. We are currently under audit by the IRS for fiscal 2012 through fiscal 2014 and the statute of limitations has been extended for fiscal 2012 to allow the IRS additional time to complete its audit. As of June 30, 2016, we were under audit by the state of New York for fiscal 2010 through fiscal 2012 and the statute of limitations has been extended for fiscal 2010 through fiscal 2012 to allow New York additional time to complete its audit.
56
In July 2016, the state of New York completed its audit of our taxes for fiscal 2010 through fiscal 2012. We paid $0.4 million to settle the audit and expect to record a tax benefit of $1.0 million in July 2016 to reverse the remaining related tax reserves.
Comparison of the fiscal years ended June 30, 2015 and 2014
Revenue, cost of revenue and gross profit.
Consolidated overview. Product revenue consists primarily of revenue we receive from the delivery of customized software and royalties from the distribution of this customized software in certain automotive navigation applications. Product revenue increased 39% to $100.8 million in fiscal 2015 from $72.7 million in fiscal 2014. The increase in product revenue was due primarily to an increase in royalty revenue from automotive navigation solutions we provide for our automotive customers, primarily Ford, offset by a slight decrease in customized software revenue. Services revenue consists primarily of revenue we derive from our mobile navigation services and advertising. Services revenue decreased 23% to $59.5 million in fiscal 2015 from $77.6 million in fiscal 2014. The decrease in services revenue was due primarily to lower subscription fees resulting from decreases in the number of paying subscribers for mobile navigation services, partially offset by an increase in advertising revenue.
Our cost of product revenue increased 50% to $55.3 million in fiscal 2015 from $36.8 million in fiscal 2014. The increase was due primarily to an increase in third party content costs associated with the increased royalty revenue from automotive navigation solutions. Our cost of services revenue decreased 2% to $23.5 million in fiscal 2015 from $24.1 million in fiscal 2014. The decrease was due primarily to a decrease in cost of mobile navigation revenue associated with the decline in such revenue, partially offset by an increase in cost of advertising revenue resulting from increases in third party ad exchange inventory costs and hosting services associated with the increased impressions delivered.
Our gross profit decreased to $81.5 million in fiscal 2015 from $89.5 million in fiscal 2014. Our gross margin decreased to 51% in fiscal 2015 from 60% in fiscal 2014. The decrease in gross margin was primarily due to lower services revenue and the increased proportion of product revenue contributed from our on-board automotive navigation solutions provided to our automotive customers, which generally has higher associated content costs and resulting lower gross margins than our mobile navigation services provided through our wireless carrier customers. We expect our overall gross margin to continue to decline as the percentage of our revenue from automotive offerings increases, and as a result of increased competition on our offering of mobile navigation services, especially from other freemium offerings. In addition, our gross margin will continue to be negatively impacted in the future by the amortization of developed technology acquired as part of our January 2014 acquisition of skobbler.
Revenue concentrations. In fiscal 2015 and 2014, revenue from Ford represented 61% and 46% of our total revenue, respectively, and revenue from AT&T represented 15% and 24% of our total revenue, respectively.
We primarily sell our services in the United States. In fiscal 2015 and 2014, revenue derived from U.S. sources represented 96% and 94% of our total revenue, respectively. With respect to revenue we receive from automobile manufacturers and OEMs for sales of vehicles in other countries, we classify that revenue as being generated in the United States because we provide deliverables to and receive compensation from the manufacturer's or OEM's United States' entity.
Segments information.
Automotive. Automotive revenue increased 37% to $103.1 million in fiscal 2015 from $75.2 million in fiscal 2014. The increase was due primarily to an increase in production royalty revenue of $28.3 million. Automotive revenue included customized software and map content revenue of $4.7 million and $5.1 million in fiscal 2015 and 2014, respectively. In addition, during fiscal 2015, we billed $5.3 million in royalties earned from new vehicle owner downloads of GM's OnStar RemoteLink® mobile application powered by our location-based services platform. We record the royalties earned as deferred revenue and recognize this revenue over the estimated service period. Deferred revenue associated with RemoteLink® as of June 30, 2015 was $5.2 million. Automotive revenue represented 64% and 50% of total revenue in fiscal 2015 and 2014, respectively.
Cost of automotive revenue increased 52% to $56.3 million in fiscal 2015 from $37.1 million in fiscal 2014. The increase was due primarily to an increase in third party content costs of $18.2 million associated with the increased royalty revenue and mix of revenue from Ford on vehicles sold in Europe and China and increased amortization expense of $0.5 million related to developed technology acquired.
Automotive gross profit increased 23% to $46.8 million in fiscal 2015 from $38.0 million in fiscal 2014. Automotive gross margin decreased to 45% in fiscal 2015 from 51% in fiscal 2014. The decrease in gross margin was due primarily to the higher proportion of revenue from vehicles sold in Europe and China, which generally has higher associated content costs.
57
Advertising. Advertising revenue increased 53% to $17.9 million fiscal 2015 from $11.7 million in fiscal 2014. The increase was due primarily to an increase in the value of contracted insertion orders along with the number of impressions delivered. Advertising revenue represented 11% and 8% of total revenue in fiscal 2015 and 2014, respectively.
Cost of advertising revenue increased 67% to $11.7 million in fiscal 2015 from $7.0 million in fiscal 2014. The increase was due primarily to increased third party ad exchange inventory costs of $3.8 million and increased third party hosting service fees of $0.9 million associated with the increased impressions delivered. Cost of advertising revenue increased at a greater rate than advertising revenue due to increased effective cost per thousand impressions, or eCPM, for display ad inventory sourced from third party exchanges, as well as enhanced content costs.
Advertising gross profit increased 33% to $6.2 million in fiscal 2015 from $4.7 million in fiscal 2014. Advertising gross margin decreased to 35% in fiscal 2015 from 40% in fiscal 2014. The decrease in gross margin was due primarily to increased eCPM for display ad inventory sourced from third party exchanges, as well as enhanced content costs.
Mobile Navigation. Mobile navigation revenue decreased 38% to $39.2 million in fiscal 2015 from $63.5 million in fiscal 2014. The decrease was primarily due to lower subscription revenue resulting from decreases in the number of paying subscribers for mobile navigation services provided through AT&T, T-Mobile and USCC, the termination of our fixed fee revenue from Sprint for bundled users, and a decrease in mobile navigation revenue internationally. Accordingly, in fiscal 2015, services revenue from AT&T, Sprint, T-Mobile, USCC and international customers decreased by $24.1 million. The decrease was partially offset by $0.8 million in one-time catch-up revenue reporting from AT&T. Mobile navigation revenue represented 24% and 42% of total revenue in fiscal 2015 and 2014, respectively.
Cost of mobile navigation revenue decreased 36% to $10.8 million in fiscal 2015 from $16.7 million in fiscal 2014. The decrease was due primarily to decreases in third party content costs of $2.0 million, compensation and benefits expense of $1.0 million, amortization of capitalized software and recognition of deferred costs of $0.9 million, data center and hosted services costs of $0.8 million, and depreciation and amortization of $0.6 million.
Mobile navigation gross profit decreased 39% to $28.4 million in fiscal 2015 from $46.8 million in fiscal 2014. Mobile navigation gross margin was comparable at 73% and 74% in fiscal 2015 and 2014, respectively.
Operating expenses
Research and development. Our research and development expenses increased 12% to $68.1 million in fiscal 2015 from $60.6 million in fiscal 2014. The increase was due primarily to the inclusion of $10.4 million of product management department costs that are classified in research and development expense beginning in fiscal 2015. Previously, product management departments reported into our sales and marketing organization and were included in sales and marketing expense for fiscal 2014. The $10.4 million increase due to the inclusion of product management costs was partially offset primarily by a $3.8 million decrease in compensation and benefits expense. As a percentage of revenue, research and development expenses increased to 42% in fiscal 2015 from 41% in fiscal 2014. The total number of research and development personnel decreased 4% to 413 at June 30, 2015 from 431 at June 30, 2014. A total of 34 product management personnel were included in research and development expense at June 30, 2015. The decrease in total research and development headcount is due primarily to a decrease resulting from our ongoing cost optimization efforts, including our restructuring efforts in the second half of fiscal 2014, partially offset by increased headcount with our acquisition of skobbler in January 2014 and the inclusion of product management personnel in fiscal 2015.
Sales and marketing. Our sales and marketing expenses decreased 19% to $27.0 million in fiscal 2015 from $33.1 million in fiscal 2014. The decrease was primarily due to a decrease of $10.4 million related to product management costs that were classified in sales and marketing expense in fiscal 2014. Beginning in fiscal 2015, these costs are now included in research and development expense. The $10.4 million decrease related to the classification of product management costs was partially offset primarily by a $4.3 million increase in compensation and benefits and commissions costs. As a percentage of revenue, sales and marketing expenses decreased to 17% in fiscal 2015 from 22% in fiscal 2014. The total number of sales and marketing personnel decreased 23% to 78 at June 30, 2015 from 101 at June 30, 2014. A total of 40 product management personnel were included in sales and marketing expense at June 30, 2014.
General and administrative. Our general and administrative expenses decreased 10% to $23.6 million in fiscal 2015 from $26.2 million in fiscal 2014. The decrease was primarily due to decreases in compensation and benefits expense of $0.9 million, professional and outside services of $0.7 million and stock-based compensation expense of $0.5 million. The total number of general and administrative personnel decreased 5% to 62 at June 30, 2015 from 66 at June 30, 2014. As a percentage of revenue, general and administrative expenses decreased to 15% in fiscal 2015 from 17% in fiscal 2014.
Restructuring. We incurred restructuring costs of $1.2 million in fiscal 2015 associated with facility lease impairment in connection with the consolidation of our Sunnyvale headquarters facilities in fiscal 2014. We incurred restructuring costs of $4.4 million in fiscal 2014 in order to further align our resources and consolidate facilities. We initiated a restructuring plan consisting of reductions of approximately 108 full-time positions in the U.S. and China and we recorded restructuring charges
58
of $2.4 million related to severance and benefits for the positions eliminated. In addition, we closed our Boston office and consolidated our Sunnyvale headquarters facilities from two buildings into one and recorded restructuring charges of $2.0 million related to the impairment of our facility leases.
Other income, net. Our other income, net was $2.3 million in fiscal 2015 and $1.3 million in fiscal 2014. Other income, net in fiscal 2015 included foreign currency transaction gains of $1.6 million and interest income of $1.0 million, which were partially offset by a $1.3 million loss from the impairment of long-term equity investments. The impairment of long-term equity investments of $1.3 million included $0.8 million from an investment in connection with the spin off of a product line developed by our Shanghai, China team.
Provision (benefit) for income taxes. Our benefit for income taxes increased to $13.0 million in fiscal 2015 from $4.0 million in fiscal 2014. Our effective tax rate was 36% in fiscal 2015 compared to 12% in fiscal 2014. Our effective tax rate in fiscal 2015 was attributable primarily to tax benefits recorded from the anticipated federal income tax refund of $5.4 million (of which $4.1 million resulted from the carryback of fiscal 2015 losses and $1.3 million was recognized in fiscal 2014); the recognition of a state income tax refund of $3.0 million and a refund of $1.1 million from a change in tax accounting method, both related to prior years and received in fiscal 2015; and the reversal of tax reserves of $4.2 million due to loss carryback, expiration of the statute of limitations, and settlement of our California audit.
Liquidity and capital resources
The following table sets forth the major sources and uses of cash and cash equivalents for each of the periods set forth below:
Fiscal Year Ended June 30, | ||||||||||||
2016 | 2015 | 2014 | ||||||||||
(in thousands) | ||||||||||||
Net cash used in operating activities | $ | (3,098 | ) | $ | (7,696 | ) | $ | (22,553 | ) | |||
Net cash provided by investing activities | 8,553 | 16,052 | 20,132 | |||||||||
Net cash used in financing activities | (2,316 | ) | (2,471 | ) | (8,883 | ) | ||||||
Effect of exchange rate changes on cash and cash equivalents | (511 | ) | (1,698 | ) | 51 | |||||||
Net increase (decrease) in cash and cash equivalents | $ | 2,628 | $ | 4,187 | $ | (11,253 | ) | |||||
At June 30, 2016, we had cash and cash equivalents and short-term investments of $109.6 million, which primarily consisted of corporate and agency bonds, asset-backed securities, municipal securities and money market mutual funds held by well-capitalized financial institutions.
Our accounts receivable are heavily concentrated in a small number of customers. As of June 30, 2016, our accounts receivable balance was $42.2 million, of which Ford represented 64%.
Our future capital requirements will depend on many factors, including our ability to continue to increase our revenue and control our expenses in fiscal 2017 and beyond, whether we return to profitability, the timing and extent of expenditures to support development efforts, the expansion of research and development and sales and marketing activities and headcount, the introduction of our new and enhanced service and product offerings and the timing and scale of the introduction of vehicles including our navigation products relative to when we are required to develop the product. We believe our cash, cash equivalents and short-term investments will be sufficient to satisfy our financial obligations through at least the next 12 months. However, we expect to continue to use cash in operating activities in fiscal 2017 and we may experience greater than expected cash usage in operating activities if revenue is lower than we anticipate or we incur greater than expected cost of revenue or operating expenses. Our revenue and operating results could be lower than we anticipate if, among other reasons, our customers, one of which we are substantially dependent upon for a large portion of our revenue, were to limit or terminate our relationships with them; we were to fail to successfully compete in our highly competitive market, our revenue did not grow as expected or we were unable to reduce our costs by using OSM. In the future, we may acquire businesses or technologies or license technologies from third parties, and we may decide to raise additional capital through debt or equity financing to the extent we believe this is necessary to successfully complete these acquisitions or license these technologies. However, additional financing may not be available to us on favorable terms, if at all, at the time we make such determinations, which could have a material adverse effect on our business, operating results, financial condition and liquidity and cash position.
Net cash used in operating activities. Net cash used in operating activities was $3.1 million, $7.7 million and $22.6 million in fiscal 2016, 2015 and 2014, respectively. Cash provided by (used in) operating activities has historically been affected by growth in our end user base and increases in our operating costs. In fiscal 2016, cash used in operating activities was due primarily to a net loss of $35.3 million, partially offset by non-cash charges for depreciation and amortization of $3.4 million, stock-based compensation of $11.4 million, write-off of long-term investments of $1.0 million, and a $15.4 million change in our operating assets and liabilities. In fiscal 2015, cash used in operating activities was driven principally by a net
59
loss of $23.1 million and a $3.2 million change in our operating assets and liabilities, partially offset by non-cash charges for depreciation and amortization of $5.2 million, stock-based compensation of $11.4 million, and write-off of long-term investments of $1.3 million. In fiscal 2014, cash used in operating activities was driven principally by a net loss of $29.5 million and a $23.0 million change in our operating assets and liabilities, partially offset by non-cash charges for depreciation and amortization of $6.8 million, stock-based compensation of $11.5 million, and valuation allowance on deferred tax assets of $7.4 million.
Net cash provided by investing activities. Net cash provided by investing activities was $8.6 million, $16.1 million and $20.1 million during fiscal 2016, 2015 and 2014, respectively. In fiscal 2016, cash was provided primarily by proceeds from sales and maturities of short-term investments, net of purchases, of $12.6 million, partially offset by purchases of property and equipment of $4.0 million. In fiscal 2015, cash was provided primarily by proceeds from sales and maturities of short-term investments, net of purchases, of $19.4 million, partially offset by purchases of property and equipment of $1.2 million and purchases of long-term investments of $2.5 million. In fiscal 2014, cash was provided primarily by proceeds from sales and maturities of short-term investments, net of purchases, of $40.2 million, partially offset by our acquisition of skobbler for $19.2 million and purchases of property and equipment of $1.1 million. We expect our capital expenditures in future periods to remain in line with fiscal 2016 as we continue to invest in the infrastructure needed for our strategic growth areas of automotive and advertising, while also leveraging the benefits of hosted environments for which we no longer have to make large upfront capital expenditure investments.
Net cash used in financing activities. During fiscal 2016, 2015 and 2014, we used cash in our financing activities of $2.3 million, $2.5 million and $8.9 million, respectively. In fiscal 2016, 2015 and 2014, these activities reflect the repurchases of our outstanding stock under our stock repurchase programs and tax withholdings paid related to net share settlements of restricted stock units upon vesting, and were partially offset by proceeds from the exercise of options for our common stock.
Contractual obligations, commitments and contingencies
We generally do not enter into long term minimum purchase commitments. However, we have agreed to pay minimum annual license fees to certain of our third party content providers. Our principal commitments, in addition to those related to our third party content providers, consist of obligations under facility leases for office space in Santa Clara, San Mateo and Culver City, California; Reston, Virginia; Southfield, Michigan; Boston, Massachusetts; Chicago, Illinois; New York, New York; Atlanta, Georgia; Shanghai, China; Xi’an, China; Berlin, Germany; Cluj, Romania; Tokyo, Japan; and Incheon, South Korea.
The following table summarizes our outstanding noncancelable contractual obligations as of June 30, 2016:
Payments due by period | ||||||||||||||||||||
Total | Less than 1 Year | 1-3 Years | 3-5 Years | More than 5 Years | ||||||||||||||||
(in thousands) | ||||||||||||||||||||
Operating lease obligations(1) | $ | 15,702 | $ | 4,190 | $ | 7,603 | $ | 3,909 | $ | — | ||||||||||
Purchase obligations(2) | 4,253 | 2,171 | 1,152 | 414 | 516 | |||||||||||||||
Total contractual obligations | $ | 19,955 | $ | 6,361 | $ | 8,755 | $ | 4,323 | $ | 516 | ||||||||||
(1) | Consists of contractual obligations for office space under noncancelable operating leases, net of sublease income. |
(2) | Consists of minimum noncancelable financial commitments primarily related to fees owed to certain third party content providers, regardless of usage level. |
At June 30, 2016, we had a liability for unrecognized tax benefits and an accrual for the payment of related interest and penalties totaling $2.2 million. Due to uncertainties related to these tax matters, we are unable to make a reasonably reliable estimate of when cash settlements with the taxing authority will occur.
In September 2015, we entered into an agreement with Huazhong, a subsidiary of a publicly traded automotive OEM supplier in China, whereby we and Huazhong agreed to form a joint venture limited liability company in China for the development, manufacture and sales of auto entertainment systems. We agreed to invest RMB 9.95 million (approximately $1.5 million as of June 30, 2016) in cash, which is expected to represent 19.9% of the equity interests of the joint venture. We and Huazhong also agreed to negotiate a Technology License Agreement, or TLA, whereby we will license our existing navigation platform technologies to the joint venture in exchange for a RMB 5.0 million (approximately $0.8 million as of June 30, 2016) license fee.
We have not made any capital contributions to the joint venture, and the parties are currently renegotiating the nature, timing and amounts of capital to be contributed. Accordingly, the joint venture has not been formed. In December 2015, we and Huazhong completed the TLA with a term of ten years. In addition, we and Huazhong negotiated a Technology Development Service Agreement, whereby we will provide the joint venture with specified technical services in exchange for a non-
60
refundable technical services fee, subject to the completion of a statement of work by the parties. The TLA and Technology Development Service Agreement will not be effective until the joint venture is formed.
Warranties and indemnifications
Our agreements with our customers generally include certain provisions for indemnifying them against liabilities if our navigation services or products infringe a third party’s intellectual property rights or for other specified reasons. We have in the past received indemnification requests or notices of their intent to seek indemnification in the future from our customers with respect to litigation in which our customers have been named as defendants. See Part I, Item 3, “Legal Proceedings.” As it relates to past indemnification requests or notices, in certain situations we have agreed to defend or indemnify our customers for the indemnity demands. For those notices where we have not agreed to provide indemnity or defense to date, or future demands for indemnity, we may in the future agree to defend and indemnify our customers, irrespective of whether we believe that we have an obligation to indemnify them or whether we believe our navigation services and products infringe the asserted intellectual property rights. Alternatively, we may reject certain of our customers’ indemnity demands, including the outstanding demands, which may lead to disputes with our customers, negatively impact our relationships with them or result in litigation against us. Our customers may also claim that any rejection of their indemnity demands constitutes a material breach of our agreements with them, allowing them to terminate such agreements. If, as a result of indemnity demands, we make substantial payments, our relationships with our customers are negatively impacted, or any of our customer agreements is terminated, our business, operating results and financial condition could be materially harmed. As of June 30, 2016, any costs in connection with such indemnity demands which are probable and estimable have been recorded in our consolidated financial statements.
We have agreed to indemnify our directors, officers and certain other employees for certain events or occurrences, subject to certain limits, while such persons are or were serving at our request in such capacity. We may terminate the indemnification agreements with these persons upon the termination of their services with us, but termination will not affect claims for indemnification related to events occurring prior to the effective date of termination. The maximum amount of potential future indemnification is unlimited. We have a director and officer insurance policy that limits our potential exposure. We believe the fair value of these indemnification agreements is minimal. We have not recorded any liabilities for these agreements as of June 30, 2016.
Off-balance sheet arrangements
During fiscal 2016, 2015 and 2014, we did not have any relationships with unconsolidated entities or financial partnerships, such as structured finance or special purpose entities, which would have been established for the purpose of facilitating off-balance sheet arrangements or other contractually narrow or limited purposes.
Recent accounting pronouncements
See Part IV., Item 15 (a) 1. Financial Statements, Note 1 Summary of business and significant accounting policies, "Recent accounting pronouncements."
ITEM 7A. | QUANTITATIVE AND QUALITATIVE DISCLOSURES ABOUT MARKET RISK |
Interest rate sensitivity. The primary objectives of our investment activities are to preserve principal, provide liquidity and maximize income without significantly increasing risk. By policy, we do not enter into investments for trading or speculative purposes. Some of the securities we invest in are subject to market risk. This means that a change in prevailing interest rates may cause the fair value of the investment to fluctuate. To minimize this risk, we invest in a variety of securities, which primarily consist of money market funds, commercial paper, municipal securities and other debt securities of domestic corporations. Due to the nature of these investments and relatively short duration of the underlying securities, we believe that we do not have any material exposure to changes in the fair value of our investment portfolio as a result of changes in interest rates. Declines in interest rates, however, will reduce future interest income. A 10% appreciation or depreciation in interest rates in fiscal 2016 would not have had a material impact on our interest income or the fair value of our marketable securities.
Foreign currency risk. A substantial majority of our revenue has been generated to date from our end users in the United States and, as such, our revenue has not been substantially exposed to fluctuations in currency exchange rates. However, some of our contracts with our customers outside of the United States are denominated in currencies other than the U.S. dollar and therefore expose us to foreign currency risk. Should the revenue generated outside of the United States grow in absolute
61
amounts and as a percentage of our revenue, we will increasingly be exposed to foreign currency exchange risks. In addition, a portion of our operating expenses are incurred outside the United States, are denominated in foreign currencies and are subject to changes in foreign currency exchange rates, particularly the RMB and the Romanian Leu. Additionally, changes in foreign currency exchange rates may cause us to recognize transaction gains and losses in our statement of operations.
To date, we have not used any foreign currency forward contracts or similar instruments to attempt to mitigate our exposure to changes in foreign currency rates.
ITEM 8. | FINANCIAL STATEMENTS AND SUPPLEMENTARY DATA |
The response to this item is submitted as a separate section of this Form 10-K. See Part IV, Item 15.
ITEM 9. | CHANGES IN AND DISAGREEMENTS WITH ACCOUNTANTS ON ACCOUNTING AND FINANCIAL DISCLOSURE |
None.
ITEM 9A. | CONTROLS AND PROCEDURES |
Evaluation of Disclosure Controls and Procedures
Our management, with the participation of our chief executive officer and our chief financial officer, evaluated the effectiveness of our disclosure controls and procedures as of June 30, 2016. The term “disclosure controls and procedures,” as defined in Rules 13a-15(e) and 15d-15(e) under the Exchange Act, means controls and other procedures of a company that are designed to ensure that information required to be disclosed by a company in the reports that it files or submits under the Exchange Act is recorded, processed, summarized and reported, within the time periods specified in the SEC’s rules and forms. Disclosure controls and procedures include, without limitation, controls and procedures designed to ensure that information required to be disclosed by a company in the reports that it files or submits under the Exchange Act is accumulated and communicated to the company’s management, including its principal executive and principal financial officers, as appropriate to allow timely decisions regarding required disclosure. Management recognizes that any controls and procedures, no matter how well designed and operated, can provide only reasonable assurance of achieving their objectives and management necessarily applies its judgment in evaluating the cost-benefit relationship of possible controls and procedures. Based on the evaluation of our disclosure controls and procedures as of June 30, 2016, our chief executive officer and chief financial officer concluded that, as of such date, our disclosure controls and procedures were effective at the reasonable assurance level.
Management’s Report on Internal Control Over Financial Reporting
The SEC, as required by Section 404 of the Sarbanes-Oxley Act, adopted rules requiring every company that files reports with the SEC to include a management report on such company’s internal control over financial reporting in its annual report. In addition, our independent registered public accounting firm must attest to the effectiveness of our internal control over financial reporting.
Our management is responsible for establishing and maintaining adequate internal control over financial reporting to provide reasonable assurance regarding the reliability of our financial reporting and the preparation of financial statements for external purposes in accordance with generally accepted accounting principles.
Management assessed our internal control over financial reporting as of June 30, 2016. Management based its assessment on criteria established in the 2013 Internal Control—Integrated Framework issued by the Committee of Sponsoring Organizations of the Treadway Commission. Based on our assessment, management has concluded that our internal control over financial reporting was effective as of June 30, 2016.
Grant Thornton LLP, an independent registered public accounting firm, has issued a report on our internal control over financial reporting, which is included below.
62
Changes in Internal Control over Financial Reporting
There were no changes in our internal control over financial reporting that occurred during the three months ended June 30, 2016 that have materially affected, or are reasonably likely to materially affect, our internal control over financial reporting.
Limitations on the Effectiveness of Controls
Control systems, no matter how well conceived and operated, are designed to provide a reasonable, but not an absolute, level of assurance that the objectives of the control system are met. Further, the design of a control system must reflect the fact that there are resource constraints, and the benefits of controls must be considered relative to their costs. Because of the inherent limitations in all control systems, no evaluation of controls can provide absolute assurance that all control issues and instances of fraud, if any, have been detected. Because of the inherent limitations in any control system, misstatements due to error or fraud may occur and not be detected.
63
Report of Independent Registered Public Accounting Firm
Board of Directors and Stockholders
Telenav, Inc.
We have audited the internal control over financial reporting of Telenav, Inc. (a Delaware corporation) and subsidiaries (the “Company”) as of June 30, 2016, based on criteria established in the 2013 Internal Control—Integrated Framework issued by the Committee of Sponsoring Organizations of the Treadway Commission (COSO). The Company’s management is responsible for maintaining effective internal control over financial reporting and for its assessment of the effectiveness of internal control over financial reporting, included in the accompanying Management’s Report on Internal Control Over Financial Reporting. Our responsibility is to express an opinion on the Company’s internal control over financial reporting based on our audit.
We conducted our audit in accordance with the standards of the Public Company Accounting Oversight Board (United States). Those standards require that we plan and perform the audit to obtain reasonable assurance about whether effective internal control over financial reporting was maintained in all material respects. Our audit included obtaining an understanding of internal control over financial reporting, assessing the risk that a material weakness exists, testing and evaluating the design and operating effectiveness of internal control based on the assessed risk, and performing such other procedures as we considered necessary in the circumstances. We believe that our audit provides a reasonable basis for our opinion.
A company’s internal control over financial reporting is a process designed to provide reasonable assurance regarding the reliability of financial reporting and the preparation of financial statements for external purposes in accordance with generally accepted accounting principles. A company’s internal control over financial reporting includes those policies and procedures that (1) pertain to the maintenance of records that, in reasonable detail, accurately and fairly reflect the transactions and dispositions of the assets of the company; (2) provide reasonable assurance that transactions are recorded as necessary to permit preparation of financial statements in accordance with generally accepted accounting principles, and that receipts and expenditures of the company are being made only in accordance with authorizations of management and directors of the company; and (3) provide reasonable assurance regarding prevention or timely detection of unauthorized acquisition, use, or disposition of the company’s assets that could have a material effect on the financial statements.
Because of its inherent limitations, internal control over financial reporting may not prevent or detect misstatements. Also, projections of any evaluation of effectiveness to future periods are subject to the risk that controls may become inadequate because of changes in conditions, or that the degree of compliance with the policies or procedures may deteriorate.
In our opinion, the Company maintained, in all material respects, effective internal control over financial reporting as of June 30, 2016, based on criteria established in the 2013 Internal Control-Integrated Framework issued by COSO.
We also have audited, in accordance with the standards of the Public Company Accounting Oversight Board (United States), the consolidated financial statements of the Company as of and for the year ended June 30, 2016, and our report dated August 22, 2016 expressed an unqualified opinion on those financial statements.
/s/ GRANT THORNTON LLP | |
San Jose, California August 22, 2016 | |
64
ITEM 9B. | OTHER INFORMATION |
Not applicable.
PART III.
ITEM 10. | DIRECTORS, EXECUTIVE OFFICERS AND CORPORATE GOVERNANCE |
Pursuant to General Instruction G(3) of Form 10-K, the information required by this Item 10 relating to our executive officers is included under the caption “Executive Officers of the Registrant” in Part I of this Form 10-K.
The other information required by this Item 10 is incorporated by reference to our Proxy Statement for the 2016 Annual Meeting of Stockholders (to be filed with the Securities and Exchange Commission within 120 days of our June 30, 2016 fiscal year end) under the headings “Election of Directors,” “Corporate Governance,” and “Section 16(a) Beneficial Ownership Reporting Compliance.”
ITEM 11. | EXECUTIVE COMPENSATION |
The information required by this Item 11 is incorporated by reference to our Proxy Statement for the 2016 Annual Meeting of Stockholders (to be filed with the Securities and Exchange Commission within 120 days of our June 30, 2016 fiscal year end) under the headings “Corporate Governance,” “Executive Compensation,” and “Compensation Committee Report.”
ITEM 12. | SECURITY OWNERSHIP OF CERTAIN BENEFICIAL OWNERS AND MANAGEMENT AND RELATED STOCKHOLDER MATTERS |
The information required by this Item 12 is incorporated by reference to our Proxy Statement for the 2016 Annual Meeting of Stockholders (to be filed with the Securities and Exchange Commission within 120 days of our June 30, 2016 fiscal year end) under the headings “Security Ownership of Certain Beneficial Owners and Management” and “Equity Compensation Plan Information.”
ITEM 13. | CERTAIN RELATIONSHIPS AND RELATED TRANSACTIONS, AND DIRECTOR INDEPENDENCE |
The information required by this Item 13 is incorporated by reference to our Proxy Statement for the 2016 Annual Meeting of Stockholders (to be filed with the Securities and Exchange Commission within 120 days of our June 30, 2016 fiscal year end) under the headings “Corporate Governance” and “Certain Relationships and Related Party Transactions.”
ITEM 14. | PRINCIPAL ACCOUNTING FEES AND SERVICES |
The information required by this Item 14 is incorporated by reference to our Proxy Statement for the 2016 Annual Meeting of Stockholders (to be filed with the Securities and Exchange Commission within 120 days of our June 30, 2016 fiscal year end) under the heading “Ratification of Appointment of Independent Registered Public Accounting Firm.”
65
PART IV.
ITEM 15. | EXHIBITS, FINANCIAL STATEMENT SCHEDULES |
(a) 1. Financial Statements
We have filed the consolidated financial statements listed in the Index to Consolidated Financial Statements of Telenav, Inc. on page F-1 as a part of this Form 10-K.
2. Financial Statement Schedule
Schedule II—Valuation and Qualifying Accounts is set forth on page [F-36] of this Form 10-K. All other schedules are omitted because they are not applicable or the required information is shown in the Consolidated Financial Statements and the Notes thereto.
3. Exhibits
See Item 15(b) below.
(b) Exhibits
The following exhibits are filed herewith or are incorporated by reference to exhibits previously filed with the U.S. Securities and Exchange Commission.
Exhibit Number | Description | Incorporated by Reference From Form | Incorporated by Reference From Exhibit Number | Date Filed | ||||
3.1 | Second Amended and Restated Certificate of Incorporation of TeleNav, Inc. filed on May 18, 2010. | 10-K | 3.1 | 9/24/2010 | ||||
3.1.1 | Certificate of Amendment of Second Amended and Restated Certificate of Incorporation of Telenav, Inc. filed on November 27, 2012. | 8-K | 3.1.1 | 12/3/2012 | ||||
3.2 | Amended and Restated Bylaws of TeleNav, Inc. effective as of May 18, 2010. | 10-K | 3.2 | 9/24/2009 | ||||
4.1 | Specimen Common Stock Certificate of TeleNav, Inc. | S-1/A | 4.1 | 1/5/2010 | ||||
4.2 | Fifth Amended and Restated Investors’ Rights Agreement, dated April 14, 2009, between TeleNav, Inc. and certain holders of TeleNav, Inc.’s capital stock named therein. | S-1 | 4.2 | 10/30/2009 | ||||
10.1 | Form of Indemnification Agreement between Registrant and its directors and officers. | S-1 | 10.1 | 10/30/2009 | ||||
10.2# | 1999 Stock Option Plan and forms of agreement thereunder. | S-1 | 10.2 | 10/30/2009 | ||||
10.3# | 2002 Executive Stock Option Plan and forms of agreement thereunder. | S-1 | 10.3 | 10/30/2009 | ||||
10.4# | 2009 Equity Incentive Plan and forms of agreement thereunder. | S-1 | 10.4 | 10/30/2009 | ||||
10.4.1# | 2009 Equity Incentive Plan, as amended. | 8-K | 10.4.1 | 12/3/2012 | ||||
10.4.2# | 2009 Equity Incentive Plan, amended and restated as of January 26, 2016. | Filed herewith | ||||||
10.6# | Employment Agreement, dated as of April 7, 2009, between TeleNav, Inc. and Loren Hillberg. | S-1 | 10.6 | 10/30/2009 | ||||
10.6.1# | Amended and Restated Employment Agreement, dated as of October 28, 2009, between TeleNav, Inc. and Loren Hillberg. | S-1 | 10.6.1 | 10/30/2009 | ||||
66
Exhibit Number | Description | Incorporated by Reference From Form | Incorporated by Reference From Exhibit Number | Date Filed | ||||
10.7# | Employment Agreement, dated as of May 4, 2005, between TeleNav, Inc. and Hassan Wahla. | S-1 | 10.7 | 10/30/2009 | ||||
10.8# | Employment Agreement, dated October 28, 2009, between TeleNav, Inc. and H.P. Jin. | S-1 | 10.8 | 10/30/2009 | ||||
10.9# | Form of Employment Agreement between TeleNav, Inc. and each of Y.C. Chao, Salman Dhanani, Robert Rennard and Hassan Wahla. | S-1 | 10.9 | 10/30/2009 | ||||
10.15† | License Agreement effective as of July 1, 2009, by and between TeleNav, Inc. and Tele Atlas North America, Inc. | S-1/A | 10.15 | 12/8/2009 | ||||
10.15.1† | Amendment No.1 effective as of March 1, 2010 to the License Agreement, dated as of July 1, 2009, by and between TeleNav, Inc. and Tele Atlas North America, Inc. | S-1/A | 10.15.1 | 4/26/2010 | ||||
10.15.2† | Amendment No. 2 effective as of August 1, 2010 to the License Agreement, dated as of July 1, 2009, as amended, by and between TeleNav, Inc. and Tele Atlas North America, Inc. | 10-Q | 10.15.2 | 11/15/2010 | ||||
10.15.3† | Amendment No. 3 effective as of December 14, 2010 to the License Agreement, dated as of July 1, 2009, as amended, by and between TeleNav, Inc. and Tele Atlas North America, Inc. | 10-K | 10.15.3 | 9/7/2012 | ||||
10.15.4† | Amendment No. 4 effective as of November 21, 2011 to the License Agreement, dated as of July 1, 2009, as amended, by and between TeleNav, Inc. and TomTom North America, Inc. | 10-K | 10.15.4 | 9/7/2012 | ||||
10.15.5† | Amendment No. 5 effective as of March 24, 2011 to the License Agreement, dated as of July 1, 2009, as amended, by and between TeleNav, Inc. and TomTom North America, Inc. | 10-K | 10.15.5 | 9/7/2012 | ||||
10.15.6† | Amendment No. 6 effective as of July 1, 2012 to the License Agreement, dated as of July 1, 2009, as amended, by and between TeleNav, Inc. and TomTom North America, Inc. | 10-K | 10.15.6 | 9/7/2012 | ||||
10.15.7† | Amendment No. 7 effective as of November 1, 2012 to the License Agreement, dated as of July 1, 2009, as amended, by and between Telenav, Inc. and TomTom North America, Inc. | 10-Q | 10.15.7 | 2/8/2013 | ||||
10.15.8† | Amendment No. 8 effective as of November 1, 2012 to the License Agreement, dated as of July 1, 2009, as amended, by and between Telenav, Inc. and TomTom North America, Inc. | 10-Q | 10.15.8 | 2/8/2013 | ||||
10.16† | Data License Agreement, dated as of December 1, 2002, by and between Televigation, Inc. and Navigation Technologies Corporation. | S-1/A | 10.16 | 2/2/2010 | ||||
10.16.1† | Third Amendment dated December 22, 2004 to the Data License Agreement, dated as of December 1, 2002, by and between Televigation, Inc. and NAVTEQ North America, LLC. | S-1/A | 10.16.1 | 4/26/2010 | ||||
10.16.2† | Fourth Amendment dated May 18, 2007 to the Data License Agreement, dated as of December 1, 2002, by and between TeleNav, Inc. and NAVTEQ North America, LLC. | S-1/A | 10.16.2 | 2/2/2010 | ||||
10.16.3† | Fifth Amendment dated January 15, 2008 to the Data License Agreement, dated as of December 1, 2002, by and between TeleNav, Inc. and NAVTEQ North America, LLC. | S-1/A | 10.16.3 | 2/2/2010 | ||||
10.16.4† | Seventh Amendment dated December 16, 2008 to the Data License Agreement, dated as of December 1, 2002, by and among TeleNav, Inc., NAVTEQ Europe B.V. and NAVTEQ North America, LLC. | S-1/A | 10.16.4 | 4/26/2010 | ||||
10.16.5 | Eighth Amendment dated December 15, 2008 to the Data License Agreement, dated as of December 1, 2002, by and between TeleNav, Inc. and NAVTEQ North America, LLC. | S-1 | 10.16.5 | 10/30/2009 | ||||
10.16.6† | Territory License No. 1, dated as of December 1, 2002, by and between Televigation, Inc. and Navigation Technologies Corporation. | S-1/A | 10.16.6 | 4/26/2010 | ||||
10.16.7† | Territory License No. 2, dated as of June 30, 2003, by and between Televigation, Inc. and NAVTEQ North America, LLC. | S-1/A | 10.16.7 | 4/26/2010 | ||||
67
Exhibit Number | Description | Incorporated by Reference From Form | Incorporated by Reference From Exhibit Number | Date Filed | ||||
10.16.8† | Territory License No. 3, dated as of February 7, 2006, by and between TeleNav, Inc. and NAVTEQ North America, LLC. | S-1/A | 10.16.8 | 4/26/2010 | ||||
10.16.9† | Territory License No. 5, dated as of March 6, 2006, by and between TeleNav, Inc. and NAVTEQ North America, LLC. | S-1/A | 10.16.9 | 4/26/2010 | ||||
10.16.10† | Territory License No. 6, dated as of May 18, 2007, by and between TeleNav, Inc. and NAVTEQ North America, LLC. | S-1/A | 10.16.10 | 4/26/2010 | ||||
10.16.11† | Territory License No. 7, dated as of May 18, 2007, by and between TeleNav, Inc. and NAVTEQ North America, LLC. | S-1/A | 10.16.11 | 4/26/2010 | ||||
10.16.12† | Ninth Amendment dated February 25, 2010 to the Data License Agreement, dated as of December 1, 2002 by and between TeleNav, Inc. and NAVTEQ North America, LLC. | S-1/A | 10.16.12 | 4/26/2010 | ||||
10.16.13 | Tenth Amendment dated June 1, 2010 to the Data License Agreement, dated as of December 1, 2002, by and between TeleNav, Inc., NAVTEQ North America, LLC, and NAVTEQ Europe B.V. | 10-Q | 10.16.13 | 5/7/2012 | ||||
10.16.14† | Eleventh Amendment dated September 16, 2010 to the Data License Agreement, dated as of December 1, 2002, by and between TeleNav, Inc., NAVTEQ North America, LLC, and NAVTEQ Europe B.V. | 10-Q | 10.16.14 | 5/7/2012 | ||||
10.16.15† | Twelfth Amendment dated September 28, 2010 to the Data License Agreement, dated as of December 1, 2002, by and between TeleNav, Inc., NAVTEQ North America, LLC, and NAVTEQ Europe B.V. | 10-Q | 10.16.15 | 5/7/2012 | ||||
10.16.16† | Fourteenth Amendment dated September 30, 2011 to the Data License Agreement, dated as of December 1, 2002, by and between TeleNav, Inc., NAVTEQ North America, LLC, and NAVTEQ Europe B.V. | 10-Q | 10.16.16 | 5/7/2012 | ||||
10.16.17† | Territory License No. 8, dated December 1, 2011, by and between TeleNav, Inc., NAVTEQ North America, LLC, and NAVTEQ Europe B.V. | 10-Q | 10.16.17 | 5/7/2012 | ||||
10.16.18† | First Amendment dated February 7, 2012 to Territory License No. 8, dated as of December 1, 2011, by and between TeleNav, Inc., NAVTEQ North America, LLC and NAVTEQ Europe B.V. | 10-Q | 10.16.18 | 5/7/2012 | ||||
10.16.19† | Second Amendment dated October 18, 2012 to Territory License No. 8, dated December 1, 2011 to the Data License Agreement, dated as of December 1, 2002, by and between Telenav, Inc., NAVTEQ North America, LLC and NAVTEQ Europe B.V. | 10-Q | 10.16.19 | 2/8/2013 | ||||
10.16.20 | Fifteenth Amendment dated October 30, 2012 to the Data License Agreement, dated as of December 1, 2002, by and between Telenav, Inc., NAVTEQ North America, LLC and NAVTEQ Europe B.V. | 10-Q | 10.16.20 | 2/8/2013 | ||||
10.16.21† | Third Amendment dated December 10, 2012 to Territory License No. 8, dated December 1, 2011 to the Data License Agreement, dated as of December 1, 2002, by and between Telenav, Inc., NAVTEQ North America, LLC and NAVTEQ Europe B.V. | 10-Q | 10.16.21 | 2/8/2013 | ||||
10.16.22† | Seventeenth Amendment dated June 27, 2013 to the Data License Agreement, dated as of December 1, 2002, by and between HERE North America, LLC (f/k/a NAVTEQ North America, LLC) (formerly Navigation Technologies Corporation) and Telenav, Inc. | 10-Q/A | 10.16.22 | 2/27/2014 | ||||
10.16.23† | Fourth Amendment dated October 2, 2013 to Territory License No. 8, dated December 1, 2011 to the Data License Agreement, dated as of December 1, 2002, by and between Telenav, Inc., and Navigation Technologies Corporation (“NTC”), which was subsequently assigned by NTC to HERE North America, LLC (f/k/a NAVTEQ North America, LLC). | 10-Q | 10.16.23 | 11/8/2013 | ||||
10.16.24 | Eighteenth Amendment dated January 28, 2014 to the Data License Agreement, dated as of December 1, 2002, by and between HERE North America, LLC (f/k/a NAVTEQ North America, LLC) (formerly Navigation Technologies Corporation) and Telenav, Inc. | 10-Q | 10.16.24 | 2/6/2014 | ||||
68
Exhibit Number | Description | Incorporated by Reference From Form | Incorporated by Reference From Exhibit Number | Date Filed | ||||
10.16.25† | Territory License No. 9, dated February 1, 2014 by and between HERE North America, LLC, HERE Europe B.V., NAVTEQ Korea Co. Ltd, and Telenav, Inc. | 10-Q | 10.16.25 | 5/8/2014 | ||||
10.16.26† | General License Agreement, dated February 10, 2014 by and between HERE North America, LLC, and Telenav, Inc. | 10-Q | 10.16.26 | 5/8/2014 | ||||
10.16.27† | Nineteenth Amendment dated May 20, 2014 to the Data License Agreement, dated as of December 1, 2002, by and between HERE North America, LLC (f/k/a NAVTEQ North America, LLC) (formerly Navigation Technologies Corporation) and Telenav, Inc. | 10-K | 10.16.27 | 8/22/2014 | ||||
10.16.28† | First Amendment, dated June 12, 2014, to Territory License No. 9, dated as of February 1, 2014, by and between Telenav, Inc., and HERE North America, LLC (f/k/a NAVTEQ North America, LLC).” | 10-K | 10.16.28 | 8/22/2014 | ||||
10.16.29† | Amended and Restated Territory License No. 8, dated August 18, 2014, by and between Telenav, Inc., HERE North America, LLC (f/k/a NAVTEQ North America, LLC), and Here Europe B.V. (f/k/a NAVTEQ Europe B.V.) | 10-Q | 10.16.29 | 11/6/2014 | ||||
10.16.30† | Patent License Agreement, dated January 1, 2014, by and between Telenav, Inc., and HERE Global B.V. (f/k/a Navteq B.V.) | 10-Q | 10.16.30 | 2/5/2015 | ||||
10.16.31† | Territory License No. 11, dated April 3, 2015 by and between HERE North America, LLC, HERE Europe B.V., and Telenav, Inc. | 10-K | 10.16.31 | 8/24/2015 | ||||
10.16.32† | First Amendment to Amended and Restated Territory License No. 8, dated November 4, 2015 by and between Telenav, Inc., and HERE North America, LLC (f/k/a NAVTEQ North America, LLC). | 10-Q | 10.16.32 | 2/9/2016 | ||||
10.16.33† | First Amendment to General License Agreement, dated November 12, 2015 by and between HERE North America, LLC, and Telenav, Inc. | 10-Q | 10.16.33 | 2/9/2016 | ||||
10.16.34† | Territory License No. 10, dated March 15, 2016, by and between HERE North America, LLC, HERE Europe B.V., HERE Solutions Korea Co. Ltd, and Telenav, Inc. | 10-Q | 10.16.34 | 5/9/2016 | ||||
10.21# | Form of First Year Executive Employment Agreement. | 10-Q | 10.21 | 11/7/2011 | ||||
10.22# | Retention Letter dated March 28, 2012 from TeleNav, Inc. to Michael W. Strambi. | 10-Q | 10.22 | 5/7/2012 | ||||
10.23# | Employment Agreement dated March 28, 2012 between TeleNav, Inc. and Michael W. Strambi. | 10-Q | 10.23 | 5/7/2012 | ||||
10.23.1# | Amendment No. 1 dated December 20, 2013 to the Employment Agreement dated March 28, 2012 between TeleNav, Inc. and Michael W. Strambi. | 10-Q | 10.23.1 | 2/6/2014 | ||||
10.25# | Director Offer Letter dated July 30, 2012 between TeleNav, Inc. and Ken Xie. | 10-K | 10.25 | 9/7/2012 | ||||
10.26† | SYNC Generation 2 On-Board Navigation Agreement dated October 12, 2009 by and between TeleNav, Inc. and Ford Motor Company. | 10-K | 10.26 | 9/7/2012 | ||||
10.26.1† | Amendment No. 1 effective August 10, 2010 to the SYNC Generation 2 On-Board Navigation Agreement dated October 12, 2009 by and between TeleNav, Inc. and Ford Motor Company. | 10-K | 10.26.1 | 9/7/2012 | ||||
10.26.2† | Amendment No. 2 effective February 3, 2011 to the SYNC Generation 2 On-Board Navigation Agreement dated October 12, 2009, as amended, by and between TeleNav, Inc. and Ford Motor Company. | 10-K | 10.26.2 | 9/7/2012 | ||||
10.26.3† | Amendment No. 3 effective February 3, 2011 to the SYNC Generation 2 On-Board Navigation Agreement dated October 12, 2009, as amended, by and between TeleNav, Inc. and Ford Motor Company. | 10-K | 10.26.3 | 9/7/2012 | ||||
69
Exhibit Number | Description | Incorporated by Reference From Form | Incorporated by Reference From Exhibit Number | Date Filed | ||||
10.26.4† | Amendment No. 4 effective March 31, 2011 to the SYNC Generation 2 On-Board Navigation Agreement dated October 12, 2009, as amended, by and between TeleNav, Inc. and Ford Motor Company. | 10-K | 10.26.4 | 9/7/2012 | ||||
10.26.5† | Amendment No. 5 effective March 31, 2011 to the SYNC Generation 2 On-Board Navigation Agreement dated October 12, 2009, as amended, by and between TeleNav, Inc. and Ford Motor Company. | 10-K | 10.26.5 | 9/7/2012 | ||||
10.26.6† | Amendment No. 6 effective March 31, 2011 to the SYNC Generation 2 On-Board Navigation Agreement dated October 12, 2009, as amended, by and between TeleNav, Inc. and Ford Motor Company. | 10-K | 10.26.6 | 9/7/2012 | ||||
10.26.7† | Amendment No. 7 effective November 15, 2011 to the SYNC Generation 2 On-Board Navigation Agreement dated October 12, 2009, as amended, by and between TeleNav, Inc. and Ford Motor Company. | 10-K | 10.26.7 | 9/7/2012 | ||||
10.26.8† | Amendment No. 8 effective January 1, 2012 to the SYNC Generation 2 On-Board Navigation Agreement dated October 12, 2009, as amended, by and between TeleNav, Inc. and Ford Motor Company. | 10-K | 10.26.8 | 9/7/2012 | ||||
10.26.9† | Amendment No. 9 effective May 11, 2012 to the SYNC Generation 2 On-Board Navigation Agreement dated October 12, 2009, as amended, by and between TeleNav, Inc. and Ford Motor Company. | 10-K | 10.26.9 | 9/7/2012 | ||||
10.26.10† | Amendment No. 10 effective February 3, 2011 to the SYNC Generation 2 On-Board Navigation Agreement dated October 12, 2009, as amended, by and between Telenav, Inc. and Ford Motor Company. | 10-Q | 10.26.10 | 5/8/2013 | ||||
10.26.11† | Amendment No. 11 effective February 3, 2011 to the SYNC Generation 2 On-Board Navigation Agreement dated October 12, 2009, as amended, by and between Telenav, Inc. and Ford Motor Company. | 10-K | 10.26.11 | 8/30/2013 | ||||
10.26.12† | Amendment No. 12 effective February 28, 2013 to the SYNC Generation 2 On-Board Navigation Agreement dated October 12, 2009, as amended, by and between Telenav, Inc. and Ford Motor Company. | 10-K | 10.26.12 | 8/30/2013 | ||||
10.26.13† | Amendment No. 13 effective June 17, 2013 to the SYNC Generation 2 On-Board Navigation Agreement dated October 12, 2009, as amended, by and between Telenav, Inc. and Ford Motor Company. | 10-K | 10.26.13 | 8/30/2013 | ||||
10.26.14† | Amendment No. 14 effective October 1, 2013 to the SYNC Generation 2 On-Board Navigation Agreement dated October 12, 2009, as amended, by and between Telenav, Inc. and Ford Motor Company. | 10-Q | 10.26.14 | 11/8/2013 | ||||
10.26.15† | Amendment No. 15 effective November 18, 2013 to the SYNC Generation 2 On-Board Navigation Agreement dated October 12, 2009, as amended, by and between Telenav, Inc. and Ford Motor Company. | 10-Q | 10.26.15 | 2/6/2014 | ||||
10.26.16† | Amendment No. 16 effective April 17, 2014 to the SYNC Generation 2 On-Board Navigation Agreement dated October 12, 2009, as amended, by and between Telenav, Inc. and Ford Motor Company | 10-Q | 10.26.16 | 5/8/2014 | ||||
10.26.17† | Amendment No. 17 effective January 1, 2015 to the SYNC Generation 2 On-Board Navigation Agreement dated October 12, 2009, as amended, by and between Telenav, Inc. and Ford Motor Company | 10-Q | 10.26.17 | 5/7/2015 | ||||
10.26.18† | Amendment No. 18 effective June 17, 2015 to the SYNC Generation 2 On-Board Navigation Agreement dated October 12, 2009, by and between Telenav, Inc. and Ford Motor Company | 10-Q | 10.26.18 | 11/9/2015 | ||||
10.28# | Summary of Nonemployee Director Compensation. | 8-K | 10.28 | 12/3/2012 | ||||
10.29# | Amended and Restated Telenav, Inc. 2011 Stock Option and Grant Plan. | S-8 | 4.2 | 10/29/2012 | ||||
70
Exhibit Number | Description | Incorporated by Reference From Form | Incorporated by Reference From Exhibit Number | Date Filed | ||||
10.32# | Form of Restricted Stock Unit Award Agreement under the 2009 Equity Incentive Plan. | 10-Q | 10.32 | 2/5/2015 | ||||
10.33# | Form of Restricted Stock Unit Award Agreement under the Amended and Restated Telenav, Inc. 2011 Stock Option and Grant Plan. | 10-Q | 10.33 | 2/5/2015 | ||||
10.35# | Amended and Restated Employment Agreement, dated September 30, 2015, by and between Telenav, Inc. and Rohan Chandran. | 10-Q | 10.35 | 11/9/2015 | ||||
10.35.1# | Severance Agreement and General Release, dated March 18, 2016, by and between Telenav, Inc. and Rohan Chandran. | Filed herewith | ||||||
10.36 | Sublease, dated as of November 11, 2015, between Avaya Inc. and Telenav, Inc. | 10-Q | 10.36 | 2/9/2016 | ||||
10.37 | Landlord Consent to Sublease, dated as of December 18, 2015, by and among The Prudential Insurance Company of America, Avaya Inc., and Telenav, Inc. | 10-Q | 10.37 | 2/9/2016 | ||||
10.38 | Lease Termination Agreement dated October 16, 2015, by and between St. Paul Fire and Marine Insurance Company and Telenav, Inc. | 8-K | 10.1 | 10/22/2015 | ||||
10.39 | Shanghai Real Estate Lease Agreement, dated as of March 4, 2016, by and between TeleNav Shanghai Inc. and Shanghai Dongfang Weijing Culture Development Co. | Filed herewith | ||||||
10.40 | Letter Agreement, dated as of September 23, 2015, among Telenav, Inc., Nokomis Capital, L.L.C. and certain other parties. | 8-K | 10.1 | 9/25/2015 | ||||
21.1 | Subsidiaries of the registrant. | Filed herewith | ||||||
23.1 | Consent of Independent Registered Public Accounting Firm - Grant Thornton LLP. | Filed herewith | ||||||
23.2 | Consent of Independent Registered Public Accounting Firm -Ernst & Young LLP. | Filed herewith | ||||||
24.1 | Power of Attorney (contained in the signature page to this Form 10-K). | Filed herewith | ||||||
31.1 | Certification Pursuant to 18 U.S.C. Section 1350, as Adopted Pursuant to Section 302 of the Sarbanes-Oxley Act of 2002 of Chief Executive Officer. | Filed herewith | ||||||
31.2 | Certification Pursuant to 18 U.S.C. Section 1350, as Adopted Pursuant to Section 302 of the Sarbanes-Oxley Act of 2002 of Chief Financial Officer. | Filed herewith | ||||||
32.1~ | Certification Pursuant to 18 U.S.C. Section 1350, as Adopted Pursuant to Section 906 of the Sarbanes-Oxley Act of 2002 of Chief Executive Officer. | Filed herewith | ||||||
32.2~ | Certification Pursuant to 18 U.S.C. Section 1350, as Adopted Pursuant to Section 906 of the Sarbanes-Oxley Act of 2002 of Chief Financial Officer. | Filed herewith | ||||||
101.INS* | XBRL Instance Document | Filed herewith | ||||||
101.SCH* | XBRL Taxonomy Extension Schema Document | Filed herewith | ||||||
101.CAL* | XBRL Taxonomy Calculation Linkbase Document | Filed herewith | ||||||
101.DEF* | XBRL Taxonomy Definition Linkbase Document | Filed herewith | ||||||
101.LAB* | XBRL Taxonomy Label Linkbase Document | Filed herewith | ||||||
101.PRE* | XBRL Taxonomy Extension Presentation Linkbase Document | Filed herewith | ||||||
71
# | Management contracts or compensation plans or arrangements in which directors or executive officers are eligible to participate. |
† | Portions of the exhibit have been omitted pursuant to an order granted by the Securities and Exchange Commission for confidential treatment. |
~ | In accordance with Item 601(b)(32)(ii) of Regulation S-K and SEC Release No. 33-8238 and 34-47986, Final Rule: Management’s Reports on Internal Control Over Financial Reporting and Certification of Disclosure in Exchange Act Periodic Reports, the certifications furnished in Exhibits 32.1 and 32.2 hereto are deemed to accompany this Form 10-K and will not be deemed “filed” for purposes of Section 18 of the Exchange Act. Such certifications will not be deemed to be incorporated by reference into any filings under the Securities Act or the Exchange Act, except to the extent that the registrant specifically incorporates it by reference. |
* | XBRL (Extensible Business Reporting Language) information is furnished and not filed or a part of a registration statement or prospectus for purposes of Sections 11 or 12 of the Securities Act, is deemed not filed for purposes of Section 18 of the Exchange Act, and otherwise is not subject to liability under these sections. |
72
SIGNATURES
Pursuant to the requirements of section 13 or 15(d) of the Securities Exchange Act of 1934, the registrant has duly caused this report to be signed on its behalf by the undersigned, thereunto duly authorized.
TELENAV, INC. | |||||
Dated: | August 22, 2016 | By: | /s/ Dr. HP JIN | ||
Dr. HP Jin | |||||
Chairman of the Board of Directors, President and Chief Executive Officer | |||||
POWER OF ATTORNEY
KNOW ALL PERSONS BY THESE PRESENTS, that each person whose signature appears below constitutes and appoints Dr. HP Jin and Michael Strambi, jointly and severally, as his or her true and lawful attorneys-in-fact and agents, with full power of substitution and resubstitution, for him or her and in his or her name, place and stead, in any and all capacities, to sign this Form 10-K, and to file the same, with all exhibits thereto, and other documents in connection therewith, with the Securities and Exchange Commission, granting unto said attorneys-in-fact and agents full power and authority to do and perform each and every act and thing requisite or necessary to be done in and about the premises hereby ratifying and confirming all that said attorneys-in-fact and agents, or his or their substitute or substitutes, may lawfully do or cause to be done by virtue hereof.
Pursuant to the requirements of the Securities Exchange Act of 1934, this report has been signed by the following persons on behalf of the registrant in the capacities and on the dates indicated.
Name and Signature | Title | Date | ||
/s/ Dr. HP JIN | Chairman of the Board of Directors, President and Chief Executive Officer | August 22, 2016 | ||
Dr. HP Jin | (Principal Executive Officer) | |||
/s/ MICHAEL STRAMBI | Chief Financial Officer and Treasurer | August 22, 2016 | ||
Michael Strambi | (Principal Financial and Accounting Officer) | |||
/s/ SAMUEL CHEN | Director | August 22, 2016 | ||
Samuel Chen | ||||
/s/ DOUGLAS MILLER | Director | August 22, 2016 | ||
Douglas Miller | ||||
/s/ RICHARD TODARO | Director | August 22, 2016 | ||
Richard Todaro | ||||
/s/ KEN XIE | Director | August 22, 2016 | ||
Ken Xie | ||||
/s/ JOSEPH M. ZAELIT | Director | August 22, 2016 | ||
Joseph M. Zaelit | ||||
73
FINANCIAL STATEMENTS.
INDEX TO CONSOLIDATED FINANCIAL STATEMENTS OF TELENAV, INC.
Page | ||||
F-1
REPORT OF INDEPENDENT REGISTERED PUBLIC ACCOUNTING FIRM
Board of Directors and Stockholders
Telenav, Inc.
We have audited the accompanying consolidated balance sheets of Telenav, Inc. (a Delaware corporation) and subsidiaries (the “Company”) as of June 30, 2016 and 2015, and the related consolidated statements of operations, comprehensive loss, stockholders’ equity, and cash flows for each of the two years in the period ended June 30, 2016. Our audits of the basic consolidated financial statements included the financial statement schedule listed in the index appearing under Item 15(a)2. These financial statements and financial statement schedule are the responsibility of the Company’s management. Our responsibility is to express an opinion on these financial statements and financial statement schedule based on our audits.
We conducted our audits in accordance with the standards of the Public Company Accounting Oversight Board (United States). Those standards require that we plan and perform the audit to obtain reasonable assurance about whether the financial statements are free of material misstatement. An audit includes examining, on a test basis, evidence supporting the amounts and disclosures in the financial statements. An audit also includes assessing the accounting principles used and significant estimates made by management, as well as evaluating the overall financial statement presentation. We believe that our audits provide a reasonable basis for our opinion.
In our opinion, the consolidated financial statements referred to above present fairly, in all material respects, the financial position of Telenav, Inc. and subsidiaries as of June 30, 2016 and 2015, and the results of their operations and their cash flows for each of the two years in the period ended June 30, 2016 in conformity with accounting principles generally accepted in the United States of America. Also in our opinion, the related financial statement schedule, when considered in relation to the basic consolidated financial statements taken as a whole, presents fairly, in all material respects, the information set forth therein.
We also have audited, in accordance with the standards of the Public Company Accounting Oversight Board (United States), the Company’s internal control over financial reporting as of June 30, 2016, based on criteria established in the 2013 Internal Control-Integrated Framework issued by the Committee of Sponsoring Organizations of the Treadway Commission (COSO), and our report dated August 22, 2016 expressed an unqualified opinion thereon.
/s/ GRANT THORNTON LLP | |
San Jose, California August 22, 2016 | |
F-2
REPORT OF INDEPENDENT REGISTERED PUBLIC ACCOUNTING FIRM
The Board of Directors and Stockholders of Telenav, Inc.
We have audited the accompanying consolidated balance sheet of Telenav, Inc. as of June 30, 2014 and the related consolidated statements of operations, comprehensive loss, stockholders’ equity, and cash flows for the year ended June 30, 2014. Our audit also included the financial statement schedule listed in the Index at Item 15(a)2. These financial statements and schedule are the responsibility of the Company’s management. Our responsibility is to express an opinion on these financial statements and schedule based on our audit.
We conducted our audit in accordance with the standards of the Public Company Accounting Oversight Board (United States). Those standards require that we plan and perform the audit to obtain reasonable assurance about whether the financial statements are free of material misstatement. An audit includes examining, on a test basis, evidence supporting the amounts and disclosures in the financial statements. An audit also includes assessing the accounting principles used and significant estimates made by management, as well as evaluating the overall financial statement presentation. We believe that our audit provides a reasonable basis for our opinion.
In our opinion, the financial statements referred to above present fairly, in all material respects, the consolidated financial position of Telenav, Inc. at June 30, 2014, and the consolidated results of its operations and its cash flows for the year ended June 30, 2014, in conformity with U.S. generally accepted accounting principles. Also, in our opinion, the related financial statement schedule, when considered in relation to the basic financial statements taken as a whole, presents fairly in all material respects the information set forth therein.
/s/ Ernst & Young LLP | |
San Jose, California August 22, 2014 | |
except for Notes 5 and 12, as to which the date is | |
August 24, 2015 | |
F-3
TELENAV, INC.
CONSOLIDATED BALANCE SHEETS
(in thousands, except per share amounts)
June 30, 2016 | June 30, 2015 | |||||||
Assets | ||||||||
Current assets: | ||||||||
Cash and cash equivalents | $ | 21,349 | $ | 18,721 | ||||
Short-term investments | 88,277 | 101,195 | ||||||
Accounts receivable, net of allowances of $111 and $211 at June 30, 2016 and 2015, respectively | 42,216 | 36,493 | ||||||
Deferred income taxes, net | — | 327 | ||||||
Restricted cash | 5,109 | 4,878 | ||||||
Income taxes receivable | 687 | 6,080 | ||||||
Deferred costs | 1,784 | 432 | ||||||
Prepaid expenses and other current assets | 4,448 | 3,856 | ||||||
Total current assets | 163,870 | 171,982 | ||||||
Property and equipment, net | 5,247 | 7,126 | ||||||
Deferred income taxes, non-current | 661 | 443 | ||||||
Goodwill and intangible assets, net | 35,993 | 37,528 | ||||||
Deferred costs, non-current | 10,292 | 2,709 | ||||||
Other assets | 2,184 | 4,134 | ||||||
Total assets | $ | 218,247 | $ | 223,922 | ||||
Liabilities and stockholders’ equity | ||||||||
Current liabilities: | ||||||||
Accounts payable | $ | 4,992 | $ | 830 | ||||
Accrued compensation | 9,308 | 9,628 | ||||||
Accrued royalties | 15,331 | 9,358 | ||||||
Other accrued expenses | 11,635 | 10,918 | ||||||
Deferred revenue | 4,334 | 2,109 | ||||||
Income taxes payable | 88 | 724 | ||||||
Total current liabilities | 45,688 | 33,567 | ||||||
Deferred rent, non-current | 1,124 | 4,858 | ||||||
Deferred revenue, non-current | 19,035 | 4,719 | ||||||
Other long-term liabilities | 2,715 | 4,595 | ||||||
Commitments and contingencies | ||||||||
Stockholders’ equity: | ||||||||
Preferred stock, $0.001 par value: 50,000 shares authorized; no shares issued or outstanding | — | — | ||||||
Common stock, $0.001 par value: 600,000 shares authorized; 42,708 shares and 40,537 shares issued and outstanding at June 30, 2016 and 2015, respectively | 43 | 41 | ||||||
Additional paid-in capital | 149,775 | 140,406 | ||||||
Accumulated other comprehensive income (loss) | (1,767 | ) | (1,540 | ) | ||||
Retained earnings | 1,634 | 37,276 | ||||||
Total stockholders’ equity | 149,685 | 176,183 | ||||||
Total liabilities and stockholders’ equity | $ | 218,247 | $ | 223,922 | ||||
See accompanying Notes to Consolidated Financial Statements.
F-4
TELENAV, INC.
CONSOLIDATED STATEMENTS OF OPERATIONS
(in thousands, except per share amounts)
Fiscal Year Ended | ||||||||||||
June 30, | ||||||||||||
2016 | 2015 | 2014 | ||||||||||
Revenue: | ||||||||||||
Product | $ | 132,454 | $ | 100,768 | $ | 72,747 | ||||||
Services | 50,892 | 59,471 | 77,566 | |||||||||
Total revenue | 183,346 | 160,239 | 150,313 | |||||||||
Cost of revenue: | ||||||||||||
Product | 79,165 | 55,270 | 36,775 | |||||||||
Services | 21,632 | 23,514 | 24,066 | |||||||||
Total cost of revenue | 100,797 | 78,784 | 60,841 | |||||||||
Gross profit | 82,549 | 81,455 | 89,472 | |||||||||
Operating expenses: | ||||||||||||
Research and development | 68,911 | 68,060 | 60,573 | |||||||||
Sales and marketing | 25,587 | 26,975 | 33,138 | |||||||||
General and administrative | 23,994 | 23,606 | 26,176 | |||||||||
Restructuring | (1,362 | ) | 1,150 | 4,412 | ||||||||
Total operating expenses | 117,130 | 119,791 | 124,299 | |||||||||
Loss from operations | (34,581 | ) | (38,336 | ) | (34,827 | ) | ||||||
Other income (expense), net | (229 | ) | 2,267 | 1,288 | ||||||||
Loss before provision (benefit) for income taxes | (34,810 | ) | (36,069 | ) | (33,539 | ) | ||||||
Provision (benefit) for income taxes | 511 | (13,006 | ) | (4,015 | ) | |||||||
Net loss | $ | (35,321 | ) | $ | (23,063 | ) | $ | (29,524 | ) | |||
Net loss per share, basic and diluted | $ | (0.85 | ) | $ | (0.58 | ) | $ | (0.76 | ) | |||
Weighted average shares used in computing net loss per share, basic and diluted | 41,567 | 39,991 | 38,796 | |||||||||
See accompanying Notes to Consolidated Financial Statements.
F-5
TELENAV, INC.
CONSOLIDATED STATEMENTS OF COMPREHENSIVE LOSS
(in thousands)
Fiscal Year Ended | ||||||||||||
June 30, | ||||||||||||
2016 | 2015 | 2014 | ||||||||||
Net loss | $ | (35,321 | ) | $ | (23,063 | ) | $ | (29,524 | ) | |||
Other comprehensive income (loss), net of tax: | ||||||||||||
Foreign currency translation adjustment, net of tax | (512 | ) | (1,698 | ) | 51 | |||||||
Available for sale securities: | ||||||||||||
Unrealized gain (loss) on available-for-sale securities, net of tax | 272 | (156 | ) | 284 | ||||||||
Reclassification adjustments for gain (loss) on available-for-sale securities recognized, net of tax | 13 | (262 | ) | (132 | ) | |||||||
Net increase (decrease) from available-for-sale securities, net of tax | 285 | (418 | ) | 152 | ||||||||
Other comprehensive income (loss), net of tax | (227 | ) | (2,116 | ) | 203 | |||||||
Comprehensive loss | $ | (35,548 | ) | $ | (25,179 | ) | $ | (29,321 | ) | |||
See accompanying Notes to Consolidated Financial Statements.
F-6
TELENAV, INC.
CONSOLIDATED STATEMENTS OF STOCKHOLDERS’ EQUITY
(in thousands)
Common Stock | Additional Paid-in Capital | Accumulated Other Comprehensive Income (Loss) | Retained Earnings | Total Stockholders' Equity | |||||||||||||||||||
Shares | Amount | ||||||||||||||||||||||
Balance at June 30, 2013 | 39,342 | $ | 40 | $ | 118,193 | $ | 373 | $ | 95,858 | $ | 214,464 | ||||||||||||
Issuance of common stock upon exercise of stock options | 217 | — | 896 | — | — | 896 | |||||||||||||||||
Release of restricted stock units | 440 | — | (1,570 | ) | — | — | (1,570 | ) | |||||||||||||||
Issuance of common stock in connection with acquisition | 732 | 1 | 4,609 | — | — | 4,610 | |||||||||||||||||
Repurchases of common stock | (1,269 | ) | (1 | ) | (4,075 | ) | — | (3,823 | ) | (7,899 | ) | ||||||||||||
Stock-based compensation expense | — | — | 11,535 | — | — | 11,535 | |||||||||||||||||
Excess tax benefit from employee stock options | — | — | (310 | ) | — | — | (310 | ) | |||||||||||||||
Foreign currency translation adjustment, net of tax | — | — | — | 51 | — | 51 | |||||||||||||||||
Unrealized net gain on available-for-sale securities, net of tax | — | — | — | 152 | — | 152 | |||||||||||||||||
Net loss | — | — | — | — | (29,524 | ) | (29,524 | ) | |||||||||||||||
Balance at June 30, 2014 | 39,462 | $ | 40 | $ | 129,278 | $ | 576 | $ | 62,511 | $ | 192,405 | ||||||||||||
Issuance of common stock upon exercise of stock options | 889 | 1 | 4,411 | — | — | 4,412 | |||||||||||||||||
Release of restricted stock units | 683 | — | (3,103 | ) | — | — | (3,103 | ) | |||||||||||||||
Repurchases of common stock | (497 | ) | — | (1,608 | ) | — | (2,172 | ) | (3,780 | ) | |||||||||||||
Stock-based compensation expense | — | — | 11,428 | — | — | 11,428 | |||||||||||||||||
Foreign currency translation adjustment, net of tax | — | — | — | (1,698 | ) | — | (1,698 | ) | |||||||||||||||
Unrealized net loss on available-for-sale securities, net of tax | — | — | — | (418 | ) | — | (418 | ) | |||||||||||||||
Net loss | — | — | — | — | (23,063 | ) | (23,063 | ) | |||||||||||||||
Balance at June 30, 2015 | 40,537 | $ | 41 | $ | 140,406 | $ | (1,540 | ) | $ | 37,276 | $ | 176,183 | |||||||||||
Issuance of common stock upon exercise of stock options | 1,299 | 1 | 1,548 | — | — | 1,549 | |||||||||||||||||
Release of restricted stock units | 948 | 1 | (3,296 | ) | — | — | (3,295 | ) | |||||||||||||||
Repurchases of common stock | (76 | ) | — | (249 | ) | — | (321 | ) | (570 | ) | |||||||||||||
Stock-based compensation expense | — | — | 11,366 | — | — | 11,366 | |||||||||||||||||
Foreign currency translation adjustment, net of tax | — | — | — | (512 | ) | — | (512 | ) | |||||||||||||||
Unrealized net gain on available-for-sale securities, net of tax | — | — | — | 285 | — | 285 | |||||||||||||||||
Net loss | — | — | — | — | (35,321 | ) | (35,321 | ) | |||||||||||||||
Balance at June 30, 2016 | 42,708 | $ | 43 | $ | 149,775 | $ | (1,767 | ) | $ | 1,634 | $ | 149,685 | |||||||||||
See accompanying Notes to Consolidated Financial Statements.
F-7
TELENAV, INC.
CONSOLIDATED STATEMENTS OF CASH FLOWS
(in thousands)
Fiscal Year Ended June 30, | ||||||||||||
2016 | 2015 | 2014 | ||||||||||
Operating activities | ||||||||||||
Net loss | $ | (35,321 | ) | $ | (23,063 | ) | $ | (29,524 | ) | |||
Adjustments to reconcile net loss to net cash used in operating activities: | ||||||||||||
Depreciation and amortization | 3,362 | 5,239 | 6,759 | |||||||||
Accretion of net premium on short-term investments | 645 | 1,318 | 3,500 | |||||||||
Stock-based compensation expense | 11,366 | 11,428 | 11,535 | |||||||||
Valuation allowance on deferred tax assets | — | (778 | ) | 7,398 | ||||||||
Bad debt expense | 95 | 33 | 132 | |||||||||
Write-off of long-term investments | 977 | 1,302 | 250 | |||||||||
Loss on disposal of property and equipment | 398 | 73 | 112 | |||||||||
Excess tax benefits from employee stock options | — | — | 310 | |||||||||
Changes in operating assets and liabilities: | ||||||||||||
Accounts receivable | (5,817 | ) | (10,764 | ) | 2,477 | |||||||
Deferred income taxes | 109 | 1,342 | (4,095 | ) | ||||||||
Restricted cash | (231 | ) | 1,117 | (3,327 | ) | |||||||
Income taxes receivable | 5,393 | 852 | — | |||||||||
Deferred costs | (8,935 | ) | (2,641 | ) | — | |||||||
Prepaid expenses and other current assets | (592 | ) | 5,133 | (5,248 | ) | |||||||
Other assets | 972 | 550 | (649 | ) | ||||||||
Accounts payable | 4,118 | 328 | (1,331 | ) | ||||||||
Accrued compensation | (320 | ) | (3,246 | ) | 3,612 | |||||||
Accrued royalties | 5,973 | 5,687 | (6,162 | ) | ||||||||
Accrued expenses and other liabilities | (923 | ) | (4,699 | ) | (2,645 | ) | ||||||
Income taxes payable | (636 | ) | (80 | ) | 398 | |||||||
Deferred rent | (272 | ) | (1,219 | ) | (1,354 | ) | ||||||
Deferred revenue | 16,541 | 4,392 | (4,701 | ) | ||||||||
Net cash used in operating activities | (3,098 | ) | (7,696 | ) | (22,553 | ) | ||||||
Investing activities | ||||||||||||
Purchases of property and equipment | (4,004 | ) | (1,208 | ) | (1,053 | ) | ||||||
Purchases of short-term investments | (55,021 | ) | (113,144 | ) | (66,350 | ) | ||||||
Purchases of long-term investments | — | (2,500 | ) | (600 | ) | |||||||
Proceeds from sales of long-term investments | — | 376 | 795 | |||||||||
Proceeds from sales and maturities of short-term investments | 67,578 | 132,528 | 106,585 | |||||||||
Acquisitions, net of cash acquired | — | — | (19,245 | ) | ||||||||
Net cash provided by investing activities | 8,553 | 16,052 | 20,132 | |||||||||
Financing activities | ||||||||||||
Proceeds from exercise of stock options | 1,549 | 4,412 | 896 | |||||||||
Repurchase of common stock | (570 | ) | (3,780 | ) | (7,899 | ) | ||||||
Tax withholdings related to net share settlements of restricted stock units | (3,295 | ) | (3,103 | ) | (1,570 | ) | ||||||
Excess tax benefits from employee stock options | — | — | (310 | ) | ||||||||
Net cash used in financing activities | (2,316 | ) | (2,471 | ) | (8,883 | ) | ||||||
Effect of exchange rate changes on cash and cash equivalents | (511 | ) | (1,698 | ) | 51 | |||||||
Net increase (decrease) in cash and cash equivalents | 2,628 | 4,187 | (11,253 | ) | ||||||||
Cash and cash equivalents, at beginning of period | 18,721 | 14,534 | 25,787 | |||||||||
Cash and cash equivalents, at end of period | $ | 21,349 | $ | 18,721 | $ | 14,534 | ||||||
Supplemental disclosure of cash flow information | ||||||||||||
Income taxes paid (received), net | $ | (4,610 | ) | $ | (10,754 | ) | $ | 1,002 | ||||
See accompanying Notes to Consolidated Financial Statements.
F-8
TELENAV, INC.
Notes to Consolidated Financial Statements
1. | Summary of business and significant accounting policies |
Description of business
Telenav, Inc., also referred to in this report as "Telenav," “we,” “our” or “us,” was incorporated in September 1999 in the State of Delaware. We are a leading provider of connected car and location-based platform services. These services consist of our automotive and mobile navigation platform and our advertising delivery platform. Our auto and mobile navigation platform allows Telenav to deliver enhanced location-based services to auto manufacturers, developers, and end users through various distribution channels, including wireless carriers. Our advertising delivery platform delivers highly targeted advertising services leveraging our location expertise. Through June 30, 2014, we operated in one business segment. Commencing July 1, 2014, we operate in three business segments: automotive, advertising and mobile navigation. Our fiscal year ends on June 30 and in this report we refer to the fiscal years ended June 30, 2016, 2015 and 2014 as fiscal 2016, fiscal 2015 and fiscal 2014, respectively.
Basis of presentation
The consolidated financial statements and accompanying notes have been prepared in accordance with U.S. generally accepted accounting principles, or GAAP. The consolidated financial statements include the accounts of Telenav, Inc. and our wholly owned subsidiaries. All significant intercompany balances and transactions have been eliminated in consolidation. Certain prior year balances have been reclassified to conform to the current year presentation.
Our consolidated financial statements also include the financial results of Shanghai Jitu Software Development Ltd., or Jitu, located in China. Based on our contractual arrangements with the shareholders of Jitu, we have determined that Jitu is a variable interest entity, or VIE, for which we are the primary beneficiary and are required to consolidate in accordance with Accounting Standards Codification, or ASC, subtopic 810-10, or ASC 810-10, Consolidation: Overall. The results of Jitu did not have a material impact on our overall operating results for fiscal 2016, fiscal 2015 or fiscal 2014.
Use of estimates
The preparation of financial statements in conformity with GAAP requires us to make estimates and assumptions that affect the amounts reported in the consolidated financial statements and accompanying notes. Significant estimates and assumptions made by us include the determination of revenue recognition and deferred revenue, the recoverability of accounts receivable, the determination of acquired intangibles and assessment of goodwill for impairment, the fair value of stock awards issued, the determination of income taxes and the recoverability of deferred tax assets. Actual results could differ from those estimates.
Revenue recognition
We generate revenue primarily from software licenses, service subscriptions and customized engineering fees. We also generate revenue from the delivery of search and display advertising impressions. We recognize revenue when persuasive evidence of an arrangement exists, delivery of the product or service has occurred, the fee is fixed or determinable, and collectability is reasonably assured. We evaluate whether it is appropriate to recognize revenue based on the gross amount billed to our customers or the net amount earned as revenue. When we are primarily obligated in a transaction, have latitude in establishing prices, are responsible for fulfillment of the transaction, have credit risk, or have several but not all of these indicators, we record revenue on a gross basis. While none of the factors individually are considered presumptive or determinative, in reaching conclusions on gross versus net revenue recognition, we place the most weight on the analysis of whether or not we are the primary obligor in the arrangement. We report our automotive and advertising revenue on a gross basis.
We derive product revenue from the delivery of customized software and royalties earned from the distribution of this customized software in certain automotive navigation applications. We generally recognize customized software revenue using the completed contract method of contract accounting under which revenue is recognized upon delivery to, and acceptance by, the automobile manufacturer of our on-board navigation solutions. We generally recognize royalty revenue for our automotive on-board navigation solutions as the software is reproduced for installation in vehicles or as the software is installed in vehicles, assuming all other conditions for revenue recognition have been met.
We derive services revenue from our brought-in automotive navigation solutions and other automotive solutions, such as map update programs. Billings for these services are recorded as deferred revenue and amortized to revenue over the estimated
F-9
service periods. In January 2015, General Motors Corporation, or GM, launched the new version of its OnStar RemoteLink® mobile application powered by our location-based services platform. We earn a one-time royalty for each new vehicle owner who downloads the RemoteLink® application. In July 2015, Ford Australia and New Zealand adopted a map update program as part of its SYNC 2 product distribution. Under this program, Ford owners in Australia and New Zealand with SYNC 2 or SYNC 3 will be eligible to receive annual map updates at no additional cost through December 2023. We earn an annual fee and a per unit fee for these updates. In August 2015, Toyota began shipping vehicles enabled to connect with our Scout® GPS Link mobile application. We earn a one-time royalty for each new Toyota sold and equipped with Entune™ Audio Plus.
We derive services revenue from the delivery of search and display advertising impressions. We recognize revenue when the related advertising services are delivered based on the specific terms of the advertising contract, which are commonly based on the number of ad impressions delivered, or clicks, drives or actions by users on mobile advertisements.
We also derive services revenue from subscriptions to access our mobile navigation services, which are generally provided through our wireless carrier customers that offer our services to their subscribers or through application stores. Our wireless carrier customers pay us based on several different revenue models, including (1) a revenue sharing arrangement that may include a minimum fee per end user, (2) a monthly or annual subscription fee per end user, or (3) based on usage. Our end users who subscribe to our services through application stores pay us a monthly or annual subscription fee.
We recognize monthly fees related to our mobile navigation services in the month we provide the services. We defer amounts received or billed in advance of the service being provided and recognize the deferred amounts when the monthly service has been provided. We recognize revenue for fixed fees for any number of subscribers receiving our services as part of bundles monthly on a straight-line basis over the term of the agreement. Our agreements do not contain general rights of refund once the service has been provided. We also establish allowances for estimated credits subsequently issued to end users by our wireless carrier customers.
We recognize as services revenue the amount our wireless carrier customers report to us as we provide our services, which are net of any revenue sharing or other fees earned and deducted by our wireless carrier customers. We are not the principal provider when selling access to our mobile navigation services through our wireless carrier customers as the subscribers directly contract with our wireless carrier customers. In addition, we may earn a fixed fee or fixed percentage of fees charged by our wireless carrier customers and our wireless carrier customers have the sole ability to set the price charged to their subscribers for our service. Our wireless carrier customers have direct responsibility for billing and collecting those fees from their subscribers and we and our wireless carrier customers may offer subscribers a free trial for our service. For end users who purchase our mobile navigation services through application stores, we utilize the application store billing process. We provide tiered pricing to certain of our wireless carrier customers based on the number of paying end users in a given month, which may result in a discounted fee per end user depending on the number of end users. Revenue recognized is based on the discounted fees earned for a given period.
In certain instances, due to the nature and timing of monthly revenue and reporting from our customers, we may be required to make estimates of the amount of revenue to recognize from a customer for the current period. Estimates for revenue include our consideration of certain factors and information, including subscriber data, historical subscription and revenue reporting trends, end user subscription data from our internal systems, and data from comparable distribution channels of our other customers. We record any differences between estimated revenue and actual revenue in the reporting period when we determine the actual amounts. To date, actual amounts have not differed materially from our estimates.
Cost of revenue
Our cost of revenue consists primarily of the cost of third party royalty based data, such as map, points of interest, or POI, traffic, gas price and weather data, and voice recognition technology that we use in providing our personalized navigation services. Our cost of revenue also includes the cost of third party exchange ad inventory as well as expenses associated with third party hosting services, data center operations, customer support, the amortization of capitalized software, recognition of deferred development costs on specific projects, stock-based compensation and amortization of acquired developed technology.
In connection with our usage of licensed third party content, our contracts with certain licensors include minimum guaranteed royalty payments, which are payable regardless of the ultimate volume of revenue derived from the number of paying end users. These contracts contain obligations for the licensor to provide ongoing services and, accordingly, we record any minimum guaranteed royalty payments as an asset when paid and amortize the amount to cost of revenue over the applicable period. Any additional royalties due based on actual usage are expensed monthly as incurred.
F-10
Foreign currency
The functional currency of our foreign subsidiaries is the local currency. Adjustments resulting from translating foreign functional currency financial statements into U.S. dollars are recorded as part of a separate component of comprehensive income in stockholders’ equity. Foreign currency transaction gains and losses are included in our net income for each year. All assets and liabilities denominated in a foreign currency are translated into U.S. dollars at the exchange rate on the balance sheet date. Revenue and expenses are translated at the average monthly exchange rates during the year. Equity transactions are translated using historical exchange rates. Foreign currency transaction gains (losses) were $(10,000), $1.6 million and$(203,000) in fiscal 2016, 2015 and 2014, respectively. The foreign currency transaction gains of $1.6 million in fiscal 2015 were primarily driven by mark-to-market adjustment of intercompany balances.
Accumulated other comprehensive income (loss), net of tax
The components of accumulated other comprehensive income (loss), net of related taxes, were as follows (in thousands):
Foreign Currency Translation Adjustments | Unrealized Gains (Losses) on Available- for-Sale Securities | Total | ||||||||||
Balance, net of tax as of June 30, 2014 | $ | 321 | $ | 255 | $ | 576 | ||||||
Other comprehensive income (loss) before reclassifications, net of tax | (1,698 | ) | (156 | ) | (1,854 | ) | ||||||
Amount reclassified from accumulated other comprehensive income (loss), net of tax | — | (262 | ) | (262 | ) | |||||||
Other comprehensive income (loss), net of tax | (1,698 | ) | (418 | ) | (2,116 | ) | ||||||
Balance, net of tax as of June 30, 2015 | $ | (1,377 | ) | $ | (163 | ) | $ | (1,540 | ) | |||
Other comprehensive income (loss) before reclassifications, net of tax | (512 | ) | 272 | (240 | ) | |||||||
Amount reclassified from accumulated other comprehensive income (loss), net of tax | — | 13 | 13 | |||||||||
Other comprehensive income (loss), net of tax | (512 | ) | 285 | (227 | ) | |||||||
Balance, net of tax as of June 30, 2016 | $ | (1,889 | ) | $ | 122 | $ | (1,767 | ) | ||||
The amount reclassified from accumulated other comprehensive income (loss), net of tax, was determined using the specific identification method and the amount was included in other income, net, for fiscal 2016 and 2015, respectively.
The amount of income tax benefit allocated to each component of accumulated other comprehensive income (loss) was not material for fiscal 2016 and 2015.
Cash equivalents and short-term investments
Cash equivalents consist of highly liquid fixed-income investments with original maturities of three months or less at the time of purchase, including money market funds. Short-term investments consist of readily marketable securities with a remaining maturity of more than three months from time of purchase. Short-term investments are classified as current assets, even though maturities may extend beyond one year, because they represent investments of cash available for operations. We classify all of our cash equivalents and short-term investments as “available-for-sale,” as these investments are free of trading restrictions. We may or may not hold securities with stated maturities greater than 12 months until maturity. After consideration of our risk versus reward objectives, as well as our liquidity requirements, we may sell these securities prior to their stated maturities. As we view these securities as available to support current operations, we classify securities with maturities beyond 12 months as current assets under the caption short-term investments in the accompanying consolidated balance sheets. These marketable securities are carried at fair value, with the unrealized gains and losses, net of tax, reported as accumulated other comprehensive income and included as a separate component of stockholders’ equity. Gains and losses are recognized when realized. When we have determined that an other-than-temporary decline in fair value has occurred, the amount of the decline that is related to a credit loss is recognized in earnings. Gains and losses are determined using the specific identification method. Our net realized gains were $4,000, $236,000 and $164,000 in fiscal 2016, 2015 and 2014, respectively.
F-11
Concentrations of risk and significant customers
Financial instruments that subject us to significant concentrations of credit risk primarily consist of cash, cash equivalents, short-term investments and accounts receivable. We maintain our cash, cash equivalents and short-term investments with well-capitalized financial institutions. Cash equivalents consist primarily of money-market accounts. Our primary customers are wireless carriers, automobile manufacturers and original equipment manufacturers, or OEMs, and we do not require collateral for accounts receivable. To manage the credit risk associated with accounts receivable, we evaluate the creditworthiness of our customers. We evaluate our accounts receivable on an ongoing basis to determine those amounts not collectible. To date, we are not aware of circumstances that may impair a specific customer’s ability to meet its financial obligations to us, other than those customers for which an allowance for doubtful accounts has been established.
Revenue related to products and services provided through Ford Motor Company, or Ford, comprised 71%, 61% and 46% of revenue for fiscal 2016, 2015 and 2014, respectively. Receivables due from Ford were 64% and 58% of total accounts receivable at June 30, 2016 and 2015, respectively. Revenue related to services provided through AT&T Mobility LLC., or AT&T, comprised 9%, 15% and 24% of revenue for fiscal 2016, 2015 and 2014, respectively. Receivables due from AT&T were 8% and 14% of total accounts receivable at June 30, 2016 and 2015, respectively. No other customer represented 10% of our revenue or 10% of our receivables for any period presented.
Our licensed map, POI and traffic data have been provided principally through TomTom North America, Inc., or TomTom, and HERE North America, LLC, a company owned by a consortium of German auto manufacturers, or HERE, in fiscal 2016, 2015 and 2014. To date, we are not aware of circumstances that may impair either party’s intent or ability to continue providing such services to us.
Restricted cash
As of June 30, 2016 and 2015, we had restricted cash of $5.1 million and $4.9 million, respectively, on our consolidated balance sheets. As of June 30, 2016 and 2015, restricted cash is comprised primarily of an overpayment from a customer that will either be refunded or be applied to future amounts owed to us.
Fair value of financial instruments
The estimated fair market value of financial instruments, including cash, accounts receivable and accounts payable, approximates the carrying values of those instruments due to their relatively short maturities.
We measure certain other financial instruments at fair value on a recurring basis. We have established a hierarchy, which consists of three levels, for disclosure of the inputs used to determine the fair value of our financial instruments.
Level 1 valuations are based on quoted prices in active markets for identical assets or liabilities.
Level 2 valuations are based on inputs that are observable, either directly or indirectly, other than quoted prices included within Level 1. Such inputs used in determining fair value for Level 2 valuations include quoted prices in active markets for similar assets or liabilities, quoted prices for identical or similar assets or liabilities in markets that are not active, or other inputs that are observable or can be corroborated by observable market data for substantially the full term of the assets or liabilities.
Level 3 valuations are based on information that is unobservable and significant to the overall fair value measurement.
As of June 30, 2016 and 2015, we did not have any Level 3 financial instruments.
Property and equipment
Property and equipment are stated at cost, less accumulated depreciation and amortization. Depreciation is computed using the straight-line method over the estimated useful lives of the respective assets. Computers, software and equipment have useful lives of three years and automobiles, furniture and fixtures have useful lives of five years. Leasehold improvements are amortized using the straight-line method over the shorter of the estimated useful lives of the assets or the term of the related lease.
F-12
Long-term investments
Our long-term investments consist of privately-held investments, and are included in other assets in our consolidated balance sheets. As of June 30, 2016, the carrying value of our total privately-held investments was $954,000. These investments are accounted for as cost-basis investments, as we own less than 20% of the voting securities and do not have the ability to exercise significant influence over operating and financial policies of the entities. Our investments are in entities that are not publicly traded and, therefore, no established market for the securities exists. Our cost-method investments are carried at historical cost in our consolidated balance sheets and measured at fair value on a nonrecurring basis when indicators of impairment exist. If we believe that the carrying value of the cost basis investments is in excess of estimated fair value, our policy is to record an impairment charge to adjust the carrying value to estimated fair value, when the impairment is deemed other-than-temporary. We regularly evaluate the carrying value of these cost-method investments for impairment. We record realized gains or losses on the sale or impairment of cost method investments in other income, net. We recorded impairment charges of $750,000, $482,000 and $250,000 for cost-method investments during fiscal 2016, 2015 and 2014, respectively.
In addition to these cost-basis investments, in April 2015, we entered into an agreement to spin off a product line developed by our Shanghai, China team, including certain assets and technology as well as the transfer of seven employees, and we agreed to invest $1.0 million in the form of a convertible note. We are the primary investor; however, we do not have significant influence over the operations of the business. Accordingly, we record the monthly net change in operating results against the carrying value of the convertible note recorded in long-term investments on our consolidated balance sheet. Fiscal 2015 includes three months of operating results for the investee entity. The entity's success is contingent upon its ability to generate revenue and raise additional capital. Based upon the early stage of this company, its lack of success to date in each of these endeavors, and China's unfavorable macroeconomic conditions making the raising of additional capital difficult, we recorded an impairment charge of $820,000 to write down the carrying value of the convertible note to zero as of June 30, 2015.
In June 2015, we also entered into an agreement to spin off a product line developed by our Xi'an, China team, including certain assets and technology as well as the transfer of 12 employees, and we agreed to invest $800,000 in the form of a convertible note. We are the primary investor; however, we do not have significant influence over the operations of the business. Accordingly, we record the monthly net change in operating results against the carrying value of the convertible note recorded in long-term investments on our consolidated balance sheet. The entity's success is contingent upon its ability to generate revenue and raise additional capital. As of June 30, 2015, our investment balance was $744,000. Based upon the early stage of this entity, its lack of success to date in each of these endeavors, and China's unfavorable macroeconomic conditions making the raising of additional capital difficult, we recorded an impairment charge of $227,000 to write down the remaining carrying value of the convertible note to zero during fiscal 2016.
Including the impairment in the Shanghai and Xi'an, China spin offs above, we recorded impairment charges of $977,000, $1.3 million and $250,000 on certain non-marketable equity investments in fiscal 2016, 2015 and 2014, respectively.
Also included in other income, net in fiscal 2014 is a $795,000 gain from the sale in December 2013 of an investment in a privately-held company.
Long-lived assets
We evaluate our long-lived assets, including intangible assets, for impairment whenever events or changes in circumstances indicate the carrying amount of an asset may not be recoverable. Recoverability of these assets is measured by a comparison of the carrying amounts to the future undiscounted cash flows the assets are expected to generate. If long-lived assets are considered to be impaired, the impairment to be recognized equals the amount by which the carrying value of the asset exceeds its fair value.
Goodwill
Goodwill represents the excess of the aggregate purchase price paid over the fair value of the net assets acquired. Goodwill is not amortized and is tested for impairment at least annually or whenever events or changes in circumstances indicate that the carrying value may not be recoverable. These tests are based on our operating segment and reporting unit structure. We first assess qualitative factors to determine whether it is necessary to perform the two-step quantitative goodwill impairment test. We are not required to calculate the fair value of our reporting units unless we determine, based on a qualitative assessment, that it is more-likely-than-not that the fair value is less than our carrying amount. If we determine it is more likely than not that the fair value of the reporting unit is less than its carrying value, we perform a two-step quantitative goodwill impairment test. The first step of the impairment test involves comparing the fair value of the reporting unit to its net book value, including goodwill. If the net book value exceeds its fair value, then we would perform the second step of the
F-13
goodwill impairment test to determine the amount of the impairment loss, if any. In assessing the fair value of our reporting units, we make assumptions regarding our estimated future cash flows, long-term growth rates, timing over which the cash flows will occur and, amongst other factors, the weighted average cost of capital. If our estimates or related assumptions change in the future, or if our net book value were to exceed our market capitalization, we may be required to record impairment loss related to our goodwill. We have not recognized any impairment of goodwill in the three year period ended June 30, 2016. As of June 30, 2016, we had goodwill of $31.3 million.
Leases
We lease our office facilities under operating lease agreements. Office facilities subject to an operating lease and the related lease payments are not recorded on our consolidated balance sheets. The terms of certain lease agreements provide for rental payments on a graduated basis; however, we recognize rent expense on a straight-line basis over the lease period in accordance with authoritative accounting guidance. Any lease incentives or contracted sublease income are recognized as reductions of rental expense on a straight-line basis over the term of the lease. The lease term begins on the date we become legally obligated for the rent payments or when we take possession of the office space, whichever is earlier. As of June 30, 2016 and 2015, we had a total of $1.3 million and $5.5 million, respectively, in deferred rent related to tenant improvement lease incentives and graduated rent payments recorded as liabilities on our balance sheets. In addition, as of June 30, 2016 and 2015, we had a total of $20,000 and $2.6 million in accrued facility exit costs relating to our operating lease arrangements. See Note 11 for a discussion of our restructuring actions.
Stock-based compensation
We account for stock-based employee compensation arrangements under the fair value recognition method, which requires us to measure the stock-based compensation costs of share-based compensation arrangements based on the grant-date fair value, and recognize the costs in the financial statements over the employees’ requisite service period. We recognize compensation expense for the fair value of these awards with time-based vesting on a straight-line basis over the employee’s requisite service period of each of these awards, net of estimated forfeitures.
Equity instruments issued to nonemployees are recorded at their fair value on the measurement date and are subject to periodic adjustment as the underlying equity instruments vest.
Income taxes
We utilize the asset and liability method of accounting for income taxes, whereby deferred tax asset or liability account balances are calculated at the balance sheet date using current tax laws and rates in effect for the year in which the differences are expected to affect taxable income. Valuation allowances are provided when necessary to reduce deferred tax assets to the amount that will more likely than not be realized.
Research and software development costs
We expense research and development costs as incurred. We account for the costs of computer software we develop for internal use by capitalizing qualifying costs, which are incurred during the application development stage, and amortizing those costs over the application’s estimated useful life, which generally ranges from 18 to 24 months depending on the type of application. We did not capitalize or write off any software development costs during fiscal 2016, 2015 and 2014. Amortization expense related to capitalized software costs, which has been recorded in cost of revenue, totaled none, $97,000 and $1.0 million for fiscal 2016, 2015 and 2014, respectively. As of June 30, 2016, capitalized software costs were fully amortized.
We also account for the costs of computer software we develop for customers requiring significant modification or customization by deferring qualifying costs under the completed contract method. All such development costs incurred are deferred until the related revenue is recognized. We deferred $648,000, $802,000 and $943,000 of software development costs during fiscal 2016, 2015 and 2014, respectively. Development costs expensed to cost of revenue totaled $660,000, $1.2 million and $922,000 in fiscal 2016, 2015 and 2014, respectively. As of June 30, 2016 and 2015, deferred capitalized software development costs, which were included primarily in prepaid expenses and other current assets, were $33,000 and $44,000, respectively.
Advertising expense
Advertising costs are expensed as incurred. Advertising expense was $254,000, $1.1 million and $2.0 million in fiscal 2016, 2015 and 2014, respectively.
F-14
Recent accounting pronouncements
In June 2016, the Financial Accounting Standards Board, or FASB, issued new guidance that changes the accounting for recognizing impairments of financial assets. Under the new guidance, credit losses for certain types of financial instruments will be estimated based on expected losses. The new guidance also modifies the impairment models for available-for-sale debt securities and for purchased financial assets with credit deterioration since their origination. The new standard is effective for fiscal years, and interim periods within those fiscal years, beginning after December 15, 2019. Early adoption is permitted as of the fiscal year beginning after December 15, 2018, including interim periods within those fiscal years. We are evaluating the effect that this new standard will have on our consolidated financial statements.
In March 2016, the FASB issued new guidance to revise aspects of stock-based compensation guidance which include income tax consequences, classification of awards as equity or liabilities, and classification on the statement of cash flows. The new standard is effective for fiscal years, and interim periods within those fiscal years, beginning after December 15, 2016. Early adoption is permitted. We are evaluating the effect that this new standard will have on our consolidated financial statements.
In March 2016, the FASB issued new guidance to clarify the implementation guidance on principal versus agent considerations for reporting revenue gross versus net. The guidance includes indicators to assist an entity in determining whether it controls a specified good or service before it is transferred to the customer. The new standard will be effective for us in the first quarter of our fiscal year ending June 30, 2019. We are evaluating the effect that this new standard will have on our consolidated financial statements.
In February 2016, the FASB issued new guidance which amends the existing accounting standards for leases. Under the new guidance, a lessee will be required to recognize right-of-use assets and lease liabilities on the balance sheet for certain leases classified as operating leases. The new standard is effective for fiscal years, and interim periods within those fiscal years, beginning after December 15, 2018. Early adoption is permitted. We are evaluating the effect that this new standard will have on our consolidated financial statements.
In January 2016, the FASB issued new guidance that amends the accounting and disclosures of financial instruments, including a provision that requires equity investments (except for investments accounted for under the equity method of accounting) to be measured at fair value with changes in fair value recognized in current earnings. The new standard is effective for fiscal years, and interim periods within those fiscal years, beginning after December 15, 2017. We are evaluating the effect that this new standard will have on our consolidated financial statements.
In November 2015, the FASB issued new guidance which simplifies the presentation of deferred income taxes. This new standard requires that deferred tax assets and liabilities be classified as non-current in a statement of financial position. We early adopted this standard effective October 1, 2015 on a prospective basis, which resulted in a reclassification of our net current deferred tax asset to the net non-current deferred tax asset in our consolidated balance sheet. No prior periods were retrospectively adjusted. Adoption of this standard resulted in a $327,000 decrease in current deferred tax assets and a corresponding $89,000 increase in non-current deferred tax assets and a $238,000 decrease in other long-term liabilities on our consolidated balance sheet.
In February 2015, the FASB issued new guidance related to consolidations. The new standard amends the guidelines for determining whether certain legal entities should be consolidated and reduces the number of consolidation models. The new standard is effective for fiscal years, and interim periods within those fiscal years, beginning after December 15, 2015. Early adoption is permitted. We are evaluating the effect that this new standard will have on our consolidated financial statements.
In May 2014, the FASB issued guidance related to revenue from contracts with customers, which supersedes the revenue recognition requirements in ASC 605, Revenue Recognition. Under this guidance, revenue is recognized when promised goods or services are transferred to customers in an amount that reflects the consideration that is expected to be received for those goods or services. The new guidance also requires additional disclosure about the nature, amount, timing and uncertainty of revenue and cash flows arising from customer contracts, including significant judgments and changes in judgments and assets recognized from costs incurred to obtain or fulfill a contract. The updated standard will replace most existing revenue recognition guidance under GAAP when it becomes effective and permits the use of either the full retrospective or cumulative effect transition method. Early adoption is permitted. In August 2015, the FASB deferred the effective date of this guidance by one year. The updated standard will now be effective for us in the first quarter of our fiscal year ending June 30, 2019. We have not yet selected a transition method and we are currently evaluating the effect that this new standard will have on our consolidated financial statements and related disclosures.
F-15
2. | Net income (loss) per share |
Basic net income (loss) per share is calculated by dividing net income (loss) by the weighted average number of common shares outstanding for the period. Diluted net income (loss) per share is computed by dividing net income (loss) by the weighted average number of common shares outstanding for the period, including potential dilutive common shares assuming the dilutive effect of outstanding stock options, restricted stock, and restricted stock units using the treasury-stock method.
The following table presents the calculation of basic and diluted net loss per share (in thousands, except per share amounts):
Fiscal Year Ended June 30, | ||||||||||||
2016 | 2015 | 2014 | ||||||||||
Net loss | $ | (35,321 | ) | $ | (23,063 | ) | $ | (29,524 | ) | |||
Weighted average common shares used in computing net loss per share, basic and diluted | 41,567 | 39,991 | 38,796 | |||||||||
Net loss per share, basic and diluted | $ | (0.85 | ) | $ | (0.58 | ) | $ | (0.76 | ) | |||
The following outstanding shares subject to options, restricted common stock and restricted stock units were excluded from the computation of diluted net loss per share for the periods presented because including them would have had an antidilutive effect (in thousands):
Fiscal Year Ended June 30, | |||||||||
2016 | 2015 | 2014 | |||||||
Stock options | 5,370 | 4,781 | 5,697 | ||||||
Restricted common stock and restricted stock units | 3,302 | 4,290 | 4,791 | ||||||
Total | 8,672 | 9,071 | 10,488 | ||||||
3. | Cash, cash equivalents and short-term investments |
Cash, cash equivalents and short-term investments consisted of the following as of June 30, 2016 (in thousands):
Amortized Cost | Unrealized Gains | Unrealized Losses | Estimated Fair Value | |||||||||||||
Cash | $ | 14,308 | $ | — | $ | — | $ | 14,308 | ||||||||
Cash equivalents: | ||||||||||||||||
Money market mutual funds | 5,641 | — | — | 5,641 | ||||||||||||
Agency bonds | 1,400 | — | — | 1,400 | ||||||||||||
Total cash equivalents | 7,041 | — | — | 7,041 | ||||||||||||
Total cash and cash equivalents | 21,349 | — | — | 21,349 | ||||||||||||
Short-term investments: | ||||||||||||||||
U.S. treasury securities | 1,699 | 3 | — | 1,702 | ||||||||||||
Asset-backed securities | 10,160 | 17 | (2 | ) | 10,175 | |||||||||||
Municipal securities | 6,004 | 14 | — | 6,018 | ||||||||||||
Commercial paper | 3,494 | 1 | — | 3,495 | ||||||||||||
Agency bonds | 5,907 | 22 | — | 5,929 | ||||||||||||
Corporate bonds | 60,754 | 217 | (13 | ) | 60,958 | |||||||||||
Total short-term investments | 88,018 | 274 | (15 | ) | 88,277 | |||||||||||
Cash, cash equivalents and short-term investments | $ | 109,367 | $ | 274 | $ | (15 | ) | $ | 109,626 | |||||||
F-16
Cash, cash equivalents and short-term investments consisted of the following as of June 30, 2015 (in thousands):
Amortized Cost | Unrealized Gains | Unrealized Losses | Estimated Fair Value | |||||||||||||
Cash | $ | 10,806 | $ | — | $ | — | $ | 10,806 | ||||||||
Cash equivalents: | ||||||||||||||||
Money market mutual funds | 7,915 | — | — | 7,915 | ||||||||||||
Total cash equivalents | 7,915 | — | — | 7,915 | ||||||||||||
Total cash and cash equivalents | 18,721 | — | — | 18,721 | ||||||||||||
Short-term investments: | ||||||||||||||||
Asset-backed securities | 16,977 | 9 | (3 | ) | 16,983 | |||||||||||
Municipal securities | 10,018 | 8 | (9 | ) | 10,017 | |||||||||||
Commercial paper | 1,996 | 2 | — | 1,998 | ||||||||||||
Agency bonds | 7,642 | 6 | (2 | ) | 7,646 | |||||||||||
Corporate bonds | 64,587 | 39 | (75 | ) | 64,551 | |||||||||||
Total short-term investments | 101,220 | 64 | (89 | ) | 101,195 | |||||||||||
Cash, cash equivalents and short-term investments | $ | 119,941 | $ | 64 | $ | (89 | ) | $ | 119,916 | |||||||
The following table summarizes the cost and estimated fair value of fixed income securities classified as short-term investments based on stated maturities as of June 30, 2016 (in thousands):
Amortized Cost | Estimated Fair Value | |||||||
Due within one year | $ | 42,558 | $ | 42,577 | ||||
Due between one and two years | 27,562 | 27,689 | ||||||
Due between two and three years | 17,898 | 18,011 | ||||||
Total | $ | 88,018 | $ | 88,277 | ||||
Declines in fair value judged to be other-than-temporary on securities available for sale are included as a component of other income, net. In order to determine whether a decline in value is other-than-temporary, we evaluate, among other factors: the duration and extent to which the fair value has been less than the carrying value and our intent and ability to retain the investment for a period of time sufficient to allow for any anticipated recovery in fair market value. As of June 30, 2016 and 2015, we did not consider any of our short-term investments to be other-than-temporarily impaired.
F-17
4. | Fair value of financial instruments |
We measure certain financial instruments at fair value on a recurring basis. We have established a hierarchy, which consists of three levels, for disclosure of the inputs used to determine the fair value of our financial instruments.
All of our cash equivalents and short-term investments are classified within Level 1 or Level 2. The fair values of these financial instruments were determined using the following inputs at June 30, 2016 (in thousands):
Fair Value Measurements at June 30, 2016 Using | ||||||||||||||||
Quoted Prices in Active Markets for Identical Assets | Significant Other Observable Inputs | Significant Unobservable Inputs | ||||||||||||||
Total | (Level 1) | (Level 2) | (Level 3) | |||||||||||||
Description | ||||||||||||||||
Cash equivalents: | ||||||||||||||||
Money market mutual funds | $ | 5,641 | $ | 5,641 | $ | — | $ | — | ||||||||
Agency bonds | 1,400 | — | 1,400 | — | ||||||||||||
Total cash equivalents | 7,041 | 5,641 | 1,400 | — | ||||||||||||
Short-term investments: | ||||||||||||||||
U.S. treasury securities | 1,702 | 1,702 | — | — | ||||||||||||
Asset-backed securities | 10,175 | — | 10,175 | — | ||||||||||||
Municipal securities | 6,018 | — | 6,018 | — | ||||||||||||
Commercial paper | 3,495 | — | 3,495 | — | ||||||||||||
Agency bonds | 5,929 | — | 5,929 | — | ||||||||||||
Corporate bonds | 60,958 | — | 60,958 | — | ||||||||||||
Total short-term investments | 88,277 | 1,702 | 86,575 | — | ||||||||||||
Cash equivalents and short-term investments | $ | 95,318 | $ | 7,343 | $ | 87,975 | $ | — | ||||||||
The fair values of our financial instruments were determined using the following inputs at June 30, 2015 (in thousands):
Fair Value Measurements at June 30, 2015 Using | ||||||||||||||||
Quoted Prices in Active Markets for Identical Assets | Significant Other Observable Inputs | Significant Unobservable Inputs | ||||||||||||||
Total | (Level 1) | (Level 2) | (Level 3) | |||||||||||||
Description | ||||||||||||||||
Cash equivalents: | ||||||||||||||||
Money market mutual funds | $ | 7,915 | $ | 7,915 | $ | — | $ | — | ||||||||
Total cash equivalents | 7,915 | 7,915 | — | — | ||||||||||||
Short-term investments: | ||||||||||||||||
Asset-backed securities | 16,983 | — | 16,983 | — | ||||||||||||
Municipal securities | 10,017 | — | 10,017 | — | ||||||||||||
Commercial paper | 1,998 | — | 1,998 | — | ||||||||||||
Agency bonds | 7,646 | — | 7,646 | — | ||||||||||||
Corporate bonds | 64,551 | — | 64,551 | — | ||||||||||||
Total short-term investments | 101,195 | — | 101,195 | — | ||||||||||||
Cash equivalents and short-term investments | $ | 109,110 | $ | 7,915 | $ | 101,195 | $ | — | ||||||||
Accretion of premium, net of discounts, on short-term investments totaled $645,000 and $1.3 million in fiscal 2016 and 2015, respectively.
F-18
Where applicable, we use quoted prices in active markets for identical assets to determine fair value short-term investments. If quoted prices in active markets for identical assets are not available to determine fair value, we use quoted prices for similar assets and liabilities or inputs that are observable either directly or indirectly. If quoted prices for identical or similar assets are not available, we use third-party valuations utilizing underlying assets assumptions.
There were no transfers between Level 1 and Level 2 financial instruments in the fiscal 2016 and 2015, respectively.
We did not have any financial liabilities measured at fair value on a recurring basis as of June 30, 2016 or 2015.
5. Balance sheet information
Property and equipment, net
Property and equipment consist of the following (in thousands):
June 30, | ||||||||
2016 | 2015 | |||||||
Computers and equipment | $ | 6,885 | $ | 14,166 | ||||
Computer software | 2,420 | 2,393 | ||||||
Furniture and fixtures | 1,337 | 2,459 | ||||||
Automobiles | 723 | 488 | ||||||
Leasehold improvements | 3,841 | 8,245 | ||||||
15,206 | 27,751 | |||||||
Less accumulated depreciation and amortization | (9,959 | ) | (20,625 | ) | ||||
Property and equipment, net | $ | 5,247 | $ | 7,126 | ||||
Depreciation and amortization expense related to property and equipment was $5.7 million, $2.8 million and $4.0 million for fiscal 2016, 2015 and 2014, respectively.
Goodwill and intangible assets, net
Intangible assets consist of the following (in thousands):
June 30, | ||||||||
2016 | 2015 | |||||||
Acquired developed technology | $ | 13,875 | $ | 13,875 | ||||
Less accumulated amortization | (9,210 | ) | (7,675 | ) | ||||
Intangible assets, net | $ | 4,665 | $ | 6,200 | ||||
Acquired developed technology is amortized on a straight-line basis over the expected useful life. Amortization expense related to intangibles was $1.5 million, $3.2 million and $2.6 million for fiscal 2016, 2015 and 2014, respectively.
As of June 30, 2016, amortization expense for intangible assets by fiscal year is as follows: $1.0 million in fiscal 2017, $1.0 million in fiscal 2018, $1.0 million in fiscal 2019, $1.0 million in fiscal 2020 and $0.7 million in fiscal 2021.
Goodwill by reportable segment as of June 30, 2016 and 2015 was as follows (in thousands):
Automotive | $ | 14,320 | ||
Advertising | 14,343 | |||
Mobile Navigation | 2,665 | |||
Goodwill | $ | 31,328 | ||
Goodwill impairment
Commencing July 1, 2014, we began to report results in three business segments. As of July 1, 2014, goodwill and intangible assets were allocated to the new reporting unit structure based on the specific identification method, and any residual
F-19
balances were allocated based on relative fair values of the related reporting units. We also tested goodwill for impairment as of July 1, 2014 and did not recognize any impairment.
We tested goodwill for impairment on April 1, 2016 and 2015 at the reporting unit level using a combination of a discounted cash flow analysis and market multiples based upon historical and projected financial information. The fair values of the automotive and advertising reporting units were estimated using the discounted cash flow approach. The estimated fair value of our mobile navigation reporting unit was determined using a combined discounted cash flow and market multiple approach with equal weighting given to the two approaches. The market multiple approach utilized revenue multiples from guideline public companies operating in similar industries. The revenue multiples were applied to the projected financial information of the mobile navigation reporting unit to determine its fair value. We applied our best judgment when assessing the reasonableness of the financial projections used to determine the fair value of each reporting unit. Based on the results of our annual goodwill impairment test as of April 1, 2016, the estimated fair value of each of our reporting units exceeded its carrying value.
Other accrued expenses
Other accrued expenses consist of the following (in thousands):
June 30, | ||||||||
2016 | 2015 | |||||||
Customer overpayments and related reserves | $ | 4,407 | $ | 4,993 | ||||
Other accrued liabilities | 7,228 | 5,925 | ||||||
Other accrued expenses | $ | 11,635 | $ | 10,918 | ||||
The overpayment from customers and related reserves will either be refunded or be applied to future amounts owed to us.
6. Commitments and contingencies
Operating leases
On October 16, 2015, we entered into a lease termination agreement with our landlord for the termination of our office lease dated June 28, 2011 for our corporate facilities on De Guigne Drive in Sunnyvale, California. The lease termination (a) became effective on March 31, 2016 with respect to 920 De Guigne Drive and 950 De Guigne Drive; and (b) became effective on June 30, 2016 with respect to 930 De Guigne Drive. On the same day, we also entered into a lease termination agreement with our sublease tenant for the termination of our sublease of 930 De Guigne Drive. The sublease termination became effective on June 30, 2016.
In connection with these lease termination agreements, we recorded the following amounts during fiscal 2016: i) the reversal of a $1.5 million restructuring accrual related to 920 De Guigne Drive, as this amount represents the fair value of our lease obligation from April 2016 through November 2019 that is no longer payable; ii) the reversal of a $0.5 million loss accrual related to 930 De Guigne Drive, as this amount represents our loss from subleasing the building from July 2016 through November 2019 that we will no longer incur, partly offset by an accrual of $0.4 million related to the early lease termination fee payable to our sublease tenant; and iii) the reversal of $1.2 million of deferred rent related to 950 De Guigne Drive, as this amount represents our deferred rent liability that is no longer required. We reversed the excess deferred rent as a credit to rent expense.
F-20
On December 18, 2015, we entered into a sublease agreement dated November 11, 2015 (the “Lease”) with Avaya Inc. to lease approximately 55,000 square feet of office and research and development space located at 4655 Great America Parkway, 3rd Floor, in Santa Clara, California (the “Great America Facility”) for a period of five years and one month (the “Term”), with a commencement date of April 1, 2016. On March 21, 2016, Avaya Inc. agreed to early occupancy of the Great America Facility by us for a prorated rent amount. The Lease provides for average monthly base rent payments during the Term of approximately $99,000 as set forth in the Lease. The Lease also provides that we must pay certain expenses and fees, including common area maintenance and property tax, in addition to the base rent. In March 2016, we relocated our corporate headquarters, and all employees formerly based at our De Guigne Drive facilities in Sunnyvale, California, to the Great America Facility.
Our primary facilities located in Santa Clara and Culver City, California, Shanghai and Xi’an, China, and Cluj, Romania, as well as certain other facilities in various locations in the United States, Germany and Japan, are leased under noncancelable operating lease arrangements. As of June 30, 2016, future minimum operating lease payments, net of sublease income, by fiscal year were as follows (in thousands):
Fiscal Year: | |||
2017 | $ | 4,190 | |
2018 | 4,013 | ||
2019 | 3,590 | ||
2020 | 2,117 | ||
2021 | 1,792 | ||
Total minimum lease payments | $ | 15,702 | |
Rent expense was $2.7 million, $3.8 million and $4.1 million for fiscal 2016, 2015 and 2014, respectively. Facility exit costs included in restructuring in fiscal 2016, 2015 and 2014 were $135,000, $1.2 million and $2.0 million, respectively.
Purchase obligations
As of June 30, 2016, in addition to our lease obligations, we had an aggregate of $4.3 million of future minimum noncancelable financial commitments primarily related to license fees due to certain of our third party content providers over the next two fiscal years. The aggregate of $4.3 million of future minimum commitments is comprised of $2.2 million due in fiscal 2017, $780,000 due in fiscal 2018, $372,000 due in fiscal 2019, $207,000 due in fiscal 2020, $207,000 due in fiscal 2021 and $516,000 due thereafter. The above commitment amounts exclude amounts already recorded on the consolidated balance sheet.
Joint venture investment commitment
In September 2015, we entered into an agreement with Ningbo Huazhong Holdings Company Limited, or Huazhong, a subsidiary of a publicly traded automotive OEM supplier in China, whereby we and Huazhong agreed to form a joint venture limited liability company in China for the development, manufacture and sales of auto entertainment systems. We agreed to invest RMB 9.95 million (approximately $1.5 million as of June 30, 2016) in cash, which is expected to represent 19.9% of the equity interests of the joint venture. We and Huazhong also agreed to negotiate a Technology License Agreement, or TLA, whereby we will license our existing navigation platform technologies to the joint venture in exchange for a RMB 5.0 million (approximately $0.8 million as of June 30, 2016) license fee.
We have not made any capital contributions to the joint venture, and the parties are currently renegotiating the nature, timing and amounts of capital to be contributed. Accordingly, the joint venture has not been formed. In December 2015, we and Huazhong completed the TLA with a term of ten years. In addition, we and Huazhong negotiated a Technology Development Service Agreement, whereby we will provide the joint venture with specified technical services in exchange for a non-refundable technical services fee, subject to the completion of a statement of work by the parties. The TLA and Technology Development Service Agreement will not be effective until the joint venture is formed.
Contingencies
From time to time, we may become involved in legal proceedings, claims and litigation arising in the ordinary course of business. When we believe a loss or a cost of indemnification is probable and can be reasonably estimated, we accrue the estimated loss or cost of indemnification in our consolidated financial statements. Where the outcome of these matters is not
F-21
determinable, we do not make a provision in our financial statements until the loss or cost of indemnification, if any, is probable and can be reasonably estimated or the outcome becomes known. We expense legal fees related to these matters as they are incurred.
On December 31, 2009, Vehicle IP, LLC, or Vehicle IP, filed a patent infringement lawsuit against us in the U.S. District Court for the District of Delaware, seeking monetary damages, fees and expenses and other relief. Verizon Wireless, or Verizon, was named as a co-defendant in the Vehicle IP litigation based on the VZ Navigator product and has demanded that we indemnify and defend Verizon against Vehicle IP. At this time, we have not agreed to defend or indemnify Verizon. AT&T was also named as a co-defendant in the Vehicle IP litigation based on the AT&T Navigator and Telenav Track products. AT&T has tendered the defense of the litigation to us and we are defending the case on behalf of AT&T. After the district court issued its claim construction ruling the defendants filed motions for summary judgment of noninfringement. On April 10, 2013 the district court granted AT&T and our motion for summary judgment of noninfringement. Plaintiff appealed the district court's claim construction and summary judgment rulings to the U.S. Court of Appeals for the Federal Circuit. On November 18, 2014, the U.S. Court of Appeals for the Federal Circuit reversed the district court's claim construction and overturned the district court's grant of summary judgment of noninfringement. The case was sent back to the U.S. District Court for the District of Delaware and trial is currently scheduled for February 2017. During fiscal 2016, we accrued $850,000 related to this litigation. We believe that it is probable that we will incur a loss; however, beyond the amount accrued we cannot currently estimate a range of any possible losses we may experience in connection with this case. Accordingly, we are unable at this time to estimate the effects of this lawsuit on our financial condition, results of operations, or cash flows.
On July 28, 2016, Nathan Gergetz filed a putative class action complaint in the U.S, District Court for the Northern District of California, alleging that Telenav violated the Telephone Consumer Protection Act, or TCPA. The complaint purports to be filed on behalf of a class, and it alleges that Telenav caused unsolicited text messages to be sent to the plaintiff from July 6, 2016 to July 26, 2016. Plaintiffs seek statutory and actual damages under the TCPA law, attorneys’ fees and costs of the action, and an injunction to prevent any future violations. Due to the preliminary nature of this matter and uncertainties relating to litigation, we are unable at this time to estimate the effects of this lawsuit on our financial condition, results of operations, or cash flows.
In addition, we have received, and expect to continue to receive, demands for indemnification from our customers, which demands can be very expensive to settle or defend, and we have in the past offered to contribute to settlement amounts and incurred legal fees in connection with certain of these indemnity demands. A number of these indemnity demands, including demands relating to pending litigation, remain outstanding and unresolved as of the date of this Form 10-K. Furthermore, in response to these demands we may be required to assume control of and bear all costs associated with the defense of our customers in compliance with our contractual commitments. At this time, we are not a party to the following cases; however our customers have requested that we indemnify them in connection with such cases.
In 2008, Alltel, AT&T, Sprint Corporation, or Sprint, and T-Mobile USA, or T-Mobile, each demanded that we indemnify and defend them against patent infringement lawsuits brought by patent holding companies EMSAT Advanced Geo-Location Technology LLC and Location Based Services LLC (collectively, EMSAT) in the U.S. District Court for the Northern District of Ohio. In March 2011, EMSAT and AT&T settled their claims. The PTO reexamined two of the patents in suit, confirming the validity of only two of the asserted claims from those patents. All patent claims that EMSAT alleged to be infringed by the Telenav GPS Navigator product were cancelled during reexamination. In the suits against T-Mobile, Alltel and Sprint, EMSAT amended its allegations to remove allegations of infringement of the patent claims that were cancelled during reexamination. EMSAT and T-Mobile stipulated to a dismissal and their case was dismissed on January 28, 2015. On March 20, 2015, the Court dismissed and closed the Alltel case and on April 10, 2015 the Court dismissed and closed the Sprint case. We have not yet determined the extent of our indemnification obligations to AT&T. We believe that it is reasonably possible that we will incur additional loss; however, we cannot currently estimate a range of other possible losses we may experience in connection with this matter. Accordingly, we are unable at this time to estimate the effects of this matter on our financial condition, results of operations, or cash flows.
In March 2009, AT&T demanded that we indemnify and defend them against a patent infringement lawsuit brought by Tendler Cellular of Texas LLC, or Tendler, in the U.S. District Court for the Eastern District of Texas. In June 2010, AT&T settled its claims with Tendler and we came to an agreement with AT&T as to the extent of our contribution towards AT&T's settlement and the amount of our contribution was not material; however, there continues to be a disagreement as to whether any additional amounts are owed to AT&T for legal fees and expenses related to the defense of the matter. We believe that it is reasonably possible that we will incur additional loss; however, we cannot currently estimate a range of other possible losses we may experience in connection with this matter. Accordingly, we are unable at this time to estimate the effects on our financial condition, results of operations, or cash flows.
F-22
On April 6, 2016, Venus Locations LLC, or Venus, filed patent infringement lawsuits against AT&T, Inc., T-Mobile and Sprint in the U.S. District Court for the Eastern District of Texas, alleging infringement of U.S. Patent Number 6,442,485 by AT&T Navigator, Telenav Navigator, and Sprint Navigator, respectively. AT&T, Inc., T-Mobile, and Sprint each demanded that we defend and indemnify them against the claims brought by Venus. On May 26, 2016, Venus filed Unopposed Motions for Dismissal in the cases against AT&T, Inc., T-Mobile, and Sprint. On May 27, 2016, the court closed each of those cases.
7. Guarantees and indemnifications
Our agreements with our customers generally include certain provisions for indemnifying them against liabilities if our products and services infringe a third party’s intellectual property rights or for other specified matters. We have in the past received indemnification requests or notices of their intent to seek indemnification in the future from our customers with respect to specific litigation claims in which our customers have been named as defendants.
We have agreed to indemnify our directors, officers and certain other employees for certain events or occurrences, subject to certain limits, while such persons are or were serving at our request in such capacity. We may terminate the indemnification agreements with these persons upon the termination of their services with us, but termination will not affect claims for indemnification related to events occurring prior to the effective date of termination. The maximum amount of potential future indemnification is unlimited. We have a directors and officers insurance policy that limits our potential exposure. We believe that any financial exposure related to these indemnification agreements is not material.
F-23
8. Stockholders’ equity
Undesignated preferred stock
We are authorized to issue 50,000,000 shares of undesignated preferred stock, par value $0.001 per share. The undesignated preferred stock may be issued from time to time at the discretion of our board of directors. As of June 30, 2016 and 2015, no shares of undesignated preferred stock were issued or outstanding.
Common stock
We are authorized to issue 600,000,000 shares of $0.001 par value stock. The holders of each share of common stock have the right to one vote.
Stock repurchase program
On March 18, 2013 and August 28, 2014, our board of directors authorized repurchase programs for the repurchase of up to $10.0 million and $10.0 million, respectively, of our shares of common stock through open market purchases.
Under the March 18, 2013 program, which we completed in the quarter ended March 31, 2014, we utilized $10.0 million of cash to repurchase 1,674,584 shares of our common stock at an average purchase price of $5.97 per share. Under the August 28, 2014 program, which expired in September 2015, we utilized $4.4 million of cash to repurchase 573,257 shares of our common stock at an average purchase price of $7.59 per share.
The repurchased shares are retired and designated as authorized but unissued shares. The timing and amount of repurchase transactions under our stock repurchase programs depends on market conditions and other considerations. We use the par value method of accounting for our stock repurchases. Under the par value method, common stock is first charged with the par value of the shares involved. The excess of the cost of shares acquired over the par value is allocated to additional paid-in capital, or APIC, based on an estimated average sales price per issued share with the excess amounts charged to retained earnings. As a result of our stock repurchases during fiscal 2016, we reduced common stock and APIC by an aggregate of $249,000 and charged $321,000 to retained earnings. As a result of our stock repurchases during fiscal 2015, we reduced common stock and APIC by an aggregate of $1.6 million and charged $2.2 million to retained earnings. As a result of our stock repurchases during fiscal 2014, we reduced common stock and APIC by an aggregate of $4.1 million and charged $3.8 million to retained earnings.
Stock plans
Under our 1999 Stock Option Plan, or 1999 Plan, 2002 Executive Stock Option Plan, or 2002 Plan, 2009 Equity Incentive Plan, or 2009 Plan, and 2011 Stock Option and Grant Plan, or 2011 Plan, eligible employees, directors, and consultants are able to participate in our future performance through awards of nonqualified stock options, incentive stock options and restricted stock units, or RSUs, through the receipt of such awards as authorized by our board of directors. Incentive stock options may be granted only to employees to purchase our common stock at prices equal to or greater than the fair market value on the date of grant. Nonqualified stock options to purchase our common stock may be granted at prices not less than 85% of the fair market value on the date of grant. Options generally vest over a four-year period beginning from the date of grant and generally expire 10 years from the date of grant. RSUs generally vest annually over a four-year period beginning from the date of grant. Prior to our IPO, we granted options outside of our stock option plans with terms substantially similar to the terms of options granted under our plans.
On the first day of each fiscal year, the number of shares available and reserved for issuance under the 2009 Plan will be annually increased by an amount equal to the lesser of 1,666,666 shares of common stock; 4% of the outstanding shares of our common stock as of the last day of our immediately preceding fiscal year; or an amount determined by our board of directors.
F-24
A summary of our stock option activity is as follows (in thousands except per share and contractual life amounts):
Number of shares | Weighted average exercise price per share | Weighted average remaining contractual life (years) | Aggregate intrinsic value | ||||||||||
Options outstanding as of June 30, 2015 | 4,781 | $ | 5.40 | ||||||||||
Granted | 2,363 | 6.62 | |||||||||||
Exercised | (1,299 | ) | 1.19 | ||||||||||
Canceled | (475 | ) | 7.10 | ||||||||||
Options outstanding as of June 30, 2016 | 5,370 | $ | 6.80 | 6.57 | $ | 295 | |||||||
As of June 30, 2016: | |||||||||||||
Options vested and expected to vest | 4,929 | $ | 6.81 | 6.38 | $ | 290 | |||||||
Options exercisable | 2,907 | $ | 6.90 | 5.13 | $ | 257 | |||||||
During fiscal 2016, 2015 and 2014, the total cash received from the exercise of stock options was $1.5 million, $4.4 million and $896,000, respectively, and the total intrinsic value of stock options exercised was $6.1 million, $2.4 million and $467,000, respectively.
A summary of our RSU activity is as follows (in thousands except contractual life amounts):
Number of Shares | Weighted average remaining contractual life (years) | Aggregate intrinsic value | |||||||
RSUs outstanding as of June 30, 2015 | 4,290 | ||||||||
Granted | 1,617 | ||||||||
Vested | (1,478 | ) | |||||||
Canceled | (1,127 | ) | |||||||
RSUs outstanding as of June 30, 2016 | 3,302 | 1.32 | $ | 16,838 | |||||
As of June 30, 2016: | |||||||||
RSUs expected to vest | 2,798 | 1.21 | $ | 14,272 | |||||
Performance-based RSUs
On May 5, 2015, our board of directors approved the 2015 Performance Share Program, or 2015 Program, including the award calculation methodology, under the terms of our 2009 Equity Incentive Plan. Under the 2015 Program, RSUs and/or cash bonuses may be earned based on the achievement of specified performance conditions measured over periods ranging from approximately 15 to 21 months. Participants in the 2015 Program generally have the ability to receive 0% to 100% of the target number of restricted stock units or cash bonus originally granted. The expense associated with performance-based RSU grants is recorded when the performance condition is determined to be probable. Fully vested restricted stock units and or cash bonuses will be awarded upon management’s certification of the level of achievement.
As of June 30, 2016, we had granted 106,000 RSUs under the 2015 Program, no RSUs had been earned and 36,000 RSUs had been canceled. At June 30, 2016, based upon our closing stock price the total unrecognized stock-based compensation expense related to the 70,000 RSUs issued and outstanding in connection with the 2015 program was $357,000.
F-25
A summary of our shares available for grant activity is as follows (in thousands):
Number of Shares | |||
Shares available for grant as of June 30, 2015 | 1,947 | ||
Additional shares authorized pursuant to annual increase provisions of 2009 Equity Incentive Plan | 1,621 | ||
Granted | (3,980 | ) | |
RSUs withheld for taxes in net share settlements | 531 | ||
Canceled | 1,600 | ||
Shares available for grant as of June 30, 2016 | 1,719 | ||
The following table summarizes the stock-based compensation expense recorded for stock options, RSUs and restricted common stock issued to employees and nonemployees (in thousands):
Fiscal Year Ended June 30, | ||||||||||||
2016 | 2015 | 2014 | ||||||||||
Cost of revenue | $ | 143 | $ | 98 | $ | 100 | ||||||
Research and development | 6,062 | 5,275 | 4,489 | |||||||||
Selling and marketing | 2,844 | 2,943 | 3,306 | |||||||||
General and administrative | 2,317 | 3,112 | 3,640 | |||||||||
Total stock-based compensation expense | $ | 11,366 | $ | 11,428 | $ | 11,535 | ||||||
The following table summarizes the stock-based compensation expense recorded for stock options, RSUs and restricted common stock issued to employees and nonemployees (in thousands):
Fiscal Year Ended June 30, | ||||||||||||
2016 | 2015 | 2014 | ||||||||||
Stock option awards | $ | 1,893 | $ | 2,071 | $ | 3,930 | ||||||
RSU awards | 9,473 | 8,851 | 5,781 | |||||||||
Restricted common stock | — | 506 | 1,824 | |||||||||
Total stock-based compensation expense | $ | 11,366 | $ | 11,428 | $ | 11,535 | ||||||
We generally use the Black-Scholes option-pricing model to determine the fair value of stock option awards. The determination of the fair value of stock option awards on the date of grant is affected by the stock price as well as assumptions regarding a number of complex and subjective variables. These variables include expected stock price volatility over the term of the awards, actual and projected employee stock option exercise behaviors, risk-free interest rates and expected dividends. The weighted average assumptions used to value stock options granted were as follows:
Fiscal Year Ended June 30, | |||||||||
2016 | 2015 | 2014 | |||||||
Expected volatility | 47 | % | 54 | % | 62 | % | |||
Expected term (in years) | 4.53 | 4.38 | 4.45 | ||||||
Risk-free interest rate | 1.35 | % | 1.60 | % | 1.44 | % | |||
Dividend yield | — | — | — | ||||||
Expected volatility. The expected volatility used is based on the historical volatility of our common stock. In evaluating similarity, we considered factors such as industry, stage of a company’s life cycle, revenue and market capitalization.
Expected term. The expected term represents the period that our stock-based awards are expected to be outstanding. The expected term was based on an analysis of our historical exercise and cancellation activity.
F-26
Risk-free interest rate. The risk-free rate is based on U.S. Treasury zero coupon issues with remaining terms similar to the expected term on the options.
Dividend yield. We have never declared or paid any cash dividends on our common stock and do not plan to pay cash dividends in the foreseeable future and, therefore, use an expected dividend yield of zero in the valuation model.
We recognize the estimated stock-based compensation expense of RSUs and restricted common stock, net of estimated forfeitures, over the vesting term. The estimated stock-based compensation cost is based on the fair value of our common stock on the date of grant.
At June 30, 2016, the total unrecognized stock-based compensation expense related to employee options was $4.5 million, net of estimated forfeitures, and will be amortized over a weighted average period of 2.97 years. The total fair value of stock options that vested during fiscal 2016, 2015 and 2014 was $2.0 million, $1.8 million and $4.1 million, respectively. At June 30, 2016, the total unrecognized stock-based compensation expense related to RSUs was $13.2 million, net of estimated forfeitures, and will be amortized over a weighted average period of 2.26 years. The total fair value of RSUs that vested during fiscal 2016, 2015 and 2014 was $9.2 million, $8.2 million and $4.1 million, respectively.
Shares reserved for future issuance
Common stock reserved for future issuance as of June 30, 2016 was as follows (in thousands):
Stock options outstanding | 5,370 | ||
RSUs outstanding | 3,302 | ||
Available for future grants | 1,719 | ||
Total common shares reserved for future issuance | 10,391 | ||
9. | Income taxes |
The domestic and foreign components of loss before provision (benefit) for income taxes were as follows (in thousands):
Fiscal Year Ended June 30, | ||||||||||||
2016 | 2015 | 2014 | ||||||||||
United States | $ | (36,142 | ) | $ | (37,583 | ) | $ | (34,549 | ) | |||
Foreign | 1,332 | 1,514 | 1,010 | |||||||||
Loss before provision (benefit) for income taxes | $ | (34,810 | ) | $ | (36,069 | ) | $ | (33,539 | ) | |||
The provision (benefit) for income taxes consists of the following (in thousands):
Fiscal Year Ended June 30, | ||||||||||||
2016 | 2015 | 2014 | ||||||||||
Current income taxes: | ||||||||||||
Federal | $ | 70 | $ | (10,214 | ) | $ | (7,506 | ) | ||||
State | 5 | (3,674 | ) | (397 | ) | |||||||
Foreign | 261 | 219 | 555 | |||||||||
Total current income taxes | 336 | (13,669 | ) | (7,348 | ) | |||||||
Deferred income taxes: | ||||||||||||
Federal | — | 1,334 | 3,205 | |||||||||
State | — | — | 128 | |||||||||
Foreign | 175 | (671 | ) | — | ||||||||
Total deferred income taxes | 175 | 663 | 3,333 | |||||||||
Total provision (benefit) for income taxes | $ | 511 | $ | (13,006 | ) | $ | (4,015 | ) | ||||
F-27
The provision (benefit) for income taxes differs from the amount computed by applying the statutory federal income tax rate as follows (in thousands):
Fiscal Year Ended June 30, | ||||||||||||
2016 | 2015 | 2014 | ||||||||||
Tax at federal statutory tax rate | $ | (12,184 | ) | $ | (12,624 | ) | $ | (11,738 | ) | |||
State taxes—net of federal benefit | 8 | (893 | ) | (269 | ) | |||||||
Non-deductible expenses | 129 | 68 | 495 | |||||||||
Research and development credits | — | (2,678 | ) | (983 | ) | |||||||
Section 199 deduction | — | (907 | ) | 425 | ||||||||
Foreign income taxed at different rates | (2 | ) | (276 | ) | (119 | ) | ||||||
Stock-based compensation expense | 562 | 1,011 | 1,368 | |||||||||
Tax exempt income | (302 | ) | (844 | ) | (265 | ) | ||||||
Change in valuation allowance - federal | 12,270 | 6,138 | 6,959 | |||||||||
Change in tax accounting method | — | (1,121 | ) | — | ||||||||
FIN 48 | 52 | (827 | ) | — | ||||||||
Other | (22 | ) | (53 | ) | 112 | |||||||
Total provision (benefit) for income taxes | $ | 511 | $ | (13,006 | ) | $ | (4,015 | ) | ||||
Our provision (benefit) for income taxes was $0.5 million in fiscal 2016 compared to $(13.0) million in fiscal 2015. Our effective tax rate, which resulted in the recognition of a tax expense, was 1% in fiscal 2016 compared to an effective tax rate, which resulted in the recognition of a tax benefit, of 36% in fiscal 2015. Our effective tax rate in fiscal 2016 was attributable primarily to income taxes in certain foreign jurisdictions where we have profit. Our effective tax rate in fiscal 2015 was attributable primarily to tax benefits recorded from the anticipated federal income tax refund of $5.4 million (of which $4.1 million was recognized in fiscal 2015 and $1.3 million was recognized in fiscal 2014; a total of $4.8 million of this expected refund had been received by us as of June 30, 2016); the recognition of a state income tax refund of $3.0 million and a refund of $1.1 million from a change in tax accounting method, both related to prior years and received in fiscal 2015; and the reversal of tax reserves of $4.2 million due to loss carryback, expiration of the statute of limitations, and settlement of our California audit. Our effective tax rate in fiscal 2016 was lower than the tax computed at the U.S. federal statutory income tax rate due primarily to losses for which no benefit will be recognized since they are not more likely than not to be realized due to the lack of current and future income and the inability to carry back losses within the two year carryback period. Our benefit for income taxes was $(4.0) million in fiscal 2014. Our effective tax rate of 12% in fiscal 2014 was lower than the tax computed at the U.S. federal statutory income tax rate due primarily to the increase in the valuation allowance which resulted in additional federal tax expense of $7.0 million.
Due to the limitations of the two year loss carryback for federal tax purposes, we do not anticipate any refunds for losses incurred in fiscal 2017 or thereafter.
F-28
Deferred income taxes reflect the net tax effects of temporary differences between the carrying amounts of assets and liabilities for financial reporting purposes and the amounts used for income tax purposes. Significant components of our net deferred tax assets were as follows (in thousands):
June 30, | ||||||||
2016 | 2015 | |||||||
Deferred tax assets: | ||||||||
Federal, state and foreign net operating losses | $ | 16,482 | $ | 5,003 | ||||
Federal and state tax credits | 6,696 | 5,530 | ||||||
Stock-based compensation | 4,747 | 4,570 | ||||||
Accrued expenses and reserves | 5,465 | 5,331 | ||||||
Capitalized expense | 252 | 333 | ||||||
Unrealized losses on investments | 727 | 306 | ||||||
Acquired intangible assets | 596 | 233 | ||||||
Total deferred tax assets: | 34,965 | 21,306 | ||||||
Deferred tax liabilities: | ||||||||
Property and equipment | (468 | ) | (1,321 | ) | ||||
Capitalized software | (3,734 | ) | (1,150 | ) | ||||
Unrealized gains on investments | (353 | ) | (393 | ) | ||||
Total deferred tax liabilities: | (4,555 | ) | (2,864 | ) | ||||
Deferred tax assets, net of liabilities: | 30,410 | 18,442 | ||||||
Valuation allowance - worldwide | (29,820 | ) | (17,672 | ) | ||||
Net deferred tax assets: | $ | 590 | $ | 770 | ||||
All available evidence, both positive and negative, was considered to determine whether, based upon the weight of the evidence, a valuation allowance for deferred tax assets is needed. In fiscal 2015, we released the valuation allowance of $769,000 on deferred tax assets, net of liabilities, in Germany due to cumulative net income, expectation of continued profits, and continued growth and sustainability of the European business.
Due to operating losses in previous years and continued earnings volatility, we maintain a valuation allowance on the majority of our deferred tax assets, net of liabilities, since the assets are not more likely than not to be realized based upon our assessment of all positive and negative evidence. Realization of deferred tax assets is dependent upon future taxable earnings and losses, the timing of which is uncertain. Due to losses in previous years, and expected losses in fiscal 2017 and potentially future years in the U.S., we maintained a full valuation allowance on deferred tax assets in the U.S. Due to foreign operating losses in previous years and continued foreign earnings volatility, we continued to maintain a full valuation allowance for our foreign deferred tax assets in China, Brazil and the United Kingdom. Our valuation allowance increased from the prior year by approximately $12.1 million, $4.7 million, and $10.1 million in fiscal 2016, 2015 and 2014, respectively.
We provide for U.S. income taxes on the earnings of foreign subsidiaries unless the subsidiaries' earnings are permanently reinvested outside the U.S. To the extent that the foreign earnings previously treated as permanently reinvested are repatriated, the related U.S. liability may be reduced by any foreign income taxes paid on these earnings. As of June 30, 2016, the cumulative amount of earnings upon which U.S. income taxes have not been provided was approximately $5.1 million. The net unrecognized deferred tax liability for these earnings was zero since we have significant net operating losses which are available to offset the repatriation income.
As of June 30, 2016, we had federal and California net operating loss carryforwards for income tax purposes of $41.9 million and $7.8 million, respectively. These loss carryforwards will begin to expire in fiscal 2020 for federal purposes and fiscal 2017 for California purposes. In addition, we had federal and California research and development tax credit carryforwards of $3.8 million and $6.6 million, respectively, as of June 30, 2016. The federal research credits will begin to expire in fiscal 2023 and the California research credits can be carried forward indefinitely. The loss carryforwards and certain credits are subject to annual limitation under Internal Revenue Code Section 382.
F-29
As of June 30, 2016, we also had foreign net operating loss carryforwards of $6.4 million, which begin to expire in fiscal 2019. Due to uncertainty regarding our ability to utilize the foreign net operating loss carryforwards in certain jurisdictions, we have placed a valuation allowance of $660,000 on these deferred tax assets.
The following is a tabular reconciliation of the total amounts of unrecognized tax benefits (in thousands):
Fiscal Year Ended June 30, | ||||||||||||
2016 | 2015 | 2014 | ||||||||||
Unrecognized tax benefit—beginning of period | $ | 6,114 | $ | 6,931 | $ | 6,340 | ||||||
Increase in tax positions taken during the current period | 513 | 562 | 623 | |||||||||
Increase in tax positions taken during the prior period | 74 | 170 | 555 | |||||||||
Decrease in tax positions taken during the prior period | — | — | (261 | ) | ||||||||
Decrease in tax positions due to settlements | — | (600 | ) | — | ||||||||
Lapse of statute of limitations | (39 | ) | (949 | ) | (326 | ) | ||||||
Unrecognized tax benefit—end of period | $ | 6,662 | $ | 6,114 | $ | 6,931 | ||||||
At June 30, 2016, 2015 and 2014, there were $1.6 million, $1.7 million and $5.5 million of unrecognized tax benefits that if recognized would affect the annual effective tax rate.
We file income tax returns in the U.S. with the Internal Revenue Service, or IRS, California, various states, and foreign tax jurisdictions in which we have subsidiaries. The statute of limitations remains open for fiscal 2012 through fiscal 2015 in the U.S., for fiscal 2010 through fiscal 2015 in state jurisdictions, and for fiscal 2011 through 2014 in foreign jurisdictions. Fiscal years outside the normal statute of limitation remain open to audit by tax authorities due to tax attributes generated in those early years which have been carried forward and may be audited in subsequent years when utilized. We are currently under audit by the IRS for fiscal 2012 through fiscal 2014 and the statute of limitations has been extended for fiscal 2012 to allow the IRS additional time to complete its audit. As of June 30, 2016, we were under audit by the state of New York for fiscal 2010 through fiscal 2012 and the statute of limitations has been extended for fiscal 2010 through fiscal 2012 to allow New York additional time to complete its audit. See Note 15 Subsequent events.
We believe it is reasonably possible that the gross unrecognized tax benefits as of June 30, 2016 could decrease (whether by payment, release, or a combination of both) by approximately $4.0 million in the next 12 months. We recognize interest and penalties related to unrecognized tax positions as part of our provision for federal, state and foreign income taxes. During fiscal 2016, 2015 and 2014, we recognized approximately $91,000, $134,000 and $278,000 in interest and penalties. We had accrued $570,000 and $493,000 for the payment of interest and penalties at June 30, 2016 and 2015, respectively.
On December 18, 2015, the Protecting Americans from Tax Hikes Act of 2015 became effective, which made several tax extender provisions permanent as well as extending others. Most notable was the permanent extension of the research and development credit which has been temporary since its enactment in 1981. Due to the inability to utilize the research and development credits, we currently do not expect this legislation to have a material impact on our financial statements.
10. Acquisitions
skobbler GmbH
On January 29, 2014, we completed our acquisition of all of the shares of privately held skobbler GmbH, or skobbler, a navigation company based in Germany. We acquired skobbler for consideration of approximately $23.8 million, consisting of approximately $19.2 million in cash and $4.6 million in shares of our restricted common stock. We believe the acquisition of skobbler will enable us to combine its OSM-based GPS navigation technology with our existing mobile navigation solutions. The transaction has been accounted for under the acquisition method of accounting. We recorded the assets acquired and liabilities assumed at their estimated fair value, with the difference between the fair value of the net assets acquired and the purchase consideration reflected as goodwill.
The total fair value of acquisition consideration of $23.8 million was comprised of $19.2 million in cash and 731,623 shares of our common stock valued at $4.6 million. The 731,623 shares of our common stock were held in escrow and were released at the rate of 50% per year on each anniversary date of closing. These shares were released from escrow solely with the passage of time and do not contain a service or performance requirement. In addition to the total purchase consideration, we issued 634,920 inducement RSUs to the founders of skobbler. The fair value of the 634,920 RSUs issued in connection with the
F-30
acquisition was $4.0 million, which was accounted for as post-combination stock-based compensation and was amortized over a weighted average period of 2.0 years.
The fair value of our common stock issued in connection with the acquisition was determined to be $6.32 per share, the closing price of our common stock on the acquisition measurement date, which is the date the acquisition closed.
The following table reflects the values of the assets acquired and liabilities assumed as of the acquisition date (in thousands):
Cash | $ | 100 | ||
Accounts receivable | 177 | |||
Other assets | 209 | |||
Customer relationships | 400 | |||
Developed technology | 7,100 | |||
Goodwill | 16,907 | |||
Liabilities assumed | (1,135 | ) | ||
Total value of assets acquired and liabilities assumed | $ | 23,758 | ||
We determined the fair value of developed technology and customer relationships to be $7.1 million and $400,000, respectively. The fair value of the developed technology and customer relationships is being amortized using the straight-line method over the estimated life of 7.0 years and 18 months, respectively. Developed technology and customer relationships are included in goodwill and intangible assets, net of amortization on the consolidated balance sheets.
Goodwill of $16.9 million was recorded as the excess of the fair value of the acquisition consideration over the fair value of the net assets acquired. This asset is attributed to buyer-specific value resulting from synergies that are not included in the fair value of assets. No goodwill was deemed to be deductible for income tax purposes.
Included in the acquisition consideration is $3.7 million in cash that was paid by us and deposited in a third party escrow account to satisfy potential indemnification claims. The full amount was released from escrow in April 2015.
For fiscal 2014, we recognized $1.1 million in acquisition related costs that were included in general and administrative expenses. The amounts of revenue and income from skobbler for fiscal 2014 were not material.
11. Restructuring
In the fourth quarter of fiscal 2014, in order to further align our resources and consolidate facilities, we initiated a restructuring plan consisting of the elimination of 108 full-time positions in the U.S. and China and we recorded restructuring charges of $2.4 million related to severance and benefits for the positions eliminated. Earlier in fiscal 2014, we commenced our consolidation of our Sunnyvale, California headquarters facilities from two buildings into one, and during the fourth quarter we closed our Boston, Massachusetts office. As a result, we recorded restructuring charges of $2.0 million related to the impairment of the facility leases. Restructuring expenses of $1.2 million incurred in fiscal 2015 were associated with facility lease impairment in connection with the consolidation of our Sunnyvale headquarters facilities in fiscal 2014. During fiscal 2016, in connection with our office lease termination agreement described further in Note 6 Commitments and contingencies, we reversed $1.5 million previously charged to our restructuring accrual as facility exit costs. As of June 30, 2016, our remaining restructuring liabilities are primarily associated with facility exit costs.
F-31
The activity related to the restructuring liabilities established during fiscal 2015 and 2016 is presented in the following table (in thousands):
Severance and Benefits | Facility Exit Costs and Asset Impairment | Total | ||||||||||
Balance at June 30, 2014 | $ | 2,126 | $ | 2,743 | $ | 4,869 | ||||||
Restructuring expenses | — | 1,150 | 1,150 | |||||||||
Cash payments | (2,123 | ) | (1,640 | ) | (3,763 | ) | ||||||
Other | (3 | ) | 391 | 388 | ||||||||
Balance at June 30, 2015 | $ | — | $ | 2,644 | $ | 2,644 | ||||||
Restructuring expenses | 146 | (11 | ) | 135 | ||||||||
Cash payments | (139 | ) | (1,145 | ) | (1,284 | ) | ||||||
Other | — | (1,468 | ) | (1,468 | ) | |||||||
Balance at June 30, 2016 | $ | 7 | $ | 20 | $ | 27 | ||||||
Of the $2.6 million in total restructuring liabilities as of June 30, 2015, $1.2 million was recorded in other accrued expenses and $1.4 million was recorded in other long-term liabilities on our consolidated balance sheet.
F-32
12. Industry segment and geographic information
We report segment information based on the “management” approach. The management approach designates the internal reporting used by management for making decisions and assessing performance as the source of our reportable segments.
Our CEO, the chief operating decision maker, reviews revenue and gross margin information for each of our reportable segments. In addition, with the exception of goodwill and intangible assets, we do not identify or allocate our assets by the reportable segments.
Commencing July 1, 2014, we began to report results in three business segments:
Automotive - Our automotive segment provides our map and navigation platform to auto manufacturers and original equipment manufacturers, or OEMs, for distribution with their vehicles. Our automotive solutions are typically a self-contained solution including software and related services and content within the car, or on-board, and are often enhanced through connection to data services for additional real time capabilities such as maps, POI, or traffic. We also provide a mobile phone-based navigation solution utilizing wireless connectivity, or brought-in, that allows OEMs to project the phone’s screen to an in-car display unit.
Advertising - Our advertising segment provides interactive mobile advertisements on behalf of our advertising clients to consumers based specifically on the location of the user and other sophisticated targeting capabilities. Our customers include advertising agencies, direct advertisers and channel partners.
Mobile Navigation - Our mobile navigation segment provides our map and navigation platform to end users through mobile devices. We distribute our services through our wireless carrier partners, and directly to consumers through mobile application stores and marketplaces.
Prior to July 1, 2014, we operated in a single segment: location-based platform services. We have conformed our single segment results for fiscal 2014 to the current period presentation for comparative purposes.
F-33
Our segment results were as follows (dollars in thousands):
Fiscal Year Ended June 30, | ||||||||||||
2016 | 2015 | 2014 | ||||||||||
Revenue | ||||||||||||
Automotive | $ | 135,372 | $ | 103,100 | $ | 75,153 | ||||||
Advertising | 21,744 | 17,941 | 11,699 | |||||||||
Mobile Navigation | 26,230 | 39,198 | 63,461 | |||||||||
Total revenue | 183,346 | 160,239 | 150,313 | |||||||||
Cost of revenue | ||||||||||||
Automotive | 81,293 | 56,319 | 37,135 | |||||||||
Advertising | 12,296 | 11,710 | 7,012 | |||||||||
Mobile Navigation | 7,208 | 10,755 | 16,694 | |||||||||
Total cost of revenue | 100,797 | 78,784 | 60,841 | |||||||||
Gross profit | ||||||||||||
Automotive | 54,079 | 46,781 | 38,018 | |||||||||
Advertising | 9,448 | 6,231 | 4,687 | |||||||||
Mobile Navigation | 19,022 | 28,443 | 46,767 | |||||||||
Total gross profit | $ | 82,549 | $ | 81,455 | $ | 89,472 | ||||||
Gross margin | ||||||||||||
Automotive | 40 | % | 45 | % | 51 | % | ||||||
Advertising | 43 | % | 35 | % | 40 | % | ||||||
Mobile Navigation | 73 | % | 73 | % | 74 | % | ||||||
Total gross margin | 45 | % | 51 | % | 60 | % | ||||||
Revenue by geographic region is based on the billing address of our customers. The following table sets forth revenue and property and equipment by geographic region (in thousands):
Fiscal Year Ended June 30, | ||||||||||||
2016 | 2015 | 2014 | ||||||||||
Revenue | ||||||||||||
United States | $ | 178,323 | $ | 153,371 | $ | 141,135 | ||||||
International | 5,023 | 6,868 | 9,178 | |||||||||
Total revenue | $ | 183,346 | $ | 160,239 | $ | 150,313 | ||||||
June 30, | ||||||||||||
Property and equipment, net | 2016 | 2015 | ||||||||||
United States | $ | 4,400 | $ | 6,319 | ||||||||
International | 847 | 807 | ||||||||||
Total property and equipment, net | $ | 5,247 | $ | 7,126 | ||||||||
F-34
13. Employee savings and retirement plan
We sponsor a defined contribution plan under Internal Revenue Code Section 401(k), or the 401(k) Plan. Most of our U.S. employees are eligible to participate following the start of their employment. Employees may contribute up to the lesser of 100% of their current compensation to the 401(k) Plan or an amount up to a statutorily prescribed annual limit. We pay the direct expenses of the 401(k) Plan and beginning in July 2006, we began to match employee contributions up to 4% of an employee’s salary. Contributions made by us are subject to certain vesting provisions. We made matching contributions and recorded expense of $1.4 million, $1.3 million and $1.6 million for fiscal 2016, 2015 and 2014, respectively.
14. Quarterly financial data (unaudited)
Summarized quarterly financial information for fiscal 2016 and 2015 is as follows (in thousands, except per share data):
Three Months Ended | ||||||||||||||||||||||||||||||||
Consolidated statements of operations data (in thousands) | Sept. 30, 2014 | Dec. 31, 2014 | Mar. 31, 2015 | June 30, 2015 | Sept. 30, 2015 | Dec. 31, 2015 | Mar. 31, 2016 | June 30, 2016 | ||||||||||||||||||||||||
(unaudited) | ||||||||||||||||||||||||||||||||
Revenue | $ | 34,987 | $ | 39,780 | $ | 42,286 | $ | 43,186 | $ | 44,061 | $ | 45,253 | $ | 46,278 | $ | 47,754 | ||||||||||||||||
Gross profit | 19,027 | 20,247 | 21,447 | 20,734 | 20,674 | 20,721 | 20,172 | 20,982 | ||||||||||||||||||||||||
Net loss | $ | (7,937 | ) | $ | (2,723 | ) | $ | (4,767 | ) | $ | (7,636 | ) | $ | (10,846 | ) | $ | (6,639 | ) | $ | (9,838 | ) | $ | (7,998 | ) | ||||||||
Net loss per share: | ||||||||||||||||||||||||||||||||
Basic and diluted | $ | (0.20 | ) | $ | (0.07 | ) | $ | (0.12 | ) | $ | (0.19 | ) | $ | (0.27 | ) | $ | (0.16 | ) | $ | (0.23 | ) | $ | (0.19 | ) | ||||||||
F-35
15. Subsequent event
In July 2016, the state of New York completed its audit of our income taxes for fiscal 2010 through fiscal 2012. We paid $442,000 to settle the audit and expect to record a tax benefit of approximately $1.0 million in July 2016 to reverse the related tax reserves.
F-36
SCHEDULE II
VALUATION AND QUALIFYING ACCOUNTS
(in thousands)
Beginning Balance | Chargeback Additions | Chargeback Reductions | Ending Balance | |||||||||||||
Trade Receivable Allowances: | ||||||||||||||||
Year Ended June 30, 2014 | $ | 241 | $ | 1,812 | $ | (1,847 | ) | $ | 206 | |||||||
Year Ended June 30, 2015 | $ | 206 | $ | 1,079 | $ | (1,074 | ) | $ | 211 | |||||||
Year Ended June 30, 2016 | $ | 211 | $ | 756 | $ | (856 | ) | $ | 111 | |||||||
Beginning Balance | Additions | Reductions | Ending Balance | |||||||||||||
Valuation Allowance for Deferred Tax Assets: | ||||||||||||||||
Year Ended June 30, 2014 | $ | 2,913 | $ | 10,059 | $ | (3 | ) | $ | 12,969 | |||||||
Year Ended June 30, 2015 | $ | 12,969 | $ | 6,356 | $ | (1,653 | ) | $ | 17,672 | |||||||
Year Ended June 30, 2016 | $ | 17,672 | $ | 12,271 | $ | (123 | ) | $ | 29,820 | |||||||
F-37
INDEX TO EXHIBITS
Exhibit Number | Description | Incorporated by Reference From Form | Incorporated by Reference From Exhibit Number | Date Filed | ||||
3.1 | Second Amended and Restated Certificate of Incorporation of TeleNav, Inc. filed on May 18, 2010. | 10-K | 3.1 | 9/24/2010 | ||||
3.1.1 | Certificate of Amendment of Second Amended and Restated Certificate of Incorporation of Telenav, Inc. filed on November 27, 2012. | 8-K | 3.1.1 | 12/3/2012 | ||||
3.2 | Amended and Restated Bylaws of TeleNav, Inc. effective as of May 18, 2010. | 10-K | 3.2 | 9/24/2009 | ||||
4.1 | Specimen Common Stock Certificate of TeleNav, Inc. | S-1/A | 4.1 | 1/5/2010 | ||||
4.2 | Fifth Amended and Restated Investors’ Rights Agreement, dated April 14, 2009, between TeleNav, Inc. and certain holders of TeleNav, Inc.’s capital stock named therein. | S-1 | 4.2 | 10/30/2009 | ||||
10.1 | Form of Indemnification Agreement between Registrant and its directors and officers. | S-1 | 10.1 | 10/30/2009 | ||||
10.2# | 1999 Stock Option Plan and forms of agreement thereunder. | S-1 | 10.2 | 10/30/2009 | ||||
10.3# | 2002 Executive Stock Option Plan and forms of agreement thereunder. | S-1 | 10.3 | 10/30/2009 | ||||
10.4# | 2009 Equity Incentive Plan and forms of agreement thereunder. | S-1 | 10.4 | 10/30/2009 | ||||
10.4.1# | 2009 Equity Incentive Plan, as amended. | 8-K | 10.4.1 | 12/3/2012 | ||||
10.4.2# | 2009 Equity Incentive Plan, amended and restated as of January 26, 2016. | Filed herewith | ||||||
10.6# | Employment Agreement, dated as of April 7, 2009, between TeleNav, Inc. and Loren Hillberg. | S-1 | 10.6 | 10/30/2009 | ||||
10.6.1# | Amended and Restated Employment Agreement, dated as of October 28, 2009, between TeleNav, Inc. and Loren Hillberg. | S-1 | 10.6.1 | 10/30/2009 | ||||
10.7# | Employment Agreement, dated as of May 4, 2005, between TeleNav, Inc. and Hassan Wahla. | S-1 | 10.7 | 10/30/2009 | ||||
10.8# | Employment Agreement, dated October 28, 2009, between TeleNav, Inc. and H.P. Jin. | S-1 | 10.8 | 10/30/2009 | ||||
10.9# | Form of Employment Agreement between TeleNav, Inc. and each of Y.C. Chao, Salman Dhanani, Robert Rennard and Hassan Wahla. | S-1 | 10.9 | 10/30/2009 | ||||
10.15† | License Agreement effective as of July 1, 2009, by and between TeleNav, Inc. and Tele Atlas North America, Inc. | S-1/A | 10.15 | 12/8/2009 | ||||
10.15.1† | Amendment No.1 effective as of March 1, 2010 to the License Agreement, dated as of July 1, 2009, by and between TeleNav, Inc. and Tele Atlas North America, Inc. | S-1/A | 10.15.1 | 4/26/2010 | ||||
10.15.2† | Amendment No. 2 effective as of August 1, 2010 to the License Agreement, dated as of July 1, 2009, as amended, by and between TeleNav, Inc. and Tele Atlas North America, Inc. | 10-Q | 10.15.2 | 11/15/2010 | ||||
10.15.3† | Amendment No. 3 effective as of December 14, 2010 to the License Agreement, dated as of July 1, 2009, as amended, by and between TeleNav, Inc. and Tele Atlas North America, Inc. | 10-K | 10.15.3 | 9/7/2012 | ||||
1
Exhibit Number | Description | Incorporated by Reference From Form | Incorporated by Reference From Exhibit Number | Date Filed | ||||
10.15.4† | Amendment No. 4 effective as of November 21, 2011 to the License Agreement, dated as of July 1, 2009, as amended, by and between TeleNav, Inc. and TomTom North America, Inc. | 10-K | 10.15.4 | 9/7/2012 | ||||
10.15.5† | Amendment No. 5 effective as of March 24, 2011 to the License Agreement, dated as of July 1, 2009, as amended, by and between TeleNav, Inc. and TomTom North America, Inc. | 10-K | 10.15.5 | 9/7/2012 | ||||
10.15.6† | Amendment No. 6 effective as of July 1, 2012 to the License Agreement, dated as of July 1, 2009, as amended, by and between TeleNav, Inc. and TomTom North America, Inc. | 10-K | 10.15.6 | 9/7/2012 | ||||
10.15.7† | Amendment No. 7 effective as of November 1, 2012 to the License Agreement, dated as of July 1, 2009, as amended, by and between Telenav, Inc. and TomTom North America, Inc. | 10-Q | 10.15.7 | 2/8/2013 | ||||
10.15.8† | Amendment No. 8 effective as of November 1, 2012 to the License Agreement, dated as of July 1, 2009, as amended, by and between Telenav, Inc. and TomTom North America, Inc. | 10-Q | 10.15.8 | 2/8/2013 | ||||
10.16† | Data License Agreement, dated as of December 1, 2002, by and between Televigation, Inc. and Navigation Technologies Corporation. | S-1/A | 10.16 | 2/2/2010 | ||||
10.16.1† | Third Amendment dated December 22, 2004 to the Data License Agreement, dated as of December 1, 2002, by and between Televigation, Inc. and NAVTEQ North America, LLC. | S-1/A | 10.16.1 | 4/26/2010 | ||||
10.16.2† | Fourth Amendment dated May 18, 2007 to the Data License Agreement, dated as of December 1, 2002, by and between TeleNav, Inc. and NAVTEQ North America, LLC. | S-1/A | 10.16.2 | 2/2/2010 | ||||
10.16.3† | Fifth Amendment dated January 15, 2008 to the Data License Agreement, dated as of December 1, 2002, by and between TeleNav, Inc. and NAVTEQ North America, LLC. | S-1/A | 10.16.3 | 2/2/2010 | ||||
10.16.4† | Seventh Amendment dated December 16, 2008 to the Data License Agreement, dated as of December 1, 2002, by and among TeleNav, Inc., NAVTEQ Europe B.V. and NAVTEQ North America, LLC. | S-1/A | 10.16.4 | 4/26/2010 | ||||
10.16.5 | Eighth Amendment dated December 15, 2008 to the Data License Agreement, dated as of December 1, 2002, by and between TeleNav, Inc. and NAVTEQ North America, LLC. | S-1 | 10.16.5 | 10/30/2009 | ||||
10.16.6† | Territory License No. 1, dated as of December 1, 2002, by and between Televigation, Inc. and Navigation Technologies Corporation. | S-1/A | 10.16.6 | 4/26/2010 | ||||
10.16.7† | Territory License No. 2, dated as of June 30, 2003, by and between Televigation, Inc. and NAVTEQ North America, LLC. | S-1/A | 10.16.7 | 4/26/2010 | ||||
10.16.8† | Territory License No. 3, dated as of February 7, 2006, by and between TeleNav, Inc. and NAVTEQ North America, LLC. | S-1/A | 10.16.8 | 4/26/2010 | ||||
10.16.9† | Territory License No. 5, dated as of March 6, 2006, by and between TeleNav, Inc. and NAVTEQ North America, LLC. | S-1/A | 10.16.9 | 4/26/2010 | ||||
10.16.10† | Territory License No. 6, dated as of May 18, 2007, by and between TeleNav, Inc. and NAVTEQ North America, LLC. | S-1/A | 10.16.10 | 4/26/2010 | ||||
10.16.11† | Territory License No. 7, dated as of May 18, 2007, by and between TeleNav, Inc. and NAVTEQ North America, LLC. | S-1/A | 10.16.11 | 4/26/2010 | ||||
10.16.12† | Ninth Amendment dated February 25, 2010 to the Data License Agreement, dated as of December 1, 2002 by and between TeleNav, Inc. and NAVTEQ North America, LLC. | S-1/A | 10.16.12 | 4/26/2010 | ||||
10.16.13 | Tenth Amendment dated June 1, 2010 to the Data License Agreement, dated as of December 1, 2002, by and between TeleNav, Inc., NAVTEQ North America, LLC, and NAVTEQ Europe B.V. | 10-Q | 10.16.13 | 5/7/2012 | ||||
10.16.14† | Eleventh Amendment dated September 16, 2010 to the Data License Agreement, dated as of December 1, 2002, by and between TeleNav, Inc., NAVTEQ North America, LLC, and NAVTEQ Europe B.V. | 10-Q | 10.16.14 | 5/7/2012 | ||||
2
Exhibit Number | Description | Incorporated by Reference From Form | Incorporated by Reference From Exhibit Number | Date Filed | ||||
10.16.15† | Twelfth Amendment dated September 28, 2010 to the Data License Agreement, dated as of December 1, 2002, by and between TeleNav, Inc., NAVTEQ North America, LLC, and NAVTEQ Europe B.V. | 10-Q | 10.16.15 | 5/7/2012 | ||||
10.16.16† | Fourteenth Amendment dated September 30, 2011 to the Data License Agreement, dated as of December 1, 2002, by and between TeleNav, Inc., NAVTEQ North America, LLC, and NAVTEQ Europe B.V. | 10-Q | 10.16.16 | 5/7/2012 | ||||
10.16.17† | Territory License No. 8, dated December 1, 2011, by and between TeleNav, Inc., NAVTEQ North America, LLC, and NAVTEQ Europe B.V. | 10-Q | 10.16.17 | 5/7/2012 | ||||
10.16.18† | First Amendment dated February 7, 2012 to Territory License No. 8, dated as of December 1, 2011, by and between TeleNav, Inc., NAVTEQ North America, LLC and NAVTEQ Europe B.V. | 10-Q | 10.16.18 | 5/7/2012 | ||||
10.16.19† | Second Amendment dated October 18, 2012 to Territory License No. 8, dated December 1, 2011 to the Data License Agreement, dated as of December 1, 2002, by and between Telenav, Inc., NAVTEQ North America, LLC and NAVTEQ Europe B.V. | 10-Q | 10.16.19 | 2/8/2013 | ||||
10.16.20 | Fifteenth Amendment dated October 30, 2012 to the Data License Agreement, dated as of December 1, 2002, by and between Telenav, Inc., NAVTEQ North America, LLC and NAVTEQ Europe B.V. | 10-Q | 10.16.20 | 2/8/2013 | ||||
10.16.21† | Third Amendment dated December 10, 2012 to Territory License No. 8, dated December 1, 2011 to the Data License Agreement, dated as of December 1, 2002, by and between Telenav, Inc., NAVTEQ North America, LLC and NAVTEQ Europe B.V. | 10-Q | 10.16.21 | 2/8/2013 | ||||
10.16.22† | Seventeenth Amendment dated June 27, 2013 to the Data License Agreement, dated as of December 1, 2002, by and between HERE North America, LLC (f/k/a NAVTEQ North America, LLC) (formerly Navigation Technologies Corporation) and Telenav, Inc. | 10-Q/A | 10.16.22 | 2/27/2014 | ||||
10.16.23† | Fourth Amendment dated October 2, 2013 to Territory License No. 8, dated December 1, 2011 to the Data License Agreement, dated as of December 1, 2002, by and between Telenav, Inc., and Navigation Technologies Corporation (“NTC”), which was subsequently assigned by NTC to HERE North America, LLC (f/k/a NAVTEQ North America, LLC). | 10-Q | 10.16.23 | 11/8/2013 | ||||
10.16.24 | Eighteenth Amendment dated January 28, 2014 to the Data License Agreement, dated as of December 1, 2002, by and between HERE North America, LLC (f/k/a NAVTEQ North America, LLC) (formerly Navigation Technologies Corporation) and Telenav, Inc. | 10-Q | 10.16.24 | 2/6/2014 | ||||
10.16.25† | Territory License No. 9, dated February 1, 2014 by and between HERE North America, LLC, HERE Europe B.V., NAVTEQ Korea Co. Ltd, and Telenav, Inc. | 10-Q | 10.16.25 | 5/8/2014 | ||||
10.16.26† | General License Agreement, dated February 10, 2014 by and between HERE North America, LLC, and Telenav, Inc. | 10-Q | 10.16.26 | 5/8/2014 | ||||
10.16.27† | Nineteenth Amendment dated May 20, 2014 to the Data License Agreement, dated as of December 1, 2002, by and between HERE North America, LLC (f/k/a NAVTEQ North America, LLC) (formerly Navigation Technologies Corporation) and Telenav, Inc. | 10-K | 10.16.27 | 8/22/2014 | ||||
10.16.28† | First Amendment, dated June 12, 2014, to Territory License No. 9, dated as of February 1, 2014, by and between Telenav, Inc., and HERE North America, LLC (f/k/a NAVTEQ North America, LLC).” | 10-K | 10.16.28 | 8/22/2014 | ||||
10.16.29† | Amended and Restated Territory License No. 8, dated August 18, 2014, by and between Telenav, Inc., HERE North America, LLC (f/k/a NAVTEQ North America, LLC), and Here Europe B.V. (f/k/a NAVTEQ Europe B.V.) | 10-Q | 10.16.29 | 11/6/2014 | ||||
3
Exhibit Number | Description | Incorporated by Reference From Form | Incorporated by Reference From Exhibit Number | Date Filed | ||||
10.16.30† | Patent License Agreement, dated January 1, 2014, by and between Telenav, Inc., and HERE Global B.V. (f/k/a Navteq B.V.) | 10-Q | 10.16.30 | 2/5/2015 | ||||
10.16.31† | Territory License No. 11, dated April 3, 2015 by and between HERE North America, LLC, HERE Europe B.V., and Telenav, Inc. | 10-K | 10.16.31 | 8/24/2015 | ||||
10.16.32† | First Amendment to Amended and Restated Territory License No. 8, dated November 4, 2015 by and between Telenav, Inc., and HERE North America, LLC (f/k/a NAVTEQ North America, LLC). | 10-Q | 10.16.32 | 2/9/2016 | ||||
10.16.33† | First Amendment to General License Agreement, dated November 12, 2015 by and between HERE North America, LLC, and Telenav, Inc. | 10-Q | 10.16.33 | 2/9/2016 | ||||
10.16.34† | Territory License No. 10, dated March 15, 2016, by and between HERE North America, LLC, HERE Europe B.V., HERE Solutions Korea Co. Ltd, and Telenav, Inc. | 10-Q | 10.16.34 | 5/9/2016 | ||||
10.21# | Form of First Year Executive Employment Agreement. | 10-Q | 10.21 | 11/7/2011 | ||||
10.22# | Retention Letter dated March 28, 2012 from TeleNav, Inc. to Michael W. Strambi. | 10-Q | 10.22 | 5/7/2012 | ||||
10.23# | Employment Agreement dated March 28, 2012 between TeleNav, Inc. and Michael W. Strambi. | 10-Q | 10.23 | 5/7/2012 | ||||
10.23.1# | Amendment No. 1 dated December 20, 2013 to the Employment Agreement dated March 28, 2012 between TeleNav, Inc. and Michael W. Strambi. | 10-Q | 10.23.1 | 2/6/2014 | ||||
10.25# | Director Offer Letter dated July 30, 2012 between TeleNav, Inc. and Ken Xie. | 10-K | 10.25 | 9/7/2012 | ||||
10.26† | SYNC Generation 2 On-Board Navigation Agreement, dated October 12, 2009, by and between TeleNav, Inc. and Ford Motor Company. | 10-K | 10.26 | 9/7/2012 | ||||
10.26.1† | Amendment No. 1 effective August 10, 2010 to the SYNC Generation 2 On-Board Navigation Agreement dated October 12, 2009 by and between TeleNav, Inc. and Ford Motor Company. | 10-K | 10.26.1 | 9/7/2012 | ||||
10.26.2† | Amendment No. 2 effective February 3, 2011 to the SYNC Generation 2 On-Board Navigation Agreement dated October 12, 2009, as amended, by and between TeleNav, Inc. and Ford Motor Company. | 10-K | 10.26.2 | 9/7/2012 | ||||
10.26.3† | Amendment No. 3 effective February 3, 2011 to the SYNC Generation 2 On-Board Navigation Agreement dated October 12, 2009, as amended, by and between TeleNav, Inc. and Ford Motor Company. | 10-K | 10.26.3 | 9/7/2012 | ||||
10.26.4† | Amendment No. 4 effective March 31, 2011 to the SYNC Generation 2 On-Board Navigation Agreement dated October 12, 2009, as amended, by and between TeleNav, Inc. and Ford Motor Company. | 10-K | 10.26.4 | 9/7/2012 | ||||
10.26.5† | Amendment No. 5 effective March 31, 2011 to the SYNC Generation 2 On-Board Navigation Agreement dated October 12, 2009, as amended, by and between TeleNav, Inc. and Ford Motor Company. | 10-K | 10.26.5 | 9/7/2012 | ||||
10.26.6† | Amendment No. 6 effective March 31, 2011 to the SYNC Generation 2 On-Board Navigation Agreement dated October 12, 2009, as amended, by and between TeleNav, Inc. and Ford Motor Company. | 10-K | 10.26.6 | 9/7/2012 | ||||
10.26.7† | Amendment No. 7 effective November 15, 2011 to the SYNC Generation 2 On-Board Navigation Agreement dated October 12, 2009, as amended, by and between TeleNav, Inc. and Ford Motor Company. | 10-K | 10.26.7 | 9/7/2012 | ||||
10.26.8† | Amendment No. 8 effective January 1, 2012 to the SYNC Generation 2 On-Board Navigation Agreement dated October 12, 2009, as amended, by and between TeleNav, Inc. and Ford Motor Company. | 10-K | 10.26.8 | 9/7/2012 | ||||
4
Exhibit Number | Description | Incorporated by Reference From Form | Incorporated by Reference From Exhibit Number | Date Filed | ||||
10.26.9† | Amendment No. 9 effective May 11, 2012 to the SYNC Generation 2 On-Board Navigation Agreement dated October 12, 2009, as amended, by and between TeleNav, Inc. and Ford Motor Company. | 10-K | 10.26.9 | 9/7/2012 | ||||
10.26.10† | Amendment No. 10 effective February 3, 2011 to the SYNC Generation 2 On-Board Navigation Agreement dated October 12, 2009, as amended, by and between Telenav, Inc. and Ford Motor Company. | 10-Q | 10.26.10 | 5/8/2013 | ||||
10.26.11† | Amendment No. 11 effective February 3, 2011 to the SYNC Generation 2 On-Board Navigation Agreement dated October 12, 2009, as amended, by and between Telenav, Inc. and Ford Motor Company. | 10-K | 10.26.11 | 8/30/2013 | ||||
10.26.12† | Amendment No. 12 effective February 28, 2013 to the SYNC Generation 2 On-Board Navigation Agreement dated October 12, 2009, as amended, by and between Telenav, Inc. and Ford Motor Company. | 10-K | 10.26.12 | 8/30/2013 | ||||
10.26.13† | Amendment No. 13 effective June 17, 2013 to the SYNC Generation 2 On-Board Navigation Agreement dated October 12, 2009, as amended, by and between Telenav, Inc. and Ford Motor Company. | 10-K | 10.26.13 | 8/30/2013 | ||||
10.26.14† | Amendment No. 14 effective October 1, 2013 to the SYNC Generation 2 On-Board Navigation Agreement dated October 12, 2009, as amended, by and between Telenav, Inc. and Ford Motor Company. | 10-Q | 10.26.14 | 11/8/2013 | ||||
10.26.15† | Amendment No. 15 effective November 18, 2013 to the SYNC Generation 2 On-Board Navigation Agreement dated October 12, 2009, as amended, by and between Telenav, Inc. and Ford Motor Company. | 10-Q | 10.26.15 | 2/6/2014 | ||||
10.26.16† | Amendment No. 16 effective April 17, 2014 to the SYNC Generation 2 On-Board Navigation Agreement dated October 12, 2009, as amended, by and between Telenav, Inc. and Ford Motor Company | 10-Q | 10.26.16 | 5/8/2014 | ||||
10.26.17† | Amendment No. 17 effective January 1, 2015 to the SYNC Generation 2 On-Board Navigation Agreement dated October 12, 2009, as amended, by and between Telenav, Inc. and Ford Motor Company | 10-Q | 10.26.17 | 5/7/2015 | ||||
10.26.18† | Amendment No. 18 effective June 17, 2015 to the SYNC Generation 2 On-Board Navigation Agreement dated October 12, 2009, by and between Telenav, Inc. and Ford Motor Company | 10-Q | 10.26.18 | 11/9/2015 | ||||
10.28# | Summary of Nonemployee Director Compensation. | 8-K | 10.28 | 12/3/2012 | ||||
10.29# | Amended and Restated Telenav, Inc. 2011 Stock Option and Grant Plan. | S-8 | 4.2 | 10/29/2012 | ||||
10.32# | Form of Restricted Stock Unit Award Agreement under the 2009 Equity Incentive Plan. | 10-Q | 10.32 | 2/5/2015 | ||||
10.33# | Form of Restricted Stock Unit Award Agreement under the Amended and Restated Telenav, Inc. 2011 Stock Option and Grant Plan. | 10-Q | 10.33 | 2/5/2015 | ||||
10.35# | Amended and Restated Employment Agreement, dated September 30, 2015, by and between Telenav, Inc. and Rohan Chandran. | 10-Q | 10.35 | 11/9/2015 | ||||
10.35.1# | Severance Agreement and General Release, dated March 18, 2016, by and between Telenav, Inc. and Rohan Chandran. | Filed herewith | ||||||
10.36 | Sublease, dated as of November 11, 2015, between Avaya Inc. and Telenav, Inc. | 10-Q | 10.36 | 2/9/2016 | ||||
10.37 | Landlord Consent to Sublease, dated as of December 18, 2015, by and among The Prudential Insurance Company of America, Avaya Inc., and Telenav, Inc. | 10-Q | 10.37 | 2/9/2016 | ||||
5
Exhibit Number | Description | Incorporated by Reference From Form | Incorporated by Reference From Exhibit Number | Date Filed | ||||
10.38 | Lease Termination Agreement dated October 16, 2015, by and between St. Paul Fire and Marine Insurance Company and Telenav, Inc. | 8-K | 10.1 | 10/22/2015 | ||||
10.39 | Shanghai Real Estate Lease Agreement, dated as of March 4, 2016, by and between TeleNav Shanghai Inc. and Shanghai Dongfang Weijing Culture Development Co. | Filed herewith | ||||||
10.40 | Letter Agreement, dated as of September 23, 2015, among Telenav, Inc., Nokomis Capital, L.L.C. and certain other parties. | 8-K | 10.1 | 9/25/2015 | ||||
21.1 | Subsidiaries of the registrant. | Filed herewith | ||||||
23.1 | Consent of Independent Registered Public Accounting Firm - Grant Thornton LLP. | Filed herewith | ||||||
23.2 | Consent of Independent Registered Public Accounting Firm -Ernst & Young LLP. | Filed herewith | ||||||
24.1 | Power of Attorney (contained in the signature page to this Form 10-K). | Filed herewith | ||||||
31.1 | Certification Pursuant to 18 U.S.C. Section 1350, as Adopted Pursuant to Section 302 of the Sarbanes-Oxley Act of 2002 of Chief Executive Officer. | Filed herewith | ||||||
31.2 | Certification Pursuant to 18 U.S.C. Section 1350, as Adopted Pursuant to Section 302 of the Sarbanes-Oxley Act of 2002 of Chief Financial Officer. | Filed herewith | ||||||
32.1~ | Certification Pursuant to 18 U.S.C. Section 1350, as Adopted Pursuant to Section 906 of the Sarbanes-Oxley Act of 2002 of Chief Executive Officer. | Filed herewith | ||||||
32.2~ | Certification Pursuant to 18 U.S.C. Section 1350, as Adopted Pursuant to Section 906 of the Sarbanes-Oxley Act of 2002 of Chief Financial Officer. | Filed herewith | ||||||
101.INS* | XBRL Instance Document | Filed herewith | ||||||
101.SCH* | XBRL Taxonomy Extension Schema Document | Filed herewith | ||||||
101.CAL* | XBRL Taxonomy Calculation Linkbase Document | Filed herewith | ||||||
101.DEF* | XBRL Taxonomy Definition Linkbase Document | Filed herewith | ||||||
101.LAB* | XBRL Taxonomy Label Linkbase Document | Filed herewith | ||||||
101.PRE* | XBRL Taxonomy Extension Presentation Linkbase Document | Filed herewith | ||||||
6
# | Management contracts or compensation plans or arrangements in which directors or executive officers are eligible to participate. |
† | Portions of the exhibit have been omitted pursuant to an order granted by the Securities and Exchange Commission for confidential treatment. |
~ | In accordance with Item 601(b)(32)(ii) of Regulation S-K and SEC Release No. 33-8238 and 34-47986, Final Rule: Management’s Reports on Internal Control Over Financial Reporting and Certification of Disclosure in Exchange Act Periodic Reports, the certifications furnished in Exhibits 32.1 and 32.2 hereto are deemed to accompany this Form 10-K and will not be deemed “filed” for purposes of Section 18 of the Exchange Act. Such certifications will not be deemed to be incorporated by reference into any filings under the Securities Act or the Exchange Act, except to the extent that the registrant specifically incorporates it by reference. |
* | XBRL (Extensible Business Reporting Language) information is furnished and not filed or a part of a registration statement or prospectus for purposes of Sections 11 or 12 of the Securities Act, is deemed not filed for purposes of Section 18 of the Exchange Act, and otherwise is not subject to liability under these sections. |
7