Attached files
| file | filename |
|---|---|
| EX-99.1 - EX-99.1 - LINDSAY CORP | d863910dex991.htm |
| 8-K - 8-K - LINDSAY CORP | d863910d8k.htm |
Exhibit 99.2 st 1 Quarter Fiscal 2020 Earnings Slide Deck Exhibit 99.2 st 1 Quarter Fiscal 2020 Earnings Slide Deck

Safe-Harbor Statement This presentation contains forward-looking statements that are subject to risks and uncertainties and which reflect management’s current beliefs and estimates of future economic circumstances, industry conditions, Company performance, financial results and planned financing. You can find a discussion of many of these risks and uncertainties in the annual, quarterly and current reports that the Company files with the Securities and Exchange Commission. Investors should understand that a number of factors could cause future economic and industry conditions, and the Company’s actual financial condition and results of operations, to differ materially from management’s beliefs expressed in the forward-looking statements contained in this presentation. These factors include those outlined in the “Risk Factors” section of the Company’s most recent annual report on Form 10-K filed with the Securities and Exchange Commission, and investors are urged to review these factors when considering the forward-looking statements contained in this presentation. For these statements, the Company claims the protection of the safe harbor for forward- looking statements contained in the Private Securities Litigation Reform Act of 1995. For full financial statement information, please see the Company’s earnings release dated January 9, 2020. 2Safe-Harbor Statement This presentation contains forward-looking statements that are subject to risks and uncertainties and which reflect management’s current beliefs and estimates of future economic circumstances, industry conditions, Company performance, financial results and planned financing. You can find a discussion of many of these risks and uncertainties in the annual, quarterly and current reports that the Company files with the Securities and Exchange Commission. Investors should understand that a number of factors could cause future economic and industry conditions, and the Company’s actual financial condition and results of operations, to differ materially from management’s beliefs expressed in the forward-looking statements contained in this presentation. These factors include those outlined in the “Risk Factors” section of the Company’s most recent annual report on Form 10-K filed with the Securities and Exchange Commission, and investors are urged to review these factors when considering the forward-looking statements contained in this presentation. For these statements, the Company claims the protection of the safe harbor for forward- looking statements contained in the Private Securities Litigation Reform Act of 1995. For full financial statement information, please see the Company’s earnings release dated January 9, 2020. 2
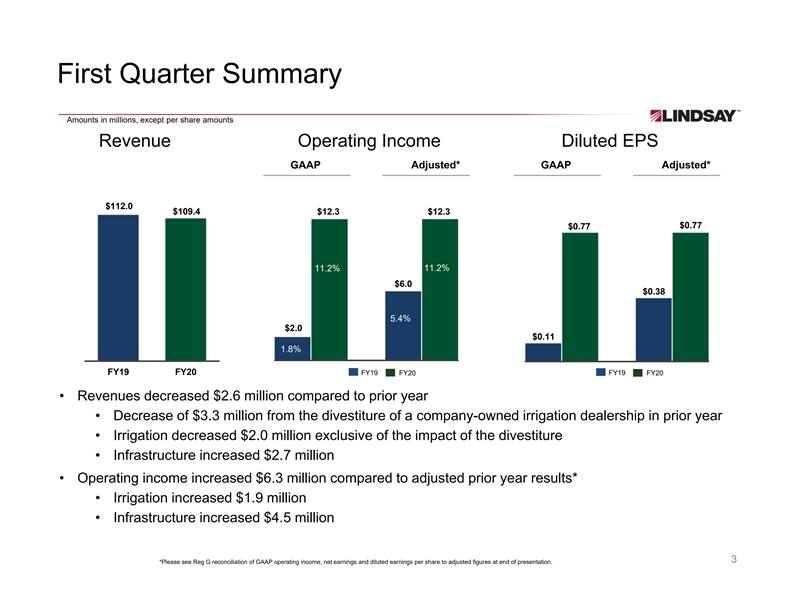
First Quarter Summary Amounts in millions, except per share amounts Revenue Operating Income Diluted EPS GAAP Adjusted* GAAP Adjusted* $112.0 $109.4 $12.3 $12.3 $0.77 $0.77 11.2% 11.2% $6.0 $0.38 1.8% 5.4% $2.0 $0.11 1.8% FY19 FY20 FY19 FY20 FY19 FY20 • Revenues decreased $2.6 million compared to prior year • Decrease of $3.3 million from the divestiture of a company-owned irrigation dealership in prior year • Irrigation decreased $2.0 million exclusive of the impact of the divestiture • Infrastructure increased $2.7 million • Operating income increased $6.3 million compared to adjusted prior year results* • Irrigation increased $1.9 million • Infrastructure increased $4.5 million 3 *Please see Reg G reconciliation of GAAP operating income, net earnings and diluted earnings per share to adjusted figures at end of presentation.First Quarter Summary Amounts in millions, except per share amounts Revenue Operating Income Diluted EPS GAAP Adjusted* GAAP Adjusted* $112.0 $109.4 $12.3 $12.3 $0.77 $0.77 11.2% 11.2% $6.0 $0.38 1.8% 5.4% $2.0 $0.11 1.8% FY19 FY20 FY19 FY20 FY19 FY20 • Revenues decreased $2.6 million compared to prior year • Decrease of $3.3 million from the divestiture of a company-owned irrigation dealership in prior year • Irrigation decreased $2.0 million exclusive of the impact of the divestiture • Infrastructure increased $2.7 million • Operating income increased $6.3 million compared to adjusted prior year results* • Irrigation increased $1.9 million • Infrastructure increased $4.5 million 3 *Please see Reg G reconciliation of GAAP operating income, net earnings and diluted earnings per share to adjusted figures at end of presentation.
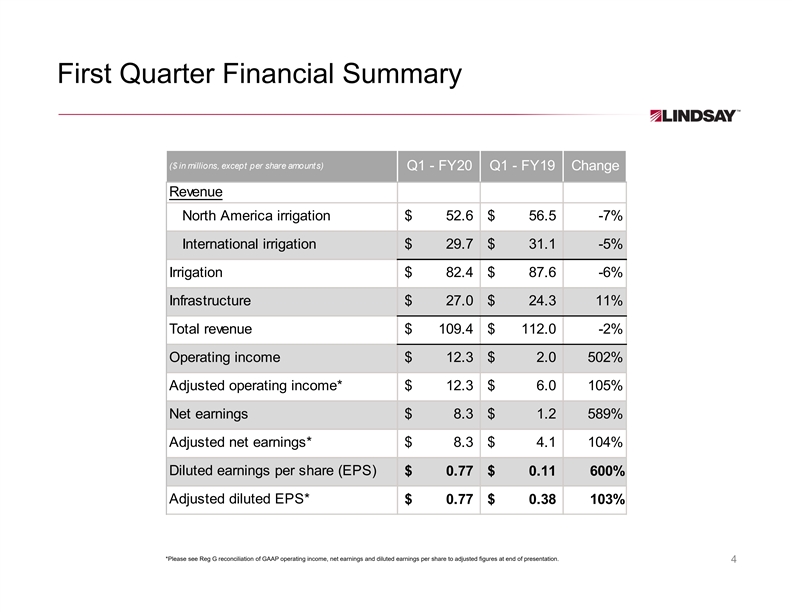
First Quarter Financial Summary ($ in millions, except per share amounts) Q1 - FY20 Q1 - FY19 Change Revenue North America irrigation $ 52.6 $ 56.5 -7% International irrigation $ 29.7 $ 31.1 -5% Irrigation $ 82.4 $ 87.6 -6% Infrastructure $ 27.0 $ 24.3 11% Total revenue $ 109.4 $ 112.0 -2% Operating income $ 12.3 $ 2.0 502% Adjusted operating income* $ 12.3 $ 6.0 105% Net earnings $ 8.3 $ 1.2 589% Adjusted net earnings* $ 8.3 $ 4.1 104% Diluted earnings per share (EPS) $ 0.77 $ 0.11 600% Adjusted diluted EPS* $ 0.77 $ 0.38 103% *Please see Reg G reconciliation of GAAP operating income, net earnings and diluted earnings per share to adjusted figures at end of presentation. 4First Quarter Financial Summary ($ in millions, except per share amounts) Q1 - FY20 Q1 - FY19 Change Revenue North America irrigation $ 52.6 $ 56.5 -7% International irrigation $ 29.7 $ 31.1 -5% Irrigation $ 82.4 $ 87.6 -6% Infrastructure $ 27.0 $ 24.3 11% Total revenue $ 109.4 $ 112.0 -2% Operating income $ 12.3 $ 2.0 502% Adjusted operating income* $ 12.3 $ 6.0 105% Net earnings $ 8.3 $ 1.2 589% Adjusted net earnings* $ 8.3 $ 4.1 104% Diluted earnings per share (EPS) $ 0.77 $ 0.11 600% Adjusted diluted EPS* $ 0.77 $ 0.38 103% *Please see Reg G reconciliation of GAAP operating income, net earnings and diluted earnings per share to adjusted figures at end of presentation. 4

Current Market Factors Irrigation Infrastructure • The phase-one trade deal between the U.S. and • States continue the transition to new federal MASH China is expected to be signed January 15. Under testing standards for road safety products. Almost the deal, China would greatly increase agricultural all of our road safety product offerings in the U.S. purchases from the U.S. in exchange for a have now received MASH eligibility. reduction or elimination of tariffs. • Our “shift left” strategy is gaining traction and ® • 2019 Net Farm Income is projected to be $92.5 contributing to an increase in Road Zipper System billion, an increase of 10.2% from 2018. About lease revenue. $14.3 billion will come from Market Facilitation ® • Road Zipper System gaining interest globally as a Payments that are part of the trade relief package. solution to traffic congestion and air quality. A multi- • Final U.S. harvest results remain uncertain but will year lease in Germany was secured in the first be updated by the USDA on January 10. quarter. • The EPA finalized 2020 volume requirements under • The five-year $305 billion U.S. highway bill enacted the Renewable Fuels Standard that slightly in December 2015 (the “FAST Act”) is scheduled to increases biofuel volumes compared with 2019. expire in September 2020 unless it is reauthorized by Congress. • Interest rates have been declining in Brazil, with the latest 50bps drop in December putting the federal funds rate at 4.5%. 5Current Market Factors Irrigation Infrastructure • The phase-one trade deal between the U.S. and • States continue the transition to new federal MASH China is expected to be signed January 15. Under testing standards for road safety products. Almost the deal, China would greatly increase agricultural all of our road safety product offerings in the U.S. purchases from the U.S. in exchange for a have now received MASH eligibility. reduction or elimination of tariffs. • Our “shift left” strategy is gaining traction and ® • 2019 Net Farm Income is projected to be $92.5 contributing to an increase in Road Zipper System billion, an increase of 10.2% from 2018. About lease revenue. $14.3 billion will come from Market Facilitation ® • Road Zipper System gaining interest globally as a Payments that are part of the trade relief package. solution to traffic congestion and air quality. A multi- • Final U.S. harvest results remain uncertain but will year lease in Germany was secured in the first be updated by the USDA on January 10. quarter. • The EPA finalized 2020 volume requirements under • The five-year $305 billion U.S. highway bill enacted the Renewable Fuels Standard that slightly in December 2015 (the “FAST Act”) is scheduled to increases biofuel volumes compared with 2019. expire in September 2020 unless it is reauthorized by Congress. • Interest rates have been declining in Brazil, with the latest 50bps drop in December putting the federal funds rate at 4.5%. 5

Irrigation Segment Revenue $56.5 $52.6 • North America revenue decreased $0.6 million exclusive of the business divestiture • Higher irrigation equipment unit volume $31.1 $29.7 • Lower average selling prices due to lower steel costs • Lower sales of replacement parts • International revenue decreased $1.4 million • Unfavorable currency impact of approximately $1.1 million North America International FY19 FY20 in millions • Operating income increased $1.9 million compared to adjusted prior year results* Operating Income • Improved cost and pricing performance resulting from Adjusted* GAAP margin improvement initiatives $9.8 $9.8 • Improvements partially offset by negative mix impact from lower sales of replacement parts $7.9 $7.8 11.8% 11.8% • Operating margin of 11.8% compared to 9.0% adjusted prior year results* 9.0% 8.9% in millions FY19 FY20 *Please see Reg G reconciliation of GAAP operating income, net earnings and diluted earnings per share to adjusted figures at end of presentation. 6Irrigation Segment Revenue $56.5 $52.6 • North America revenue decreased $0.6 million exclusive of the business divestiture • Higher irrigation equipment unit volume $31.1 $29.7 • Lower average selling prices due to lower steel costs • Lower sales of replacement parts • International revenue decreased $1.4 million • Unfavorable currency impact of approximately $1.1 million North America International FY19 FY20 in millions • Operating income increased $1.9 million compared to adjusted prior year results* Operating Income • Improved cost and pricing performance resulting from Adjusted* GAAP margin improvement initiatives $9.8 $9.8 • Improvements partially offset by negative mix impact from lower sales of replacement parts $7.9 $7.8 11.8% 11.8% • Operating margin of 11.8% compared to 9.0% adjusted prior year results* 9.0% 8.9% in millions FY19 FY20 *Please see Reg G reconciliation of GAAP operating income, net earnings and diluted earnings per share to adjusted figures at end of presentation. 6

Infrastructure Segment Revenue $27.0 $24.3 • Total revenue increased $2.7 million • Higher sales of road safety products ® • Increase in Road Zipper System lease revenue • Ongoing delivery of Road Zipper System order in Japan • Prior year included the majority of the San Rafael Bridge project • Operating income increased $4.5 million compared to in millions FY19 FY20 adjusted prior year results* • Positive mix impact from higher-margin Road Zipper Operating Income Adjusted* System sales and lease revenue GAAP • Improved cost and pricing performance resulting from $8.8 $8.8 margin improvement initiatives • Operating margin of 32.4% compared to 17.6% adjusted prior 32.4% 32.4% year results* $4.3 $4.2 17.6% 17.1% in millions FY19 FY20 *Please see Reg G reconciliation of GAAP operating income, net earnings and diluted earnings per share to adjusted figures at end of presentation. 7Infrastructure Segment Revenue $27.0 $24.3 • Total revenue increased $2.7 million • Higher sales of road safety products ® • Increase in Road Zipper System lease revenue • Ongoing delivery of Road Zipper System order in Japan • Prior year included the majority of the San Rafael Bridge project • Operating income increased $4.5 million compared to in millions FY19 FY20 adjusted prior year results* • Positive mix impact from higher-margin Road Zipper Operating Income Adjusted* System sales and lease revenue GAAP • Improved cost and pricing performance resulting from $8.8 $8.8 margin improvement initiatives • Operating margin of 32.4% compared to 17.6% adjusted prior 32.4% 32.4% year results* $4.3 $4.2 17.6% 17.1% in millions FY19 FY20 *Please see Reg G reconciliation of GAAP operating income, net earnings and diluted earnings per share to adjusted figures at end of presentation. 7
Executing Long-Term Value Creation • Deepening customer relationships through technology differentiation • Solutions and growth aligned to market megatrends…. designed to sustain and protect our evolving world • Foundation for Growth initiative driving margin expansion ONE LINDSAY • Empowered global culture through Innovative Market Leader Vision, Values and Behaviors Framework Innovative Market Leader – Sustainable Solutions – Sustainable Solutions 8Executing Long-Term Value Creation • Deepening customer relationships through technology differentiation • Solutions and growth aligned to market megatrends…. designed to sustain and protect our evolving world • Foundation for Growth initiative driving margin expansion ONE LINDSAY • Empowered global culture through Innovative Market Leader Vision, Values and Behaviors Framework Innovative Market Leader – Sustainable Solutions – Sustainable Solutions 8

Foundation for Growth Initiative Objectives • Raise operating margin floor • Innovation leader in core markets • Renewed culture and identity 11 22 33 44 Commercial Global Manufacturing Lower G&A Excellence Sourcing Optimization Expenses Cultural Changes 55 Strategic Choices 66 Margin improvement Strategy and Culture Cost 9Foundation for Growth Initiative Objectives • Raise operating margin floor • Innovation leader in core markets • Renewed culture and identity 11 22 33 44 Commercial Global Manufacturing Lower G&A Excellence Sourcing Optimization Expenses Cultural Changes 55 Strategic Choices 66 Margin improvement Strategy and Culture Cost 9

Foundation for Growth Execution Accomplishments through Q1 Fiscal 2020 • Divested four non-core businesses ü • Closed an infrastructure facility; consolidated activity into ü an existing irrigation facility • Established a centralized shared services organization ü • Made tangible progress in culture change and aligning behaviors to ü strategy • Projects in each of the four margin-improvement workstreams ü have moved to implementation and realization stage Execution is on track 10Foundation for Growth Execution Accomplishments through Q1 Fiscal 2020 • Divested four non-core businesses ü • Closed an infrastructure facility; consolidated activity into ü an existing irrigation facility • Established a centralized shared services organization ü • Made tangible progress in culture change and aligning behaviors to ü strategy • Projects in each of the four margin-improvement workstreams ü have moved to implementation and realization stage Execution is on track 10

Summary Balance Sheet ($ in millions) November 30, 2019 November 30, 2018 August 31, 2019 Cash and cash equivalents $120.9 $137.2 $127.2 Current assets $316.6 $325.3 $313.5 Current liabilities $84.8 $83.0 $82.1 Net working capital $231.8 $242.3 $231.4 Long-term debt $116.0 $116.3 $116.1 Shareholders' equity $273.0 $276.7 $268.2 11Summary Balance Sheet ($ in millions) November 30, 2019 November 30, 2018 August 31, 2019 Cash and cash equivalents $120.9 $137.2 $127.2 Current assets $316.6 $325.3 $313.5 Current liabilities $84.8 $83.0 $82.1 Net working capital $231.8 $242.3 $231.4 Long-term debt $116.0 $116.3 $116.1 Shareholders' equity $273.0 $276.7 $268.2 11

Summary of Cash Flow ($ in millions) Q1 FY20 Q1 FY19 Net earnings $8.3 $1.2 Depreciation / amortization $4.7 $3.4 Other non-cash adjustments $3.8 $0.9 Changes in assets and liabilities: Receivables ( $4.1) ($14.8) Inventories ($4.9) ($11.4) Other working capital ($6.3) $6.4 Net cash provided by (used in) operations $1.5 ($14.3) Purchases of property, plant and equipment ($4.3) ($5.7) Dividends paid ($3.4) ($3.3) 12Summary of Cash Flow ($ in millions) Q1 FY20 Q1 FY19 Net earnings $8.3 $1.2 Depreciation / amortization $4.7 $3.4 Other non-cash adjustments $3.8 $0.9 Changes in assets and liabilities: Receivables ( $4.1) ($14.8) Inventories ($4.9) ($11.4) Other working capital ($6.3) $6.4 Net cash provided by (used in) operations $1.5 ($14.3) Purchases of property, plant and equipment ($4.3) ($5.7) Dividends paid ($3.4) ($3.3) 12

Capital Allocation – A Balanced Approach Allocation Plan Allocation History • Targeted cash balance of $60-75 million, including international accounts • To support cyclical and seasonal fluctuations in working capital and projected capital expenditures • $115 million in Senior Notes maturing on 2/19/30 at annual interest rate of 3.82% • The Company’s prioritization for cash use: • Organic growth initiatives (1) Other includes debt repayments, net cash sources/uses from note receivables, net investment • Capital expenditures - expected to hedges, stock compensation and related tax benefits. be $15-20 million in fiscal 2020 • Dividend payments • Synergistic acquisitions that leverage core capabilities • Excess cash invested in opportunistic share repurchases 13Capital Allocation – A Balanced Approach Allocation Plan Allocation History • Targeted cash balance of $60-75 million, including international accounts • To support cyclical and seasonal fluctuations in working capital and projected capital expenditures • $115 million in Senior Notes maturing on 2/19/30 at annual interest rate of 3.82% • The Company’s prioritization for cash use: • Organic growth initiatives (1) Other includes debt repayments, net cash sources/uses from note receivables, net investment • Capital expenditures - expected to hedges, stock compensation and related tax benefits. be $15-20 million in fiscal 2020 • Dividend payments • Synergistic acquisitions that leverage core capabilities • Excess cash invested in opportunistic share repurchases 13

Attractive Long-Term Megatrends Water Conservation Advancing Technology Improve Road Safety Population Growth Alternative Fuels Increase Yields 14Attractive Long-Term Megatrends Water Conservation Advancing Technology Improve Road Safety Population Growth Alternative Fuels Increase Yields 14
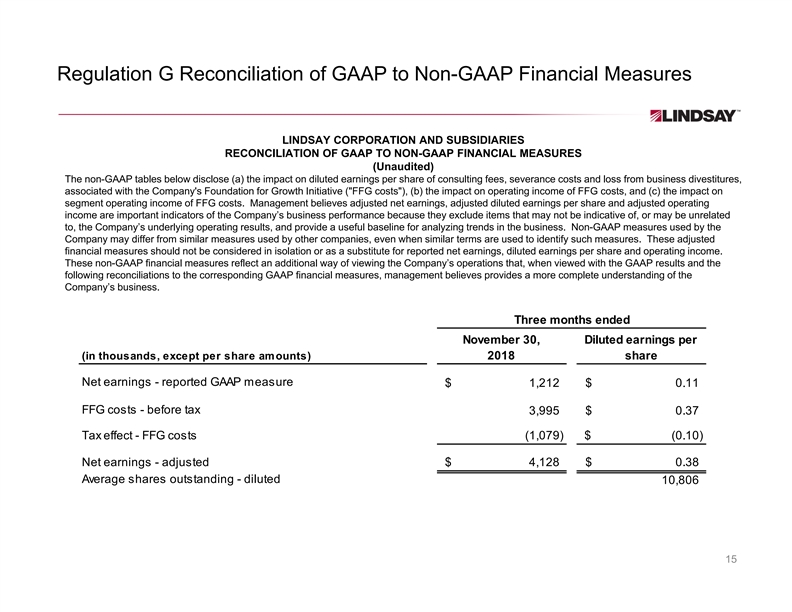
Regulation G Reconciliation of GAAP to Non-GAAP Financial Measures LINDSAY CORPORATION AND SUBSIDIARIES RECONCILIATION OF GAAP TO NON-GAAP FINANCIAL MEASURES (Unaudited) The non-GAAP tables below disclose (a) the impact on diluted earnings per share of consulting fees, severance costs and loss from business divestitures, associated with the Company's Foundation for Growth Initiative ( FFG costs ), (b) the impact on operating income of FFG costs, and (c) the impact on segment operating income of FFG costs. Management believes adjusted net earnings, adjusted diluted earnings per share and adjusted operating income are important indicators of the Company’s business performance because they exclude items that may not be indicative of, or may be unrelated to, the Company’s underlying operating results, and provide a useful baseline for analyzing trends in the business. Non-GAAP measures used by the Company may differ from similar measures used by other companies, even when similar terms are used to identify such measures. These adjusted financial measures should not be considered in isolation or as a substitute for reported net earnings, diluted earnings per share and operating income. These non-GAAP financial measures reflect an additional way of viewing the Company’s operations that, when viewed with the GAAP results and the following reconciliations to the corresponding GAAP financial measures, management believes provides a more complete understanding of the Company’s business. Three months ended November 30, Diluted earnings per (in thousands, except per share amounts) 2018 share Net earnings - reported GAAP measure $ 1,212 $ 0.11 FFG costs - before tax 3,995 $ 0.37 Tax effect - FFG costs (1,079) $ (0.10) Net earnings - adjusted $ 4,128 $ 0.38 Average shares outstanding - diluted 10,806 15Regulation G Reconciliation of GAAP to Non-GAAP Financial Measures LINDSAY CORPORATION AND SUBSIDIARIES RECONCILIATION OF GAAP TO NON-GAAP FINANCIAL MEASURES (Unaudited) The non-GAAP tables below disclose (a) the impact on diluted earnings per share of consulting fees, severance costs and loss from business divestitures, associated with the Company's Foundation for Growth Initiative ( FFG costs ), (b) the impact on operating income of FFG costs, and (c) the impact on segment operating income of FFG costs. Management believes adjusted net earnings, adjusted diluted earnings per share and adjusted operating income are important indicators of the Company’s business performance because they exclude items that may not be indicative of, or may be unrelated to, the Company’s underlying operating results, and provide a useful baseline for analyzing trends in the business. Non-GAAP measures used by the Company may differ from similar measures used by other companies, even when similar terms are used to identify such measures. These adjusted financial measures should not be considered in isolation or as a substitute for reported net earnings, diluted earnings per share and operating income. These non-GAAP financial measures reflect an additional way of viewing the Company’s operations that, when viewed with the GAAP results and the following reconciliations to the corresponding GAAP financial measures, management believes provides a more complete understanding of the Company’s business. Three months ended November 30, Diluted earnings per (in thousands, except per share amounts) 2018 share Net earnings - reported GAAP measure $ 1,212 $ 0.11 FFG costs - before tax 3,995 $ 0.37 Tax effect - FFG costs (1,079) $ (0.10) Net earnings - adjusted $ 4,128 $ 0.38 Average shares outstanding - diluted 10,806 15

Regulation G Reconciliation of GAAP to Non-GAAP Financial Measures LINDSAY CORPORATION AND SUBSIDIARIES RECONCILIATION OF GAAP TO NON-GAAP FINANCIAL MEASURES (Unaudited) (Continued) For the three months ended November 30, 2018 Operating income reconciliation Consolidated Irrigation Infrastructure Corporate Operating income - reported GAAP measure 2,040 $ 7,783 $ 4,168 $ (9,911) FFG costs - before tax 3,995 126 112 3,757 Adjusted operating income $ 6,035 $ 7,909 $ 4,280 $ (6,154) Operating revenues 111,951 $ 87,610 $ 24,341 $ — Operating income as a percent of operating revenues 1.8% 8.9% 17.1% N/A Adjusted operating income as a percent of operating revenues 5.4% 9.0% 17.6% N/A 16Regulation G Reconciliation of GAAP to Non-GAAP Financial Measures LINDSAY CORPORATION AND SUBSIDIARIES RECONCILIATION OF GAAP TO NON-GAAP FINANCIAL MEASURES (Unaudited) (Continued) For the three months ended November 30, 2018 Operating income reconciliation Consolidated Irrigation Infrastructure Corporate Operating income - reported GAAP measure 2,040 $ 7,783 $ 4,168 $ (9,911) FFG costs - before tax 3,995 126 112 3,757 Adjusted operating income $ 6,035 $ 7,909 $ 4,280 $ (6,154) Operating revenues 111,951 $ 87,610 $ 24,341 $ — Operating income as a percent of operating revenues 1.8% 8.9% 17.1% N/A Adjusted operating income as a percent of operating revenues 5.4% 9.0% 17.6% N/A 16