Attached files
| file | filename |
|---|---|
| 8-K - 8-K - CARPENTER TECHNOLOGY CORP | a19-3834_28k.htm |
Carpenter Technology Corporation 2nd Quarter Fiscal Year 2019 Earnings Call January 31, 2019
Cautionary Statement Forward-Looking Statements This presentation contains forward-looking statements within the meaning of the Private Securities Litigation Act of 1995. These forward-looking statements are subject to risks and uncertainties that could cause actual results to differ from those projected, anticipated or implied. The most significant of these uncertainties are described in Carpenter Technology's filings with the Securities and Exchange Commission, including its report on Form 10-K for the year ended June 30, 2018, Form 10-Q for the quarter ended September 30, 2018, and the exhibits attached to those filings. They include but are not limited to: (1) the cyclical nature of the specialty materials business and certain end-use markets, including aerospace, defense, industrial, transportation, consumer, medical, and energy, or other influences on Carpenter Technology's business such as new competitors, the consolidation of competitors, customers, and suppliers or the transfer of manufacturing capacity from the United States to foreign countries; (2) the ability of Carpenter Technology to achieve cash generation, growth, earnings, profitability, operating income, cost savings and reductions, qualifications, productivity improvements or process changes; (3) the ability to recoup increases in the cost of energy, raw materials, freight or other factors; (4) domestic and foreign excess manufacturing capacity for certain metals; (5) fluctuations in currency exchange rates; (6) the effect of government trade actions; (7) the valuation of the assets and liabilities in Carpenter Technology's pension trusts and the accounting for pension plans; (8) possible labor disputes or work stoppages; (9) the potential that our customers may substitute alternate materials or adopt different manufacturing practices that replace or limit the suitability of our products; (10) the ability to successfully acquire and integrate acquisitions, including LPW Technology Ltd.; (11) the availability of credit facilities to Carpenter Technology, its customers or other members of the supply chain; (12) the ability to obtain energy or raw materials, especially from suppliers located in countries that may be subject to unstable political or economic conditions; (13) Carpenter Technology's manufacturing processes are dependent upon highly specialized equipment located primarily in facilities in Reading and Latrobe, Pennsylvania and Athens, Alabama for which there may be limited alternatives if there are significant equipment failures or a catastrophic event; (14) the ability to hire and retain key personnel, including members of the executive management team, management, metallurgists and other skilled personnel; and (15) fluctuations in oil and gas prices and production. Any of these factors could have an adverse and/or fluctuating effect on Carpenter Technology's results of operations. The forward-looking statements in this document are intended to be subject to the safe harbor protection provided by Section 27A of the Securities Act of 1933, as amended (the “Securities Act”), and Section 21E of the Securities Exchange Act of 1934, as amended. Carpenter Technology undertakes no obligation to update or revise any forward-looking statements. Non-GAAP Financial Measures Some of the information included in this presentation is derived from Carpenter Technology's consolidated financial information but is not presented in Carpenter Technology's financial statements prepared in accordance with U.S. Generally Accepted Accounting Principles (GAAP). Certain of these data are considered “non-GAAP financial measures” under SEC rules. These non-GAAP financial measures supplement our GAAP disclosures and should not be considered an alternative to the GAAP measure. Reconciliations to the most directly comparable GAAP financial measures and management’s rationale for the use of the non-GAAP financial measures can be found in the Appendix to this presentation. © 2019 CRS Holdings, Inc. All rights reserved 2
2nd Quarter Fiscal Year 2019 Tony Thene President and Chief Executive Officer
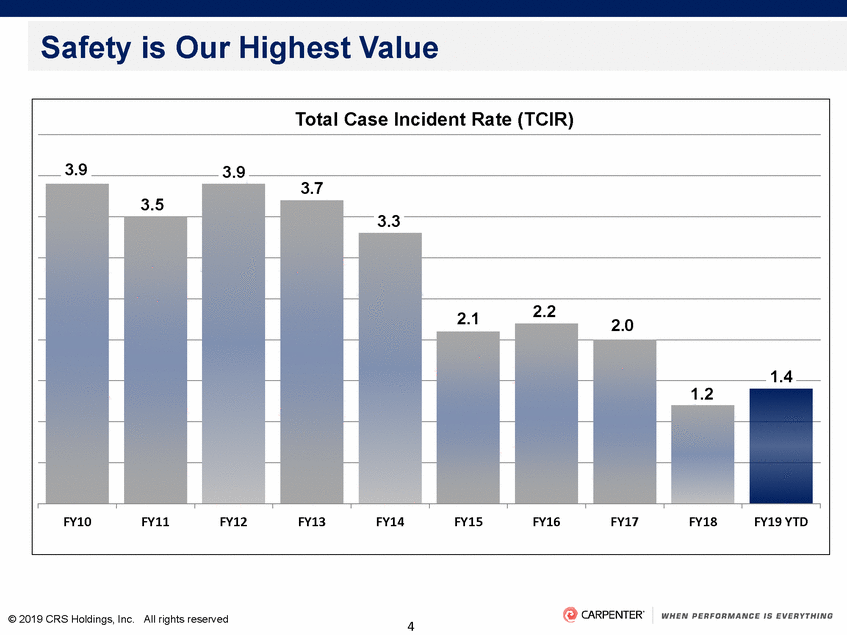
Safety is Our Highest Value 3.7 3.3 © 2019 CRS Holdings, Inc. All rights reserved 4 Total Case Incident Rate (TCIR) 3.9 3.9 3.5 2.12.22.0 1.4 1.2 FY10FY11FY12FY13FY14FY15FY16FY17FY18FY19 YTD
2nd Quarter Summary relationships and leading solutions qualifications; three additional approvals received including additive manufacturing and soft magnetics © 2019 CRS Holdings, Inc. All rights reserved 5 Solid execution drove reported EPS of $0.73, adjusted EPS of $0.76 Strong commercial execution and customer demand drove year-over-year sales growth across key end-use markets Gaining share in Medical end-use market through expanded customer Backlog up 16% sequentially and 49% year-over-year; 10th consecutive quarter of sequential backlog growth Diverse Aerospace and Defense portfolio drove 21% sequential backlog growth; gains across all major sub-markets Progressing with Athens facility Vendor Approved Process (VAP) Further building on leadership position in targeted growth areas Healthy balance sheet enables long-term strategic investments and direct returns to shareholders Executing Strategic Plan Centered on Driving Market Share Gains Across Broad Solutions Portfolio and Investing in Attractive Target Growth Areas
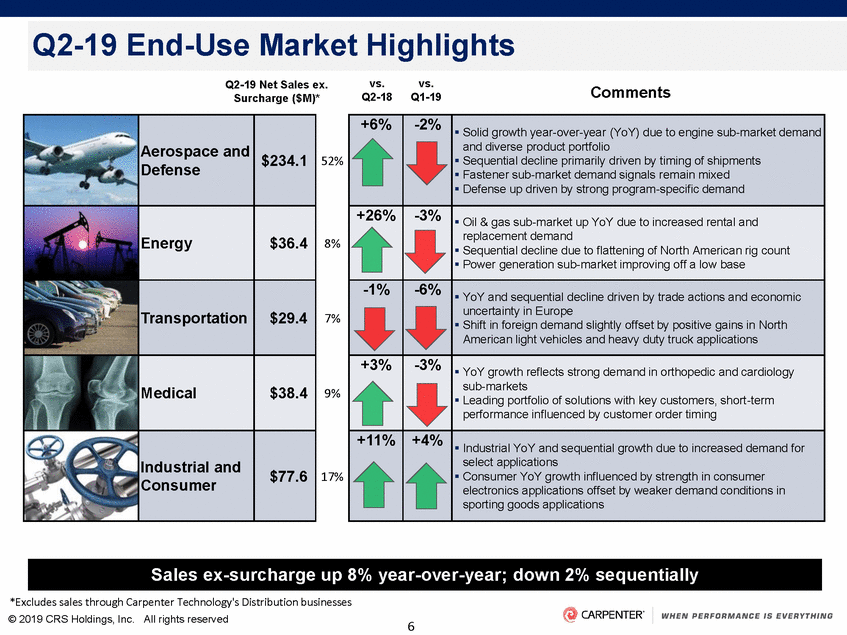
Q2-19 End-Use Market Highlights vs. Q2-18 vs. Q1-19 Q2-19 Net Sales ex. Surcharge ($M)* Comments 52% 8% 7% 9% 17% *Excludes sales through Carpenter Technology's Distribution businesses © 2019 CRS Holdings, Inc. All rights reserved 6 Sales ex-surcharge up 8% year-over-year; down 2% sequentially +6% -2% Solid growth year-over-year (YoY) due to engine sub-market demand and diverse product portfolio Sequential decline primarily driven by timing of shipments Fastener sub-market demand signals remain mixed Defense up driven by strong program-specific demand +26% -3% Oil & gas sub-market up YoY due to increased rental and replacement demand Sequential decline due to flattening of North American rig count Power generation sub-market improving off a low base -1% -6% YoY and sequential decline driven by trade actions and economic uncertainty in Europe Shift in foreign demand slightly offset by positive gains in North American light vehicles and heavy duty truck applications +3% -3% YoY growth reflects strong demand in orthopedic and cardiology sub-markets Leading portfolio of solutions with key customers, short-term performance influenced by customer order timing +11% +4% Industrial YoY and sequential growth due to increased demand for select applications Consumer YoY growth influenced by strength in consumer electronics applications offset by weaker demand conditions in sporting goods applications Aerospace and Defense $234.1 Energy $36.4 Transportation $29.4 Medical $38.4 Industrial and Consumer $77.6
2nd Quarter Financial Overview and Business Update Tim Lain Vice President and Chief Financial Officer
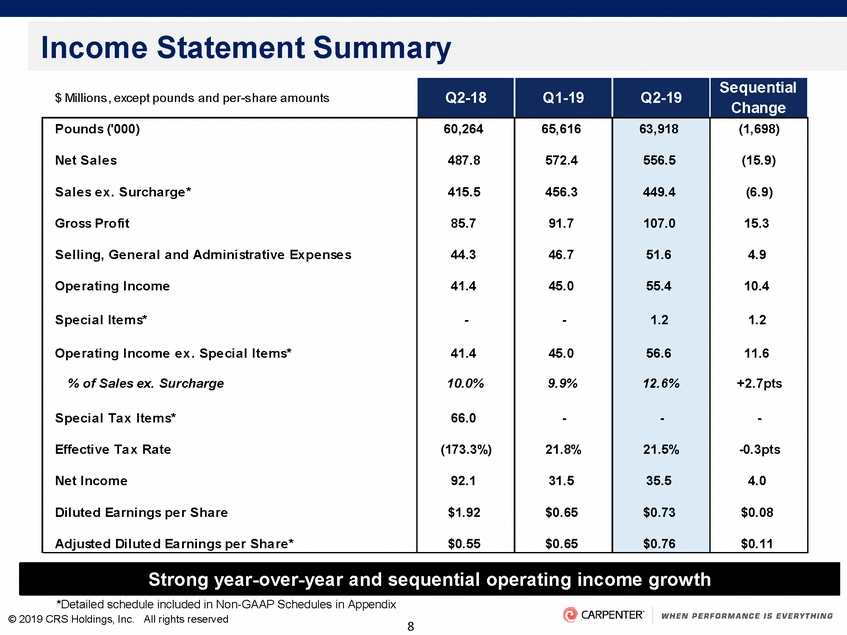
Income Statement Summary Change *Detailed schedule included in Non-GAAP Schedules in Appendix © 2019 CRS Holdings, Inc. All rights reserved 8 Strong year-over-year and sequential operating income growth $ Millions , except pounds and per-s hare am ounts Q2-18 Q1-19 Q2-19 Sequential Pounds ('000) Net Sales Sales ex. Surcharge* Gross Profit Selling, General and Administrative Expenses Operating Income Special Items* Operating Income ex. Special Items* % of Sales ex. Surcharge Special Tax Items* Effective Tax Rate Net Income Diluted Earnings per Share Adjusted Diluted Earnings per Share* 60,264 65,616 572.4 456.3 91.7 46.7 45.0 - 45.0 9.9% - 21.8% 31.5 $0.65 $0.65 63,918 556.5 449.4 107.0 51.6 55.4 1.2 56.6 12.6% - 21.5% 35.5 $0.73 $0.76 (1,698) (15.9) (6.9) 15.3 4.9 10.4 1.2 11.6 +2.7pts - -0.3pts 4.0 $0.08 $0.11 487.8 415.5 85.7 44.3 41.4 - 41.4 10.0% 66.0 (173.3%) 92.1 $1.92 $0.55
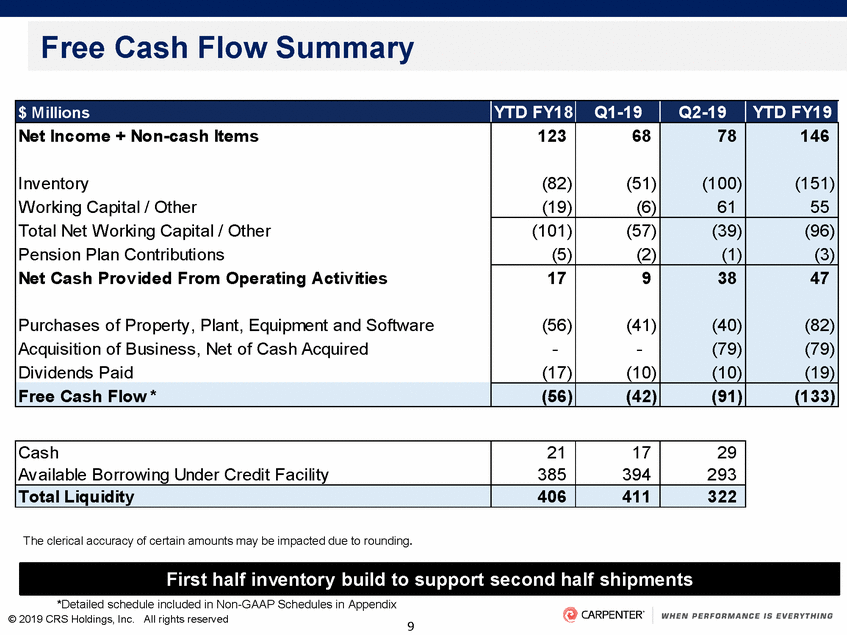
Free Cash Flow Summary The clerical accuracy of certain amounts may be impacted due to rounding. *Detailed schedule included in Non-GAAP Schedules in Appendix © 2019 CRS Holdings, Inc. All rights reserved 9 First half inventory build to support second half shipments Cash Available Borrowing Under Credit Facility 21 385 17 394 29 293 Total Liquidity 406 411 322 $ Millions YTD FY18 Q1-19 Q2-19 YTD FY19 Net Income + Non-cash Items Inventory Working Capital / Other Total Net Working Capital / Other Pension Plan Contributions Net Cash Provided From Operating Activities Purchases of Property, Plant, Equipment and Software Acquisition of Business, Net of Cash Acquired Dividends Paid 123 (82) (19) 68 (51) (6) 78 (100) 61 146 (151) 55 (101) (5) (57) (2) (39) (1) (96) (3) 17 (56) - (17) 9 (41) - (10) 38 (40) (79) (10) 47 (82) (79) (19) Free Cash Flow * (56) (42) (91) (133)
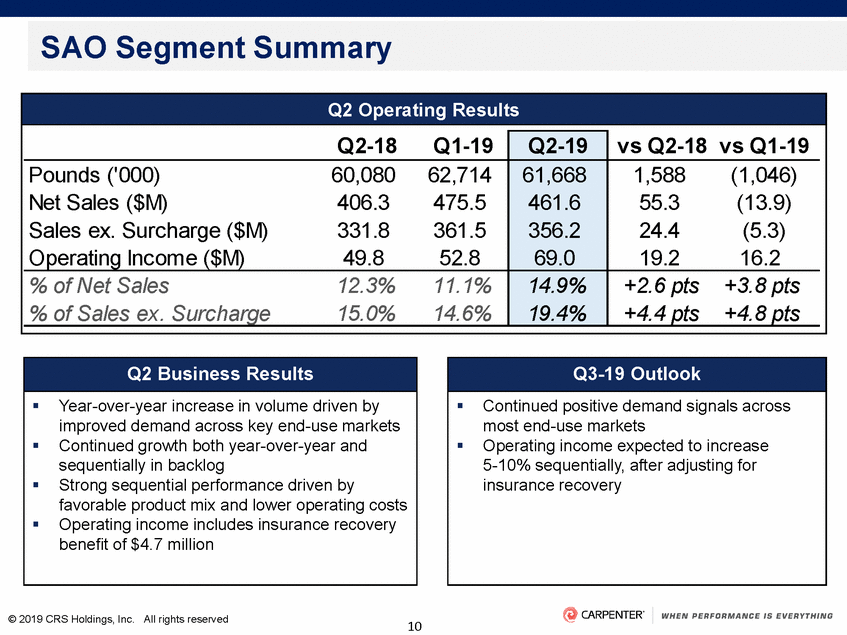
SAO Segment Summary © 2019 CRS Holdings, Inc. All rights reserved 10 Q3-19 Outlook Continued positive demand signals across most end-use markets Operating income expected to increase 5-10% sequentially, after adjusting for insurance recovery Q2 Business Results Year-over-year increase in volume driven by improved demand across key end-use markets Continued growth both year-over-year and sequentially in backlog Strong sequential performance driven by favorable product mix and lower operating costs Operating income includes insurance recovery benefit of $4.7 million Q2 Operating Results Q2-18Q1-19 Q2-19 vs Q2-18 vs Q1-19 Pounds ('000)60,08062,714 Net Sales ($M)406.3475.5 Sales ex. Surcharge ($M)331.8361.5 Operating Income ($M)49.852.8 61,668 461.6 356.2 69.0 1,588(1,046) 55.3(13.9) 24.4(5.3) 19.216.2 % of Net Sales12.3%11.1% % of Sales ex. Surcharge15.0%14.6% 14.9% 19.4% +2.6 pts+3.8 pts +4.4 pts+4.8 pts
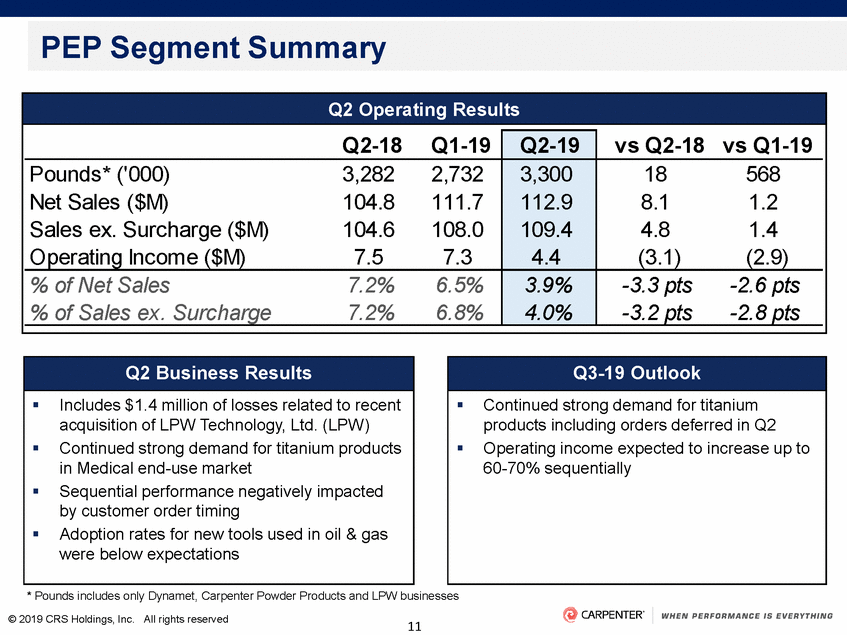
PEP Segment Summary * Pounds includes only Dynamet, Carpenter Powder Products and LPW businesses © 2019 CRS Holdings, Inc. All rights reserved 11 Q3-19 Outlook Continued strong demand for titanium products including orders deferred in Q2 Operating income expected to increase up to 60-70% sequentially Q2 Business Results Includes $1.4 million of losses related to recent acquisition of LPW Technology, Ltd. (LPW) Continued strong demand for titanium products in Medical end-use market Sequential performance negatively impacted by customer order timing Adoption rates for new tools used in oil & gas were below expectations Q2 Operating Results Q2-18Q1-19 Q2-19 vs Q2-18vs Q1-19 Pounds* ('000)3,2822,732 Net Sales ($M)104.8111.7 Sales ex. Surcharge ($M)104.6108.0 Operating Income ($M)7.57.3 3,300 112.9 109.4 4.4 18568 8.11.2 4.8 1.4 (3.1)(2.9) % of Net Sales7.2%6.5% % of Sales ex. Surcharge7.2%6.8% 3.9% 4.0% -3.3 pts-2.6 pts -3.2 pts-2.8 pts
2nd Quarter Fiscal Year 2019 Closing Comments Tony Thene President and Chief Executive Officer
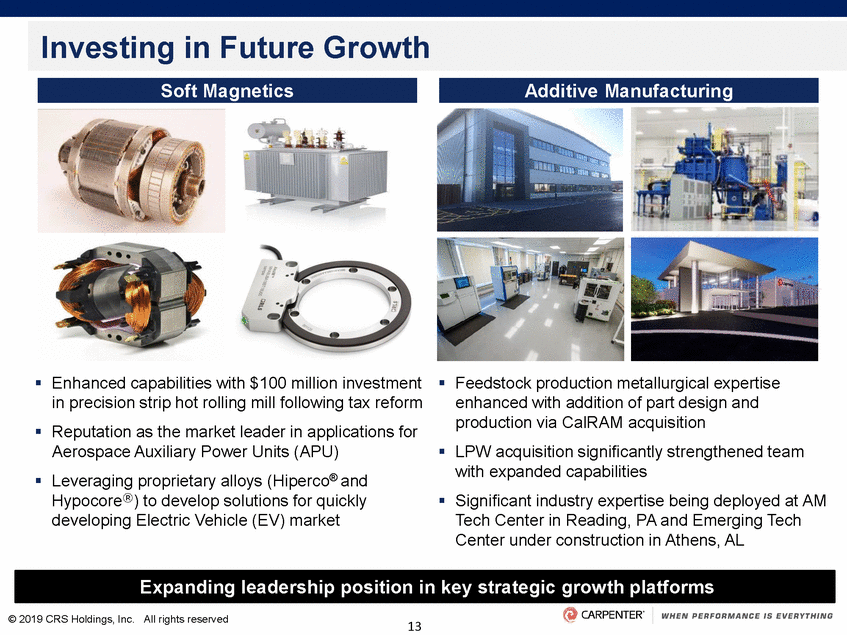
Investing in Future Growth Enhanced capabilities with $100 million investment in precision strip hot rolling mill following tax reform Reputation as the market leader in applications for Aerospace Auxiliary Power Units (APU) Leveraging proprietary alloys (Hiperco® and Hypocore®) to develop solutions for quickly developing Electric Vehicle (EV) market Feedstock production metallurgical expertise enhanced with addition of part design and production via CalRAM acquisition LPW acquisition significantly strengthened team with expanded capabilities Significant industry expertise being deployed at AM Tech Center in Reading, PA and Emerging Tech Center under construction in Athens, AL © 2019 CRS Holdings, Inc. All rights reserved 13 Expanding leadership position in key strategic growth platforms Soft Magnetics Additive Manufacturing
Closing Comments relationships and capacity expansion opportunities three approvals in second quarter © 2019 CRS Holdings, Inc. All rights reserved 14 Solutions-focused approach generating strong end-use market demand, consistent backlog growth and deeper customer Broad Aerospace and Defense solutions driving backlog growth across multiple attractive sub-markets Carpenter Operating Model focused on operational discipline Customer dialogue for Athens VAP qualifications continues; Strengthening foundation for long-term sustainable growth via end-to-end additive manufacturing platform and expanded soft magnetics capabilities Flexibility to invest in strategic growth areas while providing direct returns to shareholders Enhancing Long-Term Growth Profile By Expanding Market Opportunities and Customer Relationships, Improving Manufacturing Operations and Investing in Targeted Growth Areas
Appendix of Non-GAAP Schedules
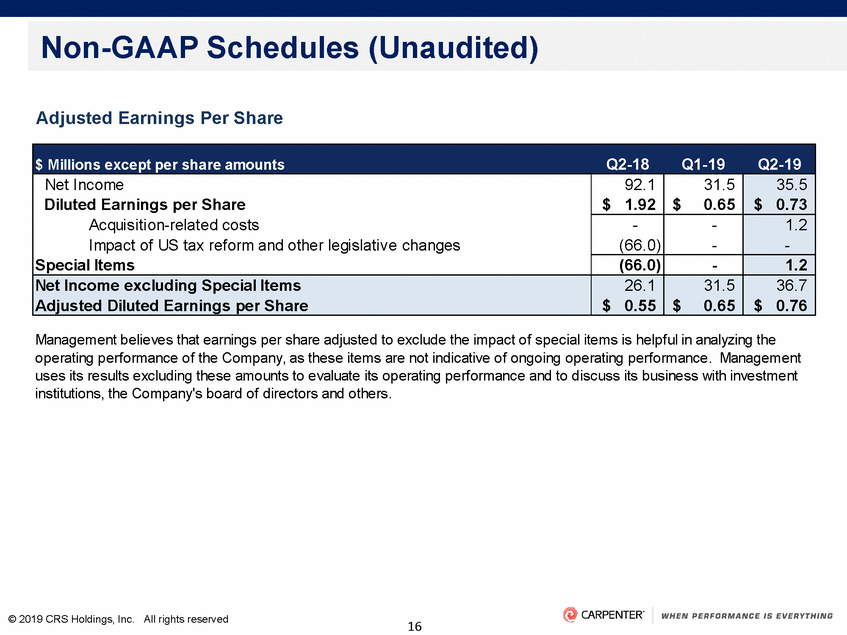
Non-GAAP Schedules (Unaudited) Adjusted Earnings Per Share Management believes that earnings per share adjusted to exclude the impact of special items is helpful in analyzing the operating performance of the Company, as these items are not indicative of ongoing operating performance. Management uses its results excluding these amounts to evaluate its operating performance and to discuss its business with investment institutions, the Company's board of directors and others. © 2019 CRS Holdings, Inc. All rights reserved 16 $ Millions except per share amountsQ2-18 Q1-19 Q2-19 Net Income Diluted Earnings per Share Acquisition-related costs Impact of US tax reform and other legislative changes Special Items 92.1 $ 1.92 31.5 $ 0.65 35.5 $ 0.73 - (66.0) - - 1.2 - (66.0) - 1.2 Net Income excluding Special Items Adjusted Diluted Earnings per Share 26.1 $ 0.55 31.5 $ 0.65 36.7 $ 0.76
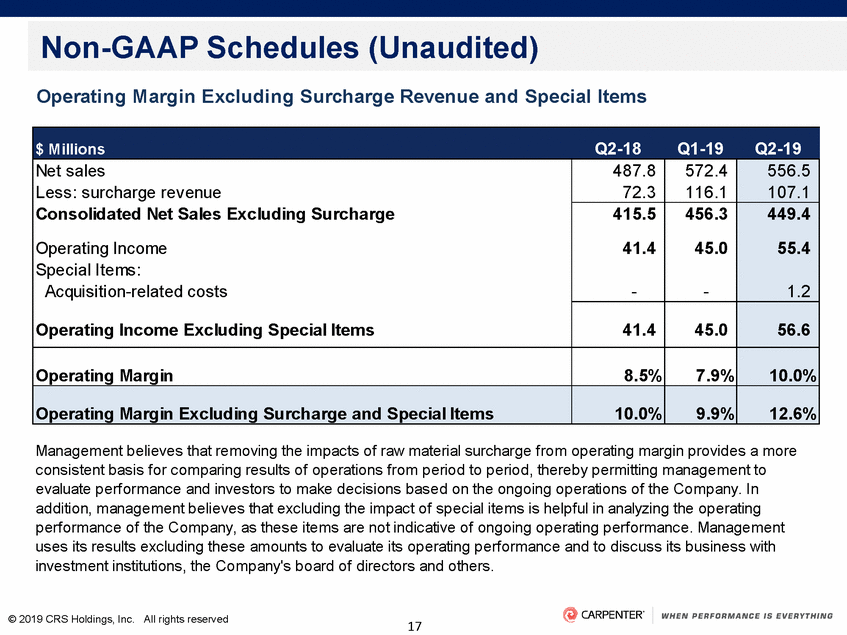
Non-GAAP Schedules (Unaudited) Operating Margin Excluding Surcharge Revenue and Special Items Management believes that removing the impacts of raw material surcharge from operating margin provides a more consistent basis for comparing results of operations from period to period, thereby permitting management to evaluate performance and investors to make decisions based on the ongoing operations of the Company. In addition, management believes that excluding the impact of special items is helpful in analyzing the operating performance of the Company, as these items are not indicative of ongoing operating performance. Management uses its results excluding these amounts to evaluate its operating performance and to discuss its business with investment institutions, the Company's board of directors and others. © 2019 CRS Holdings, Inc. All rights reserved 17 $ MillionsQ2-18 Q1-19 Q2-19 Net sales Less: surcharge revenue Consolidated Net Sales Excluding Surcharge Operating Income Special Items: Acquisition-related costs Operating Income Excluding Special Items 487.8 72.3 572.4 116.1 556.5 107.1 415.5 41.4 - 456.3 45.0 - 449.4 55.4 1.2 41.4 45.0 56.6 Operating Margin 8.5% 7.9% 10.0% Operating Margin Excluding Surcharge and Special Items 10.0% 9.9% 12.6%
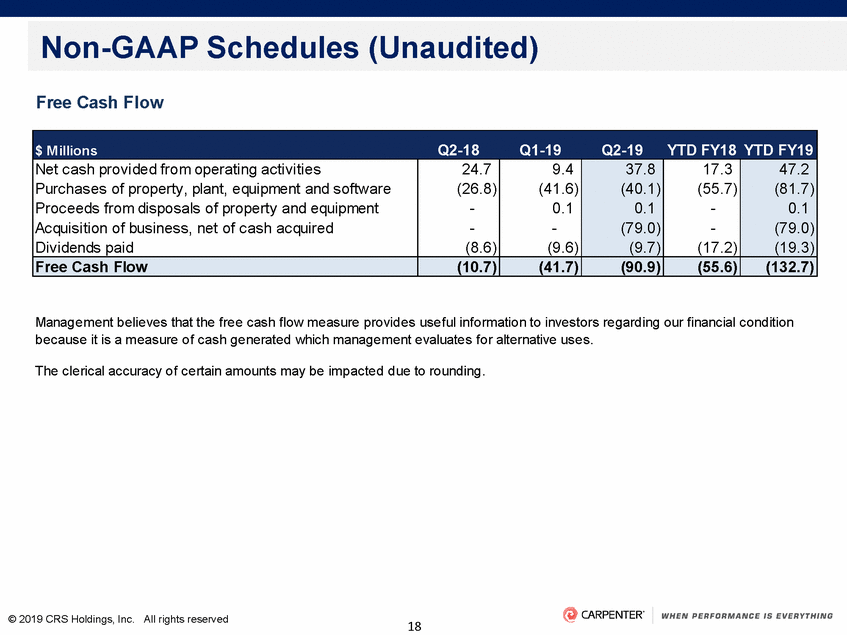
Non-GAAP Schedules (Unaudited) Free Cash Flow Management believes that the free cash flow measure provides useful information to investors regarding our financial condition because it is a measure of cash generated which management evaluates for alternative uses. The clerical accuracy of certain amounts may be impacted due to rounding. © 2019 CRS Holdings, Inc. All rights reserved 18 $ MillionsQ2-18 Q1-19 Q2-19 YTD FY18 YTD FY19 Net cash provided from operating activities Purchases of property, plant, equipment and software Proceeds from disposals of property and equipment Acquisition of business, net of cash acquired Dividends paid 24.7 (26.8) - - (8.6) 9.4 (41.6) 0.1 - (9.6) 37.8 17.3 (55.7) - - (17.2) 47.2 (40.1) (81.7) 0.1 0.1 (79.0) (79.0) (9.7) (19.3) Free Cash Flow (10.7) (41.7) (90.9) (55.6) (132.7)