Attached files
| file | filename |
|---|---|
| 8-K - 8-K - Williams Industrial Services Group Inc. | a19-2846_18k.htm |
Investor Presentation January 2019 Tracy Pagliara President and CEO Tim Howsman Chief Financial Officer Your Trust. Our Passion.

Forward-looking Statement Disclaimer This presentation contains “forward-looking statements” within the meaning of the term set forth in the Private Securities Litigation Reform Act of 1995. The forward-looking statements include statements or expectations the Company’s restructuring and ability to implement short-term and long-term growth initiatives, the Company’s ability execute its strategy for growth and resulting outcomes, expectations for growth of the business in 2019 and beyond, ability to take advantage of opportunities in the nuclear sector, ability to execute its strategic plan, drive best-in-class execution, expand into new markets, diversify and strengthen specialty services offerings, partner with blue chip customers, benefit from an operating company structure, and its ability to obtain new business, and other related matters. These statements reflect the Company’s current views of future events and financial performance and are subject to a number of risks and uncertainties, including its ability to comply with the terms of its credit facility, ability to implement strategic initiatives and business plans, and ability to maintain effective internal control over financial reporting and disclosure controls and procedures. Actual results, performance or achievements may differ materially from those expressed or implied in the forward-looking statements. Additional risks and uncertainties that could cause or contribute to such material differences include, but are not limited to, reduced demand for, or increased regulation of, nuclear and fossil power, loss of any of the Company’s major customers, whether pursuant to the loss of pending or future bids for either new business or an extension of existing business, termination of customer or vendor relationships, cost increases and project cost overruns, unforeseen schedule delays, poor performance by its subcontractors, cancellation of projects, competition, including competitors being awarded business by current customers, damage to the Company’s reputation, warranty or product liability claims, increased exposure to environmental or other liabilities, failure to comply with various laws and regulations, failure to attract and retain highly-qualified personnel, loss of customer relationships with critical personnel, volatility of the Company’s stock price, deterioration or uncertainty of credit markets, changes in the economic and social and political conditions in the United States, including the banking environment or monetary policy, and any suspension of the Company’s continued reporting obligations under the Securities Exchange Act of 1934, as amended. Other important factors that may cause actual results to differ materially from those expressed in the forward-looking statements are discussed in the Company’s filings with the SEC, including the section of the Annual Report on Form 10-K for its 2017 fiscal year titled “Risk Factors.” Any forward-looking statement speaks only as of the date of this press release. Except as may be required by applicable law, Williams undertakes no obligation to publicly update or revise any forward-looking statements, whether as a result of new information, future events or otherwise, and you are cautioned to not to rely upon them unduly. Non-GAAP Financial Measures This presentation will discuss some non-GAAP financial measures, which the Company believes are useful in evaluating our performance. You should not consider the presentation of this additional information in isolation or as a substitute for results compared in accordance with GAAP. The Company has provided reconciliations of comparable GAAP to non-GAAP measures in tables found on the EBITDA Reconciliation slide of this presentation. Cautionary Notes

Agenda Business Overview Strategic Plan Update Financial Review Key Takeaways

Business Overview Your Trust. Our Passion.

Over 50 years of safely helping plant owners and operators enhance asset value Established brand; Excellent historic safety record; Blue chip customer base Single source for broad suite of general construction, maintenance and specialty services Experienced management team; Strong culture of safety, integrity, excellence and results A transformed organization with robust growth plans. Williams is a leading provider of construction and maintenance services for energy and industrial markets. Market Capitalization $47.4 Million 52-Week Price Range $1.41 - $3.95 Recent Price $2.54 Average Volume (3 mo.) 26,000 Common Shares Outstanding 18.5 Million Ownership: Institutions* 52% Insiders 23% Market data as of 1/10/19 (Source: S&P Global IQ); shares outstanding as of 11/09/18; Institutional and insider ownership as of most recent filing Williams Industrial Services Group * Excludes insider holdings

2018: A Transformational Year Transformed from holding company structure to operating business Consolidated headquarters in Atlanta: eliminated over 80% of Dallas corporate headcount Finalized sale and closure of non-core operations: over $80 million in cash proceeds generated from liquidity initiatives beginning mid-2016 Realigned leadership structure and added experienced talent to drive growth with new customers and markets Greater focus on operational excellence and project controls Pursued new strategic growth initiatives with tangible progress Recapitalized balance sheet: refinanced debt and obtained revolver

Significant Commercial Market Progress Transformed and advanced in 2018 Aggressively grew scope at Vogtle 3 & 4 Won Energy Northwest MMC renewal Increased nuclear/fossil/pulp & paper project backlog Grew decommissioning business with Holtec Expansion: Canada and mid-stream Oil & Gas business Executed JV agreements with Arc and BWXT

Appointed SVP in March 2015 Over 20 years experience in energy and industrial markets. Appointed President of Services in August 2016 Over 36 years sales experience in energy and industrial services. Joined as SVP in November 2018 Over 35 years of varied leadership roles in the energy, power and industrial markets. Appointed SVP in November 2018 Over 20 years experience in energy and nuclear power markets. Tenured Leadership Team Appointed CFO in July 2018 36-year career of operational and finance leadership roles in variety of industries. Appointed co-President and CEO in July 2017 and sole President and CEO in April 2018 30 years of leadership and management experience in energy and industrials markets. President and CEO Tracy Pagliara Chief Financial Officer Tim Howsman SVP Business Development & Marketing Tarun Ganeriwal President, Williams Industrial Services Loren Monty SVP, Operations – Energy & Industrial Matt Petrizzo SVP, Operations - Power Kelly Powers

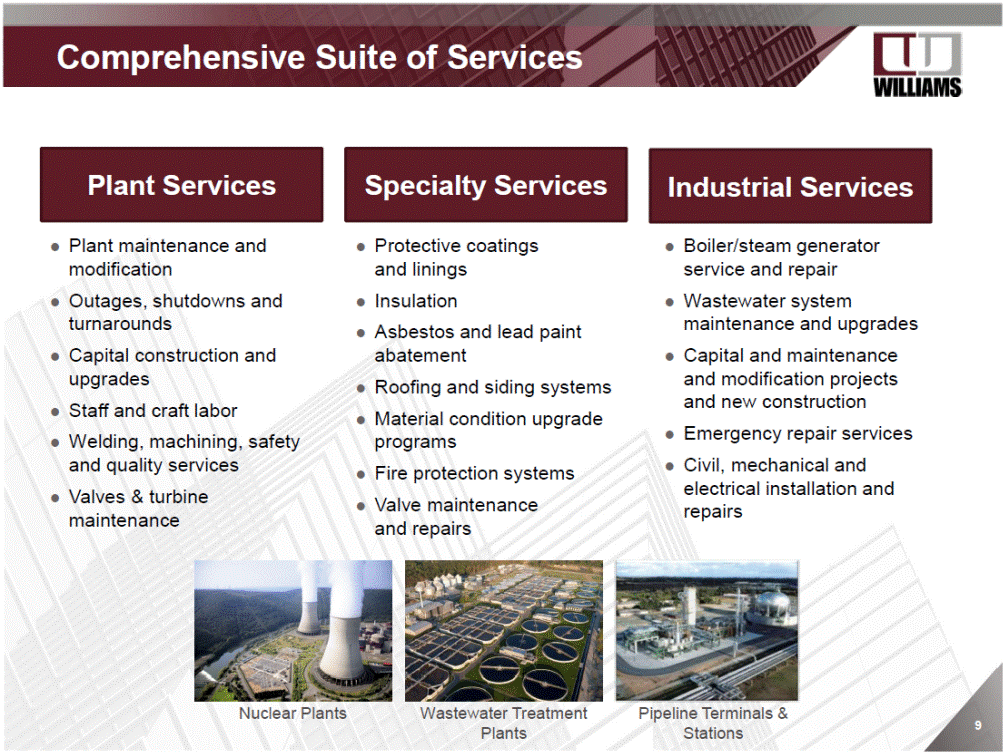
Comprehensive Suite of Services Plant maintenance and modification Outages, shutdowns and turnarounds Capital construction and upgrades Staff and craft labor Welding, machining, safety and quality services Valves & turbine maintenance Protective coatings and linings Insulation Asbestos and lead paint abatement Roofing and siding systems Material condition upgrade programs Fire protection systems Valve maintenance and repairs Boiler/steam generator service and repair Wastewater system maintenance and upgrades Capital and maintenance and modification projects and new construction Emergency repair services Civil, mechanical and electrical installation and repairs Nuclear Plants Wastewater Treatment Plants Pipeline Terminals & Stations 9 Industrial Services Specialty Services Plant Services

Broad Exposure to Diverse Customer Portfolio Blue-chip customers drive short-term results and future revenue growth potential ~60 nuclear reactors ~60 fossil plants ~30 hydro power plants ~25 paper mills ~52 industrial sites >30-year history at many sites

Long-Term Blue Chip Customers Customer Relationship Tenure End Markets 40 years Pulp & Paper Maintenance Services 36 years Nuclear Project Services Fossil and Hydro Maintenance & Project Services 28 years Pulp & Paper Maintenance Services 27 years Fossil & Wastewater Project Services 24 years* Fossil Maintenance & Project Services SNC 22 years Nuclear Project Services 18 years Fossil & Industrial Maintenance & Project Services 12 years Nuclear Maintenance Services *GUBMK is a joint venture of which Williams is a 1/3 owner, but Williams also provides specialty services as a subcontractor to GUBMK

Favorable Revenue* Mix & Strong End Markets * Revenue from continuing operations YTD 9/30/2018 $144.6 million Contract Type End Markets Vogtle 3 & 4 revenue: $64.4 million (1) (1) LTA – Long term services agreement Over 75% of revenue under long-term agreements Cost - plus 82% Fixed - price 18% Nuclear LTA 4% Nuclear Projects 56% Decommissioning 7% Fossil 22% Other Industrial 11%

Building Backlog Backlog by Industry September 30, 2018 Backlog ($ millions) Vogtle 3 & 4 backlog: $113.5 million (1) LTA – Long term services agreement (1) * Preliminary estimate Nuclear LTA 13% Nuclear Projects 64% Decommissioning 1% Fossil 17% Other Industrial 5%

Continued Opportunities in Nuclear Aging nuclear fleet requires extensive ongoing support services New Builds Lead craft labor provider for new reactors currently under construction in the U.S: Vogtle Units 3 & 4 Expect to continue to be major service provider through commissioning in 2020 and 2021 Growing support for nuclear in U.S. energy policy Decommissioning Five nuclear sites being decommissioned; 5 more expected in 5-10 years Currently providing services at SONGS Ultimate potential scope for Williams of $50 million to $75 million annually as projects advance Source: Department of Energy , NEI, World Nuclear Association 14 Maintenance 99 U.S. reactors generate ~20% of U.S. electricity consumption Canada making over $20 billion in upgrade and life extension investments Expected to continue to be a base load provider of electricity

Substantial Market Potential in Energy and Industrial Highly specialized construction and maintenance services Opportunities to Diversify and Grow U.S. O&G pipeline construction market estimated at $42 billion in 2017 -- expected to increase to $48 billion in 2022 223 distinct natural gas-fired projects in the pipeline for North America, representing $84 billion of investments U.S. petrochemical capital spending expected to surge with major capacity additions U.S. municipal water sector expected to reach $72.2 billion annually by 2027 Strong tailwinds in U.S. pulp and paper sector Power plant maintenance expected to grow to nearly $20 billion by 2020

Strategic Plan Update Your Trust. Our Passion.

Strategic Plan Overview Enhance commercial focus with customer mapping Drive operational excellence with improved project controls Implement more rigorous reporting / governance structure Instill performance-driven culture Deepen project scope with current customers Increase number of long-term agreements Leverage experience with digital conversions Win new customers with specialty service offerings Nuclear Decommissioning: Expand opportunities by leveraging nuclear experience to grow existing and new customer relationships Oil & Gas: Capitalize on midstream infrastructure boom Canada: Use nuclear experience for substantial Ontario improvement projects Other Adjacencies: Identify adjacent energy and industrial end markets Upgrade talent and increase focus: Strengthen business with more talent and specific industry focus and knowledge Pursue new partnerships: Increase portfolio of value-added service offerings Acquisitions: Selectively target acquisitions to expand service offerings after 2019 17 Expand into New Markets Strengthen and Diversify Specialty Service Offerings Aggressively Grow Core Business Drive Best-in-Class Execution Our strategic goal is to organically grow Williams into a greater, larger business with a performance-driven culture with best-in-class EBITDA margin

Strategic Initiatives Roadmap Beyond succession and high 18 EXECUTION INITIATIVES Streamline reporting process/enhance process and project controls Enhance talent, performance execution, and implement improved reporting and governance structure Business systems upgrade Instill performance based culture consistent with core values— Safety, Integrity, Excellence and Results Performance review, potential talent programs Develop and implement new strategic plan INVESTOR RELATIONS (IR) & CAPITAL STRUCTURE INITIATIVES Manage SG&A to support budget goals and future growth Refinance term loan and improve overall debt covenants Up-list from OTC pink sheets to OTCQX Evaluate equity to fund growth and/or reduce debt Up-list from OTCQX to NYSE or NASDAQ 2019 2020 2021 & GROWTH INITIATIVES Explore additional joint ventures Win new nuclear LTA award Expand nuclear and fossil projects work Leverage Arc JV to win more nuclear projects work Further penetrate Canadian market Win additional fuel storage/decommissioning projects Grow water business Capture more opportunities in oil & gas Target multiple unit LTA awards Expand oil & gas business geographically Explore acquisitions to expand specialty services

Expanding Total Addressable Market 2019 through 2023 19 Target Markets Annual Addressable Opportunities (approximate $ in millions) Oil & gas midstream $50 - $500 Fossil $75 - $150 Industrial (pulp, paper, water) $100 - $250 Canada nuclear power $125 - $250 Nuclear decommissioning $125 - $300 U.S. nuclear LTA and projects $200 - $600 TOTAL ~$675 - $2,050

Build on Commercial Strengths Single-source provider Best-in-class on time and execution Consistently exceeds Nuclear Quality Assurance Program (NQAP) regulatory requirements Robust Human Performance program contributes to culture of high-quality service Employer of choice Actively supporter of several union certification programs Engaged with Building Trade Crafts Influences training for apprentices and journeymen Total Recordable Incident Rate < 0.8, well below industry average Maintains top 10% safety performance in industry Simplifying processes in mobilization, field supervision, support staff and other overhead Deliver significant cost and time savings Safety culture defining attributes: ownership at all levels Williams is a provider of choice for construction, maintenance and specialty services 20 High Quality Performance on Critical Projects Diverse Array of Complementary Services Unparalleled Strength in Labor Relations Strong Safety Track Record

Strengthen & Diversify Service Offerings Increasing offerings expands addressable market Increase competitive positioningthrough partnerships Arc Energy Services partnership added specialty welding expertise • Other specialties that broaden addressable market Valves Radiation protection Scaffolding Minority-owned business • • • • 21 Address customer needs

Operational Excellence E2 Execution Excellence = A Transformation Initiative Driving Continuous Improvement Right People in the Right Roles at the Right Time (People) (Process) (Tools) Contract Status Reviews Monthly Operational Reviews (MORS) Development of Functional Area Working Groups Independent Reporting for key functional areas 22

Financial Review Your Trust. Our Passion.

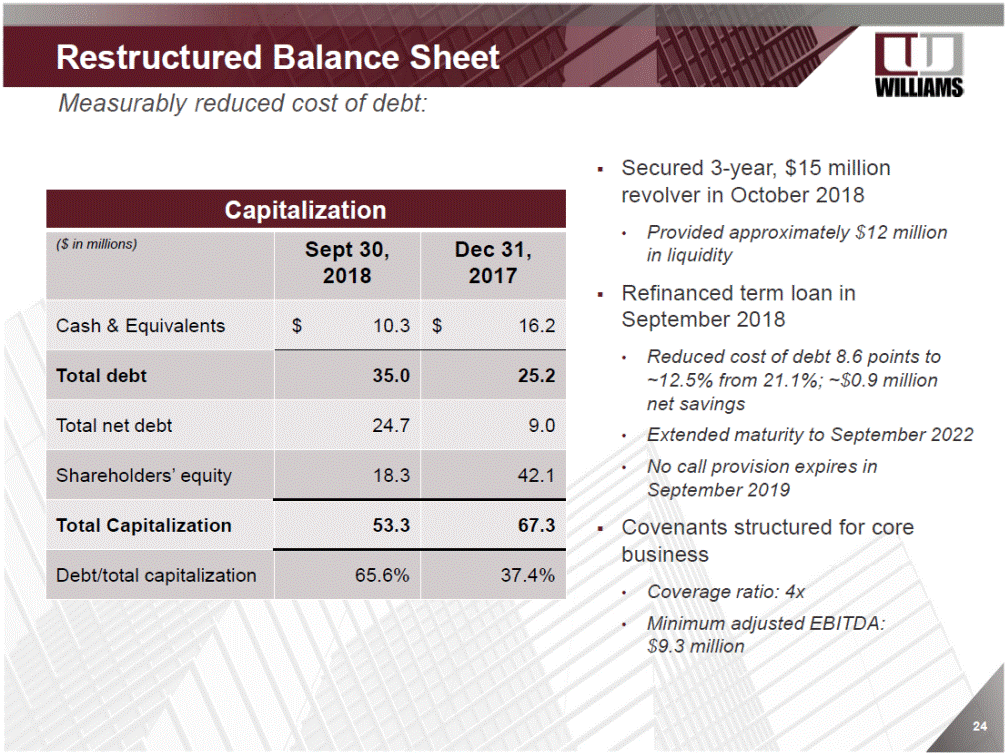
Restructured Balance Sheet Measurably reduced cost of debt: Secured 3-year, $15 million revolver in October 2018 Provided approximately $12 million in liquidity Refinanced term loan in September 2018 • Reduced cost of debt 8.6 points to ~12.5% from 21.1%; ~$0.9 million net savings Extended maturity to September 2022 No call provision expires in September 2019 • • • Covenants structured for core business Coverage ratio: 4x Minimum adjusted EBITDA: $9.3 million • • 24 Capitalization ($ in millions) Sept 30, 2018 Dec 31, 2017 Cash & Equivalents $ 10.3 $ 16.2 Total debt 35.0 25.2 Total net debt 24.7 9.0 Shareholders’ equity 18.3 42.1 Total Capitalization 53.3 67.3 Debt/total capitalization 65.6% 37.4%

2018 Preliminary Expectations and 2019 Outlook 2018 Preliminary revenue expected to be approximately $180 million to $190 million with positive adjusted earnings before interest, taxes and depreciation 2019 Expect Expect Expect revenue of approximately $210 million to $230 million SG&A expenses of approximately 8% to 9% of revenue to refinance debt at lower cost in fourth quarter 25

Key Takeaways Your Trust. Our Passion.

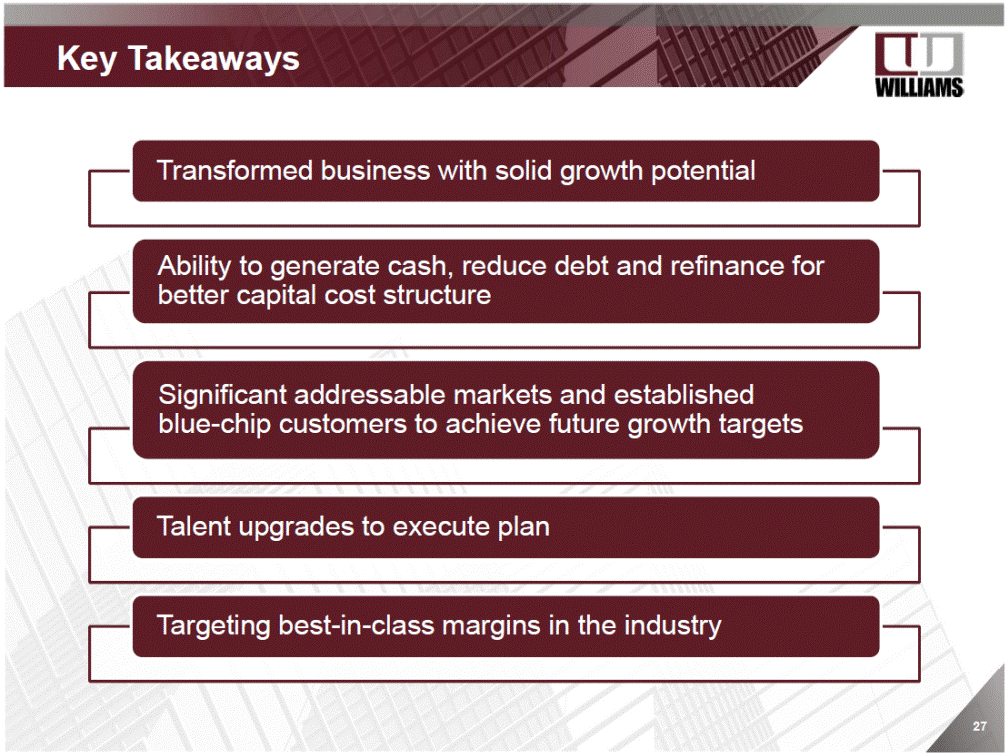
Key Takeaways 27

Your Trust. Our Passion. Investor Presentation January 2019 Tracy Pagliara President and CEO Tim Howsman Chief Financial Officer

