Attached files
| file | filename |
|---|---|
| EX-32.2 - EX-32.2 - INGLES MARKETS INC | imkt-20180929xex32_2.htm |
| EX-32.1 - EX-32.1 - INGLES MARKETS INC | imkt-20180929xex32_1.htm |
| EX-31.2 - EX-31.2 - INGLES MARKETS INC | imkt-20180929xex31_2.htm |
| EX-31.1 - EX-31.1 - INGLES MARKETS INC | imkt-20180929xex31_1.htm |
UNITED STATES
SECURITIES AND EXCHANGE COMMISSION
WASHINGTON D.C. 20549
FORM 10-K
☒ANNUAL REPORT PURSUANT TO SECTION 13 OR 15(d) OF THE SECURITIES EXCHANGE ACT OF 1934
For the fiscal year ended September 29, 2018
☐TRANSITION REPORT PURSUANT TO SECTION 13 OR 15(d) OF THE SECURITIES EXCHANGE ACT OF 1934
For the transition period from to .
Commission File Number 0-14706
INGLES MARKETS, INCORPORATED
(Exact name of registrant as specified in its charter)
|
|
|
|
|
|
|
North Carolina |
56-0846267 |
|
(State or other jurisdiction of incorporation or organization) |
(I.R.S. Employer Identification No.) |
|
|
|
|
2913 U.S. Hwy. 70 West, Black Mountain, NC |
28711 |
|
(Address of principal executive offices) |
(Zip Code) |
|
|
|
|
Registrant’s telephone number including area code: (828) 669-2941 |
|
Securities registered pursuant to Section 12(b) of the Act:
|
|
|
|
Title of each class
|
Name of each exchange on which registered
|
|
Class A Common Stock, $0.05 par value |
The NASDAQ Global Market LLC |
Securities registered pursuant to Section 12(g) of the Act:
None
(Title of Class)
Indicate by check mark if the registrant is a well-known seasoned issuer, as defined in Rule 405 of the Securities Act. YES ☐ NO ☒.
Indicate by check mark if the registrant is not required to file reports pursuant to Section 13 or Section 15(d) of the Act. YES ☐ NO ☒.
Indicate by check mark whether the registrant (1) has filed all reports required to be filed by Section 13 or 15(d) of the Securities Exchange Act of 1934 during the preceding 12 months (or for such shorter period that the registrant was required to file such reports), and (2) has been subject to such filing requirements for the past 90 days. YES ☒ NO ☐.
Indicate by check mark whether the registrant has submitted electronically every Interactive Data File required to be submitted pursuant to Rule 405 of Regulation S-T (§ 232.405 of this chapter) during the preceding 12 months (or for such shorter period that the registrant was required to submit such files). YES ☒ NO ☐ NOT APPLICABLE ☐.
Indicate by check mark if disclosure of delinquent filers pursuant to Item 405 of Regulation S-K is not contained herein, and will not be contained, to the best of registrant’s knowledge, in definitive proxy or information statements incorporated by reference in Part III of this Form 10-K or any amendment to this Form 10-K. ☒
Indicate by check mark whether the registrant is a large accelerated filer, an accelerated filer, a non-accelerated filer, a smaller reporting company or an emerging growth company. See the definitions of “large accelerated filer,” “accelerated filer,” “smaller reporting company” and “emerging growth company” in Rule 12b-2 of the Exchange Act. (Check one):
|
Large accelerated filer ☐ |
Accelerated filer ☒ |
Non-accelerated filer ☐ |
Smaller reporting company ☐ |
Emerging growth company ☐ |
If an emerging growth company, indicate by check mark if the registrant has elected not to use the extended transition period for complying with any new or revised financial accounting standards provided pursuant to Section 13(a) of the Exchange Act. ☐
Indicate by check mark whether the registrant is a shell company (as defined in Rule 12b-2 of the Exchange Act). YES ☐ NO ☒.
As of March 31, 2018, the aggregate market value of voting stock held by non-affiliates of the registrant, based on the closing sales price of the Class A Common Stock on The NASDAQ Global Select Market on March 31, 2018, was approximately $476 million. As of December 4, 2018, the registrant had 14,145,385 shares of Class A Common Stock outstanding and 6,114,391 shares of Class B Common Stock outstanding.
Certain information required in Part III hereof is incorporated by reference to the Proxy Statement for the registrant’s 2019 Annual Meeting of Stockholders to be filed with the Securities and Exchange Commission pursuant to Regulation 14A no later than 120 days after the end of the fiscal year covered by this report.
1
Ingles Markets, Incorporated
Annual Report on Form 10-K
September 29, 2018
|
|
|
Page |
|
|
PART I |
|
|
Item 1. |
Business |
3 |
|
Item 1A. |
Risk Factors |
10 |
|
Item 1B. |
Unresolved Staff Comments |
12 |
|
Item 2. |
Properties |
12 |
|
Item 3. |
Legal Proceedings |
13 |
|
|
PART II |
|
|
Item 5. |
Market for Registrant’s Common Equity, Related Stockholder Matters, and Issuer Purchases of Equity Securities |
13 |
|
Item 6. |
Selected Financial Data |
16 |
|
Item 7. |
Management’s Discussion and Analysis of Financial Condition and Results of Operations |
16 |
|
Item 7A. |
Quantitative and Qualitative Disclosures About Market Risks |
26 |
|
Item 8. |
Financial Statements and Supplementary Data |
27 |
|
Item 9A. |
Controls and Procedures |
28 |
|
Item 9B. |
Other Information |
29 |
|
|
PART III |
|
|
Item 10. |
Directors, Executive Officers and Corporate Governance |
29 |
|
Item 11. |
Executive Compensation |
29 |
|
Item 12. |
Security Ownership of Certain Beneficial Owners and Management and Related Stockholder Matters |
29 |
|
Item 13. |
Certain Relationships and Related Transactions, and Director Independence |
29 |
|
Item 14. |
Principal Accountant Fees and Services |
29 |
|
|
PART IV |
|
|
Item 15. |
Exhibits and Financial Statement Schedules |
30 |
2
This Annual Report of Ingles Markets, Incorporated (“Ingles” or the “Company”) contains certain forward-looking statements within the meaning of Section 21E of the Securities Exchange Act of 1934, as amended (the “Exchange Act”). All statements other than statements of historical fact included in this Annual Report, including the statements under “Management’s Discussion and Analysis of Financial Condition and Results of Operations,” “Business” and elsewhere regarding the Company’s strategy, future operations, financial position, estimated revenues, projected costs, projections, prospects, plans and objectives of management, are forward‑looking statements. The words “expect,” “anticipate,” “intend,” “plan,” “likely,” “goal,” “believe,” “seek” and similar expressions are intended to identify forward-looking statements. While these forward-looking statements and the related assumptions are made in good faith and reflect the Company’s current judgment regarding the direction of the Company’s business, actual results will almost always vary, sometimes materially, from any estimates, predictions, projections, assumptions or other future performance suggested herein. Such statements are based upon a number of assumptions and estimates that are inherently subject to significant risks and uncertainties, many of which are beyond the Company’s control. Some of these assumptions inevitably will not materialize, and unanticipated events will occur which will affect the Company’s results. Some important factors (but not necessarily all factors) that affect the Company’s revenues, growth strategies, future profitability and operating results, or that otherwise could cause actual results to differ materially from those expressed in or implied by any forward-looking statement, include:
|
· |
business and economic conditions generally in the Company’s operating area, including inflation or deflation; |
|
· |
the Company’s ability to successfully implement our expansion and operating strategies; |
|
· |
pricing pressures and other competitive factors, including online-based procurement of products the Company sells; |
|
· |
sudden or significant changes in the availability of gasoline and retail gasoline prices; |
|
· |
the maturation of new and expanded stores; |
|
· |
general concerns about food safety; |
|
· |
the Company’s ability to manage technology and data security; |
|
· |
the availability and terms of financing; |
|
· |
increases in costs, including food, utilities, labor and other goods and services significant to the Company’s operations; |
|
· |
success or failure in the ownership and development of real estate; |
|
· |
changes in the laws and government regulations applicable to the Company; |
|
· |
other risks and uncertainties, including those described under the caption “Risk Factors.” |
Consequently, actual events affecting the Company and the impact of such events on the Company’s operations may vary significantly from those described in this Annual Report. Given these risks and uncertainties, you are cautioned not to place undue reliance on such forward-looking statements. The forward-looking statements included in this Annual Report are made only as of the date hereof. The Company does not undertake and specifically declines any obligation to update any such statements or to publicly announce the results of any revisions to any of such statements to reflect future events or developments.
PART I
Item 1. BUSINESS
General
Ingles Markets, Incorporated (“Ingles” or the “Company”), a leading supermarket chain in the southeast United States, operates 200 supermarkets in North Carolina (72), Georgia (69), South Carolina (36), Tennessee (21), Virginia (1) and Alabama (1).
The Company’s strategy is to locate its supermarkets primarily in suburban areas, small towns and neighborhood shopping centers. The Company remodels, expands and relocates stores in these communities and builds stores in new locations to retain and grow its customer base while retaining a high level of customer service and convenience. Ingles supermarkets offer customers a wide variety of nationally advertised food products, including grocery, meat and dairy products, produce, frozen foods and other perishables, and non-food products. Non-food products include fuel centers, pharmacies, health and
3
beauty care products and general merchandise. The Company also offers quality private label items and locally-sourced items throughout its market areas.
The Company believes that customer service and convenience, modern stores and competitive prices on a broad selection of quality merchandise are essential to developing and retaining a loyal customer base. The Company has an ongoing renovation and expansion plan to add stores in its target market and modernize the appearance and layout of its existing stores. The Company’s new and remodeled supermarkets provide an enhanced level of customer convenience in order to accommodate the lifestyle of today’s shoppers. Design features of the Company’s modern stores focus on selling high-growth, high-margin products including perishable departments featuring local organic and home meal replacement items, in-store pharmacies, on-premises fuel centers, and an expanded selection of food and non-food items.
Substantially all of the Company’s stores are located within 280 miles of its warehouse and distribution facilities, near Asheville, North Carolina. The Company operates 1.65 million square feet of warehouse and distribution facilities. These facilities supply the company’s supermarkets with approximately 58% of the goods the Company sells. The remaining 42% is purchased from third parties and is generally delivered directly to the stores. The close proximity of the Company’s purchasing and distribution operations to its stores facilitates the timely distribution of consistently high quality perishable and non-perishable items.
To further ensure product quality, the Company also owns and operates a milk processing and packaging plant that supplies approximately 80% of the milk products sold by the Company’s supermarkets as well as a variety of organic milk, fruit juices and bottled water products. In addition, the milk processing and packaging plant sells approximately 73% of its products to other retailers, food service distributors and grocery warehouses in 15 states, which provides the Company with an additional source of revenue.
Real estate ownership is an important component of the Company’s operations. The Company owns 161 of its supermarkets, either in free-standing stores or as the anchor tenant in an owned shopping center. Shopping center ownership provides tenant income and can enhance store traffic through the presence of additional products and services that complement grocery store operations. The Company also owns 23 undeveloped sites suitable for a free-standing store or development by the Company or a third party. The Company’s owned real estate is generally located in the same geographic region as its supermarkets. During fiscal year 2018, the Company purchased three shopping centers which contained Ingles stores that had been leased from third party landlords.
The Company was founded by Robert P. Ingle, who served as the Company’s Chief Executive Officer until his death in March 2011. He was succeeded as Chief Executive Officer by his son, Robert P. Ingle II. In March 2016, James W. Lanning was named Chief Executive Officer and Mr. Ingle II retained his title of Chairman of the Board. Mr. Ingle II remains actively involved in the Company’s daily operations.
As of September 29, 2018, Mr. Ingle II owned beneficially (as defined by the Exchange Act) approximately 75% of the combined voting power and 28% of the total number of shares of the Company’s outstanding Class A and Class B Common Stock (in each case including stock held by the Company’s Investment/Profit Sharing Plan and Trust of which Mr. Ingle II serves as one of the trustees). The Company became a publicly traded company in September 1987. The Company’s Class A Common Stock is traded on The NASDAQ Global Select Market under the symbol “IMKTA.” The Company’s Class B Common Stock is not publicly traded.
The Company was incorporated in 1965 under the laws of the State of North Carolina. Its principal mailing address is P.O. Box 6676, Asheville, North Carolina 28816, and its telephone number is 828-669-2941. The Company’s website is www.ingles-markets.com. Information on the Company’s website is not a part of and is not incorporated by reference into this Annual Report on Form 10-K. The Company’s annual report on Form 10-K, quarterly reports on Form 10-Q, current reports on Form 8-K and amendments and supplements to these reports are available on the Company’s website as soon as reasonably practicable after they are filed with or furnished to the Securities and Exchange Commission.
4
Business
The Company operates one primary business segment, retail grocery. Information about the company’s operations is as follows (for information regarding the Company’s industry segments, see Note 11, “Segment Information” to the Consolidated Financial Statements of this Annual Report on Form 10-K):
|
|
|
|
|
|
|
|
|
|
|
|
|
|
|
|
|
|
|
|
|
|
|
|
|
|
|
|
|
|
|
|
|
|
|
|
|
Fiscal Year Ended September |
|||||||||||||
|
|
|
(dollars in millions) |
|||||||||||||
|
|
|
|
|
|
|
|
|
|
|
|
|
|
|
|
|
|
|
|
2018 |
|
2017 |
|
2016 |
|||||||||
|
|
|
|
|
|
|
|
|
|
|
|
|
|
|
|
|
|
Revenues from unaffiliated customers: |
|
|
|
|
|
|
|
|
|
|
|
|
|
|
|
|
Grocery |
|
$ |
1,413.1 |
|
|
|
$ |
1,424.9 |
|
|
|
$ |
1,392.3 |
|
|
|
Non-foods |
|
|
874.7 |
|
|
|
|
858.4 |
|
|
|
|
817.2 |
|
|
|
Perishables |
|
|
1,078.7 |
|
|
|
|
1,061.6 |
|
|
|
|
1,011.7 |
|
|
|
Gasoline |
|
|
604.9 |
|
|
|
|
515.8 |
|
|
|
|
435.6 |
|
|
|
Total retail |
|
|
3,971.4 |
|
97.0% |
|
|
3,860.7 |
|
96.5% |
|
|
3,656.8 |
|
96.4% |
|
Other |
|
|
121.4 |
|
3.0% |
|
|
142.0 |
|
3.5% |
|
|
138.2 |
|
3.6% |
|
|
|
$ |
4,092.8 |
|
100.0% |
|
$ |
4,002.7 |
|
100.0% |
|
$ |
3,795.0 |
|
100.0% |
|
Income from operations: |
|
|
|
|
|
|
|
|
|
|
|
|
|
|
|
|
Retail |
|
$ |
111.2 |
|
89.1% |
|
$ |
112.0 |
|
87.6% |
|
$ |
112.9 |
|
87.8% |
|
Other |
|
|
13.6 |
|
10.9% |
|
|
15.9 |
|
12.4% |
|
|
15.7 |
|
12.2% |
|
|
|
|
124.8 |
|
100.0% |
|
|
127.9 |
|
100.0% |
|
|
128.6 |
|
100.0% |
|
Other income, net |
|
|
3.1 |
|
|
|
|
3.8 |
|
|
|
|
2.3 |
|
|
|
Interest expense |
|
|
47.6 |
|
|
|
|
47.4 |
|
|
|
|
46.3 |
|
|
|
Income before income taxes |
|
$ |
80.3 |
|
|
|
$ |
84.3 |
|
|
|
$ |
84.6 |
|
|
“Other” consists of fluid dairy operations and shopping center rentals.
The grocery category includes grocery, dairy and frozen foods.
The non-foods category includes alcoholic beverages, tobacco, pharmacy, and health/beauty/cosmetic products.
The perishables category includes meat, produce, deli and bakery.
Supermarket Operations
The Company’s strategy is to locate its supermarkets primarily in suburban areas, small towns and neighborhood shopping centers. At September 29, 2018, the Company operated 190 supermarkets under the name “Ingles,” and 10 supermarkets under the name “Sav-Mor” with locations in western North Carolina, western South Carolina, northern Georgia, eastern Tennessee, southwestern Virginia and northeastern Alabama. The “Sav-Mor” store concept accommodates smaller shopping areas and carries dry groceries, dairy, fresh meat and produce, all of which are displayed in a modern, readily accessible environment.
The following table sets forth certain information with respect to the Company’s supermarket operations.
|
|
|
|
|
|
|
|
|
|
|
|
|
|
|
|
|
Number of Supermarkets |
|
Percentage of Total |
||||||||
|
|
|
at Fiscal |
|
Net Sales for Fiscal |
||||||||
|
|
|
Year Ended September |
|
Year Ended September |
||||||||
|
|
|
2018 |
|
2017 |
|
2016 |
|
2018 |
|
2017 |
|
2016 |
|
North Carolina |
|
72 |
|
70 |
|
70 |
|
42% |
|
41% |
|
41% |
|
South Carolina |
|
36 |
|
36 |
|
36 |
|
18% |
|
18% |
|
18% |
|
Georgia |
|
69 |
|
70 |
|
71 |
|
32% |
|
33% |
|
33% |
|
Tennessee |
|
21 |
|
21 |
|
21 |
|
8% |
|
8% |
|
8% |
|
Virginia |
|
1 |
|
1 |
|
2 |
|
— |
|
— |
|
— |
|
Alabama |
|
1 |
|
1 |
|
1 |
|
— |
|
— |
|
— |
|
|
|
200 |
|
199 |
|
201 |
|
100% |
|
100% |
|
100% |
The Company believes that today’s supermarket customers are focused on convenience, quality and value in an attractive store environment. As a result, the Company’s shopping experience combines a high level of customer service, convenience-oriented quality product offerings and low overall pricing. The Company’s modern stores provide products and services such as home meal replacement items, delicatessens, bakeries, floral departments, greeting cards and broad selections of local organic, beverage and health-related items. At September 29, 2018, the Company operated 108 pharmacies and 102 fuel stations. The Company plans to continue to incorporate these departments in substantially all future new and remodeled
5
stores. The Company trains its employees to provide friendly service and to actively address the needs of customers. These employees reinforce the Company’s distinctive service-oriented image.
Selected statistics on the Company’s supermarket operations are presented below:
|
|
|
|
|
|
|
|
|
|
|
|
|
|
|
|
|
|
|
|
Fiscal Year Ended September |
|||||||||||||
|
|
|
2018 |
|
2017 |
|
2016 |
|
2015 |
|
2014 |
|||||
|
Weighted Average Sales Per Store (000’s) (1) |
|
$ |
19,674 |
|
$ |
19,133 |
|
$ |
18,107 |
|
$ |
18,003 |
|
$ |
18,267 |
|
Total Square Feet at End of Year (000’s) |
|
|
11,329 |
|
|
11,173 |
|
|
11,117 |
|
|
11,049 |
|
|
11,063 |
|
Average Total Square Feet per Store |
|
|
56,643 |
|
|
56,146 |
|
|
55,310 |
|
|
54,974 |
|
|
54,770 |
|
Average Square Feet of Selling Space per Store (2) |
|
|
39,650 |
|
|
39,302 |
|
|
38,717 |
|
|
38,482 |
|
|
38,339 |
|
Weighted Average Sales per Square Foot of Selling Space (1) (2) |
|
|
502 |
|
|
494 |
|
|
471 |
|
|
470 |
|
|
476 |
|
(1) |
Weighted average sales per store include the effects of increases in square footage due to the opening of replacement stores and the expansion of stores through remodeling during the periods indicated, and gasoline sales. The decrease in weighted average sales per square foot of selling space in fiscal years 2015 and 2016 is attributable to significantly lower gasoline prices. Gasoline prices increased beginning with fiscal year 2017. |
|
|
|
|
(2) |
Selling space is estimated to be 70% of total interior store square footage. |
Merchandising
The Company’s merchandising strategy is designed to create a comprehensive and satisfying shopping experience that blends value and customer service with variety, quality and convenience. Management believes that this strategy fosters a loyal customer base by establishing a reputation for providing high quality products and a variety of specialty departments.
The Company’s stores carry broad selections of quality meats, produce and other perishables. The Company offers a wide variety of fresh and non-perishable organic products, including organic milk produced by the Company’s fluid dairy plant. The Company’s market areas contain numerous providers of quality local products, which is in line with current customer preferences for goods produced where they live. Management believes that supermarkets offering a broad array of products and time-saving services are perceived by customers as part of a solution to today’s lifestyle demands. Accordingly, a principal component of the Company’s merchandising strategy is to design stores that enhance the shopping experience. The Company operates fuel stations at 102 of its store locations. The Company believes fuel stations give customers a competitive fuel choice and increase store traffic by allowing customers to consolidate trips.
A selection of prepared foods and home meal replacements are featured throughout Ingles’ deli, bakery, produce and meat departments to provide customers with easy meal alternatives that they can eat at home or in the store. Many stores offer daily selections of home meal replacement items, such as rotisserie chicken and pork, international foods, fried chicken and other entrees, sandwiches, pre-packaged salads, sushi, cut fruit and prepared fresh vegetables. The bakery offers an expanded selection of baked goods and self-service selections. Ingles bakes most of its items on site, including bread baked daily, cakes made to order in various sizes, donuts and other pastries. The deli offers salad, chicken wing and olive bars, an expanded offering of cheeses, gourmet items and home meal replacement items. The Company also provides its customers with an expanded selection of frozen food items (including organics) to meet the increasing demands of its customers.
Ingles intends to continue to increase sales of its private label brands, which typically carry higher margins than comparable branded products. Ingles’ private labels cover a broad range of products throughout the store, such as milk, bread, organic products, soft drinks and canned goods. In addition to increasing margins, Ingles believes that private label sales help promote customer loyalty and provide a value-priced alternative to national brands.
The Company seeks to maintain a reputation for providing friendly service, quality merchandise and customer value and for its commitment to locally-sourced product and community involvement. The Company employs various advertising and promotional strategies to reinforce the quality and value of its products. The Company promotes these attributes using traditional advertising vehicles including radio, television, direct mail and newspapers, as well as electronic and social media. The Ingles Advantage Card is designed to foster customer loyalty by providing information to better understand the Company’s customers’ shopping patterns. The Ingles Advantage Card provides customers with special discounts throughout the Company’s stores and fuel stations.
Purchasing and Distribution
The Company currently supplies approximately 58% of its supermarkets’ inventory requirements from its modern warehouse and distribution facilities. The Company has 1.65 million square feet of office, warehouse and distribution facilities at its
6
headquarters near Asheville, North Carolina. The Company believes that its warehouse and distribution facilities will contain sufficient capacity for the continued expansion of its store base for the foreseeable future.
The Company’s centrally managed purchasing and distribution operations provide several advantages, including the ability to negotiate and reduce the cost of merchandise, decrease overhead costs and better manage its inventory at both the warehouse and store level. From time to time, the Company engages in advance purchasing on high-turnover inventory items to take advantage of special prices offered by manufacturers for limited periods, or to ensure adequate product supply during tight distribution market conditions.
The remaining 42% of the Company’s inventory requirements, primarily beverages, gasoline, bread and snack foods, are supplied directly to the Company’s supermarkets by local distributors and manufacturers.
Goods from the warehouse and distribution facilities and the milk processing and packaging plant are distributed to the Company’s stores by a fleet of 191 tractors and 753 trailers that the Company operates and maintains. The Company invests on an ongoing basis in the maintenance, upgrade and replacement of its tractor and trailer fleet. The Company also operates truck servicing and fuel storage facilities at its warehouse and distribution facilities. The Company reduces its overall distribution costs by capitalizing on back-haul opportunities (contracting to transport merchandise on trucks that would otherwise be empty) and by providing freight services for Milkco and for independent third parties.
The Company receives product recall information from various subscription, government and vendor sources. Upon receipt of recall information, the Company immediately contacts each of its stores to have the recalled product removed from the shelves, and disposes of the product as instructed. The Company may also use social media to communicate product recall information to the public. The Company has a policy of refunding and/or replacing any goods returned by customers. The details of this policy are posted inside each of the Company’s stores.
Store Development, Expansion and Remodeling
The Company believes that the appearance and design of its stores are integral components of its customers’ shopping experience and aims to develop one of the most modern supermarket chains in the industry. The ongoing modernization of the Company’s store base involves (i) the construction of new stores with continuously updated designs, and (ii) the replacement, remodeling or expansion of existing stores. The Company’s goal is to maintain clean, well-lit stores with attractive architectural and display features that enhance the image of its stores as catering to the changing lifestyle needs of quality-conscious consumers who demand increasingly diverse product offerings.
The Company is focused primarily on developing owned stores. Management believes that owning stores provides the Company with flexible, lower all-in occupancy costs. The construction of new stores by independent contractors is closely monitored and controlled by the Company. Recently, the Company has had a greater number of circumstances where an existing store was closed in order to build a new store building on the same site that reflects the Company’s current marketing strategies. The Company has also had opportunities to purchase at favorable prices shopping centers that included stores previously leased by the Company. These purchases provide flexibility for future store redevelopment as well as current net rental income.
The Company renovates and remodels stores in order to increase customer traffic and sales, respond to existing customer demand, compete effectively against new stores opened by competitors and support its quality image merchandising strategy. The Company decides to complete a remodel of an existing store based on its evaluation of the competitive landscape of the local marketplace. A remodel or expansion provides the quality of facilities and product offerings identical to that of a new store, capitalizing upon the existing customer base. The Company retains the existing customer base by keeping the store in operation during the entire remodeling process. The Company may elect to relocate, rather than remodel, certain stores where relocation provides a more convenient location for its customers and is more economical.
7
The following table sets forth, for the periods indicated, the Company’s new store development and store remodeling activities and the effect this program has had on the average size of its stores:
|
|
|
|
|
|
|
|
|
|
|
|
|
|
|
2018 |
|
2017 |
|
2016 |
|
2015 |
|
2014 |
|
Number of Stores: |
|
|
|
|
|
|
|
|
|
|
|
Opened (1) |
|
5 |
|
2 |
|
1 |
|
1 |
|
1 |
|
Closed (1) |
|
4 |
|
4 |
|
1 |
|
2 |
|
2 |
|
Stores open at end of period |
|
200 |
|
199 |
|
201 |
|
201 |
|
202 |
|
Size of Stores: |
|
|
|
|
|
|
|
|
|
|
|
Less than 30,000 sq. ft. |
|
14 |
|
14 |
|
15 |
|
15 |
|
15 |
|
30,000 up to 41,999 sq. ft. |
|
35 |
|
36 |
|
38 |
|
39 |
|
39 |
|
42,000 up to 51,999 sq. ft. |
|
22 |
|
22 |
|
23 |
|
24 |
|
25 |
|
At least 52,000 sq. ft. |
|
129 |
|
127 |
|
125 |
|
123 |
|
123 |
|
Average store size (sq. ft.) |
|
56,643 |
|
56,146 |
|
55,310 |
|
54,974 |
|
54,770 |
(1)Excludes new stores opened to replace existing stores.
The Company’s ability to open new stores is subject to many factors, including the acquisition of satisfactory sites and the successful negotiation of new leases, and may be limited by zoning and other governmental regulation. In addition, the Company’s expansion, remodeling and replacement plans are continually reviewed and are subject to change. See the “Liquidity and Capital Resources” section included in “Item 7. Management’s Discussion and Analysis of Financial Condition and Results of Operations” regarding the Company’s capital expenditures.
Competition
The supermarket industry is highly competitive and characterized by narrow profit margins. The degree of competition the Company’s stores encounter varies by location, primarily based on the size of the community in which the store is located and its proximity to other communities. The Company’s principal competitors are, in alphabetical order, Aldi, Inc., Bi-Lo, LLC., Food City (K-VA-T Food Stores, Inc.), Food Lion (Koninlijke Ahold Delhaize America N.V..), Harris Teeter (owned by The Kroger Co.), The Kroger Co., Lidl (Lidl Stiftung & Co. KG), Publix Super Markets, Inc., Target Corporation, Whole Foods Market, and Wal-Mart Stores, Inc. Increasingly over the last few years, competition for consumers’ food dollars has intensified due to the addition of, or increase in, food sections by many types of retailers (physical and online) and by restaurants.
Supermarket chains generally compete on the basis of location, quality of products, service, price, convenience, product variety and store condition.
The Company believes its competitive advantages include convenient locations, the quality of service it provides its customers, competitive pricing, product variety, quality and a pleasant shopping environment, which is enhanced by its ongoing modernization program.
In recent years, the number of online industry transactions has increased. These transactions can include online ordering, and delivery by store pickup, delivery from the store, or other means. Much of this increase in online transactions has taken place in markets with greater population density than the Company’s store locations.
By concentrating its operations within a relatively small geographic region, the Company is also positioned to more carefully monitor its markets, and the needs of its customers within those markets. The Company’s senior executives live and work in the Company’s operating region, thereby allowing management to quickly identify changes in needs and customer preference. Because of the Company’s size, store managers have direct access to corporate management and are able to receive quick decisions regarding requested changes in operations. The Company can then move quickly to make adjustments in its business in response to changes in the market and customer needs.
The Company’s management monitors competitive activity and regularly reviews and periodically adjusts the Company’s marketing and business strategies as management deems appropriate in light of existing conditions in the Company’s region. The Company’s ability to remain competitive in its changing markets will depend in part on its ability to pursue its expansion and renovation programs and its response to remodeling and new store openings by its competitors.
Seasonality
Sales in the grocery segment of the Company’s business are subject to a slight seasonal variance due to holiday related sales and due to sales in areas where seasonal homes are located. Sales are traditionally higher in the Company’s first fiscal quarter due to the inclusion of sales related to Thanksgiving and Christmas. The Company’s second fiscal quarter traditionally has
8
the lowest sales of the year, unless Easter falls in that quarter. In the third and fourth quarters, sales are affected by the return of customers to seasonal homes in the Company’s market area. The Company’s fluid dairy operations have a slight seasonal variation to the extent of its sales into the grocery industry. The Company’s real estate operations are not subject to seasonal variations.
Employees and Labor Relations
At September 29, 2018, the Company had approximately 26,000 non-union employees, of which 92% were supermarket personnel. Approximately 62% of these employees work on a part-time basis. Management considers employee relations to be good. The Company values its employees and believes that employee loyalty and enthusiasm are key elements of its operating performance. Recently, competition for labor has been more intense resulting in higher costs to attract and retain associates. The Company has responded by increasing resources devoted to employee recruitment and retention, and has expanded the ways in which it markets itself to prospective employees.
Trademarks and Licenses
The Company employs various trademarks and service marks in its business, the most important of which are its own “Laura Lynn” and “Harvest Farms” private label trademarks, “The Ingles Advantage” service mark, and the “Ingles” service mark. These service marks and the trademarks are federally registered in the United States pursuant to applicable intellectual property laws and are the property of Ingles. The Company believes it has all material licenses and permits necessary to conduct its business.
The current expiration dates for significant trade and service marks are as follows: “Ingles” – December 9, 2025; “Laura Lynn” – March 13, 2024; “Harvest Farms” – August 5, 2024; and “The Ingles Advantage” – August 30, 2025. Each registration may be renewed for an additional ten-year term prior to its expiration. The Company intends to file all renewals timely. Each of the Company’s trademark license agreements has a one year term which, with respect to one license, is automatically renewed annually, unless the owner of the trademark provides notice of termination prior to the expiration date and, with respect to the other licenses, are renewed periodically by letter from the licensor. The Company currently has four pending applications for additional trademarks or service marks.
Environmental Matters
Under applicable environmental laws, the Company may be responsible for remediation of environmental conditions and may be subject to associated liabilities relating to its stores and other buildings and the land on which such stores and other buildings are situated (including responsibility and liability related to its operation of its gas stations and the storage of gasoline in underground storage tanks), regardless of whether the Company leases or owns the stores, other buildings or land in question and regardless of whether such environmental conditions were created by the Company or by a prior owner or tenant. The presence of contamination from hazardous or toxic substances, or the failure to properly remediate such contaminated property, may adversely affect the Company’s ability to sell or rent such real property or to borrow using such real property as collateral. The Company typically conducts an environmental review prior to acquiring or leasing new stores, other buildings or raw land.
Federal, state and local governments could enact laws or regulations concerning environmental matters that affect the Company’s operations or facilities or increase the cost of producing or distributing the Company’s products. The Company believes that it currently conducts its operations, and in the past has conducted its operations, in substantial compliance with applicable environmental laws. The Company, however, cannot predict the environmental liabilities that may result from legislation or regulations adopted in the future, the effect of which could be retroactive. Nor can the Company predict how existing or future laws and regulations will be administered or interpreted or what environmental conditions may be found to exist at its facilities or at other properties where the Company or its predecessors have arranged for the disposal of hazardous substances.
The Company strives to employ sound environmental operating policies, including recycling packaging, recycling wooden pallets, and re-circulating some water used in its car washes. The Company offers reusable shopping bags to its customers and will pack groceries in bags brought in by its customers. The Company’s store modernization plans include energy efficient lighting and refrigeration equipment.
Government Regulation
The Company is subject to regulation by a variety of governmental agencies, including, but not limited to, the U.S. Food and Drug Administration, the U.S. Department of Agriculture, the Occupational Health and Safety Administration and other
9
federal, state and local agencies. The Company’s stores are also subject to local laws regarding zoning, land use and the sale of alcoholic beverages. The Company believes that its locations are in material compliance with such laws and regulations.
Item 1A. RISK FACTORS
Below is a series of risk factors that may affect the Company's business, financial condition and/or results of operations. Other risk factors are contained in "Item 7. Management's Discussion and Analysis of Financial Condition and Results of Operations" and the Notes to the Consolidated Financial Statements of this Annual Report on Form 10-K. The Company operates in a continually changing business environment, and new risk factors emerge from time to time. Management cannot predict such new risk factors, nor can it assess the impact, if any, of these risk factors on the Company's business, financial condition and/or results of operations or the extent to which any factor or combination of factors may impact of any of these areas.
The Company’s expansion and renovation plans may not be successful which may adversely affect the Company’s business and financial condition due to the capital expenditures and management resources required to carry out the Company’s plans.
The Company has spent, and intends to continue to spend, significant capital and management resources on the development and implementation of the Company’s expansion and renovation plans. These plans, if implemented, may not be successful, may not improve operating results and may have an adverse effect on cash flow and management resources due to the significant amount of capital invested and management time expended.
The level of sales and profit margins in the Company’s existing stores may not be duplicated in the Company’s new stores, depending on factors such as prevailing competition, development cost, and the Company’s market position in the surrounding community.
The Company’s warehouse and distribution center and milk processing and packaging plant, as well as all of the Company’s stores, are concentrated in the Southeastern United States, which makes it vulnerable to economic downturns, natural disasters and other adverse conditions or other catastrophic events in this region.
The Company operates in the Southeastern United States, and its performance is therefore heavily influenced by economic developments in the Southeast region. The Company’s headquarters, warehouse and distribution center and milk processing and packaging plant are located in North Carolina and all of the Company’s stores are located in the Southeast region. As a result, the Company’s business may be more susceptible to regional factors than the operations of more geographically diversified competitors. These factors include, among others, changes in the economy, weather conditions, demographics and population.
The Company has, and expects to continue to have, a significant amount of indebtedness.
At September 29, 2018, the Company had total consolidated indebtedness for borrowed money of $865.6 million and $165.6 million available under a $175.0 million of committed line of credit. A portion of the Company’s cash flow is used to service such indebtedness. The Company owns a significant amount of real estate, which has been and will continue to be a factor in the Company’s overall level of indebtedness. Real estate can be used as collateral for indebtedness and can be sold to reduce indebtedness. The Company’s significant indebtedness could have important consequences, including the following:
|
· |
it may be difficult for the Company to satisfy its obligations under its existing credit facilities and its other indebtedness and commitments; |
|
· |
the Company is required to use a portion of its cash flow from operations to pay interest and principal on its current and future indebtedness, which may require the Company to reduce funds available for other purposes; |
|
· |
the Company may have to use a greater portion of its cash flow from operations to pay interest, if interest rates increase; |
|
· |
the Company may have a limited ability to obtain additional financing, if needed, to fund additional projects, working capital requirements, capital expenditures, debt service, general corporate or other obligations, and; |
|
· |
the Company may be placed at a competitive disadvantage to its competitors that are not as highly leveraged. |
The Company’s principal stockholder, Robert P. Ingle II, has the ability to elect a majority of the Company’s directors, appoint new members of management and approve many actions requiring stockholder approval.
10
Mr. Ingle II’s beneficial ownership (as defined by the Exchange Act) represents approximately 75% of the combined voting power of all classes of the Company’s capital stock as of September 29, 2018. As a result, Mr. Ingle II has the power to elect a majority of the Company’s directors and approve any action requiring the approval of the holders of the Company’s Class A Common Stock and Class B Common Stock, including adopting certain amendments to the Company’s charter and approving mergers or sales of substantially all of the Company’s assets.
The Company is a Controlled Company under the NASDAQ Marketplace Rules. As a result, the Company is exempt from certain of NASDAQ’s corporate governance policies, including the requirements that the majority of Directors be independent (as defined in NASDAQ rules), and that the Company have a nominating committee for Director candidates.
If the Company loses the services of its key personnel, the Company’s business could suffer.
The Company’s continued success depends upon the availability and performance of the Company’s executive officers, who possess unique and extensive industry knowledge and experience. The loss of the services of any of the Company’s executive officers or other key employees could adversely affect the Company’s business.
Various aspects of the Company’s business are subject to federal, state and local laws and various operating regulations. The Company’s compliance with these regulations may require additional capital expenditures and could adversely affect the Company’s ability to conduct the Company’s business as planned.
The Company is subject to federal, state and local laws and regulations relating to zoning, land use, work place safety, public health, community right-to-know, beer and wine sales, country of origin labeling of food products, pharmaceutical sales and gasoline station operations. Furthermore, the Company’s business is regulated by a variety of governmental agencies, including, but not limited to, the U.S. Food and Drug Administration, the U.S. Department of Agriculture, and the Occupational Safety and Health Administration. Employers are also subject to laws governing their relationship with employees, including minimum wage requirements, overtime, working conditions, insurance coverage, disabled access and work permit requirements. Recent and proposed regulation has had or may have a future impact on the cost of insurance benefits for employees and on the cost of processing debit and credit card transactions. Compliance with, or changes in, these laws could reduce the revenue and profitability of the Company’s supermarkets and could otherwise adversely affect the Company’s business, financial condition or results of operations.
The Company is affected by certain operating costs which could increase or fluctuate considerably.
The Company depends on qualified employees to operate the Company’s stores and have been affected by recent tight labor markets. A shortage of qualified employees could require the Company to enhance the Company’s wage and benefit package in order to better compete for and retain qualified employees, and the Company may not be able to recover these increased labor costs through price increases charged to customers, which could significantly increase the Company’s operating costs.
The Company is self-insured for workers’ compensation, general liability and group medical and dental benefits. Risks and uncertainties are associated with self-insurance; however, the Company has limited its exposure by maintaining excess liability coverage. Self-insurance liabilities are established based on claims filed and estimates of claims incurred but not reported. The estimates are based on data provided by the respective claims administrators and analyses performed by actuaries engaged by the Company. These estimates can fluctuate if historical trends are not predictive of the future. The majority of the Company’s properties are self-insured for casualty losses and business interruption; however, liability coverage is maintained.
Energy and utility costs have been volatile in recent years, during which time the Company has expanded its store square footage. The Company attempts to increase its energy efficiency during store construction and remodeling through the use of energy-saving equipment and construction.
The Company is subject to risks related to information systems and data security.
The Company’s business is dependent on information technology systems. These complex systems are an important part of ongoing operations. If the Company were to experience disruption in these systems, did not maintain existing systems properly, or did not implement new systems appropriately, operations could suffer.
The Company has implemented procedures to protect its information technology systems and data necessary to conduct ongoing operations. The Company cannot however, be certain that all of these systems and data are entirely free from vulnerability to attack.
Compliance with tougher privacy and information security laws and standards, including protection of customer debit and credit card information, may result in higher investments in technology and changes to operational processes.
11
In recent years, more industry transactions have been online for ordering and fulfillment. This trend places a higher reliance on effective and efficient information systems.
The Company is affected by the availability and wholesale price of gasoline and retail gasoline prices, all of which can fluctuate quickly and considerably.
The Company operates fuel stations at 102 of its store locations. While the Company obtains gasoline and diesel fuel from a number of different suppliers, long-term disruption in the availability and wholesale price of gasoline for resale could have a material adverse effect on the Company’s business, financial condition and/or results of operations.
Fluctuating fuel costs could adversely affect the Company’s operating costs which depend on fuel for the Company’s fleet of tractors and trailers which distribute goods from the Company’s distribution facility and for the Company’s fluid dairy operations.
Furthermore, fluctuating fuel costs could have an adverse effect on the Company’s total gasoline sales (both in terms of dollars and gallons sold), the profitability of gasoline sales, and the Company’s plans to develop additional fuel centers. Also, retail gas price volatility could diminish customer usage of fueling centers and, thus, adversely affect customer traffic at the Company’s stores.
The Company’s industry is highly competitive. If the Company is unable to compete effectively, the Company’s financial condition and results of operations could be materially affected.
The supermarket industry is highly competitive and continues to be characterized by intense price competition, increasing fragmentation of retail formats, entry of non-traditional competitors (both physical and online) and market consolidation. Furthermore, some of the Company’s competitors have greater financial resources and could use these financial resources to take measures, such as altering product mix, reducing prices, home/in-store fulfillment, or online ordering which could adversely affect the Company’s competitive position.
Disruptions in the efficient distribution of food products to the Company’s warehouse and stores may adversely affect the Company’s business.
The Company’s business could be adversely affected by disruptions in the efficient distribution of food products to the Company’s warehouse and stores. Such disruptions could be caused by, among other things, adverse weather conditions, fuel availability, shortage of truck drivers, food contamination recalls and civil unrest in foreign countries in which the Company’s suppliers do business.
The Company’s operations are subject to economic conditions that impact consumer spending.
The Company’s results of operations are sensitive to changes in overall economic conditions that impact consumer spending, including discretionary spending. Future economic conditions such as employment levels, business conditions, interest rates, energy and fuel costs and tax rates could reduce consumer spending or change consumer purchasing habits. A general reduction in the level of consumer spending or the Company’s inability to respond to shifting consumer attitudes regarding products, store location and other factors could adversely affect the Company’s business, financial condition and/or results of operations.
Item 1B. UNRESOLVED STAFF COMMENTS
None.
Item 2. PROPERTIES
Owned Properties
The Company owns 161 of its supermarkets either as free-standing or in shopping centers where it is the anchor tenant. The Company also owns 23 undeveloped sites which are suitable for a free-standing store or shopping center development. The Company owns numerous outparcels and other acreage located adjacent to the shopping centers and supermarkets it owns. Real estate owned by the Company is generally located in the same geographic regions as its supermarkets.
The shopping centers owned by the Company contain an aggregate of 6.9 million square feet of leasable space, of which 3.6 million square feet is used by the Company’s supermarkets. The remainder of the leasable space in these shopping centers is leased or held for lease by the Company to third party tenants. A breakdown by size of the shopping centers owned and operated by the Company is as follows:
12
|
|
|
|
|
Size |
|
Number |
|
Less than 50,000 square feet |
|
16 |
|
50,000 – 100,000 square feet |
|
31 |
|
More than 100,000 square feet |
|
30 |
|
Total |
|
77 |
The Company owns an 1,649,000 square foot facility, which is strategically located between Interstate 40 and Highway 70 near Asheville, North Carolina, as well as the 119 acres of land on which it is situated. The facility includes the Company’s headquarters and its warehouse and distribution facility. The property also includes truck servicing and fuel storage facilities. The Company also owns a 139,000 square foot warehouse on 21 acres of land approximately one mile from its main warehouse and distribution facility.
The Company’s milk processing and packaging subsidiary, Milkco, Inc., owns a 140,000 square foot manufacturing and storage facility in Asheville, North Carolina. In addition to the plant, the 20-acre property includes truck cleaning and fuel storage facilities.
Certain long-term debt of the Company is secured by the owned properties. See Note 7, “Long-Term Debt” to the Consolidated Financial Statements of this Annual Report on Form 10-K for further details.
Leased Properties
The Company operates supermarkets at 39 locations leased from various unaffiliated third parties. Certain of the leases give the Company the right of first refusal to purchase the entire shopping center in which the supermarkets are located. The majority of these leases require the Company to pay property taxes, utilities, insurance, repairs and certain other expenses incidental to occupation of the premises. In addition to base rent, most leases contain provisions that require the Company to pay additional percentage rent (ranging from 0.75% to 1.50%) if sales exceed a specified amount.
Rental rates generally range from $2.66 to $7.68 per square foot. During fiscal 2018, 2017 and 2016, the Company paid a total of $11.8 million, $12.6 million and $12.7 million, respectively, in supermarket rent, exclusive of property taxes, utilities, insurance, repairs and other expenses. The following table summarizes lease expiration dates as of September 29, 2018, with respect to the initial and any renewal option terms of leased supermarkets:
|
|
|
|
|
|
|
|
|
Year of Expiration |
|
Number of |
|
(Including Renewal Terms) |
|
Leases Expiring |
|
2018-2030 |
|
5 |
|
2031-2045 |
|
1 |
|
2046 or after |
|
33 |
Management believes that the long-term rent stability provided by these leases is a valuable asset of the Company.
Item 3. LEGAL PROCEEDINGS
Various legal proceedings and claims arising in the ordinary course of business are pending against the Company. In the opinion of management, the ultimate liability, if any, from all pending legal proceedings and claims would not materially affect the Company’s business, financial condition and/or the results of operations.
PART II
Item 5. MARKET FOR REGISTRANT’S COMMON EQUITY, RELATED STOCKHOLDER MATTERS, AND ISSUER PURCHASES OF EQUITY SECURITIES
Market Information
The Company has two classes of Common Stock: Class A and Class B. Class A Common Stock is traded on The NASDAQ Global Select Market under the symbol IMKTA. There is no public market for the Company’s Class B Common Stock. However, under the terms of the Company’s Articles of Incorporation, any holder of Class B Common Stock may convert any portion or all of the holder’s shares of Class B Common Stock into an equal number of shares of Class A Common Stock at any time. For additional information regarding the voting powers, preferences and relative rights of the Class A Common Stock and Class B Common Stock, please see Note 8, “Stockholders’ Equity” to the Consolidated Financial Statements of this Annual Report on Form 10-K.
13
As of December 4, 2018, there were approximately 416 holders of record of the Company’s Class A Common Stock and 124 holders of record of the Company’s Class B Common Stock. The following table sets forth the reported high and low closing sales price for the Class A Common Stock during the periods indicated as reported by NASDAQ. The quotations reflect actual inter-dealer prices without retail mark-up, mark-down or commission and may not necessarily represent actual transactions.
|
|
|
|
|
|
|
|
|
2018 Fiscal Year |
|
High |
|
Low |
||
|
First Quarter (ended December 30, 2017) |
|
$ |
36.35 |
|
$ |
22.80 |
|
Second Quarter (ended March 31, 2018) |
|
$ |
36.50 |
|
$ |
29.40 |
|
Third Quarter (ended June 30, 2018) |
|
$ |
35.10 |
|
$ |
27.93 |
|
Fourth Quarter (ended September 29, 2018) |
|
$ |
36.80 |
|
$ |
28.40 |
|
|
|
|
|
|
|
|
|
2017 Fiscal Year |
|
High |
|
Low |
||
|
First Quarter (ended December 24, 2016) |
|
$ |
51.70 |
|
$ |
38.33 |
|
Second Quarter (ended March 25, 2017) |
|
$ |
49.80 |
|
$ |
43.15 |
|
Third Quarter (ended June 24, 2017) |
|
$ |
47.55 |
|
$ |
31.65 |
|
Fourth Quarter (ended September 30, 2017) |
|
$ |
33.75 |
|
$ |
20.90 |
On December 4, 2018, the closing sales price of the Company’s Class A Common Stock on The NASDAQ Global Select Market was $27.57 per share.
Dividends
The Company has paid cash dividends on its Common Stock in each of the past 34 fiscal years, except for the 1984 fiscal year when the Company paid a 3% stock dividend. During both fiscal 2018 and fiscal 2017, the Company paid annual dividends totaling $0.66 per share of Class A Common Stock and $0.60 per share of Class B Common Stock, paid in quarterly installments of $0.165 and $0.15 per share, respectively. The Company’s last dividend payment was made on October 18, 2018 to common stockholders of record on October 11, 2018. For additional information regarding the dividend rights of the Class A Common Stock and Class B Common Stock, please see Note 8, “Stockholders’ Equity” to the Consolidated Financial Statements of this Annual Report on Form 10-K.
The Company expects to continue paying regular cash dividends on a quarterly basis. However, the Board of Directors periodically reconsiders the declaration of dividends. The Company pays these dividends at the discretion of the Board of Directors. The continuation of these payments, the amount of such dividends, and the form in which the dividends are paid (cash or stock) depends upon the results of operations, the financial condition of the Company and other factors which the Board of Directors deems relevant. The payment of cash dividends is also subject to restrictions contained in certain financing arrangements. Such restrictions are summarized in Note 7, “Long-Term Debt” to the Consolidated Financial Statements of this Annual Report on Form 10-K.
Equity Compensation Plan Information
The Company does not have any equity compensation plans.
14
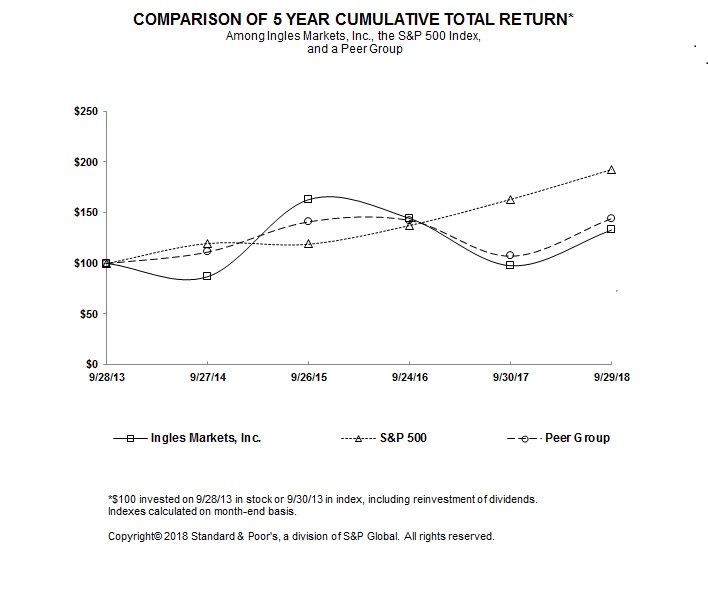
Stock Performance Graph
Set forth below are a graph and accompanying table comparing the five-year cumulative total stockholder return on the Class A Common Stock with the five-year cumulative total return of (i) the S&P 500 Comprehensive-Last Trading Day Index and (ii) a peer group of companies in the Company's line of business. The 2018 peer group consists of the following companies: Koninklijke Ahold Delhaize N.V., Weis Markets, Inc., The Kroger Co., Supervalu Inc., SpartanNash Co., Sprouts Farmers Markets, Inc., and Village Super Market, Inc.
The comparisons cover the five-years ended September 29, 2018 and assume that $100 was invested after the close of the market on September 28, 2013, and that dividends were reinvested quarterly. Returns of the companies included in the peer group reflected below have been weighted according to each company’s stock market capitalization at the beginning of each section for which a return is presented.
15
INDEXED RETURNS OF INITIAL $100 INVESTMENT*
|
|
|
|
|
|
|
|
|
|
|
|
|
|
|
|
|
|
|
|
|
|
|
|
|
|
|
|
|
|
|
|
|
|
|
Company/Index |
|
|
2014 |
|
|
2015 |
|
|
2016 |
|
|
2017 |
|
|
2018 |
|
Ingles Markets, Incorporated Class A Common Stock |
|
$ |
86.78 |
|
$ |
162.91 |
|
$ |
144.12 |
|
$ |
97.58 |
|
$ |
132.89 |
|
S&P 500 Comprehensive – Last Trading Day Index |
|
$ |
119.73 |
|
$ |
119.00 |
|
$ |
137.36 |
|
$ |
162.92 |
|
$ |
192.10 |
|
2018 Peer Group |
|
$ |
111.33 |
|
$ |
140.96 |
|
$ |
142.41 |
|
$ |
107.32 |
|
$ |
144.19 |
*Assumes $100 invested in the Class A Common Stock of Ingles Markets, Incorporated after the close of the market on September 28, 2013.
The foregoing stock performance information, including the graph, shall not be deemed to be “soliciting material” or to be filed with the Securities and Exchange Commission.
Item 6. SELECTED FINANCIAL DATA
The selected financial data set forth below has been derived from the Company’s Consolidated Financial Statements included elsewhere in this Annual Report on Form 10-K. This financial data should be read in conjunction with Item 7. “Management’s Discussion and Analysis of Financial Condition and Results of Operations” and the Consolidated Financial Statements and Notes thereto.
|
|
|
|
|
|
|
|
|
|
|
|
|
|
|
|
|
|
|
|
Selected Income Statement Data for the Years Ended September |
|||||||||||||
|
|
|
(in thousands, except per share amounts) |
|||||||||||||
|
|
|
2018 |
|
2017 |
|
2016 |
|
2015 |
|
2014 |
|||||
|
Net Sales |
|
$ |
4,092,805 |
|
$ |
4,002,700 |
|
$ |
3,794,977 |
|
$ |
3,778,644 |
|
$ |
3,835,986 |
|
Net Income |
|
|
97,365 | (3) |
|
53,874 |
|
|
54,189 |
|
|
59,353 |
|
|
51,426 |
|
Diluted Earnings per Common Share |
|
|
|
|
|
|
|
|
|
|
|
|
|
|
|
|
Class A |
|
$ |
4.81 |
|
$ |
2.66 |
|
$ |
2.68 |
|
$ |
2.93 |
|
$ |
2.28 |
|
Class B |
|
|
4.49 |
|
|
2.49 |
|
|
2.50 |
|
|
2.74 |
|
|
2.14 |
|
Cash Dividends per Common Share |
|
|
|
|
|
|
|
|
|
|
|
|
|
|
|
|
Class A |
|
$ |
0.66 |
|
$ |
0.66 |
|
$ |
0.66 |
|
$ |
0.66 |
|
$ |
0.66 |
|
Class B |
|
|
0.60 |
|
|
0.60 |
|
|
0.60 |
|
|
0.60 |
|
|
0.60 |
|
|
|
|
|
|
|
|
|
|
|
|
|
|
|
|
|
|
|
|
Selected Balance Sheet Data at September |
|||||||||||||
|
|
|
(in thousands) |
|||||||||||||
|
|
|
2018 |
|
2017 |
|
2016 |
|
2015 (2) |
|
2014 (2) |
|||||
|
Current Assets |
|
$ |
496,743 |
|
$ |
445,840 |
|
$ |
418,487 |
|
$ |
423,746 |
|
$ |
405,009 |
|
Property and Equipment, net |
|
|
1,303,044 |
|
|
1,265,112 |
|
|
1,247,882 |
|
|
1,211,458 |
|
|
1,218,607 |
|
Total Assets |
|
|
1,824,911 |
|
|
1,733,306 |
|
|
1,686,478 |
|
|
1,654,828 |
|
|
1,638,757 |
|
Current Liabilities, including Current Portion of Long-Term Debt |
|
|
260,138 |
|
|
245,563 |
|
|
241,605 |
|
|
251,960 |
|
|
249,462 |
|
Long-Term Liabilities, net of Current Portion (1) |
|
|
894,898 |
|
|
906,772 |
|
|
903,249 |
|
|
909,247 |
|
|
944,274 |
|
Stockholders’ Equity |
|
|
595,414 |
|
|
511,052 |
|
|
470,176 |
|
|
428,978 |
|
|
382,602 |
|
(1) |
Excludes long-term deferred income tax liability. |
|
(2) |
Restated to reflect retrospective adoption of new accounting pronouncement affecting debt issuance costs and deferred tax assets. |
|
(3) |
Includes $37.3 million income tax benefit from tax law changes and adoption of a different tax depreciation calculation method. |
Item 7. MANAGEMENT’S DISCUSSION AND ANALYSIS OF FINANCIAL CONDITION AND RESULTS OF OPERATIONS
Overview
Ingles, a leading supermarket chain in the Southeast United States, operates 200 supermarkets in North Carolina (72), Georgia (69), South Carolina (36), Tennessee (21), Virginia (1) and Alabama (1). The Company locates its supermarkets primarily in suburban areas, small towns and neighborhood shopping centers. Ingles supermarkets offer customers a wide variety of nationally advertised food products, including grocery, meat and dairy products, produce, frozen foods and other perishables and non-food products. Non-food products include fuel centers, pharmacies, health and beauty care products and general merchandise. The Company offers quality private label items in most of its departments. In addition, the Company focuses on selling high-growth, high-margin products to its customers through the development of certified organic products,
16
bakery departments and prepared foods including delicatessen sections. As of September 29, 2018, the Company operated 108 in-store pharmacies and 102 fuel centers.
Ingles also operates a fluid dairy and earns shopping center rentals. The fluid dairy sells approximately 27% of its products to the retail grocery segment and approximately 73% of its products to third parties. Real estate ownership is an important component of the Company’s operations, providing both operational and economic benefit.
Critical Accounting Policies
Critical accounting policies are those accounting policies that management believes are important to the portrayal of Ingles’ financial condition and results of operations, and require management’s most difficult, subjective or complex judgments, often as a result of the need to make estimates about the effect of matters that are inherently uncertain. Estimates are based on historical experience and other factors believed to be reasonable under the circumstances, the results of which form the basis for making judgments about the carrying values of assets and liabilities that are not readily apparent from other sources. Management estimates, by their nature, involve judgments regarding future uncertainties, and actual results may therefore differ materially from these estimates.
Self-Insurance
The Company is self-insured for workers’ compensation, general liability, and group medical and dental benefits. Risks and uncertainties are associated with self-insurance; however, the Company has limited its exposure by maintaining excess liability coverage of $750,000 per occurrence for workers’ compensation, $500,000 for general liability, and $450,000 per covered person for medical care benefits for a policy year. Self-insurance liabilities are established based on claims filed and estimates of claims incurred but not reported. The estimates are based on data provided by the respective claims administrators which is then applied to appropriate actuarial methods. These estimates can fluctuate if historical trends are not predictive of the future. The majority of the Company’s properties are self-insured for casualty losses and business interruption; however, liability coverage is maintained. The Company’s self-insurance reserves totaled $34.7 million and $35.5 million for employee group insurance, workers’ compensation insurance and general liability insurance at September 29, 2018 and September 30, 2017, respectively. These amounts are inclusive of expected recoveries from excess cost insurance or other sources that are recorded as receivables of $4.6 million at September 29, 2018 and $4.8 million at September 30, 2017.
Asset Impairments
The Company accounts for the impairment of long-lived assets in accordance with Financial Accounting Standards Board Accounting Standards Codification (“FASB ASC”) Topic 360. Asset groups are primarily comprised of our individual store and shopping center properties. For assets to be held and used, the Company tests for impairment using undiscounted cash flows and calculates the amount of impairment using discounted cash flows. For assets held for sale, impairment is recognized based on the excess of remaining book value over expected recovery value. The recovery value is the fair value as determined by independent quotes or expected sales prices developed by internal associates, net of costs to sell. Estimates of future cash flows and expected sales prices are judgments based upon the Company’s experience and knowledge of local operations and cash flows that are projected for several years into the future. These estimates can fluctuate significantly due to changes in real estate market conditions, the economic environment, capital spending decisions and inflation. The Company monitors the carrying value of long-lived assets for potential impairment each quarter based on whether any indicators of impairment have occurred.
Vendor Allowances
The Company receives funds for a variety of merchandising activities from the many vendors whose products the Company buys for resale in its stores. These incentives and allowances are primarily comprised of volume or purchase based incentives, advertising allowances, slotting fees, and promotional discounts. The purpose of these incentives and allowances is generally to help defray the costs incurred by the Company for stocking, advertising, promoting and selling the vendor’s products. These allowances generally relate to short term arrangements with vendors, often relating to a period of a month or less, and are negotiated on a purchase-by-purchase or transaction-by-transaction basis. Whenever possible, vendor discounts and allowances that relate to buying and merchandising activities are recorded as a reduction of item cost in inventory and recognized in merchandise costs when the item is sold. Due to system constraints and the nature of certain allowances, it is sometimes not practicable to apply allowances to the item cost of inventory. In those instances, the allowances are applied as a reduction of merchandise costs using a rational and systematic methodology, which results in the recognition of these incentives when the inventory related to the vendor consideration received is sold. Vendor allowances applied as a reduction of merchandise costs totaled $116.5 million, $116.6 million and $115.8 million for the fiscal years ended September 29, 2018, September 30, 2017 and September 24, 2016, respectively. Vendor advertising allowances that represent a
17
reimbursement of specific identifiable incremental costs of advertising the vendor’s specific products are recorded as a reduction to the related expense in the period that the related expense is incurred. Vendor advertising allowances recorded as a reduction of advertising expense totaled $14.1 million, $13.8 million, and $13.5 million for the fiscal years ended September 29, 2018, September 30, 2017 and September 24, 2016, respectively.
If vendor advertising allowances were substantially reduced or eliminated, the Company would likely consider other methods of advertising as well as the volume and frequency of the Company’s product advertising, which could increase or decrease the Company’s expenditures.
Similarly, the Company is not able to assess the impact of vendor advertising allowances on creating additional revenue, as such allowances do not directly generate revenue for the Company’s stores.
Results of Operations
Ingles operates on a 52- or 53-week fiscal year ending on the last Saturday in September. The consolidated statements of income for the fiscal years ended September 29, 2018, September 30, 2017 and September 24, 2016, consisted of 52, 53 and 52 weeks of operations, respectively.
Comparable store sales are defined as sales by grocery stores in operation for five full fiscal quarters. The Company has an ongoing renovation and expansion plan to modernize the appearance and layout of its existing stores. Sales from replacement stores, major remodels and the addition of fuel stations to existing stores are included in the comparable store sales calculation from the date of completion of the replacement, remodel or addition. A replacement store is a new store that is opened to replace an existing nearby store that is closed. A major remodel entails substantial remodeling of an existing store and may include additional retail square footage. For the fiscal years ended September 29, 2018 and September 30, 2017 comparable store sales include 196 and 197 stores, respectively. Weighted average retail square footage added to comparable stores due to replacement and remodeled stores was approximately 86,000 for the fiscal year ended September 29, 2018 and 36,000 for the fiscal year ended September 30, 2017.
The following table sets forth, for the periods indicated, selected financial information as a percentage of net sales.
|
|
|
|
|
|
|
||
|
|
Fiscal Year Ended September |
||||||
|
|
2018 |
|
2017 |
|
2016 |
||
|
Net sales |
100.0% |
|
100.0% |
|
100.0% | ||
|
Gross profit |
24.0 |
|
24.1 |
|
24.4 | ||
|
Operating and administrative expenses |
20.9 |
|
20.9 |
|
21.0 | ||
|
Gain from sale or disposal of assets |
— |
|
— |
|
— |
||
|
Income from operations |
3.1 |
|
3.2 |
|
3.4 | ||
|
Other income, net |
0.1 |
|
0.1 |
|
— |
||
|
Interest expense |
1.2 |
|
1.2 |
|
1.2 | ||
|
Income before income taxes |
2.0 |
|
2.1 |
|
2.2 | ||
|
Income tax (benefit) expense |
(0.4) |
|
0.8 |
|
0.8 | ||
|
Net income |
2.4 |
|
1.3 |
|
1.4 | ||
Fiscal Year Ended September 29, 2018 Compared to the Fiscal Year Ended September 30, 2017
There are two significant occurrences that will affect many of the comparisons between the fiscal years ended September 29, 2018 and September 30, 2017. First, fiscal year 2017 was a 53 week year, resulting generally in higher sales, operating expenses and operating income compared with the 52 weeks in fiscal year 2018. In addition, changes to Federal tax laws and the Company’s adoption of a different tax calculation method resulted in significant deferred tax benefits totaling $37.3 million in fiscal year 2018. The Company will cite these factors wherever they are relevant to the comparison of its results of operations for fiscal years 2018 with those of fiscal year 2017.
Net income for the fiscal year ended September 29, 2018 was $97.4 million, compared with net income of $53.9 million for the fiscal year ended September 30, 2017, primarily due to the positive impact of the fiscal year 2018 deferred tax benefits. Pretax income was $80.3 million for fiscal year 2018, compared with pretax income of $84.3 million for fiscal year 2017, a decrease primarily attributable to fiscal year 2017’s extra week.
Sales and gross margin increased in the retail segment, including increases in gasoline margins. Expenses increased primarily as a result of continued tight labor conditions in the Company’s market area. Fluid dairy income decreased due to decreased overall milk demand, and real estate income increased as the Company added tenants in existing shopping centers and in acquired shopping centers where the Company had previously leased a store.
18
Net Sales. Net sales for the fiscal year ended September 29, 2018 totaled $4.09 billion, compared with $4.00 billion for the fiscal year ended September 30, 2017.
Management analyzes comparable store sales for the 52 weeks of fiscal year 2018 with the corresponding 52 calendar weeks of fiscal year 2017. On this basis, retail comparable sales excluding gasoline increased 2.0% during fiscal 2018 compared with 2017. The number of transactions (excluding gasoline) increased 0.3% while the average transaction size (excluding gasoline) increased by 2.2%. Comparing fiscal 2018 with 2017 on a 52-week basis, gasoline gallons increased 2.3% and per gallon gasoline prices increased 19.1%.
Sales by product category for the fiscal years ended September 29, 2018 and September 30, 2017, respectively, were as follows:
|
|
|
|
|
|
|
|
|
|
|
Fiscal Year Ended September |
||||
|
|
|
(dollars in thousands) |
||||
|
|
|
2018 |
|
2017 |
||
|
Grocery |
|
$ |
1,413,088 |
|
$ |
1,424,891 |
|
Non-foods |
|
|
874,677 |
|
|
858,409 |
|
Perishables |
|
|
1,078,693 |
|
|
1,061,560 |
|
Gasoline |
|
|
604,897 |
|
|
515,857 |
|
Total retail grocery |
|
$ |
3,971,355 |
|
$ |
3,860,717 |
The grocery category includes grocery, dairy and frozen foods.
The non-foods category includes alcoholic beverages, tobacco, pharmacy, health and video.
The perishables category includes meat, produce, deli and bakery.
Changes in retail grocery sales for the fiscal year ended September 29, 2018 are summarized as follows (in thousands):
|
|
|
|
|
|
Total grocery sales for the fiscal year ended September 30, 2017 |
|
$ |
3,860,717 |
|
Comparable store sales increase |
|
|
153,703 |
|
Impact of stores closed in fiscal 2018 and 2017 |
|
|
(19,698) |
|
Sales growth stores opened fiscal 2018 and 2017 |
|
|
44,094 |
|
Effect of 53rd week in fiscal 2017 |
|
|
(71,883) |
|
Other |
|
|
4,422 |
|
Total retail grocery sales for the fiscal year ended September 29, 2018 |
|
$ |
3,971,355 |
Increased fiscal 2018 sales resulted from new and replacement store buildings, the introduction of new products and product presentation, especially in higher margin products, effective promotions and cost competitiveness. The Company increased its use of The Ingles Advantage Savings and Rewards Card (the “Ingles Advantage Card”) to increase net sales and comparable store sales through enhanced loyalty programs and special offers. Information obtained from holders of the Ingles Advantage Card also assists the Company in optimizing product offerings and promotions specific to customer shopping patterns.
The Company expects non-gasoline sales will be higher in the 2019 fiscal year compared with fiscal 2018. The Company anticipates adding new stores in fiscal 2019, expects to continue remodeling a significant number of existing stores, and plans to add more fuel stations and pharmacies. Fiscal 2019 sales growth will also be influenced by market fluctuations in the per gallon price of gasoline and milk, changes in commodity food prices, general labor- and distribution-influenced economic conditions and changing customer preferences for purchasing items sold by the Company.
Gross Profit. Gross profit for the 52 week fiscal year ended September 29, 2018 increased $16.6 million, or 1.7%, to $980.2 million compared with $963.6 million for the 53 week fiscal year ended September 30, 2017. As a percentage of sales, gross profit totaled 24.0% for the fiscal year ended September 29, 2018 and 24.1% for the fiscal year ended September 30, 2017.
Grocery segment gross profit as a percentage of total sales (excluding gasoline) increased 31 basis points in fiscal 2018 compared with fiscal 2017. The gross margin increase was primarily due to a favorable change in the mix of products sold, offset by a slightly lower dollar gross margin on gasoline sales.
In addition to the direct product cost, the cost of goods sold line item for the grocery segment includes inbound freight charges and the costs related to the Company’s distribution network.
Operating and Administrative Expenses. Operating and administrative expenses increased $19.0 million, or 2.3%, to $856.1 million for the 52 week fiscal year ended September 29, 2018, from $837.1 million for the 53 week fiscal year ended September 30, 2017. As a percentage of sales, operating and administrative expenses were 20.9% for both fiscal years 2018
19
and 2017. Excluding gasoline, which does not have significant direct operating expenses, the ratio of operating expenses to sales was 24.3% for fiscal 2018 compared with 23.8% for fiscal 2017.
A breakdown of the major increases in operating and administrative expenses is as follows. Dollar increases are for the 52 weeks of fiscal year 2018 compared with the 53 weeks of fiscal year 2017. On an equivalent week basis, the dollar increases would have been higher.
|
|
|
|
|
|
|
|
|
|
|
Increase |
||
|
|
Increase |
|
as a % of |
||
|
|
(in millions) |
|
sales |
||
|
Salaries and wages |
$ |
9.3 |
|
0.23 |
% |
|
Insurance |
$ |
3.8 |
|
0.09 |
% |
|
Depreciation and amortization |
$ |
3.1 |
|
0.08 |
% |
|
Utilities and fuel |
$ |
1.3 |
|
0.03 |
% |
|
Bank charges |
$ |
1.3 |
|
0.03 |
% |
Salaries and wages increased due to the addition of labor hours required for the increased sales volume and changes to the sales mix. In general the labor market in the Company’s market area has become more competitive.
Insurance expenses increased due to higher claims experienced under its self-insurance programs and increased market costs, including cost of the Affordable Care Act.
Depreciation and amortization increased as a result of the Company’s capital expenditures programs, including smaller remodeling projects that contain capital assets with shorter useful lives-compared with real restate.
Utilities and fuel increased due to increases in market energy costs and due to increases in store and shopping center square feet.
Bank charges have increased as more sales transactions are being settled with debit and credit cards, and the per transaction card costs have increased.
Gain from Sale or Disposal of Assets. Gains from sale or disposal of assets totaled $0.7 million for fiscal 2018 compared with gains of $1.5 million for fiscal 2017. There were no individually significant transactions during either fiscal year.
Other Income, Net. Other income, net totaled $3.1 million and $3.8 million for the fiscal years ended September 29, 2018 and September 30, 2017, respectively. Other income consists primarily of sales of waste paper and packaging.
Interest Expense. Interest expense was relatively unchanged at $47.6 million for the fiscal year ended September 29, 2018 and $47.4 million for the fiscal year ended September 30, 2017. Total debt was $865.6 million at the end of fiscal 2018 compared with $877.9 million at the end of fiscal 2017. Market interest rates increased during fiscal years 2017 and 2018, which affected interest expense on the Company’s floating rate debt. During late fiscal year 2017 and early fiscal year 2018, the Company renegotiated or refinanced some of its debt at lower base rates and entered into an interest rate swap to fix the interest on certain debt. These actions as well as a reduction in total debt reduced the impact of rising market interest rates.
Income Taxes. In December 2017, the Tax Cuts and Jobs Act (the “Tax Act”) became law. Among other things, the Tax Act reduced the federal corporate tax rate from 35% to 21% and allowed for full depreciation expensing of qualified property when placed in service.
As a result of the decrease in the effective tax rate, the Company recorded a decrease in its net deferred tax liabilities of $26.7 million, with a corresponding reduction to deferred income tax expense. During fiscal year 2018, the Company adopted a tax depreciation calculation method change that resulted in the accelerated deduction of certain property-related expenditures. As a result of this change and the aforementioned change in the federal corporate tax rate, the Company recorded an additional decrease in its net deferred tax liabilities of $10.6 million, with a corresponding reduction to deferred income tax expense.
Without the $37.3 million tax expense reductions, the Company’s effective tax rate would have been 25.2% for the fiscal year ended September 29, 2018 compared with 36.1% for the fiscal year ended September 30, 2017. This decrease is attributable to the aforementioned reduction in the federal corporate tax rate.
Net Income. Net income totaled $97.4 million for the fiscal year ended September 29, 2018 compared with net income of $53.9 million for the fiscal year ended September 30, 2017. Basic and diluted earnings per share for Class A Common Stock were $4.94 and $4.81, respectively, for the fiscal year ended September 29, 2018 compared with $2.74 and $2.66, respectively, for the fiscal year ended September 30, 2017. Basic and diluted earnings per share for Class B Common Stock
20
were each $4.49 for the fiscal year ended September 29, 2018 compared with $2.49 of basic and diluted earnings per share for the fiscal year ended September 30, 2017.
Fiscal Year Ended September 30, 2017 Compared to the Fiscal Year Ended September 24, 2016
Net income for the fiscal year ended September 30, 2017 was $53.9 million, compared with net income of $54.2 million for the fiscal year ended September 24, 2016. Comparisons of fiscal year 2017 to fiscal year 2016 are affected by the difference in the number of weeks in each year. Fiscal year 2017 contained 53 weeks while fiscal year 2016 consisted of 52 weeks. Fiscal year 2017 sales increased even after consideration of the additional week, but non-gasoline gross margin decreased slightly.
Labor continued to tighten in the Company’s market area in fiscal 2017, which contributed to increased operating expenses in total and as a percent of sales. During fiscal 2017 the Company’s capital expenditures for expansion and modernization of its store base continued to be higher than most of the previous few years, a trend that was begun in fiscal year 2016. This expansion also has an impact on ongoing operating costs for labor and equipment service.
Net Sales. Net sales for the fiscal year ended September 30, 2017 totaled $4.00 billion, compared with $3.79 billion for the fiscal year ended September 24, 2016.
In fiscal years with 53 weeks, such as fiscal 2017, management analyzes comparable store sales for the 53 weeks of the year with the corresponding 53 calendar weeks of the previous year. On this basis, retail comparable sales excluding gasoline increased 1.5% during fiscal 2017 compared with 2016 on a 53-week basis. The number of transactions (excluding gasoline) increased 0.8% while the average transaction size (excluding gasoline) increased by 1.1%. Comparing fiscal 2017 with 2016 on a 53-week basis, gasoline gallons increased 4.5% and per gallon gasoline prices increased 11.6%.
Sales by product category for the fiscal years ended September 30, 2017 and September 24, 2016, respectively, were as follows:
|
|
|
|
|
|
|
|
|
|
|
Fiscal Year Ended September |
||||
|
|
|
(dollars in thousands) |
||||
|
|
|
2017 |
|
2016 |
||
|
Grocery |
|
$ |
1,424,891 |
|
$ |
1,392,311 |
|
Non-foods |
|
|
858,409 |
|
|
817,161 |
|
Perishables |
|
|
1,061,560 |
|
|
1,011,749 |
|
Gasoline |
|
|
515,857 |
|
|
435,578 |
|
Total retail grocery |
|
$ |
3,860,717 |
|
$ |
3,656,799 |
The grocery category includes grocery, dairy and frozen foods.
The non-foods category includes alcoholic beverages, tobacco, pharmacy, and health/beauty/cosmetic products.
The perishables category includes meat, produce, deli and bakery.
Changes in retail grocery sales for the fiscal year ended September 30, 2017 are summarized as follows (in thousands):
|
|
|
|
|
|
Total grocery sales for the fiscal year ended September 24, 2016 |
|
$ |
3,656,799 |
|
Comparable store sales increase |
|
|
114,123 |
|
Impact of stores closed in fiscal 2017 and 2016 |
|
|
(14,725) |
|
Sales growth stores opened fiscal 2017 and 2016 |
|
|
36,740 |
|
Effect of 53rd week in fiscal 2017 |
|
|
71,883 |
|
Other |
|
|
(4,103) |
|
Total retail grocery sales for the fiscal year ended September 30, 2017 |
|
$ |
3,860,717 |
In addition to capital improvements to the store base, increased fiscal 2017 sales resulted from the introduction of new products, product presentation within the stores, effective promotions and cost competitiveness. The Ingles Advantage Savings and Rewards Card (the “Ingles Advantage Card”) also contributes to the increase in net sales and comparable store sales. Information obtained from holders of the Ingles Advantage Card assists the Company in optimizing product offerings and promotions specific to customer shopping patterns.
Gross Profit. Gross profit for the fiscal year ended September 30, 2017 increased $39.2 million, or 4.2%, to $963.6 million compared with $924.4 million for the fiscal year ended September 24, 2016. As a percentage of sales, gross profit totaled 24.1% for the fiscal year ended September 30, 2017 and 24.4% for the fiscal year ended September 24, 2016.
The increase in grocery segment gross profit dollars was primarily due to the higher sales volume and the impact of the 53rd week in fiscal 2017. Grocery segment gross profit as a percentage of total sales (excluding gasoline) decreased 8 basis points
21
in fiscal 2017 compared with fiscal 2016. The gross margin decrease was primarily due to competitive factors, which offset a favorable change in the mix of products sold.
In addition to the direct product cost, the cost of goods sold line item for the grocery segment includes inbound freight charges and the costs related to the Company’s distribution network.
Operating and Administrative Expenses. Operating and administrative expenses increased $42.5 million, or 5.4%, to $837.1 million for the fiscal year ended September 30, 2017, from $794.6 million for the fiscal year ended September 24, 2016. As a percentage of sales, operating and administrative expenses were 20.9% for fiscal year 2017 and 21.0% for fiscal year 2016. Excluding gasoline, which does not have significant direct operating expenses, the ratio of operating expenses to sales was 23.8% for fiscal 2017 compared with 23.5% for fiscal 2016.
A breakdown of the major increases in operating and administrative expenses is as follows:
|
|
|
|
|
|
|
|
|
|
|
Increase |
||
|
|
Increase |
|
as a % of |
||
|
|
(in millions) |
|
sales |
||
|
Salaries and wages |
$ |
27.4 |
|
0.68 |
% |
|
Depreciation and amortization |
$ |
4.5 |
|
0.11 |
% |
|
Repairs and maintenance |
$ |
4.1 |
|
0.10 |
% |
|
Bank charges |
$ |
3.0 |
|
0.08 |
% |
|
Taxes and licenses |
$ |
2.5 |
|
0.06 |
% |
Salaries and wages increased due to the addition of labor hours required for the increased sales volume and changes to the sales mix. In general the labor market in the Company’s market area has become more competitive.
Depreciation and amortization increased as a result of the Company’s capital expenditures programs, including smaller remodeling projects that contain capital assets with shorter useful lives-compared with real restate.
Repair and maintenance expenses increased due to increases in the amount and complexity of equipment in the Company’s stores to support new products offered, increase energy efficiency and to improve the customer shopping experience.
Bank charges have increased as more sales transactions are being settled with debit and credit cards, and the per transaction card costs have increased.
Taxes and licenses increased due to increases in the value of the Company’s real estate and for additional fees paid to municipalities to conduct business and offer certain products.
Loss or gain from Sale or Disposal of Assets. Gains from sale or disposal of assets totaled $1.5 million for fiscal 2017 compared with losses of $1.2 million for fiscal 2016. There were no individually significant gains during fiscal 2017. During fiscal 2016, the Company demolished certain buildings for redevelopment into larger and improved store or tenant space. None of these transactions were individually significant.
Other Income, Net. Other income, net totaled $3.8 million and $2.4 million for the fiscal years ended September 30, 2017 and September 24, 2016, respectively. Other income consists primarily of sales of waste paper and packaging.
Interest Expense. Interest expense increased $1.1 million for the fiscal year ended September 30, 2017 to $47.4 million from $46.3 million for the fiscal year ended September 24, 2016. Total debt was $877.9 million at the end of fiscal 2017 compared with $876.5 million at the end of fiscal 2016. Market interest rates increased during fiscal 2017, which affected interest expense on the Company’s floating rate debt. During the latter part of fiscal 2017, the Company renegotiated or refinanced some of its debt at lower base rates and more favorable terms.
Income Taxes. Income tax expense as a percentage of pre-tax income was 36.1% for the 2017 fiscal year compared with 36.0% for the 2016 fiscal year. There were no significant changes in major components of tax expense between fiscal years 2017 and 2016. Cash income taxes paid by the Company increased in fiscal 2017 compared with fiscal 2016 due to the reversal of taxes deferred in prior years.
Net Income. Net income totaled $53.9 million for the fiscal year ended September 30, 2017 compared with net income of $54.2 million for the fiscal year ended September 24, 2016. Basic and diluted earnings per share for Class A Common Stock were $2.74 and $2.66, respectively, for the fiscal year ended September 30, 2017 compared with $2.75 and $2.68, respectively, for the fiscal year ended September 24, 2016. Basic and diluted earnings per share for Class B Common Stock were each $2.49 for the fiscal year ended September 30, 2017 compared with $2.50 of basic and diluted earnings per share for the fiscal year ended September 24, 2016.
22
Liquidity and Capital Resources
Capital Expenditures
The Company believes that a key to its ability to continue to increase sales and develop a loyal customer base is providing conveniently located, clean and modern stores which provide customers with good service and an increasingly diverse selection of competitively priced products. As such, the Company has invested and will continue to invest significant amounts of capital toward the modernization of its store base. The Company’s modernization program includes the opening of new stores, the completion of major remodels and expansion of selected existing stores, and the relocation of selected existing stores to larger, more convenient locations. The Company also believes that the warehouse and distribution facility completed during fiscal 2012 has lowered its overall distribution costs and improved product availability in its stores.
Capital expenditures totaled $150.5 million and $127.7 million for fiscal 2018 and 2017, respectively. Major capital expenditures include the following:
|
|
|
|
|
|
|
|
|
|
|
|
|
|
|
2018 |
|
2017 |
|
New stores |
|
5 |
|
2 |
|
Store sites/land parcels purchased |
|
4 |
|
2 |
|
Fuel stations added |
|
5 |
|
4 |
(including those added at new or replacement stores)
During fiscal year 2018, the Company purchased three shopping centers which contained Ingles stores that had been leased from third party landlords.
Capital expenditures also included upgrading and replacing store equipment, technology investments, capital expenditures related to the Company’s distribution operation and its milk processing plant, and expenditures for stores to open in subsequent fiscal years.
Ingles’ capital expenditure plans for fiscal 2019 include investments of approximately $120 to $160 million. The majority of the Company’s fiscal 2019 capital expenditures will be dedicated to continued improvement of its store base and will include construction of one or more new/remodeled stores. Fiscal 2019 capital expenditures will also include investments in stores expected to open in fiscal 2020 as well as technology improvements, upgrading and replacing existing store equipment and warehouse and transportation equipment and improvements to the Company’s milk processing plant. The Company will also consider land acquisitions for future development and the purchase of shopping centers where the Company operates leased stores.
The Company expects that its net annual capital expenditures will be in the range of approximately $100 to $160 million going forward in order to maintain a modern store base. Planned expenditures for any given future fiscal year will be affected by the availability of financing, which can affect both the number of projects pursued at any given time and the cost of those projects. The number of projects may also fluctuate due to the varying costs of the types of projects pursued including new stores and major remodel/expansions. The Company makes decisions on the allocation of capital expenditure dollars based on many factors including the competitive environment, other Company capital initiatives and its financial condition.
In general, the Company finances its capital expenditures to the extent possible from cash on hand and cash flow from operations. Additional financing sources for capital expenditures include borrowings under the $175 million of committed line of credit, other borrowings that could be collateralized by unencumbered real property and equipment with a net book value of approximately $1.10 billion, and the public debt or equity markets. The Company has used each of these to finance past capital expenditures and expects to have them available in the future.
The Company does not generally enter into commitments for capital expenditures other than on a store-by-store basis at the time it begins construction on a new store or begins a major or minor remodeling project. Construction commitments at September 29, 2018 totaled $12.6 million.
Liquidity
The Company generated $161.2 million of cash from operations in fiscal 2018 compared with $156.3 million for fiscal 2017. Net income increased substantially, but much of the increase is from income tax benefits that will be received as cash in future periods.
23
Cash used by investing activities for fiscal 2018 totaled $148.1 million compared with $125.4 million for fiscal 2017. The Company’s most significant investing activity is capital expenditures. Comparing fiscal year 2018 with fiscal year 2017, the Company invested a greater amount in new buildings and shopping center purchases.
During fiscal 2018, the Company’s net financing activities of $26.5 million consisted primarily of Dividends and debt repayment. During fiscal 2017, the Company’s net financing activities of $12.7 million consisted primarily of dividends.
In June 2013, the Company issued $700.0 million aggregate principal amount of senior notes due in 2023 (the “Notes”). The Notes bear an interest rate of 5.75% per annum and were issued at par.
The Company has a $175.0 million line of credit (the “Line”) that matures in September 2022. The Line provides the Company with various interest rate options based on the prime rate, the Federal Funds Rate, or the London Interbank Offering Rate. The Line allows the Company to issue up to $20.0 million in unused letters of credit, of which $9.4 million of unused letters of credit were issued at September 29, 2018. The Company is not required to maintain compensating balances in connection with the Line. At September 29, 2018, the Company had no borrowing outstanding under the Line.
On December 29, 2010, the Company completed the funding of $99.7 million of Recovery Zone Facility Bonds (the “Bonds”) for construction and equipping of an approximately 830,000 square foot new warehouse and distribution center located in Buncombe County, North Carolina (the “Project”). The final maturity date of the Bonds is January 1, 2036.
Under a Continuing Covenant and Collateral Agency Agreement (the “Covenant Agreement”) between certain financial institutions and the Company, the financial institutions would hold the Bonds until June 2021, subject to certain events. Mandatory redemption of the Bonds by the Company in the annual amount of $4,530,000 began on January 1, 2014. During fiscal year 2018, the Covenant Agreement was amended to change certain terms and to extend the maturity to September 2026. The Company may redeem the Bonds without penalty or premium at any time prior to September 26, 2026.
On December 19, 2017, the Company entered into an interest rate swap agreement for a notional amount of $58.5 million at a fixed rate of 3.92%. Under this agreement, the Company pays monthly the fixed rate of 3.92% and receives the one-month LIBOR plus 1.65%. The interest rate swap effectively hedges $60 million of floating rate debt closed by the Company in September 2017. Both the floating rate debt and the interest rate swap have monthly principal amortization of $0.5 million and mature October 1, 2027. The fair market value of the interest rate swap is measured quarterly, with adjustments, if significant, recorded in other comprehensive income. The fair market value of the interest rate swap at September 29, 2018 was not significant.
The Company’s long-term debt agreements generally have cross-default provisions which could result in the acceleration of payments due under the Company’s Line, Bond and Notes indenture in the event of default under any one instrument.
The Notes, the Bonds and the Line contain provisions that under certain circumstances would permit lending institutions to terminate or withdraw their respective extensions of credit to the Company. Included among the triggering factors permitting the termination or withdrawal of the Line to the Company are certain events of default, including both monetary and non-monetary defaults, the initiation of bankruptcy or insolvency proceedings, and the failure of the Company to meet certain financial covenants designated in its respective loan documents. As of September 29, 2018, the Company was in compliance with these covenants by a significant margin. Under the most restrictive of these covenants, the Company would be able to incur approximately $416 million of additional borrowings (including borrowings under the Line) as of September 29, 2018.
The Company’s principal sources of liquidity are expected to be cash flow from operations, borrowings under the Line and long-term financing. The Company believes, based on its current results of operations and financial condition, that its financial resources, including cash balances, the existing Line, short- and long-term financing expected to be available to it and internally generated funds, will be sufficient to meet planned capital expenditures and working capital requirements for the foreseeable future, including any debt service requirements of additional borrowings. However, there can be no assurance that any such sources of financing will be available to the Company on acceptable terms, or at all.
It is possible that, in the future, the Company’s results of operations and financial condition will be different from that described in this report based on a number of intangible factors. These factors may include, among others, increased competition, changing regional and national economic conditions, adverse climatic conditions affecting food production and delivery and changing demographics as well as the additional factors discussed above and elsewhere under “Item 1A. Risk Factors.” It is also possible, for such reasons, that the results of operations from the new, expanded, remodeled and/or replacement stores will not meet or exceed the results of operations from existing stores that are described in this report.
24
Contractual Obligations and Commercial Commitments
The Company has assumed various financial obligations and commitments in the normal course of its operations and financing activities. Financial obligations are considered to represent known future cash payments that the Company is required to make under existing contractual arrangements, such as debt and lease arrangements. The following table represents the scheduled maturities of the Company’s long-term contractual obligations as of September 29, 2018:
Payment Due by Period
|
|
|
|
|
|
|
|
|
|
|
|
|
|
|
|
|
|
Contractual Obligations |
|
|
|
|
Less than |
|
|
|
|
|
|
|
More than |
||
|
(amounts in thousands) |
|
Total |
|
1 year |
|
1-3 years |
|
3-5 years |
|
5 years |
|||||
|
Long-term debt and line of credit |
|
$ |
865,588 |
|
$ |
12,848 |
|
$ |
26,219 |
|
$ |
727,445 |
|
$ |
99,076 |
|
Scheduled interest on long-term debt (1) |
|
|
234,818 |
|
|
46,305 |
|
|
91,013 |
|
|
88,771 |
|
|
8,729 |
|
Advance payments on purchase contracts |
|
|
3,115 |
|
|
1,116 |
|
|
870 |
|
|
470 |
|
|
659 |
|
Operating leases (2) |
|
|
60,396 |
|
|
10,286 |
|
|
16,170 |
|
|
10,628 |
|
|
23,312 |
|
Construction commitments |
|
|
12,611 |
|
|
12,611 |
|
|
— |
|
|
— |
|
|
— |
|
Total |
|
$ |
1,176,528 |
|
$ |
83,166 |
|
$ |
134,272 |
|
$ |
827,314 |
|
$ |
131,776 |
(1) Scheduled interest on floating rate debt calculated using rates in effect on September 29, 2018.
(2) Operating lease obligations in the above table do not include common area maintenance, insurance, utility and tax payments for which the Company is obligated under certain operating leases. These amounts are not significant compared with the operating lease payments listed in the above table.
The Company has entered supply contracts to provide approximately 70% of the fuel sold in its fuel centers. Pricing is based on certain market indices at the time of purchase. The suppliers can modify or terminate the contracts if the Company does not meet certain minimum monthly purchase requirements.
Amounts available to the Company under commercial commitments as of September 29, 2018, were as follows:
Amount of Commitment Expiration per Period
|
|
|
|
|
|
|
|
|
|
|
|
|
|
|
|
|
|
Other Commercial Commitments |
|
|
|
|
Less than |
|
|
|
|
|
|
|
More than |
||
|
(amounts in thousands) |
|
Total |
|
1 year |
|
1-3 years |
|
3-5 years |
|
5 years |
|||||
|
Available line of credit |
|
$ |
165,608 |
|
$ |
— |
|
$ |
— |
|
$ |
165,608 |
|
$ |
— |
|
Letters of credit-standby |
|
|
9,392 |
|
|
9,392 |
|
|
— |
|
|
— |
|
|
— |
|
Potential commercial commitments |
|
$ |
175,000 |
|
$ |
9,392 |
|
$ |
— |
|
$ |
165,608 |
|
$ |
— |
Off Balance Sheet Arrangements
The Company is not a party to any off-balance sheet arrangements that have, or are reasonably likely to have, a current or future material effect on the Company’s financial condition, revenues, expenses, results of operations, liquidity, capital expenditures or capital resources.
Quarterly Cash Dividends
Since December 27, 1993, the Company has paid regular quarterly cash dividends of $0.165 per share on its Class A Common Stock and $0.15 per share on its Class B Common Stock for an annual rate of $0.66 and $0.60 per share, respectively.
The Company expects to continue paying regular cash dividends on a quarterly basis. However, the Board of Directors periodically reconsiders the declaration of dividends. The Company pays these dividends at the discretion of the Board of Directors and the continuation of these payments, the amount of such dividends, and the form in which the dividends are paid (cash or stock) depends upon the results of operations, the financial condition of the Company and other factors which the Board of Directors deems relevant.
Long-term debt and line of credit agreements contain various restrictive covenants requiring, among other things, minimum levels of net worth and maintenance of certain financial ratios. These covenants have the effect of restricting certain types of transactions, including the payment of cash dividends generally and in excess of current quarterly per share amounts. Further, the Company is prevented from declaring dividends at any time that it is in default under the indenture governing the Notes.
25
Impact of Inflation
The following table from the United States Bureau of Labor Statistics lists annualized changes in the Consumer Price Index that could have an effect on the Company’s operations. One of the Company’s significant costs is labor, which increases with general inflation. Inflation or deflation in energy costs affects the Company’s gasoline sales, distribution expenses and plastic supply costs.
|
|
|
|
|
|
|
|
|
|
|
Twelve Months Ended |
||||
|
|
|
September 29, |
|
September 30, |
||
|
|
|
2018 |
|
2017 |
||
|
All items |
|
2.3 |
% |
|
2.2 |
% |
|
Food and beverages |
|
1.4 |
% |
|
1.2 |
% |
|
Energy |
|
4.8 |
% |
|
10.1 |
% |
New Accounting Pronouncements
For new accounting pronouncements, see Note 1 to the Consolidated Financial Statements included in this Annual Report on Form 10-K.
Outlook and Trends in the Company’s Markets
The Company has improved the interior layout and product offerings in a significant number of stores over the past three fiscal years. Economic conditions have improved to the point that the Company has accelerated the increase and improvement of its total retail square footage.
The Company continually assesses and modifies its business model to meet the changing needs and expectations of its customers. In connection with this review, the Company assesses the trends present in the markets in which it competes. Generally, it is difficult to predict whether a trend will continue for a period of time and it is possible that new trends will develop which will affect an existing trend. The Company believes that the following trends are likely to continue for at least the next fiscal year:
|
· |
The supermarket industry will remain highly competitive and will be characterized by industry consolidation, fragmented food retail platforms, and continued competition from super centers and other non-supermarket operators. |
|
· |
Traditional supermarket products will be acquired by customers in new and diverse ways, including online ordering, home delivery and pre-picked for customer pickup. |
|
· |
Economic conditions will continue to affect customer behavior. Economic conditions may affect purchasing patterns with regard to meal replacement items, private label purchases, promotions and product variety. |
|
· |
The Company and its customers will continue to become more environmentally aware, evidenced by the Company’s increased recycled waste paper and pallets and customers’ increased usage of reusable shopping bags. |
|
· |
Volatile petroleum costs will impact utility and distribution costs, plastic supplies cost and may change customer shopping and dining behavior. |
|
· |
Retail gasoline costs and retail prices will continue to be volatile, affecting the Company’s gasoline sales and gross margin. |
The Company plans to continue to focus on balancing sales growth and gross margin maintenance (excluding the effect of gasoline sales), and will carefully monitor its product mix and customer trends.
Item 7A. QUANTITATIVE AND QUALITATIVE DISCLOSURES ABOUT MARKET RISKS
The Company is exposed to changes in interest rates primarily as a result of its borrowing activities, which include borrowings under the line of credit, real estate and equipment financing, the Company’s 5.75% Senior Notes due 2023 and the Recovery Zone bonds. The line of credit, along with cash flow from operations, is used to maintain liquidity and fund business operations. The Company typically replaces borrowings under its variable rate line of credit, as necessary, with both long-term secured and unsecured financing.
26
The nature and amount of the Company’s debt may vary as a result of future business requirements, market conditions and other factors. The definitive extent of the Company’s interest rate risk is not quantifiable or predictable because of the variability of future interest rates and business financing requirements, but the Company does not believe such risk is material. The Company may consider the use of derivative instruments (such as the interest swap commenced in December, 2017) to adjust the Company’s interest rate risk profile.
The table below presents principal amounts and related weighted average rates by year of maturity for the Company’s debt obligations at September 29, 2018 and September 30, 2017, respectively (in thousands):
|
|
|
|
|
|
|
|
|
|
|
|
|
|
|
|
|
|
|
|
|
|
|
|
|
|
|
|
|
|
|
|
|
|
|
|
|
|
|
|
|
|
|
|
|
|
|
|
|
|
|
|
|
|
|
|
|
|
|
|
|
|
|
|
|
|
|
September 29, 2018 |
|
2019 |
|
|
2020 |
|
|
2021 |
|
|
2022 |
|
|
2023 |
|
|
Thereafter |
|
|
Total |
|
|
Fair Value |
||||||||
|
Line of credit |
|
$ |
— |
|
|
$ |
— |
|
|
$ |
— |
|
|
$ |
— |
|
|
$ |
— |
|
|
$ |
— |
|
|
$ |
— |
|
|
$ |
— |
|
Average variable interest rate |
|
|
— |
% |
|
|
— |
% |
|
|
— |
% |
|
|
— |
% |
|
|
— |
% |
|
|
— |
% |
|
|
— |
% |
|
|
|
|
Long-term debt, variable interest rate (1) |
|
$ |
7,688 |
|
|
$ |
7,761 |
|
|
$ |
7,840 |
|
|
$ |
7,921 |
|
|
$ |
8,005 |
|
|
$ |
33,239 |
|
|
$ |
72,454 |
|
|
$ |
72,454 |
|
Average year-end interest rate (1) |
|
|
3.80 |
% |
|
|
3.80 |
% |
|
|
3.80 |
% |
|
|
3.80 |
% |
|
|
3.81 |
% |
|
|
3.81 |
% |
|
|
3.80 |
% |
|
|
|
|
Long-term debt, fixed interest rate |
|
$ |
1,912 |
|
|
$ |
1,996 |
|
|
$ |
2,083 |
|
|
$ |
2,174 |
|
|
$ |
2,270 |
|
|
$ |
11,647 |
|
|
$ |
22,082 |
|
|
$ |
22,082 |
|
Average interest rate |
|
|
4.29 |
% |
|
|
4.29 |
% |
|
|
4.29 |
% |
|
|
4.29 |
% |
|
|
4.29 |
% |
|
|
4.29 |
% |
|
|
4.29 |
% |
|
|
|
|
Recovery Zone Bonds, variable interest rate |
|
$ |
4,530 |
|
|
$ |
4,530 |
|
|
$ |
4,530 |
|
|
$ |
4,530 |
|
|
$ |
4,530 |
|
|
$ |
54,440 |
|
|
$ |
77,090 |
|
|
$ |
77,090 |
|
Average year-end interest rate |
|
|
3.37 |
% |
|
|
3.37 |
% |
|
|
3.37 |
% |
|
|
3.37 |
% |
|
|
3.37 |
% |
|
|
3.37 |
% |
|
|
3.37 |
% |
|
|
|
|
Senior Notes, fixed interest rate |
|
$ |
— |
|
|
$ |
— |
|
|
$ |
— |
|
|
$ |
— |
|
|
$ |
700,000 |
|
|
$ |
— |
|
|
$ |
700,000 |
|
|
$ |
710,500 |
|
Average interest rate |
|
|
— |
% |
|
|
— |
% |
|
|
— |
% |
|
|
— |
% |
|
|
5.75 |
% |
|
|
— |
% |
|
|
5.75 |
% |
|
|
|
|
|
|
|
|
|
|
|
|
|
|
|
|
|
|
|
|
|
|
|
|
|
|
|
|
|
|
|
|
|
|
|
|
|
September 30, 2017 |
|
2018 |
|
|
2019 |
|
|
2020 |
|
|
2021 |
|
|
2022 |
|
|
Thereafter |
|
|
Total |
|
|
Fair Value |
||||||||
|
Line of credit |
|
$ |
— |
|
|
$ |
— |
|
|
$ |
— |
|
|
$ |
— |
|
|
$ |
— |
|
|
$ |
— |
|
|
$ |
— |
|
|
$ |
— |
|
Average year-end variable interest rate |
|
|
— |
% |
|
|
— |
% |
|
|
— |
% |
|
|
— |
% |
|
|
— |
% |
|
|
— |
% |
|
|
— |
% |
|
|
|
|
Long-term debt, variable interest rate |
|
$ |
7,117 |
|
|
$ |
7,688 |
|
|
$ |
7,761 |
|
|
$ |
7,840 |
|
|
$ |
7,921 |
|
|
$ |
41,244 |
|
|
$ |
79,571 |
|
|
$ |
79,571 |
|
Average year-end interest rate |
|
|
2.93 |
% |
|
|
2.92 |
% |
|
|
2.93 |
% |
|
|
2.93 |
% |
|
|
2.93 |
% |
|
|
2.93 |
% |
|
|
2.93 |
% |
|
|
|
|
Long-term debt, fixed interest rate |
|
$ |
1,832 |
|
|
$ |
1,912 |
|
|
$ |
1,996 |
|
|
$ |
2,083 |
|
|
$ |
2,174 |
|
|
$ |
13,903 |
|
|
$ |
23,900 |
|
|
$ |
23,900 |
|
Average interest rate |
|
|
4.29 |
% |
|
|
4.29 |
% |
|
|
4.29 |
% |
|
|
4.29 |
% |
|
|
4.29 |
% |
|
|
4.29 |
% |
|
|
4.29 |
% |
|
|
|
|
Recovery Zone Bonds, variable interest rate |
|
$ |
4,530 |
|
|
$ |
4,530 |
|
|
$ |
4,530 |
|
|
$ |
68,030 |
|
|
$ |
— |
|
|
$ |
— |
|
|
$ |
81,620 |
|
|
$ |
81,620 |
|
Average year-end interest rate |
|
|
2.61 |
% |
|
|
2.61 |
% |
|
|
2.61 |
% |
|
|
2.61 |
% |
|
|
— |
% |
|
|
— |
% |
|
|
2.61 |
% |
|
|
|
|
Senior Notes, fixed interest rate |
|
$ |
— |
|
|
$ |
— |
|
|
$ |
— |
|
|
$ |
— |
|
|
$ |
— |
|
|
$ |
700,000 |
|
|
$ |
700,000 |
|
|
$ |
682,500 |
|
Average interest rate |
|
|
— |
% |
|
|
— |
% |
|
|
— |
% |
|
|
— |
% |
|
|
— |
% |
|
|
5.75 |
% |
|
|
5.75 |
% |
|
|
|
(1) Excludes interest rate swap that fixes at 3.92% the interest rate on $54.5 million of variable interest rate debt.
The Company will occasionally utilize financial or derivative instruments for interest rate risk management, but has typically not utilized highly leveraged financial instruments. On the basis of the fair value of the Company’s market sensitive instruments at September 29, 2018, the Company does not consider the potential near-term losses in future earnings, fair values and cash flows from reasonable possible near-term changes in interest rates and exchange rates to be material.
Item 8. FINANCIAL STATEMENTS AND SUPPLEMENTARY DATA
The Company’s financial statements required by this item are set forth as a separate section of this Annual Report on Form 10-K. See Part IV, Item 15 of this Annual Report on Form 10-K.
27
Item 9A. CONTROLS AND PROCEDURES
Conclusion Regarding Disclosure Controls and Procedures
The Company maintains disclosure controls and procedures designed to provide reasonable assurance to achieve the objective that information in its Exchange Act reports is recorded, processed, summarized and reported within the time periods specified and pursuant to the regulations of the Securities and Exchange Commission. Disclosure controls and procedures, as defined in Rule 13a-15(e) and 15d-15(e) under the Exchange Act, include controls and procedures designed to ensure the information required to be disclosed by the Company in the reports it files or submits under the Exchange Act is accumulated and communicated to the Company’s management, including its Chief Executive Officer and Chief Financial Officer, as appropriate, to allow timely decisions regarding required disclosure. It should be noted that the Company’s system of controls and procedures, however well designed and operated, can provide only reasonable, and not absolute, assurance that the objectives of the system are met.
As required by Rule 13a-15(b) under the Exchange Act, the Company carried out an evaluation, under the supervision and with participation of its management, including its Chief Executive Officer and Chief Financial Officer, of the effectiveness of the design and operation of its disclosure controls and procedures as of September 29, 2018, the end of the period covered by this report.
Based on this evaluation, the Company’s Chief Executive Officer and Chief Financial Officer have concluded that our disclosure controls and procedures were effective at a reasonable level as of September 29, 2018.
Management’s Annual Report on Internal Control Over Financial Reporting
Management is responsible for establishing and maintaining adequate internal control over financial reporting, as defined in Exchange Act Rule 13a-15(f). Internal control over financial reporting is designed to provide reasonable assurance regarding the reliability of financial reporting and preparation of financial statements for external purposes in accordance with U.S. generally accepted accounting principles. The Company’s internal control over financial reporting includes those policies and procedures that:
|
|
(i) |
pertain to the maintenance of records that, in a reasonable detail, accurately and fairly reflect the transactions and dispositions of the Company’s assets; |
|
|
||
|
|
(ii) |
provide reasonable assurance that transactions are recorded as necessary to permit preparation of financial statements in accordance with generally accepted accounting principles, and that receipts and expenditures of the Company are being made only in accordance with authorizations of the Company’s management and directors; and |
|
|
||
|
|
(iii) |
provide reasonable assurance regarding prevention or timely detection of unauthorized acquisitions, use or disposition of the Company’s assets that could have a material adverse effect on the financial statements. |
Because of its inherent limitations, internal control over financial reporting may not prevent or detect misstatements. Also, projections of any evaluation of effectiveness to future periods are subject to the risk that controls may become inadequate because of changes in conditions, or that the degree of compliance with the policies or procedures may deteriorate.
The Company has assessed the effectiveness of its internal control over financial reporting as of September 29, 2018 using the criteria described in Internal Control – Integrated Framework (2013) issued by the Committee of Sponsoring Organizations of the Treadway Commission (COSO).
Based on its assessment of the design and related testing of the Company’s internal control over financial reporting management has concluded that, as of September 29, 2018, the Company maintained effective internal control over financial reporting based on the criteria set forth in the COSO framework.
The Company’s independent auditors, Deloitte & Touche LLP, a registered public accounting firm, are appointed by the Audit Committee of the Company’s Board of Directors. Deloitte & Touche LLP has audited and reported on the consolidated financial statements of the Company and the Company’s internal control over financial reporting. The reports of the independent auditors are contained in this Annual Report.
28
Changes in Internal Control Over Financial Reporting
There has been no change during the Company’s fiscal year ended September 29, 2018 in the Company’s internal control over financial reporting that was identified in connection with the evaluation required by Exchange Act Rule 13a-15(d) which has materially affected, or is reasonably likely to materially affect, the Company’s internal control over financial reporting.
As noted above, management has concluded that the Company’s disclosure controls and procedures were effective as of September 29, 2018.
Item 9B. OTHER INFORMATION
None.
PART III
Item 10. DIRECTORS, EXECUTIVE OFFICERS AND CORPORATE GOVERNANCE
The information required by this Item, including the information concerning the Company’s directors and officers, audit committee, and compliance with Section 16 of the Exchange Act, is incorporated herein by reference to the information to be contained in the Company’s definitive Proxy Statement to be used in connection with the solicitation of proxies for the Company's 2019 annual meeting of stockholders. The definitive Proxy Statement will be filed with the Securities and Exchange Commission (the “Commission”) pursuant to Regulation 14A no later than 120 days after September 29, 2018.
The Company has adopted a Code of Ethics that applies to its senior financial officers, including without limitation, its Chief Executive Officer, Chief Financial Officer and Controller. The full text of the Code of Ethics is published on the Company’s website at www.ingles-markets.com under the caption “Corporate Information.” In the event that the Company makes any amendments to, or grants any waivers of, a provision of the Code of Ethics applicable to its principal executive officer, principal financial officer or principal accounting officer, the Company intends to disclose such amendment or waiver on its website. Information on the Company’s website, however, does not form a part of this Annual Report on Form 10-K.
Item 11. EXECUTIVE COMPENSATION
The information required by this Item is incorporated herein by reference to the information to be contained in the Company’s definitive Proxy Statement referred to above in “Item 10. Directors, Executive Officers and Corporate Governance.”
Item 12. SECURITY OWNERSHIP OF CERTAIN BENEFICIAL OWNERS AND MANAGEMENT AND RELATED STOCKHOLDER MATTERS
The information required by this Item is incorporated herein by reference to the information to be contained in the definitive Proxy Statement referred to above in “Item 10. Directors, Executive Officers and Corporate Governance.”
Item 13. CERTAIN RELATIONSHIPS AND RELATED TRANSACTIONS, AND DIRECTOR INDEPENDENCE
The information required by this Item is incorporated herein by reference to the information to be contained in the definitive Proxy Statement referred to above in “Item 10. Directors, Executive Officers and Corporate Governance.”
Item 14. PRINCIPAL ACCOUNTANT FEES AND SERVICES
The information required by this Item is incorporated herein by reference to the information to be contained in the definitive Proxy Statement referred to above in “Item 10. Directors, Executive Officers and Corporate Governance.”
29
PART IV
Item 15. EXHIBITS AND FINANCIAL STATEMENT SCHEDULES
(a)Documents filed as part of this report:
1. The following financial statements of the Registrant are included in response to Item 8 of this Annual Report on Form 10-K:
|
|
Consolidated Balance Sheets as of September 29, 2018 and September 30, 2017; |
|
|
|
|
|
Consolidated Statements of Income for the years ended September 29, 2018, September 30, 2017, and September 24, 2016; |
|
|
|
|
|
Consolidated Statements of Changes in Stockholders’ Equity for the years ended September 29, 2018, September 30, 2017, and September 24, 2016; |
|
|
|
|
|
Consolidated Statements of Cash Flows for the years ended September 29, 2018, September 30, 2017, and September 24, 2016; |
|
|
|
|
|
Notes to Consolidated Financial Statements. |
2. Financial statement schedules:
|
|
Schedule II – Supplemental schedule of valuation and qualifying accounts. |
3. Exhibits
(b)Exhibits:
|
3.1 |
Articles of Incorporation of Ingles Markets, Incorporated (included as Exhibit 3.1 to Ingles Markets, Incorporated’s Registration Statement on Form S-1, File No. 33-23919, previously filed with the Commission and incorporated herein by this reference). (Filed on paper – hyperlink is not required pursuant to Rule 105 of Regulation S-T.) |
|
4.1 |
Articles 4 and 9 of the Articles of Incorporation of Ingles Markets, Incorporated (included as Exhibit 3.1 to Ingles Markets, Incorporated’s Registration Statement on Form S-1, File No. 33-23919, (filed on paper – hyperlink is not required pursuant to Rule 105 of Regulation S-T) and Exhibit 3.3 to Ingles Markets, Incorporated’s Annual Report on Form 10-K for the fiscal year ended September 25, 2004, File No. 0-14706, respectively, each of which were previously filed with the Commission and are incorporated herein by this reference). |
|
|
(Management contract or compensatory plan or arrangement required to be filed as an exhibit to this Annual Report on Form 10-K pursuant to Item 15(b) of Form 10-K.) |
|
|
(Management contract or compensatory plan or arrangement required to be filed as an exhibit to this Annual Report on Form 10-K pursuant to Item 15(b) of Form 10-K.) |
|
|
(Management contract or compensatory plan or arrangement required to be filed as an exhibit to this Annual Report on Form 10-K pursuant to Item 15(b) of Form 10-K.) |
|
|
(Management contract or compensatory plan or arrangement required to be filed as an exhibit to this Annual Report on Form 10-K pursuant to Item 15(b) of Form 10-K.) |
|
|
(Management contract or compensatory plan or arrangement required to be filed as an exhibit to this Annual Report on Form 10-K pursuant to Item 15(b) of Form 10-K.) |
32
|
|
(Management contract or compensatory plan or arrangement required to be filed as an exhibit to this Annual Report on Form 10-K pursuant to Item 15(b) of Form 10-K.) |
|
|
(Management contract or compensatory plan or arrangement required to be filed as an exhibit to this Annual Report on Form 10-K pursuant to Item 15(b) of Form 10-K.) |
|
|
(Management contract or compensatory plan or arrangement required to be filed as an exhibit to this Annual Report on Form 10-K pursuant to Item 15(b) of Form 10-K.) |
|
|
(Management contract or compensatory plan or arrangement required to be filed as an exhibit to this Annual Report on Form 10-K pursuant to Item 15(b) of Form 10-K.) |
|
31.1* |
Certification of Chief Executive Officer Pursuant to Section 302 of Sarbanes-Oxley Act of 2002. |
|
31.2* |
Certification of Chief Financial Officer Pursuant to Section 302 of Sarbanes-Oxley Act of 2002. |
|
32.1* |
Certification by Chief Executive Officer Pursuant to Section 906 of Sarbanes-Oxley Act of 2002. |
|
32.2* |
Certification by Chief Financial Officer Pursuant to Section 906 of Sarbanes-Oxley Act of 2002. |
|
101* |
The following financial information from the Annual Report on Form 10-K for the fiscal year ended September 29, 2018, formatted in XBRL (Extensible Business Reporting Language) and furnished electronically herewith: (i) the Consolidated Statements of Income; (ii) the Consolidated Balance Sheets; (iii) the Consolidated Statements of Cash Flows; (iv) the Consolidated Statements of Changes in Stockholders’ Equity; and (v) the Notes to the Consolidated Financial Statements. |
* Filed herewith.
33
REPORT OF INDEPENDENT REGISTERED PUBLIC ACCOUNTING FIRM
To the stockholders and the Board of Directors of Ingles Markets, Incorporated
Opinion on the Financial Statement
We have audited the accompanying consolidated balance sheets of Ingles Markets, Incorporated and subsidiaries (the "Company") as of September 29, 2018 and September 30, 2017, the related consolidated statements of income, changes in stockholders’ equity, and cash flows for each of the three years in the period ended September 29, 2018 and the related notes and the schedule listed in the Index at Item 15 (a) (collectively referred to as the "financial statements"). In our opinion, the financial statements present fairly, in all material respects, the financial position of the Company as of September 29, 2018 and September 30, 2017, and the results of its operations and its cash flows for each of the three years in the period ended September 29, 2018, in conformity with accounting principles generally accepted in the United States of America.
We have also audited, in accordance with the standards of the Public Company Accounting Oversight Board (United States) (PCAOB), the Company's internal control over financial reporting as of September 29, 2018, based on criteria established in Internal Control — Integrated Framework (2013) issued by the Committee of Sponsoring Organizations of the Treadway Commission and our report dated December 7, 2018, expressed an unqualified opinion on the Company's internal control over financial reporting.
Basis for Opinion
These financial statements are the responsibility of the Company's management. Our responsibility is to express an opinion on the Company's financial statements based on our audits. We are a public accounting firm registered with the PCAOB and are required to be independent with respect to the Company in accordance with the U.S. federal securities laws and the applicable rules and regulations of the Securities and Exchange Commission and the PCAOB.
We conducted our audits in accordance with the standards of the PCAOB. Those standards require that we plan and perform the audit to obtain reasonable assurance about whether the financial statements are free of material misstatement, whether due to error or fraud. Our audits included performing procedures to assess the risks of material misstatement of the financial statements, whether due to error or fraud, and performing procedures that respond to those risks. Such procedures included examining, on a test basis, evidence regarding the amounts and disclosures in the financial statements. Our audits also included evaluating the accounting principles used and significant estimates made by management, as well as evaluating the overall presentation of the financial statements. We believe that our audits provide a reasonable basis for our opinion.
/s/ DELOITTE & TOUCHE LLP
Atlanta, Georgia
December 7, 2018
We have served as the Company's auditor since 2012.
34
REPORT OF INDEPENDENT REGISTERED PUBLIC ACCOUNTING FIRM
To the stockholders and the Board of Directors of Ingles Markets, Incorporated
Opinion on Internal Control over Financial Reporting
We have audited the internal control over financial reporting of Ingles Markets, Incorporated and subsidiaries (the “Company”) as of September 29, 2018, based on criteria established in Internal Control — Integrated Framework (2013) issued by the Committee of Sponsoring Organizations of the Treadway Commission (COSO). In our opinion, the Company maintained, in all material respects, effective internal control over financial reporting as of September 29, 2018, based on criteria established in Internal Control — Integrated Framework (2013) issued by COSO.
We have also audited, in accordance with the standards of the Public Company Accounting Oversight Board (United States) (PCAOB) the consolidated financial statements as of and for the year ended September 29, 2018, of the Company and our report dated December 7, 2018, expressed an unqualified opinion on those financial statements.
Basis for Opinion
The Company’s management is responsible for maintaining effective internal control over financial reporting and for its assessment of the effectiveness of internal control over financial reporting, included in the accompanying Management’s Annual Report on Internal Control Over Financial Reporting. Our responsibility is to express an opinion on the Company’s internal control over financial reporting based on our audit. We are a public accounting firm registered with the PCAOB and are required to be independent with respect to the Company in accordance with the U.S. federal securities laws and the applicable rules and regulations of the Securities and Exchange Commission and the PCAOB.
We conducted our audit in accordance with the standards of the PCAOB. Those standards require that we plan and perform the audit to obtain reasonable assurance about whether effective internal control over financial reporting was maintained in all material respects. Our audit included obtaining an understanding of internal control over financial reporting, assessing the risk that a material weakness exists, testing and evaluating the design and operating effectiveness of internal control based on the assessed risk, and performing such other procedures as we considered necessary in the circumstances. We believe that our audit provides a reasonable basis for our opinion.
Definition and Limitations of Internal Control over Financial Reporting
A company’s internal control over financial reporting is a process designed to provide reasonable assurance regarding the reliability of financial reporting and the preparation of financial statements for external purposes in accordance with generally accepted accounting principles. A company’s internal control over financial reporting includes those policies and procedures that (1) pertain to the maintenance of records that, in reasonable detail, accurately and fairly reflect the transactions and dispositions of the assets of the company; (2) provide reasonable assurance that transactions are recorded as necessary to permit preparation of financial statements in accordance with generally accepted accounting principles, and that receipts and expenditures of the company are being made only in accordance with authorizations of management and directors of the company; and (3) provide reasonable assurance regarding prevention or timely detection of unauthorized acquisition, use, or disposition of the company’s assets that could have a material effect on the financial statements.
Because of its inherent limitations, internal control over financial reporting may not prevent or detect misstatements. Also, projections of any evaluation of effectiveness to future periods are subject to the risk that controls may become inadequate because of changes in conditions, or that the degree of compliance with the policies or procedures may deteriorate.
/s/ DELOITTE & TOUCHE LLP
Atlanta, Georgia
December 7, 2018
35
INGLES MARKETS, INCORPORATED AND SUBSIDIARIES
CONSOLIDATED BALANCE SHEETS
SEPTEMBER 29, 2018 AND SEPTEMBER 30, 2017
|
|
|
|
|
|
|
|
|
|
|
2018 |
|
2017 |
||
|
ASSETS |
|
|
|
|
|
|
|
CURRENT ASSETS: |
|
|
|
|
|
|
|
Cash and cash equivalents |
|
$ |
10,537,303 |
|
$ |
23,912,100 |
|
Receivables (less allowance for doubtful accounts of $433,355 – 2018 and $305,580 – 2017) |
|
|
70,056,909 |
|
|
66,329,164 |
|
Inventories |
|
|
372,195,421 |
|
|
349,333,013 |
|
Other |
|
|
43,953,483 |
|
|
6,265,737 |
|
Total current assets |
|
|
496,743,116 |
|
|
445,840,014 |
|
|
|
|
|
|
|
|
|
PROPERTY AND EQUIPMENT, NET |
|
|
1,303,044,370 |
|
|
1,265,112,350 |
|
|
|
|
|
|
|
|
|
OTHER ASSETS |
|
|
25,123,334 |
|
|
22,353,410 |
|
|
|
|
|
|
|
|
|
TOTAL ASSETS |
|
$ |
1,824,910,820 |
|
$ |
1,733,305,774 |
See Notes to Consolidated Financial Statements.
36
INGLES MARKETS, INCORPORATED AND SUBSIDIARIES
CONSOLIDATED BALANCE SHEETS
SEPTEMBER 29, 2018 AND SEPTEMBER 30, 2017
|
|
|
|
|
|
|
|
|
|
|
|
|
|
|
|
|
|
|
2018 |
|
2017 |
||
|
|
|
|
|
|
|
|
|
LIABILITIES AND STOCKHOLDERS’ EQUITY |
|
|
|
|
|
|
|
CURRENT LIABILITIES: |
|
|
|
|
|
|
|
Current portion of long-term debt |
|
$ |
12,848,013 |
|
$ |
12,210,571 |
|
Accounts payable - trade |
|
|
165,165,312 |
|
|
150,901,051 |
|
Accrued expenses and current portion of other long-term liabilities |
|
|
82,124,766 |
|
|
82,451,857 |
|
Total current liabilities |
|
|
260,138,091 |
|
|
245,563,479 |
|
|
|
|
|
|
|
|
|
DEFERRED INCOME TAXES |
|
|
74,461,000 |
|
|
69,918,000 |
|
|
|
|
|
|
|
|
|
LONG-TERM DEBT |
|
|
852,739,760 |
|
|
865,659,744 |
|
|
|
|
|
|
|
|
|
OTHER LONG-TERM LIABILITIES |
|
|
42,158,161 |
|
|
41,112,548 |
|
Total liabilities |
|
|
1,229,497,012 |
|
|
1,222,253,771 |
|
|
|
|
|
|
|
|
|
COMMITMENTS AND CONTINGENCIES |
|
|
— |
|
|
— |
|
|
|
|
|
|
|
|
|
STOCKHOLDERS’ EQUITY: |
|
|
|
|
|
|
|
Preferred stock, $0.05 par value; 10,000,000 shares authorized; no shares issued |
|
|
— |
|
|
— |
|
Common stocks: |
|
|
|
|
|
|
|
Class A, $0.05 par value; 150,000,000 shares authorized; issued and outstanding, 14,145,385 shares in 2018, 14,084,044 shares in 2017 |
|
|
707,269 |
|
|
704,202 |
|
Class B, convertible to Class A, $0.05 par value; 100,000,000 shares authorized; issued and outstanding, 6,114,391 shares in 2018, 6,175,732 shares in 2017 |
|
|
305,720 |
|
|
308,787 |
|
|
|
|
|
|
|
|
|
Paid-in capital in excess of par value |
|
|
12,311,249 |
|
|
12,311,249 |
|
|
|
|
|
|
|
|
|
Retained earnings |
|
|
582,089,570 |
|
|
497,727,765 |
|
Total stockholders’ equity |
|
|
595,413,808 |
|
|
511,052,003 |
|
TOTAL LIABILITIES AND STOCKHOLDERS’ EQUITY |
|
$ |
1,824,910,820 |
|
$ |
1,733,305,774 |
See Notes to Consolidated Financial Statements.
37
INGLES MARKETS, INCORPORATED AND SUBSIDIARIES
CONSOLIDATED STATEMENTS OF INCOME
FISCAL YEARS ENDED SEPTEMBER 29, 2018,
SEPTEMBER 30, 2017 AND SEPTEMBER 24, 2016
|
|
|
|
|
|
|
|
|
|
|
|
|
|
|
|
|
|
|
|
|
|
|
|
|
2018 |
|
2017 |
|
2016 |
|||
|
Net sales |
|
$ |
4,092,804,877 |
|
$ |
4,002,699,727 |
|
$ |
3,794,977,406 |
|
Cost of goods sold |
|
|
3,112,635,516 |
|
|
3,039,106,724 |
|
|
2,870,572,206 |
|
Gross profit |
|
|
980,169,361 |
|
|
963,593,003 |
|
|
924,405,200 |
|
Operating and administrative expenses |
|
|
856,074,106 |
|
|
837,144,859 |
|
|
794,594,653 |
|
Gain (loss) from sale or disposal of assets |
|
|
728,386 |
|
|
1,464,600 |
|
|
(1,208,549) |
|
Income from operations |
|
|
124,823,641 |
|
|
127,912,744 |
|
|
128,601,998 |
|
Other income, net |
|
|
3,064,690 |
|
|
3,806,869 |
|
|
2,362,772 |
|
Interest expense |
|
|
47,569,703 |
|
|
47,458,033 |
|
|
46,330,304 |
|
Income before income taxes |
|
|
80,318,628 |
|
|
84,261,580 |
|
|
84,634,466 |
|
Income tax (benefit) expense |
|
|
(17,046,000) |
|
|
30,388,000 |
|
|
30,445,000 |
|
Net income |
|
$ |
97,364,628 |
|
$ |
53,873,580 |
|
$ |
54,189,466 |
|
Per-share amounts: |
|
|
|
|
|
|
|
|
|
|
Class A Common Stock |
|
|
|
|
|
|
|
|
|
|
Basic earnings per common share |
|
$ |
4.94 |
|
$ |
2.74 |
|
$ |
2.75 |
|
Diluted earnings per common share |
|
$ |
4.81 |
|
$ |
2.66 |
|
$ |
2.68 |
|
Class B Common Stock |
|
|
|
|
|
|
|
|
|
|
Basic earnings per common share |
|
$ |
4.49 |
|
$ |
2.49 |
|
$ |
2.50 |
|
Diluted earnings per common share |
|
$ |
4.49 |
|
$ |
2.49 |
|
$ |
2.50 |
|
Cash dividends per common share: |
|
|
|
|
|
|
|
|
|
|
Class A |
|
$ |
0.66 |
|
$ |
0.66 |
|
$ |
0.66 |
|
Class B |
|
$ |
0.60 |
|
$ |
0.60 |
|
$ |
0.60 |
See Notes to Consolidated Financial Statements.
38
INGLES MARKETS, INCORPORATED AND SUBSIDIARIES
CONSOLIDATED STATEMENTS OF CHANGES IN STOCKHOLDERS’ EQUITY
FISCAL YEARS ENDED SEPTEMBER 29, 2018,
SEPTEMBER 30, 2017 AND SEPTEMBER 24, 2016
|
|
|
|
|
|
|
|
|
|
|
|
|
|
|
|
|
|
|
|
|
|
|
|
|
|
|
|
|
|
|
|
|
|
|
|
|
|
|
|
|
|
|
|
|
|
|
|
|
|
|
|
|
|
|
PAID-IN |
|
|
|
|
|
|
|
|
|
|
CLASS A |
|
CLASS B |
|
CAPITAL IN |
|
|
|
|
|
|
|||||||
|
|
|
COMMON STOCK |
|
COMMON STOCK |
|
EXCESS OF |
|
RETAINED |
|
|
|
||||||||
|
|
|
SHARES |
|
AMOUNT |
|
SHARES |
|
AMOUNT |
|
PAR VALUE |
|
EARNINGS |
|
TOTAL |
|||||
|
Balance, September 26, 2015 |
|
13,924,651 |
|
$ |
696,233 |
|
6,335,125 |
|
$ |
316,756 |
|
$ |
12,311,249 |
|
$ |
415,654,162 |
|
$ |
428,978,400 |
|
Net income |
|
— |
|
|
— |
|
— |
|
|
— |
|
|
— |
|
|
54,189,466 |
|
|
54,189,466 |
|
Cash dividends |
|
|
|
|
|
|
|
|
|
|
|
|
|
|
|
|
|
|
|
|
Class A |
|
— |
|
|
— |
|
— |
|
|
— |
|
|
— |
|
|
(9,200,271) |
|
|
(9,200,271) |
|
Class B |
|
— |
|
|
— |
|
— |
|
|
— |
|
|
— |
|
|
(3,791,985) |
|
|
(3,791,985) |
|
Common stock conversions |
|
41,825 |
|
|
2,091 |
|
(41,825) |
|
|
(2,091) |
|
|
— |
|
|
— |
|
|
— |
|
Balance, September 24, 2016 |
|
13,966,476 |
|
$ |
698,324 |
|
6,293,300 |
|
$ |
314,665 |
|
$ |
12,311,249 |
|
$ |
456,851,372 |
|
$ |
470,175,610 |
|
Net income |
|
— |
|
|
— |
|
— |
|
|
— |
|
|
— |
|
|
53,873,580 |
|
|
53,873,580 |
|
Cash dividends |
|
|
|
|
|
|
|
|
|
|
|
|
|
|
|
|
|
|
|
|
Class A |
|
— |
|
|
— |
|
— |
|
|
— |
|
|
— |
|
|
(9,254,502) |
|
|
(9,254,502) |
|
Class B |
|
— |
|
|
— |
|
— |
|
|
— |
|
|
— |
|
|
(3,742,685) |
|
|
(3,742,685) |
|
Common stock conversions |
|
117,568 |
|
|
5,878 |
|
(117,568) |
|
|
(5,878) |
|
|
— |
|
|
— |
|
|
— |
|
Balance, September 30, 2017 |
|
14,084,044 |
|
$ |
704,202 |
|
6,175,732 |
|
$ |
308,787 |
|
$ |
12,311,249 |
|
$ |
497,727,765 |
|
$ |
511,052,003 |
|
Net income |
|
— |
|
|
— |
|
— |
|
|
— |
|
|
— |
|
|
97,364,628 |
|
|
97,364,628 |
|
Cash dividends |
|
|
|
|
|
|
|
|
|
|
|
|
|
|
|
|
|
|
|
|
Class A |
|
— |
|
|
— |
|
— |
|
|
— |
|
|
— |
|
|
(9,316,501) |
|
|
(9,316,501) |
|
Class B |
|
— |
|
|
— |
|
— |
|
|
— |
|
|
— |
|
|
(3,686,322) |
|
|
(3,686,322) |
|
Common stock conversions |
|
61,341 |
|
|
3,067 |
|
(61,341) |
|
|
(3,067) |
|
|
— |
|
|
— |
|
|
— |
|
Balance, September 29, 2018 |
|
14,145,385 |
|
$ |
707,269 |
|
6,114,391 |
|
$ |
305,720 |
|
$ |
12,311,249 |
|
$ |
582,089,570 |
|
$ |
595,413,808 |
See Notes to Consolidated Financial Statements.
39
INGLES MARKETS, INCORPORATED AND SUBSIDIARIES
CONSOLIDATED STATEMENTS OF CASH FLOWS
FISCAL YEARS ENDED SEPTEMBER 29, 2018,
SEPTEMBER 30, 2017 AND SEPTEMBER 24, 2016
|
|
|
|
|
|
|
|
|
|
|
|
|
|
2018 |
|
2017 |
|
2016 |
|||
|
Cash Flows From Operating Activities: |
|
|
|
|
|
|
|
|
|
|
Net income |
|
$ |
97,364,628 |
|
$ |
53,873,580 |
|
$ |
54,189,466 |
|
Adjustments to reconcile net income to net cash provided by operating activities: |
|
|
|
|
|
|
|
|
|
|
Depreciation and amortization expense |
|
|
113,082,675 |
|
|
110,929,378 |
|
|
106,587,686 |
|
(Gain) loss from sale or disposal of assets |
|
|
(728,386) |
|
|
(1,464,600) |
|
|
1,208,549 |
|
Receipt of advance payments on purchases contracts |
|
|
2,108,133 |
|
|
3,736,862 |
|
|
3,195,887 |
|
Recognition of advance payments on purchases contracts |
|
|
(2,178,062) |
|
|
(2,176,620) |
|
|
(3,275,156) |
|
Deferred income taxes |
|
|
4,543,000 |
|
|
(1,531,000) |
|
|
6,806,000 |
|
Changes in operating assets and liabilities |
|
|
|
|
|
|
|
|
|
|
Receivables |
|
|
(3,727,745) |
|
|
(4,593,777) |
|
|
4,548,776 |
|
Inventory |
|
|
(22,862,408) |
|
|
(5,451,936) |
|
|
(5,236,949) |
|
Other assets |
|
|
(40,549,644) |
|
|
(1,566,670) |
|
|
3,635,949 |
|
Accounts payable and accrued expenses |
|
|
14,187,867 |
|
|
4,585,074 |
|
|
(12,629,450) |
|
Net Cash Provided By Operating Activities |
|
|
161,240,058 |
|
|
156,340,291 |
|
|
159,030,758 |
|
Cash Flows From Investing Activities: |
|
|
|
|
|
|
|
|
|
|
Proceeds from sales of property and equipment |
|
|
2,340,027 |
|
|
2,335,726 |
|
|
758,529 |
|
Capital expenditures |
|
|
(150,486,508) |
|
|
(127,695,650) |
|
|
(137,642,132) |
|
Net Cash Used By Investing Activities |
|
|
(148,146,481) |
|
|
(125,359,924) |
|
|
(136,883,603) |
|
Cash Flows From Financing Activities: |
|
|
|
|
|
|
|
|
|
|
Proceeds from short-term borrowings |
|
|
515,395,546 |
|
|
393,175,778 |
|
|
708,337,039 |
|
Payments on short-term borrowings |
|
|
(515,395,546) |
|
|
(393,175,778) |
|
|
(708,797,044) |
|
Net proceeds from new long-term borrowings |
|
|
— |
|
|
59,737,147 |
|
|
20,283,178 |
|
Principal payments on long-term borrowings |
|
|
(13,465,551) |
|
|
(59,487,736) |
|
|
(30,803,603) |
|
Dividends |
|
|
(13,002,823) |
|
|
(12,997,187) |
|
|
(12,992,256) |
|
Net Cash Used By Financing Activities |
|
|
(26,468,374) |
|
|
(12,747,776) |
|
|
(23,972,686) |
|
(Decrease) increase in Cash and Cash Equivalents |
|
|
(13,374,797) |
|
|
18,232,591 |
|
|
(1,825,531) |
|
Cash and Cash Equivalents at Beginning of Year |
|
|
23,912,100 |
|
|
5,679,509 |
|
|
7,505,040 |
|
Cash and Cash Equivalents at End of Year |
|
$ |
10,537,303 |
|
$ |
23,912,100 |
|
$ |
5,679,509 |
See Notes to Consolidated Financial Statements.
40
Ingles Markets, Incorporated and Subsidiaries
Notes To Consolidated Financial Statements
Fiscal years ended September 29, 2018, September 30, 2017 and September 24, 2016
1. Summary of Significant Accounting Policies
Nature of Operations – Ingles Markets, Incorporated (“Ingles” or the “Company”), is a leading supermarket chain in the southeast United States, operates 200 supermarkets in North Carolina (72), Georgia (69), South Carolina (36), Tennessee (21), Virginia (1) and Alabama (1).
Principles of Consolidation – The consolidated financial statements include the accounts of Ingles Markets, Incorporated and its wholly-owned subsidiaries, Sky King, Inc., Ingles Markets Investments, Inc., Milkco, Inc., Land O Sky, LLC, Shopping Center Financing, LLC, and Shopping Center Financing II, LLC. All significant inter-company balances and transactions are eliminated in consolidation.
Fiscal Year – The Company’s fiscal year ends on the last Saturday in September. Fiscal years 2018 and 2016 each consisted of 52 weeks. Fiscal year 2017 consisted of 53 weeks.
Segment Information – The Company operates one primary business segment, retail grocery sales (representing the aggregation of individual retail stores). The “Other” segment includes our remaining operations -- fluid dairy and shopping center rentals.
New Accounting Pronouncements – In February 2016, the FASB issued Accounting Standards Update ASU 2016-02 “Leases” (ASU 2016-02). ASU 2016-02 requires lessees to recognize lease assets and lease liabilities on the balance sheet for those leases previously classified as operating leases. This ASU is effective for fiscal years beginning after December 15, 2018, and interim periods within those fiscal years, with early adoption permitted. The Company will adopt the standard in the first quarter of fiscal 2020. The Company is currently evaluating the impact of adopting this ASU on its consolidated financial statements.
In May 2014, the FASB issued Accounting Standards Update ASU 2014-09 “Revenue from Contracts with Customers” (ASU 2014-09). ASU 2014-09 is a comprehensive new revenue recognition model that requires a company to recognize revenue to depict the transfer of goods or services to customers in an amount that reflects the consideration to which the entity expects to be entitled in exchange for those goods and services. In August 2015, the FASB issued ASU 2015-14 which deferred the effective date of the ASU to fiscal years beginning after December 15, 2017 and interim periods within those fiscal years, with early adoption permitted. The Company will adopt the standard in the first quarter of fiscal 2019, and determined the impact of adopting the new guidance will be immaterial to its annual and interim financial statements. The Company’s assessment included a detailed review of contracts for each of its disaggregated revenue streams and a comparison of its historical accounting policies and practices to the new standard.
Cash Equivalents – All highly liquid investments with a maturity of three months or less when purchased are considered cash. Outstanding checks in excess of bank balances are included in the line item “Accounts payable – trade” on the Consolidated Balance Sheets. There were no such balances at September 29, 2018 and September 30, 2017, respectively.
Financial Instruments – The Company at times has short-term investments and certificates of deposit with maturities of three months or less when purchased that are included in cash. At September 29, 2018, the Company had no such investments. The Company’s policy is to invest its excess cash either in money market accounts, reverse repurchase agreements or in certificates of deposit. Money market accounts and certificates of deposit are not secured; reverse repurchase agreements are secured by government obligations. At September 29, 2018 demand deposits of approximately $5.9 million in three banks exceed the $250,000 FDIC insurance limit per bank.
Interest Rate Swaps – The Company utilizes an interest rate swap contract to reduce its exposure to fluctuations in variable interest rates for future interest payments on one of its debt instruments. For determining the fair value of the interest rate swap contract, the Company uses significant observable market data or assumptions about counterparty risk. The fair value estimates reflect an income approach based on the terms of the interest rate swap contract and inputs corroborated by observable market data including interest rate curves. The Company has designated this swap as a cash flow hedge, for which the Company records the effective portions of changes in its fair value, net of tax, in other comprehensive income (loss). To the extent the interest rate swap is determined to be ineffective, the Company recognizes the change in the estimated fair value of the swap in earnings.
41
Allowance for Doubtful Accounts – Accounts receivable are primarily from vendor allowances, customer charges and pharmacy insurance company reimbursements. Accounts receivable are stated net of an allowance for uncollectible accounts, which is determined through analysis of the aging of accounts receivable at the date of the consolidated financial statements and assessments of the collectability based upon historical collection activity adjusted for current conditions.
Inventories – Substantially all of the Company’s inventory consists of finished goods. Warehouse inventories are valued at the lower of average cost or market. Store inventories are valued using the retail method under which inventories at cost (and the resulting gross margins) are determined by applying a calculated cost-to-retail ratio to the retail value of inventories. As an integral part of valuing inventory at cost, management makes certain judgments and estimates for standard gross margins, allowances for vendor consideration, markdowns and shrinkage. Warehousing and distribution costs are not included in the valuation of inventories. The Company reviews its judgments and estimates regularly and makes adjustments where facts and circumstances dictate.
Property, Equipment and Depreciation – Property and equipment are stated at cost and depreciated over the estimated useful lives by the straight-line method. Buildings are generally depreciated over 30 years. Store, office and warehouse equipment is generally depreciated over three to 10 years. Transportation equipment is generally depreciated over three to five years. Leasehold improvements are depreciated over the shorter of the subject lease term or the useful life of the asset, generally from three to 30 years. Depreciation and amortization expense totaled $113.1 million, $110.9 million and $106.6 million for fiscal years 2018, 2017 and 2016, respectively.
Asset Impairments – The Company accounts for the impairment of long-lived assets in accordance with Financial Accounting Standards Board Accounting Standards Codification (“FASB ASC”) Topic 360. Asset groups are primarily comprised of individual store and shopping center properties. For assets to be held and used, the Company tests for impairment using undiscounted cash flows and calculates the amount of impairment using discounted cash flows. For assets held for sale, impairment is recognized based on the excess of remaining book value over expected recovery value. The recovery value is the fair value as determined by independent quotes or expected sales prices developed by internal associates, less costs to sell. Estimates of future cash flows and expected sales prices are judgments based upon the Company’s experience and knowledge of local operations and cash flows that are projected for several years into the future. These estimates can fluctuate significantly due to changes in real estate market conditions, the economic environment, capital spending decisions and inflation. The Company monitors the carrying value of long-lived assets for potential impairment each quarter based on whether any indicators of impairment have occurred.
Nonqualified Investment Plan – The purpose of the Executive Nonqualified Excess Plan is to provide retirement benefits similar to the Company’s Investment/Profit Sharing Plan to certain of the Company’s management employees who are otherwise subject to limited participation in the 401(k) feature of the Company’s Investment/Profit Sharing Plan. Participant retirement account balances are liabilities of the Company. Assets of the plan are assets of the Company and are held in trust for employees and distributed upon retirement, death, disability, in-service distributions, or termination of employment. In accordance with the trust, the Company may not use these assets for general corporate purposes. Life insurance policies and marketable securities held in the trust are included in the caption “Other assets” in the Consolidated Balance Sheets.
Self-Insurance – The Company is self-insured for workers’ compensation, general liability and group medical and dental benefits. Risks and uncertainties are associated with self-insurance; however, the Company has limited its exposure by maintaining excess liability coverage of $750,000 per occurrence for workers’ compensation, $500,000 for general liability, and $450,000 per covered person for medical care benefits for a policy year. Self-insurance liabilities are established based on claims filed and estimates of claims incurred but not reported. The estimates are based on data provided by the respective claims administrators, which is then applied to appropriate actuarial methods. These estimates can fluctuate if historical trends are not predictive of the future. The Company’s self-insurance reserves totaled $34.7 million and $35.5 million for employee group insurance, workers’ compensation insurance and general liability insurance at September 29, 2018 and September 30, 2017, respectively. These amounts are inclusive of expected recoveries from excess cost insurance or other sources that are recorded as receivables of $4.6 at September 29, 2018 and $4.8 million at September 30, 2017. The Company is required in certain cases to obtain letters of credit to support its self-insured status. At fiscal year-end 2018, the Company’s self-insured liabilities were supported by $8.9 million of undrawn letters of credit which expire between September and October 2019. The Company carries casualty insurance only on those properties where it is required to do so. The Company has elected to self-insure its other properties.
Income Taxes – The Company accounts for income taxes under FASB ASC Topic 740. Deferred tax assets and liabilities are determined based on differences between financial reporting and tax bases of assets and liabilities and are measured using the currently enacted tax rates. The Company accounts for uncertainty in income taxes by prescribing a recognition threshold and measurement attribute for financial statement recognition and measurement of a tax position taken or expected to be taken on a tax return.
42
The Company files income tax returns with federal and various state jurisdictions. With few exceptions, the Company is no longer subject to federal or state income tax examinations by tax authorities for the years before tax year 2014. Examinations may challenge certain of the Company’s tax positions. Actual results could materially differ from these estimates and could significantly affect the effective tax rate and cash flows in the future years.
Valuation allowances are established when necessary to reduce deferred tax assets to the amount more likely than not expected to be realized.
Gross unrecognized tax benefits as well as interest and penalties related to uncertain tax positions could affect the Company’s effective tax rate. These amounts are insignificant for fiscal years 2018, 2017, and 2016.
Pre-Opening Costs – Costs associated with the opening of new stores are expensed when incurred.
Per-Share Amounts – The Company calculates earnings per share using the two-class method in accordance with FASB ASC Topic 260.
Advertising – The Company expenses advertising as incurred. Advertising and promotion expenses, net of vendor allowance reimbursements, totaled $12.6 million, $12.5 million and $13.3 million for fiscal years 2018, 2017 and 2016, respectively.
Use of Estimates – The preparation of financial statements in conformity with U.S. generally accepted accounting principles requires management to make estimates and assumptions that affect the amounts reported in the financial statements and accompanying notes. Although these estimates are based on management’s knowledge of current events and actions it may undertake in the future, they may ultimately differ from actual results. Such estimates include the allowance for doubtful accounts, various inventory reserves, realizability of deferred tax assets, and self-insurance reserves.
Cost of Goods Sold – In addition to the direct product cost, cost of goods sold for the grocery segment includes inbound freight charges and costs of the Company’s distribution network. Milk processing is a manufacturing process. Therefore, cost of goods sold include direct product and production costs, inbound freight, purchasing and receiving costs, inspection costs, warehousing costs, internal transfer costs, and other costs of distribution. Depreciation expense included in costs of goods sold totaled $14.4 million, $15.4 million and $16.0 million for fiscal years 2018, 2017 and 2016, respectively.
Operating and Administrative Expenses – Operating and administrative expenses include costs incurred for store and administrative labor, occupancy, depreciation (to the extent not included in Cost of Goods Sold), insurance and general administration.
Revenue Recognition – The Company recognizes revenues from grocery segment sales at the point of sale to its customers. Sales taxes collected from customers are not included in reported revenues. Discounts provided to customers by the Company at the point of sale, including discounts provided in connection with loyalty cards, are recognized as a reduction in sales as the products are sold. Product returns are not significant.
The Company recognizes fluid dairy revenues at the time the risk of loss shifts to the customer pursuant to our terms of sale. Therefore, approximately 56% of fluid dairy revenues are recognized when the product is picked up by the customer at our facility. The remaining fluid dairy revenues are recognized when the product is received at the customer’s facility upon delivery via transportation arranged by the Company.
Rental income, including contingent rentals, is recognized on the accrual basis. Upfront consideration paid by either the Company as lessor or by the lessee is recognized as an adjustment to net rental income using the straight line method over the term of the lease.
Vendor Allowances – The Company receives funds for a variety of merchandising activities from the many vendors whose products the Company buys for resale in its stores. These incentives and allowances are primarily comprised of volume or purchase based incentives, advertising allowances, slotting fees, and promotional discounts. The purpose of these incentives and allowances is generally to help defray the costs incurred by the Company for stocking, advertising, promoting and selling the vendors’ products. These allowances generally relate to short term arrangements with vendors, often relating to a period of a month or less, and are negotiated on a purchase-by-purchase or transaction-by-transaction basis. Whenever possible, vendor discounts and allowances that relate to buying and merchandising activities are recorded as a component of item cost in inventory and recognized in merchandise costs when the item is sold. Due to system constraints and the nature of certain allowances, it is sometimes not practicable to apply allowances to the item cost of inventory. In those instances, the allowances are applied as a reduction of merchandise costs using a rational and systematic methodology, which results in the recognition of these incentives when the inventory related to the vendor consideration received is sold. Vendor allowances
43
applied as a reduction of merchandise costs totaled $116.5 million, $116.6 million, and $115.8 million for the fiscal years ended September 29, 2018, September 30, 2017 and September 24, 2016, respectively. Vendor advertising allowances that represent a reimbursement of specific identifiable incremental costs of advertising the vendor’s specific products are recorded as a reduction to the related expense in the period that the related expense is incurred. Vendor advertising allowances recorded as a reduction of advertising expense totaled $14.1 million, $13.8 million, and $13.5 million for the fiscal years ended September 29, 2018, September 30, 2017 and September 24, 2016, respectively.
If vendor advertising allowances were substantially reduced or eliminated, the Company would likely consider other methods of advertising as well as the volume and frequency of its product advertising, which could increase or decrease its expenditures.
Similarly, the Company is not able to assess the impact of vendor advertising allowances on the creation of additional revenue; as such allowances do not directly generate revenue for its stores.
2. Income Taxes
Deferred Income Tax Liabilities and Assets – Deferred income taxes are determined based on the difference between the financial statement and tax bases of assets and liabilities using enacted tax laws and rates. Significant components of the Company’s deferred tax liabilities and assets are as follows:
|
|
|
|
|
|
|
|
|
|
|
2018 |
|
2017 |
||
|
Deferred tax liabilities: |
|
|
|
|
|
|
|
Property and equipment tax/book differences |
|
$ |
87,577,000 |
|
$ |
89,089,000 |
|
Property tax method |
|
|
1,156,000 |
|
|
1,575,000 |
|
Total deferred tax liabilities |
|
|
88,733,000 |
|
|
90,664,000 |
|
Deferred tax assets: |
|
|
|
|
|
|
|
Insurance reserves |
|
|
4,790,000 |
|
|
7,872,000 |
|
Advance payments on purchases contracts |
|
|
761,000 |
|
|
1,207,000 |
|
Vacation accrual |
|
|
1,652,000 |
|
|
2,471,000 |
|
State tax credits |
|
|
— |
|
|
4,000 |
|
Inventory |
|
|
1,055,000 |
|
|
1,555,000 |
|
Deferred compensation |
|
|
3,662,000 |
|
|
5,032,000 |
|
Other |
|
|
2,352,000 |
|
|
2,605,000 |
|
Total deferred tax assets |
|
|
14,272,000 |
|
|
20,746,000 |
|
Net deferred tax liabilities |
|
$ |
74,461,000 |
|
$ |
69,918,000 |
At September 29, 2018 refundable current income taxes totaling $36.7 million, are included in the line item “Other current assets” on the Consolidated Balance Sheets.
Income Tax Expense - Income tax expense differs from the amounts computed by applying the statutory federal rates to income before income taxes. The reasons for the differences are as follows:
|
|
|
|
|
|
|
|
|
|
|
|
|
|
|
|
|
|
|
|
|
|
|
|
|
2018 |
|
2017 |
|
2016 |
|||
|
Federal tax at statutory rate |
|
$ |
19,678,000 |
|
$ |
29,492,000 |
|
$ |
29,622,000 |
|
State income tax, net of federal tax benefits |
|
|
3,528,000 |
|
|
2,774,000 |
|
|
2,554,000 |
|
Federal tax credits |
|
|
(1,052,000) |
|
|
(1,024,000) |
|
|
(1,312,000) |
|
Tax rate change on deferred tax balance as of Federal law enactment date |
|
|
(26,680,000) |
|
|
— |
|
|
— |
|
Tax method change |
|
|
(10,606,000) |
|
|
— |
|
|
— |
|
Tax rate change effect of FY18 current deferred activity |
|
|
(2,124,000) |
|
|
— |
|
|
— |
|
Other |
|
|
210,000 |
|
|
(854,000) |
|
|
(419,000) |
|
Total |
|
$ |
(17,046,000) |
|
$ |
30,388,000 |
|
$ |
30,445,000 |
44
Current and deferred income tax expense (benefit) is as follows:
|
|
|
|
|
|
|
|
|
|
|
|
|
|
|
|
|
|
|
|
|
|
|
|
|
2018 |
|
2017 |
|
2016 |
|||
|
Current: |
|
|
|
|
|
|
|
|
|
|
Federal |
|
$ |
(21,596,000) |
|
$ |
26,994,000 |
|
$ |
19,676,000 |
|
State |
|
|
7,000 |
|
|
4,925,000 |
|
|
3,963,000 |
|
Total current |
|
|
(21,589,000) |
|
|
31,919,000 |
|
|
23,639,000 |
|
Deferred: |
|
|
|
|
|
|
|
|
|
|
Federal |
|
|
1,020,000 |
|
|
(1,104,000) |
|
|
6,828,000 |
|
State |
|
|
3,523,000 |
|
|
(427,000) |
|
|
(22,000) |
|
Total deferred |
|
|
4,543,000 |
|
|
(1,531,000) |
|
|
6,806,000 |
|
Total (benefit) expense |
|
$ |
(17,046,000) |
|
$ |
30,388,000 |
|
$ |
30,445,000 |
In December 2017, the Tax Cuts and Jobs Act (the “Tax Act”) became law. Among other things, the Tax Act reduced the federal corporate tax rate from 35% to 21% and allowed for full depreciation expensing of qualified property when placed in service.
As a result of the decrease in the effective tax rate, the Company recorded a decrease in its net deferred tax liabilities of $26.7 million, with a corresponding reduction to deferred income tax expense. During fiscal year 2018, the Company adopted a tax calculation method change that resulted in the accelerated deduction of certain property-related expenditures. As a result of this change and the aforementioned change in the federal corporate tax rate, the Company recorded an additional decrease in its net deferred tax liabilities of $10.6 million, with a corresponding reduction to deferred income tax expense.
3. Property and Equipment
Property and equipment, net, consists of the following:
|
|
|
|
|
|
|
|
|
|
|
|
|
|
|
|
|
|
|
2018 |
|
2017 |
||
|
Land |
|
$ |
351,073,344 |
|
$ |
339,983,697 |
|
Construction in progress |
|
|
12,393,293 |
|
|
26,684,306 |
|
Buildings |
|
|
1,173,237,017 |
|
|
1,110,482,379 |
|
Store, office and warehouse equipment |
|
|
946,026,834 |
|
|
900,160,007 |
|
Transportation equipment |
|
|
75,919,047 |
|
|
72,942,078 |
|
Leasehold improvements |
|
|
54,387,952 |
|
|
56,561,436 |
|
Total |
|
|
2,613,037,487 |
|
|
2,506,813,903 |
|
Less accumulated depreciation and amortization |
|
|
1,309,993,117 |
|
|
1,241,701,553 |
|
Property and equipment - net |
|
$ |
1,303,044,370 |
|
$ |
1,265,112,350 |
4. Property Held for Lease and Rental Income
At September 29, 2018, the Company owned and operated 77 shopping centers in conjunction with its supermarket operations. The Company leases to others a portion of its shopping center properties. The leases are non-cancelable operating lease agreements for periods ranging up to 20 years.
Rental income is included in the line item “Net sales” on the Consolidated Statements of Income. Depreciation on owned properties leased to others and other shopping center expenses are included in the line item “Cost of goods sold” on the Consolidated Statements of Income.
|
|
|
|
|
|
|
|
|
|
|
|
|
|
2018 |
|
2017 |
|
2016 |
|||
|
Rents earned on owned and subleased properties: |
|
|
|
|
|
|
|
|
|
|
Base rentals including lease termination payments |
|
$ |
10,826,997 |
|
$ |
8,847,035 |
|
$ |
8,280,790 |
|
Contingent rentals |
|
|
249,965 |
|
|
334,204 |
|
|
312,822 |
|
Total |
|
|
11,076,962 |
|
|
9,181,239 |
|
|
8,593,612 |
|
Depreciation on owned properties leased to others |
|
|
(5,132,805) |
|
|
(5,255,719) |
|
|
(4,936,485) |
|
Other shopping center expenses |
|
|
(2,967,860) |
|
|
(2,654,976) |
|
|
(2,124,105) |
|
Total |
|
$ |
2,976,297 |
|
$ |
1,270,544 |
|
$ |
1,533,022 |
45
Owned properties leased or held for lease to others under operating leases by major classes are summarized as follows:
|
|
|
|
|
|
|
|
|
|
|
|
|
|
|
|
|
|
|
September 29, |
|
September 30, |
||
|
|
|
2018 |
|
2017 |
||
|
Land |
|
$ |
54,348,413 |
|
$ |
45,528,897 |
|
Buildings |
|
|
170,700,496 |
|
|
170,277,547 |
|
Total |
|
|
225,048,909 |
|
|
215,806,444 |
|
Less accumulated depreciation |
|
|
(108,754,494) |
|
|
(114,072,360) |
|
Total |
|
$ |
116,294,415 |
|
$ |
101,734,084 |
The above amounts are included on the Consolidated Balance Sheets in the caption “Property and equipment, net.”
The following is a schedule of minimum future rental income on non-cancelable operating leases as of September 29, 2018:
|
|
|
|
|
|
Fiscal Year |
|
|
|
|
2019 |
|
$ |
8,288,913 |
|
2020 |
|
|
7,263,659 |
|
2021 |
|
|
5,525,165 |
|
2022 |
|
|
4,703,291 |
|
2023 |
|
|
3,887,179 |
|
Thereafter |
|
|
12,119,918 |
|
Total minimum future rental income |
|
$ |
41,788,125 |
5. Leases and Rental Expense
The Company conducts part of its retail operations from leased facilities. The initial terms of the leases are generally 20 years. The majority of the leases include one or more renewal options and provide that the Company pay property taxes, utilities, repairs and certain other costs incidental to occupation of the premises. Several leases contain clauses calling for percentage rentals based upon gross sales of the supermarket occupying the leased space. Step rent provisions, escalation clauses, capital improvements and other lease concessions are taken into account in computing minimum lease payments, which are recognized on a straight-line basis over the minimum lease term.
Operating Leases - Rent expense for all operating leases of $12.8 million, $13.6 million and $13.8 million for fiscal years 2018, 2017 and 2016, respectively, is included in operating and administrative expenses. Sub-lease rental income of $0.3 million for each of fiscal years 2018, 2017 and 2016, is included as a reduction of rental expense.
The components of aggregate minimum rental commitments under non-cancelable operating leases as of September 29, 2018 are as follows:
|
|
|
|
|
|
|
|
|
|
|
Fiscal Year |
|
|
|
|
2019 |
|
$ |
10,286,273 |
|
2020 |
|
|
9,201,324 |
|
2021 |
|
|
6,968,596 |
|
2022 |
|
|
6,152,252 |
|
2023 |
|
|
4,475,619 |
|
Thereafter |
|
|
23,312,213 |
|
Total minimum future rental commitments |
|
$ |
60,396,277 |
46
6. Supplementary Balance Sheet Information
Accrued Expenses and Current Portion of Other Long-Term Liabilities - Accrued expenses and current portion of other long-term liabilities are summarized as follows:
|
|
|
|
|
|
|
|
|
|
|
2018 |
|
2017 |
||
|
Property, payroll, and other taxes payable |
|
$ |
22,327,253 |
|
$ |
21,261,924 |
|
Salaries, wages, and bonuses payable |
|
|
29,583,266 |
|
|
28,369,250 |
|
Self-insurance liabilities: |
|
|
|
|
|
|
|
Employee group insurance |
|
|
5,257,120 |
|
|
4,893,855 |
|
Workers’ compensation insurance |
|
|
5,079,514 |
|
|
5,387,235 |
|
General liability insurance |
|
|
3,239,695 |
|
|
3,045,020 |
|
Interest |
|
|
13,397,615 |
|
|
13,175,382 |
|
Other |
|
|
3,240,303 |
|
|
6,319,191 |
|
Total accrued expenses and current portion of other long-term liabilities |
|
$ |
82,124,766 |
|
$ |
82,451,857 |
Employee insurance expense, including workers’ compensation and medical care benefits, net of employee contributions, totaled $37.7 million, $33.1 million and $34.5 million for fiscal years 2018, 2017 and 2016, respectively.
Other Long-Term Liabilities - Other long-term liabilities are summarized as follows:
|
|
|
|
|
|
|
|
|
|
|
2018 |
|
2017 |
||
|
Advance payments on purchases contracts |
|
$ |
3,115,106 |
|
$ |
3,185,034 |
|
Deferred lease expense |
|
|
1,941,708 |
|
|
1,913,811 |
|
Nonqualified investment plan liability |
|
|
15,033,318 |
|
|
13,303,318 |
|
Self-insurance liabilities: |
|
|
|
|
|
|
|
Workers’ compensation insurance |
|
|
16,333,768 |
|
|
17,147,541 |
|
General liability insurance |
|
|
4,776,234 |
|
|
4,663,347 |
|
Other |
|
|
2,124,800 |
|
|
1,867,015 |
|
Other long-term liabilities |
|
|
43,324,934 |
|
|
42,080,066 |
|
Less current portion |
|
|
1,166,773 |
|
|
967,518 |
|
Total other long-term liabilities |
|
$ |
42,158,161 |
|
$ |
41,112,548 |
Advance Payments on Purchases Contracts - The Company has entered into agreements with suppliers whereby payment is received in advance and earned based on purchases of product from these suppliers in the future. The unearned portion, included in other long-term liabilities, will be recognized in the results of operations in accordance with the terms of the contract.
7. Long-Term Debt
Long-term debt and short-term loans are summarized as follows:
|
|
|
|
|
|
|
|
|
|
|
2018 |
|
2017 |
||
|
Bonds payable: |
|
|
|
|
|
|
|
Senior notes, interest rate of 5.75%, maturing 2023 |
|
$ |
700,000,000 |
|
$ |
700,000,000 |
|
Recovery Zone Facility Bonds, maturing 2036 |
|
|
77,090,000 |
|
|
81,620,000 |
|
Outstanding line of credit, weighted average interest rate of 6.25% for 2018 |
|
|
— |
|
|
— |
|
Notes payable due to banks, weighted average interest rate of 3.68% for 2018 and 3.24% for 2017 |
|
|
94,535,898 |
|
|
103,471,449 |
|
Less unamortized prepaid loan costs |
|
|
(6,038,125) |
|
|
(7,221,134) |
|
Total long-term debt |
|
|
865,587,773 |
|
|
877,870,315 |
|
Less current portion |
|
|
12,848,013 |
|
|
12,210,571 |
|
Long-term debt, net of current portion |
|
$ |
852,739,760 |
|
$ |
865,659,744 |
In June 2013, the Company issued $700.0 million aggregate principal amount of senior notes due in 2023 (the “Notes”) in a private placement. The Notes bear an interest rate of 5.75% per annum and were issued at par. The Company filed a registration statement with the Securities and Exchange Commission and exchanged the private placement notes with registered notes.
The Company may redeem all or a portion of the Notes at any time on or after June 15, 2018 at the following redemption prices (expressed as percentages of the principal amount), if redeemed during the 12-month period beginning June 15 of the years indicated below:
47
|
|
|
|
Year |
|
|
2018 |
102.875% |
|
2019 |
101.917% |
|
2020 |
100.958% |
|
2021 and thereafter |
100.000% |
The Company has a $175.0 million line of credit (the “Line”) that matures in September 2022. The Line provides the Company with various interest rate options based on the prime rate, the Federal Funds Rate, or the London Interbank Offering Rate. The Line allows the Company to issue up to $20.0 million in unused letters of credit, of which $9.4 million of unused letters of credit were issued at September 29, 2018. The Company is not required to maintain compensating balances in connection with the Line. At September 29, 2018, the Company had no borrowing outstanding under the Line.
In December 2010, the Company completed the funding of $99.7 million of Recovery Zone Facility Bonds (the “Bonds”) for construction and equipping of an approximately 830,000 square foot new warehouse and distribution center to be located in Buncombe County, North Carolina (the “Project”). The final maturity date of the Bonds is January 1, 2036.
Under a Continuing Covenant and Collateral Agency Agreement (the “Covenant Agreement”) between certain financial institutions and the Company, the financial institutions would hold the Bonds until June 2021, subject to certain events. Mandatory redemption of the Bonds by the Company in the annual amount of $4.5 million began on January 1, 2014. During fiscal year 2018, the Covenant Agreement was amended to change certain terms and to extend the maturity to September 2026. The Company may redeem the Bonds without penalty or premium at any time prior to September 26, 2026.
Interest earned by bondholders on the Bonds is exempt from Federal and North Carolina income taxation. The interest rate on the Bonds is equal to one month LIBOR (adjusted monthly) plus a credit spread, adjusted to reflect the income tax exemption.
The Company’s obligation to repay the Bonds is collateralized by the Project. The Covenant Agreement incorporates substantially all financial covenants included in the Line.
The Notes, the Bonds and the Line contain provisions that under certain circumstances would permit lending institutions to terminate or withdraw their respective extensions of credit to the Company. Included among the triggering factors permitting the termination or withdrawal of the Line to the Company are certain events of default, including both monetary and non-monetary defaults, the initiation of bankruptcy or insolvency proceedings, and the failure of the Company to meet certain financial covenants designated in its respective loan documents. The Company was in compliance with all financial covenants related to the Notes, the Bonds and Line at September 29, 2018.
The Company’s long-term debt agreements generally have cross-default provisions which could result in the acceleration of payments due under the Company’s line of credit, Bond and Notes indenture in the event of default under any one instrument.
In September, 2017 the Company refinanced approximately $60 million secured borrowing obligations that were scheduled to mature in fiscal years 2018-2020 with a LIBOR-based floating rate loan maturing in October 2027. In December 2017, the Company entered into an interest rate swap contract to convert the variable interest rate on this loan to a fixed interest rate. The notional amount of the interest rate swap at inception was $58.5 million and declines each month by $0.5 million, consistent with the required principal payments of the loan. The interest rate swap has a fixed interest rate leg of 3.92% and a variable interest rate leg based on 1-month LIBOR.
The Company will recognize any differences between the variable interest rate payments and the fixed interest rate settlements with the swap counterparties as an adjustment to interest expense over the life of the swap. The Company has designated the swap as a cash flow hedge and recognizes the unrealized gains or unrealized losses as either assets or liabilities at fair value on its Consolidated Balance Sheets. As of September 29, 2018, the fair value changes of the interest rate swap was not material.
To the extent the interest rate swap is determined to be ineffective, the Company recognizes the changes in the estimated fair value of the swap in earnings. For the year ended September 28, 2018, there was no ineffectiveness recognized in earnings.
Failure of the swap counterparty to make payments would result in the loss of any potential benefit to the Company under the swap agreement. In this case, the Company would still be obligated to pay the variable interest payments underlying the debt agreements. Additionally, failure of the swap counterparty would not eliminate the Company’s obligation to continue to make payments under the existing swap agreement if it continues to be in a net pay position.
48
At September 29, 2018, property and equipment with an undepreciated cost of approximately $207 million was pledged as collateral for long-term debt. Long-term debt and Line agreements contain various restrictive covenants requiring, among other things, minimum levels of net worth and maintenance of certain financial ratios. In addition, certain loan agreements containing provisions outlining minimum tangible net worth requirements restrict the ability of the Company to pay cash dividends in excess of the current annual per share dividends paid on the Company’s Class A and Class B Common Stock. Further, the Company is prevented from paying cash dividends at any time that it is in default under the indenture governing the Notes. In addition, the terms of the indenture may restrict the ability of the Company to pay additional cash dividends based on certain financial parameters.
Components of interest costs are as follows:
|
|
|
|
|
|
|
|
|
|
|
|
|
|
2018 |
|
2017 |
|
2016 |
|||
|
Total interest costs |
|
$ |
48,707,921 |
|
$ |
48,675,895 |
|
$ |
47,807,738 |
|
Interest capitalized |
|
|
(1,138,218) |
|
|
(1,217,862) |
|
|
(1,477,434) |
|
Interest expense |
|
$ |
47,569,703 |
|
$ |
47,458,033 |
|
$ |
46,330,304 |
Maturities of long-term debt at September 29, 2018 are as follows:
|
|
|
|
|
|
Fiscal Year |
|
|
|
|
2019 |
|
$ |
14,130,664 |
|
2020 |
|
|
14,286,665 |
|
2021 |
|
|
14,453,256 |
|
2022 |
|
|
14,625,277 |
|
2023 |
|
|
714,804,840 |
|
Thereafter |
|
|
99,325,196 |
|
Less unamortized prepaid loan costs |
|
|
(6,038,125) |
|
Total |
|
$ |
865,587,773 |
8. Stockholders’ Equity
The Company has two classes of Common Stock: Class A and Class B. Class A Common Stock is traded on The NASDAQ Global Select Market under the symbol IMKTA. There is no public market for the Company’s Class B Common Stock. However, each share of Class B Common Stock is convertible at any time, at the option of the holder, into one share of Class A Common Stock. Upon any transfers of Class B Common Stock (other than to immediate family members and participants in the Investment/Profit Sharing Plan), such stock is automatically converted into Class A Common Stock.
The holders of the Class A Common Stock and Class B Common Stock are entitled to dividends and other distributions when declared out of assets legally available therefore, subject to the dividend rights of any preferred stock that may be issued in the future. Each share of Class A Common Stock is entitled to receive a cash dividend and liquidation payment in an amount equal to 110% of any cash dividend or liquidation payment on Class B Common Stock. Any stock dividend must be paid in shares of Class A Common Stock with respect to Class A Common Stock and in shares of Class B Common Stock with respect to Class B Common Stock.
The voting powers, preferences and relative rights of Class A Common Stock and Class B Common Stock are identical in all respects, except that the holders of Class A Common Stock have one vote per share and the holders of Class B Common Stock have ten votes per share. In addition, holders of Class A Common Stock, as a separate class, are entitled to elect 25% of all directors constituting the Board of Directors (rounded to the nearest whole number). As long as the Class B Common Stock represents at least 12.5% of the total outstanding Common Stock of both classes, holders of Class B Common Stock, as a separate class, are entitled to elect the remaining directors. The Company’s Articles of Incorporation and Bylaws provide that the Board of Directors can set the number of directors between five and eleven.
9. Earnings Per Common Share
The Company calculates earnings per share using the two-class method in accordance with FASB ASC Topic 260.
The two-class method of computing basic earnings per share for each period reflects the cash dividends paid per share for each class of stock, plus the amount of allocated undistributed earnings per share computed using the participation percentage which reflects the dividend rights of each class of stock. Diluted earnings per share is calculated assuming the conversion of
49
all shares of Class B Common Stock to shares of Class A Common Stock on a share-for-share basis. The tables below reconcile the numerators and denominators of basic and diluted earnings per share for current and prior periods.
|
|
|
|
|
|
|
|
|
|
|
Year Ended |
||||
|
|
|
September 29, 2018 |
||||
|
|
|
Class A |
|
Class B |
||
|
Numerator: Allocated net income |
|
|
|
|
|
|
|
Net income allocated, basic |
|
$ |
69,790,716 |
|
$ |
27,573,912 |
|
Conversion of Class B to Class A shares |
|
|
27,573,912 |
|
|
— |
|
Net income allocated, diluted |
|
$ |
97,364,628 |
|
$ |
27,573,912 |
|
|
|
|
|
|
|
|
|
Denominator: Weighted average shares outstanding |
|
|
|
|
|
|
|
Weighted average shares outstanding, basic |
|
|
14,123,182 |
|
|
6,136,594 |
|
Conversion of Class B to Class A shares |
|
|
6,136,594 |
|
|
— |
|
Weighted average shares outstanding, diluted |
|
|
20,259,776 |
|
|
6,136,594 |
|
|
|
|
|
|
|
|
|
Earnings per share |
|
|
|
|
|
|
|
Basic |
|
$ |
4.94 |
|
$ |
4.49 |
|
Diluted |
|
$ |
4.81 |
|
$ |
4.49 |
|
|
|
|
|
|
|
|
|
|
|
|
|
|
|
|
|
Year Ended |
|
Year Ended |
||||||||
|
|
|
September 30, 2017 |
|
September 24, 2016 |
||||||||
|
|
|
Class A |
|
Class B |
|
Class A |
|
Class B |
||||
|
Numerator: Allocated net income |
|
|
|
|
|
|
|
|
|
|
|
|
|
Net income allocated, basic |
|
$ |
38,393,384 |
|
$ |
15,480,196 |
|
$ |
38,380,304 |
|
$ |
15,809,162 |
|
Conversion of Class B to Class A shares |
|
|
15,480,196 |
|
|
— |
|
|
15,809,162 |
|
|
— |
|
Net income allocated, diluted |
|
$ |
53,873,580 |
|
$ |
15,480,196 |
|
$ |
54,189,466 |
|
$ |
15,809,162 |
|
|
|
|
|
|
|
|
|
|
|
|
|
|
|
Denominator: Weighted average shares outstanding |
|
|
|
|
|
|
|
|
|
|
|
|
|
Weighted average shares outstanding, basic |
|
|
14,039,125 |
|
|
6,220,651 |
|
|
13,943,299 |
|
|
6,316,477 |
|
Conversion of Class B to Class A shares |
|
|
6,220,651 |
|
|
— |
|
|
6,316,477 |
|
|
— |
|
Weighted average shares outstanding, diluted |
|
|
20,259,776 |
|
|
6,220,651 |
|
|
20,259,776 |
|
|
6,316,477 |
|
|
|
|
|
|
|
|
|
|
|
|
|
|
|
Earnings per share |
|
|
|
|
|
|
|
|
|
|
|
|
|
Basic |
|
$ |
2.74 |
|
$ |
2.49 |
|
$ |
2.75 |
|
$ |
2.50 |
|
Diluted |
|
$ |
2.66 |
|
$ |
2.49 |
|
$ |
2.68 |
|
$ |
2.50 |
10. Employee Benefit Plans
Investment/Profit Sharing Plan - The purpose of the qualified investment/profit sharing plan is to provide retirement benefits to eligible employees. Assets of the plan, including the Company’s Class B Common Stock, are held in trust for employees and distributed upon retirement, death, disability or termination of employment. Company contributions are discretionary and are determined quarterly by the Board of Directors. The plan includes a 401(k) feature. Company contributions to the plan, included in operating and administrative expenses, were approximately $2.8 million, $2.4 million and $1.8 million for fiscal years 2018, 2017 and 2016, respectively.
Nonqualified Investment Plan - The purpose of the Executive Nonqualified Excess Plan is to provide benefits similar to the Company’s Investment/Profit Sharing Plan to certain of the Company’s management employees who are otherwise subject to limited participation in the 401(k) feature of the Company’s Investment/Profit Sharing Plan. Company contributions to the plan, included in operating and administrative expenses, were approximately $215,000, $159,000 and $110,000 for fiscal years 2018, 2017 and 2016, respectively.
Cash Bonuses - The Company pays monthly bonuses to various managerial personnel based on performance of the operating units managed by these personnel. The Company pays discretionary annual bonuses to certain employees who do not receive monthly performance bonuses. The Company pays discretionary bonuses to certain executive officers based on Company performance. Operating and administrative expenses include bonuses of approximately $11.9 million, $10.6 million and $10.6 million for fiscal years 2018, 2017 and 2016, respectively.
50
Medical Care Plan - Medical and dental benefits are provided to qualified employees under a self-insured plan. Expenses under the plan include claims paid, administrative expenses and an estimated liability for claims incurred but not yet paid.
11. Segment Information
The Company operates one primary business segment, retail grocery sales (representing the aggregation of individual retail stores). “Other” includes the Company’s remaining operations -- fluid dairy and shopping center rentals. Information about the Company’s operations by lines of business (amounts in thousands) is as follows:
|
|
|
|
|
|
|
|
|
|
|
|
|
|
2018 |
|
2017 |
|
2016 |
|||
|
Revenues from unaffiliated customers: |
|
|
|
|
|
|
|
|
|
|
Grocery |
|
$ |
1,413,088 |
|
$ |
1,424,891 |
|
$ |
1,392,311 |
|
Non-foods |
|
|
874,677 |
|
|
858,409 |
|
|
817,161 |
|
Perishables |
|
|
1,078,693 |
|
|
1,061,560 |
|
|
1,011,749 |
|
Gasoline |
|
|
604,897 |
|
|
515,857 |
|
|
435,578 |
|
Total retail |
|
|
3,971,355 |
|
|
3,860,717 |
|
|
3,656,799 |
|
Other |
|
|
121,450 |
|
|
141,983 |
|
|
138,178 |
|
Total revenues from unaffiliated customers |
|
$ |
4,092,805 |
|
$ |
4,002,700 |
|
$ |
3,794,977 |
|
|
|
|
|
|
|
|
|
|
|
|
Income before income taxes: |
|
|
|
|
|
|
|
|
|
|
Retail |
|
$ |
111,165 |
|
$ |
112,017 |
|
$ |
112,906 |
|
Other |
|
|
13,659 |
|
|
15,896 |
|
|
15,696 |
|
Total income from operations |
|
|
124,824 |
|
|
127,913 |
|
|
128,602 |
|
Other income, net |
|
|
3,065 |
|
|
3,807 |
|
|
2,362 |
|
Interest expense |
|
|
47,570 |
|
|
47,458 |
|
|
46,330 |
|
Income before income taxes |
|
$ |
80,319 |
|
$ |
84,262 |
|
$ |
84,634 |
|
|
|
|
|
|
|
|
|
|
|
|
Assets: |
|
|
|
|
|
|
|
|
|
|
Retail |
|
$ |
1,679,301 |
|
$ |
1,600,699 |
|
$ |
1,555,319 |
|
Other |
|
|
147,988 |
|
|
135,076 |
|
|
133,574 |
|
Elimination of intercompany receivable |
|
|
(2,378) |
|
|
(2,469) |
|
|
(2,415) |
|
Total assets |
|
$ |
1,824,911 |
|
$ |
1,733,306 |
|
$ |
1,686,478 |
|
|
|
|
|
|
|
|
|
|
|
|
Capital expenditures: |
|
|
|
|
|
|
|
|
|
|
Retail |
|
$ |
147,851 |
|
$ |
125,866 |
|
$ |
134,732 |
|
Other |
|
|
2,636 |
|
|
1,830 |
|
|
2,910 |
|
Total capital expenditures |
|
$ |
150,487 |
|
$ |
127,696 |
|
$ |
137,642 |
|
|
|
|
|
|
|
|
|
|
|
|
Depreciation and amortization: |
|
|
|
|
|
|
|
|
|
|
Retail |
|
$ |
105,564 |
|
$ |
103,304 |
|
$ |
99,322 |
|
Other |
|
|
7,519 |
|
|
7,625 |
|
|
7,266 |
|
Total depreciation and amortization |
|
$ |
113,083 |
|
$ |
110,929 |
|
$ |
106,588 |
The grocery category includes grocery, dairy, and frozen foods.
The non-foods category includes alcoholic beverages, tobacco, pharmacy, health and video.
The perishable category includes meat, produce, deli and bakery.
The fluid dairy operation, included in “Other”, had $41.1 million, $45.9 million and $43.2 million in sales to the grocery sales segment in fiscal 2018, 2017 and 2016, respectively. These sales were eliminated in consolidation.
51
12. Selected Quarterly Financial Data (Unaudited)
The following is a summary of unaudited financial data regarding the Company’s quarterly results of operations. Each of the quarters in the two fiscal years presented contains thirteen weeks, except for the fourth quarter of fiscal 2017 which contained fourteen weeks.
|
|
|
|
|
|
|
|
|
|
|
|
|
|
|
|
|
|
|
|
|
|
|
|
|
|
|
|
|
|
|
|
|
|
|
|
|
1st |
|
2nd |
|
3rd |
|
4th |
|
|
|
||||
|
|
|
Quarter |
|
Quarter |
|
Quarter |
|
Quarter |
|
Total |
|||||
|
|
|
(amounts in thousands except earnings per common share) |
|||||||||||||
|
2018 |
|
|
|
|
|
|
|
|
|
|
|
|
|
|
|
|
Net sales |
|
$ |
1,013,786 |
|
$ |
984,562 |
|
$ |
1,034,769 |
|
$ |
1,059,688 |
|
$ |
4,092,805 |
|
Gross profit |
|
|
244,660 |
|
|
235,188 |
|
|
243,891 |
|
|
256,430 |
|
|
980,169 |
|
Net income |
|
|
45,147 | (1) |
|
9,295 |
|
|
24,484 | (2) |
|
18,439 |
|
|
97,365 |
|
Basic earnings per common share |
|
|
|
|
|
|
|
|
|
|
|
|
|
|
|
|
Class A |
|
|
2.29 |
|
|
0.47 |
|
|
1.24 |
|
|
0.94 |
|
|
4.94 |
|
Class B |
|
|
2.08 |
|
|
0.43 |
|
|
1.13 |
|
|
0.85 |
|
|
4.49 |
|
Diluted earnings per common share |
|
|
|
|
|
|
|
|
|
|
|
|
|
|
|
|
Class A |
|
|
2.23 |
|
|
0.46 |
|
|
1.21 |
|
|
0.91 |
|
|
4.81 |
|
Class B |
|
|
2.08 |
|
|
0.43 |
|
|
1.13 |
|
|
0.85 |
|
|
4.49 |
|
|
|
|
|
|
|
|
|
|
|
|
|
|
|
|
|
|
2017 |
|
|
|
|
|
|
|
|
|
|
|
|
|
|
|
|
Net sales |
|
$ |
982,758 |
|
$ |
946,152 |
|
$ |
984,398 |
|
$ |
1,089,392 |
|
$ |
4,002,700 |
|
Gross profit |
|
|
237,084 |
|
|
228,085 |
|
|
237,134 |
|
|
261,290 |
|
|
963,593 |
|
Net income |
|
|
13,824 |
|
|
9,151 |
|
|
11,527 |
|
|
19,372 |
|
|
53,874 |
|
Basic earnings per common share |
|
|
|
|
|
|
|
|
|
|
|
|
|
|
|
|
Class A |
|
|
0.70 |
|
|
0.47 |
|
|
0.58 |
|
|
0.99 |
|
|
2.74 |
|
Class B |
|
|
0.64 |
|
|
0.42 |
|
|
0.53 |
|
|
0.90 |
|
|
2.49 |
|
Diluted earnings per common share |
|
|
|
|
|
|
|
|
|
|
|
|
|
|
|
|
Class A |
|
|
0.68 |
|
|
0.45 |
|
|
0.57 |
|
|
0.96 |
|
|
2.66 |
|
Class B |
|
|
0.64 |
|
|
0.42 |
|
|
0.53 |
|
|
0.90 |
|
|
2.49 |
|
|
|||||||||||||||
(1) Includes $26.7 million income tax benefit from the Tax Act.
(2) Includes $10.6 million income tax benefit from the Tax Act.
13. Commitments and Contingencies
Various legal proceedings and claims arising in the ordinary course of business are pending against the Company. In the opinion of management, the ultimate liability, if any, from all pending legal proceedings and claims will not materially affect the Company’s financial position or the results of its operations.
Construction commitments at September 29, 2018 totaled $12.6 million. The Company expects these commitments to be fulfilled during fiscal year 2019.
14. Fair Values of Financial Instruments
The following methods and assumptions were used by the Company in estimating its fair value disclosures for financial instruments:
Cash and cash equivalents: The carrying amounts reported in the Consolidated Balance Sheets for cash and cash equivalents approximate their fair values.
Receivables: The carrying amounts reported in the Consolidated Balance Sheets for receivables approximate their fair values.
52
The fair value of the Company’s debt is estimated using valuation techniques under the accounting guidance related to fair value measurements based on observable and unobservable inputs. Observable inputs reflect readily available data from independent sources, while unobservable inputs reflect the Company’s market assumptions. These inputs are classified into the following hierarchy:
|
Level 1 Inputs - |
Quoted prices for identical assets or liabilities in active markets. |
|
|
|
|
Level 2 Inputs - |
Quoted prices for similar assets or liabilities in active markets; quoted prices for identical or similar assets or liabilities in markets that are not active; and model-derived valuations whose inputs are observable or whose significant value drivers are observable. |
|
|
|
|
Level 3 Inputs - |
Pricing inputs are unobservable for the assets or liabilities and include situations where there is little, if any, market activity for the assets or liabilities. The inputs into the determination of fair value require significant management judgment or estimation. |
The carrying amount and fair value of the Company’s debt at September 29, 2018 is as follows (in thousands):
|
|
|
|
|
|
|
|
|
|
|
|
|
Carrying |
|
|
|
|
|
|
|
|
|
Amount |
|
Fair Value |
|
Fair Value Measurements |
||
|
Senior Notes |
|
$ |
700,000 |
|
$ |
710,500 |
|
Level 2 |
|
Facility Bonds |
|
|
77,090 |
|
|
77,090 |
|
Level 2 |
|
Secured notes payable and other |
|
|
88,498 |
|
|
88,498 |
|
Level 2 |
|
Total debt |
|
$ |
865,588 |
|
$ |
876,088 |
|
|
The fair values for Level 2 measurements were determined primarily using market yields and taking into consideration the underlying terms of the debt. The fair value of the interest rate swap is not significant.
15. Cash Flow Information
Supplemental disclosure of cash flow information is as follows:
|
|
|
|
|
|
|
|
|
|
|
|
|
|
|
|
|
|
|
|
|
|
|
|
|
2018 |
|
2017 |
|
2016 |
|||
|
Cash paid during the year for: |
|
|
|
|
|
|
|
|
|
|
Interest (net of amounts capitalized) |
|
$ |
47,347,470 |
|
$ |
46,689,266 |
|
$ |
46,547,381 |
|
Income taxes |
|
|
13,672,964 |
|
|
28,415,489 |
|
|
20,209,281 |
|
Non cash items: |
|
|
|
|
|
|
|
|
|
|
Property and equipment additions included in accounts payable |
|
|
8,161,384 |
|
|
7,213,949 |
|
|
7,197,684 |
16. Related Party Transactions
The Company will from time to time make short-term non-interest bearing loans to the Company’s Investment/Profit Sharing Plan to allow the plan to meet distribution obligations during a time when the plan was prohibited from selling shares of the Company’s Class A common stock. There were no such loans outstanding at September 29, 2018 and September 30, 2017.
17. Subsequent Events
In accordance with FASB ASC Topic 855, the Company evaluated events occurring between the end of its most recent fiscal year and the date the financial statements were filed with the SEC.
53
SCHEDULE II
INGLES MARKETS, INCORPORATED AND SUBSIDIARIES
SUPPLEMENTAL SCHEDULE OF VALUATION AND QUALIFYING ACCOUNTS
|
|
|
|
|
|
|
|
|
|
|
|
|
|
|
|
|
|
|
|
|
|
|
|
|
|
|
|
|
|
|
BALANCE AT |
|
CHARGED TO |
|
|
|
|
BALANCE |
|||
|
|
|
BEGINNING OF |
|
COSTS AND |
|
|
|
|
AT END |
|||
|
DESCRIPTION |
|
YEAR |
|
EXPENSES |
|
DEDUCTIONS (1) |
|
OF YEAR |
||||
|
Fiscal year ended September 29, 2018: |
|
|
|
|
|
|
|
|
|
|
|
|
|
Deducted from asset accounts: |
|
|
|
|
|
|
|
|
|
|
|
|
|
Allowance for doubtful accounts |
|
$ |
305,580 |
|
$ |
269,736 |
|
$ |
141,961 |
|
$ |
433,355 |
|
|
|
|
|
|
|
|
|
|
|
|
|
|
|
Fiscal year ended September 30, 2017: |
|
|
|
|
|
|
|
|
|
|
|
|
|
Deducted from asset accounts: |
|
|
|
|
|
|
|
|
|
|
|
|
|
Allowance for doubtful accounts |
|
$ |
358,293 |
|
$ |
172,846 |
|
$ |
225,559 |
|
$ |
305,580 |
|
|
|
|
|
|
|
|
|
|
|
|
|
|
|
Fiscal year ended September 24, 2016: |
|
|
|
|
|
|
|
|
|
|
|
|
|
Deducted from asset accounts: |
|
|
|
|
|
|
|
|
|
|
|
|
|
Allowance for doubtful accounts |
|
$ |
400,248 |
|
$ |
— |
|
$ |
41,955 |
|
$ |
358,293 |
(1)Uncollectible accounts written off, net of recoveries.
54
SIGNATURES
Pursuant to the requirements of Section 13 or 15(d) of the Securities Exchange Act of 1934, the Registrant has duly caused this report to be signed on its behalf by the undersigned, thereunto duly authorized.
|
|
|
|
|
||||
|
|
|
INGLES MARKETS, INCORPORATED |
|||||
|
|
|||||||
|
|
|
By: |
/s/ James W. Lanning |
||||
|
|
|
James W. Lanning Chief Executive Officer, President and Chief Operating Officer |
|||||
|
|
|||||||
|
|
|
Date: December 7, 2018 |
|||||
Pursuant to the requirements of the Securities Exchange Act of 1934, this report has been signed below by the following persons on behalf of the Registrant and in the capacities and on the dates indicated:
|
|
|
|
|
|
||
|
/s/ Robert P. Ingle, II
Robert P. Ingle, II, Chairman and Director |
|
December 7, 2018 |
|
|
||
|
/s/ James W. Lanning
James W. Lanning, CEO, President, Chief Operating Officer and Director |
|
December 7, 2018 |
|
|
||
|
/s/ Ronald B. Freeman
Ronald B. Freeman, CPA, Vice |
|
December 7, 2018 |
|
|
||
|
/s/ Patricia E. Jackson
Patricia E. Jackson, CPA, Secretary and Controller |
|
December 7, 2018 |
|
|
||
|
/s/ John R. Lowden |
December 7, 2018 |
|
|
John R. Lowden, Director |
|
|
|
|
||
|
/s/ Fred D. Ayers |
December 7, 2018 |
|
|
Fred D. Ayers, Director |
|
|
|
|
||
|
/s/ Laura Sharp |
December 7, 2018 |
|
|
Laura Sharp, Director |
||
|
|
||
|
/s/ Brenda S. Tudor |
December 7, 2018 |
|
|
Brenda S. Tudor, Director |
|
|
|
|
||
|
/s/ Ernest E. Ferguson |
December 7, 2018 |
|
|
Ernest E. Ferguson, Director |
|
|
55