Attached files
| file | filename |
|---|---|
| EX-99.3 - EXHIBIT 99.3 - Marker Therapeutics, Inc. | tv508388_ex99-3.htm |
| EX-99.2 - EXHIBIT 99.2 - Marker Therapeutics, Inc. | tv508388_ex99-2.htm |
| 8-K - FORM 8-K - Marker Therapeutics, Inc. | tv508388_8k.htm |
Exhibit 99.1

Safety and efficacy of multi - TAA - T cells for Myeloma Premal Lulla , Ifigeneia Tzannou , George Carrum , Carlos A . Ramos, Rammurti Kamble , Mrinalini Bilgi , Adrian P . Gee Shivani Mukhi , Betty Chung, Ayumi Watanabe, Manik Kuvalekar , Bambi Grilley , Malcolm K . Brenner, Helen E . Heslop , Juan F . Vera and Ann M . Leen

Therapy Problems Dexamethasone Infections, osteoporosis Melphalan Immunosuppression, second cancers Thalidomide Neuropathy , Clots, anemia Lenalidomide Clots, anemia, second cancers Bortezomib Neuropathy, viral infections ASCT Immunosuppression, infections Problems with myeloma therapy New therapies needed

MultiTAA T cells MultiTAA T cell therapy for MM MAGEA4 PRAME Survivin NYESO1 SSX2

• Simultaneously target multiple TAAs • Target multiple epitopes (CD4 and CD8) within each antigen • T cells with native T cell receptor specificity (non - engineered) Our approach
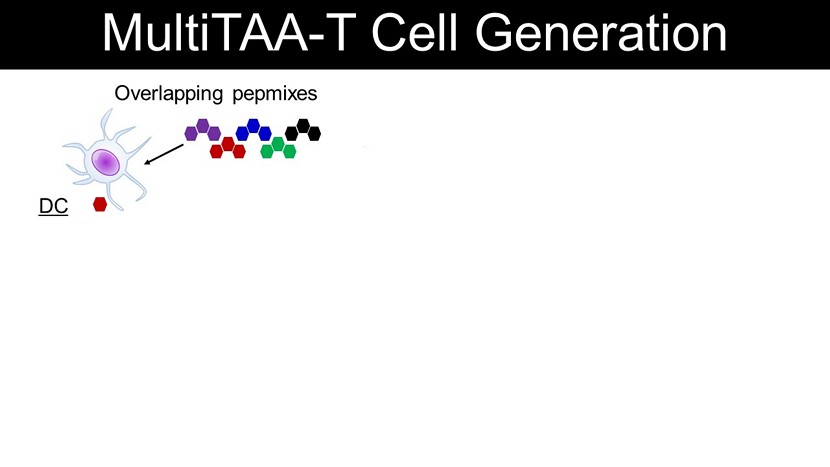
MultiTAA - T Cell Generation Activation DC Overlapping pepmixes PBMCs MultiTAA T cells Expansion

n=20 0% 20% 40% 60% 80% 100% CD3+ CD4+ CD8+ DR+/ CD83+ Profile of MultiTAA - T cells RO+/ 62L+ RO+/ 62L - -10% 0% 10% 20% 30% 40% 50% % Positive cells Phenotype Safety % Specific lysis

1 10 100 1000 MultiTAA T cell specificity/ polyclonality SFC/2x10 5 PRAME NYESO1 SSX2 MA4 Survivin 1 10 100 1000 10000 100000 # of clones mean = 4,597 clones n=10 Clonal diversity (v deep sequencing)

Clinical trial design - Dose escalation (ARM A and B) PRAME/SSX/MAGE/NYESO1/ Survivin - specific T cells : 2 - 4 pts at each level, 2 infusions 14 days apart Dose Level 1 : Day 0 and 14: 5x10 6 cells/m 2 Dose Level 2 : Day 0 and 14: 1x10 7 cells/m 2 Dose Level 3 : Day 0 and 14: 2x10 7 cells/m 2

• Any patient > 18 yrs with myeloma diagnosis (post completion of at least 1 treatment regimen) Group A: >90 days post autologous or syngeneic transplant Group B: <90 days post autologous or syngeneic transplant Clinical Trial - Eligibility • No lymphodepletion Group B: <90 days post autologous or syngeneic transplant Group A: >90 days post autologous or syngeneic transplant

ID Age/G Disease DL Prior Treatments 1 53/M IgG - kappa 1 Bor / Dex ASCT 6 61/M IgG - kappa 1 RVD ASCT 7 44/M IgG - kappa 1 CyBorD ASCT 14 47/M IgG - kappa 2 RVD ASCT 3* 65/F IgG - kappa 1 RVD ASCT CyBorD Carf /D ASCT 13 31/F IgG - kappa 2 VD 10 69/F IgG - kappa 2 VD ASCT R Pom / Carf /D 15 70/M IgA - kappa 3 RVD ASCT R - vidaza Pom /D ibrutinib / Carf dinaciclib /VD CyBorD Daratumumab RD - Elot Ixa /RD 2* 40/M Free lambda 2 RVD ASCT Pom / Carf / D ASCT mTAA T cells 18 50/F Free Kappa 3 VD ASCT Dara/VD XRT ASCT 20 57/M IgG - lambda 3 RVD ASCT R VD Pom /D KPD ASCT Ixa Dara/D Group A: Patients Enrolled

ID Age/G Disease Marrow Prior Treatments 1 53/M Active 10% Bor / Dex ASCT 6 61/M In remission 0% RVD ASCT 7 44/M In remission 0% CyBorD ASCT 14 47/M Active 0% (MRD+) RVD ASCT 3* 65/F Active 90% RVD ASCT CyBorD Carf /D ASCT 13 31/F Active 4% VD 10 69/F Active 10% VD ASCT R Pom / Carf /D 15 70/M Active 80% RVD ASCT R - vidaza Pom /D ibrutinib / Carf dinaciclib /VD CyBorD Daratumumab RD - Elot Ixa /RD 2* 40/M Active 15% RVD ASCT Pom / Carf / D ASCT mTAA T cells 18 50/F In remission 0% VD ASCT Dara/VD XRT ASCT 20 57/M Active 5% RVD ASCT R VD Pom /D KPD ASCT Ixa Dara/D Group A: Patients Infused

ID Age/G Disease DL Prior Treatments 2 40/M Free lambda 1 RVD ASCT Pom / Carf /D ASCT 3 65/F IgG - kappa 1 RVD ASCT CyBorD Carf /D ASCT 5 76/M IgG - kappa 1 CyBorD ASCT 8 57/M IgA - kappa 2 VTD ASCT Rd Cy/ Carf /D ASCT 9 50/F IgG - kappa 2 RVD ASCT 11 53/M IgG - lambda 2 VD RVD ASCT 12 54/M Free lambda 2 RVD/rituximab Rd ASCT 17 44/F IgG - kappa 3 VRD KD ASCT 19 70/M Free kappa 3 XRT VD ASCT R VD KPD ASCT Group B: Patients Enrolled

ID Age/G Disease Marrow Prior Treatments 2 40/M Active 20% RVD ASCT Pom / Carf /D ASCT 3 65/F Active 15% RVD ASCT CyBorD Carf /D ASCT 5 76/M Active 20% CyBorD ASCT 8 57/M In remission 0% VTD ASCT Rd Cy/ Carf /D ASCT 9 50/F In remission 0% RVD ASCT 11 53/M In remission 0% VD RVD ASCT 12 54/M In remission 0% RVD/rituximab Rd ASCT 17 44/F Active 0% (MRD+) VRD KD ASCT 19 70/M In remission 0% XRT VD ASCT R VD KPD ASCT Group B: Patients Infused

Active Disease: Clinical Outcomes ID Age/G Disease Marrow Week 6 Wk 6 Mo12 1 53/M Active 10% Unknown SD PR 14 47/M Active 0% (MRD+) 0% (MRD+) SD SD 3* 65/F Active 90% 85% SD PD (2m) 13 31/F Active 4% 0% SD SD 10 69/F Active 10% 10% SD PD (7m) 15 70/M Active 80% 80% SD PD (3m) 2* 40/M Active 15% 15% SD SD (3m) 2* 40/M Active 20% 0% CR CR 3* 65/F Active 15% 10% SD PD (6m) 5 76/M Active 20% 15% SD PR 17 45/F Active 0% (0.4 g/dl) 0% (0.2 g/dl) PR PR (6m) 20 57/M Active 5% (0.97 g/dl) 3% (0.53 g/dl) SD SD (3m)

In remission: Clinical Outcomes Only one patient has relapsed at a median f/u of 21 months ID Age/G Disease Marrow Week 6 Wk 6 Mo12 8 57/M In remission 0% 0% CCR CCR 9 50/F In remission 0% 0% CCR CCR 11 53/M In remission 0% 0% CCR Relapse (7m) 12 54/M In remission 0% 0% CCR CCR 6 61/M In remission 0% 0% CCR CCR 7 44/M In remission 0% 0% CCR CCR 19 70/M In remission 0% 0% CCR CCR (6m) 18 50/F In remission 0% 0% CCR CCR (8m)

Correlating clinical benefit with infused multiTAA T cells

How can we track non - gene - modified multiTAA T cells in vivo? Rationale: • In PBMCs (pre - infusion) tumor - specific T cell frequency v. low • below TCR v deep sequencing detection threshold (1/100,000) • Tumor - directed clones enriched in multiTAA T cells • Detectable by v deep sequencing Approach: • Deep sequencing of pre - infusion PBMCs and multiTAA T cells • Identify v sequences unique to the line infused • Enable in vivo tracking

How many “trackable” clones are present in our multiTAA T cells? 0 20 40 60 80 100 % unique clones 1 10 100 1000 10000 100000 # of clones mean = 4,597 clones n=10 Clonal diversity in multiTAA T cells Unique clones 59% 95% Avg = 80% Pt#2
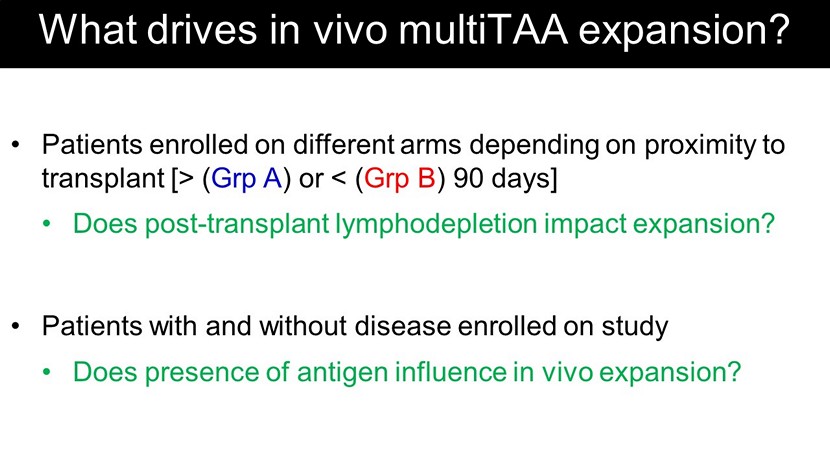
• Patients enrolled on different arms depending on proximity to transplant [> ( Grp A ) or < ( Grp B ) 90 days] • Does post - transplant lymphodepletion impact expansion? What drives in vivo multiTAA expansion? • Patients with and without disease enrolled on study • Does presence of antigen influence in vivo expansion?

0 0.2 0.4 0.6 0.8 1 1.2 Pre Early Late Antigen drives multiTAA expansion – TCR tracking 0 0.2 0.4 0.6 0.8 1 1.2 1 Production frequency Peripheral blood Marrow Post infusion Production frequency Post infusion Active disease No disease

0 10 20 30 40 50 60 70 80 Preinf Week 6 Mo 6 Mo 12 Antigen drives multiTAA expansion – ELIspot Active disease No disease SFC/5x10 5 PBMCs Peripheral blood pre wk6 mo6 mo12 0 20 40 60 Pre wk6 mo6 mo12 0 20 40 60 pre wk6 mo6 mo12 Active disease No disease Survivin NYESO1 MAGEA4 SSX2 PRAME SFC/5x10 5 PBMCs

T cell kinetics in responders
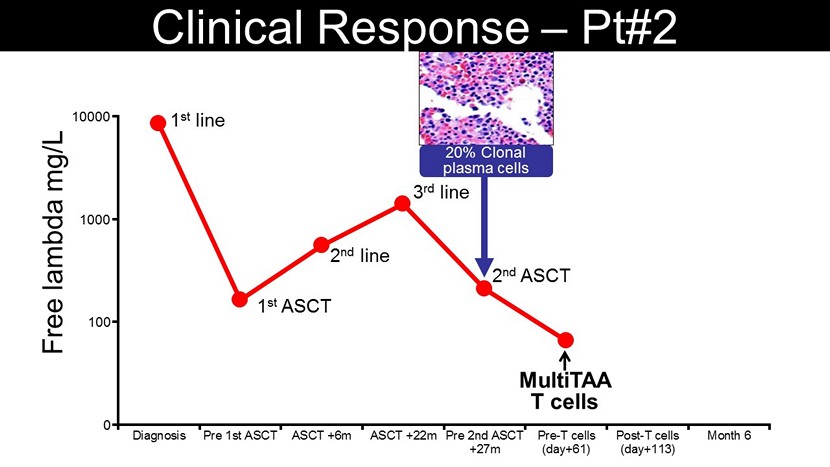
Clinical Response – Pt#2 20% Clonal plasma cells Diagnosis Pre 1st ASCT ASCT +6m ASCT +22m Pre 2nd ASCT +27m Pre-T cells (day+61) Post-T cells (day+113) Month 6 2 nd line 2 nd ASCT 1 st line 1 st ASCT 3 rd line 100 1000 10000 0 MultiTAA T cells Free lambda mg/L
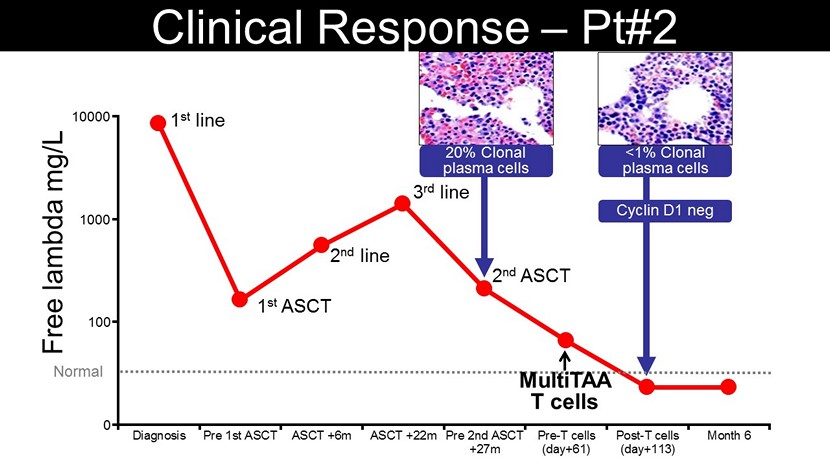
Clinical Response – Pt#2 <1% Clonal plasma cells Cyclin D1 neg 20% Clonal plasma cells Diagnosis Pre 1st ASCT ASCT +6m ASCT +22m Pre 2nd ASCT +27m Pre-T cells (day+61) Post-T cells (day+113) Month 6 2 nd line 2 nd ASCT 1 st line 1 st ASCT 3 rd line 100 1000 10000 0 Normal MultiTAA T cells Free lambda mg/L

0 50 100 150 200 250 300 Pre Wk4 Wk6 Mo3 SFC/5x10 5 60 120 180 0 6 Wk Post SFC/5x10 5 MAGE A4 SSX2 Survivin NYESO - 1 PRAME Targeted antigens PBMC Marrow Clinical Response – Pt#2 MAGE A4 SSX2 Survivin NYESO - 1 PRAME
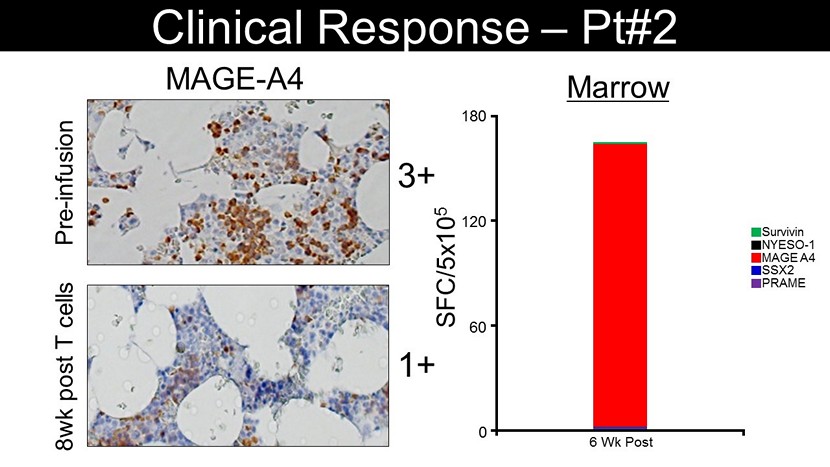
60 120 180 0 6 Wk Post SFC/5x10 5 MAGE A4 SSX2 Survivin NYESO - 1 PRAME Marrow Clinical Response – Pt#2 MAGE - A4 3+ Pre - infusion 1+ 8wk post T cells

Targeted antigens SFC/5x10 5 0 50 100 150 200 250 300 Pre Wk4 Wk6 Mo3 60 120 180 0 6 Wk Post MAGE A4 SSX2 Survivin NYESO - 1 PRAME MAGE A4 SSX2 Survivin NYESO - 1 PRAME SFC/5x10 5 PBMC Marrow In vivo T cell tracking – Pt#2 0 0.1 0.2 0.3 0.4 0.5 Pre Wk4 Mo6 % Production Frequency 0 0.1 0.2 0.3 Wk 6 Post % Production Frequency 0 0.1 0.2 0.3 0.4 0.5 Pre Wk4 Mo6 multiTAA - derived clones multiTAA - derived clones

Immune escape post multiTAA T cells

0 1 2 3 4 5 6 7 8 Diagnosis 1st line PD+3y Pre 1st HSCT HSCT +2y Pre 2nd HSCT Pre - T cells (d+47) Post - T cells (d+89) IgG kappa M - spike (g/dl) Clinical Course - Pt#3 2 nd line 3 rd line 1 st HSCT 2 nd HSCT 1 st line MultiTAA T cells 15% Clonal plasma cells

0 1 2 3 4 5 6 7 8 Diagnosis 1st line PD+3y Pre 1st HSCT HSCT +2y Pre 2nd HSCT Pre - T cells (d+47) Post - T cells (d+89) IgG kappa M - spike (g/dl) Clinical Course - Pt#3 2 nd line 3 rd line 1 st HSCT 2 nd HSCT 1 st line 15% Clonal plasma cells 10% Clonal plasma cells MultiTAA T cells
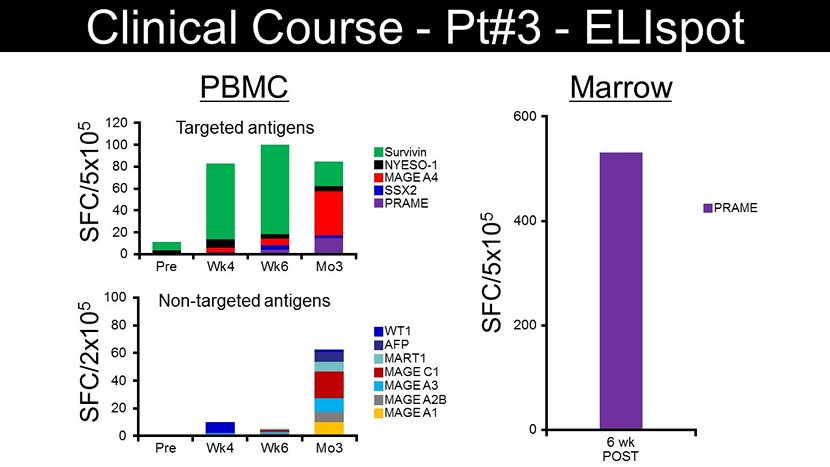
0 20 40 60 80 100 Pre Wk4 Wk6 Mo3 SFC/2x10 5 MART1 MAGE C1 WT1 AFP MAGE A3 MAGE A2B MAGE A1 Non - targeted antigens 0 20 40 60 80 100 120 Pre Wk4 Wk6 Mo3 SFC/5x10 5 MAGE A4 SSX2 Survivin NYESO - 1 PRAME Targeted antigens PBMC SFC/5x10 5 PRAME Marrow 0 200 400 600 6 wk POST Clinical Course - Pt#3 - ELIspot
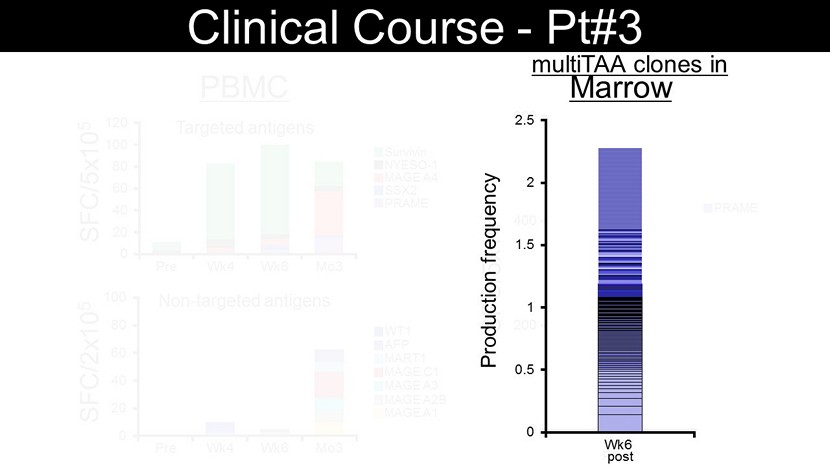
0 20 40 60 80 100 Pre Wk4 Wk6 Mo3 SFC/2x10 5 MART1 MAGE C1 WT1 AFP MAGE A3 MAGE A2B MAGE A1 Non - targeted antigens 0 20 40 60 80 100 120 Pre Wk4 Wk6 Mo3 SFC/5x10 5 MAGE A4 SSX2 Survivin NYESO - 1 PRAME Targeted antigens PBMC SFC/5x10 5 PRAME Marrow 0 200 400 600 6 wk POST Clinical Course - Pt#3 multiTAA clones in 0 0.5 1 1.5 2 2.5 Wk6 Production frequency post

0 1 2 3 4 5 6 7 8 Diagnosis 1st line PD+3y Pre 1st HSCT HSCT +2y Pre 2nd HSCT Pre - T cells (d+47) Post - T cells (d+89) Month 6 Month 8 Clinical Course - Pt#3 2 nd line 3 rd line 1 st HSCT 2 nd HSCT 1 st line MultiTAA T cells 10% Clonal plasma cells 15% Clonal plasma cells IgG kappa M - spike (g/dl)

0 1 2 3 4 5 6 7 8 Diagnosis 1st line PD+3y Pre 1st HSCT HSCT +2y Pre 2nd HSCT Pre - T cells (d+47) Post - T cells (d+89) Month 6 Month 8 Clinical Course - Pt#3 2 nd line 3 rd line 1 st HSCT 2 nd HSCT 1 st line 90% Clonal plasma cells 10% Clonal plasma cells 15% Clonal plasma cells IgG kappa M - spike (g/dl) MultiTAA T cells

0 20 40 60 80 100 Pre Wk4 Wk6 Mo3 Mo6 SFC/2x10 5 MART1 MAGE C1 WT1 AFP MAGE A3 MAGE A2B MAGE A1 Non - targeted antigens 0 20 40 60 80 100 120 Pre Wk4 Wk6 Mo3 Mo6 SFC/5x10 5 MAGE A4 SSX2 Survivin NYESO - 1 PRAME Targeted antigens PBMC 6 mo POST SFC/5x10 5 Marrow 0 200 400 600 6 wk POST MAGE A4 SSX2 Survivin NYESO - 1 PRAME Clinical Course - Pt#3

Pre Wk8 mth6 50 40 30 20 10 0 Pre Wk8 mth6 80 60 40 20 0 SFC/5x10 5 Pre Wk8 mth6 20 0 15 10 5 Pre Wk8 mth6 100 80 60 40 20 0 2 1 0 IHC Score MAGE - A4 2+ PRAME 2+ Survivin 1+ NYESO1 neg Pre Mechanism of Escape

Pre Wk8 mth6 SFC/5x10 5 100 80 60 40 20 0 Pre Wk8 mth6 50 40 30 20 10 0 2 1 0 Pre Wk8 mth6 80 60 40 20 0 Pre Wk8 mth6 20 0 15 10 5 IHC Score MAGE - A4 2+ PRAME 2+ Survivin 1+ NYESO1 neg Pre Mechanism of Escape

Pre Wk8 mth6 SFC/5x10 5 100 80 60 40 20 0 Pre Wk8 mth6 50 40 30 20 10 0 2 1 0 Pre Wk8 mth6 80 60 40 20 0 Pre Wk8 mth6 20 0 15 10 5 IHC Score 0 20 40 60 80 100 120 Pre Wk4 Wk6 Mo3 Mo6 SFC/5x10 5 MAGE A4 SSX2 Survivin NYESO - 1 PRAME Targeted antigens MAGE - A4 PRAME Survivin NYESO1 Mechanism of Escape

variable genes (n=1,828) MS4A1 IL1B CD86 CTLA4 LAG3 Pre wk6 mo3 mo6 IL6 PD1 SD mo3 MM cell proliferation (n=407) Fulciniti M et al, Blood Cancer J, 2016 Mitchell JS et al, Nat commun , 2016 Mechanism of Escape Pre wk6 mo3 mo6 SD PD SD PD Immune activating genes Immune inhibitory genes PD mo6 Linghua Wang, David Wheeler HGSC - BCM

• Safe to date (DL3 – Arm A & B) • Feasible • In vivo expansion of tumor - specific T cells directed to target antigens • Antigen spreading • Clinical benefit MultiTAA T cells for myeloma

TRL Lab PIs Helen Heslop Cliona Rooney Malcolm Brenner Juan Vera Ann Leen QA/QC Laboratory Adrian Gee Sara Richman Natasha Lapteva Debbie Lyon April Durett Suzanne Poole Zhuyong Mei Crystal Silva - Lentz GMP Laboratory Huimin Zhang Birju Mehta Funding : Leukemia Texas Reseach grant, Leukemia and Lymphoma SCOR , ASBMT New Investigator Award, ASH Scholar Award , Ruth L . Kirschstein National Research (NIH), BCM Junior Faculty Seed Funding Award, TACCT - CPRIT, EPCRS - DLDCC, LLS/Rising Tide TRL Laboratory Ifigeneia Tzannou Shivani Mukhi Aster Workineh Manik Kuvalekar Sujita Sukumaran Ayumi Watanabe Pradip Bajgain Norihiro Watanabe Ulrike Gerdemann Anastasia Papadopoulou Collaborators David Wheeler Linghua Wang Adaptive Biotech. Marie Gingras Betty Chung Art Zieske Clinical Team Robert Krance George Carrum Ram Kamble Swati Naik Carlos Ramos Stephen Gottschalk Clinical Research Bambi Grilley Bridget Medina Hao Liu Munu Bilgi Catherine Robertson Elicia Casteneda Acknowledgements