Attached files
| file | filename |
|---|---|
| EX-31.4 - EX-31.4 - KMG CHEMICALS INC | kmg-ex314_87.htm |
| EX-31.3 - EX-31.3 - KMG CHEMICALS INC | kmg-ex313_86.htm |
UNITED STATES
SECURITIES AND EXCHANGE COMMISSION
Washington, D.C. 20549
Form 10-K/A
(Amendment No. 1)
(Mark one)
|
☒ |
ANNUAL REPORT PURSUANT TO SECTION 13 OR 15(d) OF THE SECURITIES EXCHANGE ACT OF 1934 |
For the fiscal year ended July 31, 2018
or
|
☐ |
TRANSITION REPORT PURSUANT TO SECTION 13 OR 15(d) OF THE SECURITIES EXCHANGE ACT OF 1934 |
For the transition period from to
Commission file number: 001-35577
KMG CHEMICALS, INC.
(Exact name of registrant as specified in its charter)
|
Texas |
|
75-2640529 |
|
(State or other jurisdiction of |
|
(I.R.S. Employer |
300 Throckmorton Street
Fort Worth, Texas 76102
(Address of principal executive offices, including zip code)
(817) 761-6100
(Registrant’s telephone number, including area code)
SECURITIES REGISTERED PURSUANT TO SECTION 12(b) OF THE EXCHANGE ACT:
|
Title of Each Class |
|
Name of each Exchange on which Registered |
|
Common Stock, $.01 par value |
|
The New York Stock Exchange |
SECURITIES REGISTERED PURSUANT TO SECTION 12(g) OF THE EXCHANGE ACT:
|
Title of Each Class |
|
Name of each Exchange on which Registered |
None
Indicate by a check mark if the registrant is a well-known seasoned issuer, as defined in Rule 405 of the Securities Act. Yes ☒ No ☐
Indicate by a check mark if the registrant is not required to file reports pursuant to Section 13 or Section 15(d) of the Act. Yes ☐ No ☒
Indicate by check mark whether the registrant (1) has filed all reports required to be filed by Section 13 or 15(d) of the Securities Exchange Act of 1934 during the preceding 12 months (or for such shorter period that the registrant was required to file such reports), and (2) has been subject to such filing requirements for the past 90 days. Yes ☒ No ☐
Indicate by check mark whether the registrant has submitted electronically every Interactive Data File required to be submitted pursuant to Rule 405 of Regulation S-T (§229.405 of this chapter) during the preceding 12 months (or such shorter period that the registrant was required to submit such files). Yes ☒ No ☐
Indicate by check mark if disclosure of delinquent filers pursuant to Item 405 of Regulation S-K is not contained herein, and will not be contained, to the best of registrant’s knowledge, in definitive proxy or information statements incorporated by reference in Part III of this Form 10-K or any amendment to this Form 10-K. ☐
Indicate by check mark whether the registrant is a large accelerated filer, an accelerated filer, a non-accelerated filer, a smaller reporting company or an emerging growth company. See definition of “large accelerated filer,” “accelerated filer,” “smaller reporting company” and “emerging growth company” in Rule 12b-2 of the Exchange Act.
|
Large Accelerated Filer |
|
☒ |
|
Accelerated Filer |
|
☐ |
|
|
|
|
|
|||
|
Non-Accelerated Filer |
|
☐ |
|
Smaller Reporting Company |
|
☐ |
|
|
|
|
|
|||
|
|
|
|
|
Emerging Growth Company |
|
☐ |
If an emerging growth company, indicate by check mark if the registrant has elected not to use the extended transition period for complying with any new or revised financial accounting standards provided pursuant to Section 13(a) of the Exchange Act. ☐
Indicate by check mark whether the registrant is a shell company (as defined in Rule 12b-2 of the Exchange Act). Yes ☐ No ☒
The aggregate market value of the voting and non-voting common equity held by non-affiliates of the registrant computed by reference to the closing price of $60.75 on The New York Stock Exchange as of the last business day of our most recently completed second fiscal quarter (January 31, 2018) was $877.7 million.
As of September 28, 2018, there were 15,553,484 shares of the registrant’s common stock, par value $0.01, per share outstanding.
DOCUMENTS INCORPORATED BY REFERENCE
None.
KMG Chemicals, Inc. (the “Company,” “we,” “us” or “our”), is filing this Amendment No. 1 on Form 10-K/A (this “Amendment”) to its Annual Report on Form 10-K for the fiscal year ended July 31, 2018, which was originally filed with the Securities and Exchange Commission (the “SEC”) on October 1, 2018 (the “Original Filing”), to include the information previously omitted from Part III. This information was previously omitted from the Original Filing in reliance on General Instruction G(3) to Form 10-K, which permits the information in the above-referenced items to be incorporated in the Form 10-K by reference from a definitive proxy statement if such statement is filed no later than 120 days after our fiscal year end. On August 14, 2018, we entered into an Agreement and Plan of Merger (the “Merger Agreement”) with Cabot Microelectronics Corporation (“Cabot Microelectronics”), a Delaware corporation, and Cobalt Merger Sub Corporation, a Texas corporation and wholly owned subsidiary of Cabot Microelectronics, and, as a result, we do not expect to hold a 2018 annual meeting of shareholders and will not file a definitive proxy statement. We are therefore filing this Amendment to include Part III information in our Form 10-K. The reference on the cover of the Original Filing to the incorporation by reference to portions of our definitive proxy statement into Part III of the Original Filing has been deleted.
Except for the addition of the Part III information, the update to the cover page, and the filing of related certifications, this Amendment does not amend or otherwise update any other information in the Original Filing. This Amendment continues to speak as of the date of the Original Filing and the Company has not updated the disclosure contained herein to reflect events that have occurred since the filing of the Original Filing. Accordingly, this Amendment should be read in conjunction with the Original Filing and the Company’s other filings made with the SEC subsequent to the filing of the Original Filing, including amendments to those filings, if any.
2
|
|
|
|
4 |
|
|
|
|
|
|
|
|
|
|
4 |
||
|
|
|
|
|
|
|
|
|
11 |
||
|
|
|
|
|
|
|
|
Security Ownership of Certain Beneficial Owners and Management and Related Stockholder Matters |
|
31 |
|
|
|
|
|
|
|
|
|
Certain Relationships and Related Transactions, and Director Independence |
|
31 |
|
|
|
|
|
|
|
|
|
|
32 |
||
|
|
|
|
|
|
|
|
|
|
33 |
|
|
|
|
|
|
|
|
|
|
33 |
3
ITEM 10. DIRECTORS, EXECUTIVE OFFICERS AND CORPORATE GOVERNANCE
Board of Directors
The following table sets forth certain information with respect to each of our directors as of November 13, 2018.
|
Name and Age |
|
Director Since |
|
Business Experience during the Past 5 Years and Other Information |
|
Gerald G. Ermentrout (70) |
|
2008 |
|
Mr. Ermentrout has over 30 years of experience in industrial gases and electronic chemicals. He joined Air Products and Chemicals, Inc. in 1975 and held various positions until his retirement in early 2007. From 1996 to 2007, Mr. Ermentrout served as the Vice President and General Manager of the Electronic Chemicals Division, which included the high-purity process chemicals business that we acquired in December 2007. In that position, he managed Air Products’ global materials and equipment business serving the semiconductor and flat panel display industries, with responsibility for sales, marketing and operations. During his tenure at Air Products, Mr. Ermentrout also held positions where he managed oxygen, nitrogen and hydrogen plants and pipeline systems, as well as managed major acquisitions and divestitures. He served on the board of directors of AZ Electronic Materials, a public company previously listed on the London Stock Exchange from April 1, 2007 until June 1, 2014. He received a Bachelor of Science in Engineering from the United States Naval Academy and a Master of Business Administration from Lehigh University. Mr. Ermentrout is the Lead Director on our Board of Directors as well as the chair of the Nominating and Corporate Governance Committee and a member of the Compensation and Development Committee. Mr. Ermentrout brings to our Board critical industry experience and specialized knowledge in electronic chemicals, our largest business segment. That experience includes managing electronic chemical operations in North America and internationally, and pursuing merger and acquisition opportunities in that business. |
|
|
|
|
|
|
|
Christopher T. Fraser (60) |
|
2008 |
|
Mr. Fraser is a director, Chairman of the Board, President and our Chief Executive Officer (“CEO”). He became President and CEO on an interim basis in July 2013, and was selected as our permanent President and CEO in September 2013. He has broad experience in the chemical industry, much of that experience with major, global participants. From 2006 to 2009, he was the President and CEO of Chemical Lime Company, the leading North American producer of calcium based (limestone), alkaline products with various industrial applications including the manufacture of steel, water treatment, flue gas desulphurization, and chemical production. Before joining Chemical Lime, Mr. Fraser was President and CEO of OCI Chemical Corporation, a wholly-owned subsidiary of DC Chemical Co., among the world’s leading producers of high quality soda ash and sodium percarbonate. Prior to joining OCI in 1996, Mr. Fraser held various positions of responsibility in sales, marketing, business development, operations and general management. In 2011, Mr. Fraser joined the Operating Partner Program of Advent International, and in that position he advises that global equity firm on investment opportunities in the industrial sector, focusing on chemicals and materials. Mr. Fraser holds Bachelor of Science in Chemistry and in Business Administration from the University of Connecticut, as well as a Master of Business Administration from Pepperdine University. Prior to becoming our President and CEO, Mr. Fraser served as a director on our Board since 2008, and became Chairman of the Board in December 2012. His leadership, industry and governance experience as the CEO of chemical manufacturing companies, in mergers and acquisitions, and in creating and maintaining an appropriate corporate structure, have been a valuable resource to the Board. |
|
|
|
|
||
|
George W. Gilman (76) |
|
1996 |
|
Mr. Gilman served as a director of our subsidiary KMG-Bernuth from 1995 until 1997 and became a director on our Board in 1996. Mr. Gilman has served as the CEO, President and as a director of Commerce Securities Corporation, a Financial Industry Regulatory Authority member firm, since 1982. He practiced law with the law firm of George Gilman, P.C. from 1986 to 1998, and since 1998 has practiced with the law firm of Gilman & Gilman, P.C. He also has been involved in the commercial real estate business since 1987, and currently through Gulf Equities Realty Corp. Mr. Gilman is a certified public accountant. Mr. Gilman is a member of the Audit Committee and a member of the Nominating and Corporate Governance Committee. Mr. Gilman’s knowledge of accounting and legal matters, and his experience in public company financing and investor relations, provide the Board an important resource. |
4
|
Name and Age |
|
Director Since |
|
Business Experience during the Past 5 Years and Other Information |
|
|
|
|
||
|
Robert Harrer (53) |
|
2015 |
|
Mr. Harrer became a director in September 2015. He is currently Senior Vice President, Chief Financial Officer of Renaissance Pharmaceuticals, Inc., which develops and manufactures a broad range of sterile and environmentally controlled products. From March 2014 until December 2015, Mr. Harrer was Senior Vice President, Chief Financial Officer of Innophos, a leading producer of performance-critical specialty grade phosphate products and nutritional specialty ingredients. From 2010 to 2013, Mr. Harrer was Executive Vice President, Chief Financial Officer and Chief Administrative Officer of Avantor Performance Materials, a global manufacturer of performance materials and chemicals for leading-edge electronics, biopharmaceutical, laboratory and research applications. Avantor is owned by New Mountain Capital LLC, a private equity firm, for which Mr. Harrer worked as a business consultant prior to the acquisition of Avantor. From 2000-2009, Mr. Harrer worked for Rohm and Haas in various leadership positions, including Chief Financial Officer of the Electronic Materials business, Director of Finance of the European Region, and Corporate Controller and Director of Financial Planning at Rohm and Haas’ Philadelphia headquarter. Following The Dow Chemical Company’s acquisition of Rohm and Haas in 2009, Mr. Harrer served as division controller at Dow. Mr. Harrer earned his Master of Business Administration and Mathematics at Albert Einstein University in Ulm, Germany. Mr. Harrer currently serves as the Chairman of the Audit Committee and is a member of the Compensation and Development Committee. His financial, chemical industry and executive experience are invaluable resources for the Board. |
|
|
|
|
|
|
|
John C. Hunter, III (71) |
|
2011 |
|
Mr. Hunter has over 40 years of global chemical industry experience. He began his career in 1969 with Monsanto Company, and for the next three decades held positions of increasing responsibility in areas such as engineering, sales, and management. He was appointed Vice President and General Manager, Asia Pacific, for the Specialty Chemicals Division of Monsanto Chemical Company in 1989, and Vice President and General Manager, Fibers Division and Asia-Pacific for the Chemicals Group, an operating unit of Monsanto Company, in 1993. Mr. Hunter became President of the Fibers Business Unit in 1995. In September 1997, Monsanto spun off its chemicals business as Solutia Inc., and Mr. Hunter was appointed its President and Chief Operating Officer. He became President and Chief Executive Officer of Solutia in May 1999, and added the role of Chairman of the Board in December 1999. Mr. Hunter retired as Chairman, President and Chief Executive Officer of Solutia in 2004. Mr. Hunter is currently a member of the board of directors and chair of the compensation and nominating committee of Edgewell Personal Care. He received a Bachelor of Science degree in Chemical Engineering from the Georgia Institute of Technology and a Master of Business Administration from the University of Houston. Mr. Hunter is a member of the Nominating and Corporate Governance Committee and Chair of the Compensation and Development Committee. His commercial, chemical industry and corporate governance experience as the CEO and Chairman of a major chemical manufacturing company are invaluable resources for the Board. |
|
|
|
|
|
|
|
Fred C. Leonard, III (73) |
|
1996 |
|
Mr. Leonard served as a director of our subsidiary KMG-Bernuth from 1992 until 1997, and served as the Secretary of KMG-Bernuth from 1993 until 2001. From 1972 through April 2015, Mr. Leonard served as the Chair of the Board, CEO and President of Valves Incorporated of Texas, Inc. (“Val-Tex”), a manufacturing company located in Houston, Texas, prior to our acquisition of Val-Tex. Mr. Leonard currently serves as a board member of DKI Investments Incorporated, a private Texas Corporation formed to acquire and operate companies. Mr. Leonard is a member of our Compensation and Development Committee and a member of our Audit Committee. He provides the Board with critical expertise in compensation systems and strategies, and as the long-time CEO of a private manufacturing company, he brings to the Board leadership experience and a broad-based expertise in a variety of business disciplines. |
|
|
|
|
|
|
5
|
Name and Age |
|
Director Since |
|
Business Experience during the Past 5 Years and Other Information |
|
|
2018 |
|
Ms. Montana retired as Chief Executive Officer and President of Shell Midstream Partners, LP. in June 2015 and remains a member of its board of directors. Employed at Shell from 1977 until 2015, Ms. Montana served in various capacities in the downstream and midstream sector during her career. Ms. Montana became Executive Vice President, US Pipelines & Special Projects – Americas in Shell Downstream Inc. in January 2014. Ms. Montana served as Executive Vice President, Supply & Distribution, from 2009 to 2014, where she was responsible for hydrocarbon supply to Shell’s downstream worldwide fuels manufacturing and marketing businesses. Prior to 2009, Ms. Montana served in the U.S. from 2004 as Vice President, Supply, and then Vice President, Global Distribution, where she led Shell’s fuels global terminal and distribution operations. In these various roles, Ms. Montana led Shell’s U.S. pipeline business since 2006. Ms. Montana currently is a member of the board of directors of Contanda, a private terminal company; the board of trustees of Missouri University of Science & Technology and the Houston YMCA. Past affiliations include API Downstream Committee and the National Petroleum Council. Ms. Montana holds a bachelor of science in Chemical Engineering from the University of Missouri, Rolla. Ms. Montana’s extensive experience in the energy industry, particularly her experience in supply and distribution and in the pipeline sector, makes her well qualified to serve as a member of the Board. |
|
|
|
|
|
||
|
Karen A. Twitchell (63) |
|
2010 |
|
Ms. Twitchell is a member of the board of directors of Kraton Corp., where she is Chair of the Compensation Committee and a member of the Audit Committee. In addition, she is on the board of Trecora Resources, where she is Lead Independent Director, Chair of the Audit Committee and a member of the Compensation Committee. From 2010 to 2013, she was Executive Vice President and Chief Financial Officer of Landmark Aviation, where she was responsible for all financial and strategic planning functions. Previously, Ms. Twitchell was Vice President and Treasurer of LyondellBasell Industries from 2001 to 2009, where she was responsible for global treasury operations for this worldwide chemical and refining company. Before that, she had served as Vice President and Treasurer of Kaiser Aluminum Corporation and of Southdown Inc. Prior to joining Southdown, Ms. Twitchell was an investment banker with Credit Suisse First Boston in its corporate finance department. Ms. Twitchell holds a Bachelor of Arts in Economics from Wellesley College and a Master of Business Administration from Harvard University. Ms. Twitchell is a member of the Audit and Nominating and Corporate Governance Committees. She brings important experience to the Board in accounting matters, financings and capital structure, merger and acquisition transactions, investor relations and enterprise risk management. |
Named Executive Officers Who Are Not Directors
The following table sets forth certain information with respect to our current named executive officers who are not directors.
|
Name and Age |
|
Business Experience during the Past 5 Years and Other Information |
|
Marvin T. Green III (44) |
|
Mr. Green was named Chief Financial Officer in February 2018. Mr. Green joined KMG in 2015 as Director of Corporate Development, overseeing the company’s mergers and acquisitions strategy and execution. Before joining KMG, Mr. Green worked in investment banking with Imperial Capital, LLC from 2007 to 2015 and Lehman Brothers from 2004 to 2007, focusing on mergers and acquisitions, financing and restructuring transactions. Mr. Green holds a Bachelor of Business Administration in Finance and Marketing from Texas Christian University and earned his Master of Business Administration from the University of Chicago, Graduate School of Business with concentrations in Accounting, Analytic Finance and Entrepreneurship. |
|
|
|
|
|
Jeffrey S. Handelman (58) |
|
Mr. Handelman became our Senior Vice President Electronic Chemicals in March 2017. Prior to joining KMG, Mr. Handelman was Executive Vice President, Process Materials at Versum Materials, a leading electronic materials supplier to the semiconductor industry. Versum Materials was spun off from Air Products and Chemicals’ electronic chemicals division in September 2016. At Air Products, Mr. Handelman held positions of increasing responsibility, including Wet Process General Manager and Vice President, Global Sales for the firm’s electronics business. Prior to joining Air Products, Mr. Handelman held various business management and strategic development positions at Ashland Chemical and Koch Industries. |
6
|
Name and Age |
|
Business Experience during the Past 5 Years and Other Information |
|
|
|
|
|
Roger C. Jackson (67) |
|
Mr. Jackson was elected Secretary in 2001, and became Vice President and General Counsel in 2002. Prior to then, Mr. Jackson had been a partner since 1995 in Woods & Jackson, L.L.P. and had been a partner in the Houston law firm Brown, Parker & Leahy L.L.P. beginning in 1985. |
|
|
|
|
|
Ernest C. Kremling (54) |
|
Mr. Kremling was named Senior Vice President Industrial Lubricants, Wood Treating Chemicals and Manufacturing Services in March 2017. Mr. Kremling joined KMG as Vice President-Operations in 2008. Prior to that, Mr. Kremling spent 20 years with the Dow Chemical Company in various manufacturing roles, which included project management and plant and site leadership. During the course of his employment with Dow, he worked in Asia for several years and held positions of global responsibility that covered Asia, Europe and South America. |
|
|
|
|
Communication with the Board
In order to provide our shareholders and other interested parties with a direct and open line of communication to the Board of Directors, the Board of Directors has adopted the following procedures for communications to directors. Shareholders and other interested persons may communicate with the Board or with our non-management directors as a group by written communications addressed in care of the Chair of our Nominating and Corporate Governance Committee or our Corporate Secretary, 300 Throckmorton Street, Fort Worth, Texas 76102.
All communications received in accordance with these procedures will be reviewed initially by senior management. Senior management will relay all such communications to the appropriate director or directors unless it is determined that the communication (i) does not relate to our business or affairs or the functioning or constitution of the Board of Directors or any of its committees; (ii) relates to routine or insignificant matters that do not warrant the attention of the Board of Directors; (iii) is an advertisement or other commercial solicitation or communication; (iv) is frivolous or offensive; or (v) is otherwise not appropriate for delivery to directors.
The director or directors who receive any such communication will have discretion to determine whether the subject matter of the communication should be brought to the attention of the full Board of Directors or one or more of its committees and whether any response to the person sending the communication is appropriate. Any such response will be made only in accordance with applicable law and regulations relating to the disclosure of information.
The Corporate Secretary will retain copies of all communications received pursuant to these procedures for a period of at least one year. The Board of Directors will review the effectiveness of these procedures from time to time and, if appropriate, recommend changes. As of November 13, 2018, no such communications had been received.
7
The Board of Directors held ten meetings in fiscal year 2018, including special meetings, and took action by unanimous consent in several instances. All directors attended all meetings. All directors also attended the 2017 Annual Meeting of Shareholders.
Stock Ownership Guideline for Non-Employee Directors
We have adopted a stock ownership guideline for non-employee directors. Non-employee directors are to own the greater of 4,000 shares or the number of shares of our Common Stock whose value equals five times their annual cash retainer. Non-employee directors have two years from their election to achieve the 4,000 shares level and five years from their election to achieve the 5x guideline. The Compensation and Development Committee may enforce the guideline by paying director compensation in restricted stock. As of July 31, 2018, each of our non-employee directors has satisfied the requirement as it may relate to them.
Board Committee Membership
The Board of Directors has three standing committees, an Audit Committee, a Nominating and Corporate Governance Committee (“Governance Committee”) and a Compensation and Development Committee (“Compensation Committee”). The Audit Committee, the Governance Committee and the Compensation Committee are composed entirely of non-employee directors whom the Board has determined are independent under the applicable committee independence standards of the New York Stock Exchange. The table below provides the current membership for the four standing committees.
|
|
|
Audit Committee |
|
Nominating & Corporate Governance Committee |
|
Compensation & Development Committee |
|
Gerald G. Ermentrout |
|
|
|
X* |
|
X |
|
George W. Gilman |
|
X |
|
X |
|
|
|
Robert Harrer |
|
X* |
|
|
|
X |
|
John C. Hunter, III |
|
|
|
X |
|
X* |
|
Fred C. Leonard, III |
|
X |
|
|
|
X |
|
Margaret C. Montana |
|
X |
|
|
|
X |
|
Karen A. Twitchell |
|
X |
|
X |
|
|
|
* |
Committee Chair |
Board Leadership Structure
The Board does not have a set policy on whether the roles of the chairman and CEO should be separate and, if separate, whether the chairman should be selected from the non-employee directors or be an employee. Rather, the Board makes this choice on the basis of what it believes is in our best interests at a given point in time. The Board has determined that it is currently in our best interests that Christopher T. Fraser serves as our Chairman, President and CEO. The Board believes that Mr. Fraser’s knowledge and past experience as a CEO will serve us well and that his insights have been, and will continue to be, invaluable to the Board.
We have designated a Lead Director to ensure the representation of the non-employee directors in our leadership structure. The responsibilities of the Lead Director include calling and setting the agenda for executive sessions and other meetings of the non‑employee directors, serving as principal liaison for the non-employee directors with the Board Chair and the CEO, substituting for the Board Chair when he is unavailable, and serving as the contact for shareholder communication. Mr. Ermentrout is our current Lead Director.
The Board’s Oversight of Risk Management
Responsibility for risk oversight rests with the full Board. Three committees lend support to the Board in reviewing our consideration of material risks and overseeing our management of material risks. The Audit Committee makes inquiries of senior management about our risk assessment and risk management policies. These policies address our major financial risk exposures and the steps management has taken to monitor and mitigate these risks. The Compensation Committee reviews compensation policies and practices to ensure that our compensation policies are not reasonably likely to have a material adverse effect. The Governance Committee assists the Board with oversight of material risk generally, and specifically to assist with oversight of management’s responsibility to identify, assess, prioritize and manage material risks related to our business, and to ensure alignment between our risk-taking activities and our strategic objectives. We also have an enterprise risk management steering committee which is comprised of senior executive management. The steering committee is responsible for the administration of our enterprise risk management
8
process. The Audit and Governance Committees receive reports from our enterprise risk management steering committee, and report regularly to the Board.
Committee Charters, the Code of Business Conduct and Corporate Governance Guidelines
The Audit, Governance and Compensation Committees have each adopted charters that have been approved by the Board of Directors. The Board of Directors has also adopted a Code of Business Conduct applicable to directors and all employees, including the CEO, the Chief Financial Officer (“CFO”) and other senior management. The Code of Business Conduct covers such topics as financial reporting, conflicts of interest, compliance with laws, fair dealing and use of our assets. The Code of Business Conduct satisfies the requirements of a “code of ethics” under Section 406(c) of the Sarbanes-Oxley Act of 2002, and requires that any waiver of those provisions as they relate to executive officers or directors may be made only by the Board of Directors and must be promptly disclosed to shareholders along with the reason for the waiver. The Board of Directors has also established Corporate Governance Guidelines covering, among other things, the duties and responsibilities and independence of our directors, director access to management and independent auditors, director compensation, performance reviews of our CEO and management succession planning.
The charters of the Audit, Compensation and Governance Committees, the Code of Business Conduct and the Corporate Governance Guidelines, are available on our website at kmgchemicals.com or by writing to Corporate Secretary, KMG Chemicals, Inc., 300 Throckmorton Street, Fort Worth, Texas 76102. These documents will be provided free of charge. Material contained on our website is not incorporated by reference in, or considered to be part of, this Form 10-K.
Audit Committee
The Audit Committee advises the Board and management from time to time with respect to internal controls, systems and procedures, accounting policies and other significant aspects of our accounting, auditing and financial reporting practices. The Audit Committee also monitors the preparation of our quarterly and annual reports and supervises our relationship with our external auditors. The Audit Committee met nine times during fiscal year 2018.
The Audit Committee operates under a charter approved by the Board of Directors and that satisfies the applicable SEC rules and regulations and the New York Stock Exchange Listed Company Manual. The Audit Committee’s function under its written charter is to appoint the independent registered public accounting firm and auditors to audit our financial statements and perform other services related to the audit; review the scope and results of the audit with the independent auditors; review with management and the independent auditors our interim and year-end operating results; oversee our external reporting; consider the adequacy of the internal accounting procedures; provide oversight for the internal audit function; evaluate the independence of the external auditors; and approve and review any non-audit services to be performed by the independent auditors. The Audit Committee has also established procedures for the receipt, retention, and treatment of complaints we receive regarding accounting, internal accounting controls or audit matters, and the confidential, anonymous submission to us by our employees of concerns regarding questionable accounting or auditing matters.
Currently, the Audit Committee consists of five non-employee directors, George W. Gilman, Robert Harrer, Fred C. Leonard, III, Margaret C. Montana and Karen A. Twitchell. Mr. Harrer is the current Chair. Mr. Harrer has served on our Board of Directors since 2015. In the course of his career, Mr. Harrer has acquired (i) an understanding of generally accepted accounting principles and financial statements, (ii) the ability to assess the general application of such principles in connection with the accounting for estimates, accruals and reserves, (iii) experience preparing, auditing, analyzing or evaluating financial statements that present a breadth and level of complexity of accounting issues that are generally comparable to the breadth and complexity of issues that can reasonably be expected to be raised by our financial statements, (iv) an understanding of internal control over financial reporting, and (v) an understanding of audit committee functions. The Board of Directors has determined that Mr. Harrer is an “audit committee financial expert” within the meaning of that term under the rules of the SEC and has the requisite financial management experience as defined under the New York Stock Exchange Listed Company Manual. The Board has also determined that all of the members of the Audit Committee are independent and financially sophisticated within the meaning of the listing standards of the New York Stock Exchange and as defined in Exchange Act Rule 10A-3.
Nominating and Corporate Governance Committee
The Governance Committee is responsible for developing and implementing policies and practices relating to corporate governance, including establishing and monitoring implementation of Corporate Governance Guidelines. The committee also plans for the succession of the CEO and other executives. The committee is responsible for identifying and assessing candidates for the Board
9
of Directors, including making recommendations to the Board regarding candidates. During fiscal year 2018, the Governance Committee held two meetings. In fulfilling its duties, the Governance Committee, among other things:
|
|
• |
identifies individuals qualified to be Board members consistent with criteria established by the committee, and with a view to selecting persons whose background and skills support our strategy for increasing shareholder value; |
|
|
• |
recommends to the Board nominees for the next annual meeting of shareholders; and |
|
|
• |
evaluates individuals suggested by shareholders. |
In recommending director candidates to the Board, the Governance Committee charter requires the committee to select individuals who possess the highest personal and professional integrity. The selection process includes reviewing a candidate’s depth of experience and availability, the balance of the business interest and experience of the incumbent or nominated directors, and the need for any required expertise on the Board or one of its committees, including the expertise needed to support and oversee the execution of our corporate strategy. In making its nominations, the Governance Committee first evaluates the current Board members. The committee has also developed a matrix of desirable skills and experience to apply to director candidates, and in the appropriate case has retained a third party consulting firm that specializes in locating candidates for the boards of directors of public companies. The objective of this selection process is to assemble a group of Directors with diverse backgrounds and experience that can best represent shareholder interests through the exercise of sound judgment.
Currently, the Governance Committee consists solely of non-employee directors who are independent within the meaning of listing standards of the New York Stock Exchange and applicable SEC rules and regulations. Members of the Governance Committee currently are Gerald G. Ermentrout, George W. Gilman, John C. Hunter, III and Karen Twitchell. Mr. Ermentrout is the Chair.
Compensation and Development Committee
The Compensation Committee establishes compensation for our CEO and other executive officers, and makes recommendations to the Board of Directors regarding compensation of directors. The committee also administers our incentive compensation and other equity based compensation plans, which included in fiscal year 2018 our 2016 Long-Term Incentive Plan and 2009 Long-Term Incentive Plan. The Compensation Committee is composed of four non-employee directors, Gerald G. Ermentrout, Robert Harrer, John C. Hunter, III and Fred C. Leonard, III. Mr.Hunter is the current Chair. The Board has determined that each of the members of the committee is independent within the meaning of the listing standards of the New York Stock Exchange and as defined in applicable SEC rules and regulations. During fiscal year 2018, the Compensation Committee held three meetings.
Section 16(a) Beneficial Ownership Reporting Compliance
Based solely on a review of Forms 3, 4 and 5 and amendments thereto furnished to us, we know of no failure in Section 16(a) beneficial ownership reporting compliance during fiscal year 2018, except that Mr. Kremling failed to timely file one Form 4 covering one transaction for 2,850 shares.
10
ITEM 11. EXECUTIVE COMPENSATION
Compensation Discussion and Analysis
Introduction
This Compensation Discussion and Analysis (“CD&A”) contains the philosophy underlying our compensation strategy and the major elements of compensation paid to the persons included in our Summary Compensation Table. We refer to those persons as named executive officers (“NEOs”). For 2018, our NEOs were:
|
NEO |
|
Title |
|
Christopher T. Fraser |
|
President and Chief Executive Officer |
|
Marvin T. Green III (1) |
|
Chief Financial Officer |
|
Marcelino Rodriguez (1) |
|
Former Vice President and Chief Financial Officer |
|
Jeffrey S. Handelman |
|
Senior Vice President Electronic Chemicals |
|
Roger C. Jackson |
|
Vice President, General Counsel and Secretary |
|
Ernest C. Kremling |
|
Senior Vice President Industrial Lubricants, Wood Treating Chemicals and Manufacturing Services |
|
(1) |
Mr. Green became an NEO upon becoming Chief Financial Officer in February 2018. Mr. Rodriguez left the Company in February 2018. |
Executive Summary
In this CD&A, we address the following:
|
|
• |
the objectives underlying our executive compensation program; |
|
|
• |
what our compensation program is designed to reward; |
|
|
• |
the elements of compensation that make up our compensation program; |
|
|
• |
how we determine executive compensation; and |
|
|
• |
other important compensation policies. |
Business Performance Highlights
|
|
• |
GAAP diluted earnings per share was a record $4.29 in fiscal year 2018, up 123% from $1.92 in fiscal year 2018. |
|
|
• |
Adjusted diluted earnings per share* was a record $4.33 in fiscal year 2018, up 91% from $2.27 in fiscal year 2017. |
|
|
• |
GAAP net income was a record $64.8 million in fiscal year 2018, up 175% from $23.6 million in fiscal year 2017. |
|
|
• |
Adjusted EBITDA* was a record $119.5 million, up 99% from $60.2 million in fiscal year 2017. |
*See the discussion on pages 25–26 of the Original Filing under the Caption “Non-GAAP Financial Measures” for a reconciliation of non-GAAP financial measures.
11
Business Performance Highlights
|
GAAP net income (in millions) |
GAAP diluted earnings per share |
|
Adjusted EBITDA* (in millions) |
Adjusted diluted earnings per share* |
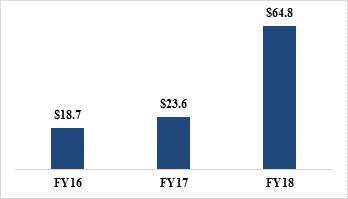
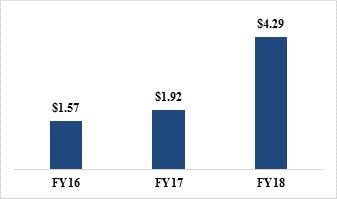
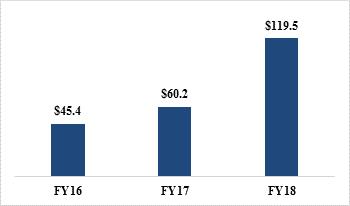
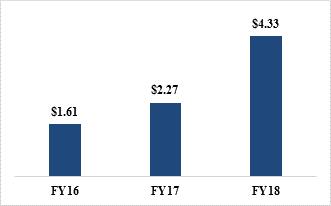
*See the discussion on pages 21–22 of the Original Filing under the Caption “Non-GAAP Financial Measures” for a reconciliation of non-GAAP financial measures.
Compensation Program Highlights
|
|
• |
NEO base salaries increased an average of 6.68%, reflecting both executive performance and the competitive market. |
|
|
• |
Fiscal year 2018 target direct compensation was 79% performance-based for our CEO and 59% performance-based for our other NEOs. |
|
|
• |
Annual incentive awards to our NEOs, excluding Mr. Rodriguez, paid out at 137.2% of target on average, reflecting above-target performance for adjusted EBITDA and adjusted return on invested capital. |
|
|
• |
We granted long-term incentive awards in December 2017 in the form of performance-based restricted stock unit (“RSU”) awards where 100% of the vesting was contingent on meeting specified performance conditions. |
|
|
• |
The Compensation Committee conducted an extensive review of public companies in chemical and related industries and updated our peer group to better align our compensation with the specialty chemicals industry. |
12
Below we highlight some of our executive compensation practices which we believe enforce alignment with shareholder interests:
|
What We Do |
What We Don’t Do |
||
|
☑ |
Majority of NEO compensation is variable |
☒ |
No excise tax gross-ups |
|
☑ |
Long-term incentives are heavily performance-based |
☒ |
No hedging transactions by officers or directors |
|
☑ |
Share ownership requirements for NEOs |
☒ |
No share recycling under our amended LTI plan |
Objectives of Our Compensation Program
We produce and distribute specialty chemicals and performance materials for the semiconductor, industrial wood preservation and pipeline and energy markets. Our business strategy includes growing in a manner that increases shareholder value by purchasing additional product lines and businesses. We target for acquisition products and businesses in specialty chemicals that offer unique products with higher value applications, barriers to entry, proven management teams with a track record of performance and strong cash flow. To assist in carrying out this strategy, our Compensation Committee has designed our compensation program to:
|
|
• |
reward executive officers for long-term strategic management and the enhancement of shareholder value; |
|
|
• |
integrate the compensation program with our short and long-term strategic business plans; |
|
|
• |
ensure the alignment of our NEOs with the interests of our shareholders over the long-term; and |
|
|
• |
attract, motivate, reward and retain experienced and highly qualified executive officers. |
What Our Compensation Program Is Designed To Reward
Our compensation program is designed to reward executive officers who are capable of leading us in achieving our business strategy on both a short-term and long-term basis. When making compensation decisions, we consider:
|
|
• |
overall Company performance; |
|
|
• |
individual performance of our executives; |
|
|
• |
relative internal relationships within the executive pay structure; |
|
|
• |
compensation at our peer companies; and |
|
|
• |
ability to pay. |
The Elements of Our Compensation
In fiscal year 2018 we utilized the following elements of compensation to support our compensation program objectives:
|
|
• |
base salary; |
|
|
• |
annual incentive compensation; |
|
|
• |
long-term incentive compensation; |
|
|
• |
broad-based employee benefits; and |
|
|
• |
other agreements and benefits. |
13
How We Determine Each Element of Compensation and Why We Pay Each Element
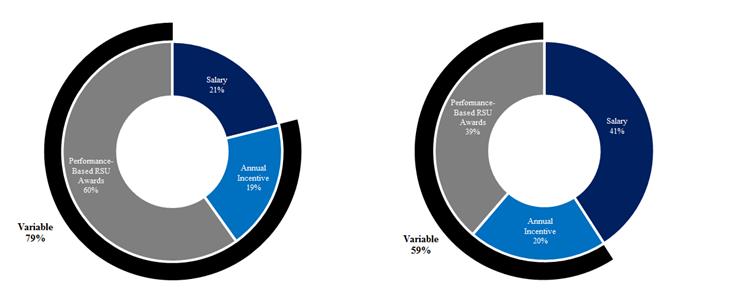
The Compensation Committee continues to weight at-risk performance-based incentives compensation of our NEOs more heavily than base salary. We believe that our compensation program will enhance our profitability and increase shareholder value by more closely aligning the financial interests of our executive officers with those of our shareholders. We believe that the achievement of long-term goals increases shareholder value to a greater degree than the achievement of short-term goals. The charts below show the mix of target direct compensation for our NEOs, excluding Mr. Green, in fiscal year 2018, demonstrating the emphasis placed upon variable compensation and long-term incentive compensation in particular in our program:
|
CEO Pay Mix |
Other NEO Pay Mix |
Benchmarking and Other Market Data
The Compensation Committee analyzes comparative data from national surveys and data from a peer group of publicly-traded chemical companies of base salaries, annual and long-term incentive targets. We collectively refer to the national surveys and peer group information as “market survey data” in this discussion. The composition and performance of the peer group is reviewed each year. For fiscal year 2018, our independent consultant conducted an extensive review of public companies in chemical and related industries and recommended five replacements to the peer group to better align our compensation with the special chemicals industry. In fiscal year 2018, the peer group included fourteen publicly-traded chemical companies having comparable to slightly higher annual revenues and a comparable value for ongoing operations: American Vanguard Corporation, Balchem Corporation, Cabot Microelectronics, CSW Industrials, Inc., Entegris, Inc., Ingevity Corporation, Innophos Holdings, Inc., Innospec, Inc., LSB Industries, Inc., OMNOVA Solutions, Inc., Quaker Chemical Corp., Rogers Corp., Rudolph Technologies, Inc. and Trecora Resources. The 25th, 50th and 75th percentiles for the data sources were analyzed to gain an understanding of the range of competitive pay practices. Although the 50th percentile of the combined data was used by the Compensation Committee as a reference point for establishing base salary, annual incentive targets and total direct compensation, the compensation of individual executives may vary above or below the reference point because of the background, personal performance, skills and experience, the comparative compensation of our executives and our ability to provide certain compensation within our budgetary constraints.
14
Merger Transaction with Cabot Microelectronics
The Merger Agreement with Cabot Microelectronics contains provisions regarding the treatment of outstanding equity awards. Immediately prior to the effective time, each RSU award relating to shares of KMG common stock, whether or not subject to performance-based vesting conditions, that was granted prior to August 14, 2018 and that is outstanding as of immediately prior to the effective time will fully vest (with any applicable performance metrics deemed satisfied based on the level of achievement specified in the applicable award agreement) and be cancelled and converted in exchange for the right to receive the Merger Consideration in respect of each share of KMG common stock underlying the applicable RSU award.
On October 22, 2018, the following NEOs were granted time-based RSUs under the 2016 Long-Term Incentive Plan in the following amounts and with the vesting schedule stated below:
|
|
• |
Mr. Fraser received a grant of 20,728 RSUs; |
|
|
• |
Mr. Kremling received a grant of 5,221 RSUs; and |
|
|
• |
Mr. Green received a grant of 2,874 RSUs. |
Each of the above RSUs awarded to the NEOs will vest in three equal installments on each of July 31, 2019, 2020 and 2021. If the NEO is terminated without cause or resigns with good reason during the 18 months following the effective time of the Merger, the NEO will vest in a number of shares equal to 150% of the number of shares otherwise subject to the RSU award.
Immediately prior to the effective time, each RSU relating to shares of KMG common stock that is not subject to performance-based vesting conditions and was granted on or following August 14, 2018 and that is outstanding as of immediately prior to the effective time of the Merger will be assumed by Cabot Microelectronics and converted into a RSU award relating to a number of shares of Cabot Microelectronics common stock (rounded to the nearest whole share) equal to (i) the number of shares of KMG common stock subject to such KMG RSU award immediately prior to the effective time of the Merger, multiplied by (ii) the “equity award exchange ratio” (defined below). The assumed RSU awards will be subject to the same terms and conditions as were applicable to the corresponding KMG equity award immediately prior to the effective time (including vesting terms). The “equity award exchange ratio” means the sum of (a) 0.2000 and (b) the quotient (rounded to four decimal places) obtained by dividing (x) $55.65 by (y) the volume weighted average price per share (calculated to the nearest one-hundredth of one cent) of Cabot Microelectronics common stock on the Nasdaq for the consecutive period of five trading days beginning on the seventh trading day immediately preceding the effective time and concluding at the close of trading on the third trading day immediately preceding the effective time.
In addition, under the Merger Agreement, KMG has granted cash retention awards to executive officers and employees. The aggregate amount of the cash retention awards granted to all executive officers and employees is approximately $16.5 million. Approximately 82% of the retention bonus pool was granted to KMG executive officers and approximately 18% was granted to non-executive officer employees.
Upon consummation of the Merger, 50% of the retention bonus award will be paid to the executive officer. The remaining 50% of the retention bonus award will be paid to the executive officer on the date that is twelve months following consummation of the Merger, provided that the executive officer is still in employment on such date. If an executive officer's employment is terminated involuntarily not for cause, voluntarily by the executive officer for good reason, or due to death or disability, in each case, prior to the date that is twelve months following consummation of the Merger, the unpaid portion of the retention bonus award will be paid upon termination of employment. The estimated total aggregate retention bonus payments that could be made to executive officers in connection with the merger equal $13,350,000.
Except as set forth in this section, the information regarding compensation programs for the NEOs in this CD&A does not take into account the transactions contemplated by the Merger Agreement with Cabot Microelectronics. For additional details regarding the Merger Agreement, please refer to our Definitive Proxy Statement on Schedule 14A filed with the SEC on October 9, 2018.
15
About Our Executive Compensation Program
Base Salary
Base salary is compensation paid to an executive for performing specific job responsibilities and it represents the minimum income an executive might receive in any given year. Base salary is essential to attracting and retaining experienced and highly qualified executives, including our NEOs. We initially establish base salary based upon the abilities, accomplishments, and prior work experience and performance of the executive officer. Adjustments in base salary are considered on a discretionary basis, taking into account internal pay relationships and consistency, the executive’s historical contributions, and the experience, level of responsibility, changes in responsibilities, retention risk and market survey data.
We intend to pay base salaries that are within the market median range of national survey and peer group data. See “How We Determine Executive Officer Compensation — Benchmarking and Other Market Data.” Increases in base salary in fiscal year 2018 were driven by market adjustments for the compensation of the CEO and the other NEOs. In addition, increases in base salary reflect that our operations have grown geographically and in complexity with recent acquisitions in our electronic chemicals business and the industrial lubricants business.
Annualized Base Salaries of Named Executive Officers
|
Year |
|
Fraser |
|
|
Green |
|
|
Rodriguez |
|
|
Handelman |
|
|
Jackson |
|
|
Kremling |
|
||||||
|
FY 2018 (1) |
|
$ |
788,000 |
|
|
$ |
220,497 |
|
|
$ |
300,000 |
|
|
$ |
364,000 |
|
|
$ |
301,000 |
|
|
$ |
362,000 |
|
|
FY 2017 |
|
$ |
736,000 |
|
|
|
— |
|
|
|
260,000 |
|
|
$ |
360,000 |
|
|
$ |
287,000 |
|
|
$ |
345,000 |
|
|
% Increase |
|
|
7.1 |
% |
|
|
— |
|
|
|
15.4 |
% |
|
|
1.1 |
% |
|
|
4.9 |
% |
|
|
4.9 |
% |
|
(1) |
The table presents annualized base salaries. For actual base salaries paid to the NEOs see the Summary Compensation Table below. Mr. Green became an NEO upon becoming CFO in February 2018. Mr. Rodriguez left the Company in February 2018. |
Annual Incentive Compensation
General
Our annual incentive compensation is designed to focus and motivate our executives to achieve our strategic objectives.
The Compensation Committee administers our annual incentive awards to executives, but delegates to our CEO the day-to-day responsibility for the program with respect to the other executives. Annual incentive compensation rewards executives based upon achievement of the financial performance objectives and individual performance objectives that are established by the Compensation Committee, based upon the recommendation of the CEO for the other executive officers. The Compensation Committee establishes the financial and individual objectives for the CEO. The Compensation Committee evaluates each particular individual’s achievement or progress toward the objectives, and determines the degree to which the objectives have been achieved. The Compensation Committee may make adjustments to the objectives or weight given to a particular objective to take into account special or unforeseen circumstances.
Annual incentive compensation is paid as a percentage of base salary. The annual incentive is calculated for each performance objective using the formula: Base Salary × Annual Incentive Level at Target × % Objective Weight × Payout % for Objective Achieved. The Compensation Committee intends to set annual target incentive compensation at approximately the median of national survey and peer group data.
16
The table below shows the annual incentive targets for NEOs for fiscal year 2018. Mr. Rodriguez left the Company in February 2018 and so did not receive any annual incentive award in fiscal year 2018 and is not included in the table below.
Target Incentive Awards for Fiscal Year 2018 for the NEOs
|
Name |
|
Target Incentive (% of Base Salary) |
|
|
Target Incentive ($) |
|
||
|
Christopher T. Fraser |
|
|
90 |
% |
|
|
709,200 |
|
|
Marvin T. Green III |
|
|
50 |
% |
|
|
110,249 |
|
|
Jeffrey S. Handelman |
|
|
50 |
% |
|
|
182,000 |
|
|
Roger C. Jackson |
|
|
50 |
% |
|
|
150,500 |
|
|
Ernest C. Kremling |
|
|
50 |
% |
|
|
181,000 |
|
Annual incentive compensation for our CEO and the other NEOs is subject to a potential range from threshold, to target, to maximum. For fiscal year 2018, the threshold performance payout is set at 45% of base salary for our CEO and 25% of base salary for the other NEOs. The maximum payout is set at 166.5% of base salary for our CEO and 92.5% of base salary for the other NEOs.
Financial Performance Objectives
The Board of Directors establishes financial performance objectives based upon one or more of the following performance measures:
|
|
• |
return on equity, assets, capital or investment; |
|
|
• |
revenue growth; |
|
|
• |
earnings per share growth; |
|
|
• |
EBITDA; |
|
|
• |
gross margin; and |
|
|
• |
operating cash flow or cash flow from operating activities. |
Financial performance metrics may be adjusted for acquisitions, restructuring expenses, foreign exchange translation gains/losses, stock-based compensation and other items as determined to be appropriate by the Compensation Committee. The financial performance objectives may be identical for all executives or may differ among executives to reflect more appropriate measures related to a particular individual’s performance. Performance measures are adopted and weighted by the Compensation Committee annually to give emphasis to performance for which executives have the most direct control.
Each executive’s objectives have a threshold level below which no award will be payable, a target level and a maximum award level. The target level for financial objectives is generally set based on performance at 100% of budget for the fiscal year. Threshold and maximum are generally set at 80% and 120% of target, respectively. Each objective is given a weight relative to the other financial performance and personal objectives.
For fiscal year 2018, the table below shows the performance objectives and actual results for adjusted EBITDA and adjusted return on invested capital:
Annual Incentive Performance Objectives and Results in Fiscal Year 2018
|
Performance Objective (1) |
|
Performance Target |
|
|
Actual Results |
|
|
Achievement (% of Target) |
|
|
Payout (% of Target) |
|
|
Corporate EBITDA, adjusted |
|
$112.4 million |
|
|
$119.7 million |
|
|
106.5% |
|
|
132.4% |
|
|
Return on Invested Capital, adjusted |
|
12% |
|
|
13.2% |
|
|
111.0% |
|
|
160.0% |
|
|
(1) |
EBITDA and return on invested capital were adjusted for restructuring and realignment expenses, acquisition and integration expenses, non-budgeted acquisitions, currency exchange gains and losses and stock-based compensation expense. |
17
For our corporate level NEOs, including Mr. Fraser, Mr. Green and Mr. Jackson, adjusted EBITDA and adjusted return on invested capital accounted for 70% of the annual incentive opportunity, and individual performance objectives described below accounted for 30%. For our business leaders, these corporate metrics accounted for 30% of the annual incentive opportunity, adjusted EBITDA for the applicable business accounted for 40% and individual performance objectives accounted for 30%. For Handelman, 30% of his award opportunity was based on the adjusted EBITDA of our electronic chemicals business, measured against threshold, target, and maximum levels of adjusted EBITDA set by the Compensation Committee. For fiscal year 2018, adjusted electronic chemicals EBITDA was achieved at 101.7% of target (for a payout percentage of 108.4%). In the case of Mr. Kremling, 30% of the annual incentive opportunity was based on the adjusted EBITDA of our industrial lubricants and wood treating businesses, measured against threshold, target, and maximum levels of adjusted EBITDA set by the Compensation Committee. For fiscal year 2018, adjusted EBITDA for the industrial lubricants and wood treating chemicals businesses was achieved at 127.3% of target (for a payout percentage of 200.0%).
Individual Performance Objectives
Personal goals for NEOs are selected by the Compensation Committee based on input from the CEO, as to other executive officers, and the input of other Board members. The personal goals for each individual are generally selected from areas of our business where the executive has the most direct and substantial involvement, and number from four to seven items. They are often very specific, and usually include initiating or completing projects having an important strategic or operational impact.
Although achievement of personal goals is determined by the Compensation Committee most often on the basis of a subjective or qualitative analysis, the committee tries to define the goals in a way that they can readily determine that they have been met. When the goals lend themselves to a quantitative approach, that method is used. For fiscal year 2018, the Compensation Committee included the factors described below when evaluating each NEO’s achievement of his personal goals.
Mr. Fraser successfully led efforts to continue the integration of recent acquisitions, conducted a comprehensive succession planning review and led the company’s successful equity raise in the fiscal year. For fiscal year 2018, the Compensation Committee determined that Mr. Fraser achieved his personal goals at 120% of target, thus earning a payout percentage of 150%.
Mr. Green successfully and effectively fulfilled the responsibilities of Chief Financial Officer upon the departure of the prior officeholder. The Compensation Committee determined that he achieved personal goals as a percentage of target and as a payout percentage of 120% and 150%, respectively.
Mr. Handelman effectively led various organizational projects in the electronic chemicals business, including by upgrading business talent, addressed tactical and strategic elements for important products, and participated in several Board and industry-facing projects. The Compensation Committee determined that he achieved personal goals as a percentage of target and as a payout percentage of 95% and 87.5%, respectively.
Mr. Jackson was a significant contributor to the successful equity raise in fiscal year 2018 and began implementation of enhanced compliance processes. The Compensation Committee determined that he achieved personal goals as a percentage of target and as a payout percentage of 100% and 100%, respectively.
Mr. Kremling successfully managed integration efforts in certain of our business, promoted the company’s business excellence program, and implemented improvements in the environmental, health and safety function. The Compensation Committee determined that he achieved personal goals as a percentage of target and as a payout percentage of 105% and 112.5%, respectively.
Annual Incentives Earned
Based on the business and individual performance results described above, the Compensation Committee awarded the annual incentive compensation described in the table below to our NEOs in fiscal year 2018. Mr. Rodriguez left the Company in February 2018 and did not receive an annual incentive award for fiscal year 2018.
|
Name |
|
Target Incentive ($) |
|
|
Actual Incentive ($) |
|
|
Actual Incentive (% of Target) |
|
|||
|
Christopher T. Fraser |
|
|
709,200 |
|
|
|
1,013,018 |
|
|
|
143 |
% |
|
Marvin T. Green III |
|
|
110,249 |
|
|
|
162,121 |
|
|
|
147 |
% |
|
Jeffrey S. Handelman |
|
|
182,000 |
|
|
|
204,151 |
|
|
|
112 |
% |
|
Roger C. Jackson |
|
|
150,500 |
|
|
|
192,582 |
|
|
|
128 |
% |
|
Ernest C. Kremling |
|
|
181,000 |
|
|
|
282,422 |
|
|
|
156 |
% |
18
Long-Term Incentive Compensation
General
We provide our NEOs with long-term equity compensation tied to our performance. We believe that this aligns the financial interests of our shareholders with the interests of our executives, and motivates our executive officers to enhance shareholder value. Additionally, the Compensation Committee believes that long-term equity compensation serves as an important retention tool. Long‑term equity compensation should comprise the largest percentage of executive compensation. Long-term equity incentives are targeted at the market 50th percentile, if performance objectives are achieved. However, the actual long-term incentive compensation delivered may be less or more than target based on performance. The Compensation Committee currently administers equity incentives under our 2016 Long-Term Incentive Plan and 2009 Long-Term Incentive Plan.
The Compensation Committee determines long-term incentive award levels and the types of awards from the financial results for the prior fiscal year. Long-term incentive grants vary in amount from year to year based on the performance of the executive, his or her expected role in our future performance and on our financial performance. In setting new long-term equity awards, the Compensation Committee also considers prior equity grants made to the executive officer, which were often made as new hire or special recognition awards.
In fiscal year 2018, we granted performance-based RSU awards to our executives. Although we may consider grants of stock options in the future, we have not issued any stock options in recent years and there are currently none outstanding.
Fiscal Year 2018 Performance-Based Restricted Stock Unit Awards
Performance-based RSU awards were granted to the NEOs in fiscal year 2018. The Compensation Committee has designed the performance-based RSU awards to encourage retention of executives by using three-year overlapping performance periods.
In fiscal year 2018, the awards to NEOs were granted as Series 4 awards of RSUs. Each Series 4 award includes two performance-based tranches (with each tranche accounting for 50% of the award). For the first tranche, vesting is subject to the achievement of an adjusted EBITDA metric. For the second tranche, vesting is subject to performance requirements for adjusted average annual return on invested capital and annual compound growth rate in the Company’s adjusted diluted earnings per share. Performance under the awards is measured over a three-year period beginning August 1, 2017. The fiscal year 2018 Series 4 awards granted to the NEOs an aggregate target amount of 45,918 performance-based RSUs, excluding 4,582 performance-based RSUs granted to Mr. Rodriguez that were forfeited when we left the Company in February 2018. Awards for all recipients vest based on satisfaction of performance requirements at July 31, 2020. The individual awards to particular NEOs are described in the Grants of Plan-Based Awards table.
When considering the individual awards, the Compensation Committee determines, based on market survey data, a target award level as a percentage of base pay appropriate for each executive. The value of the RSUs used to calculate the number of RSUs then awarded takes into consideration the share price at grant and may take into consideration anticipated share appreciation. In fiscal year 2018, the Compensation Committee assumed a Common Stock price of $49.11 per share when establishing awards (at the beginning of the 3-year performance measurement period for the awards the actual share price was $50.62). None of the awards received dividends or dividend equivalents. The Grants of Plan-Based Awards table sets forth the performance-based restricted stock awards made to the NEOs in fiscal year 2018.
Long-Term Incentive Compensation Vesting in Fiscal Year 2018
The Stock Vested table below sets forth details of the performance-based and time-based RSU awards to the NEOs that vested in fiscal year 2018.
Broad-Based Employee Benefits
Our employee benefits are designed to allow us to be attractive to current and potential employees and to remain competitive in the market.
Health and Welfare Plans
We offer health and welfare benefits to substantially all employees, including executives. These benefits include medical, dental, life, accidental death, short and long-term disability, and long-term care coverage. Executives make the same contributions for the same type of coverage, and receive the same level of benefits as other employees for each form of coverage or benefit. We provide vacation and paid holidays to all eligible employees, including executives, that is comparable to other similarly sized companies.
19
We offer a defined contribution 401(k) plan to substantially all of our employees in the United States. In calendar year 2018, participants may contribute up to $18,500 of their compensation, raised from a contribution limit of $18,000 in calendar year 2017. We make matching contributions under the plan up to 4% of the participant’s compensation. Employees age 50 or over are entitled to make an additional pre-tax contribution of up to $6,000 per year. Employees are fully vested in employer contributions. The Summary Compensation Table reflects our contributions to the 401(k) Plan for each NEO.
Other Agreement and Benefits
Executive benefits or perquisites may be provided on a limited basis to attract and retain key executives. Currently, we do not offer executive benefits or perquisites with a value over $10,000 to any executive.
Employment Agreements
We currently have employment agreements with two of our NEOs, Mr. Fraser and Mr. Jackson. Mr. Fraser’s employment agreement continues until terminated. Mr. Jackson’s employment agreement automatically renews for one-year periods, and will continue to do so unless we provide at least 60 days prior written notice of non-renewal. The employment agreements contain provisions for the assignment to us of any right, title and interest in all works, copyrights, materials, inventions, ideas, discoveries, designs, improvements, trade secrets, patents and trademarks, and any applications related thereto, during Mr. Fraser’s or Mr. Jackson’s employment. The agreements contain provisions prohibiting the disclosure of confidential information.
In Mr. Fraser’s agreement we also agreed to grant performance-based RSU awards for 10,000 shares of common stock (at maximum) based upon the achievement of certain financial objectives, and 4,000 shares of common stock based upon the achievement certain organizational objectives, in fiscal year 2018. Under the terms of Mr. Jackson’s agreement, if we terminate his employment (other than for cause or due to death or disability) or elect not to extend his employment for the renewal term, or if he voluntarily terminates his employment for good reason following a change of control, then we must pay him a termination payment equal to a multiple of his base salary at termination. See “Potential Payments upon Termination or Change in Control” for additional information.
Additionally, each of our NEOs, except for Mr. Green, signed an agreement with non-compete obligations prohibiting the executive from engaging and being financially interested in any business which is competitive with us during his term of employment and for a period of one year after his employment with us terminates, unless he first obtains our prior written consent. In the event an executive breaches any of these provisions, we may terminate any payments then owing to the executive and/or seek specific performance or injunctive relief for such breach or threatened breach.
Executive Severance Plan
The Board of Directors approved an executive severance plan in fiscal year 2009. The plan provides that any regular, full-time employee who is designated by the Compensation Committee may become a participant. Except for Mr. Jackson, all of our NEOs have been designated as participants under the plan. The Compensation Committee intends, in appropriate cases, to use the plan to offer severance to eligible employees, including future hires. In anticipation of additional participants, the Compensation Committee has established three participation levels. The plan may also be used to offer severance payments in lieu of the severance payments under current employment agreements or severance plans to eligible employees wishing to convert to the plan.
The plan is designed to provide an eligible employee with a severance payment in the event of a qualifying termination, which is with respect to an eligible employee who (i) is affirmatively discharged from employment by us, other than a discharge for cause, or (ii) voluntarily terminates for good reason, as defined in the plan. The severance benefit is based on the participation level of the eligible employee as assigned by the Compensation Committee, and is calculated at a multiple of (i) base salary or (ii) base salary and annual incentive award at the target level. The severance benefit is paid in a lump sum.
For a qualifying termination occurring more than 30 days before a change of control, the severance benefit is 2.0x, 1.5x or 1.0x of base salary for the three participation levels. The highest participation level is for a CEO-participant, the second is for other senior executives who are participants and the third level is for all other participants. For a qualifying termination occurring within 30 days before or two years after a change of control, the benefit is 2.5x, 2.0x or 1.5x of base salary plus annual incentive compensation at the target level. If the qualifying termination was not for cause but was instead related to performance issues, the severance benefit is 1.0x, 0.75x or 0.5x of base salary only. In the case of a qualifying termination occurring within 30 days before or two years after a change of control or a qualifying termination occurring for good reason, the eligible employee is also paid a prorated portion of his or her annual incentive compensation.
20
In order for an eligible employee to receive severance benefits under the executive severance plan, he or she must execute and deliver an acceptable release of all claims.
Deferred Compensation Plan
In September 2017, we adopted an unfunded nonqualified deferred compensation plan (the “Deferred Compensation Plan”) for the benefit of certain employees, including the Company’s NEOs. Pursuant to the Deferred Compensation Plan and subject to applicable tax laws, participants may elect to defer up to 90% of each of base salary, short‑term incentive compensation, or long-term incentive compensation, or 100% of Form 1099 compensation. The Company may, in its sole discretion, provide discretionary contributions to the Deferred Compensation Plan. Participants will be 100% vested at all times in their deferral accounts. A Participant may receive a distribution from the Deferred Compensation Plan upon a qualifying distribution event such as separation from service, disability, death or unforeseeable emergency, or an in-service distribution at times elected by the Participant, all as defined in the Deferred Compensation Plan. Distributions from the Deferred Compensation Plan will be made in the manner elected by the Participant pursuant to the terms of the Deferred Compensation Plan. Compensation deferred under the Deferred Compensation Plan represents an unsecured obligation of the Company.
How We Determine Executive Officer Compensation
Role of the Compensation Committee
The Compensation Committee is composed of independent, outside members of the Board of Directors in accordance with New York Stock Exchange rules and current SEC rules and regulations, and all but one member is independent under Section 162(m) of the Internal Revenue Code of 1986 (the “Code”). They are responsible for establishing, reviewing, approving and monitoring the compensation paid to the NEOs.
Role of Executive Officers in Setting Compensation
Our CEO provides input on the Compensation Committee agenda, including background information regarding our strategic objectives, suggestions on annual performance targets and reports on his evaluations of the other executive officers. He makes recommendations with respect to merit increases and annual incentive goals for such other executive officers that are then reviewed by the Compensation Committee prior to final approval. Since our CEO is a member of the Board, he has input on the overall compensation program. The Compensation Committee makes the decision related to the CEO’s compensation.
The Compensation Committee meetings are attended by the committee members, and as needed, by other directors, the CEO, CFO, General Counsel and outside advisors, including our compensation consultant. The Compensation Committee regularly meets in executive session without any members of management present.
Role of the Independent Consultant
The Compensation Committee has the sole authority, to the extent deemed necessary and appropriate, to retain and terminate any compensation consultants and has the sole authority to approve related fees and other retention terms. In fiscal year 2018, the Compensation Committee engaged Pearl Meyer & Partners (“Pearl Meyer”) to advise it on executive compensation for fiscal year 2018 and for fiscal year 2019. Pearl Meyer is independent of us, reports directly to the Compensation Committee, and has no other business relationship with us other than assisting the committee with its executive compensation and board compensation practices. The independence of the consultant is considered annually by the committee. In fiscal year 2018, we incurred expense of approximately $83,910 with Pearl Meyer in connection with this work. The Compensation Committee and Pearl Meyer review salaries based on our current and projected company size and annual and long-term incentive programs established for each executive’s position based on data from general industry surveys and our peer companies relating to our current and projected company size.
Other Important Compensation Policies
Stock Ownership Requirements for Named Executive Officers
We have adopted a stock ownership requirement for certain executives that is measured as of the end of each fiscal year. The requirement calls for stock ownership related to base salary to equal three times base salary for the CEO, two times base salary for the VP-Operations, CFO and General Counsel and one time base salary for other designated executives. Executives covered by the requirement must achieve the stock ownership within five years of becoming an executive. Among the measures the Compensation Committee may consider if the required stock ownership level is not met by an executive, the after-tax portion of a cash bonus due to
21
that executive may be paid in shares of our Common Stock. As of July 31, 2018, all of our executives had satisfied the stock ownership requirement as it applies to them.
Consideration of Risk
The Compensation Committee, with assistance of its independent compensation consultant, reviewed the elements of our executive compensation during fiscal year 2018 to determine whether any portion of executive compensation encouraged excessive risk taking. Management assessed risk with respect to the compensation of other employees. Management and the Compensation Committee believe that risks arising from our compensation policies and practices for our executive officers and other employees are not reasonably likely to have a material adverse effect on us. In addition, we believe that the mix and design of the elements of compensation do not encourage management to assume excessive risks.
Financial Restatement
The Compensation Committee does not have a policy in place governing modifications to compensation where the payment of such compensation was based upon the achievement of specific results that were subsequently subject to restatement. If the Compensation Committee deems it appropriate, however, to the extent permitted by governing law, we will seek to recoup amounts determined by a financial restatement to have been inappropriately paid to an executive officer. Our performance-based restricted stock awards include a provision authorizing recoupment.
Trading in Our Stock Derivatives
Our Insider Trading Policy prohibits directors and employees from purchasing or selling options on our Common Stock, engaging in short sales with respect to our Common Stock, or trading in puts, calls, straddles, equity swaps or other derivative securities that are directly linked to our Common Stock.
Tax and Accounting Implications of our Forms of Compensation
The Company has accounted for the tax effects of the Tax Cuts and Jobs Act of 2017 (the “Tax Act”), under the guidance of Staff Accounting Bulletin No. 118, Income Tax Accounting Implications of the Tax Cuts and Jobs Act, or SAB 118, on a provisional basis. The Company continued its assessment of the impacts of the new provisions associated with the deductibility of executive compensation under Internal Revenue Code Section 162(m) under the Tax Act. On August 21, 2018, the Internal Revenue Service (“IRS”) issued Notice 2018-68, which provides interpretative guidance on the application of the new executive compensation deduction limits enacted under the Tax Act. As of July 31, 2018, the Company recorded an adjustment of $0.2 million of previously recognized tax benefits associated with executive officers’ stock-based compensation deductions.
While the Compensation Committee cannot predict with certainty how our executive compensation might be affected in the future by the Code, the committee intends to try to preserve the tax deductibility of executive compensation while maintaining an executive compensation program consistent with our compensation philosophy.
Our compensation program contains the following tax and accounting implications:
|
|
• |
From and after January 1, 2018, compensation awarded in excess of $1 million for our covered employees (our CEO and our three other highest paid executives) will generally not be deductible. |
|
|
• |
Performance-based restricted share awards are expensed over the performance and service period when payout is probable. No dividends are paid on performance restricted stock until shares are actually issued. |
|
|
• |
Our 401(k) contributions are accrued and expensed in the year of service. |
22
2017 Advisory Vote on Executive Compensation
The Compensation Committee considered the results of the 2017 advisory, non-binding “say-on-pay” proposal in connection with the discharge of its responsibilities. Because 98.2% of our shareholders voting on the “say on pay” proposal approved the compensation of the NEOs described in our proxy statement for our 2017 Annual Meeting of Shareholders, the Compensation Committee did not implement significant changes to our executive compensation program as a result of the shareholder advisory vote. The Board currently intends to ask for an advisory, non-binding vote on compensation each year in connection with an annual shareholders meeting.
Compensation Committee Report
The Compensation Committee has reviewed and discussed with management the foregoing Compensation Discussion and Analysis. Based on this review and discussion with management, the Compensation Committee recommended to the Board of Directors that the Compensation Discussion and Analysis be included in this Annual Report on Form 10-K.
The Compensation Committee:
John C. Hunter, III, Chair
Gerald G. Ermentrout
Robert Harrer
Fred C. Leonard, III
Margaret C. Montana
Compensation Committee Interlocks and Insider Participation
During fiscal year 2018, none of the members of the Compensation Committee have served as officers or employees of the Company or of any of our subsidiaries or had a relationship requiring disclosure under this caption.
During fiscal year 2018, none of our executive officers served as a member of a compensation committee or board of directors of any other entity that has an executive officer serving as a member of our Compensation Committee or Board of Directors.
23
The following table presents information for the three fiscal years ended July 31, 2018, 2017 and 2016 for our NEOs, except for Mr. Green who became an NEO in 2018, and Mr. Handelman who became an NEO in 2017.
|
Name and Principal Position |
|
Year |
|
Salary ($) (1) |
|
|
Bonus ($) |
|
|
Stock Awards ($) (2) |
|
|
Non-Equity Incentive Plan Compensation ($) (3) |
|
|
All Other Compensation ($) (4) |
|
|
Total ($) |
|
||||||
|
Christopher T. Fraser |
|
2018 |
|
|
786,042 |
|
|
|
— |
|
|
|
2,232,727 |
|
|
|
1,013,018 |
|
|
|
14,863 |
|
|
|
4,046,650 |
|
|
Director, President and |
|
2017 |
|
|
736,204 |
|
|
|
— |
|
|
|
1,709,281 |
|
|
|
1,089,950 |
|
|
|
10,800 |
|
|
|
3,546,235 |
|
|
Chief Executive Officer |
|
2016 |
|
|
708,361 |
|
|
|
— |
|
|
|
5,005,227 |
|
|
|
1,018,446 |
|
|
|
73,766 |
|
|
|
6,805,800 |
|
|
Marvin T. Green III (5) |
|
2018 |
|
|
226,433 |
|
|
|
— |
|
|
|
235,707 |
|
|
|
162,121 |
|
|
|
7,592 |
|
|
|
631,853 |
|
|
Chief Financial Officer |
|
|
|
|
|
|
|
|
|
|
|
|
|
|
|
|
|
|
|
|
|
|
|
|
|
|
|
Marcelino Rodriguez (6) |
|
2018 |
|
|
191,422 |
|
|
|
— |
|
|
|
247,840 |
|
|
|
— |
|
|
|
7,065 |
|
|
|
446,327 |
|
|
Former Vice President and |
|
2017 |
|
|
260,000 |
|
|
|
— |
|
|
|
202,897 |
|
|
|
204,100 |
|
|
|
8,000 |
|
|
|
674,997 |
|
|
Chief Financial Officer |
|
2016 |
|
|
202,522 |
|
|
|
— |
|
|
|
32,835 |
|
|
|
79,642 |
|
|
|
8,101 |
|
|
|
323,100 |
|
|
Jeffrey S. Handelman |
|
2018 |
|
|
362,063 |
|
|
|
— |
|
|
|
380,902 |
|
|
|
204,151 |
|
|
|
52,357 |
|
|
|
999,472 |
|
|
Senior Vice President |
|
2017 |
|
|
124,615 |
|
|
|
— |
|
|
|
1,001,550 |
|
|
|
187,110 |
|
|
|
25,465 |
|
|
|
1,338,740 |
|
|
Electronic Chemicals |
|
|
|
|
|
|
|
|
|
|
|
|
|
|
|
|
|
|
|
|
|
|
|
|
|
|
|
Roger C. Jackson |
|
2018 |
|
|
300,450 |
|
|
|
— |
|
|
|
248,598 |
|
|
|
192,582 |
|
|
|
11,120 |
|
|
|
752,749 |
|
|
Vice President, General Counsel and |
|
2017 |
|
|
286,600 |
|
|
|
— |
|
|
|
223,914 |
|
|
|
224,981 |
|
|
|
10,915 |
|
|
|
746,410 |
|
|
Secretary |
|
2016 |
|
|
271,450 |
|
|
|
— |
|
|
|
211,155 |
|
|
|
196,462 |
|
|
|
10,858 |
|
|
|
689,925 |
|
|
Ernest C. Kremling |
|
2018 |
|
|
361,084 |
|
|
|
— |
|
|
|
378,738 |
|
|
|
282,422 |
|
|
|
11,184 |
|
|
|
1,033,428 |
|
|
Senior Vice President |
|
2017 |
|
|
344,328 |
|
|
|
— |
|
|
|
340,995 |
|
|
|
272,420 |
|
|
|
19,583 |
|
|
|
977,326 |
|
|
Industrial Lubricants, Wood Treating |
|
2016 |
|
|
322,270 |
|
|
|
— |
|
|
|
318,996 |
|
|
|
245,328 |
|
|
|
81,090 |
|
|
|
967,684 |
|
|
Chemicals and Manufacturing Services |
|
|
|
|
|
|
|
|
|
|
|
|
|
|
|
|
|
|
|
|
|
|
|
|
|
|
|
(1) |
Salary reflects actual base salary paid during the fiscal year, before deferrals under our Deferred Compensation Plan. |
|
(2) |
Stock Awards reflect the grant date fair value of RSU awards granted in each of the respective fiscal years calculated in accordance with accounting principles generally accepted in the United States. The value of performance-based RSU awards is presented assuming target performance objectives are met. The assumptions used in calculating those amounts are set forth in note 14 of our audited consolidated financial statements in our Annual Report on Form 10-K for the year ended July 31, 2018. The table includes the grant date fair value of performance-based RSU made in fiscal year 2018 to Mr. Fraser, Mr. Rodriguez, Mr. Handelman, Mr. Jackson and Mr. Kremling, based on a value of $54.09 per share on the date of grant. If the maximum performance conditions are achieved on these awards, the value at the grant date of these performance-based RSU awards would be $2,970,461 to Mr. Fraser, $371,706 to Mr. Rodriguez, $571,299 to Mr. Handelman, $372,951 to Mr. Jackson and $568,161 to Mr. Kremling. Mr. Green received a performance-based RSU award in fiscal year 2018 with a grant date fair value of $18,066, based on a value of $60.22 per share on the date of grant. If the maximum performance conditions are achieved on Mr. Green’s performance-based RSU award, the value at the grant date of this performance-based RSU award would be $26,132. Mr. Green also received three time‑based RSU awards with grant date fair values of $91,396, $18,066 and $108,180, based on values of $60.93, $60.22 and $54.09 per share on the date of each grant, respectively. See also the table respecting Grants of Plan-Based Awards for the fiscal year 2018 awards. |
|
(3) |
Non-Equity Incentive Plan Compensation represents payments under our annual incentive plan, before deferrals under our Deferred Compensation Plan. See the discussion of our incentive plan under the Compensation Discussion and Analysis section of this Form 10-K/A. |
|
(4) |
Under our 401(k) plan for United States based employees, we match up to 4% of participant’s compensation. Matching contributions to our 401(k) plan of $14,863 to Mr. Fraser, $7,592 to Mr. Green, $7,065 to Mr. Rodriguez, $7,743 to Mr. Handelman, $11,120 to Mr. Jackson and $11,184 to Mr. Kremling are included in All Other Compensation. All Other Compensation for Mr. Handelman for fiscal year 2018 also includes payments for relocation expenses of $41,000, plus a related tax gross-up payment of $3,613. |
|
(5) |
Mr. Green became an NEO upon becoming CFO in February 2018. The amounts included in the table for fiscal year 2018 include compensation to him as Director of Corporate Development prior to becoming CFO. |
|
(6) |
Mr. Rodriguez left the Company in February 2018. Unvested RSU awards for Mr. Rodriguez, including all of the awards listed in the table under Stock Awards for fiscal years 2018, 2017 and 2016, were forfeited when he left the Company. |
24
The following table presents information respecting grants of plan based awards for fiscal year 2018.
|
|
|
|
|
Date of Board or Compensation Committee |
|
Estimated Future Payouts Under Non-Equity Incentive Plans ($) (1) |
|
|
Estimated Future Payouts Under Equity Incentive Plan Awards (#) (1)(2)(3) |
|
|
All Other Stock Awards |
|
|
Grant Date Fair Value of Stock |
|
||||||||||||||||||||
|
Name |
|
Grant Date |
|
Action |
|
Threshold |
|
|
Target |
|
|
Maximum |
|
|
Threshold |
|
|
Target |
|
|
Maximum |
|
|
(#)(4) |
|
|
Awards (5) |
|
||||||||
|
Christopher T. Fraser |
|
— |
|
— |
|
|
354,600 |
|
|
|
709,200 |
|
|
|
1,312,020 |
|
|
|
|
|
|
|
|
|
|
|
|
|
|
|
|
|
|
|
|
|
|
|
|
12/5/2017 |
|
12/5/2017 |
|
|
|
|
|
|
|
|
|
|
|
|
|
|
20,458 |
|
|
|
27,278 |
|
|
|
40,917 |
|
|
|
|
|
|
|
1,475,467 |
|
|
|
|
12/5/2017 |
|
12/5/2017 |
|
|
|
|
|
|
|
|
|
|
|
|
|
|
5,000 |
|
|
|
10,000 |
|
|
|
10,000 |
|
|
|
|
|
|
|
540,900 |
|
|
|
|
12/5/2017 |
|
12/5/2017 |
|
|
|
|
|
|
|
|
|
|
|
|
|
|
4,000 |
|
|
|
4,000 |
|
|
|
4,000 |
|
|
|
|
|
|
|
216,360 |
|
|
Marvin T. Green III |
|
— |
|
— |
|
|
55,124 |
|
|
|
110,249 |
|
|
|
203,960 |
|
|
|
|
|
|
|
|
|
|
|
|
|
|
|
|
|
|
|
|
|
|
|
|
2/15/2018 |
|
2/15/2018 |
|
|
|
|
|
|
|
|
|
|
|
|
|
|
150 |
|
|
|
300 |
|
|
|
600 |
|
|
|
|
|
|
|
18,066 |
|
|
|
|
4/5/2018 |
|
4/5/2018 |
|
|
|
|
|
|
|
|
|
|
|
|
|
|
|
|
|
|
|
|
|
|
|
|
|
|
1,500 |
|
|
|
91,395 |
|
|
|
|
2/15/2018 |
|
2/15/2018 |
|
|
|
|
|
|
|
|
|
|
|
|
|
|
|
|
|
|
|
|
|
|
|
|
|
|
300 |
|
|
|
18,066 |
|
|
|
|
12/5/2017 |
|
12/5/2017 |
|
|
|
|
|
|
|
|
|
|
|
|
|
|
|
|
|
|
|
|
|
|
|
|
|
|
2,000 |
|
|
|
108,180 |
|
|
Marcelino Rodriguez (6) |
|
12/5/2017 |
|
12/5/2017 |
|
|
|
|
|
|
|
|
|
|
|
|
|
|
3,436 |
|
|
|
4,582 |
|
|
|
6,872 |
|
|
|
|
|
|
|
247,840 |
|
|
Jeffrey S. Handelman |
|
— |
|
— |
|
|
91,000 |
|
|
|
182,000 |
|
|
|
336,700 |
|
|
|
|
|
|
|
|
|
|
|
|
|
|
|
|
|
|
|
|
|
|
|
|
12/5/2017 |
|
12/5/2017 |
|
|
|
|
|
|
|
|
|
|
|
|
|
|
5,281 |
|
|
|
7,042 |
|
|
|
10,562 |
|
|
|
|
|
|
|
380,902 |
|
|
Roger C. Jackson |
|
— |
|
— |
|
|
75,250 |
|
|
|
150,500 |
|
|
|
278,425 |
|
|
|
|
|
|
|
|
|
|
|
|
|
|
|
|
|
|
|
|
|
|
|
|
12/5/2017 |
|
12/5/2017 |
|
|
|
|
|
|
|
|
|
|
|
|
|
|
3,447 |
|
|
|
4,596 |
|
|
|
6,895 |
|
|
|
|
|
|
|
248,598 |
|
|
Ernest C. Kremling |
|
— |
|
— |
|
|
90,500 |
|
|
|
181,000 |
|
|
|
334,850 |
|
|
|
|
|
|
|
|
|
|
|
|
|
|
|
|
|
|
|
|
|
|
|
|
12/5/2017 |
|
12/5/2017 |
|
|
|
|
|
|
|
|
|
|
|
|
|
|
5,252 |
|
|
|
7,002 |
|
|
|
10,504 |
|
|
|
|
|
|
|
378,738 |
|
|
(1) |
See the discussion of our incentive plan under the Compensation Discussion and Analysis section of this Form 10-K/A. See “Merger Transaction with Cabot Microelectronics” |
|
(2) |
On December 5, 2017 (for all NEOs other than Mr. Green), the NEOs in the above table were granted Series 4 performance-based RSU awards. Each Series 4 performance-based RSU award includes two tranches. For the first tranche, vesting is subject to the achievement of an adjusted EBITDA metric. For the second tranche, vesting is subject to performance requirements for adjusted average annual return on invested capital and annual compound growth rate in the Company’s adjusted diluted earnings per share. Performance under the awards is measured over a three-year period beginning August 1, 2017. A threshold of 30.0% of the award vests if the adjusted earnings per share growth rate over the measuring period is at least 5.0%. If adjusted return on invested capital is at least 8.0% a threshold award of 20.0% vests. The maximum award of 200.0% vests if the earnings per share growth rate over the measuring period is at least 20.0% and the average annual return on invested capital is at least 16.0%. On February 15, 2018, Mr. Green was granted a Series 3 performance-based RSU award with the same vesting schedule and performance requirements as the second tranche of the Series 4 performance-based RSU awards granted to the other NEOs. |
|
(3) |
On December 5, 2017, Mr. Fraser was granted Series 3 performance-based RSU awards: 10,000 shares of the Series 3 performance-based RSU awards are subject to a performance requirement for net debt repayments with a threshold vesting of 50% at not less than $20.0 million repaid and a maximum award vesting at $25.0 million repaid; and 4,000 shares of the Series 3 performance-based RSU awards are subject to a requirement to meet organizational goals. |
|
(4) |
On December 5, 2017, Mr. Green was granted a time-based award for 2,000 RSUs, one half (1/2) of which vested on July 31, 2018, and the second half of which vests on July 31, 2019. On February 15, 2018, Mr. Green was granted an award for 300 RSUs that vests on July 31, 2020. On April 5, 2018, Mr. Green was granted a time-based award for 1,500 RSUs, one half (1/2) of which vested on July 31, 2018, and the second half of which vests on July 31, 2019. |
|
(5) |
This amount represents the aggregate grant date fair value of each award at the target level of each respective award. See note 12 to our audited consolidated financial statements in our Annual Report on Form 10-K for the year ended July 31, 2017. |
|
(6) |
Mr. Rodriguez left the Company in February 2018. All of the awards granted to Mr. Rodriguez in fiscal year 2018 were forfeited when he left the Company. |
25
Outstanding Equity Awards at Fiscal Year-End
The following table presents information respecting outstanding equity awards at July 31, 2018. As of July 31, 2018, we did not have any outstanding stock option awards. Mr. Rodriguez did not have any outstanding equity awards at July 31, 2018.
|
|
|
Stock Awards (1) |
|
|||||||||||||
|
Name |
|
Number of Shares or Units of Stock That Have Not Vested (#) |
|
|
Market Value of Shares or Units of Stock That Have Not Vested ($) (2) |
|
|
Equity Incentive Plan Awards: Number of Unearned Shares, Units or Other Rights That Have Not Vested (#) |
|
|
Equity Incentive Plan Awards: Market or Payout Value of Unearned Shares, Units or Other Rights That Have Not Vested ($) (2) |
|
||||
|
Christopher T. Fraser |
|
|
28,804 |
|
(3) |
|
2,068,127 |
|
|
|
|
|
|
|
|
|
|
|
|
|
53,334 |
|
(4) |
|
3,829,381 |
|
|
|
|
|
|
|
|
|
|
|
|
|
6,000 |
|
(5) |
|
430,800 |
|
|
|
|
|
|
|
|
|
|
|
|
|
|
|
|
|
|
|
|
|
37,644 |
|
(6) |
|
2,702,839 |
|
|
|
|
|
|
|
|
|
|
|
|
|
63,988 |
|
(7) |
|
4,594,338 |
|
|
|
|
|
|
|
|
|
|
|
|
|
56,791 |
|
(8) |
|
4,077,594 |
|
|
|
|
|
|
|
|
|
|
|
|
|
107,543 |
|
(9) |
|
7,721,587 |
|
|
Marvin T. Green III |
|
|
750 |
|
(10) |
|
53,850 |
|
|
|
|
|
|
|
|
|
|
|
|
|
300 |
|
(10) |
|
21,540 |
|
|
|
|
|
|
|
|
|
|
|
|
|
1,000 |
|
(11) |
|
71,800 |
|
|
|
|
|
|
|
|
|
|
|
|
|
563 |
|
(12) |
|
40,423 |
|
|
|
|
|
|
|
|
|
|
|
|
|
375 |
|
(3) |
|
26,925 |
|
|
|
|
|
|
|
|
|
|
|
|
|
|
|
|
|
|
|
|
|
528 |
|
(13) |
|
37,910 |
|
|
|
|
|
|
|
|
|
|
|
|
|
1,046 |
|
(14) |
|
75,103 |
|
|
|
|
|
|
|
|
|
|
|
|
|
739 |
|
(8) |
|
53,060 |
|
|
Jeffrey S. Handelman |
|
|
6,646 |
|
(15) |
|
477,183 |
|
|
|
|
|
|
|
|
|
|
|
|
|
|
|
|
|
|
|
|
|
9,718 |
|
(6) |
|
697,752 |
|
|
|
|
|
|
|
|
|
|
|
|
|
13,009 |
|
(7) |
|
934,046 |
|
|
Roger C. Jackson |
|
|
4,852 |
|
(3) |
|
348,374 |
|
|
|
|
|
|
|
|
|
|
|
|
|
|
|
|
|
|
|
|
|
6,342 |
|
(6) |
|
455,356 |
|
|
|
|
|
|
|
|
|
|
|
|
|
11,007 |
|
(7) |
|
790,303 |
|
|
|
|
|
|
|
|
|
|
|
|
|
9,567 |
|
(8) |
|
686,911 |
|
|
Ernest C. Kremling |
|
|
7,317 |
|
(3) |
|
525,361 |
|
|
|
|
|
|
|
|
|
|
|
|
|
|
|
|
|
|
|
|
|
9,663 |
|
(6) |
|
693,803 |
|
|
|
|
|
|
|
|
|
|
|
|
|
16,762 |
|
(7) |
|
1,203,512 |
|
|
|
|
|
|
|
|
|
|
|
|
|
14,425 |
|
(8) |
|
1,035,715 |
|
|
(1) |
Stock awards reflect grants of performance-based RSU awards and time-based RSU awards under our 2016 Long-Term Incentive Plan and 2009 Long-Term Incentive Plan. See the Compensation Discussion and Analysis section of this Form 10‑K/A and note 14 of our audited consolidated financial statements in our Annual Report on Form 10-K for the year ended July 31, 2018. See “Merger Transaction with Cabot Microelectronics” for a discussion of the treatment of equity awards in connection with the merger transaction with Cabot Microelectronics. |
|
(2) |
Market value is calculated based on our closing stock price on July 31, 2018 of $71.80. |
|
(3) |
Represents fiscal year 2016 time-based RSU awards under our 2016 Long-Term Incentive Plan and 2009 Long-Term Incentive Plan. Awards vest October 31, 2018. The table reflects our estimate that 100.0% of the time-based RSU awards will vest. |
|
(4) |
Represents a fiscal year 2016 time-based RSU award under our 2016 Long-Term Incentive Plan. One half (1/2) of the outstanding award vests at each of July 31, 2019 and 2020. The table reflects our estimate that 100.0% of the time-based RSU awards will vest. |
|
(5) |
Represents a fiscal year 2014 time-based RSU award under our 2009 Long-Term Incentive Plan. The award vests on September 24, 2018. The table reflects our estimate that 100.0% of the time-based RSU award will vest. |
|
(6) |
Represents fiscal year 2018 Series 4 performance-based RSU awards under our 2016 Long-Term Incentive Plan and 2009 Long-Term Incentive Plan. Awards vest July 31, 2020 if performance requirements are satisfied. Each Series 4 performance-based RSU award includes two tranches. The table reflects our estimate that 100.0% of the first tranche will vest and 176% of the second tranche will vest. See the table “Grants of Plan Based Awards.” |
|
(7) |
Represents fiscal year 2017 Series 4 performance-based RSU awards under our 2016 Long-Term Incentive Plan and 2009 Long-Term Incentive Plan. Awards vest July 31, 2019 if performance requirements are satisfied. Each Series 4 performance-based RSU award includes two tranches. The table reflects our estimate that 100.0% of the first tranche will vest and 186% of the second tranche will vest. |
26
|
(9) |
Represents fiscal year 2016 Series 3 performance-based RSU awards under our 2016 Long-Term Incentive Plan. One half (1/2) of the remaining award vests at each of July 31, 2019 and 2020 if performance requirements are satisfied. The table reflects our estimate that 195.0% of the Series 3 performance-based RSU awards will vest. |
|
(10) |
Represents a fiscal year 2018 time-based RSU award under our 2016 Long-Term Incentive Plan. The award vests on July 31, 2020. The table reflects our estimate that 100.0% of the 2018 time-based RSU award will vest. See the table “Grants of Plan Based Awards.” |
|
(11) |
Represents a fiscal year 2018 time-based RSU award under our 2009 Long-Term Incentive Plan. The award vests on July 31, 2019. The table reflects our estimate that 100.0% of the 2018 time-based RSU award will vest. See the table “Grants of Plan Based Awards.” |
|
(12) |
Represents a fiscal year 2017 time-based RSU award under our 2009 Long-Term Incentive Plan. The award vests on July 31, 2019. The table reflects our estimate that 100.0% of the 2017 time-based RSU award will vest. |
|
(13) |
Represents a fiscal year 2018 performance-based RSU award under our 2016 Long-Term Incentive Plan of Series 1 performance-based RSUs. Awards vest July 31, 2020 if performance requirements are satisfied. The table reflects our estimate that 176% of the 2018 performance-based RSU award will vest. See the table “Grants of Plan Based Awards.” |
|
(14) |
Represents a fiscal year 2017 performance-based RSU award under our 2009 Long-Term Incentive Plan of Series 1 performance-based RSUs. Awards vest July 31, 2019 if performance requirements are satisfied. The table reflects our estimate that 186% of the 2017 performance-based RSU award will vest. |
Stock Vested
The following table presents information respecting stock awards vested for NEOs during fiscal year 2018.
|
|
|
Stock Awards |
|
|||||
|
Name |
|
Number of Shares Acquired on Vesting (#) (1) |
|
|
Value Realized On Vesting ($) |
|
||
|
Christopher T. Fraser (2) |
|
|
64,477 |
|
|
|
4,506,929 |
|
|
Marvin T. Green III |
|
|
1,750 |
|
|
|
125,650 |
|
|
Marcelino Rodriguez |
|
|
— |
|
|
|
— |
|
|
Jeffrey S. Handelman |
|
|
3,324 |
|
|
|
185,114 |
|
|
Roger C. Jackson |
|
|
— |
|
|
|
— |
|
|
Ernest C. Kremling |
|
|
— |
|
|
|
— |
|
|
|
(1) |
Number of Shares Acquired on Vesting includes amounts withheld from the executive for the payment of income tax withholding. |
|
|
(2) |
Mr. Fraser elected to defer 37,481 shares under our Deferred Compensation Plan, valued at $2,691,136 based on our closing stock price of $71.80 per share at July 31, 2018, which are not included in the table. |
27
Nonqualified Deferred Compensation
The following table presents information relating to the Deferred Compensation Plan for fiscal year 2018.
|
Name |
|
Executive Contributions in Last FY ($) |
|
|
Registrant Contributions in Last FY ($) |
|
|
Aggregate Earnings in Last FY ($) |
|
|
Aggregate Withdrawals/ Distributions ($) |
|
|
Aggregate Balance at Last FYE ($) |
|
|||||
|
Christopher T. Fraser |
|
|
363,693 |
|
|
|
— |
|
|
|
22,686 |
|
|
|
— |
|
|
|
386,379 |
|
|
Marvin T. Green III |
|
|
46,135 |
|
|
|
— |
|
|
|
2,327 |
|
|
|
— |
|
|
|
48,462 |
|
|
Marcelino Rodriguez (1) |
|
|
6,184 |
|
|
|
— |
|
|
|
901 |
|
|
|
— |
|
|
|
7,085 |
|
|
Jeffrey S. Handelman |
|
|
— |
|
|
|
— |
|
|
|
— |
|
|
|
— |
|
|
|
— |
|
|
Roger C. Jackson |
|
|
— |
|
|
|
— |
|
|
|
— |
|
|
|
— |
|
|
|
— |
|
|
Ernest C. Kremling |
|
|
— |
|
|
|
— |
|
|
|
— |
|
|
|
— |
|
|
|
— |
|
|
|
(1) |
Mr. Rodriguez left the Company in February 2018. |
Potential Payments upon Termination or Change in Control
The following describes the payments and benefits that would be provided to each NEO in the event that this employment is terminated with us for any reason, including death, disability, retirement, voluntary termination, termination for cause and termination without cause, with and without a change in control. The information is provided as of July 31, 2018. See “Merger Transaction with Cabot Microelectronics” for a discussion of the treatment of equity awards and other payments that will be made to our NEOs in connection with the merger transaction with Cabot Microelectronics.
We have an employment agreement that contains severance provisions with Mr. Jackson. At July 31, 2018, four of our NEOs, Mr. Fraser, Mr. Green, Mr. Handelman and Mr. Kremling, are participants in our Executive Severance Plan (the “ESP”). Under the terms of Mr. Jackson’s employment agreement, if we terminate his employment (other than for cause or due to death or disability) or elect not to extend his term of employment for the renewal term, or if he voluntarily terminates his employment for good reason due to a change of control, then we must pay Mr. Jackson a termination payment equal to 3.0 times his base salary. The termination payments are paid in equal annual payments if the termination is not within one year of a change of control. If the termination or election not to extend the employment agreement by us or voluntary resignation for good reason by the executive occurs within one year of a change of control, then any options to acquire shares of our Common Stock held by the executive becomes fully vested as of the date of termination, and are exercisable for a period of two years. Under the ESP, participants are paid severance equal to a pro-rated portion of annual incentive compensation. Messrs. Rodriguez, Handelman and Kremling also would be paid a lump sum payment of 1.5 times base salary if the termination of employment was not in connection with a change of control, or 2.0 times the sum of base salary and target annual incentive, if it was in connection with a change of control. For Mr. Fraser, the multiples were 2.0 times base salary, or 2.5 times the sum of base salary and target annual incentive. A resignation by the executive for “good reason,” such as our failure to pay any amount due to such executive, demotion, relocation or an uncured breach of the employment agreement by us, can also trigger a severance payment to the executive under the ESP. A “change of control” includes, among other events, the acquisition by an individual or group of beneficial ownership of more than 50% of the combined voting power of our then-outstanding Common Stock.
Performance-based and time‑based restricted awards vest on death, total and permanent disability or retirement. On death and total and permanent disability, these restricted stock awards vest proportionally based on months of service in the three-year performance measurement period, but for performance‑based awards on performance achieved as of the termination. On retirement, the awards vest 100%, but subject to satisfaction of the performance criteria for performance‑based awards at the end of the performance measurement period. Time‑based award may also vest proportionally based on months of service in the three-year period, if the termination of employment occurs in the last year of the vesting period and was not for cause or poor performance. Performance-based and time-based awards vest at maximum on a change of control.
28
The table below presents information respecting amounts payable upon a death, disability, or termination of NEOs, or a change of control, as of July 31, 2018. See “Executive Benefits and Perquisites-Executive Severance Plan.” The table does not include Mr. Rodriguez, who left the Company in February 2018.
|
Name |
|
Death ($) |
|
|
Disability ($) |
|
|
Voluntary Termination ($) (1) |
|
|
Termination For Cause ($) |
|
|
Termination Without Cause But No Change of Control ($) |
|
|
Termination Without Cause but with a Change of Control ($) |
|
|
Change of Control |
|
|||||||
|
Christopher T. Fraser |
|
|
|
|
|
|
|
|
|
|
|
|
|
|
|
|
|
|
|
|
|
|
|
|
|
|
|
|
|
Incentive Bonus (2) |
|
|
— |
|
|
|
— |
|
|
|
— |
|
|
|
— |
|
|
|
1,013,018 |
|
|
|
1,013,018 |
|
|
|
— |
|
|
Cash Severance (3) |
|
|
— |
|
|
|
— |
|
|
|
— |
|
|
|
— |
|
|
|
1,572,084 |
|
|
|
3,733,700 |
|
|
|
— |
|
|
Value of Unvested Stock Awards (4) |
|
|
17,681,988 |
|
|
|
17,681,988 |
|
|
|
— |
|
|
|
— |
|
|
|
— |
|
|
|
26,158,320 |
|
|
|
26,158,320 |
|
|
Marvin T. Green III |
|
|
|
|
|
|
|
|
|
|
|
|
|
|
|
|
|
|
|
|
|
|
|
|
|
|
|
|
|
Incentive Bonus (2) |
|
|
— |
|
|
|
— |
|
|
|
— |
|
|
|
— |
|
|
|
162,121 |
|
|
|
162,121 |
|
|
|
— |
|
|
Cash Severance (3) |
|
|
— |
|
|
|
— |
|
|
|
— |
|
|
|
— |
|
|
|
339,650 |
|
|
|
679,299 |
|
|
|
— |
|
|
Value of Unvested Stock Awards (4) |
|
|
198,874 |
|
|
|
198,874 |
|
|
|
— |
|
|
|
— |
|
|
|
— |
|
|
|
338,322 |
|
|
|
338,322 |
|
|
Jeffrey S. Handelman |
|
|
|
|
|
|
|
|
|
|
|
|
|
|
|
|
|
|
|
|
|
|
|
|
|
|
|
|
|
Incentive Bonus (2) |
|
|
— |
|
|
|
— |
|
|
|
— |
|
|
|
— |
|
|
|
204,151 |
|
|
|
204,151 |
|
|
|
— |
|
|
Cash Severance (3) |
|
|
— |
|
|
|
— |
|
|
|
— |
|
|
|
— |
|
|
|
543,095 |
|
|
|
1,086,189 |
|
|
|
— |
|
|
Value of Unvested Stock Awards (4) |
|
|
1,260,887 |
|
|
|
1,260,887 |
|
|
|
— |
|
|
|
— |
|
|
|
— |
|
|
|
2,214,599 |
|
|
|
2,214,599 |
|
|
Roger C. Jackson |
|
|
|
|
|
|
|
|
|
|
|
|
|
|
|
|
|
|
|
|
|
|
|
|
|
|
|
|
|
Incentive Bonus (2) |
|
|
— |
|
|
|
— |
|
|
|
— |
|
|
|
— |
|
|
|
192,582 |
|
|
|
192,582 |
|
|
|
— |
|
|
Cash Severance (3) |
|
|
— |
|
|
|
— |
|
|
|
— |
|
|
|
— |
|
|
|
901,350 |
|
|
|
901,350 |
|
|
|
— |
|
|
Value of Unvested Stock Awards (4) |
|
|
1,627,665 |
|
|
|
1,627,665 |
|
|
|
— |
|
|
|
— |
|
|
|
— |
|
|
|
2,368,682 |
|
|
|
2,368,682 |
|
|
Ernest C. Kremling |
|
|
|
|
|
|
|
|
|
|
|
|
|
|
|
|
|
|
|
|
|
|
|
|
|
|
|
|
|
Incentive Bonus (2) |
|
|
— |
|
|
|
— |
|
|
|
— |
|
|
|
— |
|
|
|
282,422 |
|
|
|
282,422 |
|
|
|
— |
|
|
Cash Severance (3) |
|
|
— |
|
|
|
— |
|
|
|
— |
|
|
|
— |
|
|
|
541,626 |
|
|
|
1,083,252 |
|
|
|
— |
|
|
Value of Unvested Stock Awards (4) |
|
|
2,464,595 |
|
|
|
2,464,595 |
|
|
|
— |
|
|
|
— |
|
|
|
— |
|
|
|
3,591,651 |
|
|
|
3,591,651 |
|
|
(1) |
Any retirement would be treated as a voluntary termination, except for performance-based awards as described above. |
|
(2) |
The amount is the actual incentive award for fiscal year 2018. |
|
(3) |
Multiple of base salary or the sum of base salary and target incentive bonus for the year in which the termination occurs. |
|
(4) |
For unvested stock awards, the service period requirement is prorated as of July 31, 2018 for death and disability, and the performance objectives are estimated as described in the notes to the Outstanding Equity Awards at Fiscal Year-End table. Performance-based and time-based awards vest at maximum on a change of control, and the amount is calculated based on our closing stock price on July 31, 2018 of $71.80. See “Merger Transaction with Cabot Microelectronics” for a discussion of the treatment of equity awards in connection with the merger transaction with Cabot Microelectronics. |
29
The table below presents information respecting compensation paid to directors in fiscal year 2018 who, except for Mr. Fraser, were not NEOs. We also reimburse our directors for travel, lodging and related expenses incurred in attending Board, committee or other business meetings.
Director Compensation
|
Name |
|
Fees Earned Or Paid in Cash ($) (1) |
|
|
Stock Awards ($) (2) |
|
|
Total ($) |
|
|||
|
|
|
78,000 |
|
|
|
75,010 |
|
|
|
153,010 |
|
|
|
George W. Gilman |
|
|
55,000 |
|
|
|
75,010 |
|
|
|
130,010 |
|
|
Robert Harrer |
|
|
60,000 |
|
|
|
75,010 |
|
|
|
135,010 |
|
|
John C. Hunter, III |
|
|
55,000 |
|
|
|
75,010 |
|
|
|
130,010 |
|
|
Fred C. Leonard, III |
|
|
64,000 |
|
|
|
75,010 |
|
|
|
139,010 |
|
|
Margaret C. Montana |
|
|
36,667 |
|
|
|
50,009 |
|
|
|
86,676 |
|
|
Karen A. Twitchell |
|
|
62,000 |
|
|
|
75,010 |
|
|
|
137,010 |
|
|
(1) |
Each director is paid an annual retainer of $55,000 per year. The Chair of the Audit Committee is paid a retainer of $12,000 per year, the Chair of the Compensation Committee is paid a retainer of $9,000 per year, and the Chair of the Governance Committee is paid a retainer of $8,000 per year. Mr. Ermentrout was selected as Lead Director in fiscal year 2014. The Lead Director is paid an annual retainer of $15,000. Annual retainers are paid quarterly. Directors are reimbursed for out-of-pocket expenses incurred in attending meetings and for other expenses incurred in performing in their capacity as directors. |
|
(2) |
This amount represents the aggregate grant date fair value, which we expense in our financial statements. See note 14 of our audited consolidated financial statements in our Annual Report on Form 10-K for the year ended July 31, 2018. |
CEO Pay Ratio
As required by SEC rules, the Company is providing the following information about the relationship of the annual total compensation of the Company’s employees and the annual total compensation of the Company’s CEO. The pay ratio figure below is a reasonable estimate calculated in a manner consistent with Item 402(u) of Regulation S-K under the Exchange Act.
We determined that as of July 31, 2018, we had a total global population of approximately 750 full-time employees, based on our human resources system of record. To determine our median employee, we chose base salary as our consistently applied compensation measure. We then calculated an annual base salary for each employee, annualizing pay for those employees who commenced work during fiscal year 2018 and for any employees who were on leave for a portion of fiscal year 2018.
Total annual compensation for the median employee was $48,500 and total annual compensation for the CEO was $4,046,650, resulting in a ratio of median employee total annual compensation to CEO total annual compensation of 83 to 1. Total annual compensation for the median employee and the CEO includes base salary, annual incentive, equity-based awards and other compensation calculated according to the disclosure requirements of Item 402(u) of Regulation S-K under the Exchange Act.
30
ITEM 12. SECURITY OWNERSHIP OF CERTAIN BENEFICIAL OWNERS AND MANAGEMENT AND RELATED STOCKHOLDER MATTERS
The following table sets forth certain information as of November 13, 2018 with regard to the beneficial ownership of Common Stock by (i) each person known to us to be the beneficial owner of 5% or more of our outstanding Common Stock, (ii) our executive officers and the directors individually and (iii) our officers and directors as a group. All addresses are in care of KMG Chemicals, Inc., 300 Throckmorton Street, Fort Worth, Texas 76102.
|
Name |
|
Common Stock Beneficially Owned |
|
|
Percent of Total Beneficial Shares (%) (1) |
|
||
|
Directors and Executive Officers |
|
|
|
|
|
|
|
|
|
Gerald G. Ermentrout |
|
|
31,768 |
|
|
* |
|
|
|
Christopher T. Fraser (2) |
|
|
296,869 |
|
|
|
1.9 |
% |
|
George W. Gilman |
|
|
69,164 |
|
|
* |
|
|
|
Marvin T. Green III |
|
|
7,324 |
|
|
|
|
|
|
Jeffrey S. Handelman |
|
|
9,441 |
|
|
* |
|
|
|
Robert Harrer |
|
|
5,990 |
|
|
* |
|
|
|
John C. Hunter, III |
|
|
19,331 |
|
|
* |
|
|
|
Roger C. Jackson |
|
|
105,598 |
|
|
* |
|
|
|
Ernest C. Kremling |
|
|
59,713 |
|
|
* |
|
|
|
Fred C. Leonard, III (3) |
|
|
416,927 |
|
|
|
2.7 |
% |
|
Margaret C. Montana |
|
|
1,127 |
|
|
|
|
|
|
Karen A. Twitchell |
|
|
17,815 |
|
|
* |
|
|
|
Directors and Executive Officers as a Group (12 persons) |
|
|
1,041,067 |
|
|
|
6.7 |
% |
|
|
|
|
|
|
|
|
|
|
|
Five Percent Shareholders |
|
|
|
|
|
|
|
|
|
BlackRock, Inc. (4) 55 East 52nd Street, New York, New NY 10055 |
|
|
836,301 |
|
|
|
5.3 |
% |
|
David L. Hatcher (5) 19 Briar Hollow Lane, Suite 290, Houston, TX 77027 |
|
|
866,097 |
|
|
|
5.5 |
% |
|
T. Rowe Price Associates, Inc. (6) 100 E. Pratt Street, Baltimore, MD 20202 |
|
|
1,634,180 |
|
|
|
10.4 |
% |
|
* |
Less than 1%. |
|
(2) |
Mr. Fraser and Cabot Microelectronics may be deemed to have shared voting power with respect to such shares pursuant to the terms of the voting and support agreement entered into between Mr. Fraser and Cabot Microelectronics on August 14, 2018 in connection with the Merger Agreement. Mr. Fraser has sole dispositive power with respect to such shares subject to certain restrictions on transfer set forth in the voting agreement. |
|
(3) |
Mr. Leonard and Cabot Microelectronics may be deemed to have shared voting power with respect to such shares pursuant to the terms of the voting agreement entered into between Mr. Leonard and Cabot Microelectronics on August 14, 2018 in connection with the Merger Agreement. Mr. Leonard has sole dispositive power with respect to such shares subject to certain restrictions on transfer set forth in the voting agreement. |
|
(4) |
Based on the Schedule 13G filed with the Securities Exchange Commission (the “SEC”) on February 12, 2018, BlackRock, Inc. has sole voting power over 807,344 shares, shared voting power over 0 shares, sole dispositive power over 836,301 shares, and shared dispositive power over 0 shares. |
|
(5) |
Based on the Form 4 filed with the SEC on November 1, 2017 by David L. Hatcher. |
|
(6) |
Based on the Schedule 13G/A filed with the SEC on September 10, 2018 jointly by T. Rowe Price Associates, Inc. (“Price Associates”) and T. Rowe Price Small-Cap Value Fund, Inc. (“Price Small-Cap”), Price Associates has sole voting power over 504,416 shares, shared voting power over 0 shares, sole dispositive power over 1,634,180 shares, and shared dispositive power over 0 shares. These shares are owned by various individual and institutional investors including Price Small‑Cap (which owns 1,023,260 shares representing 6.6% of the shares outstanding), to which Price Associates serves as investment adviser with power to direct investments and/or sole power to vote the shares. For purposes of the reporting requirements of the Exchange Act, Price Associates is deemed to be a beneficial owner of such shares; however, Price Associates expressly disclaims that it is, in fact, the beneficial owner of such shares. |
31
Item 13. Certain Relationships and Related Transactions, and Director Independence
Review, Approval or Ratification of Transactions with Related Persons
Our Code of Business Conduct prohibits employees, officers and directors from having a personal, financial or family interest that could in any way prevent the individual from acting in our best interests (a “conflict of interest”) and provides that any conflict of interest waiver relating to Board members or executive officers may only be made after review and approval by the Board. In addition, the Board reviews certain relationships and related party transactions with respect to directors, as part of its assessment of each director’s independence.
Transactions with Related Persons
During fiscal year 2018 there were no related party transactions required to be disclosed under Item 404 of Regulation S-K.
Director Independence
The Board of Directors is currently composed of seven non-employee directors and one employee director. Under our guidelines and the listing requirements of the New York Stock Exchange, at least a majority of our Board of Directors must be independent. The Board of Directors has determined that all seven of its current non-employee directors meet the New York Stock Exchange requirement of independence.
Item 14. Principal Accounting Fees and Service
Principal Accounting Firm Fees
The aggregate fees billed by our independent registered public accounting firm and auditor, KPMG LLP, for professional services rendered to us for the two fiscal years ended July 31, 2018 and 2017 were as follows:
|
|
|
2018 |
|
|
2017 |
|
||
|
Audit Fees (1) |
|
$ |
1,376,250 |
|
|
$ |
1,134,287 |
|
|
Audit-Related Fees (2) |
|
|
45,000 |
|
|
|
17,500 |
|
|
Tax Fees (3) |
|
|
— |
|
|
|
— |
|
|
All Other Fees (4) |
|
|
— |
|
|
|
— |
|
|
Total |
|
$ |
1,421,250 |
|
|
$ |
1,151,787 |
|
|
(1) |
Includes fees and reimbursable expenses for professional services rendered for the audits of our consolidated financial statements, quarterly reviews of the consolidated financial statements included in quarterly reports on Form 10-Q, and audit of internal control over financial reporting. |
|
(2) |
Includes fees and reimbursable expenses for assurance and related services that are reasonably related to the performance of the audit or review of the financial statements. |
|
(3) |
Includes fees and reimbursable expenses for international tax consulting services. |
|
(4) |
Includes fees and reimbursable expenses for certain consulting services. |
The policy of the Audit Committee is to pre-approve all audit and non-audit services conducted by our independent registered public accounting firm and auditors. Under the policy, pre-approval is required before the independent accountants are engaged for the particular services. The Audit Committee has considered whether the provision of the services included in other fees is compatible with maintaining the independence of our independent registered accounting firm and auditors.
32
ITEM 15. EXHIBITS, FINANCIAL STATEMENT SCHEDULES, AND REPORTS ON FORM 10-K
|
(a) |
The financial statements and financial statement schedules filed as part of this report in Item 8 are listed in the Index to Financial Statements contained in that item. |
|
(b) |
The following documents are filed as exhibits. Documents marked with an asterisk (*) are management contracts or compensatory plans, and portions of documents marked with a dagger (†) have been granted confidential treatment. |
|
|
||
|
|
|
|
|
|
||
|
|
|
|
|
|
||
|
|
|
|
|
|
||
|
|
|
|
|
|
||
|
|
|
|
|
|
||
|
|
|
|
|
|
||
|
|
|
|
|
|
||
|
|
|
|
|
|
||
|
|
|
|
|
|
||
|
|
|
|
|
|
||
|
|
|
|
|
|
||
|
|
|
|
|
|
||
|
|
|
|
|
|
||
|
|
|
|
|
|
||
|
|
|
|
|
|
||
|
|
|
|
|
|
||
|
|
|
|
|
|
||
|
|
|
|
|
|
||
|
|
|
|
|
|
||
|
|
|
|
|
|
||
|
|
|
|
|
|
||
|
|
|
|
|
|
||
|
|
|
|
|
|
||
|
|
|
|
|
|
||
|
|
|
|
|
|
||
|
|
|
|
|
|
||
|
|
|
|
|
|
||
|
|
|
|
|
|
Certificate under Section 302 the Sarbanes-Oxley Act of 2002 of the Chief Executive Officer. |
|
|
|
|
|
|
|
Certificate under Section 302 the Sarbanes-Oxley Act of 2002 of the Chief Financial Officer. |
|
|
|
|
|
|
|
||
|
|
|
|
|
|
||
|
|
|
|
|
101.INS |
|
XBRL Instance Document, filed as exhibit 101.INS to the Company’s report on Form 10-K filed on October 1, 2018, and incorporated herein by reference. |
|
|
|
|
|
101.SCH |
|
XBRL Schema Document, filed as exhibit 101.SCH to the Company’s report on Form 10-K filed on October 1, 2018, and incorporated herein by reference. |
|
|
|
|
|
101.CAL |
|
XBRL Calculation Linkbase Document, filed as exhibit 101.CAL to the Company’s report on Form 10-K filed on October 1, 2018, and incorporated herein by reference. |
|
|
|
|
|
101.DEF |
|
XBRL Definition Linkbase Document, filed as exhibit 101.DEF to the Company’s report on Form 10-K filed on October 1, 2018, and incorporated herein by reference. |
|
|
|
|
|
101.LAB |
|
XBRL Label Linkbase Document, filed as exhibit 101.LAB to the Company’s report on Form 10-K filed on October 1, 2018, and incorporated herein by reference. |
|
|
|
|
|
101.PRE |
|
XBRL Presentation Linkbase Document, filed as exhibit 101.PRE to the Company’s report on Form 10-K filed on October 1, 2018, and incorporated herein by reference. |
|
(c) |
Schedule II-Valuation and Qualifying Accounts and Reserves. All other schedules are omitted because they are not applicable or the required information is contained in the applicable financial statements or notes thereto. |
33
Pursuant to the requirements of Section 13 or 15(d) of the Securities Exchange Act of 1934, the registrant has duly caused this report to be signed on its behalf by the undersigned, thereunto duly authorized.
|
KMG CHEMICALS, INC. |
||||||
|
|
|
|
|
|
|
|
|
By: |
|
/s/ Christopher T. Fraser |
|
|
|
Date: November 14, 2018 |
|
|
|
Christopher T. Fraser President, Chief Executive Officer and Director |
|
|
|
|
34