Attached files
| file | filename |
|---|---|
| EX-99.3 - EX-99.3 - READING INTERNATIONAL INC | rdi-20181113xex99_3.htm |
| EX-99.1 - EX-99.1 - READING INTERNATIONAL INC | rdi-20181113xex99_1.htm |
| 8-K - 8-K - READING INTERNATIONAL INC | rdi-20181113x8k.htm |

READING INTERNATIONAL 2018 ANNUAL STOCKHOLDERS MEETING NOVEMBER 7, 2018
SAFE HARBOR DISCLAIMER Our comments today may contain forward-looking statements and management may make additional forward-looking statements in response to your questions. Such written and oral disclosures are made pursuant to the Safe Harbor provision of the Private Securities Litigation Reform Act of 1995. Although we believe our expectations expressed in such forwardlooking statements are reasonable, we cannot assure you that they will be realized. Investors are cautioned that such forward-looking statements involve risks and uncertainties that could cause actual results to differ materially from the anticipated results, and therefore we refer you to a more detailed discussion of the risks and uncertainties in the Company’s filings with the Securities & Exchange Commission.
FINANCIAL RECONCILATIONS We use EBITDA in the evaluation of our Company’s performance since we believe that EBITDA provides a useful measure of financial performance and value. We believe this principally for the following reasons: We believe that EBITDA is an accepted industry-wide comparative measure of financial performance. It is, in our experience, a measure commonly adopted by analysts and financial commentators who report upon the cinema exhibition and real estate industries, and it is also a measure used by financial institutions in underwriting the creditworthiness of companies in these industries. Accordingly, our management monitors this calculation as a method of judging our performance against our peers, market expectations and our creditworthiness. It is widely accepted that analysts, financial commentators and persons active in the cinema exhibition and real estate industries typically value enterprises engaged in these businesses at various multiples of EBITDA. Accordingly, we find EBITDA valuable as an indicator of the underlying value of our businesses. We expect that investors may use EBITDA to judge our ability to generate cash, as a basis of comparison to other companies engaged in the cinema exhibition and real estate businesses and as a basis to value our company against such other companies. EBITDA is not a measurement of financial performance under generally accepted accounting principles in the United States of America and it should not be considered in isolation or construed as a substitute for net income or other operations data or cash flow data prepared in accordance with generally accepted accounting principles in the United States for purposes of analyzing our profitability. The exclusion of various components, such as interest, taxes, depreciation and amortization, limits the usefulness of these measures when assessing our financial performance, as not all funds depicted by EBITDA are available for management’s discretionary use. For example, a substantial portion of such funds may be subject to contractual restrictions and functional requirements to service debt, to fund necessary capital expenditures and to meet other commitments from time to time. EBIT and EBITDA also fail to take into account the cost of interest and taxes. Interest is clearly a real cost that for us is paid periodically as accrued. Taxes may or may not be a current cash item but are nevertheless real costs that, in most situations, must eventually be paid. A company that realizes taxable earnings in high tax jurisdictions may, ultimately, be less valuable than a company that realizes the same amount of taxable earnings in a low tax jurisdiction. EBITDA fails to take into account the cost of depreciation and amortization and the fact that assets will eventually wear out and have to be replaced.
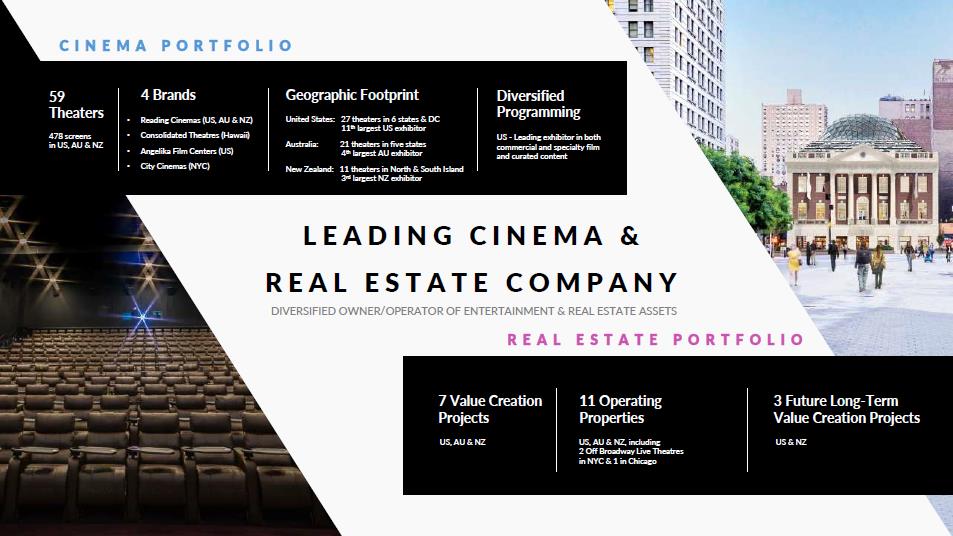
CINEMA PORTFOLIO 59 Theaters 478 screens in US, AU & NZ 4 Brands Reading Cinemas (US, AU & NZ) Consolidated Theatres (Hawaii) Angelika Film Centers (US) City Cinemas (NYC) Geographic Footprint United States 27 theaters in 6 states & DC 11th largest US exhibitor Australia 21 theaters in five states 4th largest AU exhibitor New Zealand 11 theaters in North & South Island 3rd largest NZ exhibitor Diversified Programming US – Leading exhibitor in both commercial and specialty film and curated content LEADING CINEMA & REAL ESTATE COMPANY DIVERSIFIED OWNER/OPERATOR OF ENTERTAINMENT & REAL ESTATE ASSETS REAL ESTATE PORTFOLIO 7 Value Creation Projects US, AU & NZ 11 Operating Properties US, AU & NZ, including 2 Off Broadway Live Theatres in NYC & 1 in Chicago 3 Future Long-Term Value Creation Projects US & NZ
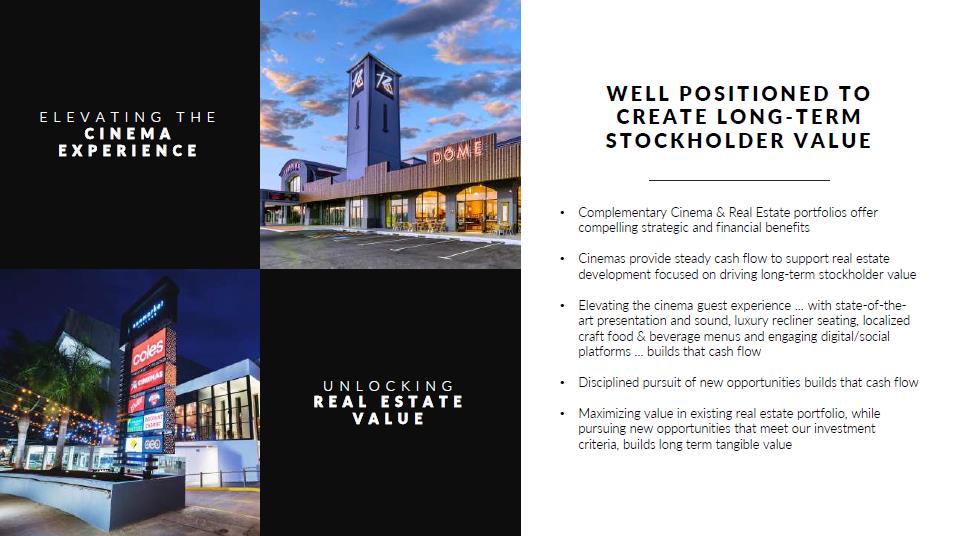
ELEVATING THE CINEMA EXPERIENCE UNLOCKING REAL ESTATE VALUE WELL POSITIONED TO CREATE LONG-TERM STOCKHOLDER VALUE • Complementary Cinema & Real Estate portfolios offer compelling strategic and financial benefits • Cinemas provide steady cash flow to support real estate development focused on driving long-term stockholder value • Elevating the cinema guest experience … with state-of-theart presentation and sound, luxury recliner seating, localized craft food & beverage menus and engaging digital/social platforms … builds that cash flow • Disciplined pursuit of new opportunities builds that cash flow • Maximizing value in existing real estate portfolio, while pursuing new opportunities that meet our investment criteria, builds long term tangible value
newmarket VILLAGE READING CINEMAS NEWMARKET-VILLAGE.COM.AU
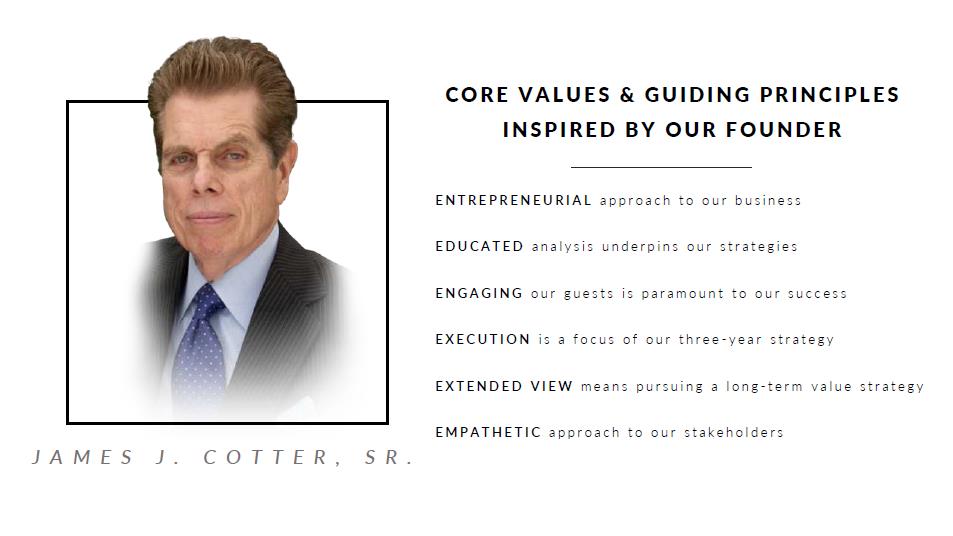
CORE VALUES & GUIDING PRINCIPLES INSPIRED BY OUR FOUNDER JAMES J. COTTER SR. ENTREPRENEURIAL approach to our business EDUCATED analysis underpins our strategies ENGAGING our guests is paramount to our success EXECUTION is a focus of our three-year strategy EXTENDED VIEW means pursuing a long-term value strategy EMPATHETIC approach to our stakeholders
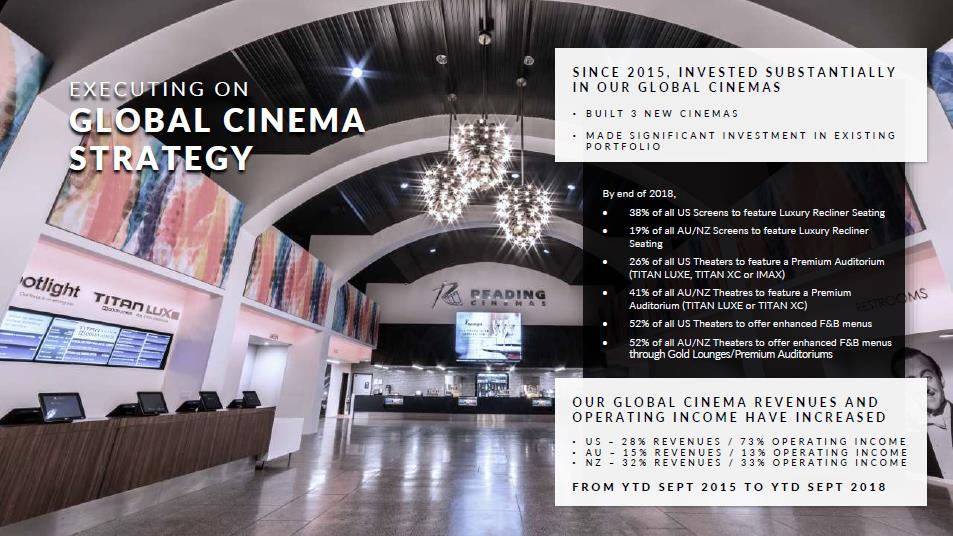
EXECUTING ON GLOBAL CINEMA STRATEGY SINCE 2015, INVESTED SUBSTANTIALLY IN OUR GLOBAL CINEMAS •BUILT 3 NEW CINEMAS • MADE SIGNIFICANT INVESTMENT IN EXISTING PORTFOLIO By end of 2018, . 38% of all US Screens to feature Luxury Recliner Seating . 19% of all AU/NZ Screens to feature Luxury Recliner Seating . 26% of all US Theaters to feature a Premium Auditorium (TITAN LUXE, TITAN XC or IMAX) . 41% of all AU/NZ Theatres to feature a Premium Auditorium (TITAN LUXE or TITAN XC) . 52% of all US Theaters to offer enhanced F&B menus . 52% of all AU/NZ Theaters to offer enhanced F&B menus through Gold Lounges/Premium Auditoriums OUR GLOBAL CINEMA REVENUES AND OPERATING INCOME HAVE INCREASED • US– 28% REVENUES/ 73% OPERATING INCOME • AU– 15% REVENUES/ 13% OPERATING INCOME • NZ– 32% REVENUES/ 33% OPERATING INCOME FROM YTD SEPT 2015 TO YTD SEPT 2018
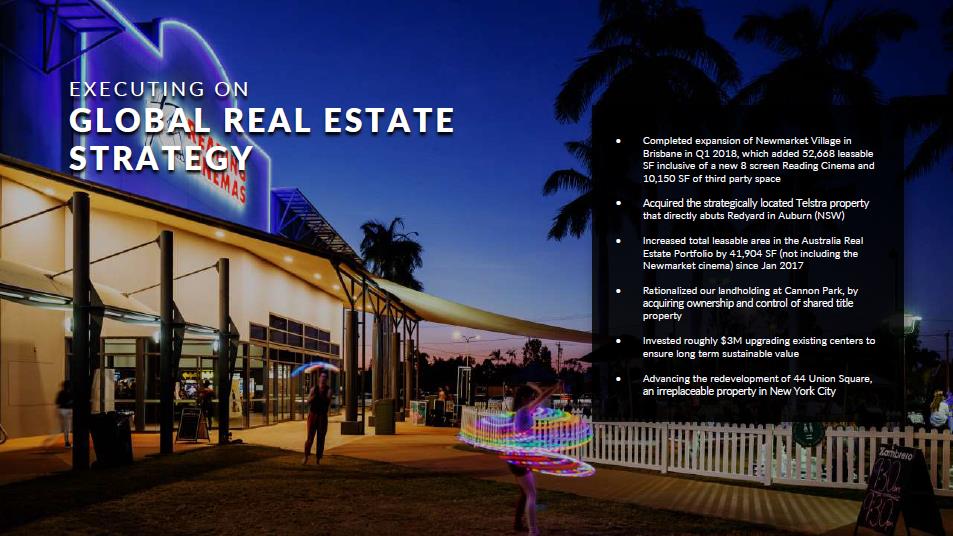
EXECUTING ON GLOBAL REAL ESTATE STRATEGY . Completed expansion of Newmarket Village in Brisbane in Q1 2018, which added 52,668 leasable SF inclusive of a new 8 screen Reading Cinema and 10,150 SF of third party space . Acquired the strategically located Telstra property that directly abuts Redyard in Auburn (NSW) . Increased total leasable area in the Australia Real Estate Portfolio by 41,904 SF (not including the Newmarket cinema) since Jan 2017 . Rationalized our landholding at Cannon Park, by acquiring ownership and control of shared title property . Invested roughly $3M upgrading existing centers to ensure long term sustainable value . Advancing the redevelopment of 44 Union Square, an irreplaceable property in New York City
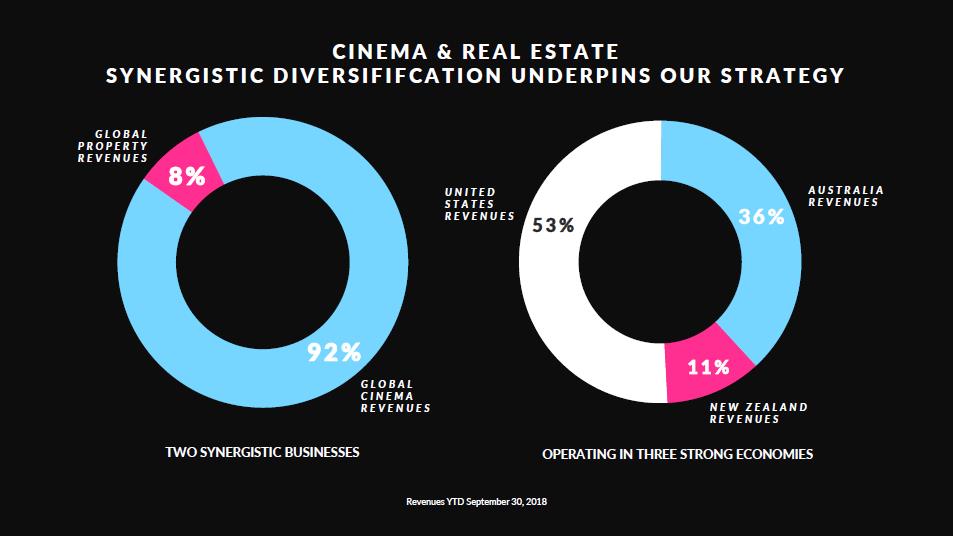
CINEMA & REAL ESTATE SYNERGISTIC DIVERSIFIFCATION UNDERPINS OUR STRATEGY TWO SYNERGISTIC BUSINESSES GLOBAL PROPERTY REVENUES 8% GLOBAL CINEMA REVENUES 92% OPERATING IN THREE STRONG ECONOMIES UNITED STATES REVENUES 53% AUSTRALIA REVENUES 36% NEW ZEALAND REVENUES 11% Revenues YTD September 30, 2018
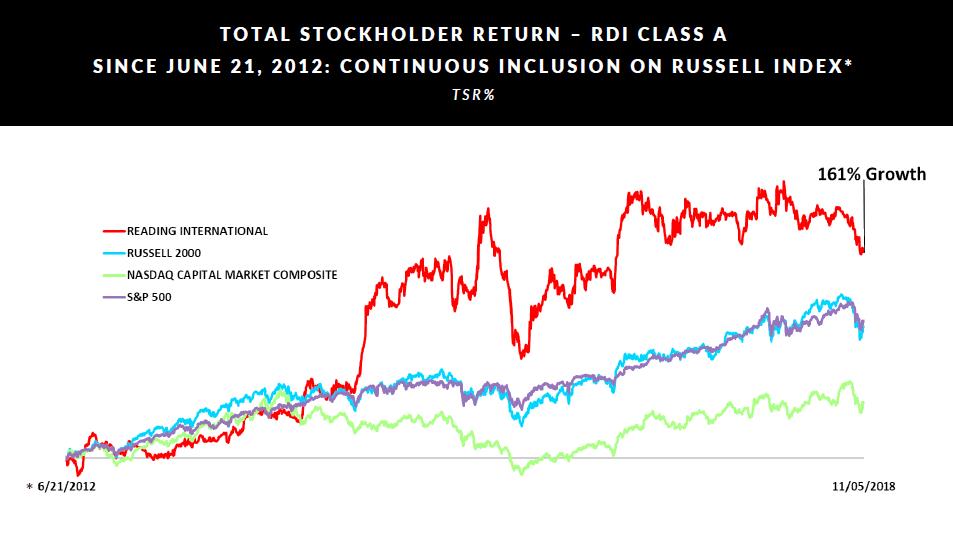
TOTAL STOCKHOLDER RETURN – RDI CLASS A SINCE JUNE 21, 2012: CONTINUOUS INCLUSION ON RUSSELL INDEX * TSR% READING INTERNATIONAL RUSSELL 2000 NASDAQ CAPITAL MARKET COMPOSITE S&P 500 *6/21/2012 11/05/2018 161% Growth
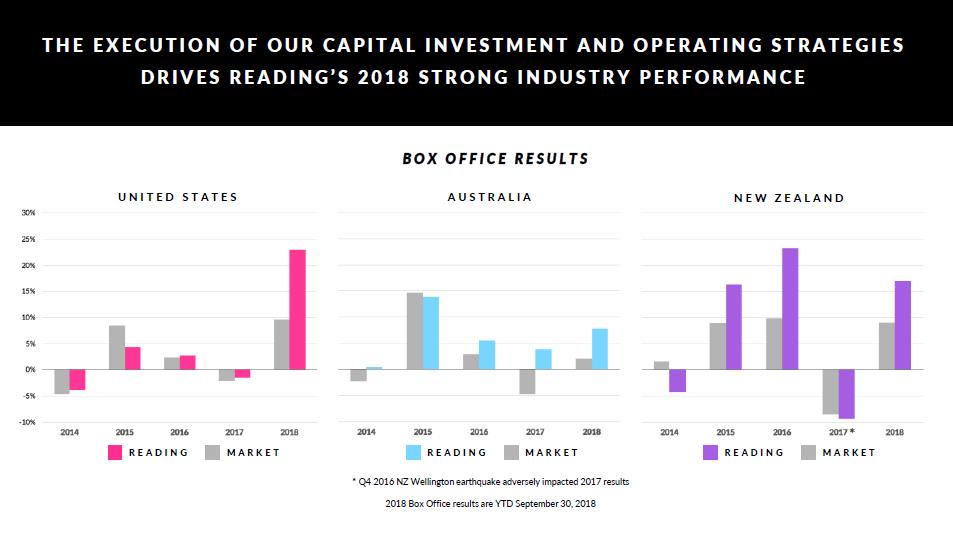
THE EXECUTION OF OUR CAPITAL INVESTMENT AND OPERATING STRATEGIES DRIVES READING’S 2018 STRONG INDUSTRY PERFORMANCE BOX OFFICE RESULTS UNITED STATES READING MARKET AUSTRALIA READING MARKET NEW ZEALAND * Q4 2016 NZ Wellington earthquake adversely impacted 2017 results 2018 Box Office results are YTD September 30, 2018 READING MARKET 30% 25% 20% 15% 10% 5% 0% -5% -10% 2014 2015 2016 2017 2018 2014 2015 2016 2017 2018 2014 2015 2016 2017* 2018
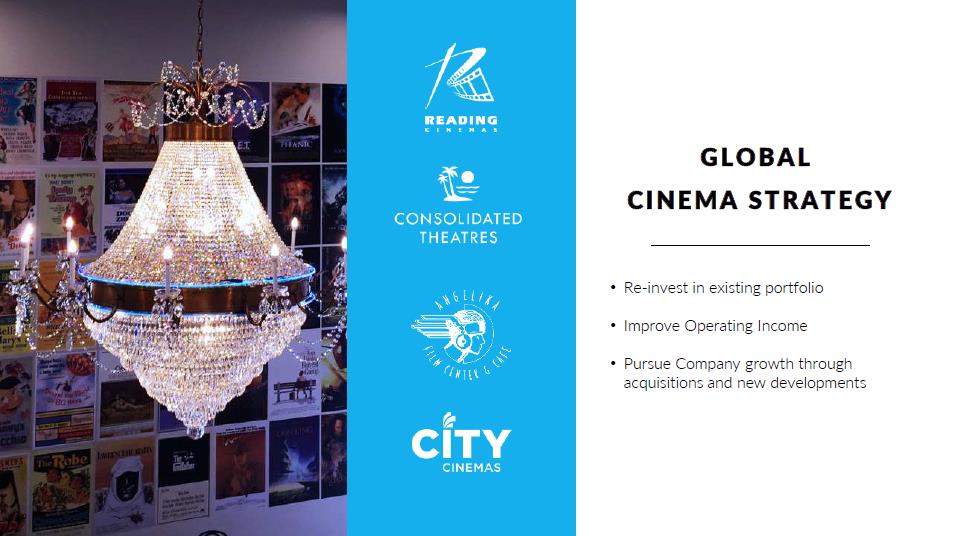
GLOBAL CINEMA STRATEGY READING CINEMAS CONSOLIDATED THEATRES ANGELIKA FILM CENTER & CAFÉ CITY CINEMAS • Re-invest in existing portfolio • Improve Operating Income • Pursue Company growth through acquisitions and new developments
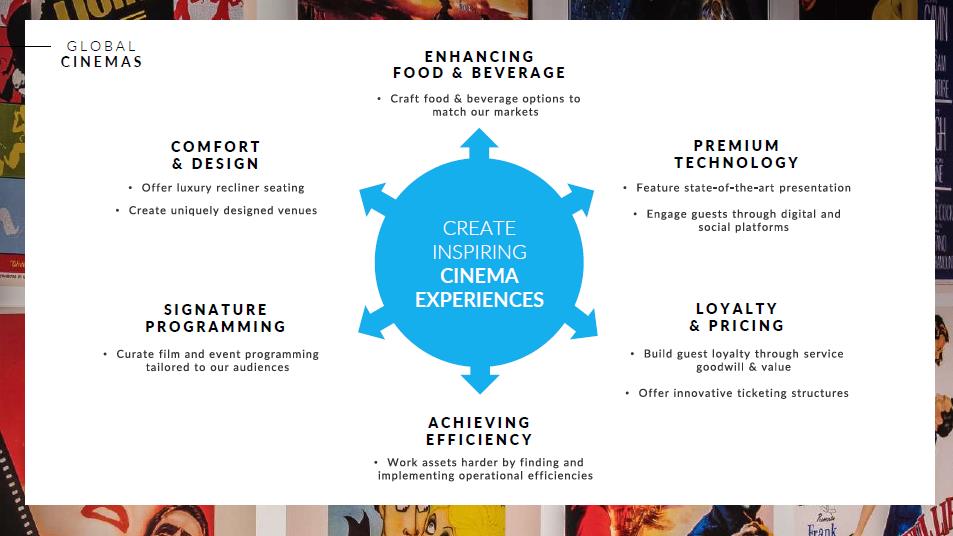
GLOBAL CINEMAS CREATE INSPIRING CINEMA EXPERIENCES ENHANCING FOOD & BEVERAGE Craft food & beverage options to match our markets COMFORT & DESIGN Offer luxury recliner seating Create uniquely designed venues SIGNATURE PROGRAMMING Curate film and event programming tailored to our audiences ACHIEVING EFFICIENCY Work assets harder by finding and implementing operational efficiencies LOYALTY & PRICING Build guest loyalty through service goodwill & value Offer innovative ticketing structures PREMIUM TECHNOLOGY Feature state-of-the-art presentation Engage guests through digital and social platforms
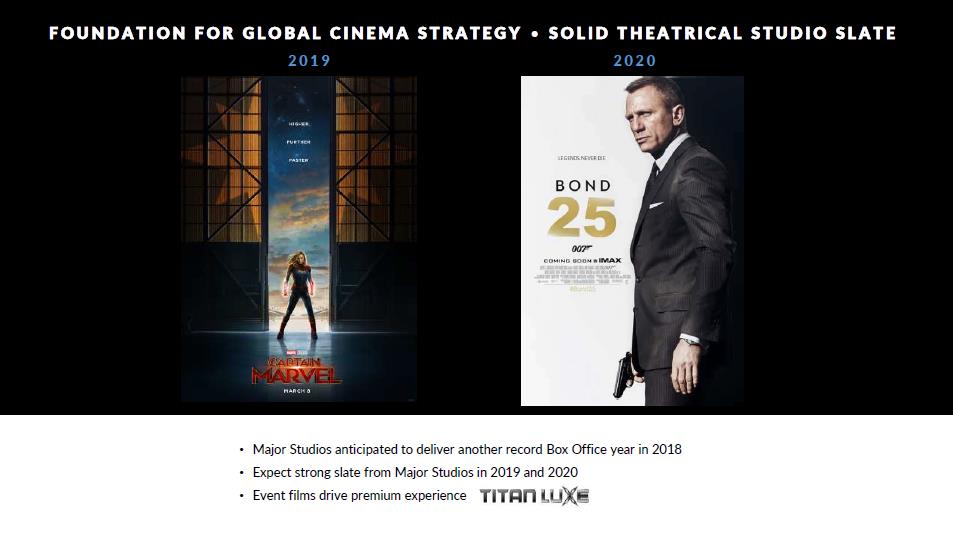
FOUNDATION FOR GLOBAL CINEMA STRATEGY • SOLID THEATRICAL STUDIO SLATE 2019 2020 • Major Studios anticipated to deliver another record Box Office year in 2018 • Expect strong slate from Major Studios in 2019 and 2020 • Event films drive premium experience TITAN LUXE
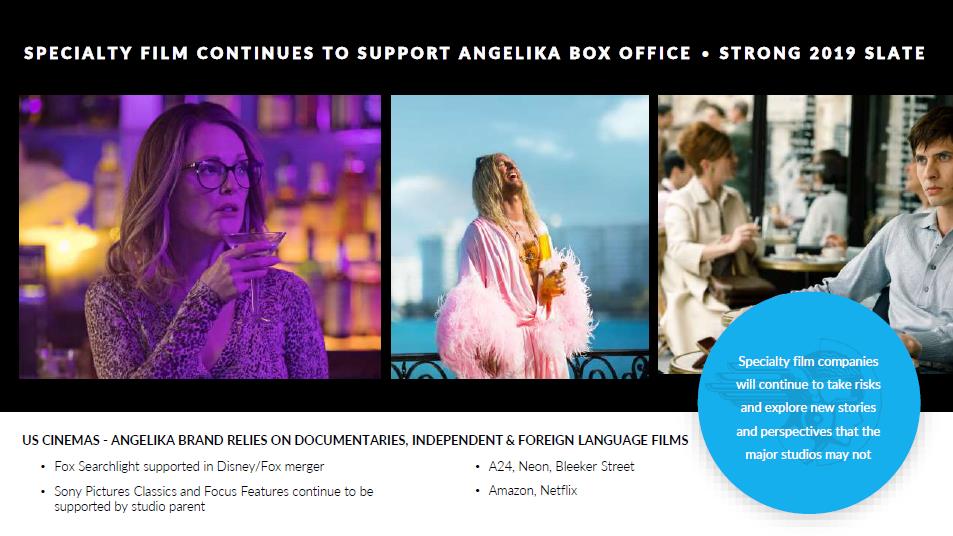
SPECIALTY FILM CONTINUES TO SUPPORT ANGELIKA BOX OFFICE • STRONG 2019 SLATE US CINEMAS-ANGELIKA BRAND RELIES ON DOCUMENTARIES, INDEPENDENT & FOREIGN LANGUAGE FILMS • Fox Searchlight supported in Disney/Fox merger • Sony Pictures Classics and Focus Features continue to be supported by studio parent • A24, Neon, Bleeker Street • Amazon, Netflix Specialty film companies will continue to take risks and explore new stories and perspectives that the major studios may not
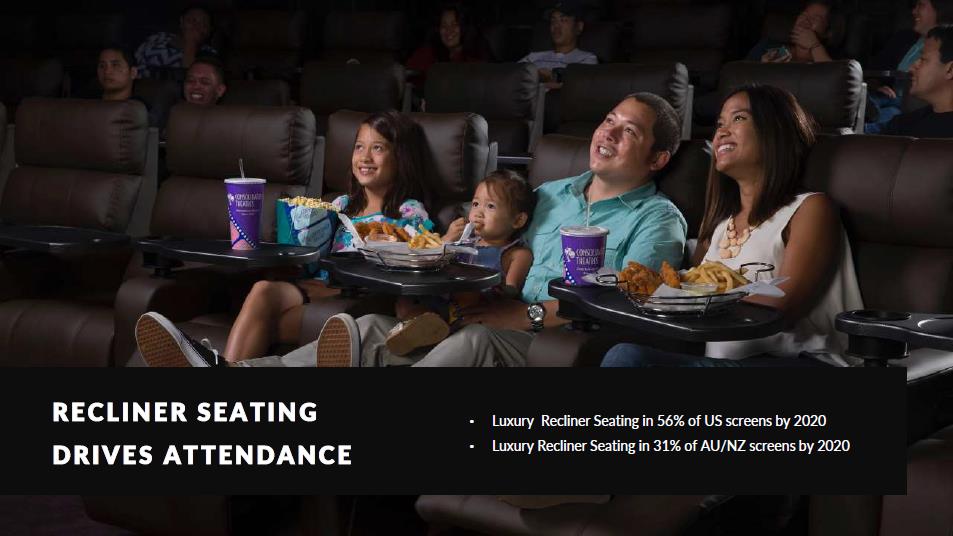
RECLINER SEATING DRIVES ATTENDANCE • Luxury Recliner Seating in 56% of US screens by 2020 • Luxury Recliner Seating in 31% of AU/NZ screens by 2020
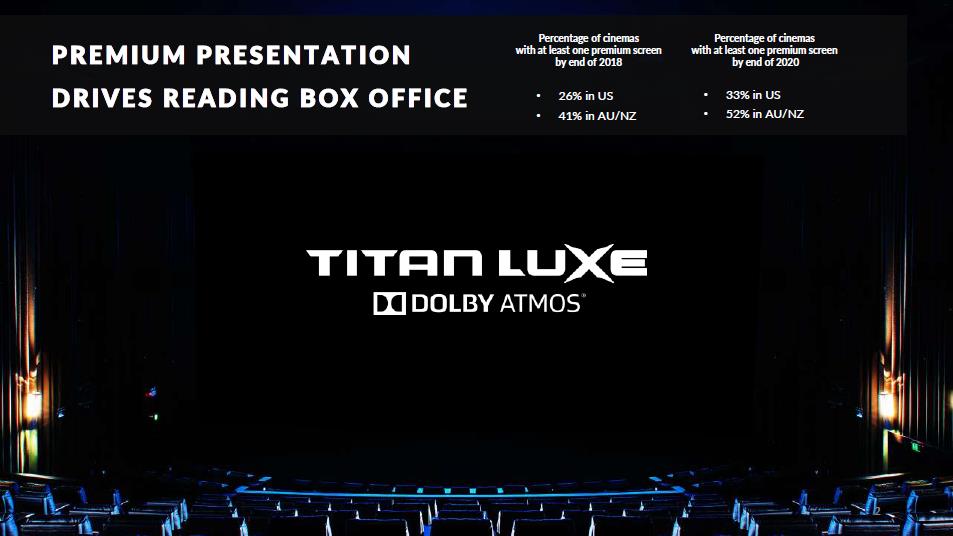
PREMIUM PRESENTATION DRIVES READING BOX OFFICE TITAN LUXE DOLBY ATMOS Percentage of cinemas with at least one premium screen by end of 2018 • 26% in US • 41% in AU/NZ Percentage of cinemas with at least one premium screen by end of 2020 • 33% in US • 52% in AU/NZ
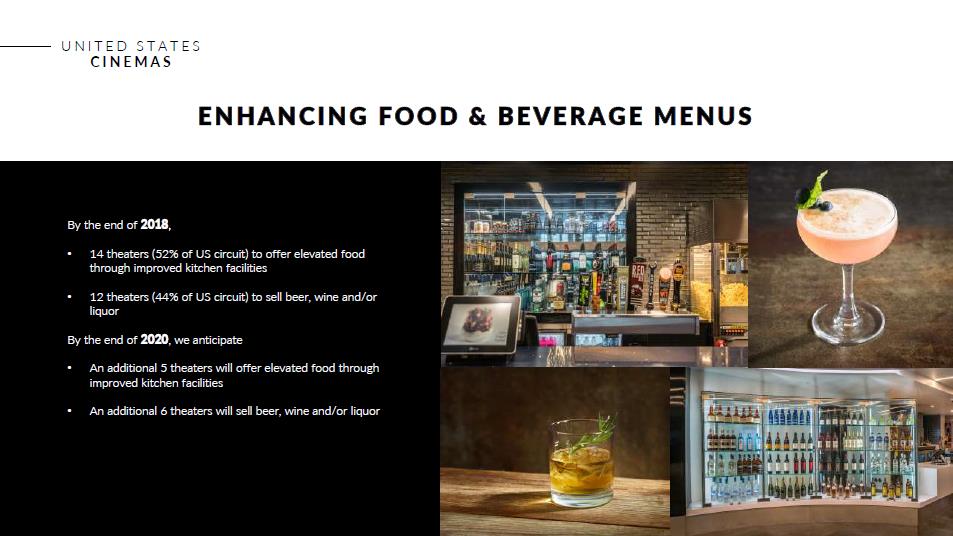
UNITED STATES CINEMAS ENHANCING FOOD & BEVERAGE MENUS By the end of 2018, • 14 theaters (52% of US circuit) to offer elevated food through improved kitchen facilities • 12 theaters (44% of US circuit) to sell beer, wine and/or liquor By the end of 2020, we anticipate • An additional 5 theaters will offer elevated food through improved kitchen facilities • An additional 6 theaters will sell beer, wine and/or liquor
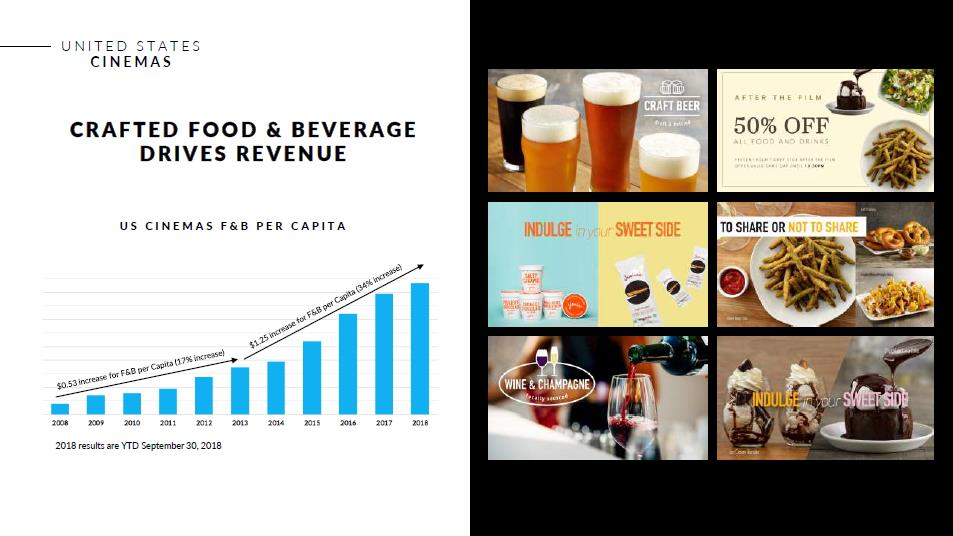
UNITED STATES CINEMAS CRAFTED FOOD & BEVERAGE DRIVES REVENUE US CINEMAS F&B PER CAPITA $0.53 increase for F&B per Capital (17% increase) $1.25 increase for F&B per Capital (34% increase) 2009 2009 2010 2011 2012 2013 2014 2014 2015 2016 2017 2018 2018 results are YTD September 30, 2018
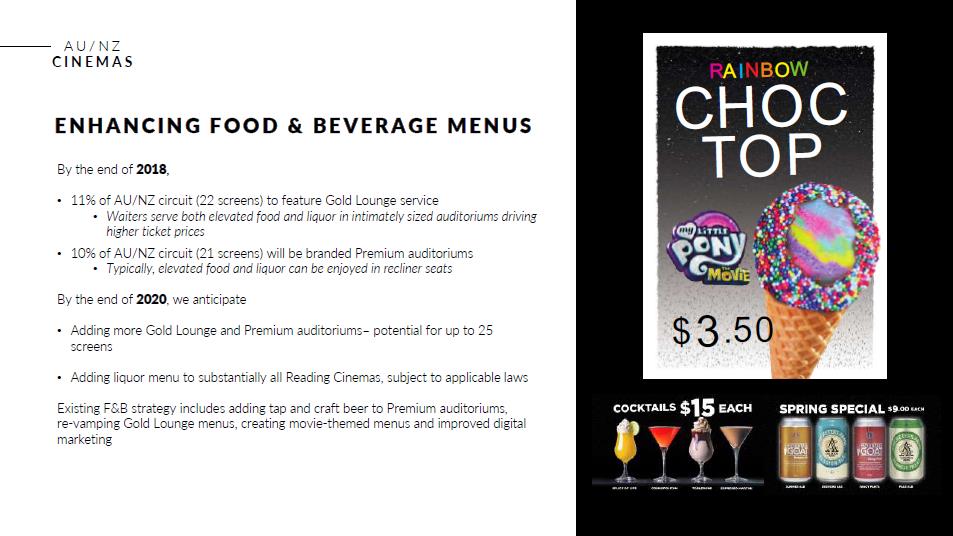
AU/NZ CINEMAS ENHANCING FOOD & BEVERAGE MENUS By the end of 2018, • 11% of AU/NZ circuit (22 screens) to feature Gold Lounge service • Waiters serve both elevated food and liquor in intimately sized auditoriums driving higher ticket prices • 10% of AU/NZ circuit (21 screens) will be branded Premium auditoriums • Typically, elevated food and liquor can be enjoyed in recliner seats By the end of 2020, we anticipate • Adding more Gold Lounge and Premium auditoriums– potential for up to 25 screens • Adding liquor menu to substantially all Reading Cinemas, subject to applicable laws Existing F&B strategy includes adding tap and craft beer to Premium auditoriums, re-vamping Gold Lounge menus, creating movie-themed menus and improved digital marketing RAINBOW CHOC TOP $3.50
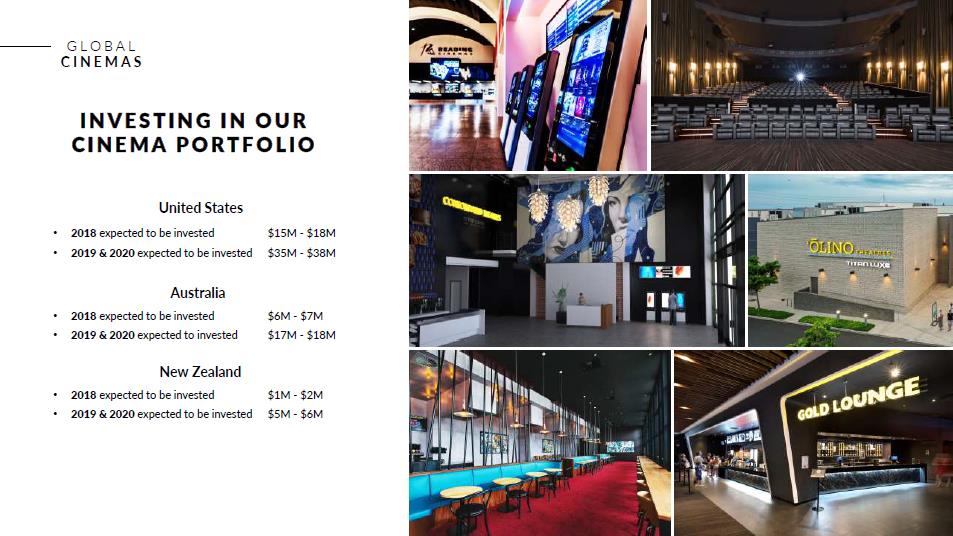
GLOBAL CINEMAS INVESTING IN OUR CINEMA PORTFOLIO United States • 2018 expected to be invested $15M-$18M • 2019 & 2020 expected to be invested $35M-$38M Australia • 2018 expected to be invested $6M-$7M • 2019 & 2020 expected to invested $17M-$18M New Zealand • 2018 expected to be invested $1M-$2M • 2019 & 2020 expected to be invested $5M-$6M
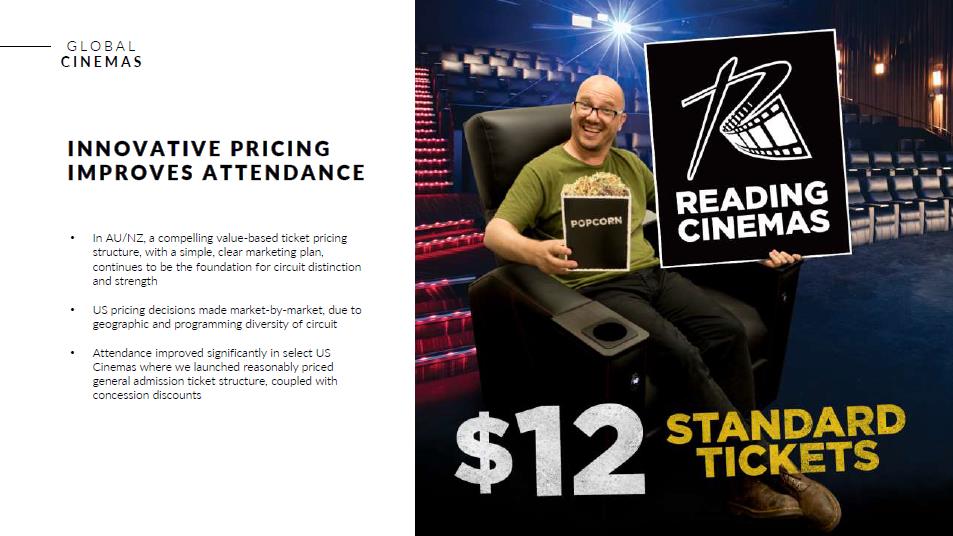
GLOBAL CINEMAS INNOVATIVE PRICING IMPROVES ATTENDANCE • In AU/NZ, a compelling value-based ticket pricing structure, with a simple, clear marketing plan, continues to be the foundation for circuit distinction and strength • US pricing decisions made market-by-market, due to geographic and programming diversity of circuit • Attendance improved significantly in select US Cinemas where we launched reasonably priced general admission ticket structure, coupled with concession discounts
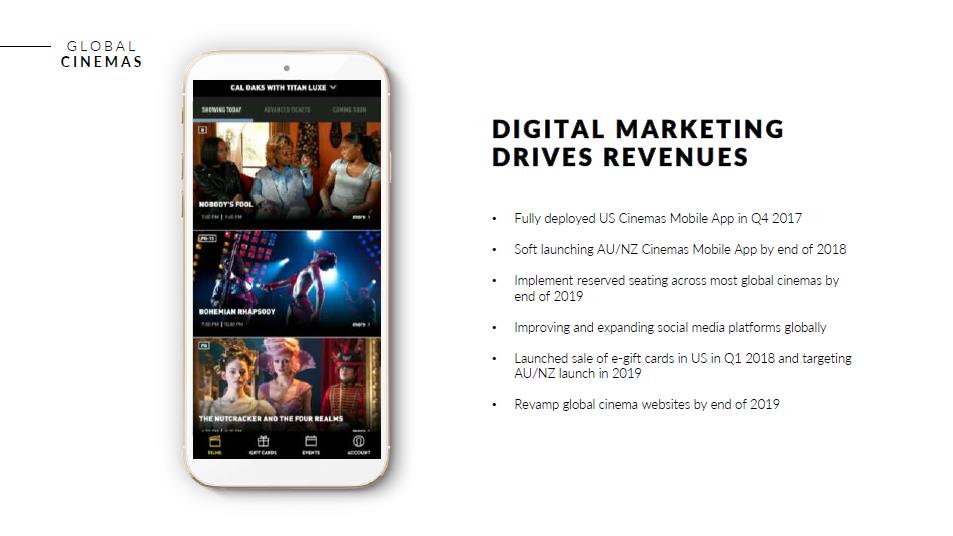
GLOBAL CINEMAS DIGITAL MARKETING DRIVES REVENUES • Fully deployed US Cinemas Mobile App in Q4 2017 • Soft launching AU/NZ Cinemas Mobile App by end of 2018 • Implement reserved seating across most global cinemas by end of 2019 • Improving and expanding social media platforms globally • Launched sale of e-gift cards in US in Q1 2018 and targeting AU/NZ launch in 2019 • Revamp global cinema websites by end of 2019
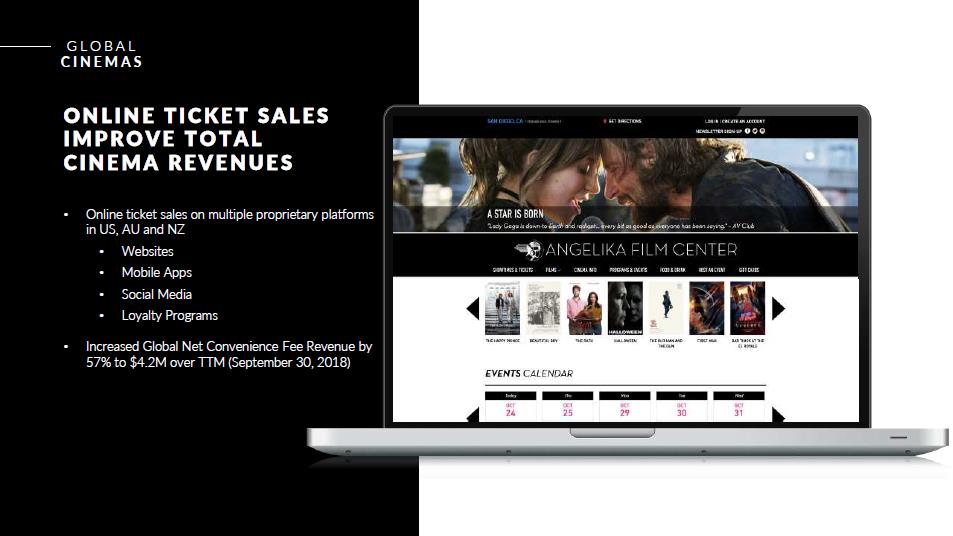
GLOBAL CINEMAS ONLINE TICKET SALES IMPROVE TOTAL CINEMA REVENUES • Online ticket sales on multiple proprietary platforms in US, AU and NZ • Websites • Mobile Apps • Social Media • Loyalty Programs • Increased Global Net Convenience Fee Revenue by 57% to $4.2M over TTM (September 30, 2018)
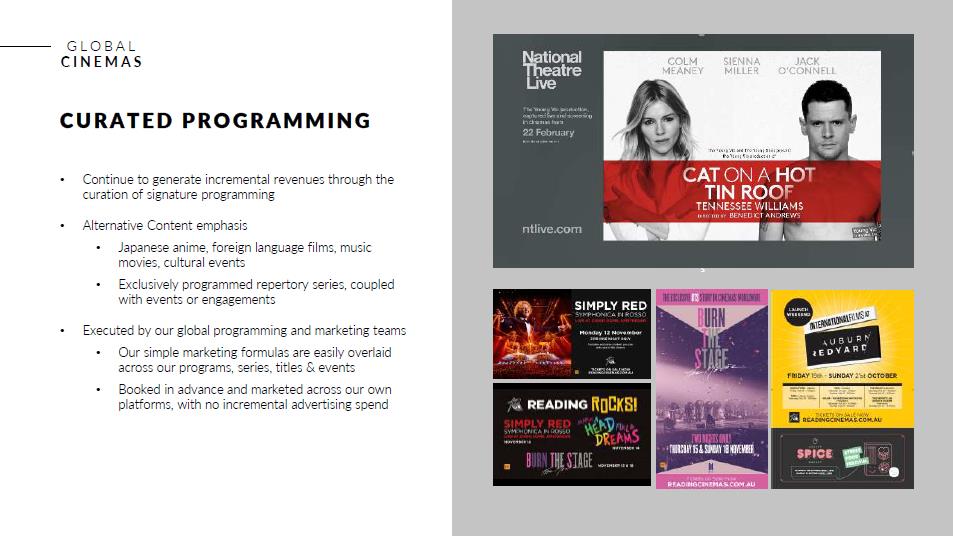
GLOBAL CINEMAS CURATED PROGRAMMING • Continue to generate incremental revenues through the curation of signature programming • Alternative Content emphasis • Japanese anime, foreign language films, music movies, cultural events • Exclusively programmed repertory series, coupled with events or engagements • Executed by our global programming and marketing teams • Our simple marketing formulas are easily overlaid across our programs, series, titles & events • Booked in advance and marketed across our own platforms, with no incremental advertising spend
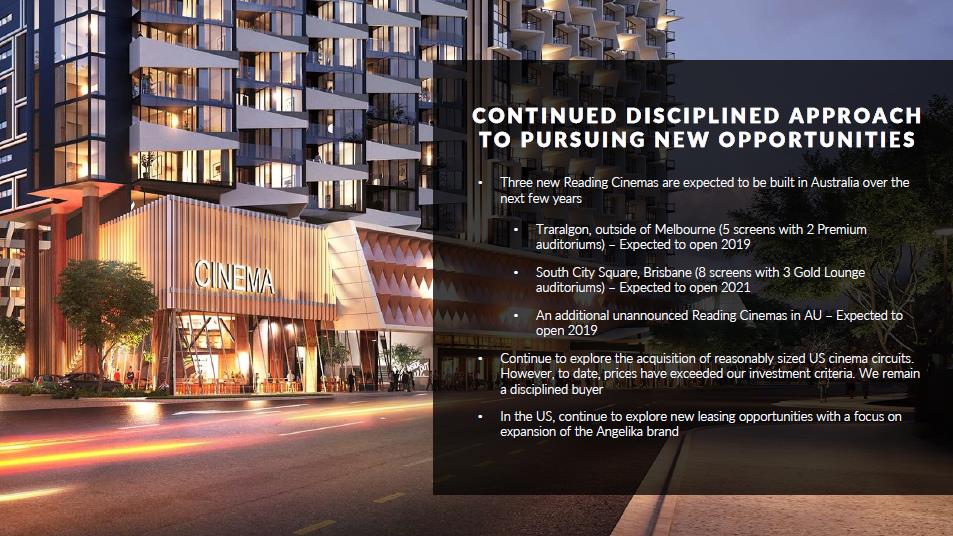
CONTINUED DISCIPLINED APPROACH TO PURSUING NEW OPPORTUNITIES • Three new Reading Cinemas are expected to be built in Australia over the next few years • Traralgon, outside of Melbourne (5 screens with 2 Premium auditoriums) – Expected to open 2019 • South City Square, Brisbane (8 screens with 3 Gold Lounge auditoriums) – Expected to open 2021 • An additional unannounced Reading Cinemas in AU – Expected to open 2019 • Continue to explore the acquisition of reasonably sized US cinema circuits. However, to date, prices have exceeded our investment criteria. We remain a disciplined buyer • In the US, continue to explore new leasing opportunities with a focus on expansion of the Angelika brand
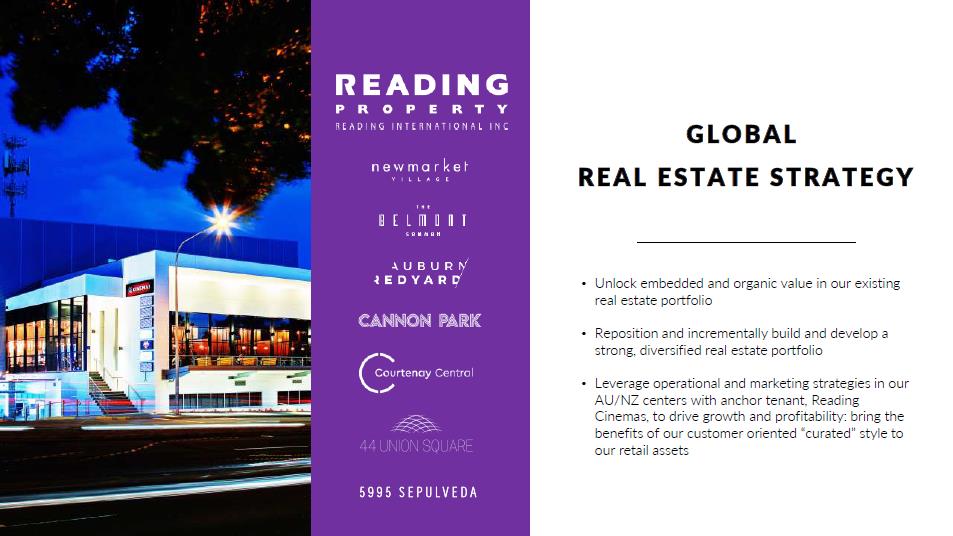
READING PROPERTY READING INTERNATIONAL INC. newmarket VILLAGE THE BELMONT COMMON AUBURN REDYARD CANNON PARK Courtenay Central 44 UNION SQUARE 5995 SEPULVEDA GLOBAL REAL ESTATE STRATEGY • Unlock embedded and organic value in our existing real estate portfolio • Reposition and incrementally build and develop a strong, diversified real estate portfolio • Leverage operational and marketing strategies in our AU/NZ centers with anchor tenant, Reading Cinemas, to drive growth and profitability: bring the benefits of our customer oriented “curated” style to our retail assets
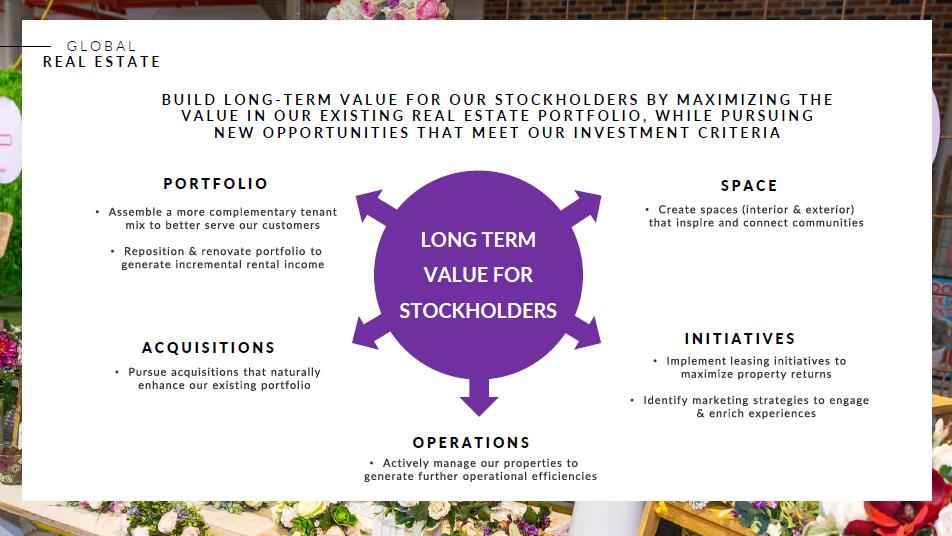
GLOBAL REAL ESTATE BUILD LONG-TERM VALUE FOR OUR STOCKHOLDERS BY MAXIMIZING THE VALUE IN OUR EXISTING REAL ESTATE PORTFOLIO, WHILE PURSUING NEW OPPORTUNITIES THAT MEET OUR INVESTMENT CRITERIA LONG TERM VALUE FOR STOCKHOLDERS PORTFOLIO Assemble a more complementary tenant mix to better serve our customers Reposition & renovate portfolio to generate incremental rental income ACQUISITIONS Pursue acquisitions that naturally enhance our existing portfolio OPERATIONS Actively manage our properties to generate further operational efficiencies SPACE Create spaces (interior & exterior) that inspire and connect communities INITIATIVES Implement leasing initiatives to maximize property returns Identify marketing strategies to engage & enrich experiences
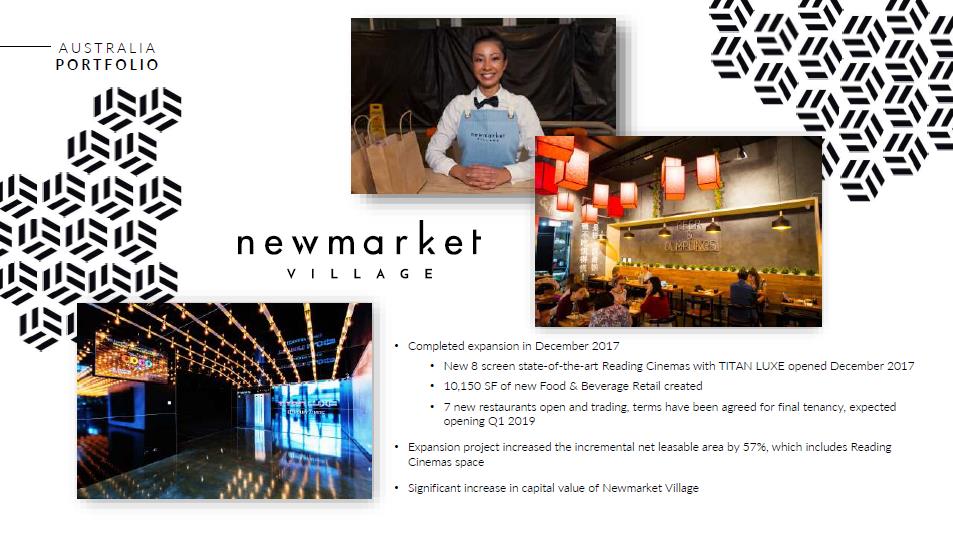
AUSTRALIA PORTFOLIO newmarket VILLAGE • Completed expansion in December 2017 • New 8 screen state-of-the-art Reading Cinemas with TITAN LUXE opened December 2017 • 10,150 SF of new Food & Beverage Retail created • 7 new restaurants open and trading, terms have been agreed for final tenancy, expected opening Q1 2019 • Expansion project increased the incremental net leasable area by 57%, which includes Reading Cinemas space • Significant increase in capital value of Newmarket Village
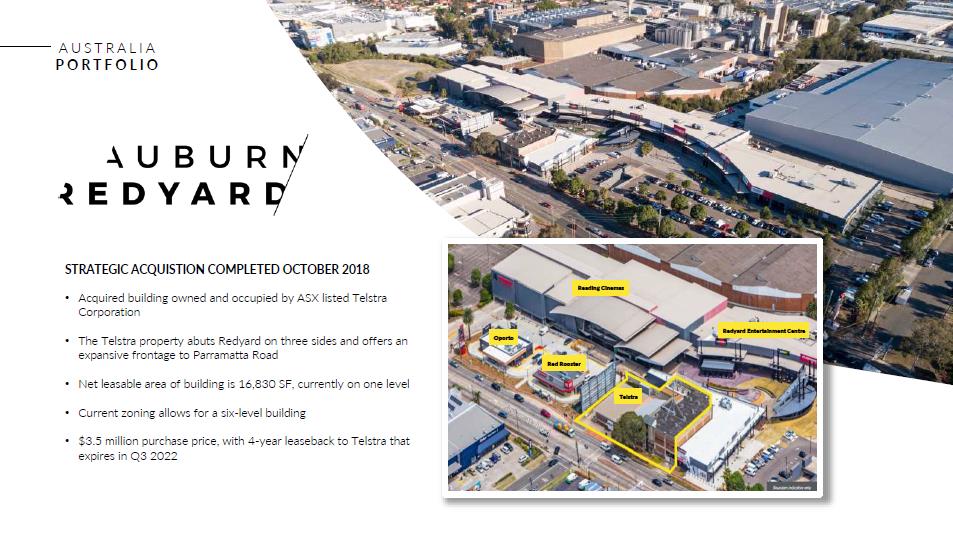
AUSTRALIA PORTFOLIO AUBURN REDYARD STRATEGIC ACQUISTION COMPLETED OCTOBER 2018 • Acquired building owned and occupied by ASX listed Telstra Corporation • The Telstra property abuts Redyard on three sides and offers an expansive frontage to Parramatta Road • Net leasable area of building is 16,830 SF, currently on one level • Current zoning allows for a six-level building • $3.5 million purchase price, with 4-year leaseback to Telstra that expires in Q3 2022
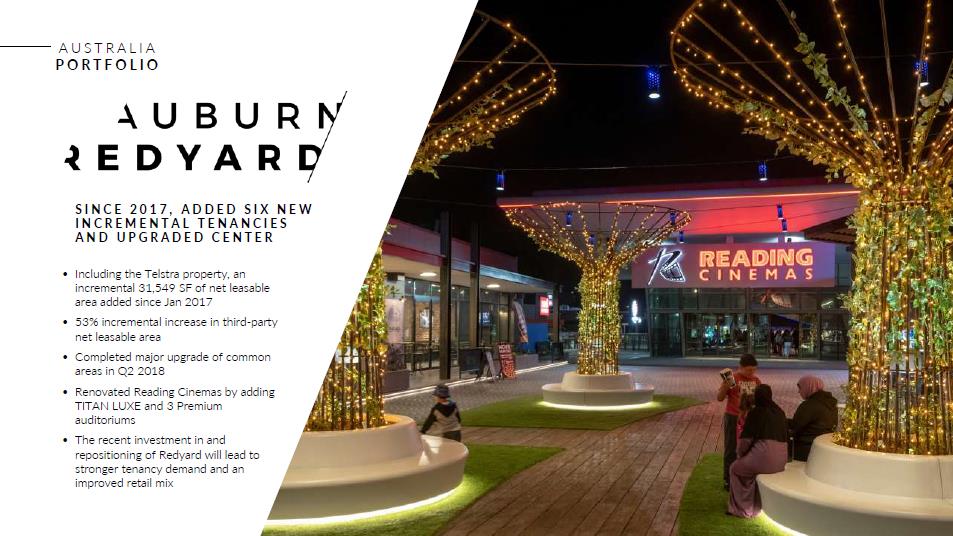
AUSTRALIA PORTFOLIO AUBURN REDYARD SINCE 2017, ADDED SIX NEW INCREMENTAL TENANCIES AND UPGRADED CENTER • Including the Telstra property, an incremental 31,549 SF of net leasable area added since Jan 2017 • 53% incremental increase in third-party net leasable area • Completed major upgrade of common areas in Q2 2018 • Renovated Reading Cinemas by adding TITAN LUXE and 3 Premium auditoriums • The recent investment in and repositioning of Redyard will lead to stronger tenancy demand and an improved retail mix
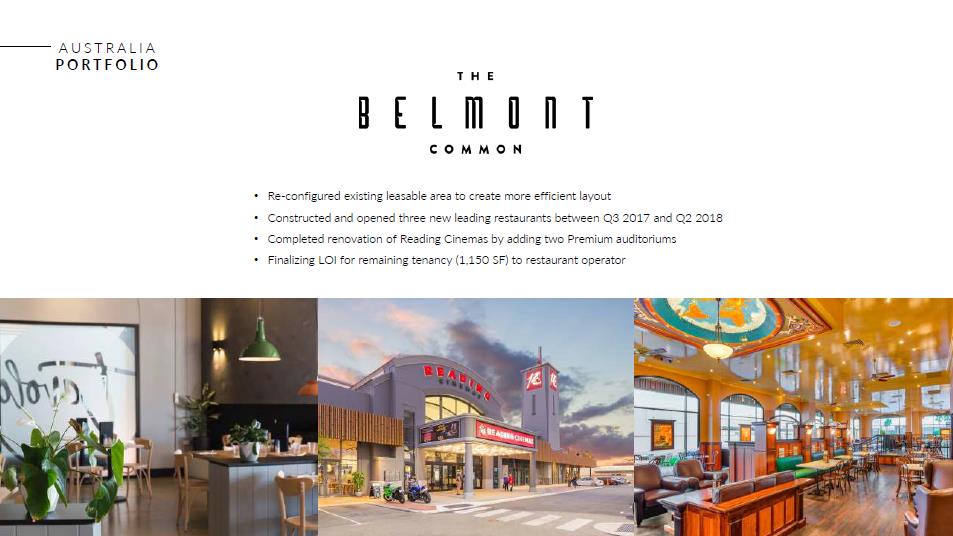
AUSTRALIA PORTFOLIO THE BELMONT COMMON • Re-configured existing leasable area to create more efficient layout • Constructed and opened three new leading restaurants between Q3 2017 and Q2 2018 • Completed renovation of Reading Cinemas by adding two Premium auditoriums • Finalizing LOI for remaining tenancy (1,150 SF) to restaurant operator
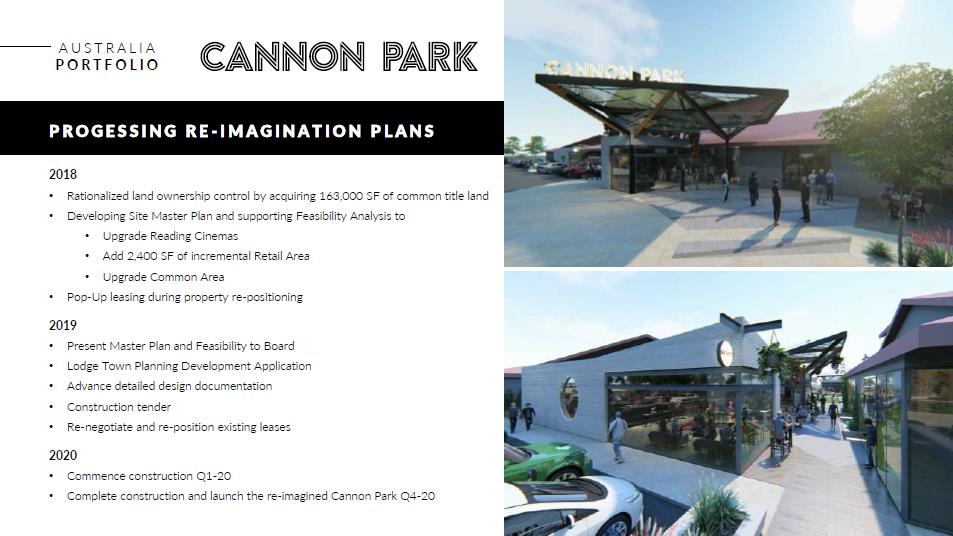
AUSTRALIA PORTFOLIO CANNON PARK PROGESSING RE-IMAGINATION PLANS 2018 • Rationalized land ownership control by acquiring 163,000 SF of common title land • Developing Site Master Plan and supporting Feasibility Analysis to • Upgrade Reading Cinemas • Add 2,400 SF of incremental Retail Area • Upgrade Common Area • Pop-Up leasing during property re-positioning 2019 • Present Master Plan and Feasibility to Board • Lodge Town Planning Development Application • Advance detailed design documentation • Construction tender • Re-negotiate and re-position existing leases 2020 • Commence construction Q1-20 • Complete construction and launch the re-imagined Cannon Park Q4-20
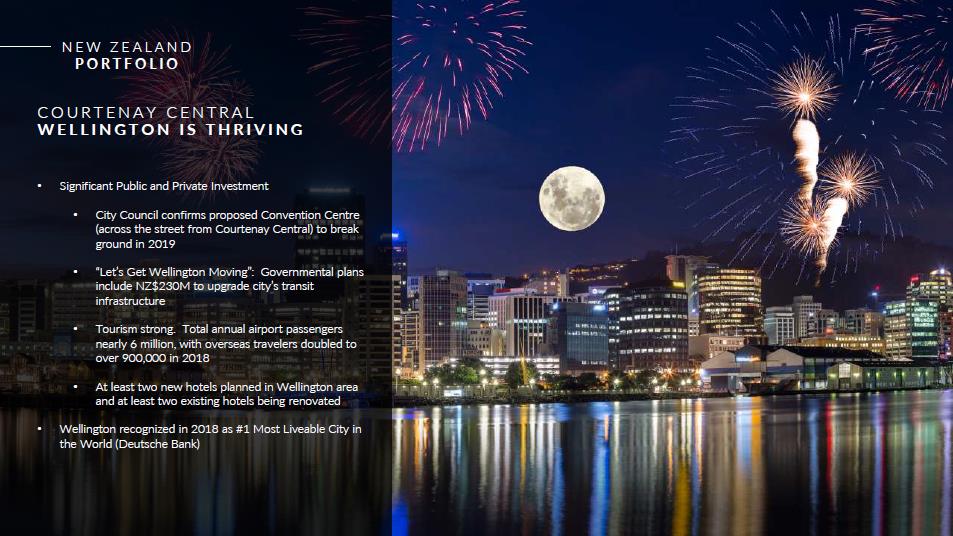
NEW ZEALAND PORTFOLIO COURTENAY CENTRAL WELLINGTON IS THRIVING • Significant Public and Private Investment • City Council confirms proposed Convention Centre (across the street from Courtenay Central) to break ground in 2019 • “Let’s Get Wellington Moving”: Governmental plans include NZ$230M to upgrade city’s transit infrastructure • Tourism strong. Total annual airport passengers nearly 6 million, with overseas travelers doubled to over 900,000 in 2018 • At least two new hotels planned in Wellington area and at least two existing hotels being renovated • Wellington recognized in 2018 as #1 Most Liveable City in the World (Deutsche Bank)
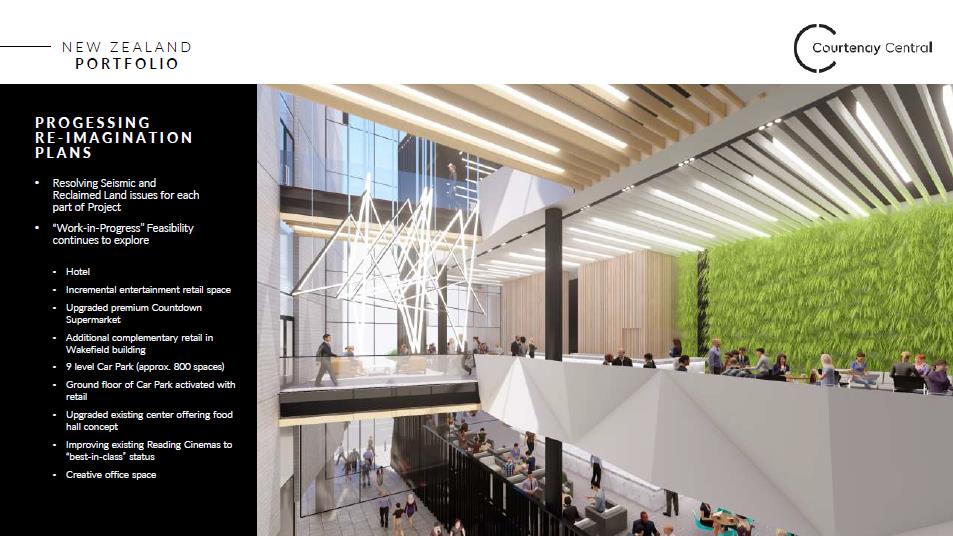
NEW ZEALAND PORTFOLIO Courtenay Central PROGESSING RE-IMAGINATION PLANS • Resolving Seismic and Reclaimed Land issues for each part of Project • “Work-in-Progress” Feasibility continues to explore • Hotel • Incremental entertainment retail space • Upgraded premium Countdown Supermarket • Additional complementary retail in Wakefield building • 9 level Car Park (approx. 800 spaces) • Ground floor of Car Park activated with retail • Upgraded existing center offering food hall concept • Improving existing Reading Cinemas to “best-in-class” status • Creative office space
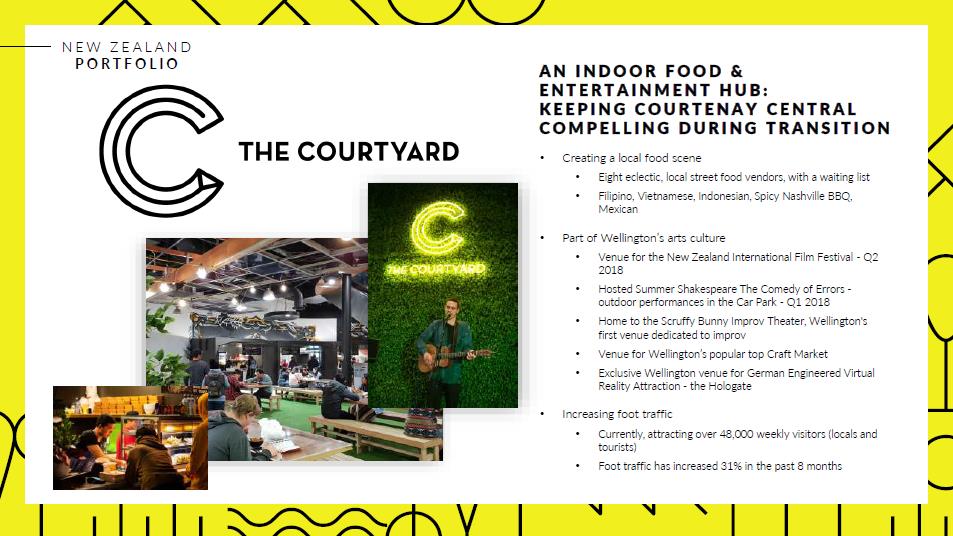
NEW ZEALAND PORTFOLIO THE COURTYARD AN INDOOR FOOD & ENTERTAINMENT HUB: KEEPING COURTENAY CENTRAL COMPELLING DURING TRANSITION • Creating a local food scene • Eight eclectic, local street food vendors, with a waiting list • Filipino, Vietnamese, Indonesian, Spicy Nashville BBQ, Mexican • Part of Wellington’s arts culture • Venue for the New Zealand International Film Festival-Q2 2018 • Hosted Summer Shakespeare The Comedy of Errors-outdoor performances in the Car Park-Q1 2018 • Home to the Scruffy Bunny Improv Theater, Wellington's first venue dedicated to improv • Venue for Wellington’s popular top Craft Market • Exclusive Wellington venue for German Engineered Virtual Reality Attraction-the Hologate • Increasing foot traffic • Currently, attracting over 48,000 weekly visitors (locals and tourists) • Foot traffic has increased 31% in the past 8 months
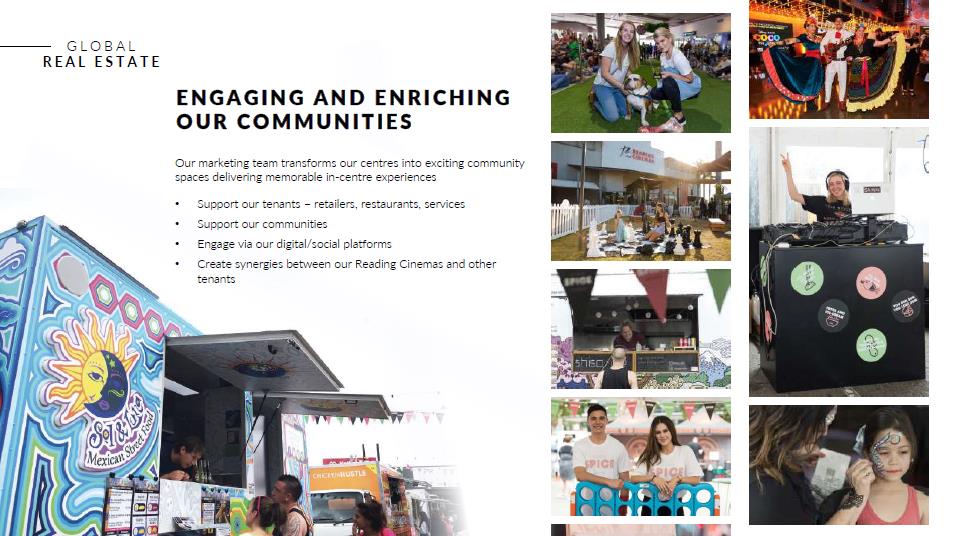
GLOBAL REAL ESTATE ENGAGING AND ENRICHING OUR COMMUNITIES Our marketing team transforms our centres into exciting community spaces delivering memorable in-centre experiences • Support our tenants – retailers, restaurants, services • Support our communities • Engage via our digital/social platforms • Create synergies between our Reading Cinemas and other tenants
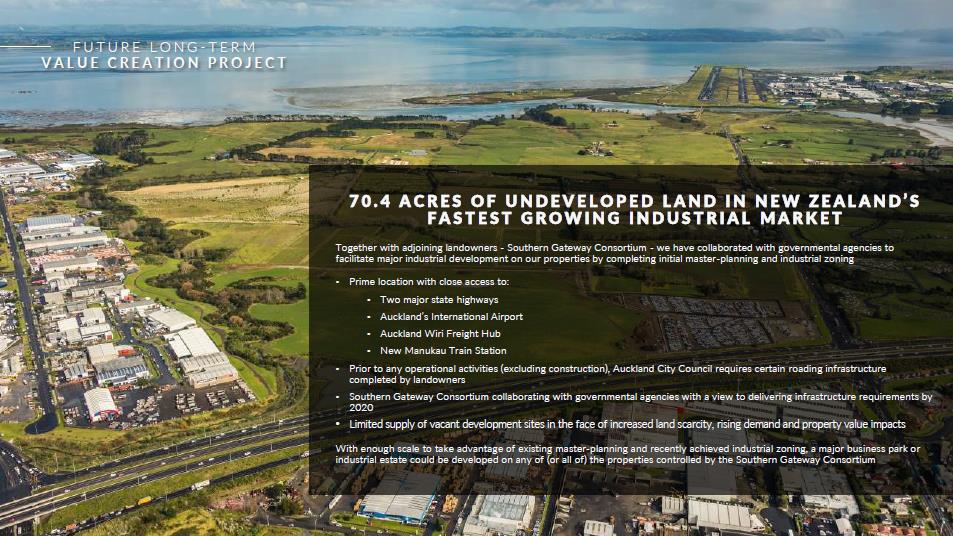
FUTURE LONG-TERM VALUE CREATION PROJECT 70.4 ACRES OF UNDEVELOPED LAND IN NEW ZEALAND’S FASTEST GROWING INDUSTRIAL MARKET Together with adjoining landowners-Southern Gateway Consortium-we have collaborated with governmental agencies to facilitate major industrial development on our properties by completing initial master-planning and industrial zoning • Prime location with close access to: • Two major state highways • Auckland’s International Airport • Auckland Wiri Freight Hub • New Manukau Train Station • Prior to any operational activities (excluding construction), Auckland City Council requires certain roading infrastructure completed by landowners • Southern Gateway Consortium collaborating with governmental agencies with a view to delivering infrastructure requirements by 2020 • Limited supply of vacant development sites in the face of increased land scarcity, rising demand and property value impacts With enough scale to take advantage of existing master-planning and recently achieved industrial zoning, a major business park or industrial estate could be developed on any of (or all of) the properties controlled by the Southern Gateway Consortium
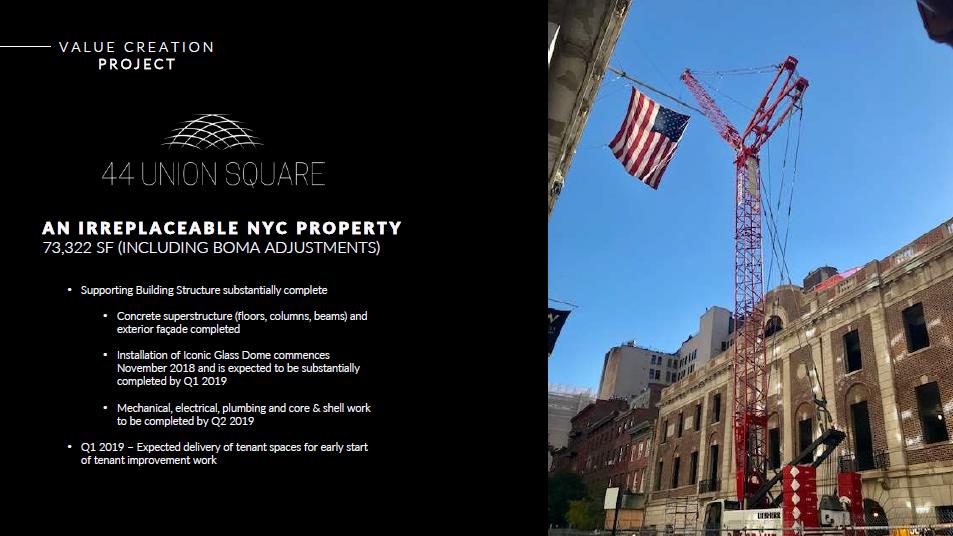
VALUE CREATION PROJECT 44 UNION SQUARE AN IRREPLACEABLE NYC PROPERTY 73,322 SF (INCLUDING BOMA ADJUSTMENTS) • Supporting Building Structure substantially complete • Concrete superstructure (floors, columns, beams) and exterior façade completed • Installation of Iconic Glass Dome commences November 2018 and is expected to be substantially completed by Q1 2019 • Mechanical, electrical, plumbing and core & shell work to be completed by Q2 2019 • Q1 2019 – Expected delivery of tenant spaces for early start of tenant improvement work
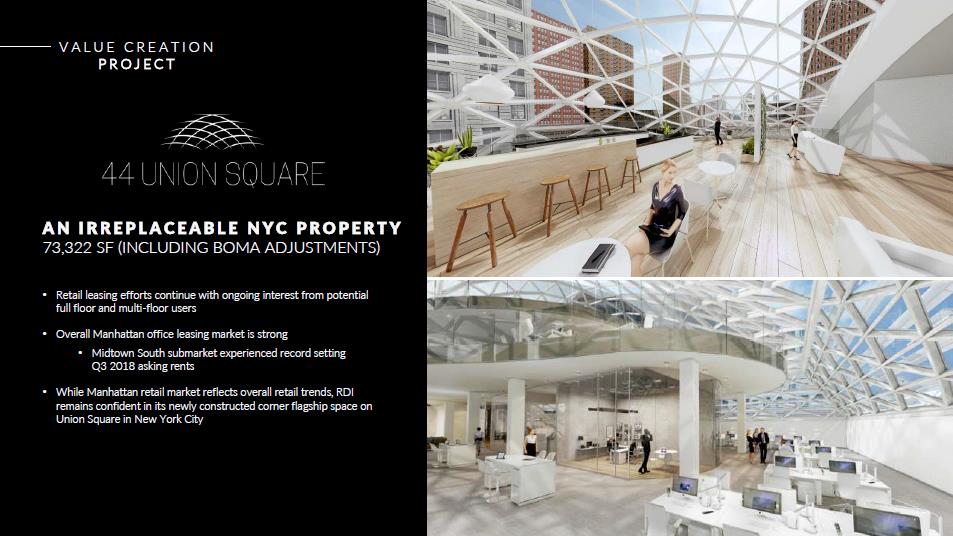
VALUE CREATION PROJECT44 UNION SQUARE AN IRREPLACEABLE NYC PROPERTY 73,322 SF (INCLUDING BOMA ADJUSTMENTS) • Retail leasing efforts continue with ongoing interest from potential full floor and multi-floor users • Overall Manhattan office leasing market is strong • Midtown South submarket experienced record setting Q3 2018 asking rents • While Manhattan retail market reflects overall retail trends, RDI remains confident in its newly constructed corner flagship space on Union Square in New York City
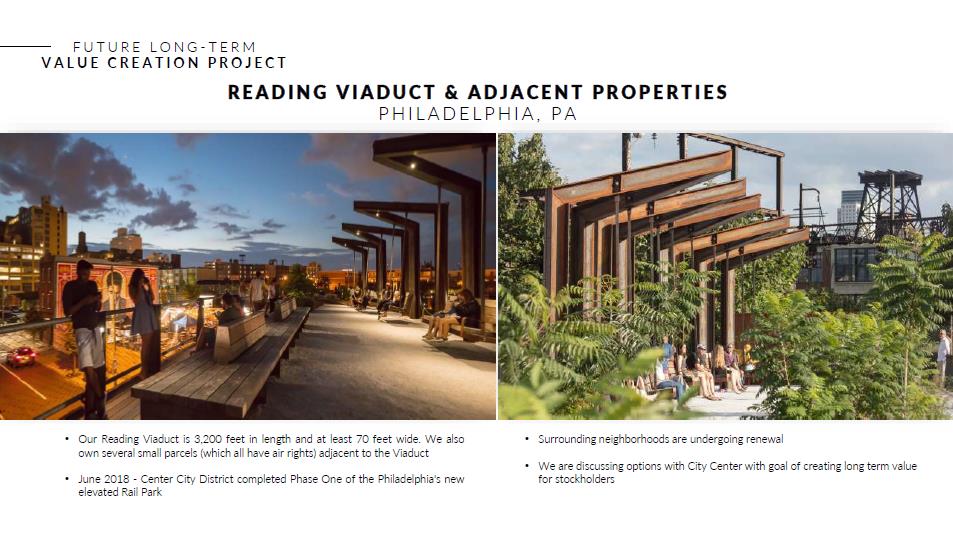
FUTURE LONG-TERM VALUE CREATION PROJECT READING VIADUCT & ADJACENT PROPERTIES PHILADELPHIA, PA • Our Reading Viaduct is 3,200 feet in length and at least 70 feet wide. We also own several small parcels (which all have air rights) adjacent to the Viaduct • June 2018-Center City District completed Phase One of the Philadelphia's new elevated Rail Park • Surrounding neighborhoods are undergoing renewal • We are discussing options with City Center with goal of creating long term value for stockholders
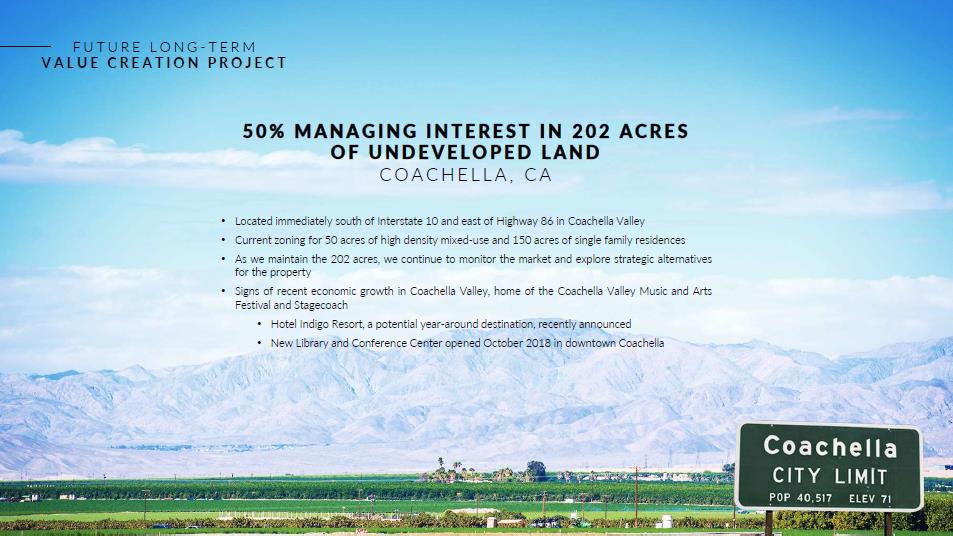
FUTURE LONG-TERM VALUE CREATION PROJECT 50% MANAGING INTEREST IN 202 ACRES OF UNDEVELOPED LAND COACHELLA, CA • Located immediately south of Interstate 10 and east of Highway 86 in Coachella Valley • Current zoning for 50 acres of high density mixed-use and 150 acres of single family residences • As we maintain the 202 acres, we continue to monitor the market and explore strategic alternatives for the property • Signs of recent economic growth in Coachella Valley, home of the Coachella Valley Music and Arts Festival and Stagecoach • Hotel Indigo Resort, a potential year-around destination, recently announced • New Library and Conference Center opened October 2018 in downtown Coachella
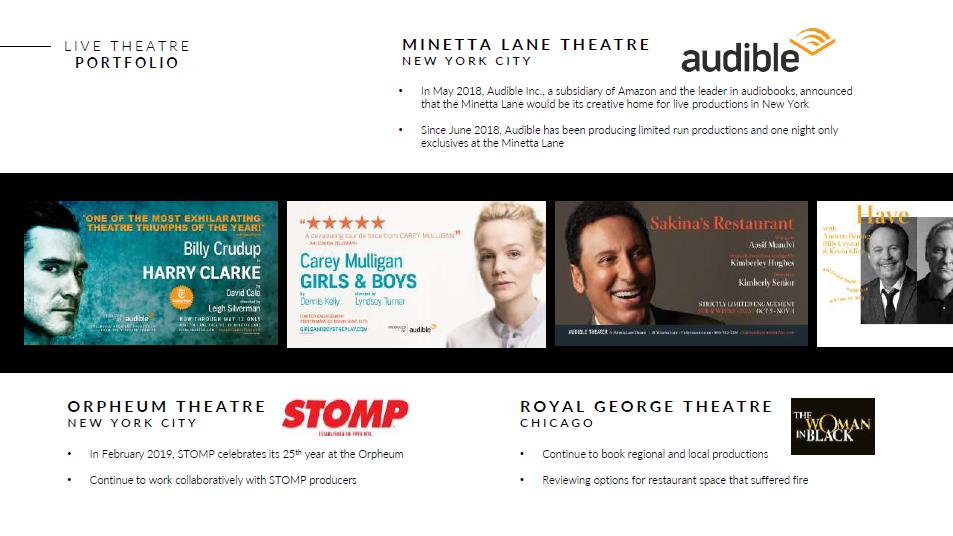
LIVE THEATRE PORTFOLIO MINETTA LANE THEATRE NEW YORK CITY audible • In May 2018, Audible Inc., a subsidiary of Amazon and the leader in audiobooks, announced that the Minetta Lane would be its creative home for live productions in New York • Since June 2018, Audible has been producing limited run productions and one night only exclusives at the Minetta Lane ORPHEUM THEATRE NEW YORK CITY• In February 2019, STOMP celebrates its 25th year at the Orpheum • Continue to work collaboratively with STOMP producers ROYAL GEORGE THEATRE CHICAGO • Continue to book regional and local productions • Reviewing options for restaurant space that suffered fire
FINANCIAL REVIEW PRESENTED BY DEV GHOSE Executive Vice President & Chief Financial Officer
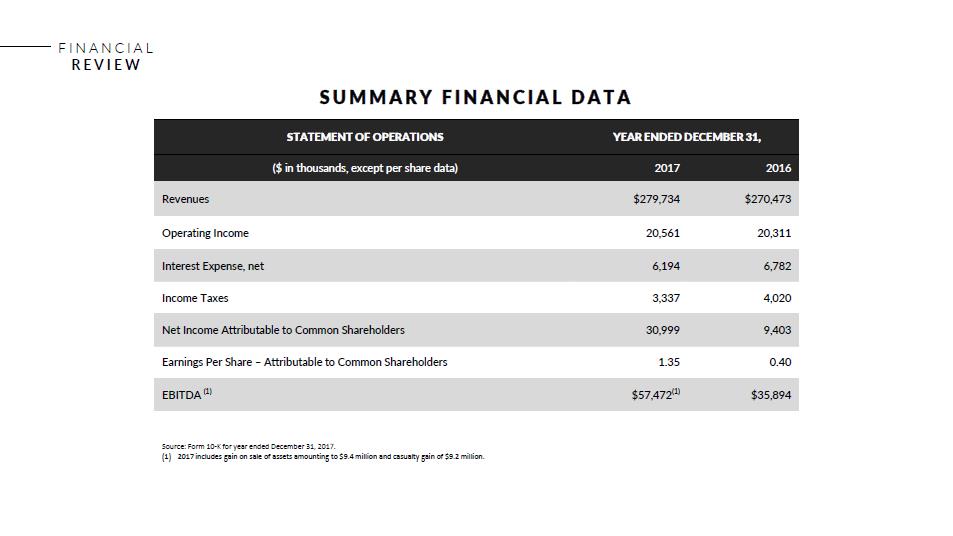
FINANCIAL REVIEW SUMMARY FINANCIAL DATA STATEMENT OF OPERATIONS YEAR ENDED DECEMBER 31, ($ in thousands, except per share data) 2017 2016 Revenues $279,734 $270,473 Operating Income 20,561 20,311 Interest Expense, net 6,194 6,782 Income Taxes 3,337 4,020 Net Income Attributable to Common Shareholders 30,999 9,403 Earnings Per Share – Attributable to Common Shareholders 1.35 0.40 EBITDA (1) $57,472(1) $35,894 Source: Form 10-K for year ended December 31, 2017. (1) 2017 includes gain on sale of assets amounting to $9.4 million and casualty gain of $9.2 million.
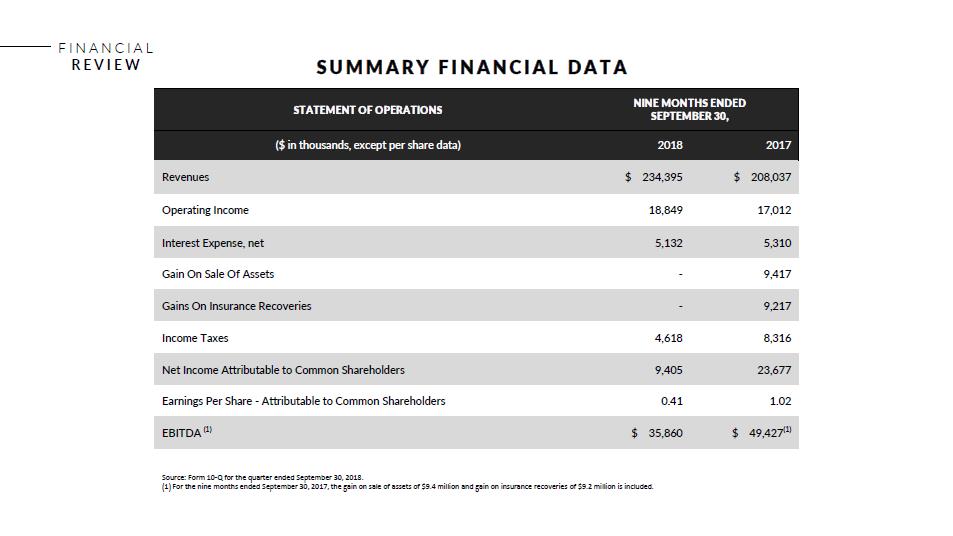
FINANCIAL REVIEW SUMMARY FINANCIAL DATA STATEMENT OF OPERATIONS NINE MONTHS ENDED SEPTEMBER 30, ($ in thousands, except per share data) 2018 2017 Revenues $ 234,395 $ 208,037 Operating Income 18,849 17,012 Interest Expense, net 5,132 5,310 Gain On Sale Of Assets-9,417 Gains On Insurance Recoveries-9,217 Income Taxes 4,618 8,316 Net Income Attributable to Common Shareholders 9,405 23,677 Earnings Per Share-Attributable to Common Shareholders 0.41 1.02 EBITDA (1) $ 35,860 $ 49,427(1) Source: Form 10-Q for the quarter ended September 30, 2018. (1) For the nine months ended September 30, 2017, the gain on sale of assets of $9.4 million and gain on insurance recoveries of $9.2 million is included.
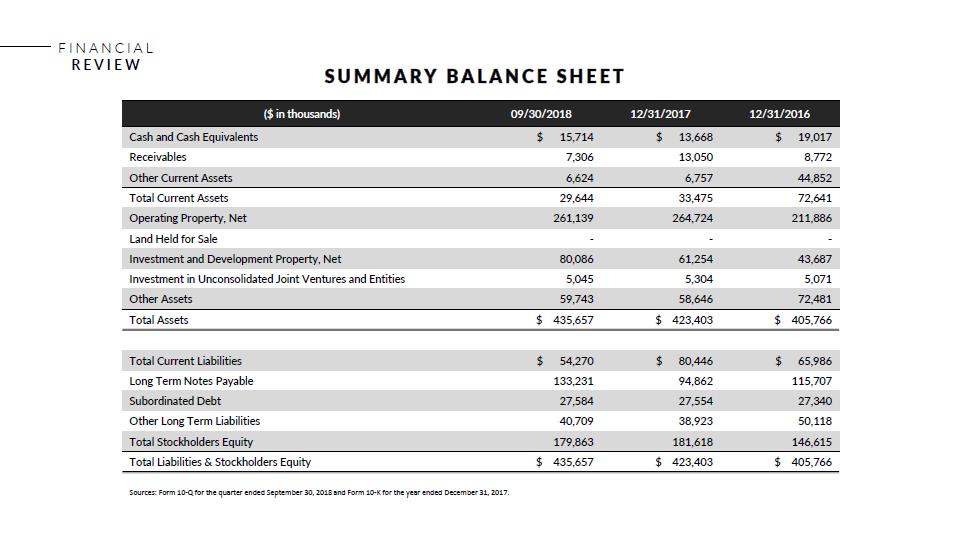
FINANCIAL REVIEW SUMMARY BALANCE SHEET ($ in thousands) 09/30/2018 12/31/2017 12/31/2016 Cash and Cash Equivalents $ 15,714 $ 13,668 $ 19,017 Receivables 7,306 13,050 8,772 Other Current Assets 6,624 6,757 44,852 Total Current Assets 29,644 33,475 72,641 Operating Property, Net 261,139 264,724 211,886 Land Held for Sale---Investment and Development Property, Net 80,086 61,254 43,687 Investment in Unconsolidated Joint Ventures and Entities 5,045 5,304 5,071 Other Assets 59,743 58,646 72,481 Total Assets $ 435,657 $ 423,403 $ 405,766 Total Current Liabilities $ 54,270 $ 80,446 $ 65,986 Long Term Notes Payable 133,231 94,862 115,707 Subordinated Debt 27,584 27,554 27,340 Other Long Term Liabilities 40,709 38,923 50,118 Total Stockholders Equity 179,863 181,618 146,615 Total Liabilities & Stockholders Equity $ 435,657 $ 423,403 $ 405,766 Sources: Form 10-Q for the quarter ended September 30, 2018 and Form 10-K for the year ended December 31, 2017.
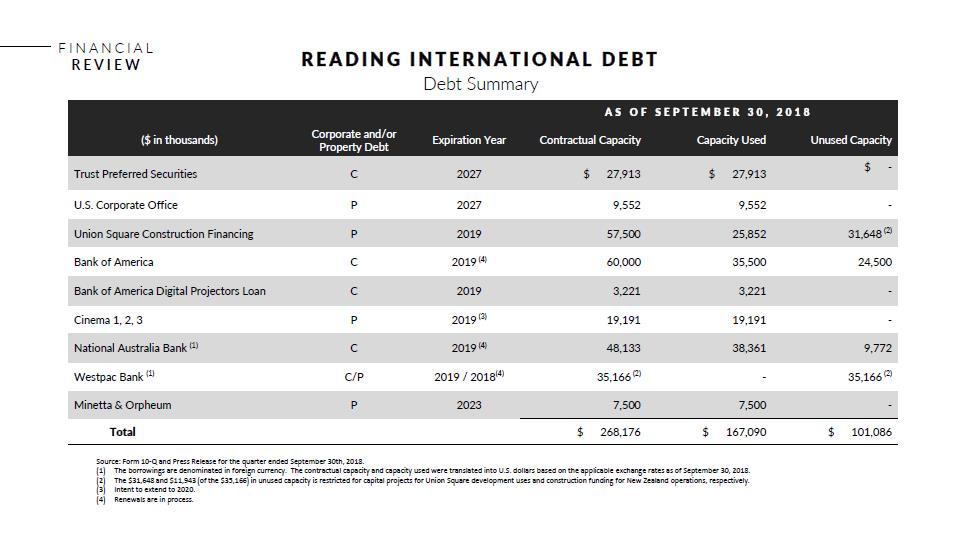
FINANCIAL REVIEW READING INTERNATIONAL DEBT Debt Summary AS OF SEPTEMBER 30, 2018 ($ in thousands) Corporate and/or Property Debt Expiration Year Contractual Capacity Capacity Used Unused Capacity Trust Preferred Securities C 2027 $ 27,913 $ 27,913 $-U.S. Corporate Office P 2027 9,552 9,552-Union Square Construction Financing P 2019 57,500 25,852 31,648 (2) Bank of America C 2019 (4) 60,000 35,500 24,500 Bank of America Digital Projectors Loan C 2019 3,221 3,221-Cinema 1, 2, 3 P 2019 (3) 19,191 19,191-National Australia Bank (1) C 2019 (4) 48,133 38,361 9,772 Westpac Bank (1) C/P 2019 / 2018(4) 35,166 (2)-35,166 (2) Minetta & Orpheum P 2023 7,500 7,500-Total $ 268,176 $ 167,090 $ 101,086 Source: Form 10-Q and Press Release for the quarter ended September 30th, 2018. (1) The borrowings are denominated in foreign currency. The contractual capacity and capacity used were translated into U.S. dollars based on the applicable exchange rates as of September 30, 2018. (2) The $31,648 and $11,943 (of the $35,166) in unused capacity is restricted for capital projects for Union Square development uses and construction funding for New Zealand operations, respectively. (3) Intent to extend to 2020. (4) Renewals are in process.
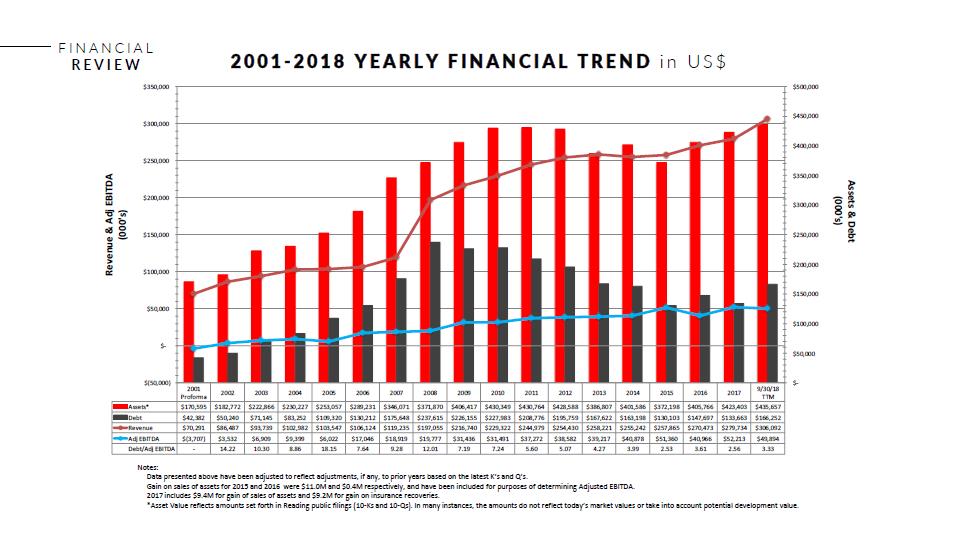
FINANCIAL REVIEW 2001- 2018 YEARLY FINANCIAL TREND in US $ 2001 Proforma 2002 2003 2004 2005 2006 2007 2008 2009 2010 2011 2012 2013 2014 2015 2016 2017 9/30/18 TTM Assets* $170,595 $182,772 $222,866 $230,227 $253,057 $289,231 $346,071 $371,870 $406,417 $430,349 $430,764 $428,588 $386,807 $401,586 $372,198 $405,766 $423,403 $435,657 Debt $42,382 $50,240 $71,145 $83,252 $109,320 $130,212 $175,648 $237,615 $226,155 $227,983 $208,776 $195,759 $167,622 $163,198 $130,103 $147,697 $133,663 $166,252 Revenue $70,291 $86,487 $93,739 $102,982 $103,547 $106,124 $119,235 $197,055 $216,740 $229,322 $244,979 $254,430 $258,221 $255,242 $257,865 $270,473 $279,734 $306,092 Adj EBITDA $(3,707) $3,532 $6,909 $9,399 $6,022 $17,046 $18,919 $19,777 $31,436 $31,491 $37,272 $38,582 $39,217 $40,878 $51,360 $40,966 $52,213 $49,894 Debt/Adj EBITDA-14.22 10.30 8.86 18.15 7.64 9.28 12.01 7.19 7.24 5.60 5.07 4.27 3.99 2.53 3.61 2.56 3.33 $- $50,000 $100,000 $150,000 $200,000 $250,000 $300,000 $350,000 $400,000 $450,000 $500,000 $(50,000) $- $50,000 $100,000 $150,000 $200,000 $250,000 $300,000 $350,000 Revenue & Adj EBITDA (000's) Assets & Debt (000's) Notes: Data presented above have been adjusted to reflect adjustments, if any, to prior years based on the latest K’s and Q’s. Gain on sales of assets for 2015 and 2016 were $11.0M and $0.4M respectively, and have been included for purposes of determining Adjusted EBITDA. 2017 includes $9.4M for gain of sales of assets and $9.2M for gain on insurance recoveries. *Asset Value reflects amounts set forth in Reading public filings (10-Ks and 10-Qs). In many instances, the amounts do not reflect today’s market values or take into account potential development value.
READING INTERNATIONAL THANK YOU