Attached files
| file | filename |
|---|---|
| EXCEL - IDEA: XBRL DOCUMENT - READING INTERNATIONAL INC | Financial_Report.xls |
| EX-32 - EX-32 - READING INTERNATIONAL INC | rdi-20140930xex32.htm |
| EX-3.1 - EX-3.1 - READING INTERNATIONAL INC | rdi-20140930ex31b5f5c77.htm |
| EX-31.1 - EX-31.1 - READING INTERNATIONAL INC | rdi-20140930ex3112ef6ba.htm |
| EX-31.2 - EX-31.2 - READING INTERNATIONAL INC | rdi-20140930ex312df6d62.htm |
SECURITIES AND EXCHANGE COMMISSION
Washington, D.C. 20549
__________________________________
FORM 10-Q
(Mark One)
|
☑ |
QUARTERLY REPORT PURSUANT TO SECTION 13 OR 15(D) OF THE SECURITIES EXCHANGE ACT OF 1934 |
For the quarterly period ended: September 30, 2014
OR
|
☐ |
TRANSITION REPORT PURSUANT TO SECTION 13 OR 15(D) OF THE SECURITIES EXCHANGE ACT OF 1934 |
For the transition period from ___________ to ___________
Commission file number 1-8625

READING INTERNATIONAL, INC.
(Exact name of Registrant as specified in its charter)
|
NEVADA (State or other jurisdiction of incorporation or organization) |
95-3885184 (IRS Employer Identification No.) |
|
6100 Center Drive, Suite 900 Los Angeles, CA (Address of principal executive offices) |
90045 (Zip Code) |
Registrant’s telephone number, including area code: (213) 235-2240
Indicate by check mark whether the registrant: (1) has filed all reports required to be filed by Section 13 or 15(d) of the Securities Exchange Act of 1934 during the preceding twelve months (or for such shorter period that the registrant was required to file such reports), and (2) has been subject to such filing requirements for the past 90 days. Yes ☑ No ☐
Indicate by check mark whether the registrant has submitted electronically and posted on its corporate Web site, if any, every Interactive Data File required to be submitted and posted pursuant to Rule 405 of Regulation S-T (§ 232.405 of this chapter) during the preceding 12 months (or for such shorter period that the registrant was required to submit and post such files). Yes ☑ No ☐
Indicate by check mark whether the registrant is a large accelerated filer, an accelerated filer, or a non-accelerated filer. See definition of “accelerated filer and large accelerated filer” in Rule 12b-2 of the Exchange Act. (Check one): Large accelerated filer ☐ Accelerated filer ☑ Non-accelerated filer ☐
Indicate by check mark whether the registrant is a shell company (as defined in Rule 12b-2 of the Exchange Act). Yes ☐ No ☑
Indicate the number of shares outstanding of each of the issuer’s classes of common stock, as of the latest practicable date. As of November 12, 2014, there were 21,885,238 shares of Class A Nonvoting Common Stock, $0.01 par value per share and 1,495,490 shares of Class B Voting Common Stock, $0.01 par value per share outstanding.
1
READING INTERNATIONAL, INC. AND SUBSIDIARIES
TABLE OF CONTENTS
2
PART 1 - Financial Information
Reading International, Inc. and Subsidiaries
Condensed Consolidated Balance Sheets (Unaudited)
(U.S. dollars in thousands)
|
|
September 30, |
December 31, |
||
|
|
2014 |
2013 |
||
|
ASSETS |
|
|
|
|
|
Current Assets: |
|
|
|
|
|
Cash and cash equivalents |
|
$ 40,636
|
|
$ 37,696
|
|
Receivables |
|
8,405 |
|
9,087 |
|
Inventory |
|
780 |
|
941 |
|
Investment in marketable securities |
|
51 |
|
55 |
|
Restricted cash |
|
782 |
|
782 |
|
Deferred tax asset |
|
1,381 |
|
3,273 |
|
Prepaid and other current assets |
|
3,957 |
|
3,283 |
|
Land held for sale |
|
10,809 |
|
-- |
|
Total current assets |
|
66,801 |
|
55,117 |
|
Operating property, net |
|
185,925 |
|
191,660 |
|
Land held for sale |
|
45,527 |
|
11,052 |
|
Investment and development property, net |
|
26,203 |
|
74,230 |
|
Investment in unconsolidated joint ventures and entities |
|
6,542 |
|
6,735 |
|
Investment in Reading International Trust I |
|
838 |
|
838 |
|
Goodwill |
|
21,538 |
|
22,159 |
|
Intangible assets, net |
|
11,958 |
|
13,440 |
|
Deferred tax asset, net |
|
6,273 |
|
5,566 |
|
Other assets |
|
6,109 |
|
6,010 |
|
Total assets |
|
$ 377,714
|
|
$ 386,807
|
|
LIABILITIES AND STOCKHOLDERS' EQUITY |
|
|
|
|
|
Current Liabilities: |
|
|
|
|
|
Accounts payable and accrued liabilities |
|
$ 16,785
|
|
$ 18,608
|
|
Film rent payable |
|
6,288 |
|
6,438 |
|
Notes payable – current |
|
31,879 |
|
75,538 |
|
Taxes payable - current |
|
3,790 |
|
8,308 |
|
Deferred current revenue |
|
10,561 |
|
11,864 |
|
Other current liabilities |
|
6,102 |
|
6,155 |
|
Total current liabilities |
|
75,405 |
|
126,911 |
|
Notes payable – long-term |
|
99,864 |
|
65,009 |
|
Subordinated debt |
|
27,913 |
|
27,913 |
|
Noncurrent tax liabilities |
|
11,826 |
|
12,478 |
|
Other liabilities |
|
37,525 |
|
32,749 |
|
Total liabilities |
|
252,533 |
|
265,060 |
|
Commitments and contingencies (Note 13) |
|
|
|
|
|
Stockholders’ equity: |
|
|
|
|
|
Class A non-voting common stock, par value $0.01, 100,000,000 shares authorized, |
|
|
|
|
|
32,520,508 issued and 21,885,238 outstanding at September 30, 2014 and 32,254,199 |
|
|
|
|
|
issued and 21,890,029 outstanding at December 31, 2013 |
|
226 |
|
225 |
|
Class B voting common stock, par value $0.01, 20,000,000 shares authorized and |
|
|
|
|
|
1,495,490 issued and outstanding at September 30, 2014 and at December 31, 2013 |
|
15 |
|
15 |
|
Nonvoting preferred stock, par value $0.01, 12,000 shares authorized and no issued |
|
|
|
|
|
or outstanding shares at September 30, 2014 and December 31, 2013 |
|
-- |
|
-- |
|
Additional paid-in capital |
|
138,910 |
|
137,849 |
|
Accumulated deficit |
|
(49,470) |
|
(57,952) |
|
Treasury shares |
|
(6,854) |
|
(4,512) |
|
Accumulated other comprehensive income |
|
37,558 |
|
41,515 |
|
Total Reading International, Inc. stockholders’ equity |
|
120,385 |
|
117,140 |
|
Noncontrolling interests |
|
4,796 |
|
4,607 |
|
Total stockholders’ equity |
|
125,181 |
|
121,747 |
|
Total liabilities and stockholders’ equity |
|
$ 377,714
|
|
$ 386,807
|
See accompanying notes to consolidated financial statements.
3
Reading International, Inc. and Subsidiaries
Condensed Consolidated Statements of Income (Unaudited)
(U.S. dollars in thousands, except per share amounts)
|
|
Three Months Ended |
|
Nine Months Ended |
||||||
|
|
September 30, |
|
September 30, |
||||||
|
|
2014 |
2013 |
|
2014 |
2013 |
||||
|
Operating revenue |
|
|
|
|
|
|
|
|
|
|
Cinema |
$ |
60,947 |
$ |
61,228 |
|
$ |
180,225 |
$ |
180,657 |
|
Real estate |
|
4,084 |
|
4,244 |
|
|
12,781 |
|
14,024 |
|
Total operating revenue |
|
65,031 |
|
65,472 |
|
|
193,006 |
|
194,681 |
|
Operating expense |
|
|
|
|
|
|
|
|
|
|
Cinema |
|
48,292 |
|
48,742 |
|
|
142,016 |
|
145,872 |
|
Real estate |
|
2,289 |
|
2,716 |
|
|
7,523 |
|
8,115 |
|
Depreciation and amortization |
|
3,821 |
|
3,602 |
|
|
11,490 |
|
11,243 |
|
General and administrative |
|
4,456 |
|
4,586 |
|
|
14,723 |
|
13,323 |
|
Total operating expense |
|
58,858 |
|
59,646 |
|
|
175,752 |
|
178,553 |
|
Operating income |
|
6,173 |
|
5,826 |
|
|
17,254 |
|
16,128 |
|
Interest income |
|
203 |
|
96 |
|
|
429 |
|
343 |
|
Interest expense |
|
(1,614) |
|
(2,910) |
|
|
(6,966) |
|
(8,467) |
|
Net gain (loss) on sale of assets |
|
25 |
|
-- |
|
|
25 |
|
(7) |
|
Other income (expense) |
|
242 |
|
(55) |
|
|
1,630 |
|
72 |
|
Income before income tax expense and equity earnings of unconsolidated joint ventures and entities |
|
5,029 |
|
2,957 |
|
|
12,372 |
|
8,069 |
|
Income tax (expense) |
|
(1,312) |
|
(751) |
|
|
(4,747) |
|
(3,140) |
|
Income before equity earnings of unconsolidated joint ventures and entities |
|
3,717 |
|
2,206 |
|
|
7,625 |
|
4,929 |
|
Equity earnings of unconsolidated joint ventures and entities |
|
222 |
|
225 |
|
|
833 |
|
1,005 |
|
Net Income |
$ |
3,939 |
$ |
2,431 |
|
$ |
8,458 |
$ |
5,934 |
|
Net (income) loss attributable to noncontrolling interests |
|
-- |
|
(38) |
|
|
23 |
|
(74) |
|
Net income attributable to Reading International, Inc. common shareholders |
$ |
3,939 |
$ |
2,393 |
|
$ |
8,481 |
$ |
5,860 |
|
Basic earnings per share attributable to Reading International, Inc. shareholders |
$ |
0.17 |
$ |
0.10 |
|
$ |
0.36 |
$ |
0.25 |
|
Diluted earnings per share attributable to Reading International, Inc. shareholders |
$ |
0.17 |
$ |
0.10 |
|
$ |
0.36 |
$ |
0.25 |
|
Weighted average number of shares outstanding–basic |
|
23,380,728 |
|
23,383,200 |
|
|
23,457,050 |
|
23,333,352 |
|
Weighted average number of shares outstanding–diluted |
|
23,678,223 |
|
23,517,191 |
|
|
23,754,545 |
|
23,467,343 |
See accompanying notes to consolidated financial statements.
4
Reading International, Inc. and Subsidiaries
Condensed Consolidated Statements of Comprehensive Income (Loss) (Unaudited)
(U.S. dollars in thousands)
|
|
|
Three Months Ended |
|
|
Nine Months Ended |
||||||
|
|
|
September 30, |
|
|
September 30, |
||||||
|
|
|
2014 |
|
|
2013 |
|
|
2014 |
|
|
2013 |
|
Net income |
$ |
3,939 |
|
$ |
2,431 |
|
$ |
8,458 |
|
$ |
5,934 |
|
Foreign currency translation gain (loss) |
|
(14,687) |
|
|
5,819 |
|
|
(4,627) |
|
|
(13,043) |
|
Unrealized gain (loss) on available for sale investments |
|
(1) |
|
|
(2) |
|
|
(2) |
|
|
2 |
|
Amortization of pension prior service costs |
|
215 |
|
|
166 |
|
|
686 |
|
|
496 |
|
Comprehensive income (loss) |
|
(10,534) |
|
|
8,414 |
|
|
4,515 |
|
|
(6,611) |
|
Net (income) loss attributable to noncontrolling interests |
|
-- |
|
|
(38) |
|
|
23 |
|
|
(74) |
|
Comprehensive income attributable to noncontrolling interests |
|
(42) |
|
|
(15) |
|
|
(14) |
|
|
57 |
|
Comprehensive income (loss) attributable to Reading International, Inc. |
$ |
(10,576) |
|
$ |
8,361 |
|
$ |
4,524 |
|
$ |
(6,628) |
See accompanying notes to consolidated financial statements.
5
Reading International, Inc. and Subsidiaries
Condensed Consolidated Statements of Cash Flows (Unaudited)
(U.S. dollars in thousands)
|
|
|
|
|
|
|
|
|
|
Nine Months Ended |
|||
|
|
|
September 30, |
|||
|
|
|
2014 |
|
|
2013 |
|
Operating Activities |
|
|
|
|
|
|
Net income |
$ |
8,458 |
|
$ |
5,934 |
|
Adjustments to reconcile net loss to net cash used in operating activities: |
|
|
|
|
|
|
Gain (loss) recognized on foreign currency transactions |
|
-- |
|
|
33 |
|
Equity earnings of unconsolidated joint ventures and entities |
|
(833) |
|
|
(1,005) |
|
Distributions of earnings from unconsolidated joint ventures and entities |
|
610 |
|
|
879 |
|
(Gain) loss on sale of assets |
|
(25) |
|
|
7 |
|
Change in net deferred tax assets |
|
1,047 |
|
|
980 |
|
Foreign currency translation adj - note |
|
1,595 |
|
|
-- |
|
Depreciation and amortization |
|
11,490 |
|
|
11,243 |
|
Amortization of prior service costs |
|
686 |
|
|
495 |
|
Amortization of above and below market leases |
|
215 |
|
|
305 |
|
Amortization of deferred financing costs |
|
578 |
|
|
722 |
|
Amortization of straight-line rent |
|
360 |
|
|
606 |
|
Stock based compensation expense |
|
86 |
|
|
148 |
|
Changes in assets and liabilities: |
|
|
|
|
|
|
Decrease in receivables |
|
522 |
|
|
1,146 |
|
(Increase) decrease in prepaid and other assets |
|
(1,408) |
|
|
171 |
|
Decrease in accounts payable and accrued expenses |
|
(1,597) |
|
|
(840) |
|
Increase (decrease) in film rent payable |
|
(96) |
|
|
174 |
|
Decrease in taxes payable |
|
(5,168) |
|
|
(2,371) |
|
Increase (decrease) in deferred revenue and other liabilities |
|
(1,706) |
|
|
(2,381) |
|
Net cash provided by operating activities |
|
14,814 |
|
|
16,246 |
|
Investing Activities |
|
|
|
|
|
|
Purchases of and additions to property and equipment |
|
(8,669) |
|
|
(12,666) |
|
Change in restricted cash |
|
27 |
|
|
1,613 |
|
Proceeds from notes receivable |
|
-- |
|
|
2,000 |
|
Distributions of investment in unconsolidated joint ventures and entities |
|
212 |
|
|
155 |
|
Deposit from sale of property |
|
5,390 |
|
|
-- |
|
Proceeds of time deposits |
|
-- |
|
|
8,000 |
|
Net cash provided by investing activities |
|
(3,040) |
|
|
(898) |
|
Financing Activities |
|
|
|
|
|
|
Repayment of long-term borrowings |
|
(6,627) |
|
|
(25,133) |
|
Proceeds from borrowings |
|
-- |
|
|
12,500 |
|
Capitalized borrowing costs |
|
-- |
|
|
(103) |
|
Repurchase of Class A Nonvoting Common Stock |
|
(2,342) |
|
|
-- |
|
Proceeds from the exercise of stock options |
|
975 |
|
|
249 |
|
Noncontrolling interest contributions |
|
327 |
|
|
263 |
|
Noncontrolling interest distributions |
|
(101) |
|
|
(2,103) |
|
Net cash (used in) financing activities |
|
(7,768) |
|
|
(14,327) |
|
Effect of exchange rate on cash |
|
(1,066) |
|
|
(1,705) |
|
Increase (decrease) in cash and cash equivalents |
|
2,940 |
|
|
(684) |
|
Cash and cash equivalents at the beginning of the period |
|
37,696 |
|
|
38,531 |
|
Cash and cash equivalents at the end of the period |
$ |
40,636 |
|
$ |
37,847 |
|
Supplemental Disclosures |
|
|
|
|
|
|
Cash paid during the period for: |
|
|
|
|
|
|
Interest on borrowings |
$ |
7,357 |
|
$ |
8,536 |
|
Income taxes |
|
5,178 |
|
|
4,911 |
See accompanying notes to consolidated financial statements.
6
Reading International, Inc. and Subsidiaries
Notes to Condensed Consolidated Financial Statements (Unaudited)
For the Nine Months Ended September 30, 2014
Note 1 – Basis of Presentation
Reading International, Inc., a Nevada corporation (“RDI” and collectively with our consolidated subsidiaries and corporate predecessors, the “Company,” “Reading” and “we,” “us,” or “our”), was founded in 1983 as a Delaware corporation and reincorporated in 1999 in Nevada. Our businesses consist primarily of:
|
· |
the development, ownership, and operation of multiplex cinemas in the United States, Australia, and New Zealand; and |
|
· |
the development, ownership, and operation of retail and commercial real estate in Australia, New Zealand, and the United States. |
The accompanying unaudited condensed consolidated financial statements were prepared in accordance with accounting principles generally accepted in the United States of America (“US GAAP”) for interim reporting and with the instructions to Form 10-Q and Rule 10-01 of Regulation S-X of the Securities and Exchange Commission (“SEC”) for interim reporting. As such, certain information and disclosures typically required by US GAAP for complete financial statements have been condensed or omitted. The financial information presented in this quarterly report on Form 10-Q for the period ended September 30, 2014 (the “September Report”) should be read in conjunction with our Annual Report filed on Form 10-K for the year ended December 31, 2013 (our “2013 Annual Report”) which contains the latest audited financial statements and related notes. The periods presented in this document are the three (“2014 Quarter”) and nine (“2014 Nine Months”) months ended September 30, 2014 and the three (“2013 Quarter”) and nine (“2013 Nine Months”) months ended September 30, 2013.
In the opinion of management, all adjustments of a normal recurring nature considered necessary to present fairly in all material respects our financial position as of September 30, 2014 and the results of our operations and cash flows for the three and nine months ended September 30, 2014 and 2013 have been made. The results of operations for the three and nine months ended September 30, 2014 are not necessarily indicative of the results of operations to be expected for the entire year.
Out of Period Adjustment
During this quarter, we identified an adjustment of approximately $1.4 million to the deferred tax asset that was originated from a transaction we effectuated in Australia in 2013. The adjustment increased the deferred tax asset with a corresponding increase to other comprehensive income. We determined that the adjustment did not have a material impact to our current or prior period consolidated financial statements.
Expiring Debt and Liquidity Requirements
Expiring Long-Term Debt
Our New Zealand Corporate Credit Facility matures on March 31, 2015 and as such the balance of $21.8 million (NZ$28.0 million) has been reclassified as a current liability on the consolidated balance sheet as of September 30, 2014.
Additionally, the term of our Union Square Theatre Term Loan matures on May 1, 2015. Accordingly, the outstanding balance of this debt of $6.5 million has been classified as a current liability on the consolidated balance sheet as of September 30, 2014.
While no assurances can be given that we will be successful, we currently anticipate that these loans will either be extended or replaced prior to their maturities.
Tax Settlement Liability
As indicated in our 2013 Annual Report, in accordance with the agreement between the U.S. Internal Revenue Service and our subsidiary, Craig Corporation, it is obligated to pay $290,000 per month, $3.5 million per year, in settlement of its tax liability for the tax year ended June 30, 1997.
Liquidity
For the above mentioned liabilities, we believe that we have the required liquidity to meet these obligations either through the extension or replacement of maturing debt or the generation of cash from our operating activities. Together with our $40.6 million of cash and cash equivalents, we expect to meet our anticipated short-term working capital requirements for the next twelve months.
7
Receivables
Our receivables balance is comprised primarily of credit card receivables, representing the purchase price of tickets, concessions or coupon books sold at our various businesses. Sales charged on customer credit cards are collected when the credit card transactions are processed. The remaining receivables balance is primarily comprised of goods and services tax (“GST”) refunded receivables from our Australian taxing authorities, management fee receivables from the managed cinemas and business interruption insurance recovery proceeds.
Marketable Securities
We had investments in marketable securities of $51,000 and $55,000 at September 30, 2014 and December 31, 2013, respectively. We account for these investments as available for sale investments. We assess our investment in marketable securities for other-than-temporary impairments in accordance with Financial Accounting Standards Board (“FASB”) Accounting Standards Codification (“ASC”) 320-10 for each applicable reporting period. These investments have a cumulative gain of $7,000 included in accumulated other comprehensive income at September 30, 2014. For the three and nine months ended September 30, 2014, our net unrealized gain (loss) on marketable securities was ($1,000) and ($2,000), respectively. For the three and nine months ended September 30, 2013, our net unrealized gain (loss) on marketable securities was ($2,000) and $2,000, respectively. During the nine months ended September 30, 2014 and 2013, we did not buy or sell any marketable securities.
Deferred Leasing Costs
We amortize direct costs incurred in connection with obtaining tenants for our properties over the respective term of the lease on a straight-line basis.
Deferred Financing Costs
We amortize direct costs incurred in connection with obtaining financing over the term of the loan using the effective interest method, or the straight-line method, if the result is not materially different. In addition, interest on loans with increasing interest rates and scheduled principal pre-payments is also recognized using the effective interest method.
Accounting Pronouncements Adopted During 2014
No new pronouncements were adopted during the nine months ended September 30, 2014.
New Accounting Pronouncements
In April 2014, the FASB issued ASU No. 2014-08, Reporting Discontinued Operations and Disclosures of Disposals of Components of an Entity. The amendments in this update change the criteria for determining which disposals can be presented as discontinued operations and modify related disclosure requirements. The guidance applies prospectively to new disposals and new classifications of disposal groups as held for sale after the effective date, and is effective for the Company as of January 1, 2015. However, all entities may adopt the guidance early for new disposals (or new classifications as held for sale) that have not been reported in financial statements previously issued or available for issuance.
In May 2014, the Financial Accounting Standards Board issued a new standard to achieve a consistent application of revenue recognition within the U.S. resulting in a single revenue model to be applied by reporting companies under U.S. generally accepted accounting principles. Under the new model, recognition of revenues occurs when a customer obtains control of promised goods or services in an amount that reflects the consideration to which the entity expects to be entitled in exchange for those goods or services. In addition, the new standard requires that reporting companies disclose the nature, amount, timing and uncertainty of revenue and cash flows arising from contracts with customers. The new standard is effective for us beginning in the first quarter of 2017; early adoption is prohibited. The new standard is required to be applied retrospectively to each prior reporting period presented or retrospectively with the cumulative effect of initially applying it recognized at the date of initial application. We have not yet selected a transition method nor have we determined the impact of the new standard on our consolidated condensed financial statements.
Note 2 – Equity and Stock-Based Compensation
Stock-Based Compensation
During the nine months ended September 30, 2014 and 2013, we issued 125,209 and 217,890, respectively, Class A Nonvoting shares to an executive employee associated with the vesting of his prior years’ stock grants. During the three and nine months ended September 30, 2014, we accrued $300,000 and $900,000, respectively, in compensation expense associated with the vesting of executive employee stock grants. During the three and nine months ended September 30, 2013, we accrued $188,000 and $564,000, respectively, in compensation expense associated with the vesting of executive employee stock grants.
8
Employee/Director Stock Option Plan
We have a long-term incentive stock option plan that provides for the grant to eligible employees, directors, and consultants of incentive or nonstatutory options to purchase shares of our Class A Nonvoting Common Stock and Class B Voting Common Stock. Currently we issue options under our 2010 Stock Incentive Plan.
When the Company’s tax deduction from an option exercise exceeds the compensation cost resulting from the option, a tax benefit is created. FASB ASC 718-20 relating to Stock-Based Compensation (“FASB ASC 718-20”), requires that excess tax benefits related to stock option exercises be reflected as financing cash inflows instead of operating cash inflows. For the three and nine months ended September 30, 2014 and 2013, there was no impact to the unaudited condensed consolidated statement of cash flows because there were no recognized tax benefits from stock option exercises during these periods.
FASB ASC 718-20 requires companies to estimate forfeitures. Unusually, during the nine months ended September 30, 2014, we had forfeitures of 64,000 options for the Class A common stock as a result of employee terminations. It is the company’s policy, unless adjusted by the Compensation Committee, to give the terminated employee three months from their termination date to exercise their options. If the options are not exercised within the three month period, they are considered forfeited.
In accordance with FASB ASC 718-20, we estimate the fair value of our options using the Black-Scholes option-pricing model, which takes into account assumptions such as the dividend yield, the risk-free interest rate, the expected stock price volatility, and the expected life of the options. As we intend to retain all earnings, we exclude the dividend yield from the calculation. We expense the estimated grant date fair values of options issued on a straight-line basis over the vesting period.
For the 20,000 and 50,000 options granted during the nine months ended September 30, 2014 and 2013, respectively, we estimated the fair value of these options at the date of grant using a Black-Scholes option-pricing model with the following weighted average assumptions:
|
2014 |
2013 |
|||
|
|
Stock option exercise price |
$7.40 |
$5.89 |
|
|
|
Risk-free interest rate |
2.88% |
2.26% |
|
|
|
Expected dividend yield |
-- |
-- |
|
|
|
Expected option life in years |
10 |
10 |
|
|
|
Expected volatility |
30.65% |
31.89% |
|
|
|
Weighted average fair value |
$2.46 |
$1.89 |
|
Based on the above calculation and prior years’ assumptions, and, in accordance with the FASB ASC 718-20, we recorded compensation expense for the total estimated grant date fair value of $ 33,000 and $ 102,000 for the three and nine months ended September 30, 2014, respectively, and $77,000 and $130,000 for the three and nine months ended September 30, 2013, respectively. At September 30, 2014, the total unrecognized estimated compensation cost related to non-vested stock options granted was $385,000, which we expect to recognize over a weighted average vesting period of 1.96 years. 141,100 options were exercised, during the nine months ended September 30, 2014 having an intrinsic value of $285,000 for which we received $890,000 of cash, and 62,500 options were exercised during the nine months ended September 30, 2013 having an intrinsic value of $132,000 for which we received $249,000 of cash. The intrinsic, unrealized value of all options outstanding, vested and expected to vest, at September 30, 2014 was $1.1 million of which 66.2% are currently exercisable.
Pursuant to both our 1999 Stock Option Plan and our 2010 Stock Incentive Plan, all stock options expire no later than ten years from their grant date. The aggregate total number of shares of Class A Nonvoting Common Stock and Class B Voting Common Stock authorized for issuance under our 2010 Stock Incentive Plan is 1,250,000. At the discretion of our Compensation and Stock Options Committee, the vesting period of stock options is usually between zero and four years.
9
We had the following stock options outstanding and exercisable as of September 30, 2014 and December 31, 2013:
|
|
|
|
Weighted |
|
|
|
Weighted Average |
|||||
|
|
Common Stock |
Average Exercise |
Common Stock |
|
Price of |
|||||||
|
|
Options |
Price of Options |
Exercisable |
|
Exercisable |
|||||||
|
|
Outstanding |
Outstanding |
Options |
|
Options |
|||||||
|
|
Class A |
Class B |
Class A |
Class B |
Class A |
Class B |
Class A |
Class B |
||||
|
Outstanding - December 31, 2013 |
709,850 | 185,100 |
$ |
6.24 |
$ |
9.90 | 490,350 | 185,100 |
$ |
6.85 |
$ |
9.90 |
|
Granted |
20,000 |
-- |
$ |
-- |
$ |
-- |
-- |
-- |
|
-- |
|
-- |
|
Exercised |
(500) |
-- |
$ |
-- |
$ |
-- |
-- |
-- |
|
-- |
|
-- |
|
Outstanding - March 31, 2014 |
729,350 | 185,100 |
$ |
6.60 |
$ |
9.90 | 510,350 | 185,100 |
$ |
6.87 |
$ |
9.90 |
|
Granted |
-- |
-- |
$ |
-- |
$ |
-- |
-- |
-- |
|
-- |
|
-- |
|
Exercised |
(77,000) |
-- |
$ |
-- |
$ |
-- |
-- |
-- |
|
-- |
|
-- |
|
Outstanding - June 30, 2014 |
652,350 | 185,100 |
$ |
6.71 |
$ |
9.90 | 435,350 | 185,100 |
$ |
6.95 |
$ |
9.90 |
|
Granted |
-- |
-- |
$ |
-- |
$ |
-- |
-- |
-- |
|
-- |
|
-- |
|
Exercised |
(63,600) |
-- |
$ |
-- |
$ |
-- |
-- |
-- |
|
-- |
|
-- |
|
Forfeited |
(64,000) |
-- |
$ |
-- |
$ |
-- |
-- |
-- |
|
-- |
|
-- |
|
Outstanding - September 30, 2014 |
524,750 | 185,100 |
$ |
6.60 |
$ |
9.90 | 347,250 | 185,100 |
$ |
6.78 |
$ |
9.90 |
The weighted average remaining contractual life of all options outstanding, vested, and expected to vest at September 30, 2014 and December 31, 2013 was approximately 3.51 and 4.70 years, respectively. The weighted average remaining contractual life of the exercisable options outstanding at September 30, 2014 and December 31, 2013 was approximately 3.45 and 3.63 years, respectively.
10
Note 3 – Business Segments
We organize our operations into two reportable business segments within the meaning of FASB ASC 280-10 - Segment Reporting. Our reportable segments are (1) cinema exhibition and (2) real estate. The cinema exhibition segment is engaged in the development, ownership, and operation of multiplex cinemas. The real estate segment is engaged in the development, ownership, and operation of commercial properties. Incident to our real estate operations, we have acquired, and continue to hold, raw land in urban and suburban centers in Australia, New Zealand, and the United States.
The tables below summarize the results of operations for each of our principal business segments for the three months ended September 30, 2014 and 2013, respectively. Operating expenses include costs associated with the day-to-day operations of the cinemas and the management of rental properties, including our live theater assets (dollars in thousands):
|
Three Months Ended September 30, 2014 |
Cinema Exhibition |
Real Estate |
Intersegment Eliminations |
Total |
||||
|
Revenue |
$ |
60,947 |
$ |
6,035 |
$ |
(1,951) |
$ |
65,031 |
|
Operating expense |
|
50,243 |
|
2,289 |
|
(1,951) |
|
50,581 |
|
Depreciation and amortization |
|
2,765 |
|
964 |
|
-- |
|
3,729 |
|
General and administrative expense |
|
803 |
|
436 |
|
-- |
|
1,239 |
|
Segment operating income |
$ |
7,136 |
$ |
2,346 |
$ |
-- |
$ |
9,482 |
|
Three Months Ended September 30, 2013 |
Cinema Exhibition |
Real Estate |
Intersegment Eliminations |
Total |
||||
|
Revenue |
$ |
61,228 |
$ |
6,157 |
$ |
(1,913) |
$ |
65,472 |
|
Operating expense |
|
50,655 |
|
2,716 |
|
(1,913) |
|
51,458 |
|
Depreciation and amortization |
|
2,540 |
|
951 |
|
-- |
|
3,491 |
|
General and administrative expense |
|
891 |
|
185 |
|
-- |
|
1,076 |
|
Segment operating income |
$ |
7,142 |
$ |
2,305 |
$ |
-- |
$ |
9,447 |
|
Reconciliation to net income attributable to Reading International, Inc. shareholders: |
|
|
|
|
2014 Quarter |
2013 Quarter |
||
|
Total segment operating income |
|
|
|
|
$ |
9,482 |
$ |
9,447 |
|
Non-segment: |
|
|
|
|
|
|
|
|
|
Depreciation and amortization expense |
|
|
|
|
|
92 |
|
111 |
|
General and administrative expense |
|
|
|
|
|
3,217 |
|
3,510 |
|
Operating income |
|
|
|
|
|
6,173 |
|
5,826 |
|
Interest expense, net |
|
|
|
|
|
(1,411) |
|
(2,814) |
|
Other income (expense) |
|
|
|
|
|
242 |
|
(55) |
|
Gain on sale of assets |
|
|
|
|
|
25 |
|
-- |
|
Income tax expense |
|
|
|
|
|
(1,312) |
|
(751) |
|
Equity earnings of unconsolidated joint ventures and entities |
|
|
|
|
|
222 |
|
225 |
|
Net income |
|
|
|
|
$ |
3,939 |
$ |
2,431 |
|
Net (income) attributable to noncontrolling interests |
|
|
|
|
|
-- |
|
(38) |
|
Net income attributable to Reading International, Inc. common shareholders |
|
|
|
|
$ |
3,939 |
$ |
2,393 |
11
The tables below summarize the results of operations for each of our principal business segments for the nine months ended September 30, 2014 and 2013, respectively. Operating expenses include costs associated with the day-to-day operations of the cinemas and the management of rental properties, including our live theater assets (dollars in thousands):
|
Nine Months Ended September 30, 2014 |
Cinema Exhibition |
Real Estate |
Intersegment Eliminations |
Total |
||||
|
Revenue |
$ |
180,225 |
$ |
18,396 |
$ |
(5,615) |
$ |
193,006 |
|
Operating expense |
|
147,631 |
|
7,523 |
|
(5,615) |
|
149,539 |
|
Depreciation and amortization |
|
8,378 |
|
2,839 |
|
-- |
|
11,217 |
|
General and administrative expense |
|
2,903 |
|
870 |
|
-- |
|
3,773 |
|
Segment operating income |
$ |
21,313 |
$ |
7,164 |
$ |
-- |
$ |
28,477 |
|
Nine Months Ended September 30, 2013 |
Cinema Exhibition |
Real Estate |
Intersegment Eliminations |
Total |
||||
|
Revenue |
$ |
180,657 |
$ |
19,764 |
$ |
(5,740) |
$ |
194,681 |
|
Operating expense |
|
151,612 |
|
8,115 |
|
(5,740) |
|
153,987 |
|
Depreciation and amortization |
|
7,824 |
|
3,086 |
|
-- |
|
10,910 |
|
General and administrative expense |
|
2,463 |
|
519 |
|
-- |
|
2,982 |
|
Segment operating income |
$ |
18,758 |
$ |
8,044 |
$ |
-- |
$ |
26,802 |
|
Reconciliation to net income attributable |
|
|
|
|
2014 Nine |
2013 Nine |
||
|
to Reading International, Inc. shareholders: |
|
|
|
|
Months |
Months |
||
|
Total segment operating income |
|
|
|
|
$ |
28,477 |
$ |
26,802 |
|
Non-segment: |
|
|
|
|
|
|
|
|
|
Depreciation and amortization expense |
|
|
|
|
|
273 |
|
333 |
|
General and administrative expense |
|
|
|
|
|
10,950 |
|
10,341 |
|
Operating income |
|
|
|
|
|
17,254 |
|
16,128 |
|
Interest expense, net |
|
|
|
|
|
(6,537) |
|
(8,124) |
|
Other income |
|
|
|
|
|
1,630 |
|
72 |
|
Gain (loss) on sale of assets |
|
|
|
|
|
25 |
|
(7) |
|
Income tax expense |
|
|
|
|
|
(4,747) |
|
(3,140) |
|
Equity earnings of unconsolidated joint ventures and entities |
|
|
|
|
|
833 |
|
1,005 |
|
Net income |
|
|
|
|
$ |
8,458 |
$ |
5,934 |
|
Net (income) loss attributable to noncontrolling interests |
|
|
|
|
|
23 |
|
(74) |
|
Net income attributable to Reading International, Inc. common shareholders |
|
|
|
|
$ |
8,481 |
$ |
5,860 |
Note 4 – Operations in Foreign Currency
We have significant assets in Australia and New Zealand. To the extent possible, we conduct our Australian and New Zealand operations on a self-funding basis. The carrying value of our Australian and New Zealand assets and liabilities fluctuate due to changes in the exchange rates between the U.S. dollar and the functional currency of Australia (Australian dollar) and New Zealand (New Zealand dollar). We have no derivative financial instruments to hedge against the risk of foreign currency exposure.
Presented in the table below are the currency exchange rates for Australia and New Zealand as of September 30, 2014 , December 31, 2013 and September 30, 2013
|
|
U.S. Dollar |
||
|
|
September 30, |
December 31, |
September 30, |
|
|
2014 |
2013 |
2013 |
|
Australian Dollar |
0.8737 |
0.8929 |
0.9342 |
|
New Zealand Dollar |
0.7788 |
0.8229 |
0.8323 |
12
Note 5 – Earnings (Loss) Per Share
Basic earnings (loss) per share is computed by dividing the net income (loss) attributable to Reading International, Inc. common shareholders by the weighted average number of common shares outstanding during the period. Diluted earnings (loss) per share is computed by dividing the net income (loss) attributable to Reading International, Inc. common shareholders by the weighted average number of common shares outstanding during the period after giving effect to all potentially dilutive common shares that would have been outstanding if the dilutive common shares had been issued. Stock options and non-vested stock awards give rise to potentially dilutive common shares. In accordance with FASB ASC 260-10 - Earnings Per Share, these shares are included in the diluted earnings per share calculation under the treasury stock method. The following is a calculation of earnings (loss) per share (dollars in thousands, except share data):
|
Three Months Ended |
Nine Months Ended |
|||||||
|
September 30, |
September 30, |
|||||||
|
2014 |
2013 |
2014 |
2013 |
|||||
|
Net income from continuing operations |
$ |
3,939 |
$ |
2,393 |
$ |
8,481 |
$ |
5,860 |
|
Net income attributable to Reading International, Inc. common shareholders |
|
3,939 |
|
2,393 |
|
8,481 |
|
5,860 |
|
Basic earnings per share attributable to Reading International, Inc. shareholders |
$ |
0.17 |
$ |
0.10 |
$ |
0.36 |
$ |
0.25 |
|
Diluted earnings per share attributable to Reading International, Inc. shareholders |
$ |
0.17 |
$ |
0.10 |
$ |
0.36 |
$ |
0.25 |
|
Weighted average shares of common stock – basic |
|
23,380,728 |
|
23,383,200 |
|
23,457,050 |
|
23,333,352 |
|
Weighted average shares of common stock – diluted |
|
23,678,223 |
|
23,517,191 |
|
23,754,545 |
|
23,467,343 |
For the three and nine months ended September 30, 2014, the weighted average common stock – diluted included 297,495 of common stock compensation and in-the-money incremental stock options, and for the three and nine months ended September 30, 2013, the weighted average common stock – diluted included 133,992 of common stock compensation and in-the-money incremental stock options. In addition, 572,998 of out-of-the-money stock options were excluded from the computation of diluted earnings (loss) per share for the three and nine months ended September 30, 2014, and 729,865 of out-of-the-money stock options were excluded from the computation of diluted earnings (loss) per share for the three and nine months ended September 30, 2013.
Note 6 – Property and Equipment
Operating Property, net
As of September 30, 2014 and December 31, 2013, property associated with our operating activities is summarized as follows (dollars in thousands):
|
|
|
September 30, |
|
December 31, |
|
Operating Property |
|
2014 |
|
2013 |
|
Land |
$ |
64,485 |
$ |
65,578 |
|
Building and improvements |
|
122,409 |
|
123,061 |
|
Leasehold interests |
|
46,922 |
|
46,330 |
|
Fixtures and equipment |
|
108,090 |
|
106,099 |
|
Total cost |
|
341,906 |
|
341,068 |
|
Less: accumulated depreciation |
|
(155,981) |
|
(149,408) |
|
Operating property, net |
$ |
185,925 |
$ |
191,660 |
Depreciation expense for property and equipment was $3.7 million and $10.7 million for the three and nine months ended September 30, 2014, respectively, and $3.2 million and $10.4 million for the three and nine months ended September 30, 2013, respectively.
Land Held for Sale – Moonee Ponds
On October 15, 2013, we entered into a definitive purchase and sale agreement to sell this property for a sale price of $21.3 million (AUS$23.0 million) payable in full upon closing of that transaction on April 16, 2015. The property has a book value of $10.8 million (AUS $12.4 million), and while the transaction was treated as a current sale for tax purposes, it does not qualify as a sale under US GAAP until the close of the transaction on April 16, 2015. As the scheduled closing date is less than one year away, this asset has been listed as a current asset.
13
Land Held for Sale – Burwood
On May 12, 2014, we entered into a contract to sell our undeveloped 50.6 acre parcel in Burwood, Victoria, Australia, to an affiliate of Australand Holdings Limited for a purchase price of $54.6 million (AUS$65.0 million).
Reading received $5.9 million (AUS$6.5 million) on the May 23, 2014 closing. The balance of the purchase price is due on December 31, 2017. The agreement provides for mandatory pre-payments in the event that any of the land is sold by the buyer, any such prepayment being in an amount equal to the greater of (a) 90% of the net sale price or (b) the balance of the purchase price multiplied by a fraction the numerator of which is the square footage of property being sold by the buyer and the denominator of which is the original square footage of the property being sold to the buyer. The agreement does not provide for the payment of interest on the balance owed.
Our book basis in the property is $45.5 million (AUS$52.1 million) and while the transaction was treated as a current sale for tax purposes, it does not qualify as a sale under US GAAP until the receipt of the payment of the balance of the purchase price due on December 31, 2017 (or earlier depending upon whether any prepayment obligation is triggered). The asset has been listed as a long term asset.
Investment and Development Property
As of September 30, 2014 and December 31, 2013, our investment and development property is summarized as follows (dollars in thousands):
|
|
|
September 30, |
|
December 31, |
|
Investment and Development Property |
|
2014 |
|
2013 |
|
Land |
$ |
22,748 |
$ |
59,550 |
|
Construction-in-progress (including capitalized interest) |
|
3,455 |
|
14,680 |
|
Investment and development property |
$ |
26,203 |
$ |
74,230 |
The decrease of $48.0 million is substantially due to the reclassification of the Burwood property costs from the Investment and Development property category to Land Held for Sale category under non-current assets on the balance sheet.
Note 7 – Investments in Unconsolidated Joint Ventures and Entities
Our investments in unconsolidated joint ventures and entities are accounted for under the equity method of accounting except for Rialto Distribution, which is accounted for as a cost method investment, and, as of September 30, 2014 and December 31, 2013, included the following (dollars in thousands):
|
|
|
|
September 30, |
|
December 31, |
|
|
Interest |
|
2014 |
|
2013 |
|
Rialto Distribution |
33.3% |
$ |
-- |
$ |
-- |
|
Rialto Cinemas |
50.0% |
|
1,679 |
|
1,571 |
|
205-209 East 57th Street Associates, LLC |
25.0% |
|
-- |
|
-- |
|
Mt. Gravatt |
33.3% |
|
4,863 |
|
5,164 |
|
Total investments |
|
$ |
6,542 |
$ |
6,735 |
For the three and nine months ended September 30, 2014 and 2013, we recorded our share of equity earnings from our investments in unconsolidated joint ventures and entities as follows (dollars in thousands):
|
|
|
Three Months Ended |
|
Nine Months Ended |
||||
|
|
|
September 30, |
|
September 30, |
||||
|
|
|
2014 |
|
2013 |
|
2014 |
|
2013 |
|
Rialto Distribution |
$ |
-- |
$ |
97 |
$ |
13 |
$ |
137 |
|
Rialto Cinemas |
|
69 |
|
3 |
|
424 |
|
71 |
|
205-209 East 57th Street Associates, LLC |
|
-- |
|
-- |
|
-- |
|
(1) |
|
Mt. Gravatt |
|
153 |
|
125 |
|
396 |
|
798 |
|
Total equity earnings |
$ |
222 |
$ |
225 |
$ |
833 |
$ |
1,005 |
14
Note 8 – Goodwill and Intangible Assets
In accordance with FASB ASC 350-20-35, Goodwill - Subsequent Measurement and Impairment, we perform an annual impairment review in the fourth quarter of our goodwill and other intangible assets on a reporting unit basis, or earlier if changes in circumstances indicate an asset may be impaired. No such circumstances existed during the 2014 Quarter and 2014 Nine Month period. As of September 30, 2014 and December 31, 2013, we had goodwill consisting of the following (dollars in thousands):
|
Cinema |
Real Estate |
Total |
||||
|
Balance as of December 31, 2013 |
$ |
16,935 |
$ |
5,224 |
$ |
22,159 |
|
Foreign currency translation adjustment |
|
(621) |
|
-- |
|
(621) |
|
Balance at September 30, 2014 |
$ |
16,314 |
$ |
5,224 |
$ |
21,538 |
We have intangible assets other than goodwill that are subject to amortization, which we amortize over various periods. We amortize our beneficial leases over the lease period, the longest of which is 30 years; our trade name using an accelerated amortization method over its estimated useful life of 45 years; and our other intangible assets over 10 years. For the three and nine months ended September 30, 2014, the amortization expense of intangibles totaled $345,000 and $1.4 million, respectively, and, for the three and nine months ended September 30, 2013, the amortization expense of intangibles totaled $620,000 and $1.7 million, respectively. The accumulated amortization of intangibles includes $633,000 and $777,000 of the amortization of acquired leases, which are recorded in operating expense for the nine months ended September 30, 2014 and 2013, respectively.
Intangible assets subject to amortization consist of the following (dollars in thousands):
|
As of September 30, 2014 |
|
Beneficial Leases |
|
Trade name |
|
Other Intangible Assets |
|
Total |
|
Gross carrying amount |
$ |
24,171 |
$ |
7,254 |
$ |
453 |
$ |
31,878 |
|
Less: Accumulated amortization |
|
15,641 |
|
3,826 |
|
453 |
|
19,920 |
|
Total, net |
$ |
8,530 |
$ |
3,428 |
$ |
-- |
$ |
11,958 |
|
|
|
|
|
|
|
|
|
|
|
As of December 31, 2013 |
|
Beneficial Leases |
|
Trade name |
|
Other Intangible Assets |
|
Total |
|
Gross carrying amount |
$ |
24,223 |
$ |
7,254 |
$ |
455 |
$ |
31,932 |
|
Less: Accumulated amortization |
|
14,520 |
|
3,517 |
|
455 |
|
18,492 |
|
Total, net |
$ |
9,703 |
$ |
3,737 |
$ |
-- |
$ |
13,440 |
15
Note 9 – Prepaid and Other Assets
Prepaid and other assets are summarized as follows (dollars in thousands):
|
|
|
September 30, |
|
December 31, |
|
|
|
2014 |
|
2013 |
|
Prepaid and other current assets |
|
|
|
|
|
Prepaid expenses |
$ |
1,584 |
$ |
1,079 |
|
Prepaid taxes |
|
978 |
|
623 |
|
Prepaid rent |
|
1,023 |
|
1,210 |
|
Deposits |
|
369 |
|
368 |
|
Other |
|
3 |
|
3 |
|
Total prepaid and other current assets |
$ |
3,957 |
$ |
3,283 |
|
|
|
|
|
|
|
Other non-current assets |
|
|
|
|
|
Other non-cinema and non-rental real estate assets |
$ |
1,134 |
$ |
1,134 |
|
Long-term deposits |
|
114 |
|
144 |
|
Deferred financing costs, net |
|
2,074 |
|
1,833 |
|
Interest rate cap at fair value |
|
40 |
|
75 |
|
Tenant inducement asset |
|
471 |
|
512 |
|
Straight-line rent asset |
|
2,276 |
|
2,310 |
|
Other |
|
-- |
|
2 |
|
Total non-current assets |
$ |
6,109 |
$ |
6,010 |
Note 10 – Income Tax
The provision for income taxes is different from the amount computed by applying U.S. statutory rates to consolidated losses before taxes. The significant reason for these differences is as follows (dollars in thousands):
|
|
|
Three Months Ended |
|
Nine Months Ended |
||||
|
|
|
September 30, |
|
September 30, |
||||
|
|
|
2014 |
|
2013 |
|
2014 |
|
2013 |
|
Expected tax provision |
$ |
1,838 |
$ |
1,090 |
$ |
4,630 |
$ |
3,139 |
|
Increase (decrease) in tax expense resulting from: |
|
|
|
|
|
|
|
|
|
Change in valuation allowance, other |
|
(1,611) |
|
(1,099) |
|
(4,019) |
|
(3,033) |
|
Foreign tax provision |
|
770 |
|
88 |
|
3,450 |
|
1,129 |
|
Foreign withholding tax provision |
|
146 |
|
262 |
|
435 |
|
798 |
|
Tax effect of foreign tax rates on current income |
|
(227) |
|
9 |
|
(611) |
|
(106) |
|
State and local tax provision |
|
2 |
|
150 |
|
257 |
|
387 |
|
Tax/audit litigation settlement |
|
394 |
|
251 |
|
605 |
|
826 |
|
Actual tax provision |
$ |
1,312 |
$ |
751 |
$ |
4,747 |
$ |
3,140 |
Pursuant to FASB ASC 740-10 – Income Taxes (“FASB ASC 740-10”), a provision should be made for the tax effect of earnings of foreign subsidiaries that are not permanently invested outside the United States. Our intent is that earnings of our foreign subsidiaries are not permanently invested outside the United States. Current earnings were available for distribution in the Reading Australia and Reading New Zealand consolidated group of subsidiaries as of September 30, 2014. We have provided $453,000 in withholding tax expense in relation to those earnings. We believe the U.S. tax impact of a dividend from our Australian and New Zealand subsidiaries, net of loss carry forward and potential foreign tax credits, would not have a material effect on the tax provision as of September 30, 2014.
Deferred income taxes reflect the “temporary differences” between the financial statement carrying amounts of assets and liabilities for financial reporting purposes and the amounts used for income tax purposes, adjusted by the relevant tax rate. In accordance with FASB ASC 740-10, we record net deferred tax assets to the extent we believe these assets will more likely than not be realized. In making such determination, we consider all available positive and negative evidence, including scheduled reversals of deferred tax assets and liabilities, projected future taxable income, tax planning strategies, and recent financial performance. FASB ASC 740-10 presumes that a valuation allowance is required when there is substantial negative evidence about realization of deferred tax assets, such as a pattern of losses in recent years, coupled with facts that suggest such losses may continue.
16
We have accrued $15.6 million in total tax liabilities as of September 30, 2014, of which $ 3.8 million has been classified as taxes payable-current and $11.8 million have been classified as taxes payable – long-term. As part of current tax liabilities, we have accrued $3.5 million in connection with the settlement of the IRS claims against our subsidiary Craig Corporation relating to its 1996 tax year. This is an obligation of Craig Corporation, and not of Reading International, Inc. We believe that the $15.6 million represents an adequate provision for our income and other tax exposures, including income tax contingencies related to foreign withholding taxes.
In accordance with FASB ASC 740-10-25 – Income Taxes - Uncertain Tax Positions (“FASB ASC 740-10-25”), we record interest and penalties related to income tax matters as part of income tax expense.
The following table is a summary of the activity related to unrecognized tax benefits, excluding interest and penalties, for the periods ending September 30, 2014 December 31, 2013, and December 31, 2012 (dollars in thousands):
|
Nine Months Ended September 30, 2014 |
Year Ended December 31, 2013 |
Year Ended December 31, 2012 |
||||
|
Unrecognized tax benefits – gross beginning balance |
$ |
2,160 |
$ |
2,171 |
$ |
1,974 |
|
Gross increases – prior period tax provisions |
|
171 |
|
(11) |
|
197 |
|
Unrecognized tax benefits – gross ending balance |
$ |
2,331 |
$ |
2,160 |
$ |
2,171 |
For the nine months ended September 30, 2014, we recorded a change of approximately $171,000 to our gross unrecognized tax benefits. The net tax balance is approximately $2.3 million, of which $1.3 million would impact the effective rate if recognized.
It is difficult to predict the timing and resolution of uncertain tax positions. Based upon the Company’s assessment of many factors, including past experience and judgments about future events, we estimate that within the next 12 months the reserve for uncertain tax positions will increase within a range of $500,000 to $1.5 million. The reasons for such changes include but are not limited to tax positions expected to be taken during the next twelve months, reevaluation of current uncertain tax positions, expiring statutes of limitations, and interest related to the “Tax Audit/Litigation” settlement which occurred January 6, 2011.
Our company and subsidiaries are subject to U.S. federal income tax, income tax in U.S. states and possessions, and income tax in Australia and New Zealand. Generally, changes to our U.S. federal and most state income tax returns for the calendar year 2009 and earlier are barred by statutes of limitations. Our income tax returns of Australia filed since inception in 1995 are generally open for examination because of operating losses. The income tax returns filed in New Zealand for calendar year 2009 and afterward generally remain open for examination as of September 30, 2014.
Note 11 – Notes Payable
Notes payable are summarized as follows (dollars in thousands):
|
Name of Note Payable or Security |
2014 Interest Rates |
2013 Interest Rates |
Maturity Date |
|
2014 Balance |
|
2013 Balance |
|
Trust Preferred Securities |
4.23% |
4.24% |
April 30, 2027 |
$ |
27,913 |
$ |
27,914 |
|
Australian NAB Corporate Term Loan |
5.07% |
5.09% |
June 30, 2019 |
|
51,111 |
|
56,699 |
|
Australian Shopping Center Loans |
-- |
-- |
November 1, 2014 |
|
45 |
|
89 |
|
New Zealand Corporate Credit Facility |
5.50% |
4.80% |
March 31, 2015 |
|
21,806 |
|
23,041 |
|
US Bank of America Revolver |
2.65% |
2.67% |
October 31, 2017 |
|
29,750 |
|
31,500 |
|
US Cinema 1, 2, 3 Term Loan |
3.65% |
5.21% |
July 1, 2016 |
|
15,000 |
|
15,000 |
|
US Minetta & Orpheum Theatres Loan |
2.90% |
2.91% |
June 1, 2018 |
|
7,500 |
|
7,500 |
|
US Union Square Theatre Term Loan |
5.92% |
5.92% |
May 1, 2015 |
|
6,531 |
|
6,717 |
|
Total |
|
|
|
$ |
159,656 |
$ |
168,460 |
Derivative Instruments
As indicated in Note 17 – Derivative Instruments, for both our Australian NAB Corporate Credit Facility (“NAB Loan”) and our U.S. Bank of America Revolver (“BofA Revolver”), we have entered into interest rate swap agreements for all or part of these facilities. The loan agreement together with the swap results in us paying a total fixed interest rate of 7.85% (1.15% swap contract rate plus a 2.35% margin under the loan) for our NAB Loan and a total fixed interest rate of 5.20% (1.20% swap contract rate plus a 4.00% margin under the loan) for our BofA Revolver instead of the above indicated 5.07% and 2.65%, respectively, which are the obligatorily disclosed loan rates. Additionally, on June 3, 2013, we entered into a new swap agreement for our BofA Revolver that came into effect on December 31, 2013 (see Note 17 – Derivative Instruments).
17
Notes Payable Refinancing and Payoff
Australian NAB Corporate Term Loan and Revolver
On June 27, 2014, we refinanced our existing three-tiered credit facility with NAB. It is comprised of (1) the Bank Bill Discount Facility with a facility limit of AUS$61.2 million, an interest rate of 2.35% above the BBSY, and amortization at AUS$2.0 million per year; (2) the Bill Discount Facility – Revolving with a facility limit of AUS$10.0 million and an interest rate of 1.50% above the BBSY on any undrawn portion. Currently we have not drawn any of this revolver; and (3) the Bank Guarantee Facility with a facility limit of AUS$5.0 million. All three have an expiry date of June 30, 2019. The modification of this particular term loan was not considered to be substantial as defined by ASC 740.
New Zealand Corporate Credit Facility
The New Zealand bank loan comes due for repayment on March 31, 2015. This loan has been classified as a short term liability on the consolidated balance sheet as of June 30, 2014.
US Bank of America Revolver
On March 25, 2013, Bank of America extended the borrowing limit on our BofA Revolver from $30.0 million to $35.0 million and we borrowed $5.0 million on this revolver. On April 1, 2013, we used $2.3 million of the revolver proceeds to partially repay our US Liberty Theaters Term Loan.
US Bank of America Line of Credit
On June 28, 2013, we repaid the entire $2.0 million outstanding balance on our $5.0 million Bank of America line of credit.
US Cinema 1, 2 & 3 Term Loan
On June 26, 2014, our controlled subsidiary Sutton Hill Properties, LLC, entered into an agreement with Santander Bank, N.A, refinancing the current loan on the property and providing an additional $6.0 million for the acquisition of rights to add additional density to any redevelopment of the property (“air rights”).We replaced an existing term loan of $15.0 million that was scheduled to mature on the following day. The new loan has a 2-year term, payable interest only, commencing June 27, 2014, all principal and unpaid interest due and payable on maturity. The loan is collateralized by our Cinemas 1,2,3 property (including any air rights that we may acquire). The loan has an interest rate of 3.50% over the 30-day Libor. The modification of this particular term loan was not considered to be substantial as defined by ASC 740.
US Minetta and Orpheum Theatres Loan
On May 29, 2013, we refinanced our Liberty Theaters loan with a $7.5 million loan securitized by our Minetta and Orpheum theatres, having a maturity date of June 1, 2018, bearing an interest rate of LIBOR plus a 2.75% margin and having a LIBOR rate cap of 4.00% (plus the 2.75% margin). See Note 16 – Derivative Instruments.
US Union Square Term Loan
The US Union Square Term loan comes due for repayment on May 1, 2015. This loan has been classified as a short-term liability on the consolidated balance sheet as of June 30, 2014.
US Sutton Hill Capital Note – Related Party
On June 18, 2013, we repaid our 8.25% note to Sutton Hill Capital (“SHC”) for $9.0 million. As the debtor on this note was Sutton Hill Properties, LLC, in which we have a 75% interest, the note was, in effect, paid $6.75 million by us and $2.25 million by our co-investor.
18
Note 12 – Other Liabilities
Other liabilities are summarized as follows (dollars in thousands):
|
|
|
September 30, |
|
December 31, |
|
|
|
2014 |
|
2013 |
|
Current liabilities |
|
|
|
|
|
Lease liability |
$ |
5,900 |
$ |
5,900 |
|
Security deposit payable |
|
202 |
|
246 |
|
Other |
|
-- |
|
9 |
|
Other current liabilities |
$ |
6,102 |
$ |
6,155 |
|
Other liabilities |
|
|
|
|
|
Foreign withholding taxes |
$ |
6,949 |
$ |
6,748 |
|
Straight-line rent liability |
|
9,274 |
|
9,259 |
|
Environmental reserve |
|
1,656 |
|
1,656 |
|
Accrued pension |
|
7,550 |
|
8,527 |
|
Interest rate swap |
|
2,260 |
|
3,288 |
|
Acquired leases |
|
1,376 |
|
1,797 |
|
Other payable |
|
751 |
|
875 |
|
Other |
|
2,310 |
|
599 |
|
Deferred Revenue - Real Estate |
|
5,399 |
|
-- |
|
Other liabilities |
$ |
37,525 |
$ |
32,749 |
Included in our other liabilities are accrued pension costs of $7.5 million at September 30, 2014. The benefits of our pension plans are fully vested, and, as such, no service costs were recognized for the three or nine months ended September 30, 2014 and 2013. Our pension plans are unfunded; therefore, the actuarial assumptions do not include an estimate for any expected return on the plan assets. For the three and nine months ended September 30, 2014, we recognized $52,000 and $209,000, respectively, of interest cost and $215,000 and $686,000, respectively, of amortized prior service cost. For the three and nine months ended September 30, 2013, we recognized $66,000 and $231,000, respectively, of interest cost and $166,000 and $330,000, respectively, of amortized prior service cost.
On August 29, 2014 the Supplemental Executive Retirement Plan “SERP” that was effective since March 1, 2007, was ended and replaced with a new Pension annuity. As a result of the termination of the SERP program the accrued pension liability of $7.6 million was reversed and replaced with a new pension annuity liability of $7.5 million. The valuation of the liability is based on the present value of $10.3 million discounted at a 4.25% over a 15- year term. Monthly payments of $56,944 will be made to the estate of Jim Cotter Sr. commencing October 1, 2014. The discounted value of $2.8 million (which is the difference between the estimated payout of $10.3 million and the present value of $7.5 million) will be amortized and expensed over the 15-year term. In addition, the accumulated prior service costs of $3.1 million recorded as part of other comprehensive income will also be amortized over the 15-
year term.
Note 13 – Commitments and Contingencies
Unconsolidated Debt
Total debt of unconsolidated joint ventures and entities was $623,000 and $634,000 as of September 30, 2014 and December 31, 2013. Our share of unconsolidated debt, based on our ownership percentage, was $208,000 and $211,000 as of September 30, 2014 and December 31, 201, respectively. This debt is guaranteed by one of our subsidiaries to the extent of our ownership percentage.
Note 14 – Noncontrolling interests
Noncontrolling interests are composed of the following enterprises:
|
· |
Australia Country Cinemas Pty Ltd. (“ACC”) 25% noncontrolling interest owned by Panorama Cinemas for the 21st Century Pty Ltd.; |
|
· |
Shadow View Land and Farming, LLC 50% noncontrolling membership interest owned by the estate of Mr. James J. Cotter, Sr.; and |
|
· |
Sutton Hill Properties, LLC (“SHP”) 25% noncontrolling interest owned by Sutton Hill Capital, LLC. |
19
The components of noncontrolling interests are as follows (dollars in thousands):
|
September 30, |
December 31, |
|||
|
2014 |
2013 |
|||
|
Australian Country Cinemas |
$ |
545 |
$ |
532 |
|
Shadow View Land and Farming LLC |
|
2,015 |
|
1,862 |
|
Sutton Hill Properties |
|
2,236 |
|
2,213 |
|
Noncontrolling interests in consolidated subsidiaries |
$ |
4,796 |
$ |
4,607 |
The components of income attributable to noncontrolling interests are as follows (dollars in thousands):
|
Three Months Ended |
Nine Months Ended |
|||||||
|
September 30, |
September 30, |
|||||||
|
2014 |
2013 |
2014 |
2013 |
|||||
|
AFC LLC |
$ |
-- |
$ |
-- |
$ |
-- |
$ |
173 |
|
Australian Country Cinemas |
|
56 |
|
49 |
|
128 |
|
97 |
|
Shadow View Land and Farming LLC |
|
(22) |
|
(24) |
|
(49) |
|
(38) |
|
Sutton Hill Properties |
|
(34) |
|
13 |
|
(102) |
|
(158) |
|
Net income (loss) attributable to noncontrolling interest |
$ |
0 |
$ |
38 |
$ |
(23) |
$ |
74 |
Summary of Controlling and Noncontrolling Stockholders’ Equity
A summary of the changes in controlling and noncontrolling stockholders’ equity is as follows (dollars in thousands):
|
Controlling Stockholders’ Equity |
Noncontrolling Stockholders’ Equity |
Total Stockholders’ Equity |
||||
|
Equity at – January 1, 2014 |
$ |
117,140 |
$ |
4,607 |
$ |
121,747 |
|
Net Income (loss) |
|
8,481 |
|
(23) |
|
8,458 |
|
Increase in additional paid in capital |
|
1,062 |
|
-- |
|
1,062 |
|
Treasury stock purchased |
|
(2,342) |
|
-- |
|
(2,342) |
|
Contributions from noncontrolling stockholders - SHP |
|
-- |
|
327 |
|
327 |
|
Distributions to noncontrolling stockholders |
|
-- |
|
(101) |
|
(101) |
|
Accumulated other comprehensive income |
|
(3,957) |
|
(14) |
|
(3,971) |
|
Equity at – September 30, 2014 |
$ |
120,385 |
$ |
4,796 |
$ |
125,181 |
|
Controlling Stockholders’ Equity |
Noncontrolling Stockholders’ Equity |
Total Stockholders’ Equity |
||||
|
Equity at – January 1, 2013 |
$ |
126,856 |
$ |
4,098 |
$ |
130,954 |
|
Net Income |
|
5,860 |
|
74 |
|
5,934 |
|
Increase in additional paid in capital |
|
297 |
|
76 |
|
373 |
|
Contributions from noncontrolling stockholders - SHP |
|
-- |
|
2,513 |
|
2,513 |
|
Distributions to noncontrolling stockholders |
|
-- |
|
(2,103) |
|
(2,103) |
|
Accumulated other comprehensive income |
|
(12,488) |
|
(57) |
|
(12,545) |
|
Equity at – September 30, 2013 |
$ |
120,525 |
$ |
4,601 |
$ |
125,126 |
Note 15 – Common Stock
Common Stock Issuance
During the nine months ended September 30, 2014 and 2013, we issued 125,209 and 217,890, respectively, of Class A Nonvoting shares to an executive employee associated with his prior years’ stock grants.
20
Common Stock Buyback
On May 16, 2014, the Company's board of directors authorized management, at its discretion, to spend from time to time up to an aggregate of $10.0 million to acquire shares of Reading’s Common Stock. This approved stock repurchase plan supercedes and effectively cancels the program that was approved by the board on May 14, 2004, which allowed management to purchase up to 350,000 shares of Reading’s Common Stock.
The repurchase program allows Reading to repurchase its shares from time to time in accordance with the requirements of the Securities and Exchange Commission on the open market, in block trades and in privately negotiated transactions, depending on market conditions and other factors. All purchases are subject to the availability of shares at prices that are acceptable to Reading, and accordingly, no assurances can be given as to the timing or number of shares that may ultimately be acquired pursuant to this authorization.
Under this approved buyback program, the company has repurchased $2.3 million worth of common stock. This leaves $7.7 million available for repurchase as of September 30, 2014.
Note 16 – Derivative Instruments
As more fully described in our 2013 Annual Report, we are exposed to interest rate changes from our outstanding floating rate borrowings. We manage our fixed to floating rate debt mix to mitigate the impact of adverse changes in interest rates on earnings and cash flows and on the market value of our borrowings. From time to time, we may enter into interest rate hedging contracts, which effectively convert a portion of our variable rate debt to a fixed rate over the term of interest rate swaps or fix the maximum variable rate with an interest rate cap. For an explanation of the impact of swaps on our interest paid for the periods presented, see Note 11 – Notes Payable.
As part of our US Minetta and Orpheum Theatres Loan, we entered into a five year LIBOR rate cap of 4.00% with a loan margin of 2.75%. See Note 11 – Notes Payable. Additionally, on June 3, 2013, we entered into a new swap agreement for our BofA Revolver that will take effect on December 31, 2014 with a pay fixed rate of 1.15% and an expiration date of October 31, 2017.
The following table sets forth the terms of our interest rate swap and cap derivative instruments at September 30, 2014:
|
Type of Instrument |
|
Notional Amount |
|
Pay Fixed Rate |
|
Receive Variable Rate |
|
Maturity Date |
|
Interest rate swap |
$ |
62,750,000 |
|
5.500% |
|
2.715% |
|
June 30, 2016 |
|
Interest rate swap |
$ |
27,913,000 |
|
1.200% |
|
0.233% |
|
October 31, 2017 |
|
Interest rate swap |
$ |
31,500,000 |
|
1.150% |
|
0.150% |
|
October 31, 2017 |
|
Interest rate cap |
$ |
7,500,000 |
|
4.000% |
|
0.000% |
|
June 1, 2018 |
In accordance with FASB ASC 815-10-35, Subsequent Valuation of Derivative Instruments and Hedging Instruments (“FASB ASC 815-10-35”), we marked our interest rate swap and cap instruments to market on the consolidated balance sheet resulting in a decrease in interest expense of $958,000 and decrease of $1.0 million during the three and nine months ended September 30, 2014, respectively, and a decrease of $209,000 and $1.6 million in interest expense during the three and nine months ended September 30, 2013, respectively. At September 30, 2014 and December 31, 2013, we recorded as other long-term liabilities the fair market value of our interest rate swaps and cap of $2.3 million and $3.3 million, respectively. In accordance with FASB ASC 815-10-35, we have not designated any of our current interest rate swap or cap positions as financial reporting hedges.
Note 17 – Fair Value of Financial Instruments
FASB ASC 820-10, Fair Value Measurement (“FASB ASC 820-10”) establishes a fair value hierarchy that prioritizes the inputs to valuation techniques used to measure fair value. The statement requires that assets and liabilities carried at fair value be classified and disclosed in one of the following three categories:
|
· |
Level 1: Quoted market prices in active markets for identical assets or liabilities. |
|
· |
Level 2: Observable market based inputs or unobservable inputs that are corroborated by market data. |
|
· |
Level 3: Unobservable inputs that are not corroborated by market data. |
We used the following methods and assumptions to estimate the fair values of the assets and liabilities:
Level 1 Fair Value Measurements – are based on market quotes of our marketable securities.
21
Level 2 Fair Value Measurements – Interest Rate Swaps and Caps – The fair value of interest rate swap and cap instruments are estimated based on market data and quotes from counter parties to the agreements that are corroborated by market data.
Level 3 Fair Value Measurements – Impaired Property – For assets measured on a non-recurring basis, such as real estate assets that are required to be recorded at fair value as a result of an impairment, our estimates of fair value are based on management’s best estimate derived from evaluating market sales data for comparable properties developed by a third party appraiser and arriving at management’s estimate of fair value based on such comparable data primarily based on properties with similar characteristics.
As of September 30, 2014 and December 31, 2013, we held certain items that are required to be measured at fair value on a recurring basis. These included available for sale securities and interest rate derivative contracts. Our available-for-sale securities primarily consist of investments associated with the ownership of marketable securities in New Zealand and the U.S. Derivative instruments are related to our economic hedge of interest rates.
The fair values of the interest rate swap and cap agreements are determined using the market standard methodology of discounting the future cash payments and cash receipts on the pay and receive legs of the interest swap agreements that have the net effect of swapping the estimated variable rate note payment stream for a fixed rate payment stream over the period of the swap. The variable interest rates used in the calculation of projected receipts on the interest rate swap agreements are based on an expectation of future interest rates derived from observable market interest rate curves and volatilities. To comply with the provisions of FASB ASC 820-10, we incorporate credit valuation adjustments to reflect both our own nonperformance risk and the respective counterparty's nonperformance risk in the fair value measurements. Although we have determined that the majority of the inputs used to value our derivatives fall within Level 2 of the fair value hierarchy, the credit valuation adjustments associated with our derivatives utilize Level 3 inputs, such as estimates of current credit spreads, to evaluate the likelihood of default by our counterparties and us. However, as of September 30, 2014 and December 31, 2013, we have assessed the significance of the impact of the credit valuation adjustments on the overall valuation and determined that the credit valuation adjustments are not significant to the overall valuation of our derivatives. As a result, we have determined that our derivative valuations in their entirety are classified in Level 2 of the fair value hierarchy. The nature of our interest rate swap and cap derivative instruments is described in Note 16 – Derivative Instruments.
We have consistently applied these valuation techniques in all periods presented and believe we have obtained the most accurate information available for the types of derivative contracts we hold. Additionally, there were no transfers of assets and liabilities between levels 1, 2, or 3 during the nine months ended September 30, 2014.
We measure and record the following assets and liabilities at fair value on a recurring basis subject to the disclosure requirements of FASB ASC 820-10 (dollars in thousands):
|
Book Value |
Fair Value |
||||||||
|
September 30, |
December 31, |
September 30, |
December 31, |
||||||
|
Financial Instrument |
Level |
2014 |
2013 |
2014 |
2013 |
||||
|
Investment in marketable securities |
1 |
$ |
51 |
$ |
55 |
$ |
51 |
$ |
55 |
|
Interest rate swaps and cap liability |
2 |
$ |
2,260 |
$ |
3,288 |
$ |
2,260 |
$ |
3,288 |
We measure the following liabilities at fair value on a recurring basis subject to the disclosure requirements of FASB ASC 820-10 (dollars in thousands):
|
Book Value |
Fair Value |
|||||||||
|
September 30, |
December 31, |
September 30, |
December 31, |
|||||||
|
Financial Instrument |
Level |
2014 |
2013 |
2014 |
2013 |
|||||
|
Notes payable |
3 |
$ |
131,743 |
$ |
140,547 |
$ |
109,479 |
$ |
121,411 | |
|
Subordinated debt |
3 |
$ |
27,913 |
$ |
27,913 |
$ |
10,096 |
$ |
11,067 | |
We estimated the fair value of our secured mortgage notes payable, unsecured notes payable, trust preferred securities, and other debt instruments by performing discounted cash flow analyses using an appropriate market discount rate. We calculated the market discount rate by obtaining period-end treasury rates for fixed-rate debt, or LIBOR rates for variable-rate debt, for maturities that correspond to the maturities of our debt, adding appropriate credit spreads derived from information obtained from third-party financial institutions. These credit spreads take into account factors such as our credit standing, the maturity of the debt, whether the debt is secured or unsecured, and the loan-to-value ratios of the debt.
22
Note 18 - Subsequent Events
None
23
Item 2 – Management’s Discussion and Analysis of Financial Condition and Results of Operations
We are an internationally diversified company principally focused on the development, ownership, and operation of entertainment and real estate assets in the United States, Australia, and New Zealand. Currently, we operate in two business segments:
|
· |
cinema exhibition, through our 56 multiplex cinemas; and |
|
· |
real estate, including real estate development and the rental of retail, commercial, and live theater assets. |
We believe that these two business segments can complement one another as we can use the comparatively consistent cash flows generated by our cinema operations to fund the front-end cash demands of our real estate development business.
We manage our worldwide cinema exhibition businesses under various different brands:
|
· |
in the US, under the Reading, Angelika Film Center, Consolidated Amusements, and City Cinemas brands; |
|
· |
in Australia, under the Reading brand; and |
|
· |
in New Zealand, under the Reading and Rialto brands. |
Cinema Activities
We continue to consider opportunities to expand our cinema operations while continuing to cull those cinema assets that are underperforming or have unacceptable risk profiles on a go-forward basis. On April 17, 2014 we entered into a lease for a new 8- screen multi-plex Angelika-style art cinema to be built in the Union Market area of Washington D.C. On June 13, 2014 we opened a temporary “pop-up” cinema to service the site during the development and construction of the permanent cinema. On December 31, 2013 we acquired ownership of the Plano cinema in Plano, Texas, a cinema that we have been managing for approximately 10 years but did not own. In addition, on July 25, 2014, we officially opened our 6-screen cinema in Dunedin, New Zealand. The Dunedin cinema was under lease to Hoyts at the time we acquired the property in June 2007. We are also refurbishing and repositioning our Carmel Mountain theater in San Diego County as a luxury Angelika theater.
Real Estate Activities
In recent periods we have focused our real estate development activities on (i) the disposition of certain assets (Moonee Ponds and Burwood) which we believe to have achieved their full potential land value, (ii) the improvement and expansion of our shopping center assets (an anchor grocery store tenancy for Wellington and a multi-plex cinema for Newmarket, (iii) the redevelopment of our Union Square and Cinemas 1,2,&3 properties in Manhattan and (iv) the procurement of land use entitlements for our landholdings in Coachella, California (202 acres) and Manukau, New Zealand (64 acres). The market for New York City property has continued to strengthen, with comparable sales being reported in the range of $1,100 per buildable square foot. Our business plan is to continue with the build-out of our existing operating properties, such as our Wellington, New Zealand site, and our Newmarket, Australia site, to redevelop our Union Square and Cinemas 1,2&3 properties, to continue to pursue the various land use entitlements needed for the development of our landholdings in New Zealand and California, and to seek out additional, profitable real estate development opportunities while continuing to use and judiciously expand our presence in the cinema exhibition business by identifying, developing, and acquiring cinema properties when and where we believe to be appropriate. In addition, we may sell all or portions of our properties in order to provide liquidity for other projects. We have entered into a contract to sell our property in Moonee Ponds, Australia, which is to close next year and have sold our property in Burwood, Australia, with a balance due of $51.1 million (AUS$58.5 million) that is scheduled to be paid at closing in December 2017.
Financing Activities
On June 27, 2014, we refinanced our existing three-tiered credit facility with NAB. It is comprised of (1) the Bank Bill Discount Facility with a facility limit of AUS$61.3 million an interest rate of 2.35% above the BBSY, and amortization at AUS$2.0 million per year; (2) the Bill Discount Facility – Revolving with a facility limit of AUS$10.0 million and an interest rate of 1.50% above the BBSY on any undrawn portion; and (3) the Bank Guarantee Facility with a facility limit of AUS$5.0 million. We are fully drawn on the Bank Bill Discount Facility, have drawn none of the Bill Discount Facility-Revolving and are utilizing AUS$2.6 million on the Bank Guarantee Facility. All three have an expiry date of June 30, 2019. The collateral for this facility is basically all the Australian cash flows and assets, other than the contract rights relating to the disposition of our Burwood and Moonee Ponds properties. The proceeds of the Burwood and Moonee Ponds transactions are likewise not subject to these financing agreements and may be freely utilized by us. BBSY is the Bank Bill Swap Bid base rate for this facility, and is currently 2.65% producing current all in rates of 5.00% and 4.15% respectively for the two facilities.
24
On June 26, 2014, our controlled subsidiary Sutton Hill Properties, LLC, refinanced with Santander Bank, N.A, the then existing $15.0 million term loan on our Cinema 1,2&3 property. The new loan has a 2-year term, payable interest only until maturity and includes a line of credit of $6.0 million for the acquisition of rights to add additional density to any redevelopment of the property (“air rights”). The loan has an interest rate of 3.50% over the 30-day Libor. The unused portion of the line of credit has an interest rate of 0.25% over the 30-day Libor. To date none of the $6.0 million line of credit has been drawn.
Results of Operations
At September 30, 2014, we owned and operated 52 cinemas with 434 screens, had interests in certain unconsolidated joint ventures and entities that own an additional 3 cinemas with 29 screens and managed 1 cinemas with 4 screens. Regarding our real estate, during the period, we (i) owned and operated four Entertainment Themed Retail Centers (“ETRCs”) that we developed in Australia and New Zealand, (ii) owned the fee interests in four developed commercial properties in Manhattan and Chicago improved with live theaters comprising seven stages and ancillary retail and commercial space, (iii) owned the fee interests underlying one of our Manhattan cinemas, (iv) held for development an additional four parcels aggregating approximately 75 acres located principally in urbanized areas of Australia and New Zealand (calculated net of our Moonee Ponds and Burwood Properties), and (v) owned 50% of a 202-acre property that is zoned for the development of up to 816 single-family residential units in the U.S. In addition, we continue to hold various properties used in our historic railroad operations.
The tables below summarize the results of operations for each of our principal business segments for the three (“2014 Quarter”) and nine (“2014 Nine Months”) months ended September 30, 2014 and the three (“2013 Quarter”) and nine (“2013 Nine Months”) months ended September 30, 2013, respectively (dollars in thousands):
|
Three Months Ended September 30, 2014 |
Cinema Exhibition |
Real Estate |
Intersegment Eliminations |
Total |
||||
|
Revenue |
$ |
60,947 |
$ |
6,035 |
$ |
(1,951) |
$ |
65,031 |
|
Operating expense |
|
50,243 |
|
2,289 |
|
(1,951) |
|
50,581 |
|
Depreciation and amortization |
|
2,765 |
|
964 |
|
-- |
|
3,729 |
|
General and administrative expense |
|
803 |
|
436 |
|
-- |
|
1,239 |
|
Segment operating income |
$ |
7,136 |
$ |
2,346 |
$ |
-- |
$ |
9,482 |
|
|
|
|
|
|
|
|
|
|
|
Three Months Ended September 30, 2013 |
Cinema Exhibition |
Real Estate |
Intersegment Eliminations |
Total |
||||
|
Revenue |
$ |
61,228 |
$ |
6,157 |
$ |
(1,913) |
$ |
65,472 |
|
Operating expense |
|
50,655 |
|
2,716 |
|
(1,913) |
|
51,458 |
|
Depreciation and amortization |
|
2,540 |
|
951 |
|
-- |
|
3,491 |
|
General and administrative expense |
|
891 |
|
185 |
|
-- |
|
1,076 |
|
Segment operating income |
$ |
7,142 |
$ |
2,305 |
$ |
-- |
$ |
9,447 |
|
Reconciliation to net income attributable to Reading International, Inc. shareholders: |
|
|
|
|
2014 Quarter |
2013 Quarter |
||
|
Total segment operating income |
|
|
|
|
$ |
9,482 |
$ |
9,447 |
|
Non-segment: |
|
|
|
|
|
|
|
|
|
Depreciation and amortization expense |
|
|
|
|
|
92 |
|
111 |
|
General and administrative expense |
|
|
|
|
|
3,217 |
|
3,510 |
|
Operating income |
|
|
|
|
|
6,173 |
|
5,826 |
|
Interest expense, net |
|
|
|
|
|
(1,411) |
|
(2,814) |
|
Other income (expense) |
|
|
|
|
|
242 |
|
(55) |
|
Gain on sale of assets |
|
|
|
|
|
25 |
|
-- |
|
Income tax expense |
|
|
|
|
|
(1,312) |
|
(751) |
|
Equity earnings of unconsolidated joint ventures and entities |
|
|
|
|
|
222 |
|
225 |
|
Net income |
|
|
|
|
$ |
3,939 |
$ |
2,431 |
|
Net (income) attributable to noncontrolling interests |
|
|
|
|
|
-- |
|
(38) |
|
Net income attributable to Reading International, Inc. common shareholders |
|
|
|
|
$ |
3,939 |
$ |
2,393 |
25
|
Nine Months Ended September 30, 2014 |
Cinema Exhibition |
Real Estate |
Intersegment Eliminations |
Total |
||||
|
Revenue |
$ |
180,225 |
$ |
18,396 |
$ |
(5,615) |
$ |
193,006 |
|
Operating expense |
|
147,631 |
|
7,523 |
|
(5,615) |
|
149,539 |
|
Depreciation and amortization |
|
8,378 |
|
2,839 |
|
-- |
|
11,217 |
|
General and administrative expense |
|
2,903 |
|
870 |
|
-- |
|
3,773 |
|
Segment operating income |
$ |
21,313 |
$ |
7,164 |
$ |
-- |
$ |
28,477 |
|
|
|
|
|
|
|
|
|
|
|
Nine Months Ended September 30, 2013 |
Cinema Exhibition |
Real Estate |
Intersegment Eliminations |
Total |
||||
|
Revenue |
$ |
180,657 |
$ |
19,764 |
$ |
(5,740) |
$ |
194,681 |
|
Operating expense |
|
151,612 |
|
8,115 |
|
(5,740) |
|
153,987 |
|
Depreciation and amortization |
|
7,824 |
|
3,086 |
|
-- |
|
10,910 |
|
General and administrative expense |
|
2,463 |
|
519 |
|
-- |
|
2,982 |
|
Segment operating income |
$ |
18,758 |
$ |
8,044 |
$ |
-- |
$ |
26,802 |
|
Reconciliation to net income attributable |
|
|
|
|
2014 Nine |
2013 Nine |
||
|
to Reading International, Inc. shareholders: |
|
|
|
|
Months |
Months |
||
|
Total segment operating income |
|
|
|
|
$ |
28,477 |
$ |
26,802 |
|
Non-segment: |
|
|
|
|
|
|
|
|
|
Depreciation and amortization expense |
|
|
|
|
|
273 |
|
333 |
|
General and administrative expense |
|
|
|
|
|
10,950 |
|
10,341 |
|
Operating income |
|
|
|
|
|
17,254 |
|
16,128 |
|
Interest expense, net |
|
|
|
|
|
(6,537) |
|
(8,124) |
|
Other income |
|
|
|
|
|
1,630 |
|
72 |
|
Gain (loss) on sale of assets |
|
|
|
|
|
25 |
|
(7) |
|
Income tax expense |
|
|
|
|
|
(4,747) |
|
(3,140) |
|
Equity earnings of unconsolidated joint ventures and entities |
|
|
|
|
|
833 |
|
1,005 |
|
Net income |
|
|
|
|
$ |
8,458 |
$ |
5,934 |
|
Net (income) loss attributable to noncontrolling interests |
|
|
|
|
|
23 |
|
(74) |
|
Net income attributable to Reading International, Inc. common shareholders |
|
|
|
|
$ |
8,481 |
$ |
5,860 |
26
Cinema Exhibition Segment
Included in the cinema exhibition segment above are revenue and expense from the operations of 52 cinema complexes with 434 screens during the 2014 Quarter and 51 cinema complexes with 429 screens during the 2013 Quarter. The following tables detail our cinema exhibition segment operating results for the three months ended September 30, 2014 and 2013, respectively (dollars in thousands):
|
Three Months Ended September 30, 2014 |
United States |
Australia |
New Zealand |
Total |
||||
|
Admissions revenue |
$ |
20,283 |
$ |
15,606 |
$ |
4,348 |
$ |
40,237 |
|
Concessions revenue |
|
8,851 |
|
6,657 |
|
1,784 |
|
17,292 |
|
Advertising and other revenue |
|
1,690 |
|
1,393 |
|
335 |
|
3,418 |
|
Total revenue |
|
30,824 |
|
23,656 |
|
6,467 |
|
60,947 |
|
|
|
|
|
|
|
|
|
|
|
Film rent and advertising cost |
|
10,332 |
|
7,108 |
|
2,067 |
|
19,507 |
|
Concession cost |
|
1,553 |
|
1,333 |
|
467 |
|
3,353 |
|
Occupancy expense |
|
6,385 |
|
4,383 |
|
1,186 |
|
11,954 |
|
Other operating expense |
|
9,166 |
|
4,671 |
|
1,592 |
|
15,429 |
|
Total operating expense |
|
27,436 |
|
17,495 |
|
5,312 |
|
50,243 |
|
|
|
|
|
|
|
|
|
|
|
Depreciation and amortization |
|
1,218 |
|
1,179 |
|
368 |
|
2,765 |
|
General and administrative expense |
|
565 |
|
231 |
|
7 |
|
803 |
|
Segment operating income |
$ |
1,605 |
$ |
4,751 |
$ |
780 |
$ |
7,136 |
|
Operating Data as a Percentage of Revenue for the Three Months Ended September 30, 2014 |
United States |
Australia |
New Zealand |
Total |
||||
|
Admissions revenue |
|
65.8% |
|
66.0% |
|
67.2% |
|
66.0% |
|
Concessions revenue |
|
28.7% |
|
28.1% |
|
27.6% |
|
28.4% |
|
Advertising and other revenue |
|
5.5% |
|
5.9% |
|
5.2% |
|
5.6% |
|
Total revenue |
|
100.0% |
|
100.0% |
|
100.0% |
|
100.0% |
|
|
|
|
|
|
|
|
|
|
|
Film rent and advertising cost |
|
50.9% |
|
45.5% |
|
47.5% |
|
48.5% |
|
Concession cost |
|
17.5% |
|
20.0% |
|
26.2% |
|
19.4% |
|
Occupancy expense |
|
20.7% |
|
18.5% |
|
18.3% |
|
19.6% |
|
Other operating expense |
|
29.7% |
|
19.7% |
|
24.6% |
|
25.3% |
|
Total operating cost and expense |
|
89.0% |
|
74.0% |
|
82.1% |
|
82.4% |
|
|
|
|
|
|
|
|
|
|
|
Depreciation and amortization |
|
4.0% |
|
5.0% |
|
5.7% |
|
4.5% |
|
General and administrative expense |
|
1.8% |
|
1.0% |
|
0.1% |
|
1.3% |
|
Segment operating income |
|
5.2% |
|
20.1% |
|
12.1% |
|
11.7% |
|
Three Months Ended September 30, 2013 |
United States |
Australia |
New Zealand |
Total |
||||
|
Admissions revenue |
$ |
22,825 |
$ |
14,851 |
$ |
3,682 |
$ |
41,358 |
|
Concessions revenue |
|
9,327 |
|
5,954 |
|
1,404 |
|
16,685 |
|
Advertising and other revenue |
|
1,792 |
|
1,177 |
|
216 |
|
3,185 |
|
Total revenue |
|
33,944 |
|
21,982 |
|
5,302 |
|
61,228 |
|
|
|
|
|
|
|
|
|
|
|
Cinema cost |
|
11,516 |
|
6,471 |
|
1,611 |
|
19,598 |
|
Concession cost |
|
1,584 |
|
1,141 |
|
365 |
|
3,090 |
|
Occupancy expense |
|
6,367 |
|
4,380 |
|
941 |
|
11,688 |
|
Other operating expense |
|
8,864 |
|
5,813 |
|
1,602 |
|
16,279 |
|
Total operating expense |
|
28,331 |
|
17,805 |
|
4,519 |
|
50,655 |
|
|
|
|
|
|
|
|
|
|
|
Depreciation and amortization |
|
1,512 |
|
816 |
|
212 |
|
2,540 |
|
General and administrative expense |
|
572 |
|
317 |
|
2 |
|
891 |
|
Segment operating income |
$ |
3,529 |
$ |
3,044 |
$ |
569 |
$ |
7,142 |
27
|
Operating Data as a Percentage of Revenue for the Three Months Ended September 30, 2013 |
United States |
Australia |
New Zealand |
Total |
||||
|
|
|
67.2% |
|
67.6% |
|
69.4% |
|
67.5% |
|
Concessions revenue |
|
27.5% |
|
27.1% |
|
26.5% |
|
27.3% |
|
Advertising and other revenue |
|
5.3% |
|
5.4% |
|
4.1% |
|
5.2% |
|
Total revenue |
|
100.0% |
|
100.0% |
|
100.0% |
|
100.0% |
|
|
|
|
|
|
|
|
|
|
|
Film rent and advertising cost |
|
50.5% |
|
43.6% |
|
43.8% |
|
47.4% |
|
Concession cost |
|
17.0% |
|
19.2% |
|
26.0% |
|
18.5% |
|
Occupancy expense |
|
18.8% |
|
19.9% |
|
17.7% |
|
19.1% |
|
Other operating expense |
|
26.1% |
|
26.4% |
|
30.2% |
|
26.6% |
|
Total operating cost and expense |
|
83.5% |
|
81.0% |
|
85.2% |
|
82.7% |
|
|
|
|
|
|
|
|
|
|
|
Depreciation and amortization |
|
4.5% |
|
3.7% |
|
4.0% |
|
4.1% |
|
General and administrative expense |
|
1.7% |
|
1.4% |
|
0.0% |
|
1.5% |
|
Segment operating income |
|
10.4% |
|
13.8% |
|
10.7% |
|
11.7% |
|
· |
Cinema revenue decreased for the 2014 Quarter by $281,000 or 0.5% compared to the same period in 2013, despite strong showing in Australia and New Zealand, due to the US revenue being $3.1 million lower than 2013. |
|
· |
Total operating expense decreased by $411,886 or 0.8% compared to the same period in 2013. Operating expense as a percent of gross revenue decreased from 82.7%to 82.4% in 2014. This decrease was driven by Australia and New Zealand, both showing declines in operating expense percentage, but was offset by an increase in the U.S. |
|
· |
Depreciation expense increased for the 2014 Quarter by $225,000 or 8.9% compared to the same period in 2013, due to additions of cinema assets. |
|
· |
General and administrative expense for the 2014 Quarter decreased by $88,000 or 9.9% for the 2014 Quarter compared to the 2013, with Australia providing all the decrease. |
|
· |
The Australian quarterly average exchange rate to the U.S dollar increased to 0.9247 for the 2014 Quarter from 0.9165 for the 2013 Quarter an increase of 0.9% The New Zealand quarterly average exchange rate to the U.S dollar climbed to 0.8419 for the 2014 Quarter from 0.7988 for the 2013 Quarter, an increase of 5.4%. Both had an impact on the individual components of our income statement. |
|
· |
Because of the above, and driven by positive results in Australia and New Zealand, which offset a decline of $1.9 million in the US, cinema exhibition segment operating income was flat to last year. |
The following tables detail our cinema exhibition segment operating results for the nine months ended September 30, 2014 and 2013, respectively (dollars in thousands):
|
Nine Months Ended September 30, 2014 |
|
United States |
|
Australia |
|
New Zealand |
|
Total |
|
Admissions revenue |
$ |
61,358 |
$ |
46,078 |
$ |
12,043 |
$ |
119,479 |
|
Concessions revenue |
|
26,515 |
|
18,814 |
|
4,850 |
|
50,179 |
|
Advertising and other revenue |
|
5,021 |
|
4,617 |
|
929 |
|
10,567 |
|
Total revenues |
|
92,894 |
|
69,509 |
|
17,822 |
|
180,225 |
|
|
|
|
|
|
|
|
|
|
|
Cinema cost |
|
31,828 |
|
21,219 |
|
5,609 |
|
58,656 |
|
Concession cost |
|
4,625 |
|
3,724 |
|
1,246 |
|
9,595 |
|
Occupancy expense |
|
18,651 |
|
13,034 |
|
3,298 |
|
34,983 |
|
Other operating expense |
|
25,654 |
|
14,608 |
|
4,135 |
|
44,398 |
|
Total operating expense |
|
80,759 |
|
52,586 |
|
14,287 |
|
147,631 |
|
|
|
|
|
|
|
|
|
|
|
Depreciation and amortization |
|
3,907 |
|
3,547 |
|
924 |
|
8,378 |
|
General and administrative expense |
|
2,111 |
|
756 |
|
36 |
|
2,903 |
|
Segment operating income |
$ |
6,117 |
$ |
12,620 |
$ |
2,575 |
$ |
21,313 |
|
Operating Data as a Percentage of Revenue for the Nine Months Ended |
|
United States |
|
Australia |
|
New Zealand |
|
Total |
|
Admissions revenue |
|
66.1% |
|
66.3% |
|
67.6% |
|
66.3% |
|
Concessions revenue |
|
28.5% |
|
27.1% |
|
27.2% |
|
27.8% |
|
Advertising and other revenue |
|
5.4% |
|
6.6% |
|
5.2% |
|
5.9% |
|
Total revenue |
|
100.0% |
|
100.0% |
|
100.0% |
|
100.0% |
|
|
|
|
|
|
|
|
|
|
|
Film rent and advertising cost |
|
51.9% |
|
46.1% |
|
46.6% |
|
49.1% |
28
|
Concession cost |
|
17.4% |
|
19.8% |
|
25.7% |
|
19.1% |
|
Occupancy expense |
|
20.1% |
|
18.8% |
|
18.5% |
|
19.4% |
|
Other operating expense |
|
27.6% |
|
21.0% |
|
23.2% |
|
24.6% |
|
Total operating cost and expense |
|
86.9% |
|
75.7% |
|
80.2% |
|
81.9% |
|
|
|
|
|
|
|
|
|
|
|
Depreciation and amortization |
|
4.2% |
|
5.1% |
|
5.2% |
|
4.6% |
|
General and administrative expense |
|
2.3% |
|
1.1% |
|
0.2% |
|
1.6% |
|
Segment operating income |
|
6.6% |
|
18.2% |
|
14.4% |
|
11.8% |
|
Nine Months Ended September 30, 2013 |
|
United States |
|
Australia |
|
New Zealand |
|
Total |
|
Admissions revenue |
$ |
63,070 |
$ |
48,328 |
$ |
11,111 |
$ |
122,509 |
|
Concessions revenue |
|
26,410 |
|
18,336 |
|
4,097 |
|
48,843 |
|
Advertising and other revenue |
|
4,712 |
|
3,888 |
|
705 |
|
9,305 |
|
Total revenues |
|
94,192 |
|
70,552 |
|
15,913 |
|
180,657 |
|
|
|
|
|
|
|
|
|
|
|
Cinema cost |
|
31,992 |
|
21,514 |
|
4,918 |
|
58,424 |
|
Concession cost |
|
4,480 |
|
3,712 |
|
1,048 |
|
9,240 |
|
Occupancy expense |
|
19,317 |
|
13,909 |
|
2,852 |
|
36,078 |
|
Other operating expense |
|
24,815 |
|
18,411 |
|
4,644 |
|
47,870 |
|
Total operating expense |
|
80,604 |
|
57,546 |
|
13,462 |
|
151,612 |
|
|
|
|
|
|
|
|
|
|
|
Depreciation and amortization |
|
4,643 |
|
2,468 |
|
713 |
|
7,824 |
|
General and administrative expense |
|
1,739 |
|
722 |
|
2 |
|
2,463 |
|
Segment operating income |
$ |
7,206 |
$ |
9,816 |
$ |
1,736 |
$ |
18,758 |
|
Operating Data as a Percentage of Revenue for the Nine Months Ended |
|
United States |
|
Australia |
|
New Zealand |
|
Total |
|
Admissions revenue |
|
67.0% |
|
68.5% |
|
69.8% |
|
67.8% |
|
Concessions revenue |
|
28.0% |
|
26.0% |
|
25.7% |
|
27.0% |
|
Advertising and other revenue |
|
5.0% |
|
5.5% |
|
4.4% |
|
5.2% |
|
Total revenue |
|
100.0% |
|
100.0% |
|
100.0% |
|
100.0% |
|
|
|
|
|
|
|
|
|
|
|
Film rent and advertising cost |
|
50.7% |
|
44.5% |
|
44.3% |
|
47.7% |
|
Concession cost |
|
17.0% |
|
20.2% |
|
25.6% |
|
18.9% |
|
Occupancy expense |
|
20.5% |
|
19.7% |
|
17.9% |
|
20.0% |
|
Other operating expense |
|
26.3% |
|
26.1% |
|
29.2% |
|
26.5% |
|
Total operating cost and expense |
|
85.6% |
|
81.6% |
|
84.6% |
|
83.9% |
|
|
|
|
|
|
|
|
|
|
|
Depreciation and amortization |
|
4.9% |
|
3.5% |
|
4.5% |
|
4.3% |
|
General and administrative expense |
|
1.8% |
|
1.0% |
|
0.0% |
|
1.4% |
|
Segment operating income |
|
7.6% |
|
13.9% |
|
10.9% |
|
10.4% |
|
· |
Cinema revenue decreased for the 2014 Nine Months by $432,000 or 0.2% compared to the same period in 2013. The U.S. decline of $1.3 million being offset by a strong $1.9 million increase in New Zealand. |
|
· |
Operating expense decreased for the 2014 Nine Months by $4.0 million or 2.6% compared to the same period in 2013. Overall, our operating expense as a percent of revenue decreased from 83.9% during the 2013 Nine Months to 81.9% for the 2014 Nine Months; a significant decrease in Australia’s operating expense as a result of improved operating efficiencies was the main reason for the decrease in operating expense percentage year over year. |
|
· |
Depreciation expense increased for the 2014 Nine Months by $554,000 or 7.1% compared to the same period in 2013 for the same reasons noted above for the 2014 Quarter. |
|
· |
General and administrative expense increased by $440,000 or 17.9% for the 2014 Nine Months compared to the 2013 Nine Months. This was driven primarily by the U.S. cinema segment. |
|
· |
The Australian quarterly exchange rate to the U.S. dollar declined to 0.9183 for the 2014 Nine Months from 0.9821 for the 2013 Nine Months, a decrease of 6.5%. The New Zealand quarterly exchange rate to the U.S. dollar increased to 0.8467 for the 2014 Nine Months from 0.8182 for the 2013 Nine Months, an increase of 3.5%. Both had an impact on the individual components of our income statement. |
|
· |
Because of the above, the cinema exhibition segment income increased for the 2014 Nine Months by $2.6 million or 13.6% compared to the same period in 2013 caused by a decrease in operating expense. |
29
Real Estate Segment
The following tables detail our real estate segment operating results for the three months ended September 30, 2014 and 2013, respectively (dollars in thousands):
|
Three Months Ended September 30, 2014 |
|
United States |
|
Australia |
|
New Zealand |
|
Total |
|
Live theater rental and ancillary income |
$ |
670 |
$ |
-- |
$ |
-- |
$ |
670 |
|
Property rental income |
|
470 |
|
3,512 |
|
1,383 |
|
5,365 |
|
Total revenues |
|
1,140 |
|
3,512 |
|
1,383 |
|
6,035 |
|
|
|
|
|
|
|
|
|
|
|
Live theater cost |
|
306 |
|
-- |
|
-- |
|
306 |
|
Property cost |
|
43 |
|
500 |
|
439 |
|
982 |
|
Occupancy expense |
|
235 |
|
563 |
|
202 |
|
1,000 |
|
Total operating expense |
|
584 |
|
1,063 |
|
641 |
|
2,288 |
|
|
|
|
|
|
|
|
|
|
|
Depreciation and amortization |
|
81 |
|
642 |
|
241 |
|
964 |
|
General and administrative expense |
|
12 |
|
409 |
|
15 |
|
436 |
|
Segment operating income |
$ |
463 |
$ |
1,398 |
$ |
486 |
$ |
2,347 |
|
Operating Data as a Percentage of Revenue for the Three Months Ended September 30, 2014 |
|
United States |
|
Australia |
|
New Zealand |
|
Total |
|
Live theater rental and ancillary revenue |
|
58.8% |
|
0.0% |
|
0.0% |
|
11.1% |
|
Property rental revenue |
|
41.2% |
|
100.0% |
|
100.0% |
|
88.9% |
|
Total revenue |
|
100.0% |
|
100.0% |
|
100.0% |
|
100.0% |
|
|
|
|
|
|
|
|
|
|
|
Live theater cost |
|
45.7% |
|
0.0% |
|
0.0% |
|
45.7% |
|
Property cost |
|
9.1% |
|
14.2% |
|
31.7% |
|
18.3% |
|
Occupancy expense |
|
20.6% |
|
16.0% |
|
14.6% |
|
16.6% |
|
Total operating cost and expense |
|
51.2% |
|
30.3% |
|
46.3% |
|
37.9% |
|
|
|
|
|
|
|
|
|
|
|
Depreciation and amortization |
|
7.1% |
|
18.3% |
|
17.4% |
|
16.0% |
|
General and administrative expense |
|
1.1% |
|
11.6% |
|
1.1% |
|
7.2% |
|
Segment operating income |
|
40.6% |
|
39.8% |
|
35.1% |
|
38.9% |
30
|
Three Months Ended September 30, 2013 |
|
United States |
|
Australia |
|
New Zealand |
|
Total |
|
Live theater rental and ancillary income |
$ |
765 |
$ |
-- |
$ |
-- |
$ |
765 |
|
Property rental income |
|
416 |
|
3,407 |
|
1,569 |
|
5,392 |
|
Total revenues |
|
1,181 |
|
3,407 |
|
1,569 |
|
6,157 |
|
|
|
|
|
|
|
|
|
|
|
Live theater cost |
|
511 |
|
-- |
|
-- |
|
511 |
|
Property cost |
|
79 |
|
622 |
|
432 |
|
1,133 |
|
Occupancy expense |
|
120 |
|
751 |
|
201 |
|
1,072 |
|
Total operating expense |
|
710 |
|
1,373 |
|
633 |
|
2,716 |
|
|
|
|
|
|
|
|
|
|
|
Depreciation and amortization |
|
78 |
|
627 |
|
246 |
|
951 |
|
General and administrative expense |
|
5 |
|
167 |
|
13 |
|
185 |
|
Segment operating income |
$ |
388 |
$ |
1,240 |
$ |
677 |
$ |
2,305 |
|
Operating Data as a Percentage of Revenue for the Three Months Ended September 30, 2013 |
United States |
Australia |
New Zealand |
Total |
||||
|
Live theater rental and ancillary revenue |
|
64.8% |
|
0.0% |
|
0.0% |
|
12.4% |
|
Property rental revenue |
|
35.2% |
|
100.0% |
|
100.0% |
|
87.6% |
|
Total revenue |
|
100.0% |
|
100.0% |
|
100.0% |
|
100.0% |
|
|
|
|
|
|
|
|
|
|
|
Live theater cost |
|
66.8% |
|
0.0% |
|
0.0% |
|
66.8% |
|
Property cost |
|
19.0% |
|
18.3% |
|
27.5% |
|
21.0% |
|
Occupancy expense |
|
10.2% |
|
22.0% |
|
12.8% |
|
17.4% |
|
Total operating cost and expense |
|
60.1% |
|
40.3% |
|
40.3% |
|
44.1% |
|
|
|
|
|
|
|
|
|
|
|
Depreciation and amortization |
|
6.6% |
|
18.4% |
|
15.7% |
|
15.4% |
|
General and administrative expense |
|
0.4% |
|
4.9% |
|
0.8% |
|
3.0% |
|
Segment operating income |
|
32.9% |
|
36.4% |
|
43.1% |
|
37.4% |
|
· |
Real estate revenue decreased for the 2014 Quarter by $122,000 or 2.0% compared to the same period in 2013. The decrease in New Zealand revenue is primarily the result of the closure of the Courtenay Central parking structure which has resulted in an estimated loss of revenue for the New Zealand operations of $2.0 million a year together with the termination of the Hoyts lease at our Dunedin property. For the 2014 Quarter, live theatre revenue in the U.S. decreased by $95,000 from the 2013 Quarter. |
|
· |
Operating expense for the real estate segment decreased for the 2014 Quarter by $428,000 or 15.8% compared to the same period in 2013. The decrease in operating expense is attributable to the same factors as discussed above regarding the change in revenue. |
|
· |
General and administrative expense for the real estate segment increased by $251,000 for the 2014 Quarter compared to the 2013 Quarter due to personnel changes in the Australian real estate department. |
|
· |
The Australian quarterly average exchange rate to the U.S dollar climbed to 0.9247 for the 2014 Quarter from 0.9165 for the 2013 Quarter an increase of 0.9% The New Zealand quarterly average exchange rate to the U.S dollar climbed to 0.8419 for the 2014 Quarter from 0.7988 for the 2013 Quarter, an increase of 5.4%. Both had an impact on the individual components of our income statement. |
|
· |
Real estate segment net operating income decreased for the 2014 Quarter by $42,000 or 1.8% compared to the same period in 2013, due mainly from the reduction in net operating income from the Courtenay Central parking structure closure. |
The following tables detail our real estate segment operating results for the nine months ended September 30, 2014 and 2013, respectively (dollars in thousands):
|
Nine Months Ended September 30, 2014 |
|
United States |
|
Australia |
|
New Zealand |
|
Total |
|
Live theater rental and ancillary income |
$ |
2,541 |
$ |
-- |
$ |
-- |
$ |
2,541 |
|
Property rental income |
|
1,321 |
|
10,377 |
|
4,157 |
|
15,855 |
|
Total revenues |
|
3,862 |
|
10,377 |
|
4,157 |
|
18,396 |
|
|
|
|
|
|
|
|
|
|
|
Live theater cost |
|
1,204 |
|
-- |
|
-- |
|
1,204 |
|
Property cost |
|
(37) |
|
1,737 |
|
1,248 |
|
2,948 |
|
Occupancy expense |
|
730 |
|
1,982 |
|
659 |
|
3,371 |
|
Total operating expense |
|
1,897 |
|
3,719 |
|
1,907 |
|
7,523 |
|
|
|
|
|
|
|
|
|
|
|
Depreciation and amortization |
|
246 |
|
1,893 |
|
700 |
|
2,839 |
31
|
General and administrative expense |
|
34 |
|
794 |
|
42 |
|
870 |
|
Segment operating income |
$ |
1,685 |
$ |
3,971 |
$ |
1,508 |
$ |
7,164 |
|
|
|
|
|
|
|
|
|
|
|
Operating Data as a Percentage of Revenue for the Nine Months Ended September 30, 2014 |
|
United States |
|
Australia |
|
New Zealand |
|
Total |
|
Live theater rental and ancillary revenue |
|
65.8% |
|
0.0% |
|
0.0% |
|
13.8% |
|
Property rental revenue |
|
34.2% |
|
100.0% |
|
100.0% |
|
86.2% |
|
Total revenue |
|
100.0% |
|
100.0% |
|
100.0% |
|
100.0% |
|
|
|
|
|
|
|
|
|
|
|
Live theater cost |
|
47.4% |
|
0.0% |
|
0.0% |
|
47.4% |
|
Property cost |
|
-2.8% |
|
16.7% |
|
30.0% |
|
18.6% |
|
Occupancy expense |
|
18.9% |
|
19.1% |
|
15.9% |
|
18.3% |
|
Total operating cost and expense |
|
49.1% |
|
35.8% |
|
45.9% |
|
40.9% |
|
|
|
|
|
|
|
|
|
|
|
Depreciation and amortization |
6.4% | 18.2% | 16.8% | 15.4% | ||||
|
General and administrative expense |
|
0.9% |
|
7.7% |
|
1.0% |
|
4.7% |
|
Segment operating income |
|
43.6% |
|
38.3% |
|
36.3% |
|
38.9% |
|
Nine Months Ended September 30, 2013 |
|
United States |
|
Australia |
|
New Zealand |
|
Total |
|
Live theater rental and ancillary income |
$ |
2,292 |
$ |
-- |
$ |
-- |
$ |
2,292 |
|
Property rental income |
|
1,247 |
|
10,740 |
|
5,485 |
|
17,472 |
|
Total revenues |
|
3,539 |
|
10,740 |
|
5,485 |
|
19,764 |
|
|
|
|
|
|
|
|
|
|
|
Live theater cost |
|
1,460 |
|
-- |
|
-- |
|
1,460 |
|
Property cost |
|
229 |
|
1,785 |
|
1,262 |
|
3,277 |
|
Occupancy expense |
|
401 |
|
2,376 |
|
601 |
|
3,379 |
|
Total operating expense |
|
2,091 |
|
4,161 |
|
1,863 |
|
8,115 |
|
|
|
|
|
|
|
|
|
|
|
Depreciation and amortization |
|
235 |
|
2,001 |
|
850 |
|
3,086 |
|
General and administrative expense |
|
77 |
|
406 |
|
36 |
|
519 |
|
Segment operating income |
$ |
1,136 |
$ |
4,172 |
$ |
2,736 |
$ |
8,044 |
|
|
|
|
|
|
|
|
|
|
|
Operating Data as a Percentage of Revenue for the Nine Months Ended September 30, 2013 |
|
United States |
|
Australia |
|
New Zealand |
|
Total |
|
Live theater rental and ancillary revenue |
|
64.8% |
|
0.0% |
|
0.0% |
|
11.6% |
|
Property rental revenue |
|
35.2% |
|
100.0% |
|
100.0% |
|
88.4% |
|
Total revenue |
|
100.0% |
|
100.0% |
|
100.0% |
|
100.0% |
|
|
|
|
|
|
|
|
|
|
|
Live theater cost |
|
63.7% |
|
0.0% |
|
0.0% |
|
63.7% |
|
Property cost |
|
18.4% |
|
16.6% |
|
23.0% |
|
18.8% |
|
Occupancy expense |
|
11.3% |
|
22.1% |
|
11.0% |
|
17.1% |
|
Total operating cost and expense |
|
59.1% |
|
38.7% |
|
34.0% |
|
41.1% |
|
|
|
|
|
|
|
|
|
|
|
Depreciation and amortization |
|
6.6% |
|
18.6% |
|
15.5% |
|
15.6% |
|
General and administrative expense |
|
2.2% |
|
3.8% |
|
0.7% |
|
2.6% |
|
Segment operating income |
|
32.1% |
|
38.8% |
|
49.9% |
|
40.7% |
|
· |
Real estate revenue decreased for the 2014 Nine Months by $1.4 million or 6.9% compared to the same period in 2013. The decrease in New Zealand revenue is primarily the result of the closure of the Courtenay Central parking structure which has resulted in an estimated loss of revenue for the New Zealand operations of $2.0 million a year together with the termination of the Hoyts lease at our Dunedin property. This was offset by an overall increase in live theatre revenue by $249,000 or 10.9% compared to the same period in 2013 |
|
· |
Operating expense for the real estate segment decreased for the 2014 Nine Months by $592,000 or 7.3% compared to the same period in 2013. This decrease in operating expense was due to the same reasons noted above for the quarterly results. |
|
· |
The Australian quarterly exchange rate to the U.S. dollar declined to 0.9247 for the 2014 Nine Months from 0.9821 for the 2013 Nine Months, a decrease of 5.8%. The New Zealand quarterly exchange rate to the U.S. dollar increased to 0.8515 for the 2014 Nine Months from 0.8182 for the 2013 Nine Months, an increase of 4.1%. Both had an impact on the individual components of our income statement. |
32
|
· |
Real estate segment income decreased for the 2014 Nine Months by $880,000 or 10.9% compared to the same period in 2013, due primarily to the shortfall in operating income from the Courtenay Central parking structure closure, offset by a decrease in operating expenses for 2014 Nine Months and positive operating results from the live theater operations compared to the same period in 2013. |
Corporate
Quarterly Results
General and administrative expense decreased slightly by $293,000 for the 2014 Quarter compared to the 2013 Quarter.
Net interest expense decreased by $1.4 for the 2014 Quarter compared to the 2013 Quarter. Our interest expense was lower in the 2014 Quarter due to a change in mark-to-market interest rate swap valuations for the quarter.
Income taxes increased by $561,000 due to improved pretax income in the 2014 Quarter compared to the 2013 Quarter.
Nine Months Results
General and administrative expense increased by $609,000 for the 2014 Nine Months compared to the 2013 Nine Months. The increase in general and administrative expense during the 2014 Nine Months was due primarily to the increase in pension expenses estimated by our third party actuarial valuation report for 2014.
Net interest expense decreased by $1.5 million for the 2014 Nine Months compared to the 2013 Nine Months as a result of favorable changes in the mark-to-market swap valuations.
Income tax expense increased by $1.6 million for the 2014 Nine Months compared to the 2013 Nine Months primarily because of improved pre-tax income during 2014 compared to 2013.
Other income increased $1.4 million due to insurance proceeds received during the 2014 period for the Courtenay Central parking structure business interruption recovery claim.
Net Income (Loss) Attributable to Reading International, Inc. Common Shareholders
We recorded a net income attributable to Reading International, Inc. common shareholders of $3.9 million for the 2014 Quarter compared to a net income of $2.4 million for the 2013 Quarter and a net income of $8.5 million for the 2014 Nine Months compared to a net income of $5.9 million for the 2013 Nine Months. As described above, the increase in net income from 2013 to 2014 was primarily due to improved efficiencies in operations of the cinema business, which is reflected in the decrease in the cinema business total operating expense for the 2014 Nine Months by $4.0 million or 2.6% compared to the same period in 2013.
Business Plan, Capital Resources, and Liquidity
Business Plan
Our cinema exhibition business plan is to continue to identify, develop, and acquire cinema properties, where reasonably available, that allow us to leverage our cinema expertise and technology over a larger operating base.
Our real estate business plan is to begin development of our existing land assets, to be sensitive to opportunities to convert our entertainment assets to higher and better uses, or, when appropriate, to dispose of such assets.
In addition, we review opportunities to monetize our assets where such action could lead to a financially acceptable outcome. We will also continue to investigate potential synergistic acquisitions that may not readily fall into either of our two cinema or real estate segments.
33
Contractual Obligations
The following table provides information with respect to the maturities and scheduled principal repayments of our secured debt and lease obligations at September 30, 2014 (in thousands):
|
2014 |
2015 |
2016 |
2017 |
2018 |
Thereafter |
Total |
||||||||
|
Debt |
$ |
2,294 |
$ |
33,521 |
$ |
20,247 |
$ |
22,747 |
$ |
9,247 |
$ |
43,685 |
$ |
131,743 |
|
Subordinated notes (trust preferred securities) |
|
-- |
|
-- |
|
-- |
|
-- |
|
-- |
|
27,913 |
|
27,913 |
|
Tax settlement liability |
|
870 |
|
2,974 |
|
-- |
|
-- |
|
-- |
|
-- |
|
3,844 |
|
Pension liability |
|
171 |
|
684 |
|
684 |
|
684 |
|
684 |
|
4,643 |
|
7,550 |
|
Lease obligations |
|
6,482 |
|
32,234 |
|
28,504 |
|
25,878 |
|
22,089 |
|
60,654 |
|
175,841 |
|
Estimated interest on debt |
|
1,809 |
|
5,876 |
|
5,007 |
|
4,505 |
|
3,627 |
|
10,918 |
|
31,741 |
|
Total |
$ |
11,626 |
$ |
75,289 |
$ |
54,442 |
$ |
53,814 |
$ |
35,647 |
$ |
147,814 |
$ |
378,632 |
We base estimated interest on long-term debt on the anticipated loan balances for future periods calculated against current fixed and variable interest rates.
We adopted FASB ASC 740-10-25 on January 1, 2007. As of adoption, the total amount of gross unrecognized tax benefits for uncertain tax positions was $12.5 million decreasing to $2.3 million as of September 30, 2014 primarily as a result of the settlement on January 6, 2011 of our Tax Audit/Litigation matter.
Unconsolidated Debt
Total debt of unconsolidated joint ventures and entities was $623,000 and $634,000 as of September 30, 2014 and December 31, 2013, respectively. Our share of unconsolidated debt, based on our ownership percentage, was $208,000 and $211,000 as of September 30, 2014 and December 31, 2013, respectively. This debt is guaranteed by one of our subsidiaries to the extent of our ownership percentage.
Off-Balance Sheet Arrangements
There are no off-balance sheet transactions, arrangements or obligations (including contingent obligations) that have, or are reasonably likely to have, a current or future material effect on our financial condition, changes in the financial condition, revenues or expenses, results of operations, liquidity, capital expenditures, or capital resources.
Currency Risk
We are subject to currency risk because we conduct a significant portion of our business in Australia and New Zealand. Set forth below is a chart indicating the various exchange rates at certain points in time for the Australian and New Zealand Dollar vis-à-vis the US Dollar over the past 20 years.
34
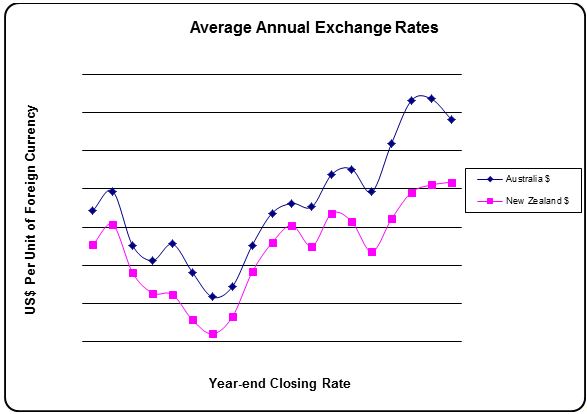
We do not engage in currency hedging activities. Rather, to the extent possible, we operate our Australian and New Zealand operations on a self-funding basis. Our policy in Australia and New Zealand is to match revenues and expenses, whenever possible, in local currencies. As a result, we have procured in local currencies the majority of our expenses in Australia and New Zealand. As our U.S. operations are funded in part by the operational results of Australia and New Zealand, fluctuations in these foreign currencies affect such funding. As we continue to progress with our acquisition and development activities in Australia and New Zealand, the effect of variations in currency values will likely increase.
Liquidity and Capital Resources
Our ability to generate sufficient cash flows from operating activities in order to meet our obligations and commitments drives our liquidity position. This is further affected by our ability to obtain adequate, reasonable financing and/or to convert non-performing or non-strategic assets into cash.
Currently, our liquidity needs arise primarily from:
|
· |
capital expenditure needs; |
|
· |
working capital requirements; and |
|
· |
debt servicing requirements. |
Expiring Debt and Liquidity Requirements
Expiring Long-Term Debt
Our New Zealand Corporate Credit Facility matures on March 31, 2015 and as such the balance of $21.8 million (NZ$28.0 million) has been reclassified as a current liability on the consolidated balance sheet as of September 30, 2014.
Additionally, the term of our Union Square Theatre Term Loan matures on May 1, 2015. Accordingly, the outstanding balance of this debt of $6.5 million has been classified as a current liability on the consolidated balance sheet as of September 30, 2014.
While no assurances can be given that we will be successful, we currently anticipate that these loans will either be extended or replaced prior to their maturities.
35
Tax Settlement Liability
As indicated in our 2013 Annual Report, in accordance with the agreement between the U.S. Internal Revenue Service and our subsidiary, Craig Corporation, it is obligated to pay $290,000 per month, $3.5 million per year, in settlement for its tax liability for its tax year 1996. At September 30, 2014, Craig Corporation’s remaining tax liability under this agreement was approximately $3.8 million.
For the abovementioned liabilities, we believe that we have sufficient borrowing capacity under our various credit facilities, together with our $40.6 million of cash and cash equivalents, to meet our anticipated short-term working capital requirements for the next twelve months.
Operating Activities
Cash provided by operations was $15.0 million in the 2014 Nine Months compared to $16.2 million in the 2013 Nine Months. The year-to-year decrease in cash provided by operations of $1.3 million was due primarily to a $4.1 million increase in operational cash flows offset by a $5.4 million change in operating assets and liabilities.
Investing Activities
Cash used in investing activities for the 2014 Nine Months was $3.0 million compared to $898,000 used in investing activities for the 2013 Nine Months, a change of $2.1 million. The $3.0 million of cash used in investing activities for the 2014 Nine Months related to:
|
· |
$5.3 million in deposits from a sale of property; and |
|
· |
$212,000 of distributions from unconsolidated JV’s and entities; |
offset by
|
· |
$8.6 million in property enhancements to our existing properties. |
The $898,000 of cash provided by investing activities for the 2013 Nine Months was primarily related to:
|
· |
$1.6 million in cash provided from restricted cash; |
|
· |
$2.0 million of proceeds from a note receivable; and |
|
· |
$8.0 million of proceeds from time deposits; |
offset by
|
· |
$12.7 million in property enhancements to our existing properties; |
Financing Activities
Cash used in financing activities for the 2014 Nine Months was $7.8 million compared to $14.3 million of cash used in financing activities for the same period in 2013, resulting in a change of $6.5 million. The $7.8 million in cash used in financing activities during the 2014 Nine Months was primarily related to:
|
· |
$6.6 million of loan repayments; and |
|
· |
$2.3 million used to repurchase Class A non-voting stock; |
offset by
|
· |
$975,000 of proceeds from the exercise of stock options. |
The $14.3 million in cash used in financing activities during the 2013 Nine Months was primarily related to:
|
· |
$25.1 million of loan repayment including a $6.4 million payoff of our former Liberty Theaters Term Loan, a $6.8 million pay off our Sutton Hill Capital Note, $4.6 million in payments on our Bank of America Revolver and Line of Credit, $6.5 million in payments on our NAB term debt, and a $592,000 pay off of the Nationwide Loan 1; and |
|
· |
$2.1 million in noncontrolling interests’ distributions; |
36
offset by
|
· |
$12.5 million of new borrowing including $5.0 million from our Bank of America Revolver and $7.5 million from our new loan on the Orpheum and Minetta Lane Theatres, net of $103,000 of borrowing costs; |
|
· |
$263,000 in noncontrolling interests’ contributions; and |
|
· |
$249,000 of proceeds from the exercise of stock options. |
Critical Accounting Policies
The SEC defines critical accounting policies as those that are, in management’s view, most important to the portrayal of the company’s financial condition and results of operations and the most demanding in their calls on judgment. Although accounting for our core business of cinema and live theater exhibition with a real estate focus is relatively straightforward, we believe our most critical accounting policies relate to:
|
· |
impairment of long-lived assets, including goodwill and intangible assets; |
|
· |
tax valuation allowance and obligations; and |
|
· |
legal and environmental obligations. |
We discuss these critical accounting policies in our 2013 Annual Report and advise you to refer to that discussion.
In May 2014, the Financial Accounting Standards Board issued a new standard to achieve a consistent application of revenue recognition within the U.S resulting in a single revenue model to be applied by reporting companies under U.S. general accepted accounting principles. The new standard is effective beginning in the first quarter of 2017. While we feel the impact of the proposed revenue recognition will have minimal impact on our business since our revenues predominantly come from movie ticket sales and concession purchases we intend to go through the analysis to ensure that we are in compliance.
Financial Risk Management
Our internally developed risk management procedure seeks to minimize the potentially negative effects of changes in currency exchange rates and interest rates on the results of operations. Our primary exposure to fluctuations in the financial markets is currently due to changes in interest rates and currency exchange rates between U.S and Australia and New Zealand.
As our operational focus continues to shift to Australia and New Zealand, unrealized foreign currency translation gains and losses could materially affect our financial position. We currently manage our currency exposure by creating, whenever possible, natural hedges in Australia and New Zealand. This involves local country sourcing of goods and services as well as borrowing in local currencies.
Our exposure to interest rate risk arises out of our long-term debt obligations. Consistent with our internally developed guidelines, we seek to reduce the negative effects of changes in interest rates by changing the character of the interest rate on our long-term debt, converting a variable rate into a fixed rate by entering into derivative contracts on certain borrowing transactions. Our Australian credit facilities provide for floating interest rates but require that not less than a certain percentage of the loans be swapped into fixed rate obligations using derivative contracts.
In accordance with FASB ASC 815-10-35, Subsequent Valuation of Derivative Instruments and Hedging Instruments (“FASB ASC 815-10-35”), we marked our interest rate swap and cap instruments to market on the consolidated balance sheet resulting in a decrease in interest expense of $958,000 and a decrease of $1.0 million during the three and nine months ended September 30, 2014, respectively, and an decrease of $209,000 and $1.6 million in interest expense during the three and nine months ended September 30, 2013, respectively. At September 30, 2014 and December 31, 2013, we recorded the fair market value of our interest rate swaps and cap of $2.3 million and $3.3 million, respectively, as other long-term liabilities. In accordance with FASB ASC 815-10-35, we have not designated any of our current interest rate swap or cap positions as financial reporting hedges.
Inflation
We continually monitor inflation and the effects of changing prices. Inflation increases the cost of goods and services used. Competitive conditions in many of our markets restrict our ability to recover fully the higher costs of acquired goods and services through price increases. We attempt to mitigate the impact of inflation by implementing continuous process improvement solutions to enhance productivity and efficiency and, as a result, lower costs and operating expenses. In our opinion, we have managed the effects of inflation appropriately, and, as a result, it has not had a material impact on our operations and the resulting financial position or liquidity.
37
Litigation
We are currently, and are from time to time, involved with claims and lawsuits arising in the ordinary course of our business. Some examples of the types of claims are:
|
· |
contractual obligations; |
|
· |
insurance claims; |
|
· |
IRS claims; |
|
· |
employment matters; |
|
· |
environmental matters; and |
|
· |
antitrust issues. |
Where we are the plaintiffs, we expense all legal fees on an on-going basis and make no provision for any potential settlement amounts until received. In Australia, the prevailing party is entitled to recover its attorneys’ fees, which typically work out to be approximately 60% of the amounts actually spent where first class legal counsel is engaged at customary rates. Where we are a plaintiff, we have likewise made no provision for the liability for the defendant’s attorneys' fees in the event we are determined not to be the prevailing party.
Where we are the defendants, we accrue for probable damages that insurance may not cover as they become known and can be reasonably estimated. In our opinion, any claims and litigation in which we are currently involved are not reasonably likely to have a material adverse effect on our business, results of operations, financial position, or liquidity. However, we do not give any assurance as to the ultimate outcome of such claims and litigation. The resolution of such claims and litigation could be material to our operating results for any particular period, depending on the level of income for such period. There have been no material changes to our litigation exposure since our 2013 Annual Report.
Forward-Looking Statements
Our statements in this interim quarterly report contain a variety of forward-looking statement as defined by the Securities Litigation Reform Act of 1995. Forward-looking statements reflect only our expectations regarding future events and operating performance and necessarily speak only as of the date the information was prepared. No guarantees can be given that our expectation will in fact be realized, in whole or in part. You can recognize these statements by our use of words such as, by way of example, “may,” “might,” “expect,” “believe,” and “anticipate” or other similar terminology.
These forward-looking statements reflect our expectation after having considered a variety of risks and uncertainties. However, they are necessarily the product of internal discussion and do not necessarily completely reflect the views of individual members of our Board of Directors or of our management team. Individual Board members and individual members of our management team may have different views as to the risks and uncertainties involved, and may have different views as to future events or our operating performance.
Among the factors that could cause actual results to differ materially from those expressed in or underlying our forward-looking statements are the following:
|
· |
With respect to our cinema operations: |
|
o |
The number and attractiveness to movie goers of the films released in future periods; |
|
o |
The amount of money spent by film distributors to promote their motion pictures; |
|
o |
The licensing fees and terms required by film distributors from motion picture exhibitors in order to exhibit their films; |
|
o |
The continued willingness of moviegoers to spend money on our concession items; |
|
o |
The comparative attractiveness of motion pictures as a source of entertainment and willingness and/or ability of consumers (i) to spend their dollars on entertainment and (ii) to spend their entertainment dollars on movies in an outside-the-home environment; |
|
o |
The extent to which we encounter competition from other cinema exhibitors, from other sources of outside of the home entertainment, and from inside the home entertainment options, such as “home theaters” and competitive film product distribution technology, such as, by way of example, cable, satellite broadcast, DVD and VHS rentals and sales, and so called “movies on demand”; |
38
|
o |
the extent to which we can digitalize our cinema circuit compared to our competitors; and |
|
o |
The extent to and the efficiency with which, we are able to integrate acquisitions of cinema circuits with our existing operations. |
|
· |
With respect to our real estate development and operation activities: |
|
o |
The rental rates and capitalization rates applicable to the markets in which we operate and the quality of properties that we own; |
|
o |
The extent to which we can obtain on a timely basis the various land use approvals and entitlements needed to develop our properties; |
|
o |
The risks and uncertainties associated with real estate development; |
|
o |
The availability and cost of labor and materials; |
|
o |
Competition for development sites and tenants; |
|
o |
Environmental remediation issues; and |
|
o |
The extent to which our cinemas can continue to serve as an anchor tenant who will, in turn, be influenced by the same factors as will influence generally the results of our cinema operations. |
|
· |
With respect to our operations generally as an international company involved in both the development and operation of cinemas and the development and operation of real estate; and previously engaged for many years in the railroad business in the United States: |
|
o |
Our ongoing access to borrowed funds and capital and the interest that must be paid on that debt and the returns that must be paid on such capital; |
|
o |
The relative values of the currency used in the countries in which we operate; |
|
o |
Changes in government regulation; |
|
o |
Our labor relations and costs of labor (including future government requirements with respect to pension liabilities, disability insurance and health coverage, and vacations and leave); |
|
o |
Our exposure from time to time to legal claims and to uninsurable risks such as those related to our historic railroad operations, including potential environmental claims and health related claims relating to alleged exposure to asbestos or other substances now or in the future, recognized as being possible causes of cancer or other health related problems; |
|
o |
Changes in future effective tax rates and the results of currently ongoing and future potential audits by taxing authorities having jurisdiction over our various companies; and |
|
o |
Changes in applicable accounting policies and practices. |
The above list is not necessarily exhaustive, as business is by definition unpredictable and risky, and subject to influence by numerous factors outside of our control, such as changes in government regulation or policy, competition, interest rates, supply, technological innovation, changes in consumer taste and fancy, weather, and the extent to which consumers in our markets have the economic wherewithal to spend money on beyond-the-home entertainment.
Given the variety and unpredictability of the factors that will ultimately influence our businesses and our results of operation, it naturally follows that no guarantees can be given that any of our forward-looking statements will ultimately prove to be correct. Actual results will undoubtedly vary and there is no guarantee as to how our securities will perform either when considered in isolation or when compared to other securities or investment opportunities.
Finally, we undertake no obligation to update publicly or to revise any of our forward-looking statements, whether as a result of new information, future events or otherwise, except as may be required under applicable law. Accordingly, you should always note the date to which our forward-looking statements speak.
Additionally, certain of the presentations included in this interim quarterly report may contain “non-GAAP financial measures.” In such case, a reconciliation of this information to our GAAP financial statements will be made available in connection with such statements.
39
Item 3 – Quantitative and Qualitative Disclosure about Market Risk
The SEC requires that registrants include information about potential effects of changes in currency exchange and interest rates in their filings. Several alternatives, all with some limitations, have been offered. We base the following discussion on a sensitivity analysis that models the effects of fluctuations in currency exchange rates and interest rates. This analysis is constrained by several factors, including the following:
|
· |
It is based on a single point in time; and |
|
· |
It does not include the effects of other complex market reactions that would arise from the changes modeled. |
Although the results of such an analysis may be useful as a benchmark, they should not be viewed as forecasts.
At September 30, 2014, approximately 52% and 21% of our assets were invested in assets denominated in Australian dollars (Reading Australia) and New Zealand dollars (Reading New Zealand), respectively, including approximately $31.4 million in cash and cash equivalents. At December 31, 2013, approximately 55% and 18% of our assets were invested in assets denominated in Australian dollars (Reading Australia) and New Zealand dollars (Reading New Zealand) including approximately $34.5 million in cash and cash equivalents.
Our policy in Australia and New Zealand is to match revenues and expenses, whenever possible, in local currencies. As a result, we have procured in local currencies a majority of our expenses in Australia and New Zealand. Due to the developing nature of our operations in Australia and New Zealand, our revenue is not yet significantly greater than our operating and interest expenses. Despite this natural hedge, recent movements in foreign currencies have had an effect on our current earnings. Although foreign currency has had an effect on our current earnings, the effect of the translation adjustment on our assets and liabilities noted in our other comprehensive income was an increase of $16.4 million and a increase of $6.4 million for the three and nine months ended September 30, 2014, respectively. As we continue to progress our acquisition and development activities in Australia and New Zealand, we cannot assure you that the foreign currency effect on our earnings will be negligible in the future.
Historically, our policy has been to borrow in local currencies to finance the development and construction of our ETRCs in Australia and New Zealand whenever possible. As a result, the borrowings in local currencies have provided somewhat of a natural hedge against the foreign currency exchange exposure. Even so, and as a result of our issuance of fully subordinated notes (TPS) in 2007, and their subsequent partial repayment, approximately 66% and 49% of our Australian and New Zealand assets, respectively, remain subject to such exposure unless we elect to hedge our foreign currency exchange between the US and Australian and New Zealand dollars. If the foreign currency rates were to fluctuate by 10%, the resulting change in Australian and New Zealand assets would be $13.1 million and $3.9 million, respectively, and the change in our quarterly net income (loss) would be $797,000 and $149,000, respectively. Presently, we have no plan to hedge such exposure.
We record unrealized foreign currency translation gains or losses that could materially affect our financial position. As of September 30, 2014 and December 31, 2013, we have recorded a cumulative unrealized foreign currency translation gain of approximately $38.9 million and $65.6 million, respectively.
Historically, we maintain most of our cash and cash equivalent balances in short-term money market instruments with original maturities of three months or less. Due to the short-term nature of such investments, a change of 1% in short-term interest rates would not have a material effect on our financial condition.
While we have typically used fixed rate financing (secured by first mortgages) in the U.S., fixed rate financing is typically not available to corporate borrowers in Australia and New Zealand. The majority of our Australian and New Zealand bank loans have variable rates. The Australian facility provides for floating interest rates, but requires that not less than a certain percentage of the loan be swapped into fixed rate obligations (see Financial Risk Management above). Taking into consideration our interest rate swaps and cap, a 1% increase or decrease in short-term interest rates would have resulted in approximately $162,000 increase or decrease in our 2014 Quarter’s interest expense.
40
Item 4 – Controls and Procedures
We maintain disclosure controls and procedures that are designed to ensure that information required to be disclosed in the Company’s Exchange Act reports, as amended, is recorded, processed, summarized and reported within the time periods specified in the SEC’s rules and forms and that such information is accumulated and communicated to our management, including our Chief Executive Officer and Chief Financial Officer, as appropriate, to allow for timely decisions regarding required disclosure. In designing and evaluating the disclosure controls and procedures, management recognizes that any controls and procedures, no matter how well designed and operated, can provide only reasonable assurance of achieving the desired control objectives, and our management is required to apply its judgment in evaluating the cost-benefit relationship of possible controls and procedures.
Under the supervision and with the participation of our management, including our principal executive officer and principal financial officer, we conducted an evaluation of our disclosure controls and procedures in connection with the preparation of this Quarterly Report. In its evaluations, our management, including our chief executive officer and our chief financial officer, identified a material weakness in our internal control over financial reporting based on their discovery that our audited consolidated financial statements for the fiscal year ended December 31, 2013 and unaudited consolidated financial statements for the quarters ended March 31, 2014 and June 30, 2014 erroneously omitted a $1.4 million tax effect of a 2013 year-end transaction by one of our Reading Australia subsidiaries. Properly included, the tax effect would have resulted in an increase in our deferred tax asset and total assets and a corresponding increase in our other consolidated income and total liabilities and shareholders’ equity, but would not have had a material effect on our financial condition or results of operations as reflected in our prior financial statements.
In light of the foregoing, our management concluded that our disclosure controls and procedures were not effective to ensure that the tax effect of transactions in our foreign jurisdictions was reported. As a means of remedying the material weakness and improving our controls and procedures, we have determined to engage tax advisors to support our accounting for taxes in countries in which we have no employees experienced in tax matters.
Changes in Internal Control over Financial Reporting
No change in our internal control over financial reporting (as defined in Rule 13a-15(f) and 15d-15(f) under the Exchange Act) occurred during the quarter ended September 30, 2014 that has materially affected, or is reasonably likely to materially affect, our internal control over financial reporting.
41
For a description of legal proceedings, please refer to Item 3 entitled Legal Proceedings contained in the Company’s Annual Report on Form 10-K for the year ended December 31, 2013.
There have been no material changes in risk factors as previously disclosed in our annual report on Form 10-K filed on March 7, 2014 with the SEC for the fiscal year ended December 31, 2013.
Item 2 – Unregistered Sales of Equity Securities and Use of Proceeds
For a description of grants of stock to certain executives, see the Stock Based Compensation section under see Note 2 – Equity and Stock-Based Compensation to our Condensed Consolidated Financial Statements.
Item 3 – Defaults upon Senior Securities
None.
On August 7, 2014, James J. Cotter, Sr. advised the Board of Directors that, due to health reasons, he was resigning, effective immediately, as our Company’s Chairman and Chief Executive Officer and as a director. The Board of Directors has elected James J. Cotter, Jr. to serve as our new Chief Executive Officer, Ellen Marie Cotter to serve as our new Chairman, and Margaret Cotter to serve as our new Vice Chairman. Mr. James J. Cotter, Jr. has resigned his position as Vice Chairman but will continue to serve as our President.
Mr. Andrzej Matyczynski has agreed to extend his current September 1, 2014 retirement date for three months, until December 1, 2014. During this period, he will serve as our Chief Financial Officer until a successor has been retained. Thereafter, he will assist in the transitioning of this office.
Ellen Marie Cotter, Margaret Cotter and James J. Cotter, Jr. are the children of James J. Cotter, Sr. and have advised us that they consider their interest in our Company to be a long term family asset and that they intend to continue the Company in the direction established by their father--- as a motion picture exhibition and real estate company.
Ellen Cotter is currently the head of our Domestic Cinema Operations. She joined our Company in 1998 and has been a director since 2013.
Margaret Cotter has been a director since 2002 and has been President of our live theaters and manages the real estate which houses each of the four live theaters since 2000. She heads the day-to-day pre-development process and transition of our properties from theatre operations to major realty developments which currently include the Union Square and Cinemas 123 properties.
James J. Cotter, Jr. was initially elected to the Board in 2002, served from 2007, until his resignation on August 7, 2014, as Vice Chairman to assume the duties of CEO, and continues to serve as the President of our Company. Further information about Mr. Cotter, Jr.’s business history and related party transactions involving our Company and the Cotter family is set forth in our Proxy Materials filed on Schedule 14A for our 2014 Annual Meeting of Stockholders, and incorporated by reference herein. There are no related party transactions between our company and Mr. Cotter, Jr. other than the employment contract relating to his services as President, filed as Exhibit 10.2 to our Company’s report on form 10Q for the Period ended June 30, 2013 and incorporated by reference as exhibit 10.34 to our Company’s report on form 10K for the period ended December 31, 2013.
We are advised by Ellen Cotter, James J. Cotter, Jr. and Margaret Cotter, that they intend to recommend to the Board of Directors that, going forward, the position of Chairman be rotated among them, depending upon their respective availabilities and workloads.
42
Item 6 – Exhibits
|
3.1 |
Amended Article of Incorporation |
|
10.1 |
John Hunter Separation Agreement |
|
10.2 |
James J Cotter, Jr. Employment Agreement |
|
31.1 |
Certification Pursuant to Section 302 of the Sarbanes-Oxley Act of 2002, filed herewith. |
|
31.2 |
Certification Pursuant to Section 302 of the Sarbanes-Oxley Act of 2002, filed herewith. |
|
32 |
Certifications Pursuant to Section 906 of the Sarbanes-Oxley Act of 2002, filed herewith. |
|
101.INS |
XBRL Instance Document |
|
101.SCH |
XBRL Taxonomy Extension Schema |
|
101.CAL |
XBRL Taxonomy Extension Calculation |
|
101.DEF |
XBRL Taxonomy Extension Definition |
|
101.LAB |
XBRL Taxonomy Extension Labels |
|
101.PRE |
XBRL Taxonomy Extension Presentation |
43
Pursuant to the requirements of the Securities Exchange Act of 1934, the Registrant has duly caused this report to be signed on its behalf by the undersigned thereunto duly authorized.
READING INTERNATIONAL, INC.
Date:November 12, 2014
By: /s/ James J. Cotter, Jr.
James J. Cotter, Jr.
Chief Executive Officer
Date:November 12, 2014
By: /s/ Andrzej Matyczynski
Andrzej Matyczynski
Chief Financial Officer
44
EXHIBIT 31.1
PURSUANT TO SECTION 302 OF THE SARBANES-OXLEY ACT OF 2002
I, James J. Cotter, Jr., certify that:
|
1) |
I have reviewed this quarterly report on Form 10-Q of Reading International, Inc.; |
|
2) |
Based on my knowledge, this quarterly report does not contain any untrue statement of a material fact or omit to state a material fact necessary to make the statements made, in light of the circumstances under which such statements were made, not misleading with respect to the period covered by this quarterly report; |
|
3) |
Based on my knowledge, the financial statements and other financial information included in this quarterly report fairly present in all material respects the financial condition, results of operations and cash flows of the registrant as of, and for, the periods presented in this quarterly report; |
|
4) |
The registrant's other certifying officer and I are responsible for establishing and maintaining disclosure controls and procedures (as defined in Exchange Act Rules 13a-15(e) and 15d-15(e)) and internal control over financial reporting (as defined in Exchange Act Rules 13a-15(f) and 15d-15(f)) for the registrant and we have: |
|
a) |
designed such disclosure controls and procedures to ensure that material information relating to the registrant, including its consolidated subsidiaries, is made known to us by others within those entities, particularly during the period in which this quarterly report is being prepared; |
|
b) |
designed such internal control over financial reporting, or caused such internal control over financial reporting to be designed under our supervision, to provide reasonable assurance regarding the reliability of financial reporting and the preparation of financial statements for external purposes in accordance with generally accepted accounting principles; |
|
c) |
evaluated the effectiveness of the registrant's disclosure controls and procedures as of the end of the period covered by this report based on such evaluation; and |
|
d) |
presented in this quarterly report our conclusions about the effectiveness of the disclosure controls and procedures based on our evaluation as of the Evaluation Date; |
|
5) |
The registrant's other certifying officer and I have disclosed, based on our most recent evaluation, to the registrant's auditors and the audit committee of registrant's board of directors (or persons performing the equivalent function): |
|
a) |
all significant deficiencies in the design or operation of internal controls which could adversely affect the registrant's ability to record, process, summarize and report financial data and have identified for the registrant's auditors any material weaknesses in internal controls; and |
|
b) |
any fraud, whether or not material, that involves management or other employees who have a significant role in the registrant's internal controls; and |
|
6) |
The registrant's other certifying officer and I have indicated in this quarterly report whether or not there were significant changes in internal controls or in other factors that could significantly affect internal controls subsequent to the date of our most recent evaluation, including any corrective actions with regard to significant deficiencies and material weaknesses. |
By:/s/ James J. Cotter, Jr.
James J. Cotter, Jr.
Chief Executive Officer
November 12, 2014
45
EXHIBIT 31.2
CERTIFICATIONS
PURSUANT TO SECTION 302 OF THE SARBANES-OXLEY ACT OF 2002
I, Andrzej Matyczynski, certify that:
|
1) |
I have reviewed this quarterly report on Form 10-Q of Reading International, Inc.; |
|
2) |
Based on my knowledge, this quarterly report does not contain any untrue statement of a material fact or omit to state a material fact necessary to make the statements made, in light of the circumstances under which such statements were made, not misleading with respect to the period covered by this quarterly report; |
|
3) |
Based on my knowledge, the financial statements and other financial information included in this quarterly report fairly present in all material respects the financial condition, results of operations and cash flows of the registrant as of, and for, the periods presented in this quarterly report; |
|
4) |
The registrant's other certifying officer and I are responsible for establishing and maintaining disclosure controls and procedures (as defined in Exchange Act Rules 13a-15(e) and 15d-15(e)) and internal control over financial reporting (as defined in Exchange Act Rules 13a-15(f) and 15d-15(f)) for the registrant and we have: |
|
a) |
designed such disclosure controls and procedures to ensure that material information relating to the registrant, including its consolidated subsidiaries, is made known to us by others within those entities, particularly during the period in which this quarterly report is being prepared; |
|
b) |
designed such internal control over financial reporting, or caused such internal control over financial reporting to be designed under our supervision, to provide reasonable assurance regarding the reliability of financial reporting and the preparation of financial statements for external purposes in accordance with generally accepted accounting principles; |
|
c) |
evaluated the effectiveness of the registrant's disclosure controls and procedures as of the end of the period covered by this report based on such evaluation; and |
|
d) |
presented in this quarterly report our conclusions about the effectiveness of the disclosure controls and procedures based on our evaluation as of the Evaluation Date; |
|
5) |
The registrant's other certifying officer and I have disclosed, based on our most recent evaluation, to the registrant's auditors and the audit committee of registrant's board of directors (or persons performing the equivalent function): |
|
a) |
all significant deficiencies in the design or operation of internal controls which could adversely affect the registrant's ability to record, process, summarize and report financial data and have identified for the registrant's auditors any material weaknesses in internal controls; and |
|
b) |
any fraud, whether or not material, that involves management or other employees who have a significant role in the registrant's internal controls; and |
|
6) |
The registrant's other certifying officer and I have indicated in this quarterly report whether or not there were significant changes in internal controls or in other factors that could significantly affect internal controls subsequent to the date of our most recent evaluation, including any corrective actions with regard to significant deficiencies and material weaknesses. |
By:/s/ Andrzej Matyczynski
Andrzej Matyczynski
Chief Financial Officer
November 12, 2014
46
EXHIBIT 32
CERTIFICATION PURSUANT TO
18 U.S.C. SECTION 1350,
AS ADOPTED PURSUANT TO
SECTION 906 OF THE SARBANES-OXLEY ACT OF 2002
Each of the undersigned hereby certifies, in his capacity as an officer of Reading International, Inc. (the “Company”), for purposes of 18 U.S.C. Section 1350, as adopted pursuant to Section 906 of the Sarbanes-Oxley Act of 2002, that to the best of his knowledge:
|
· |
The Quarterly Report of the Company on Form 10-Q for the period ended September 30, 2014 as filed with the Securities and Exchange Commission fully complies with the requirements of Section 13(a) and 15(d), as applicable, of the Securities Exchange Act of 1934; and |
|
· |
The information contained in such report fairly presents, in all material respects, the financial condition and results of operation of the Company. |
A signed original of this written statement required by Section 906 has been provided to the Company and will be retained by the Company and furnished to the Securities and Exchange Commission or its staff upon request.
Dated: November 12, 2014
/s/ James J. Cotter, Jr.
Name:James J. Cotter, Jr.
Title:Chief Executive Officer
/s/ Andrzej Matyczynski
Name:Andrzej Matyczynski
Title:Chief Financial Officer
47
Exhibit 3.1
CERTIFICATE OF AMENDMENT AND RESTATEMENT
OF
ARTICLES OF INCORPORATION
OF
READING INTERNATIONAL, INC.
A Nevada Corporation
The undersigned hereby certifies as follows:
|
1. He is the duly elected and acting Secretary of Reading International, Inc., a Nevada corporation (the “Corporation”). |
|
2. On March 7, 2013, the Board of Directors of the Corporation unanimously approved the amendment and restatement of the Corporation’s articles of incorporation (the “Articles”), pursuant to Section 78.385 of the Nevada Revised Statutes (“NRS”). |
|
3. On May 16, 2013, upon the recommendation of the Board of Directors of the Corporation, the proposed amendment to the Articles was submitted to the stockholders of the Corporation. The stockholders of the Corporation’s $.01 par value Class B Voting common stock (“Class B Common Stock”) were entitled to vote on the amendment, with the amendment to the Articles requiring the affirmative vote of a majority of the outstanding Class B Common Stock. The holders of a majority of Class B Common Stock voted in favor of the amendment to Article IV to add Section 4.7, requiring the Corporation to obtain stockholder approval to engage in any transaction(s), involving the sale, issuance or potential issuance of the Corporation’s Class B Common Stock. The Corporation, having received the approval required for the amendment, incorporates the amended provision of the Articles in the Amended and Restated Articles of Incorporation attached hereto. |
|
4. Article IV, Capital Stock, is hereby amended to include Section 4.7, such section to read in full as follows: |
4.7Certain Issuances of Preferred Stock. The Corporation shall not, without the approval or ratification of the holders of a majority of the outstanding shares of Class B Voting Common Stock, engage in any transaction or series of related transactions, involving the sale, issuance or potential issuance by the Corporation of shares of any class of Preferred Stock (or securities convertible into or exchangeable for shares of any class of Preferred Stock) having voting rights, other than voting rights with respect to the approval of any change in the rights, privileges or preferences of such class of Preferred Stock.
|
1. The Corporation’s Articles are hereby amended and restated to read in full as follows: |
48
AMENDED AND RESTATED
ARTICLES OF INCORPORATION
OF
READING INTERNATIONAL, INC.
A NEVADA CORPORATION
ARTICLE I
NAME
The name of the corporation is Reading International, Inc. (the “Corporation”).
ARTICLE II
RESIDENT AGENT AND REGISTERED OFFICE
This section was intentionally omitted.
ARTICLE III
PURPOSE
The purpose of the Corporation is to engage in any lawful act or activity for which corporations may be organized under the NRS.
ARTICLE IV
CAPITAL STOCK
4.1Number of Authorized Shares; Par Value. The aggregate number of shares which the Corporation shall have authority to issue is one hundred forty million (140,000,000) shares to be designated respectively as “Class A Non-Voting Common Stock,” “Class B Voting Common Stock” and “Preferred Stock” divided as follows:
|
(a) |
Class A Non-Voting Common Stock. The total number of authorized shares of Class A Non-Voting Common Stock shall be one hundred million (100,000,000) shares with the par value of $.01 per share. |
|
(b) |
Class B Voting Common Stock. The total number of authorized shares of Class B Voting Common Stock shall be twenty million (20,000,000) shares with the par value of $.01 per share. |
|
(c) |
Preferred Stock. The total number of authorized shares of Preferred Stock shall be twenty million (20,000,000) shares with the par value of $.01 per share. |
|
(d) |
Increase or Decrease in Authorized Shares. The total number of authorized shares of Class A Non-Voting Common Stock, Class B Voting Common Stock or Preferred Stock may be increased or decreased (but not below the number of shares thereof then outstanding) by the affirmative vote of the holders of a majority of the stock of the Corporation entitled to vote. |
|
4.2 Class A Non-Voting Common Stock Voting Rights. Class A Non-Voting Common Stock shall have no voting rights; provided, however, that the holders of the Class A Non-Voting Common Stock will be entitled to vote as a separate class on any amendments to the Articles of Incorporation or any merger which would adversely affect their rights, privileges or preferences, or any liquidation or dissolution in which such holders would receive securities with rights, privileges or preferences less beneficial than those held by them as holders of Class A Non-Voting Common Stock. |
49
|
4.3 Class B Voting Common Stock Voting Rights. The holders of the Class B Voting Common Stock shall be entitled to one vote per one share of Class B Voting Common Stock on all matters submitted to the stockholders of the Corporation for a vote. |
|
4.4 Other Rights, Preferences and Privileges of Class A Non-Voting Common Stock and Class B Voting Common Stock. Except as otherwise specifically set forth herein with respect to voting, all shares of Class A Non-Voting Common Stock and Class B Voting Common Stock shall have the same rights, preferences and privileges with respect to dividends, distributions, or any liquidation or dissolution of the Corporation. |
|
4.5 Preferred Stock. The Preferred Stock may be issued at any time or from time to time, in any one or more series, and any such series shall be comprised of such number of shares and may have such voting powers, whole or limited, or no voting powers, and such designations, preferences and relative, participating, optional or other special rights and qualifications, limitations or restrictions thereof, including liquidation preferences, as shall be stated and expressed in the resolution or resolutions of the board of directors of the Corporation, the board of directors being hereby expressly vested with such power and authority to the full extent now or hereafter permitted by law. |
|
4.6 Certain Issuances of Class B Voting Common Stock. The Corporation shall not, without the approval or ratification of the holders of a majority of the outstanding shares of Class B Voting Common Stock, engage in any transaction, or series of related transactions, involving the sale, issuance or potential issuance by the Corporation of shares of Class B Voting Common Stock (or securities convertible into or exchangeable for shares of Class B Voting Common Stock) equal to 5% or more of the shares of Class B Voting Common Stock as of the date of such sale or issuance; provided, however, that this Section 4.6 shall not apply to the sale or issuance of shares of Class B Voting Common Stock pursuant to the exercise of stock options outstanding as of the date this Section 4.6 is made part of the Amended and Restated Articles of Incorporation of the Corporation. |
4.7. Certain Issuances of Preferred Stock: The Corporation shall not, without the approval or ratification of the holders of a majority of the outstanding shares of Class B Voting Common Stock, engage in any transaction or series of related transactions, involving the sale, issuance or potential issuance by the Corporation of shares of any class of Preferred Stock (or securities convertible into or exchangeable for shares of any class of Preferred Stock) having voting rights, other than voting rights with respect to the approval of any change in the rights, privileges or preferences of such class of Preferred Stock.
50
ARTICLE V
DIRECTORS
The business and affairs of the Corporation shall be managed by or under the direction of the board of directors, which initially shall consist of one director. Provided that the Corporation has at least one director, the number of directors may at any time or times be increased or decreased as provided in the bylaws; provided, however that the number of directors shall not exceed ten.
ARTICLE VI
BYLAWS
In furtherance and not in limitation of the powers conferred upon the board of directors of the Corporation by the NRS, the board of directors shall have the power to alter, amend, change, add to and repeal, from time to time, the bylaws of the Corporation, subject to the rights of the stockholders entitled to vote with respect thereto to alter, amend, change, add to and repeal the bylaws adopted by the directors of the Corporation.
ARTICLE VII
ELECTION OF DIRECTORS
Unless the bylaws of the Corporation provide for the division of the directors into classes and except as may otherwise be provided in the bylaws of the Corporation, all directors shall be elected to hold office until their respective successors are elected and qualified, or until their earlier resignation or removal, at the annual meeting of the stockholders, whether telephonic or not, within or without the State of Nevada or by written consent and such election need not be by written ballot.
ARTICLE VIII
SALE OF ASSETS
In furtherance of the powers conferred on the stockholders of the Corporation by the NRS, the stockholders of the Corporation shall have the power to vote on any proposed sale of substantially all of the Corporation’s assets.
ARTICLE IX
AMENDMENT OF ARTICLES OF INCORPORATION
In the event the board of directors of the Corporation determines that it is in the Corporation’s best interest to amend these Articles of Incorporation, the board of directors shall adopt a resolution setting forth the proposed amendment and declaring its advisability and submit the matter to the stockholders entitled to vote thereon for the consideration thereof in accordance with the provisions of the NRS and these Articles of Incorporation. In the resolution setting forth the proposed amendment, the board of directors may insert a provision allowing the board of directors to later abandon the amendment, without concurrence by the stockholders, after the amendment has received stockholder approval but before the amendment is filed with the Nevada Secretary of State.
51
ARTICLE XI
ACQUISITIONS OF CONTROLLING INTEREST
The Corporation elects not to be governed by the provisions of Chapters 78.378 to 78.3793, inclusive, of the NRS pertaining to acquisitions of controlling interest.
ARTICLE XII
COMBINATIONS WITH INTERESTED STOCKHOLDERS
The Corporation elects not to be governed by the provisions of Chapters 78.411 to 78.444, inclusive, of the NRS pertaining to combinations with interested stockholders.
ARTICLE XIII
DIRECTORS’ AND OFFICERS’ LIABILITY
A director or officer of the Corporation shall not be personally liable to this Corporation or its stockholders for damages for breach of fiduciary duty as a director or officer, but this Article shall not eliminate or limit the liability of a director or officer for (i) acts or omissions which involve intentional misconduct, fraud or a knowing violation of law or (ii) the unlawful payment of distributions. Any repeal or modification of this Article by the stockholders of the Corporation shall be prospective only, and shall not adversely affect any limitation on the personal liability of a director or officer of the Corporation for acts or omissions prior to such repeal or modification.
In Witness Whereof, the undersigned has executed this Certificate of Amendment and Restatement as of the 27th day of June, 2014.
_/s/ James J. Cotter_____________________________
James J. Cotter, Jr., President
52