Attached files
| file | filename |
|---|---|
| EX-32 - EX-32 - READING INTERNATIONAL INC | rdi-20180331xex32.htm |
| EX-31.2 - EX-31.2 - READING INTERNATIONAL INC | rdi-20180331xex31_2.htm |
| EX-31.1 - EX-31.1 - READING INTERNATIONAL INC | rdi-20180331xex31_1.htm |
SECURITIES AND EXCHANGE COMMISSION
Washington, D.C. 20549
__________________________________
FORM 10-Q
(Mark One)
|
|
|
|
☑ |
QUARTERLY REPORT PURSUANT TO SECTION 13 OR 15(D) OF THE SECURITIES EXCHANGE ACT OF 1934 |
For the quarterly period ended: March 31, 2018
OR
|
☐ |
TRANSITION REPORT PURSUANT TO SECTION 13 OR 15(D) OF THE SECURITIES EXCHANGE ACT OF 1934 |
For the transition period from ___________ to ___________
Commission file number 1-8625

READING INTERNATIONAL, INC.
(Exact name of Registrant as specified in its charter)
|
NEVADA (State or other jurisdiction of incorporation or organization) |
95-3885184 (IRS Employer Identification No.) |
|
5995 Sepulveda Boulevard, Suite 300 Culver City, CA (Address of principal executive offices) |
90230 (Zip Code) |
Registrant’s telephone number, including area code: (213) 235-2240
Indicate by check mark whether the registrant: (1) has filed all reports required to be filed by Section 13 or 15(d) of the Securities Exchange Act of 1934 during the preceding twelve months (or for such shorter period that the registrant was required to file such reports), and (2) has been subject to such filing requirements for the past 90 days. Yes ☑ No ☐
Indicate by check mark whether the registrant has submitted electronically and posted on its corporate Web site, if any, every Interactive Data File required to be submitted and posted pursuant to Rule 405 of Regulation S-T (§ 232.405 of this chapter) during the preceding 12 months (or for such shorter period that the registrant was required to submit and post such files). Yes ☑ No ☐
Indicate by check mark whether the registrant is a large accelerated filer, an accelerated filer, a non-accelerated filer, smaller reporting company, or an emerging growth company. See definitions of “large accelerated filer”, “accelerated filer”, “smaller reporting company,” and “emerging growth company” in Rule 12b-2 of the Exchange Act.
(Check one): Large accelerated filer ☐ Accelerated filer ☑ Non-accelerated filer ☐ Smaller reporting company ☐
Emerging growth company ☐
If an emerging growth company, indicate by check mark if the registrant has elected not to use the extended transition period for complying with any new or revised financial accounting standards provided pursuant to Section 13(a) of the Exchange Act. ☐
Indicate by check mark whether the registrant is a shell company (as defined in Rule 12b-2 of the Exchange Act). Yes ☐ No ☑
Indicate the number of shares outstanding of each of the issuer’s classes of common stock, as of the latest practicable date. As of May 10, 2018, there were 21,296,438 shares of Class A Nonvoting Common Stock, $0.01 par value per share and 1,680,590 shares of Class B Voting Common Stock, $0.01 par value per share outstanding.
1
READING INTERNATIONAL, INC. AND SUBSIDIARIES
TABLE OF CONTENTS
|
|
Page |
|
3 |
|
|
3 |
|
|
3 |
|
|
4 |
|
|
Consolidated Statements of Comprehensive Income (Unaudited) |
5 |
|
6 |
|
|
7 |
|
|
Item 2 – Management’s Discussion and Analysis of Financial Condition and Results of Operations |
28 |
|
Item 3 – Quantitative and Qualitative Disclosure about Market Risk |
44 |
|
45 |
|
|
46 |
|
|
46 |
|
|
46 |
|
|
Item 2 - Unregistered Sales of Equity Securities and Use of Proceeds |
46 |
|
46 |
|
| 47 | |
| 47 | |
|
48 |
|
|
Certifications |
|
2
PART 1 – FINANCIAL INFORMATION
READING INTERNATIONAL, INC.
CONSOLIDATED BALANCE SHEETS
(Unaudited; U.S. dollars in thousands, except share information)
|
|
||||
|
|
||||
|
|
March 31, |
December 31, |
||
|
|
2018 |
2017 |
||
|
ASSETS |
(unaudited) |
|||
|
Current Assets: |
||||
|
Cash and cash equivalents |
$ |
8,668 |
$ |
13,668 |
|
Receivables |
8,922 | 13,050 | ||
|
Inventory |
1,342 | 1,432 | ||
|
Prepaid and other current assets |
6,713 | 5,325 | ||
|
Total current assets |
25,645 | 33,475 | ||
|
Operating property, net |
269,578 | 264,724 | ||
|
Investment and development property, net |
66,944 | 61,254 | ||
|
Investment in unconsolidated joint ventures |
5,283 | 5,304 | ||
|
Goodwill |
20,383 | 20,276 | ||
|
Intangible assets, net |
8,227 | 8,542 | ||
|
Deferred tax asset, net |
24,834 | 24,908 | ||
|
Other assets |
5,661 | 4,543 | ||
|
Total assets |
$ |
426,555 |
$ |
423,026 |
|
LIABILITIES AND STOCKHOLDERS' EQUITY |
||||
|
Current Liabilities: |
||||
|
Accounts payable and accrued liabilities |
$ |
27,101 |
$ |
34,359 |
|
Film rent payable |
7,708 | 13,511 | ||
|
Debt – current portion |
10,544 | 8,109 | ||
|
Taxes payable – current |
3,031 | 2,938 | ||
|
Deferred current revenue |
8,276 | 9,850 | ||
|
Other current liabilities |
9,515 | 11,679 | ||
|
Total current liabilities |
66,175 | 80,446 | ||
|
Debt – long-term portion |
108,322 | 94,862 | ||
|
Subordinated debt, net |
27,564 | 27,554 | ||
|
Noncurrent tax liabilities |
12,186 | 12,274 | ||
|
Other liabilities |
28,553 | 26,649 | ||
|
Total liabilities |
242,800 | 241,785 | ||
|
Commitments and contingencies (Note 13) |
||||
|
Stockholders’ equity: |
||||
|
Class A non-voting common stock, par value $0.01, 100,000,000 shares authorized, |
||||
|
33,082,295 issued and 21,295,031 outstanding at March 31, 2018, and |
|
232 |
|
231 |
|
Class B voting common stock, par value $0.01, 20,000,000 shares authorized and |
||||
|
1,680,590 issued and outstanding at March 31, 2018 and December 31, 2017 |
17 | 17 | ||
|
Nonvoting preferred stock, par value $0.01, 12,000 shares authorized and no issued |
||||
|
or outstanding shares at March 31, 2018 and December 31, 2017 |
-- |
-- |
||
|
Additional paid-in capital |
146,236 | 145,898 | ||
|
Retained earnings |
35,920 | 32,679 | ||
|
Treasury shares |
(23,223) | (22,906) | ||
|
Accumulated other comprehensive income |
20,241 | 20,991 | ||
|
Total Reading International, Inc. stockholders’ equity |
179,423 | 176,910 | ||
|
Noncontrolling interests |
4,332 | 4,331 | ||
|
Total stockholders’ equity |
183,755 | 181,241 | ||
|
Total liabilities and stockholders’ equity |
$ |
426,555 |
$ |
423,026 |
See accompanying Notes to the Unaudited Consolidated Financial Statements.
3
CONSOLIDATED STATEMENTS OF INCOME
(Unaudited; U.S. dollars in thousands, except per share data)
|
|
||||
|
|
Three Months Ended |
|||
|
|
March 31, |
March 31, |
||
|
|
2018 |
2017(1) |
||
|
Revenue |
|
|
|
|
|
Cinema |
$ |
72,255 |
$ |
66,560 |
|
Real estate |
|
3,567 |
|
2,894 |
|
Total revenue |
|
75,822 |
|
69,454 |
|
Costs and expenses |
|
|
|
|
|
Cinema |
|
(54,948) |
|
(51,782) |
|
Real estate |
|
(2,384) |
|
(2,036) |
|
Depreciation and amortization |
|
(5,250) |
|
(3,934) |
|
General and administrative |
|
(7,597) |
|
(6,174) |
|
Total costs and expenses |
|
(70,179) |
|
(63,926) |
|
Operating income |
|
5,643 |
|
5,528 |
|
Interest expense, net |
|
(1,594) |
|
(1,860) |
|
Other income (expense) |
|
(82) |
|
821 |
|
Income before income tax expense and equity earnings of unconsolidated joint ventures |
|
3,967 |
|
4,489 |
|
Equity earnings of unconsolidated joint ventures |
|
257 |
|
255 |
|
Income before income taxes |
|
4,224 |
|
4,744 |
|
Income tax expense |
|
(1,155) |
|
(1,703) |
|
Net income |
$ |
3,069 |
$ |
3,041 |
|
Less: net income (loss) attributable to noncontrolling interests |
|
22 |
|
12 |
|
Net income attributable to Reading International, Inc. common shareholders |
$ |
3,047 |
$ |
3,029 |
|
Basic earnings per share attributable to Reading International, Inc. shareholders |
$ |
0.13 |
$ |
0.13 |
|
Diluted earnings per share attributable to Reading International, Inc. shareholders |
$ |
0.13 |
$ |
0.13 |
|
Weighted average number of shares outstanding–basic |
|
22,967,237 |
|
23,168,351 |
|
Weighted average number of shares outstanding–diluted |
|
23,132,989 |
|
23,465,176 |
See accompanying Notes to the Unaudited Consolidated Financial Statements.
(1) Certain prior year balances have been reclassified to conform to the 2018 presentation (see Note 2 – Summary of Significant Accounting Policies – Reclassifications).
4
READING INTERNATIONAL, INC.
CONSOLIDATED STATEMENTS OF COMPREHENSIVE INCOME
(Unaudited; U.S. dollars in thousands)
|
|
|||||
|
|
Three Months Ended |
||||
|
|
March 31, |
March 31, |
|||
|
|
2018 |
2017(1) |
|||
|
Net income |
$ |
3,069 |
$ |
3,041 | |
|
Foreign currency translation (loss) gain |
(803) | 5,826 | |||
|
Other |
50 | 48 | |||
|
Comprehensive income |
2,316 | 8,915 | |||
|
Less: net income attributable to noncontrolling interests |
22 | 12 | |||
|
Less: comprehensive (loss) income attributable to noncontrolling interests |
(3) | 13 | |||
|
Comprehensive income attributable to Reading International, Inc. |
$ |
2,297 |
$ |
8,890 | |
See accompanying Notes to the Unaudited Consolidated Financial Statements.
(1) Certain prior year balances have been reclassified to conform to the 2018 presentation (see Note 2 – Summary of Significant Accounting Policies – Reclassifications).
5
READING INTERNATIONAL, INC.
CONSOLIDATED STATEMENTS OF CASH FLOWS
(Unaudited; U.S. dollars in thousands)
|
|
|||||
|
|
Three Months Ended |
||||
|
|
March 31, |
March 31, |
|||
|
|
2018 |
2017 |
|||
|
Operating Activities |
|||||
|
Net income |
$ |
3,069 |
$ |
3,041 | |
|
Adjustments to reconcile net income to net cash provided by operating activities: |
|||||
|
Equity earnings of unconsolidated joint ventures |
(257) | (255) | |||
|
Distributions of earnings from unconsolidated joint ventures |
236 | 220 | |||
|
Gain recognized on foreign currency transactions |
-- |
(825) | |||
|
Change in net deferred tax assets |
157 | 577 | |||
|
Depreciation and amortization |
5,250 | 3,934 | |||
|
Other amortization |
224 | 532 | |||
|
Stock based compensation expense |
379 | 166 | |||
|
Net changes in operating assets and liabilities: |
|||||
|
Receivables |
3,205 | 2,215 | |||
|
Prepaid and other assets |
(2,259) | (1,504) | |||
|
Payments for accrued pension |
(2,404) |
-- |
|||
|
Accounts payable and accrued expenses |
1,997 | (5,426) | |||
|
Film rent payable |
(5,790) | (1,710) | |||
|
Taxes payable |
150 | 44 | |||
|
Deferred revenue and other liabilities |
(1,505) | (698) | |||
|
Net cash provided by operating activities |
2,452 | 311 | |||
|
Investing Activities |
|||||
|
Demolition costs of operating property |
-- |
(2,458) | |||
|
Purchases of and additions to operating and investment properties |
(23,231) | (8,478) | |||
|
Change in restricted cash |
(260) | 12 | |||
|
Net cash used in investing activities |
(23,491) | (10,924) | |||
|
Financing Activities |
|||||
|
Repayment of long-term borrowings |
(9,707) | (12,875) | |||
|
Proceeds from borrowings |
25,998 | 16,119 | |||
|
Repurchase of Class A Nonvoting Common Stock |
(317) | (671) | |||
|
Proceeds from the exercise of stock options |
203 | 3 | |||
|
Noncontrolling interest contributions |
27 | 41 | |||
|
Noncontrolling interest distributions |
(43) | (77) | |||
|
Net cash provided by financing activities |
16,161 | 2,540 | |||
|
Effect of exchange rate changes on cash and cash equivalents |
(122) | 87 | |||
|
Net decrease in cash and cash equivalents |
(5,000) | (7,986) | |||
|
Cash and cash equivalents at January 1 |
13,668 | 19,017 | |||
|
Cash and cash equivalents at March 31 |
$ |
8,668 |
$ |
11,031 | |
|
Supplemental Disclosures |
|||||
|
Interest paid |
$ |
2,121 |
$ |
1,658 | |
|
Income taxes paid |
808 | 1,408 | |||
|
Non-Cash Transactions |
|||||
|
Additions to operating and investing properties through accrued expenses |
4,530 |
-- |
|||
See accompanying Notes to the Unaudited Consolidated Financial Statements.
6
READING INTERNATIONAL, INC.
NOTES TO CONSOLIDATED FINANCIAL STATEMENTS (Unaudited)
Note 1 – Description of Business and Segment Reporting
The Company
Reading International, Inc., a Nevada corporation (“RDI” and collectively with our consolidated subsidiaries and corporate predecessors, the “Company,” “Reading” and “we,” “us,” or “our”), was incorporated in 1999. Our businesses consist primarily of:
|
· |
the development, lease or ownership, and operation of multiplex cinemas in the United States, Australia, and New Zealand; and, |
|
· |
the development, ownership, and operation of retail and commercial real estate in Australia, New Zealand, and the United States. |
Business Segments
Reported below are the operating segments of the Company for which separate financial information is available and evaluated regularly by the Chief Executive Officer, the chief operating decision-maker of the Company. As part of our real estate activities, we hold undeveloped land in urban and suburban centers in New Zealand and the United States.
The table below summarizes the results of operations for each of our business segments for the quarter ended March 31, 2018 and 2017, respectively. Operating expense includes costs associated with the day-to-day operations of the cinemas and the management of rental properties, including our live theater assets.
|
|
Three Months Ended |
|||||
|
(Dollars in thousands) |
|
March 31, 2018 |
|
March 31, 2017 |
||
|
Revenue: |
||||||
|
Cinema exhibition |
$ |
72,255 |
$ |
66,560 | ||
|
Real estate |
5,958 | 4,497 | ||||
|
Inter-segment elimination |
(2,391) | (1,603) | ||||
|
|
$ |
75,822 |
$ |
69,454 | ||
|
Segment operating income: |
||||||
|
Cinema exhibition |
$ |
10,285 |
$ |
9,093 | ||
|
Real estate |
1,631 | 1,294 | ||||
|
|
$ |
11,916 |
$ |
10,387 | ||
A reconciliation of segment operating income to income before income taxes is as follows:
|
|
Three Months Ended |
|||||
|
(Dollars in thousands) |
March 31, 2018 |
March 31, 2017 |
||||
|
Segment operating income |
$ |
11,916 |
$ |
10,387 | ||
|
Unallocated corporate expense |
||||||
|
Depreciation and amortization expense |
(117) | (106) | ||||
|
General and administrative expense |
(6,156) | (4,753) | ||||
|
Interest expense, net |
(1,594) | (1,860) | ||||
|
Equity earnings of unconsolidated joint ventures |
257 | 255 | ||||
|
Other income (expense) |
(82) | 821 | ||||
|
Income before income tax expense |
$ |
4,224 |
$ |
4,744 | ||
Note 2 – Summary of Significant Accounting Policies
Basis of Consolidation
The accompanying consolidated financial statements include the accounts of the Company’s wholly-owned subsidiaries as well as majority-owned subsidiaries that the Company controls, and should be read in conjunction with the Company’s Annual Report on Form 10-K as of and for the year-ended December 31, 2017 (“2017 Form 10-K”). All significant intercompany balances and transactions have been eliminated on consolidation. These consolidated financial statements were prepared in accordance with accounting principles generally accepted in the United States of America (“U.S. GAAP”) for interim reporting with the instructions for Form 10-Q and Rule 10-01 of Regulation S-X of the Securities and Exchange Commission (“SEC”). As such, they do not include all information and footnotes required by U.S. GAAP for complete financial statements. We believe that we have included all normal and recurring adjustments necessary for a fair presentation of the results for the interim period. Operating results for the quarter ended March 31, 2018 are not necessarily indicative of the results that may be expected for the year ending December 31, 2018.
7
Use of Estimates
The preparation of consolidated financial statements in conformity with U.S. GAAP requires management to make estimates and assumptions that affect the amounts reported in the consolidated financial statements and footnotes thereto. Significant estimates include (i) projections we make regarding the recoverability and impairment of our assets (including goodwill and intangibles), (ii) valuations of our derivative instruments, (iii) recoverability of our deferred tax assets, (iv) estimation of breakage and redemption experience rates, which drive how we recognize breakage on our gift card and gift certificates, and revenue from our customer loyalty program, and (v) allocation of insurance proceeds to various recoverable components. Actual results may differ from those estimates.
Reclassifications
Certain reclassifications have been made in the March 31, 2017 comparative information in our consolidated financial statements and accompanying notes to conform to the 2018 presentation. These reclassifications relate to the following immaterial balances:
|
(i) |
net-off of interest income against interest expense in our consolidated statements of income; and, |
|
(ii) |
combination of certain components in our consolidated statements of comprehensive income into one line, “Others”. |
Recently Adopted and Issued Accounting Pronouncements
Adopted:
ASU 2014-09 Revenue from Contracts with Customers: On 1 January 2018, we adopted the new accounting standard ASC 606 Revenue from Contracts with Customers using the modified retrospective method. We recognized the cumulative effect of initially applying the new revenue standard as an adjustment to the opening balance of retained earnings. The comparative information has not been restated and continues to be reported under the accounting standards in effect for those periods. We expect the impact of the adoption of the new standard to be immaterial to our net income and cash flows from operations on an ongoing basis.
Our cinema and food and beverage revenue continues to be recognized upon sale and completion of the provision of the movie or performance, or delivery of food and beverage items. Where necessary, revenue is deferred until these obligations are discharged. Property rentals continue to be recognized on a straight line basis, and live theatre license fees continue to be based on a percentage of weekly ticket sales. Under the new standard, rewards owed to and points accrued by Members of our customer loyalty programs are held as deferred revenue. Revenue from unredeemed gift cards and certificates (known as “breakage” in our industry) is recognized in proportion to the pattern of rights exercised by the customer, when the Company expects that it is probable that a significant revenue reversal would not occur for any estimated breakage amounts.
The cumulative effect of the changes made to our consolidated January 1, 2018 balance sheet for the adoption of ASU 2014-09 Revenue from Contracts with Customers were as follows:
|
|
|
|
|
|
|
|
|
(Dollars in thousands) |
|
Balance at December 31, 2017 |
|
Adjustments due to ASU 2014-09 |
|
Balance at January 1, 2018 |
|
Assets |
|
|
|
|
|
|
|
Deferred income taxes |
|
24,908 |
|
(161) |
|
24,747 |
|
Liabilities |
|
|
|
|
|
|
|
Deferred current revenue |
|
9,850 |
|
(354) |
|
9,496 |
|
Stockholders' Equity |
|
|
|
|
|
|
|
Retained earnings |
|
32,679 |
|
194 |
|
32,873 |
8
In accordance with the new revenue standard requirements, the disclosure of the impact of adoption on our consolidated income statement and balance sheet was as follows:
|
|
|
|
|
|
|
|
|
(Dollars in thousands) |
|
As Reported, March 31, 2018 |
|
Balances Without Adoption of ASC 606 |
|
Effect of change Higher / (Lower) |
|
Revenues |
|
|
|
|
|
|
|
Cinema |
|
72,255 |
|
71,995 |
|
260 |
|
Income tax expense |
|
(1,155) |
|
(1,084) |
|
(71) |
|
Net income |
|
3,047 |
|
2,858 |
|
189 |
|
|
|
|
|
|
|
|
|
(Dollars in thousands) |
|
As Reported |
|
Balances Without Adoption of ASC 606 |
|
Effect of change Higher / (Lower) |
|
Assets |
|
|
|
|
|
|
|
Deferred income taxes |
|
24,834 |
|
24,905 |
|
(71) |
|
Liabilities |
|
|
|
|
|
|
|
Deferred current revenue |
|
8,276 |
|
8,536 |
|
(260) |
|
Stockholders' Equity |
|
|
|
|
|
|
|
Retained earnings |
|
35,920 |
|
35,731 |
|
189 |
Refer to Note 1: - Description of the Business and Segment Reporting for a disaggregation of our revenue sources.
Cinema Segment
Sales of cinema tickets and food and beverage (“F&B”) revenue: recognized when sold and collected, either in cash or by credit card at our theatre locations and through our online selling channels. Sales of bulk or advanced tickets are deferred and recognized as revenue when the related screening for that ticket is shown.
Gift Card/Certificate Programs: We run gift card and gift certificate programs in all three countries. Revenue from these programs is deferred and recognized when redeemed. From January 1, 2018, we recognize revenue on unredeemed cards and certificates using the proportional method, whereby breakage revenue is recognized in proportion to the pattern of rights exercised by the customer when the Company expects that it is probable that a significant revenue reversal would not occur for any estimated breakage amounts. This is based on a breakage ‘experience rate’, which is determined by historical redemption data.
Loyalty revenue: We run a customer loyalty program in every country. From January 1, 2018, a component of revenue from Members of our Loyalty Programs relating to the earning of loyalty rewards is deferred until such a time as Members redeem rewards, or until we believe the likelihood of redemption by the Member is remote. Deferral is based on the progress made toward the next reward, the fair value of that reward, and the likelihood of redemption, determined by historical redemption data.
Advertising revenue: recognized based on contractual arrangements or relevant admissions information, as appropriate.
Real Estate
Live Theatre License Fees: We lease theatre space to third party production companies. Revenue is recognized in accordance with the license agreement, and is recorded on a weekly basis after the performance of a show has occurred.
Property Rentals: we contractually retain substantially all of the risks and benefits of ownership of our real estate properties and therefore, we account for our tenant leases as operating leases. Accordingly, rental revenue is recognized on a straight-line basis over the lease term.
On January 1, 2018, the Company adopted ASU 2016-18, Statement of Cash Flows, Topic 230: Restricted Cash, a consensus of the FASB Emerging Issues Task Force. This new guidance requires that amounts generally described as restricted cash and cash equivalents should be combined with unrestricted cash and cash equivalents when reconciling the beginning and end of period balances on the statement of cash flows. This guidance has no material effect on our consolidated statement of cash flows.
On January 1, 2018, the Company adopted ASU 2016-15, Statement of Cash Flows (Topic 230): Classification of Certain Cash Receipts and Cash Payments). The amendments covered in this ASU are improvements to current GAAP, as such amendments will provide guidance with respect to eight (8) specific cash flow classification issues, thereby reducing the current and potential future diversity in practice. Adoption of this guidance has no material effect on our consolidated statement of cash flows.
9
On January 1, 2018, the Company adopted ASU 2017-07, Compensation—Retirement Benefits (Topic 715): Improving the Presentation of Net Periodic Pension Cost and Net Periodic Postretirement Benefit Cost. The amendments in this Update (i) require that an employer disaggregate the service cost component from the other components of net benefit cost, and (ii) provide explicit guidance on how to present the service cost component and the other components of net benefit cost in the income statement and (iii) allow only the service cost component of net benefit cost to be eligible for capitalization. The new guidance has no material impact on our consolidated financial statements.
Also, on January 1, 2018, the Company adopted ASU 2017-01, Business Combinations (Topic 805): Clarifying the Definition of a Business. This ASU provides that when substantially all of the fair value of the gross assets acquired (or disposed of) is concentrated in a single identifiable asset or a group of similar identifiable assets, the asset is not a “business”, thus reducing the number of transactions that need further evaluation for business combination. The new guidance has no material impact on our current consolidated financial statements, and we do not expect the ASU 2017-01 to be applicable to our consolidated financial statements in the near term unless we enter into a definitive business acquisition transaction.
On January 1, 2017, the Company adopted ASU 2016-09, Compensation—Stock Compensation (Topic 718): Improvements to Employee Share-Based Payment Accounting. This new guidance, which became effective for fiscal years beginning after December 15, 2016, provides for the simplification of several aspects of the accounting for share-based payment transactions, including (i) accounting for tax benefits in excess of compensation cost and tax deficiencies, (ii) accounting for forfeitures, and (iii) classification on the statement of cash flows. The only significant impact of the adoption of this new guidance to us is the immediate recognition of excess tax benefits (or “windfalls”) and tax deficiencies (or “shortfalls”) in the consolidated statement of income. Previously, (i) tax windfalls were recorded in additional paid-in capital (“APIC”) in the consolidated statement of stockholders’ equity and (ii) tax shortfalls were recorded in APIC to the extent of previous windfalls and then to the consolidated statement of income.
Issued:
|
v |
ASUs Effective 2019 and Beyond |
|
· |
New Lease Accounting Model (ASU 2016-02, Leases: Topic 842) |
This new guidance, which becomes effective for us by January 1, 2019, establishes a right-of-use ("ROU") model that requires a lessee to record a ROU asset and a lease liability on the balance sheet for all leases with terms longer than 12 months. Leases will be classified as either finance or operating, with classification affecting the pattern of expense recognition in the income statement. A modified retrospective transition approach is required for lessees with capital and operating leases existing at, or entered into after, the beginning of the earliest comparative period presented in the financial statements, with certain practical expedients available. While we are still evaluating the impact of our pending adoption of this new standard on our consolidated financial statements, we expect that upon adoption we will recognize ROU assets and lease liabilities and that the amounts could be material since a majority of our operating cinemas are leased. We have developed an implementation plan. Significant implementation matters that we are addressing include (i) assessment of lease population, (ii) determination of appropriate discount rate to use and (ii) assessment of renewal options to include in the initial lease term. While the Company is continuing to assess the effect of adoption, the Company currently believes the most significant changes relate to the recognition of new ROU assets and lease liabilities on its balance sheet for cinemas currently subject to operating leases.
|
· |
Goodwill Impairment Simplification (ASU 2017-04, Intangibles – Goodwill and Other (Topic 350): Simplifying the Test for Goodwill Impairment) |
Issued by FASB in January 2017, this new guidance removes the second step of the two-step impairment test for measuring goodwill and is to be applied on a prospective basis only. The new guidance is effective for the Company on January 1, 2020, including interim periods within the year of adoption. Early adoption is permitted for interim or annual goodwill impairment tests performed on testing dates after January 1, 2017. We do not anticipate the adoption of ASU 2017-04 to have a material impact on our consolidated financial statements.
Note 3 – Operations in Foreign Currency
We have significant assets in Australia and New Zealand. Historically, we have conducted our Australian and New Zealand operations (collectively “foreign operations”) on a self-funding basis where we use cash flows generated by our foreign operations to pay for the expense of foreign operations. Our Australian and New Zealand assets and liabilities are translated from their functional currencies of Australian dollar (“AU$”) and New Zealand dollar (“NZ$”), respectively, to the U.S. dollar based on the exchange rate as of March 31, 2018. The carrying value of the assets and liabilities of our foreign operations fluctuates as a result of changes in the exchange rates between the functional currencies of the foreign operations and the U.S. dollar. The translation adjustments are accumulated in the Accumulated Other Comprehensive Income in the Consolidated Balance Sheets.
10
Likewise, historically, our overall operating strategy has been to conduct business mostly on a self-funding basis (except for funds used to pay an appropriate share of our U.S. corporate overhead). As such, we have not historically used derivative financial instruments to hedge against the risk of foreign currency exposure. However, in certain circumstances, we may decide to move funds between jurisdictions where circumstances encouraged us to do so from an overall economic standpoint. Going forward, particularly in light of recent tax law changes, we intend to take a more global view of our financial resources, and to be more flexible in making use of resources from one jurisdiction in other jurisdictions.
As of December 31, 2016, we determined certain historically long-term intercompany loans from the U.S. Parent Company to our Australian subsidiary should be considered short-term. Subsequently, on September 1, 2017, we determined that the remaining AU$21.1 million in such long-term intercompany loans should be considered as short-term as well. This loan was paid in full on December 21, 2017. As a result of the above, we recognized foreign exchange gain on these intercompany advances based on the relative strengthening of the Australian dollar to the U.S. dollar in the amounts of $0 and $825,000 for the three months ended March 31, 2018 and March 2017 respectively in our Consolidated Statements of Income.
Presented in the table below are the currency exchange rates for Australia and New Zealand:
|
|
Foreign Currency / USD |
|||||
|
|
As of and for the quarter ended |
|
As of and for the twelve months ended |
|
As of and for the quarter ended |
|
|
|
March 31, 2018 |
December 31, 2017 |
March 31, 2017 |
|||
|
Spot Rate |
||||||
|
Australian Dollar |
0.7690 |
0.7815 |
0.7638 |
|||
|
New Zealand Dollar |
0.7239 |
0.7100 |
0.7001 |
|||
|
Average Rate |
||||||
|
Australian Dollar |
0.7861 |
0.7670 |
0.7584 |
|||
|
New Zealand Dollar |
0.7275 |
0.7111 |
0.7122 |
|||
Note 4 – Earnings Per Share
Basic earnings per share (“EPS”) is calculated by dividing the net income attributable to the Company’s common stockholders by the weighted average number of common shares outstanding during the period. Diluted EPS is calculated by dividing the net income attributable to the Company’s common stockholders by the weighted average number of common and common equivalent shares outstanding during the period and are calculated using the treasury stock method for equity-based compensation awards.
The following table sets forth the computation of basic and diluted EPS and a reconciliation of the weighted average number of common and common equivalent shares outstanding:
|
|
Three Months Ended |
|||||
|
(Dollars in thousands, except share data) |
March 31, 2018 |
March 31, 2017 |
||||
|
Numerator: |
||||||
|
Net income attributable to RDI common stockholders |
$ |
3,047 |
$ |
3,029 | ||
|
Denominator: |
||||||
|
Weighted average number of common stock – basic |
22,967,237 | 23,168,351 | ||||
|
Weighted average dilutive impact of awards |
165,752 | 296,825 | ||||
|
Weighted average number of common stock – diluted |
23,132,989 | 23,465,176 | ||||
|
Basic EPS attributable to RDI common stockholders |
$ |
0.13 |
$ |
0.13 | ||
|
Diluted EPS attributable to RDI common stockholders |
$ |
0.13 |
$ |
0.13 | ||
|
Awards excluded from diluted EPS |
-- |
-- |
||||
Our weighted average number of common stock - basic decreased primarily as a result of our repurchase of 386,462 shares of Class A Common Stock during the 12 months ended March 31, 2018, pursuant to our current stock repurchase program offset by the issuance of shares due to the exercise of share options and vesting of restricted stock units.
11
Note 5 – Property and Equipment
Operating Property, net
As of March 31, 2018 and December 31, 2017, property associated with our operating activities is summarized as follows:
|
|
March 31, |
December 31, |
||||
|
(Dollars in thousands) |
2018 |
2017 |
||||
|
Land |
$ |
76,125 |
$ |
76,457 | ||
|
Building and improvements |
152,350 | 153,232 | ||||
|
Leasehold improvements |
48,469 | 48,481 | ||||
|
Fixtures and equipment |
152,116 | 145,033 | ||||
|
Construction-in-progress |
29,477 | 26,000 | ||||
|
Total cost |
458,537 | 449,203 | ||||
|
Less: accumulated depreciation |
(188,959) | (184,479) | ||||
|
Operating property, net |
$ |
269,578 |
$ |
264,724 | ||
Depreciation expense for operating property was $4.7 million for the quarter ended March 31, 2018 and $3.5 million for the quarter ended March 31, 2017.
Investment and Development Property, net
As of March 31, 2018 and December 31, 2017, our investment and development property is summarized below:
|
|
March 31, |
December 31, |
||||
|
(Dollars in thousands) |
2018 |
2017 |
||||
|
Land |
$ |
25,283 |
$ |
25,025 | ||
|
Building |
1,900 | 1,900 | ||||
|
Construction-in-progress (including capitalized interest) |
39,761 | 34,329 | ||||
|
Investment and development property |
$ |
66,944 |
$ |
61,254 | ||
Construction-in-Progress – Operating and Investing Properties
Construction-in-Progress balances are included in both our operating and development properties. The balances of our major projects along with the movements for the three months ended March 31, 2018 are shown below:
|
(Dollars in thousands) |
Balance, December 31, 2017 |
Additions during the period(1) |
Completed during the period |
Foreign currency translation |
Balance, March 31, 2018 |
|||||
|
Union Square development |
$ |
29,223 |
$ |
5,486 |
$ |
-- |
$ |
-- |
$ |
34,709 |
|
Newmarket Property development |
370 | 756 | (636) | (8) | 482 | |||||
|
Courtenay Central development |
4,676 |
- |
-- |
91 | 4,767 | |||||
|
Cinema developments and improvements |
19,015 | 5,123 | (2,879) | 54 | 21,313 | |||||
|
Other real estate projects |
7,045 | 1,020 |
-- |
(98) | 7,967 | |||||
|
Total |
$ |
60,329 |
$ |
12,385 |
$ |
(3,515) |
$ |
39 |
$ |
69,238 |
(1) Includes capitalized interest of $335,000 for the quarter ended March 31, 2018.
Real Estate Transactions
Sale of Landholding in Burwood, Australia
On December 14, 2017, we received $28.1 million (AU$36.6 million) representing the final payment with respect to the $50.6 million (AU$64.9 million) sale price of our property in Burwood, Victoria, Australia. Previously, partial payments of $16.6 million (AU$21.8 million) and $5.9 million (AU$6.5 million) were received on June 19, 2017 and May 23, 2014.
12
Note 6 – Investments in Unconsolidated Joint Ventures
Our investments in unconsolidated joint ventures are accounted for under the equity method of accounting.
The table below summarizes our active investment holdings in two (2) unconsolidated joint ventures as of March 31, 2018 and December 31, 2017:
|
|
March 31, |
December 31, |
||||||
|
(Dollars in thousands) |
Interest |
2018 |
2017 |
|||||
|
Rialto Cinemas |
50.0% |
$ |
1,279 |
$ |
1,186 | |||
|
Mt. Gravatt |
33.3% |
4,004 | 4,118 | |||||
|
Total investments |
$ |
5,283 |
$ |
5,304 | ||||
For the quarter ended March 31, 2018 and 2017, the recognized share of equity earnings from our investments in unconsolidated joint ventures are as follows:
|
|
Quarter Ended |
|||||||
|
|
March 31, |
March 31, |
||||||
|
(Dollars in thousands) |
2018 |
2017 |
||||||
|
Rialto Cinemas |
$ |
70 |
$ |
39 | ||||
|
Mt. Gravatt |
187 | 216 | ||||||
|
Total equity earnings |
$ |
257 |
$ |
255 | ||||
Note 7 – Goodwill and Intangible Assets
The table below summarizes goodwill by business segment as of March 31, 2018 and December 31, 2017.
|
(Dollars in thousands) |
Cinema |
Real Estate |
Total |
||||||
|
Balance at December 31, 2017 |
$ |
15,052 |
$ |
5,224 |
$ |
20,276 | |||
|
Foreign currency translation adjustment |
107 |
-- |
107 | ||||||
|
Balance at March 31, 2018 |
$ |
15,159 |
$ |
5,224 |
$ |
20,383 | |||
The Company is required to test goodwill and other intangible assets for impairment on an annual basis and, if current events or circumstances require, on an interim basis. Our next annual evaluation of goodwill and other intangible assets is scheduled during the fourth quarter of 2018. To test the impairment of goodwill, the Company compares the fair value of each reporting unit to its carrying amount, including the goodwill, to determine if there is potential goodwill impairment. A reporting unit is generally one level below the operating segment. As of March 31, 2018, we were not aware of any events indicating potential impairment of goodwill had occurred.
The tables below summarize intangible assets other than goodwill as of March 31, 2018 and December 31, 2017, respectively.
|
|
As of March 31, 2018 |
|||||||||||
|
(Dollars in thousands) |
Beneficial Leases |
Trade Name |
Other Intangible Assets |
Total |
||||||||
|
Gross carrying amount |
$ |
28,836 |
$ |
7,255 |
$ |
1,139 |
$ |
37,230 | ||||
|
Less: Accumulated amortization |
(23,511) | (5,004) | (488) | (29,003) | ||||||||
|
Net intangible assets other than goodwill |
$ |
5,325 |
$ |
2,251 |
$ |
651 |
$ |
8,227 | ||||
|
|
As of December 31, 2017 |
|||||||||||
|
(Dollars in thousands) |
Beneficial Leases |
Trade Name |
Other Intangible Assets |
Total |
||||||||
|
Gross carrying amount |
$ |
28,860 |
$ |
7,254 |
$ |
1,139 |
$ |
37,253 | ||||
|
Less: Accumulated amortization |
(23,292) | (4,936) | (483) | (28,711) | ||||||||
|
Net intangible assets other than goodwill |
$ |
5,568 |
$ |
2,318 |
$ |
656 |
$ |
8,542 | ||||
13
Beneficial leases are amortized over the life of the lease up to 30 years, trade names are amortized based on the accelerated amortization method over its estimated useful life of 45 years, and other intangible assets are amortized over their estimated useful lives of up to 30 years (except for transferrable liquor licenses, which are indefinite-lived assets). The table below summarizes the amortization expense of intangible assets for the quarter ended March 31, 2018.
|
|
Quarter Ended |
|||||
|
|
March 31, |
March 31, |
||||
|
(Dollars in thousands) |
2018 |
2017 |
||||
|
Beneficial lease amortization |
$ |
207 |
$ |
304 | ||
|
Other amortization |
93 | 102 | ||||
|
Total intangible assets amortization |
$ |
300 |
$ |
406 | ||
Note 8 – Prepaid and Other Assets
Prepaid and other assets are summarized as follows:
|
|
March 31, |
December 31, |
||||
|
(Dollars in thousands) |
2018 |
2017 |
||||
|
Prepaid and other current assets |
||||||
|
Prepaid expenses |
$ |
2,486 |
$ |
1,625 | ||
|
Prepaid rent |
1,101 | 1,055 | ||||
|
Prepaid taxes |
633 | 653 | ||||
|
Income taxes receivable |
2,187 | 1,686 | ||||
|
Deposits |
243 | 243 | ||||
|
Investment in marketable securities |
46 | 46 | ||||
|
Restricted cash |
17 | 17 | ||||
|
Total prepaid and other current assets |
$ |
6,713 |
$ |
5,325 | ||
|
Other non-current assets |
||||||
|
Straight-line rent |
3,421 | 2,564 | ||||
|
Other non-cinema and non-rental real estate assets |
1,134 | 1,134 | ||||
|
Investment in Reading International Trust I |
838 | 838 | ||||
|
Long-term deposits |
8 | 7 | ||||
|
Long-term restricted cash |
260 |
-- |
||||
|
Total other non-current assets |
$ |
5,661 |
$ |
4,543 | ||
Note 9 – Income Taxes
On December 22, 2017, the U.S. Tax Cuts and Jobs Act of 2017 (the “Tax Act”) was signed into law. The Tax Act significantly changed the U.S. corporate income tax law by lowering the statutory corporate tax rate from 35% to 21%, imposing a one-time mandatory repatriation tax on earnings of foreign subsidiaries, and changing how foreign earnings are subject to U.S. tax. Due to the timing of the enactment and the complexity involved in applying the provisions of the Tax Act, we made reasonable estimates of the effects and recorded provisional amounts in our financial statements as of December 31, 2017, pursuant to the guidance of the U.S. Securities and Exchange Commission Staff Accounting Bulletin No. 118. We recorded income tax expense in 2017 for the impact of the Tax Act of approximately $13.0 million. This 2017 net amount is primarily comprised of $8.3 million from re-measurement of federal net deferred tax assets resulting from the reduction in the U.S. statutory corporate tax rate and a provisional amount of $4.7 million from the one-time mandatory repatriation tax on deferred earnings of our foreign subsidiaries. As we complete our analysis of the Tax Act, collect and prepare necessary data, and interpret any additional guidance issued by the U.S. Treasury Department and the IRS, we may make adjustments to the provisional amount. Those adjustments may materially impact our provision for income taxes in the period in which the adjustments are made. The accounting for the tax effects of the Tax Act will be completed in 2018.
The interim provision for income taxes is different from the amount determined by applying the U.S. federal statutory rate to consolidated income before taxes. The differences are attributable to foreign tax rate differential, unrecognized tax benefits, and foreign tax credit. Our effective tax rate was 27.3% and 35.9% for the three months ended March 31, 2018 and 2017, respectively. The change between 2018 and 2017 is primarily related to the reduction of U.S. statutory corporate tax rate as the result of the Tax Act, foreign tax credit, partially offset by a change in the foreign tax rate differential.
14
Note 10 – Debt
The Company’s borrowings at March 31, 2018 and December 31, 2017, net of deferred financing costs and including the impact of interest rate derivatives on effective interest rates, are summarized below:
|
|
|
|
|
|
|
|
|
|
|
|
|
|
|
|
|
|
|
|
|
|
As of March 31, 2018 |
|||||||||||||
|
(Dollars in thousands) |
|
Maturity Date |
|
Contractual Facility |
|
Balance, Gross |
|
Balance, Net(3) |
|
Stated Interest Rate |
|
Effective Interest Rate (1) |
||||
|
Denominated in USD |
|
|
|
|
|
|
|
|
|
|
|
|
|
|
|
|
|
|
Trust Preferred Securities (USA) |
|
April 30, 2027 |
|
$ |
27,913 |
|
$ |
27,913 |
|
$ |
27,564 |
|
5.77% |
|
5.77% |
|
|
Bank of America Credit Facility (USA) |
|
November 28, 2019 |
|
|
55,000 |
|
|
31,000 |
|
|
31,000 |
|
4.88% |
|
4.88% |
|
|
Bank of America Line of Credit (USA) |
|
October 31, 2019 |
|
|
5,000 |
|
|
-- |
|
|
-- |
|
4.84% |
|
4.84% |
|
|
Bank of America digital projector loan (USA) |
|
December 28, 2019 |
|
|
4,031 |
|
|
4,031 |
|
|
4,031 |
|
5.00% |
|
5.00% |
|
|
Cinema 1, 2, 3 Term Loan (USA)(4) |
|
August 31, 2019 |
|
|
19,396 |
|
|
19,396 |
|
|
19,037 |
|
3.25% |
|
3.25% |
|
|
Minetta & Orpheum Theatres Loan (USA)(4) |
|
June 1, 2018 |
|
|
7,500 |
|
|
7,500 |
|
|
7,488 |
|
4.44% |
|
4.44% |
|
|
U.S. Corporate Office Term Loan (USA)(4) |
|
January 1, 2027 |
|
|
9,665 |
|
|
9,665 |
|
|
9,531 |
|
4.64% / 4.44% |
|
4.61% |
|
|
Union Square Construction Financing (USA)(4) |
|
December 29, 2019 |
|
|
57,500 |
|
|
9,155 |
|
|
6,326 |
|
6.06% / 11.88% |
|
6.79% |
|
Denominated in foreign currency ("FC") (2) |
|
|
|
|
|
|
|
|
|
|
|
|
|
|
|
|
|
|
NAB Corporate Term Loan (AU) |
|
June 28, 2019 |
|
|
51,139 |
|
|
41,525 |
|
|
41,453 |
|
3.78% |
|
3.78% |
|
|
Westpac Bank Corporate (general/non-construction) Credit Facility (NZ) |
|
December 31, 2019 |
|
|
25,337 |
|
|
-- |
|
|
- |
|
3.70% |
|
3.70% |
|
|
Westpac Bank Corporate (construction) Credit Facility (NZ) |
|
December 31, 2018 |
|
|
13,030 |
|
|
-- |
|
|
-- |
|
3.70% |
|
3.70% |
|
|
|
$ |
275,511 |
|
|
150,185 |
|
|
146,430 |
|
|
|
|
|||
(1) Both interest rate derivatives associated with the Trust Preferred Securities and Bank of America Credit Facility expired in October 2017 so the effective interest rate no longer applies as of December 31, 2017
(2) The contractual facilities and outstanding balances of the FC-denominated borrowings were translated into U.S. dollars based on the applicable exchange rates as of March 31, 2018.
(3) Net of deferred financing costs amounting to $3.8 million.
(4) The loan for our Minetta & Orpheum Theatres was obtained from Santander Bank. The term loan for our Cinema 1,2,3 Theatre was refinanced during the third quarter of 2016 with Valley National Bank. The term loan, which is collateralized by our new U.S Corporate Headquarters office building, was obtained with Citizens Asset Finance, Inc. In December 2016, we completed the negotiation of the construction financing for our Union Square redevelopment project, $8.0 million of which was advanced from the total construction loan limit of $57.5 million on December 29, 2016. As of March 31, 2018 an additional $1.2 million had been advanced.
|
|
|
|
|
|
|
|
|
|
|
|
|
|
|
|
|
|
|
|
|
|
As of December 31, 2017 |
|||||||||||||
|
(Dollars in thousands) |
|
Maturity Date |
|
Contractual Facility |
|
Balance, Gross |
|
Balance, Net(3) |
|
Stated Interest Rate |
|
Effective Interest Rate (1) |
||||
|
Denominated in USD |
|
|
|
|
|
|
|
|
|
|
|
|
|
|
|
|
|
|
Trust Preferred Securities (USA) |
|
April 30, 2027 |
|
$ |
27,913 |
|
$ |
27,913 |
|
$ |
27,554 |
|
5.38% |
|
5.38% |
|
|
Bank of America Credit Facility (USA) |
|
November 28, 2019 |
|
|
55,000 |
|
|
31,000 |
|
|
31,000 |
|
4.57% |
|
4.57% |
|
|
Bank of America Line of Credit (USA) |
|
October 31, 2019 |
|
|
5,000 |
|
|
-- |
|
|
-- |
|
4.57% |
|
4.57% |
|
|
Cinema 1, 2, 3 Term Loan (USA) |
|
September 1, 2019 |
|
|
19,500 |
|
|
19,500 |
|
|
19,105 |
|
3.25% |
|
3.25% |
|
|
Minetta & Orpheum Theatres Loan (USA) |
|
June 1, 2018 |
|
|
7,500 |
|
|
7,500 |
|
|
7,470 |
|
4.13% |
|
4.13% |
|
|
U.S. Corporate Office Term Loan (USA)(4) |
|
January 1, 2027 |
|
|
9,719 |
|
|
9,719 |
|
|
9,582 |
|
4.64% / 4.44% |
|
4.61% |
|
|
Union Square Construction Financing (USA) |
|
December 29, 2019 |
|
|
57,500 |
|
|
8,000 |
|
|
5,033 |
|
5.81% |
|
5.81% |
|
Denominated in FC (2) |
|
|
|
|
|
|
|
|
|
|
|
|
|
|
|
|
|
|
NAB Corporate Loan Facility (AU) |
|
June 30, 2019 |
|
|
51,970 |
|
|
30,869 |
|
|
30,781 |
|
3.66% |
|
3.66% |
|
|
Westpac Bank Corporate (general/non-construction) Credit Facility (NZ) |
|
December 31, 2019 |
|
|
24,850 |
|
|
-- |
|
|
-- |
|
3.70% |
|
3.70% |
|
|
Westpac Bank Corporate (construction) Credit Facility (NZ) |
|
December 31, 2018 |
|
|
12,780 |
|
|
-- |
|
|
-- |
|
3.70% |
|
3.70% |
|
|
|
|
|
|
$ |
271,732 |
|
$ |
134,501 |
|
$ |
130,525 |
|
|
|
|
(1) Both interest rate derivatives associated with the Trust Preferred Securities and Bank of America Credit Facility expired in October 2017 so the effective interest rate no longer applies as of December 31, 2017.
(2) The contractual facilities and outstanding balances of the FC-denominated borrowings were translated into U.S. dollars based on the applicable exchange rates as of December 31, 2016.
(3) Net of deferred financing costs amounting to $4.0 million.
(4) The loan for our Minetta & Orpheum Theatres was obtained from Santander Bank. The term loan for our Cinema 1,2,3 Theatre was refinanced during the third quarter of 2016 with Valley National Bank. The term loan, which is collateralized by our new U.S Corporate Headquarters office building, was obtained with Citizens Asset Finance, Inc.. In December 2016, we completed the negotiation of the construction financing for our Union Square redevelopment project, $8.0 million of which was advanced from the total construction loan limit of $57.5 million on December 29, 2016. As of December 31, 2017 no further advances had been made under this financing agreement.
Our loan arrangements are presented, net of the deferred financing costs, on the face of our consolidated balance sheet as follows:
|
|
Dollars in thousands |
|||||
|
Balance Sheet Caption |
March 31, 2018 |
December 31, 2017 |
||||
|
Debt - current portion |
$ |
10,544 |
$ |
8,109 | ||
|
Debt - long-term portion |
108,322 | 94,862 | ||||
|
Subordinated debt |
27,564 | 27,554 | ||||
|
Total borrowings |
$ |
146,430 |
$ |
130,525 | ||
15
Union Square Construction Financing
On December 29, 2016, we closed on our new construction finance facilities totaling $57.5 million to fund the non-equity portion of the anticipated construction costs of the redevelopment of our property at 44 Union Square in New York City. The combined facilities consist of $50 million in aggregate loans (comprised of three loan tranches) from Bank of the Ozarks and a $7.5 million mezzanine loan from Tammany Mezz Investor, LLC, an affiliate of Fisher Brothers. At December 29, 2016, Bank of the Ozarks advanced $8.0 million to repay the then existing $8.0 million loan with East West Bank. As of March 31, 2018, an additional $1.2 million had been advanced under the mezzanine loan facility.
Presented in the table below is the breakdown of the Union Square construction financing as of March 31, 2018:
|
|
|
|
|
|
|
|
|
|
|
|
|
|
|
|
|
|
|
(Dollars in thousands) |
|
|
|
|
Facility Limits and Advances |
|
|
|
|
|||||||
|
Financing Component |
|
Lender |
|
Facility Limit |
|
Advanced-to- Date |
|
Remaining Facility |
|
Interest Rate(1) |
|
Maturity Date(2) |
||||
|
Mezzanine loan |
|
Tammany Mezz Investor LLC |
|
$ |
7,500 |
|
$ |
1,155 |
|
$ |
6,345 |
|
Greater of (i) 10.50% and (ii) Adjusted LIBOR + 10% |
|
December 29, 2019 |
|
|
Senior loan, including building and project loan |
|
Bank of the Ozarks |
|
|
50,000 |
|
|
8,000 |
|
|
42,000 |
|
Greater of (i) 4.75% and (ii) Adjusted LIBOR + 4.25% |
|
December 29, 2019 |
|
|
Total Union Square Financing |
|
|
|
$ |
57,500 |
|
$ |
9,155 |
|
$ |
48,345 |
|
|
|
|
|
(1) Not to exceed the New York State maximum lawful borrowing rate, which typically is 16%.
(2) Allowable for up to two (2) extension request options, one (1) year for each extension request.
Cinema 1,2,3 Term Loan
On August 31, 2016, Sutton Hill Properties LLC (“SHP”), a 75% subsidiary of RDI, refinanced its $15.0 million Santander Bank term loan with a different lender, Valley National Bank. This new $20.0 million loan is collateralized by our Cinema 1,2,3 property and bears an interest rate of 3.25% per annum, with principal instalments and accruing interest paid monthly. The new loan matures on September 1, 2019, with a one-time option to extend the maturity date for another year.
Bank of America Credit Facility
On March 3, 2016, we amended our $55.0 million credit facility with Bank of America to permit real property acquisition loans. This amendment provides that the consolidated leverage ratio be reduced by 0.25% from the established levels in the credit facility during the period of such borrowing, with a repayment term based on the earlier of the eighteen months from the date of such borrowing or the maturity date of the credit agreement. Such modification was not considered substantial in accordance with U.S. GAAP.
Bank of America Line of Credit
In October 2016, the term of this line of credit was extended to October 31, 2019. Such modification was not considered to be substantial under US GAAP.
Westpac Bank Corporate Credit Facility
On December 15, 2017, we extended the maturity of the 1st tranche (general/non-construction credit line) of our Westpac Corporate Credit Facility to December 31, 2019. Prior to this on April 26, 2017, we extended the maturity of our entire Westpac Corporate Credit Facility, $38.4 million (NZ$53.0 million) to December 31, 2018, from March 31, 2018. We are currently working on a longer-term renewal of our Westpac Corporate Credit Facility which will replace the existing facility.
U.S. Corporate Office Term Loan
On December 13, 2016, we obtained a ten-year $8.4 million mortgage loan on our new Los Angeles Corporate Headquarters at a fixed annual interest rate of 4.64%. This loan provided for a second loan upon completion of certain improvements. On June 26, 2017, we obtained a further $1.5 million under this provision at a fixed annual interest rate of 4.44%.
Bank of America Digital Projector Loan
On February 5, 2018, we purchased our U.S. cinema projectors, which had previously been held on operating leases, using a $4.6 million loan from Bank of America. This loan carries an interest rate of 5%.
16
Note 11 – Other Liabilities
Other liabilities are summarized as follows:
|
(Dollars in thousands) |
March 31, 2018 |
December 31, 2017 |
||||
|
Current liabilities |
||||||
|
Lease liability |
$ |
5,900 |
$ |
5,900 | ||
|
Liability for demolition costs |
2,836 | 2,781 | ||||
|
Accrued pension |
684 | 2,907 | ||||
|
Security deposit payable |
76 | 91 | ||||
|
Other |
19 |
-- |
||||
|
Other current liabilities |
$ |
9,515 |
$ |
11,679 | ||
|
Other liabilities |
||||||
|
Straight-line rent liability |
$ |
15,529 |
$ |
13,444 | ||
|
Lease make-good provision |
5,687 | 5,648 | ||||
|
Accrued pension |
5,047 | 5,228 | ||||
|
Environmental reserve |
1,656 | 1,656 | ||||
|
Deferred revenue - real estate |
16 | 18 | ||||
|
Acquired leases |
163 | 186 | ||||
|
Other |
455 | 469 | ||||
|
Other liabilities |
$ |
28,553 |
$ |
26,649 | ||
On August 29, 2014, the Supplemental Executive Retirement Plan (“SERP”) that has been effective since March 1, 2007, was ended and replaced in accordance with the terms of a pension annuity. As a result of the termination of the SERP program, the accrued pension liability of $7.6 million was reversed and replaced with this pension annuity liability of $7.5 million. The valuation of the liability is based on the present value of $10.2 million discounted at a rate of 4.25% over a 15- year term, resulting in a monthly payment of $57,000. The discount rate of 4.25% has been applied since 2014 to determine the net periodic benefit cost and plan benefit obligation and is expected to be used in future years. The discounted value of $2.7 million (which is the difference between the estimated payout of $10.2 million and the present value of $7.5 million) as of August 29, 2014 will be amortized and expensed based on the 15-year term. In addition, the accumulated actuarial loss of $3.1 million recorded, as part of other comprehensive income will also be amortized based on the 15-year term.
In February 2018 we made a payment of $2.4 million relating to the annuity representing payments for the 42 months outstanding at the time. Monthly ongoing payments of $57,000 are now being made.
As a result of the above, included in our current and non-current liabilities are accrued pension costs of $5.7 million at March 31, 2018. The benefits of our pension plans are fully vested and therefore no service costs were recognized for the quarter ended March 31, 2018 and 2017. Our pension plans are unfunded.
During the quarter ended March 31, 2018, the interest cost was $45,000 and actuarial loss was $52,000. During the quarter ended March 31, 2017, the interest cost was $45,000, and actuarial loss was $52,000.
Note 12 – Accumulated Other Comprehensive Income
The following table summarizes the changes in each component of accumulated other comprehensive income attributable to RDI:
|
(Dollars in thousands) |
Foreign Currency Items |
|
Unrealized Gain (Losses) on Available-for-Sale Investments |
|
Accrued Pension Service Costs |
|
Total |
||||
|
Balance at January 1, 2018 |
$ |
23,575 |
$ |
8 |
$ |
(2,592) |
$ |
20,991 | |||
|
Net current-period other comprehensive (loss) income |
(800) | (2) | 52 | (750) | |||||||
|
Balance at March 31, 2018 |
$ |
22,775 |
$ |
6 |
$ |
(2,540) |
$ |
20,241 | |||
17
Note 13 – Commitments and Contingencies
Litigation General
We are currently involved in certain legal proceedings and, as required, have accrued estimates of probable and estimable losses for the resolution of these claims, including legal costs.
|
· |
Where we are the plaintiffs, we accrue legal fees as incurred on an on-going basis and make no provision for any potential settlement amounts until received. In Australia, the prevailing party is usually entitled to recover its attorneys’ fees, which recoveries typically work out to be approximately 60% of the amounts actually spent where first-class legal counsel is engaged at customary rates. Where we are a plaintiff, we have likewise made no provision for the liability for the defendant’s attorneys' fees in the event we are determined not to be the prevailing party. |
|
· |
Where we are the defendants, we accrue for probable damages that insurance may not cover as they become known and can be reasonably estimated. In our opinion, any claims and litigation in which we are currently involved are not reasonably likely to have a material adverse effect on our business, results of operations, financial position, or liquidity. It is possible, however, that future results of the operations for any particular quarterly or annual period could be materially affected by the ultimate outcome of the legal proceedings. From time-to-time, we are involved with claims and lawsuits arising in the ordinary course of our business that may include contractual obligations, insurance claims, tax claims, employment matters, and anti-trust issues, among other matters. |
All of these matters require significant judgments based on the facts known to us. These judgments are inherently uncertain and can change significantly when additional facts become known. We provide accruals for matters that have probable likelihood of occurrence and can be properly estimated as to their expected negative outcome. We do not record expected gains until the proceeds are received by us. However, we typically make no accruals for potential costs of defense, as such amounts are inherently uncertain and dependent upon the scope, extent and aggressiveness of the activities of the applicable plaintiff.
Environmental and Asbestos Claims on Reading Legacy Operations
Certain of our subsidiaries were historically involved in railroad operations, coal mining, and manufacturing. Also, certain of these subsidiaries appear in the chain-of-title of properties that may suffer from pollution. Accordingly, certain of these subsidiaries have, from time-to-time, been named in and may in the future be named in various actions brought under applicable environmental laws. Also, we are in the real estate development business and may encounter from time-to-time unanticipated environmental conditions at properties that we have acquired for development. These environmental conditions can increase the cost of such projects and adversely affect the value and potential for profit of such projects. We do not currently believe that our exposure under applicable environmental laws is material in amount.
From time-to-time, there are claims brought against us relating to the exposure of former employees of our railroad operations to asbestos and coal dust. These are generally covered by an insurance settlement reached in September 1990 with our insurance providers. However, this insurance settlement does not cover litigation by people who were not our employees and who may claim second-hand exposure to asbestos, coal dust and/or other chemicals or elements now recognized as potentially causing cancer in humans. Our known exposure to these types of claims, asserted or probable of being asserted, is not material.
Cotter Jr. Related Litigation Matters
The following table provides a list of legal matters and current status relating to James J. Cotter, Jr’s (“Cotter, Jr.”) employment termination, Mr. Cotter, Jr.’s subsequent derivative action brought against the Company and our Directors alleging, among other things, that such termination violated the fiduciary duties of such Directors, and Mr. Cotter, Jr.’s efforts to cause a change of control of the Company, with detailed discussions following:
18
|
|
|
|
|
|
|
|
|
|
|
|
|
Description |
Plaintiff/ Claimant |
Filed with |
Current Status |
|
|
James J. Cotter, Jr. Legal Cases |
|
|||
|
Cotter, Jr. Derivative Litigation against all Directors on matters other than the handling by the Directors of the Patton Vision Unsolicited Indication of Interest |
Cotter, Jr. |
Nevada District Court |
Claims against Directors Judy Codding, William Gould, Edward L. Kane, Douglas McEachern and Michael Wrotniak were dismissed on December 29, 2017; court trial for the remaining claim was postponed at Cotter, Jr.’s request. The Court put the trial on a trial stack with the trial set to begin on July 9, 2018. It is anticipated that various summary judgment motions being brought by the Company and the Defendant Directors will be heard before the case is tried. |
|
|
Cotter, Jr. Derivative Litigation against all Directors re handling by the Directors of unsolicited indication of interest by Patton Vision, LLC. |
Cotter, Jr. |
Nevada District Court |
Dismissed as to all Directors on December 29, 2017. |
|
|
Direct Case against the Company seeking reimbursement and advancement of attorney’s fees incurred with respect to the Employment Arbitration |
Cotter, Jr. |
Nevada District Court |
Summary judgment entered in favor of the Company on October 3, 2016. |
|
|
Employment Arbitration |
RDI |
American Arbitration Association |
While RDI is the named claimant, the matter relates to Mr. Cotter, Jr’s claims for compensation related to his termination. In Discovery Phase: hearing anticipated in October, 2018. |
|
|
T2 Partners Derivative Complaint |
T2 Partners Management |
Nevada District Court |
Settled on October 6, 2016, without the payment of any monetary consideration or any reimbursement of attorney’s fees. |
|
James J. Cotter, Jr., Litigation Matters.
The James J. Cotter, Jr. Derivative Litigation: On June 12, 2015, the Board of Directors terminated James J. Cotter, Jr. as the President and Chief Executive Officer of our Company. That same day, Mr. Cotter, Jr. filed a lawsuit, styled as both an individual and a derivative action, and titled “James J. Cotter, Jr., individually and derivatively on behalf of Reading International, Inc. vs. Margaret Cotter, et al.” Case No,: A-15-719860-V, Dept. XI, against our Company and each of our then sitting Directors (Ellen Cotter, Margaret Cotter, Guy Adams, William Gould, Edward Kane, Douglas McEachern, and Tim Storey) in the Eighth Judicial District Court of the State of Nevada for Clark County (the “Nevada District Court”). Since that date, our Company has been engaged in ongoing litigation with Mr. Cotter, Jr. with respect to his claims against our Directors. Mr. Cotter, Jr. has over this period of time twice amended his complaint, removing his individual claims and withdrawing his claims against Tim Storey (but reserving the right to reinstitute such claims), adding claims relating to actions taken by our Board since the filing of his original complaint, and adding as defendants two of our directors who were not on our Board at the time of his termination: Judy Codding and Michael Wrotniak. Mr. Cotter, Jr.’s lawsuit, as amended from time to time, is referred to herein as the “Cotter Jr. Derivative Action” and his complaint, as amended from time to time, is referred to herein as the “Cotter Jr. Derivative Complaint.” The defendant directors named in the Cotter Jr. Derivative Complaint, from time to time, are referred to herein as the “Defendant Directors.”
The Cotter Jr. Derivative Complaint alleges among other things, that the Defendant Directors breached their fiduciary duties to the Company by terminating Mr. Cotter, Jr. as President and Chief Executive Officer, continuing to make use of the Executive Committee that has been in place for more than the past ten years (but which no longer includes Mr. Cotter, Jr. as a member), making allegedly potentially misleading statements in our Company’s press releases and filings with the SEC, paying certain compensation to Ellen Cotter, allowing the Cotter Estate to make use of Class A Stock to pay for the exercise of certain long outstanding stock options to acquire 100,000 shares of Class B Stock (the “Cotter Estate Stock Options”) held of record by the Cotter Estate and determined by the Nevada District Court to be assets of the Cotter Estate, and allowing Ellen Cotter and Margaret Cotter to vote the 100,000 shares of Class B Stock issued upon the exercise of such options, appointing Ellen Cotter as President and Chief Executive Officer, appointing Margaret Cotter as Executive Vice President-Real Estate Management and Development-NYC, and the way in which the Board handled an unsolicited indication of interest made by a third party to acquire all of the stock of our Company. In the lawsuit, Mr. Cotter, Jr. seeks reinstatement as President and Chief Executive Officer, a declaration that Ellen Cotter and Margaret Cotter may not vote the above referenced 100,000 shares of Class B Stock, and alleges as damages fluctuations in the price for our Company’s shares after the announcement of his termination as President and Chief Executive Officer and certain unspecified damages to our Company’s reputation.
19
On December 29, 2017, the Nevada District Court entered its final order memorializing its determination on December 11, 2017 that Mr. Cotter, Jr., had failed to raise any genuine issue of material fact relating to the disinterestedness and/or independence of Directors Codding, Gould, Kane, McEachern and Wrotniak (the “Dismissed Directors”), and dismissing with prejudice all claims against them. Mr. Cotter, Jr., has appealed this final order to the Nevada Supreme Court. In that same final order, the Nevada District Court also memorialized its dismissal of all claims based upon what the Defendant Directors action in regard to what Mr. Cotter, Jr., characterize as an “offer” by Patton Vision, LLC (“Patton Vision”), to purchase all of the outstanding stock of our Company. The Nevada District Court ruled that Mr. Cotter, Jr., had failed “to show damages relating to an unenforceable, unsolicited, nonbinding offer.”
Also on December 29, 2017, the Board of Directors, by votes of 5 to 1 with 3 directors abstaining, voted to ratify the decision made by the Board of Directors on June 12, 2015, to terminate Mr. Cotter, Jr., as our Company’s President and Chief Executive Officer and to ratify the decision made by the Board’s Compensation and Stock Options Committee on September 21, 2015, to permit the Estate of James J. Cotter, Sr., to use shares of Class A Common Stock to exercise the Cotter Estate Stock Options. Voting in favor of the ratification motions were all of the Dismissed Directors: Directors Codding, Gould, Kane, McEachern and Wrotniak. Voting against ratification was the Plaintiff Mr. Cotter, Jr.. Abstaining were directors Guy Adams, Ellen Cotter and Margaret Cotter, who are now the only remaining Defendant Directors.
The trial of the remaining issues in the case against the remaining defendants in that case, which was scheduled to begin on January 8, 2018, was continued by the Nevada District Court at the request of Mr. Cotter, Jr. Mr. Cotter, Jr.’s request for a continuance was brought before the Nevada District Court on Monday, January 8, 2018, and came as a surprise to our Company and the Defendant Directors since Plaintiff counsel had advised the Nevada District Court as late as the afternoon of Friday, January 5, 2018, that Mr. Cotter, Jr. was prepared to begin jury selection that following Monday. Mr. Cotter, Jr.’s motion request for a continuance was based on an asserted medical condition (the nature of which has not been disclosed to our Company or the Defendant Directors). A new trial date of July 9, 2018 has been set. The remaining Defendant Directors and our Company have filed motions for summary judgment on a variety of theories, including ratification, which it is anticipated will be heard before trial.
On April 13, 2018, our Board of Directors appointed a special litigation committee (the “Special Litigation Committee”) comprised of our Lead Independent Director, William Gould (who will serve as chair) and Director Judy Codding to review the Cotter Jr. Derivative Litigation and determine whether the continued prosecution of that case is in the best interests of our Company.
The James J. Cotter, Jr., Fee Reimbursement Litigation: Mr. Cotter, Jr. also brought a direct action in the Nevada District Court (James J. Cotter, Jr. v. Reading International, Inc., a Nevada corporation; Does 1-100 and Roe Entities, 1-100, inclusive, Case No. A-16-735305-B) seeking advancement of attorney’s fees incurred in the Cotter Jr. Employment Arbitration. Summary judgment was entered against Mr. Cotter, Jr. with respect to that direct action on October 3, 2016.
The James J. Cotter, Jr., Employment Arbitration: In addition, our Company is in arbitration with Mr. Cotter, Jr. (Reading International, Inc. v. James J. Cotter, AAA Case No. 01-15-0004-2384, filed July 2015) (the “Cotter Jr. Employment Arbitration”) seeking declaratory relief and defending claims asserted by Mr. Cotter, Jr. On January 20, 2017, Mr. Cotter Jr. filed a First Amended Counter-Complaint which includes claims of breach of contract, contractual indemnification, retaliation, wrongful termination in violation of California Labor Code § 1102.5, wrongful discharge, and violations of California Code of Procedure § 1060 based on allegations of unlawful and unfair conduct. Mr. Cotter, Jr. seeks compensatory damages estimated by his counsel at more than $1.2 million, plus unquantified special and punitive damages, penalties, interest and attorney’s fees. On April 9, 2017, the Arbitrator granted without leave to amend the Company’s motion to dismiss Mr. Cotter, Jr.’s claims for retaliation, violation of labor code §1102.5 and wrongful discharge in violation of public policy. The Cotter Jr. Employment Arbitration is in the discovery phase.
The T2 Derivative Litigation: For a period of approximately 12 months, between August 6, 2015 and August 4, 2016, our Company and our directors other than Mr. Cotter, Jr. were subject to a derivative lawsuit filed in the Nevada District Court captioned T2 Partners Management, LP, a Delaware limited partnership, doing business as Kase Capital Management; T2 Accredited Fund, LP, a Delaware limited partnership, doing business as Kase Fund; T2 Qualified Fund, LP, a Delaware limited partnership, doing business as Kase Qualified Fund; Tilson Offshore Fund, Ltd, a Cayman Islands exempted company; T2 Partners Management I, LLC, a Delaware limited liability company, doing business as Kase Management; T2 Partners Management Group, LLC, a Delaware limited liability company, doing business as Kase Group; JMG Capital Management, LLC, a Delaware limited liability company, Pacific Capital Management, LLC, a Delaware limited liability company (the “T2 Plaintiffs”), derivatively on behalf of Reading International, Inc. vs. Margaret Cotter, Ellen Cotter, Guy Adams, Edward Kane, Douglas McEachern, Timothy Storey, William Gould and Does 1 through 100, inclusive, as defendants, and, Reading International, Inc., a Nevada corporation, as Nominal Defendant. That complaint was subsequently amended (as amended the “T2 Derivative Complaint”) to add as defendants Directors Judy Codding and Michael Wrotniak (collectively with the directors initially named the “T2 Defendant Directors”) and S. Craig Tompkins, our Company’s legal counsel (collectively with the T2 Defendant Directors, the “T2 Defendants”). The T2 Derivative Action was settled pursuant to a Settlement Agreement between the parties dated August 4, 2016, which as modified was approved by the Nevada District Court on October 6, 2016. The District Court’s Order provided for the dismissal with prejudice of all claims contained in the T2 Plaintiffs’ First Amended Complaint and provide that each side would be responsible for its own attorneys’ fees.
20
In the joint press release issued by our Company and the T2 Plaintiffs on July 13, 2016, representatives of the T2 Plaintiffs stated as follows: "We are pleased with the conclusions reached by our investigations as Plaintiff Stockholders and now firmly believe that the Reading Board of Directors has and will continue to protect stockholder interests and will continue to work to maximize shareholder value over the long-term. We appreciate the Company's willingness to engage in open dialogue and are excited about the Company's prospects. Our questions about the termination of James Cotter, Jr., and various transactions between Reading and members of the Cotter family-or entities they control-have been definitively addressed and put to rest. We are impressed by measures the Reading Board has made over the past year to further strengthen corporate governance. We fully support the Reading Board and management team and their strategy to create stockholder value.”
The T2 Plaintiffs alleged in their T2 Derivative Complaint various violations of fiduciary duty, abuse of control, gross mismanagement and corporate waste by the T2 Defendant Directors. More specifically the T2 Derivative Complaint sought the reinstatement of James J. Cotter, Jr. as President and Chief Executive Officer, an order setting aside the election results from the 2015 Annual Meeting of Stockholders, based on an allegation that Ellen Cotter and Margaret Cotter were not entitled to vote the shares of Class B Common Stock held by the Cotter Estate and the Cotter Trust, and certain monetary damages, as well as equitable injunctive relief, attorney fees and costs of suit. In May 2016, the T2 Plaintiffs unsuccessfully sought a preliminary injunction (i) enjoining the Inspector of Elections from counting at our 2016 Annual Meeting of Stockholders any proxies purporting to vote either the 327,808 Class B shares held of record by the Cotter Estate or the 696,080 Class B shares held of record by the Cotter Trust, and (ii) enjoining Ellen Cotter, Margaret Cotter and James J. Cotter, Jr. from voting the above referenced shares at the 2016 Annual Meeting of Stockholders. This request for preliminary injunctive relief was denied by the Nevada District Court after a hearing on May 26, 2016.
The Cotter Trust Litigation:
Up until his death on September 13, 2014, James J. Cotter, Sr., the father of Ellen Cotter, James J. Cotter, Jr. and Margaret Cotter, was our controlling stockholder, having the sole power to vote approximately 66.9% of the outstanding voting stock of the Company. Under applicable Nevada Law, a stockholder holding more than 2/3rds of the Company’s voting stock has the power at any time, with or without cause, to remove any one or more directors (up to and including the entire board of directors) by written consent taken without a meeting of the stockholders.
Following the death of Mr. Cotter, Sr., disputes arose among Ellen Cotter, James J. Cotter, Jr. and Margaret Cotter concerning the voting control and disposition of those shares. These disputes initially resulted in an action brought by Ellen Cotter and Margaret Cotter on February 5, 2015 in the Superior Court of the State of California, County of Los Angeles (the “California Superior Court”), in the case captioned In re James J. Cotter Living Trust dated August 1, 2000 (Case No. BP159755) (the “Trust Case”), to determine which of two trust documents controlled the living trust created by their father (the “Cotter Living Trust”). On March 23, 2018, the California Superior Court ruled that the trust document advocated by Mr. Cotter, Jr., was invalid. Accordingly, Ellen Cotter and Margaret Cotter are the Co-Trustees of the Cotter Living Trust, and Margaret Cotter is the sole Trustee of the voting sub-trust to be formed under the Cotter Living Trust to eventually hold Class B Voting Stock representing approximately 66.9% of the outstanding voting stock of our Company (the “Cotter Voting Trust”).
Prior to this ruling, Mr. Cotter Jr. on or about February 8, 2017, brought an ex parte motion in the Trust Case seeking the appointment of a trustee ad litem to market and potentially sell the voting stock to be held by the Cotter Voting Trust. In light of our Board’s determination that it would be in the best interests of our Company and our stockholders generally to continue to pursue our Company’s business plan, and not to sell the Company at this time, the potential disruption to the achievement of that business plan and to the business and affairs of our Company generally if there were to be a change of control transaction at this time, the commitment of Ellen Cotter and Margaret Cotter to the pursuit and fulfilment of that business plan, our Company has made filings in the California Superior Court opposing such an appointment of a trustee ad litem.
As of March 31, 2018, according to the books of the Company, the Cotter Living Trust held of record 696,080 shares of our Class B Stock constituting approximately 41.4% of the voting power of our outstanding capital stock. According to the books of the Company, the Estate of James J. Cotter (the “Cotter Estate”) as of that date held of record an additional 427,808 shares of Class B Stock, constituting approximately 25.5% of the voting power of our outstanding capital stock. We are advised, based upon public filings made by one or more of Ellen Cotter, Margaret Cotter and James J. Cotter, Jr. (the “Cotter Filings”) that the Class B Stock currently held of record by the Cotter Estate will eventually pour over into the Cotter Living Trust where it will then be placed in the Cotter Voting Trust. At the present time, however, such Class B Stock is held of record by the Cotter Living Trust and the Cotter Estate, respectively. Ellen Cotter and Margaret Cotter are also the Co-Executors of the Cotter Estate.
On March 23, 2018, the California Superior Court ruled that it would appoint a temporary trustee ad litem (the “TTAL”) “with the narrow and specific authority to obtain offers to purchase the RDI stock in the voting trust, but not to exercise any other powers without court approval, specifically the sale of the company or any other powers possessed by the trustees.” No TTAL has been appointed to date.
21
On April 12, 2018, following the application for a writ by Ellen Cotter and Margaret Cotter as the Trustees of the Cotter Living Trust, the California Court of Appeals stayed all trial court proceedings and issued an Order to Show Cause as to why it should not vacate the California Superior Court’s Order that a trustee ad litem be appointed to market the above referenced RDI stock.
The California Superior Court, in the Trust Case, has jurisdiction over the Cotter Living Trust, which as described in more detail above, currently owns 41.4% of our Class B Stock, and, at such time as the Cotter Estate is probated, may receive up to an additional 25.5% of our Class B Stock, has jurisdiction over a potentially controlling block of our voting power. Should the California Superior Court order the sale of the Cotter Living Trust’s Class B Stock and such sale be completed, then there may be a change of control of our Company, depending on, among other things, who the ultimate purchaser(s) of such shares might be, the number of shares of Class B Stock distributed by the Cotter Estate to the Cotter Living Trust, and whether the California Superior Court orders a sale of all or only some portion to the Class B Stock held by the Cotter Living Trust.
Costs of Litigation/Arbitration: Our Company is and was legally obligated to cover the costs and expenses incurred by our Defendant Directors in defending the Cotter Jr. Derivative Action and the T2 Derivative Action. Furthermore, although in a derivative action the stockholder plaintiff seeks only damages or other relief for the benefit of our Company, and not for the stockholder plaintiff’s individual benefit and, accordingly, although our Company is, at least in theory, only a nominal defendant, as a practical matter our Company has a direct interest in defending against Mr. Cotter, Jr.’s claims and opposing the remedies he is seeking. Mr. Cotter, Jr. is, among other things, (a) seeking an order that our Board’s termination of Mr. Cotter, Jr. was ineffective and demanding, as a remedy, that he be reinstated as the President and Chief Executive Officer of our Company, (b) seeking an order limiting the use of our Board’s Executive Committee, and (c) asserting that our Company has made materially misleading statements in certain press releases and filings with the SEC. Accordingly, our Company is also incurring, on its own account, significant cost and expense defending the decision to terminate Mr. Cotter, Jr. as President and Chief Executive Officer, its board committee structure, and the adequacy of those press releases and filings, in addition to its costs incurred in responding to discovery demands and satisfying indemnity obligations to the Defendant Directors. Likewise, in connection with the T2 Derivative Action, our Company incurred substantial costs defending claims related to the defense of claims relating to the termination of Mr. Cotter, Jr., opposing his reinstatement, and defending the conduct of its annual meetings. Cost incurred in the Cotter Jr. Employment Arbitration and in the defense of the Cotter Jr. Attorney’s fees case were direct costs of our Company.
The Directors and Officer’s Insurance Policy, in the amount of $10 million, being used to cover a portion of the costs of defending the Cotter Jr. Derivative Action, has been exhausted. We are now covering the defense costs of the Defendant Directors, in addition to our own costs incurred in connection with the Cotter Jr. Derivative Action. In 2017, these out-of-pocket costs totaled approximately $4.0 million. Costs of the litigation for the quarter ended were $1.4 million, compared to $645,000 for the same period in 2017.
Our Company has also incurred legal expense representing the interests of our Company in the Trust Case, opposing Mr. Cotter, Jr.’s Ex Parte Motion to seek a trustee ad litem to market stock potentially representing a controlling interest in our Company without the involvement of our Board of Directors and without any safeguards to protect the interests of non-controlling stockholders.
The Special Independent Committee. On August 7, 2017, our Board appointed a Special Independent Committee to, among other things, review, consider, deliberate, investigate, analyze, explore, evaluate, monitor and exercise general oversight of any and all activities of the Company directly or indirectly involving, responding to or relating to the Cotter Jr. Derivative Action, the Cotter Jr. Employment Arbitration, the Cotter Trust Litigation, and any other litigation or arbitration matters involving any one or more of Ellen Cotter, Margaret Cotter, James J. Cotter, Jr., the Cotter Estate and/or the Cotter Living Trust.
The STOMP Arbitration
In April 2015, Liberty Theatres, LLC (“Liberty”), a wholly owned subsidiary of the Company, commenced an American Arbitration Association arbitration proceeding against The Stomp Company Limited Partnership (“Stomp”), the producer of the show STOMP, in response to Stomp’s purported termination of their license agreement with Liberty relating to such show. STOMP has been playing at our Orpheum Theatre in New York City for 23 years and still continues to play to date. Liberty sought specific performance, injunctive and declaratory relief and damages. Stomp counterclaimed for unspecified damages, alleging that Liberty has interfered with the Stomp’s endeavors to move the show to another Off-Broadway theater. Stomp based its purported termination of the license agreement upon the alleged deficient condition of the Orpheum Theater.
On December 18, 2015, the Arbitrator issued his Partial Final Award of Arbitration, providing for, among other things (i) the issuance of a permanent injunction prohibiting Stomp from “transferring or taking actions to market, promote, or otherwise facilitate any transfer of, STOMP to another theatre in New York City having fewer than 500 seats without Liberty’s prior written consent”, (ii) the Stomp’s Notice of Termination purportedly terminating the parties’ license agreement was invalid, null and void and the License Agreement remains in full force and effect, and (iii) the award to Liberty of its reasonable attorneys’ fees in an amount to be determined by the Arbitrator.
22
In explaining his decision to award Liberty its reasonable attorneys’ fees, the Arbitrator stated as follows: “Liberty is entitled to such an award [of attorneys’ fees] not only because it is the prevailing party in this proceeding, but because [the Producer] unfairly disparaged the Orpheum and caused Liberty to incur attorneys’ fees in order to address and resolve [the Producer’s] groundless and frivolous allegations with respect to the Orpheum’s condition, Liberty’s performance under the License Agreement, and Stomp’s reasons for seeking to transfer STOMP to a larger theatre.”
In April 2016, we received a Final Award in our arbitration with Stomp. The Final Award awards us $2.3 million in attorney’s fees and costs. In September 2016, the parties agreed on the payment terms of the Final Award (“Payment Agreement”), on a basis that is intended to allow recovery by Liberty of the entire Final Award (plus interest at 4%), while at the same time allowing the show to continue playing at our Orpheum Theater. The total of $2.3 million plus interest has now been paid in full, final payment being received on March 5, 2018. STOMP continues to play at our Orpheum Theater.
23
Note 14 – Non-controlling Interests
These are composed of the following enterprises:
|
· |
Australia Country Cinemas Pty Ltd. -- 25% noncontrolling interest owned by Panorama Cinemas for 21st Century Pty Ltd.; |
|
· |
Shadow View Land and Farming, LLC -- 50% noncontrolling membership interest owned by either the estate of Mr. James J. Cotter, Sr. (the “Cotter Estate”) and/or the James J. Cotter, Sr. Living Trust (the “Cotter Trust”); and, |
|
· |
Sutton Hill Properties, LLC -- 25% noncontrolling interest owned by Sutton Hill Capital, LLC (which in turn is 50% owned by the Cotter Estate and/or the Cotter Trust). |
The components of noncontrolling interests are as follows:
|
|
|
|
|
|
|
|
|
|
|
March 31, |
|
December 31, |
||
|
(Dollars in thousands) |
|
2018 |
|
2017 |
||
|
Australian Country Cinemas, Pty Ltd |
|
$ |
131 |
|
$ |
138 |
|
Shadow View Land and Farming, LLC |
|
|
2,142 |
|
|
2,127 |
|
Sutton Hill Properties, LLC |
|
|
2,059 |
|
|
2,066 |
|
Noncontrolling interests in consolidated subsidiaries |
|
$ |
4,332 |
|
$ |
4,331 |
The components of income attributable to noncontrolling interests are as follows:
|
|
|
|
|
|
|
|
|
|
|
Three Months Ended |
||||
|
|
|
March 31, |
|
March 31, |
||
|
(Dollars in thousands) |
|
2018 |
|
2017 |
||
|
Australian Country Cinemas, Pty Ltd |
|
$ |
41 |
|
$ |
44 |
|
Shadow View Land and Farming, LLC |
|
|
(13) |
|
|
(16) |
|
Sutton Hill Properties, LLC |
|
|
(6) |
|
|
(16) |
|
Net income attributable to noncontrolling interests |
|
$ |
22 |
|
$ |
12 |
Summary of Controlling and Noncontrolling Stockholders’ Equity
A summary of the changes in controlling and noncontrolling stockholders’ equity is as follows:
|
|
|
|
|
|
|
|
|
|
|
|
(Dollars in thousands) |
|
|
Controlling Stockholders’ Equity |
|
|
Noncontrolling Stockholders’ Equity |
|
|
Total Stockholders’ Equity |
|
Equity at January 1, 2018 |
|
$ |
176,910 |
|
$ |
4,331 |
|
$ |
181,241 |
|
Adjustments to opening retained earnings on adoption of ASC 606 |
|
|
194 |
|
|
(2) |
|
|
192 |
|
Net income |
|
|
3,047 |
|
|
22 |
|
|
3,069 |
|
Increase in additional paid in capital |
|
|
339 |
|
|
-- |
|
|
339 |
|
Treasury stock purchased |
|
|
(317) |
|
|
-- |
|
|
(317) |
|
Contributions from noncontrolling stockholders |
|
|
-- |
|
|
27 |
|
|
27 |
|
Distributions to noncontrolling stockholders |
|
|
-- |
|
|
(43) |
|
|
(43) |
|
Accumulated other comprehensive income |
|
|
(750) |
|
|
(3) |
|
|
(753) |
|
Equity at March 31, 2018 |
|
$ |
179,423 |
|
$ |
4,332 |
|
$ |
183,755 |
|
|
|
|
|
|
|
|
|
|
|
|
(Dollars in thousands) |
|
|
Controlling Stockholders’ Equity |
|
|
Noncontrolling Stockholders’ Equity |
|
|
Total Stockholders’ Equity |
|
Equity at January 1, 2017 |
|
$ |
142,197 |
|
$ |
4,418 |
|
$ |
146,615 |
|
Net income |
|
|
3,029 |
|
|
12 |
|
|
3,041 |
|
Increase in additional paid in capital |
|
|
169 |
|
|
-- |
|
|
169 |
|
Treasury stock purchased |
|
|
(672) |
|
|
-- |
|
|
(672) |
|
Contributions from noncontrolling stockholders |
|
|
-- |
|
|
41 |
|
|
41 |
|
Distributions to noncontrolling stockholders |
|
|
-- |
|
|
(77) |
|
|
(77) |
|
Accumulated other comprehensive loss |
|
|
5,861 |
|
|
13 |
|
|
5,874 |
|
Equity at March 31, 2017 |
|
$ |
150,584 |
|
$ |
4,407 |
|
$ |
154,991 |
24
Note 15 – Stock-Based Compensation and Stock Repurchases
Employee and Director Stock Option Plan
The Company may grant stock options and other share-based payment awards of our Common Stock to eligible employees, directors, and consultants under the 2010 Stock Incentive Plan (the “Plan”). The aggregate total number of shares of the Common Stock authorized for issuance under the Plan is 2,197,460.
During the Company’s 2017 Annual Stockholders’ Meeting held on November 7, 2017, the Company's stockholders, upon recommendation of the Board of Directors, approved an amendment to the Company's 2010 Plan to increase the number of shares of common stock issuable under such plan by an additional 947,460 shares. The effect of the increase is to restore the amount of shares of Common Stock available under the 2010 Stock Incentive Plan from the 302,540 shares available as of September 30, 2017, back up to its original reserve of 1,250,000 shares. As of March 31, 2018, we had 1,220,607 shares remaining for future issuances.
Since the adoption of the Plan in 2010, the Company has granted awards primarily in the form of stock options. In the 1st quarter of 2016, the Company started to award restricted stock units (“RSUs”) to directors and certain members of management. Stock options are generally granted at exercise prices equal to the grant-date market prices and typically expire no later than five years from the grant date. In contrast to a stock option where the grantee buys the Company’s share at an exercise price determined on grant date, an RSU entitles the grantee to receive one share for every RSU based on a vesting plan. At the discretion of our Compensation and Stock Options Committee, the vesting period of stock options and RSUs granted to employees ranges from zero to four years. Grants to directors and certain executive officers are subject to Board approval. At the time the options are exercised or RSUs vest, at the discretion of management, we will issue treasury shares or make a new issuance of shares to the option or RSU holder.
Stock Options
We estimate the grant-date fair value of our stock options using the Black-Scholes option-valuation model, which takes into account assumptions such as the dividend yield, the risk-free interest rate, the expected stock price volatility, and the expected life of the options. We expense the estimated grant-date fair values of options over the vesting period on a straight-line basis. Based on our historical experience, the “deemed exercise” of expiring in-the-money options and the relative market price to strike price of the options, we have not hereto estimated any forfeitures of vested or unvested options.
There were no share options issued in the quarter ended March 31, 2018. The weighted average assumptions used in the option-valuation model were as follows:
|
|
||||
|
|
Three Months Ended March 31 |
|||
|
|
2018 |
2017 |
||
|
Stock option exercise price |
$ |
- |
15.97 | |
|
Risk-free interest rate |
0.00% | 1.68% | ||
|
Expected dividend yield |
-- |
-- |
||
|
Expected option life in years |
- |
3.75 | ||
|
Expected volatility |
0.00% | 24.92% | ||
|
Weighted average fair value |
$ |
- |
3.46 | |
For the quarter ended March 31, 2018 and 2017, we recorded compensation expense of $85,000 and $53,000, respectively. At March 31, 2018, the total unrecognized estimated compensation expense related to non-vested stock options was $793,000, which we expect to recognize over a weighted average vesting period of 1.76 years. The intrinsic, unrealized value of all options outstanding, vested and expected to vest, at March 31, 2018 was $2.8 million, of which 76.8% are currently exercisable.
The following table summarizes the information of options outstanding and exercisable as of March 31, 2018 and December 31, 2017:
|
|
|
|
|
|
|
|
|
|
|
|
|
|
|
Outstanding Stock Options - Class A Shares |
||||||||
|
|
|
Number of Options |
|
Weighted Average Exercise Price |
|
Weighted Average Remaining Years of Contractual Life |
Aggregate Intrinsic Value |
|||
|
Balance - December 31, 2016 |
|
535,077 |
|
$ |
9.84 |
|
|
2.61 |
$ |
3,615,191 |
|
Granted |
|
169,762 |
|
|
15.94 |
|
|
|
|
|
|
Exercised |
|
(177,750) |
|
|
7.85 |
|
|
|
$ |
702,840 |
|
Forfeited |
|
(2,500) |
|
|
6.23 |
|
|
|
|
|
|
Balance - December 31, 2017 |
|
524,589 |
|
$ |
12.50 |
|
|
3.15 |
$ |
3,054,325 |
|
Granted |
|
- |
|
|
- |
|
|
|
|
|
|
Exercised |
|
(30,000) |
|
|
5.74 |
|
|
|
$ |
321,749 |
|
Forfeited |
|
- |
|
|
- |
|
|
|
|
|
|
Balance - March 31, 2018 |
|
494,589 |
|
$ |
12.17 |
|
|
3.07 |
$ |
2,832,550 |
|
|
|
|
|
|
|
|
|
|
|
|
25
Restricted Stock Units
We estimate the grant-date fair values of our RSUs using the Company’s stock price at grant-date and record such fair values as compensation expense over the vesting period on a straight-line basis. The following table summarizes the status of the RSUs granted to-date as of March 31, 2018:
|
|
|
|
|
|
|
|
|
|
|
|
|
|
|
|
|
Outstanding Restricted Stock Units |
||||||||
|
|
|
|
RSU Grants (in units) |
|
Total |
|
Vested, |
|
Unvested, |
||
|
Grant Date |
|
|
Directors |
|
Management |
|
Grants |
|
March 31, 2018 |
|
March 31, 2018 |
|
March 10, 2016 |
|
|
35,147 |
|
27,381 |
|
62,528 |
|
48,838 |
|
13,690 |
|
April 11, 2016 |
|
|
-- |
|
5,625 |
|
5,625 |
|
1,406 |
|
4,219 |
|
March 23, 2017 |
|
|
30,681 |
|
32,463 |
|
63,144 |
|
46,912 |
|
16,232 |
|
August 29, 2017 |
|
|
-- |
|
7,394 |
|
7,394 |
|
-- |
|
7,394 |
|
January 2, 2018 |
|
|
29,393 |
|
-- |
|
29,393 |
|
-- |
|
29,393 |
|
|
|
|
|
|
|
|
|
|
|
|
|
|
Total |
|
|
95,221 |
|
72,863 |
|
168,084 |
|
97,156 |
|
70,928 |
These RSU awards vest 25% at the end of each year for 4 years (in the case of members of management) and vest 100% on the date of grant which is early January of the year following in which such RSUs were granted (in the case of directors). For the quarter ended March 31, 2018 and 2017, we recorded compensation expense of $294,000 and $120,000, respectively. The total unrecognized compensation expense related to the non-vested RSUs was $1.0 million as of March 31, 2018, which we expect to recognize over a weighted average vesting period of 1.1 years.
Stock Repurchase Program
On March 2, 2017, the Company's Board of Directors authorized management, at its discretion, to spend up to an aggregate of $25.0 million to acquire shares of Reading’s Class A Common Stock. The previously approved stock repurchase program, which allowed management to spend up to an aggregate of $10.0 million to acquire shares of Reading’s Non-Voting Common Stock, was completed as of December 31, 2016.
The repurchase program allows Reading to repurchase its shares in accordance with the requirements of the SEC on the open market, in block trades and in privately negotiated transactions, depending on market conditions and other factors. All purchases are subject to the availability of shares at prices that are acceptable to Reading, and accordingly, no assurances can be given as to the timing or number of shares that may ultimately be acquired pursuant to this authorization.
Under the stock repurchase program, the Company has reacquired 428,361 shares of Class A Common Stock for $6.8 million at an average price of $15.97 per share (excluding transaction costs) to-date, of which 18,638 were purchased for $317,000 at an average price of $16.98 during the quarter ending March 31, 2018. This leaves $18.2 million available under the March 2, 2017 program for repurchase as of March 31, 2018.
Note 16 – Derivative Instruments
From time-to-time, we purchase interest rate derivative instruments to hedge the interest rate risk that results from the variability of our floating-rate borrowings. Our use of derivative transactions is intended to reduce long-term fluctuations in cash flows caused by market movements. All derivative instruments are recorded on the balance sheet at fair value with changes in fair value through interest expense in the Consolidated Statement of Income. As of March 31, 2018, we do not have material derivative positions nor have designated any of these derivatives as accounting hedges.
Note 17 – Fair Value Measurements
ASC 820, Fair Value Measurement establishes a fair value hierarchy that prioritizes the inputs to valuation techniques used to measure fair value. The statement requires that assets and liabilities carried at fair value be classified and disclosed in one of the following three categories:
|
· |
Level 1: Quoted market prices in active markets for identical assets or liabilities; |
|
· |
Level 2: Quoted prices for similar instruments in active markets; quoted prices for identical or similar instruments in markets that are not active; and model-derived valuations in which all significant inputs and significant value drivers are observable in active markets; and, |
|
· |
Level 3: Valuations derived from valuation techniques in which one or more significant inputs or significant value drivers are unobservable. |
26
As of March 31, 2018 and December 31, 2017 material financial assets and financial liabilities were carried and measured at fair value on a recurring basis.
The following tables summarize our financial liabilities that are carried at cost and measured at fair value on a non-recurring basis as of March 31, 2018 and December 31, 2017, by level within the fair value hierarchy.
|
|
Fair Value Measurement at March 31, 2018 |
||||||||||||||
|
(Dollars in thousands) |
Carrying Value(1) |
Level 1 |
Level 2 |
Level 3 |
Total |
||||||||||
|
Notes payable |
$ |
122,272 |
$ |
-- |
$ |
-- |
$ |
121,684 |
$ |
121,684 | |||||
|
Subordinated debt |
27,913 |
-- |
-- |
16,621 | 16,621 | ||||||||||
|
|
$ |
150,185 |
$ |
-- |
$ |
-- |
$ |
138,305 |
$ |
138,305 | |||||
|
|
Fair Value Measurement at December 31, 2017 |
||||||||||||||
|
(Dollars in thousands) |
Carrying Value(1) |
Level 1 |
Level 2 |
Level 3 |
Total |
||||||||||
|
Notes payable |
$ |
106,588 |
$ |
-- |
$ |
-- |
$ |
106,894 |
$ |
106,894 | |||||
|
Subordinated debt |
27,913 |
-- |
-- |
16,088 | 16,088 | ||||||||||
|
|
$ |
134,501 |
$ |
-- |
$ |
-- |
$ |
122,982 |
$ |
122,982 | |||||
(1) These balances are presented before any deduction for deferred financing costs.
Following is a description of the valuation methodologies used to estimate the fair value of our financial assets and liabilities. There have been no changes in the methodologies used at March 31, 2018 and December 31, 2017.
|
· |
Level 1 investments in marketable securities primarily consist of investments associated with the ownership of marketable securities in U.S. and New Zealand. These investments are valued based on observable market quotes on the last trading date of the reporting period. |
|
· |
Level 2 derivative financial instruments are valued based on discounted cash flow models that incorporate observable inputs such as interest rates and yield curves from the derivative counterparties. The credit valuation adjustments associated with our non-performance risk and counterparty credit risk are incorporated in the fair value estimates of our derivatives. As of March 31, 2018 and December 31, 2017, we concluded that the credit valuation adjustments were not significant to the overall valuation of our derivatives. |
|
· |
Level 3 borrowings include our secured and unsecured notes payable, trust preferred securities and other debt instruments. The borrowings are valued based on discounted cash flow models that incorporate appropriate market discount rates. We calculated the market discount rate by obtaining period-end treasury rates for fixed-rate debt, or LIBOR for variable-rate debt, for maturities that correspond to the maturities of our debt, adding appropriate credit spreads derived from information obtained from third-party financial institutions. These credit spreads take into account factors such as our credit rate, debt maturity, types of borrowings, and the loan-to-value ratios of the debt. |
The Company’s financial instruments also include cash, cash equivalents, receivables and accounts payable. The carrying values of these financial instruments approximate the fair values due to their short maturities. Additionally, there were no transfers of assets and liabilities between levels 1, 2, or 3 during the quarter ended March 31, 2018 and March 31, 2017.
27
This MD&A should be read in conjunction with the accompanying unaudited consolidated financial statements included in Part I, Item 1 (Financial Statements). The foregoing discussions and analyses contain certain forward-looking statements. Please refer to the “Forward Looking Statements” included at the conclusion of this section.
Item 2 – Management’s Discussions and Analysis (“MD&A”) of Financial Condition and Results of Operations
We are an internationally diversified company principally focused on the development, lease or ownership, and operation of entertainment and real estate assets in the United States, Australia, and New Zealand. Currently, we operate in two business segments:
|
· |
Cinema exhibition, through our 59 multiplex cinemas; and, |
|
· |
Real estate, including real estate development and the rental of retail, commercial and live theater assets. |
We believe that these two business segments complement one another, as we can use the comparatively consistent cash flows generated by our cinema operations to fund the front-end cash demands of our real estate development business.
Cinema Exhibition
We manage our worldwide cinema exhibition businesses under various brands:
|
· |
in the U.S., under the following brands: Reading Cinemas, Angelika Film Centers, Consolidated Theatres, and City Cinemas; |
|
· |
in Australia, under the Reading Cinemas brand; and, |
|
· |
in New Zealand, under the Reading Cinemas and Rialto brands. |
Shown in the following table are the number of locations and theatre screens in our theatre circuit in each country, by state/territory/ region and indicating our cinema brands and our interest in the underlying asset as of March 31, 2018:
|
|
State / Territory / |
Location |
Screen |
Interest in Asset Underlying the Cinema |
||||||||
|
Country |
Region |
Count |
Count |
Leased |
Owned |
Operating Brands |
||||||
|
United States |
Hawaii |
9 |
98 |
9 |
Consolidated Theatres |
|||||||
|
|
California |
7 |
88 |
7 |
Reading Cinemas, Angelika Film Center |
|||||||
|
|
New York(3) |
6 |
23 |
5 |
1 |
Angelika Film Center, City Cinemas |
||||||
|
|
Texas |
2 |
13 |
2 |
Angelika Film Center |
|||||||
|
|
New Jersey |
1 |
12 |
1 |
Reading Cinemas |
|||||||
|
|
Virginia |
1 |
8 |
1 |
Angelika Film Center |
|||||||
|
|
Washington DC |
1 |
3 |
1 |
Angelika Film Center |
|||||||
|
|
U.S. Total |
27 |
245 |
26 |
1 |
|||||||
|
Australia |
New South Wales |
6 |
43 |
4 |
2 |
Reading Cinemas |
||||||
|
|
Victoria |
6 |
43 |
6 |
Reading Cinemas |
|||||||
|
|
Queensland |
5 |
48 |
2 |
3 |
Reading Cinemas, Event Cinemas(1) |
||||||
|
|
Western Australia |
2 |
16 |
1 |
1 |
Reading Cinemas |
||||||
|
|
South Australia |
2 |
15 |
2 |
Reading Cinemas |
|||||||
|
|
Australia Total |
21 |
165 |
15 |
6 |
|||||||
|
New Zealand |
Wellington |
2 |
15 |
1 |
1 |
Reading Cinemas |
||||||
|
|
Otago |
3 |
15 |
2 |
1 |
Reading Cinemas, Rialto Cinemas(2) |
||||||
|
|
Auckland |
2 |
15 |
2 |
Reading Cinemas, Rialto Cinemas(2) |
|||||||
|
|
Canterbury |
1 |
8 |
1 |
Reading Cinemas |
|||||||
|
|
Southland |
1 |
5 |
1 |
Reading Cinemas |
|||||||
|
|
Bay of Plenty |
1 |
5 |
1 |
Reading Cinemas |
|||||||
|
|
Hawke's Bay |
1 |
4 |
1 |
Reading Cinemas |
|||||||
|
|
New Zealand Total |
11 |
67 |
6 |
5 |
|||||||
|
GRAND TOTAL |
59 |
477 |
47 |
12 |
||||||||
|
(1) |
The Company has a 33.3% unincorporated joint venture interest in a 16-screen cinema located in Mt. Gravatt, Queensland managed by Event Cinemas. |
|
(2) |
The Company is a 50% joint venture partner in two (2) New Zealand Rialto cinemas. We negotiate the commercial theatrical release terms of these cinemas and our joint venture partner, Event Cinemas, manages their day-to-day operations. |
|
(3) |
Our New York statistics include one (1) managed cinema. |
Real Estate
We engage in real estate development and the ownership, and rental or licensing to third parties of retail, commercial and live theater assets. We own the fee interests in all three of our live theaters, and in 12 of our cinemas (as presented in the preceding table). Our real estate business creates long-term value for our stockholders through the continuous improvement and development of our investment and operating properties, including our entertainment-themed centers (“ETCs”).
28
Our real estate activities have historically consisted principally of:
|
· |
the ownership of fee or long-term leasehold interests in properties used in our cinema exhibition activities or which were acquired for the development of cinemas or cinema-based real estate development projects; |
|
· |
the acquisition and development of fee interests in land; |
|
· |
the licensing to production companies of our live theaters; and, |
|
· |
the redevelopment of our existing fee-owned cinema or live theater sites to their highest and best use. |
Cinema Exhibition
Our cinema revenue consists primarily of admissions, F&B, advertising and theater rentals. Cinema operating expense consists of the costs directly attributable to the operation of the cinemas, including film rent expense, operating costs, and occupancy costs. Cinema revenue and expense fluctuate with the availability of quality first run films and the numbers of weeks such first run films stay in the market. For a breakdown of our current cinema assets that we own and/or manage, please see Part I, Item 1 – Our Business of our 2017 Annual Report.
While our capital projects in recent years have been focused in growing our real estate segment, we have also achieved considerable improvements to our cinema exhibition portfolio, as discussed below:
Cinema Additions (including re-openings)
The latest additions and enhancements to our cinema portfolio are as follows:
|
· |
Opening a new state-of-the-art eight-screen in Newmarket, Brisbane, Australia: On December 14, 2017, in connection with our expansion and upgrading of our Newmarket Village, Brisbane location, we opened an eight screen Reading Cinemas offering one TITAN LUXE with DOLBY ATMOS sound and recliner seating, and three Gold Lounge auditoriums featuring recliner seating, as well as offering an expanded F&B menu. |
|
· |
U.S. Refurbishments: In 2017 and the first quarter of 2018, we continued to invest in the refurbishment of our U.S. cinema circuit. During this period seven locations have had significant refurbishment work performed: our Cal Oaks, Valley Plaza and Grossmont locations in California; our Ward and Pearlridge locations in Hawaii; our Paris location in New York and our Manville location in New Jersey. Further, at Cal Oaks, in addition to refurbishing and upgrading our existing cinema. On March 30, 2018 we launched our new dine-in concept, “Spotlight.” |
|
· |
AU and NZ Refurbishments In 2017, we partially renovated six theaters: Belmont, Rouse Hill, West Lakes, Harbourtown, Courtenay Central and Napier. |
Cinema Pipeline
Our cinema pipeline includes 3 new multi-screen locations in Australia and New Zealand, which have been approved by our Board of Directors and which we anticipate bringing on line in 2019/2020.
Cinema Closures
We evaluate the performance of each of our cinemas and, in some instances, we may decide to close an operation when it is not economically viable to continue operate from the location. Since 2015, we have closed two underperforming theaters, one each in the United States and Australia.
Upgrades to our Film Exhibition Technology and Theatre Amenities
We continue to focus in areas of the matured cinema business where we believe we have growth potential and ultimately, provide long-term value to our stockholders. These are (i) upgrading of our existing cinemas and (ii) developing new cinemas to provide our customers with premium offerings, including state-of-the-art presentation (including sound, lounges and bar service) and luxury seating. As of March 31, 2018, the upgrades to our theater circuits’ film exhibition technology and amenities are summarized in the following table (excluding our managed cinema):
|
|
Location Count |
Screen Count |
|
|
Screen Format |
|||
|
Digital (all cinemas in our theatre circuit) |
58 |
473 |
|
|
IMAX |
1 |
1 |
|
|
Titan XC and LUXE |
12 |
15 |
|
|
Dine-in Service (for international operations) |
|||
|
Gold Lounge(1) |
9 |
22 |
|
|
Premium(2) |
8 |
14 |
|
|
Upgraded Food & Beverage menu (for U.S. operations)(3) |
13 |
n/a |
|
|
Premium Seating (recliner seating features) |
20 |
112 |
|
|
Liquor Licenses Obtained(4) |
26 |
n/a |
29
(1) Gold Lounge: This is our "First Class Full Dine-in Service" in our Australian and New Zealand cinemas, which includes upgraded F&B menu (with alcoholic beverages), luxury recliner seating features (intimate 30-40 seat cinemas) and waiter service.
(2) Premium Service: This is our "Business Class Dine-in Service" in our Australian and New Zealand cinemas, which includes upgraded F&B menu (with alcoholic beverages) and luxury recliner seating features (less intimate 80-seat cinemas), but no waiter service.
(3) Upgraded Food & Beverage Menu: Historically, our upgraded F&B offerings in the U.S. cinemas have been available at a common counter rather than a dine-in service at each auditorium. However, we have opened our first ‘dine in” operation at our Cal Oaks Theater in Murrieta, California in Riverside County. We are working with former Food Network executives to curate a menu of locally inspired and freshly prepared items.
(4) Liquor Licenses: Licenses are applicable at each cinema location, rather than each theatre auditorium (except for our Hawaii licenses, where we are licensed for particular auditoriums). For accounting purposes, we capitalize the cost of successfully purchasing or applying for liquor licenses meeting certain thresholds as an intangible asset due to long-term economic benefits derived on future sales of alcoholic beverages.
Real Estate
Our operating properties currently consists of the following assets:
|
· |
our Newmarket, Queensland ETC, our Belmont, Western Australia ETC, our Auburn, New South Wales ETC, our Townsville, Queensland ETC and our Wellington, New Zealand ETC; |
|
· |
two (2) single-auditorium live theaters in Manhattan (Minetta Lane and Orpheum) and a four-auditorium live theater complex (including the accompanying ancillary retail and commercial tenants) in Chicago (The Royal George); and, |
|
· |
our US Headquarters building in Culver City, California and our Australia corporate office building in Melbourne, Australia; and, |
|
· |
the ancillary retail and commercial space at some of our non-ETC cinema properties. |
At the beginning of January 2016, we ceased our live theatre business at our Union Square property in New York, terminated all tenant leases and prepared the property for redevelopment. Accordingly, this property is no longer treated as an operating property.
In addition, we have various parcels of unimproved real estate held for development in Australia and New Zealand and certain unimproved land in the United States including some that was used in our legacy activities.
Since January 1, 2017, we have added approximately 24,790 square feet of rentable square footage in our Australian ETCs, of which approximately 24,078 square foot has been leased at an average price of AU$71.16 per square foot, per year.
Our key real estate transactions in recent years are as follows:
Strategic Acquisitions
|
· |
On April 11, 2018, the Company purchased a property at 98 Parramatta Road, located adjacent to our Entertainment Themed Center (“ETC”) in Auburn, for $3.5 million (AU$4.5 million). The property consists of an approximately 16,830 square feet office building located on an estimated 20,870 square foot lot, with approximately 182 feet of frontage to Parramatta Road. The transaction is subject to a leaseback to Telstra Corporation through September 2022. The property borders our Redyard center in Auburn on three boundaries to the east, west and south. Including this acquisition, our Redyard center represents approximately 519,992 square feet (48,309 square meters) of land, with approximately 1,620 feet (498 meters) of uninterrupted frontage to Parramatta Road, a major Sydney arterial motorway. |
|
· |
Purchase of New Corporate Headquarters Building in Los Angeles County. On April 11, 2016, we purchased a 24,000 square foot office building with 72 parking spaces located at 5995 Sepulveda Boulevard in Culver City, California (an emerging high-tech and communications center in Los Angeles County) for $11.2 million cash and financed the property with a $9.9 million 10-year, fixed-rate mortgage loan. We currently use approximately 50% of the leasable area for our headquarters offices and we plan to lease the remainder to unaffiliated third parties. |
30
Opportunistic Sales
|
· |
Sale of Landholding in Burwood, Australia. On December 14, 2017, we received the final payment for Burwood of $28.1 million (AU$36.6 million), on June 19, 2017 we received $16.6 million (AU$21.8 million) as a partial payment and on May 23, 2014 we received $5.9 million (AU$6.5 million) as the initial deposit. |
Value-creating Opportunities
We are engaged in several real estate development projects to take our properties to their highest and best use. The most notable of these value-creating projects are as follows:
|
· |
Redevelopment of 44 Union Square Property in New York, USA. We secured construction financing for our Union Square property in December 2016 and have entered into a guaranteed maximum price construction management agreement with an affiliate of CNY. We anticipate that the project will be ready for the commencement of tenant fit-out at the beginning of the fourth quarter of this year. Retail and office leasing interest to date has been strong and we are currently in discussions with a number of quality tenants. This redevelopment will add approximately 23,000 square footage of rentable space to the current square footage of the building for an approximate total of 73,322 square feet of rentable space, inclusive of anticipated BOMA (Building Owners and Managers Association) adjustments and subject to lease negotiations and the final tenant mix. Since January 1, 2017, we have invested $22.9 million in this re-development project, bringing our total investment in the project as of March 31, 2018 to $37.5 million (including direct costs incurred in obtaining the related construction financing) out of a total projected investment of $74.5 million. |
|
· |
Expansion Project for our Newmarket Shopping Center at an affluent suburb of Brisbane, Australia. In December 2017 we opened our eight-screen Reading Cinema, including 10,150 square feet of additional retail space and 124 additional parking spaces. As of March 31, 2018, approximately 93% of this new retail space has been leased. |
|
· |
Courtenay Central Redesign/Expansion/Temporary Closure and the related demolition of adjacent parking building for our Courtenay Central ETC in Wellington, New Zealand. We continue to make progress on our supermarket development project at our Courtenay Central ETC in Wellington, New Zealand. On November 14, 2016, Wellington experienced a severe 7.8 magnitude earthquake. That earthquake rendered our Tory Street parking building unsafe and ultimately led to the demolition of that building and the temporary closure of our adjacent ETC, which reopened on March 29, 2017. Our supermarket tenant remains committed to the site but has delayed construction in order to upgrade to a “premium” offering. Under the agreement to lease, our tenant is responsible for any increase in our costs resulting from those design changes. In light of the demolition of the existing parking building (a major portion of the cost of which was covered by insurance), we are undertaking a comprehensive redesign analysis, intended to increase the amount of retail leasable space at the center and to better coordinate the interface between the parking building and the remainder of the center. While we work on a redesign of the property, we have activated the building with several temporary “pop-up” retail offerings. We are currently working on plans and in discussions with tenants regarding the construction of additional retail space at the site. |
We received an initial payment of $5.0 million in December 2016 and a final settlement of $20.0 million in May 2017, reaching the policy maximum of $25.0 million for the loss event. As a result, we recorded a gain of $9.2 million (NZ$12.7 million) representing excess insurance recoveries over the recorded property’s carrying value during the second quarter ended June 30, 2017. This amount is recorded net of demolition costs incurred and an allocation to lost profits, covered within the same insurance policy.
During the quarter ended June 30, 2017, we recorded a gain on business interruption recoveries of $1.5 million (NZ$2.1 million), presented as part of the relevant segment revenue lines in our Consolidated Statement of Operations for that quarter.
31
Refer to Note 19 – Insurance Recoveries on Impairment and Related Losses due to Earthquake of our 2017 Form 10K for further details on the impact of the earthquake incident.
|
· |
Cinema 1,2,3 Redevelopment – in June 2017, we entered into an exclusive dealing and pre-development agreement with our adjoining neighbors, 260-264 LLC, to jointly develop the properties, currently home to Cinemas 1,2,3 and Anassa Taverna. Under the terms of the agreement, Reading and 260-264 LLC will work together on a comprehensive mixed-use plan to co-develop the properties located on 3rd Avenue, between 59th Street and 60th Streets, in New York City. The parties have completed an initial feasibility study, analyzing various retail, entertainment and residential uses for the site and are working on the terms of a final agreement for the development of the combined property. Due to delays in these negotiations, we are currently investigating alternative opportunities for the site, which is at the present time houses one of our cinema operations. |
|
· |
Manukau Land Rezoning – in August 2016, the Auckland City Council re-zoned 64.0 acres of our 70.4 acre property in Manukau from agricultural to light industrial use. The remaining 6.4 acres were already zoned for heavy industrial use. Now that our zoning enhancement goal is achieved, we are reviewing our options with respect to the value realization opportunities and commercial exploitation of this asset. We see this property as a future value realization opportunity for us. This tract is adjacent to the Auckland Airport which has recently been expanding toward our property. We are currently working with adjoining landowners to develop an infrastructure plan for the approximately 355 acres of rezoned land of which our property is a part. |
Corporate Matters
|
· |
$25-million Stock Repurchase Program. The prior repurchase program was completed at the end of 2016. The new repurchase program approved on March 2, 2017 allows Reading to repurchase its Class A Stock from time to time in accordance with the requirements of the Securities and Exchange Commission on the open market, in block trades and in privately negotiated transactions, depending on market conditions and other factors. The Board’s authorization is for a two-year period, expiring March 1, 2019, or earlier should the full repurchase authorization be used. To date, we have repurchased 428,361 shares at an average price of $15.97 per share. |
Our Financing Strategy
Our treasury management is focused on concerted cash management using cash balances to reduce debt. We have used cash generated from operations and other excess cash, to the extent not needed for capital expenditures, to pay down our loans and credit facilities providing us flexibility on our available loan facilities for future use and, thereby, reducing interest charges. On a periodic basis, we review the maturities of our borrowing arrangements and negotiate for renewals and extensions where necessary in the current circumstances.
Over the past twelve months, we extended the maturity, in April 2017 of our NZ$35.0 million (US$25.3 million) general/non-construction credit line and our NZ$18.0 million (US$13.0 million) construction credit line of our Westpac Corporate Credit Facility to December 31, 2018, from March 31, 2018. Subsequently, in June 2017, we fully paid our loan balance using the cash received from insurance settlement relating to Courtenay Central property damage; we then further extended the maturity, in December 2017 of the NZ$35.0 million (US$25.3 million) general/non-construction credit line of our Westpac Corporate Credit Facility to December 31, 2019.
With the effectiveness of the new tax law, and the maturation of our operations in Australia and New Zealand we have adopted a global view of our financing capabilities. We have taken advantage of overseas funding resources, for example, to reduce our need to draw upon more expensive domestic borrowings in connection with our redevelopment of our Union Square property.
Refer to our Form 10-K for the year ended December 31, 2017 (“2017 Form 10-K”) for more details on our cinema and real estate segments.
32
RESULTS OF OPERATIONS
The table below summarizes the results of operations for each of our principal business segments along with the non-segment information for the three months ended March 31, 2018 and March 31, 2017:
|
|
|
|
|
|
|
|
|
|
|
|
|
|
|
|
|
|
Three Months Ended |
|
% Change |
|||||||
|
(Dollars in thousands) |
|
March 31, 2018 |
|
March 31, 2017 |
|
Fav/(Unfav) |
||||||
|
SEGMENT RESULTS |
|
|
|
|
|
|
|
|
|
|
|
|
|
|
Revenue |
|
|
|
|
|
|
|
|
|
|
|
|
|
Cinema exhibition |
|
$ |
72,255 |
|
$ |
66,560 |
|
|
9 |
% |
|
|
|
Real estate |
|
|
5,958 |
|
|
4,497 |
|
|
32 |
% |
|
|
|
Inter-segment elimination |
|
|
(2,391) |
|
|
(1,603) |
|
|
(49) |
% |
|
|
|
Total revenue |
|
|
75,822 |
|
|
69,454 |
|
|
9 |
% |
|
|
|
Operating expense |
|
|
|
|
|
|
|
|
|
|
|
|
|
Cinema exhibition |
|
|
(57,339) |
|
|
(53,385) |
|
|
(7) |
% |
|
|
|
Real estate |
|
|
(2,384) |
|
|
(2,036) |
|
|
(17) |
% |
|
|
|
Inter-segment elimination |
|
|
2,391 |
|
|
1,603 |
|
|
49 |
% |
|
|
|
Total operating expense |
|
|
(57,332) |
|
|
(53,818) |
|
|
(7) |
% |
|
|
|
Depreciation and amortization |
|
|
|
|
|
|
|
|
|
|
|
|
|
Cinema exhibition |
|
|
(3,765) |
|
|
(2,932) |
|
|
(28) |
% |
|
|
|
Real estate |
|
|
(1,369) |
|
|
(897) |
|
|
(53) |
% |
|
|
|
Total depreciation and amortization |
|
|
(5,134) |
|
|
(3,829) |
|
|
(34) |
% |
|
|
|
General and administrative expense |
|
|
|
|
|
|
|
|
|
|
|
|
|
Cinema exhibition |
|
|
(866) |
|
|
(1,150) |
|
|
25 |
% |
|
|
|
Real estate |
|
|
(574) |
|
|
(270) |
|
|
> 100 |
% |
|
|
|
Total general and administrative expense |
|
|
(1,440) |
|
|
(1,420) |
|
|
(1) |
% |
|
|
|
Segment operating income |
|
|
|
|
|
|
|
|
|
|
|
|
|
Cinema exhibition |
|
|
10,285 |
|
|
9,093 |
|
|
13 |
% |
|
|
|
Real estate |
|
|
1,631 |
|
|
1,294 |
|
|
26 |
% |
|
|
|
Total segment operating income |
|
$ |
11,916 |
|
$ |
10,387 |
|
|
15 |
% |
|
|
NON-SEGMENT RESULTS |
|
|
|
|
|
|
|
|
|
|
||
|
|
Depreciation and amortization expense |
|
|
(117) |
|
|
(106) |
|
|
nm |
||
|
|
General and administrative expense |
|
|
(6,156) |
|
|
(4,753) |
|
|
(30) |
% |
|
|
|
Interest expense, net |
|
|
(1,594) |
|
|
(1,860) |
|
|
14 |
% |
|
|
|
Equity earnings of unconsolidated joint ventures |
|
|
257 |
|
|
255 |
|
|
nm |
||
|
|
Other income/(expense) |
|
|
(82) |
|
|
821 |
|
|
nm |
||
|
|
Income before income taxes |
|
|
4,224 |
|
|
4,744 |
|
|
(11) |
% |
|
|
|
Income tax expense |
|
|
(1,155) |
|
|
(1,703) |
|
|
32 |
% |
|
|
Net income |
|
|
3,069 |
|
|
3,041 |
|
|
1 |
% |
||
|
|
Less: net income/(loss) attributable to noncontrolling interests |
|
|
22 |
|
|
12 |
|
|
nm |
||
|
Net income attributable to RDI common stockholders |
|
$ |
3,047 |
|
$ |
3,029 |
|
|
1 |
% |
||
|
Basic EPS |
|
$ |
0.13 |
|
$ |
0.13 |
|
|
- |
% |
||
“nm – not meaningful”
Consolidated and Non-Segment Results:
1st Quarter Net Results
Revenue for the quarter ended March 31, 2018 increased by 9%, or $6.4 million, to $75.8 million and net income attributable to RDI common stockholders increased by 1%, or $18,000 to $3.0 million principally due to an increase in Cinema circuit segment operating income due to the re-opening of our Courtenay Central ETC in Wellington New Zealand which was closed for the majority of Q1 2017 due to the earthquake in November 2016 and to increased operating income from our U.S. operations. These were offset by increased non-segment G&A expenses as well lower other income due to the one-off gain in 2017 from foreign exchange gain on short term funds held in our foreign operations of $825,000 that did not repeat in 2018. EPS for the quarter ended March 31, 2018 remained consistent when compared to the prior-year quarter at $0.13.
Non-Segment General & Administrative Expenses
Non-segment general and administrative expense for the quarter ended March 31, 2018 compared to the same period of the prior year increased by 30% or $1.4 million. This increase mainly relates to higher non-recurring legal expenses incurred on the Derivative Litigation, the Cotter Employment Arbitration and other Cotter litigation matters and higher compensation costs, due to headcount and the timing of annual salary increases as well as timing of recording increases in variable compensation costs.
Income Tax Expense
Income tax expense for the quarter ended March 31, 2018 decreased by $548,000 compared to equivalent prior-year period. The change between 2018 and 2017 is primarily related to (i) lower pretax income, (ii) the reduction of U.S. statutory corporate tax rate as the result of the Tax Act, and (iii) a net increase in foreign tax credit.
33
Business Segment Results
At March 31, 2018, we leased or owned and operated 55 cinemas with 444 screens, had interests in certain unconsolidated joint ventures that own an additional 3 cinemas with 29 screens and managed 1 cinema with 4 screens. During the period, we also (i) owned and operated five ETCs located in Newmarket Village (a suburb of Brisbane), Belmont (a suburb of Perth), Auburn (a suburb of Sydney) and Townsville in Australia and Wellington in New Zealand, (ii) owned and operated our headquarters office buildings in Culver City (an emerging high-tech and communications hub in Los Angeles County) and Melbourne, Australia, (iii) owned and operated the fee interests in three developed commercial properties in Manhattan and Chicago improved with live theaters comprising six stages and ancillary retail and commercial space (our fourth live theatre was closed at the end of 2015 as part of the Union Square property redevelopment), (iv) owned a 75% managing member interest in a limited liability company which in turn owns the fee interest in Cinemas 1,2,3, (v) held for development four parcels aggregating approximately 70.4 acres located in New Zealand, (vi) owned a 50% managing member interest in a limited liability company which in turn owns a 202-acre property that is zoned approximately 150 acres for single-family residential use (maximum of 550 homes) and approximately 50 acres for high density mixed use in the U.S. and that is held for development, and (vii) owned approximately 200 acres in Pennsylvania and New Jersey from our legacy railroad business, including the Reading Viaduct in downtown Philadelphia.
The Company transacts business in Australia and New Zealand and is subject to risks associated with changing foreign currency exchange rates. The Australian and New Zealand Dollars both strengthened against the US Dollar by 4% and 2%, respectively, comparing the average exchange rate movements during the first quarter of 2018 to those during the same period of 2017. This had the effect of slightly increasing the value of our Australian and New Zealand assets, liabilities, revenues and expenses. Refer to Note 3 – Operations in Foreign Currency for further information.
34
Cinema Exhibition
The following table details our cinema exhibition segment operating results for the quarter ended March 31, 2018 and March 31, 2017, respectively:
|
|
|
|
|
|
|
|
|
|
|
|
|
|
|
|
|
|
|
|
Three Months Ended |
|
|
|
||||||
|
(Dollars in thousands) |
|
March 31, 2018 |
% of Revenue |
|
March 31, 2017 |
% of Revenue |
|
% Change - Fav/(Unfav) |
|||||
|
REVENUE |
|
|
|
|
|
|
|
|
|
|
|
||
|
|
United States |
Admissions revenue |
|
$ |
24,706 |
34% |
|
$ |
23,226 |
35% |
|
6 |
% |
|
|
|
Food & beverage revenue |
|
|
10,765 |
15% |
|
|
10,735 |
16% |
|
- |
% |
|
|
|
Advertising and other revenue |
|
|
2,516 |
3% |
|
|
2,275 |
3% |
|
11 |
% |
|
|
|
|
|
$ |
37,987 |
53% |
|
$ |
36,236 |
54% |
|
5 |
% |
|
|
Australia |
Admissions revenue |
|
$ |
17,051 |
24% |
|
$ |
15,974 |
24% |
|
7 |
% |
|
|
|
Food & beverage revenue |
|
|
7,837 |
11% |
|
|
7,264 |
11% |
|
8 |
% |
|
|
|
Advertising and other revenue |
|
|
1,829 |
3% |
|
|
1,720 |
3% |
|
6 |
% |
|
|
|
|
|
$ |
26,717 |
37% |
|
$ |
24,958 |
37% |
|
7 |
% |
|
|
New Zealand |
Admissions revenue |
|
$ |
4,934 |
7% |
|
$ |
3,666 |
6% |
|
35 |
% |
|
|
|
Food & beverage revenue |
|
|
2,266 |
3% |
|
|
1,417 |
2% |
|
60 |
% |
|
|
|
Advertising and other revenue |
|
|
351 |
0% |
|
|
283 |
0% |
|
24 |
% |
|
|
|
|
|
$ |
7,551 |
10% |
|
$ |
5,366 |
8% |
|
41 |
% |
|
|
|
|
|
|
|
|
|
|
|
|
|
|
|
|
|
Total revenue |
|
$ |
72,255 |
100% |
|
$ |
66,560 |
100% |
|
9 |
% |
|
|
OPERATING EXPENSE |
|
|
|
|
|
|
|
|
|
|
|
||
|
|
United States |
Film rent and advertising cost |
|
$ |
(12,875) |
18% |
|
$ |
(12,182) |
18% |
|
(6) |
% |
|
|
|
Food & beverage cost |
|
|
(2,302) |
3% |
|
|
(2,027) |
3% |
|
(14) |
% |
|
|
|
Occupancy expense |
|
|
(7,202) |
10% |
|
|
(6,929) |
10% |
|
(4) |
% |
|
|
|
Other operating expense |
|
|
(9,942) |
14% |
|
|
(10,359) |
16% |
|
4 |
% |
|
|
|
|
|
$ |
(32,321) |
45% |
|
$ |
(31,497) |
47% |
|
(3) |
% |
|
|
Australia |
Film rent and advertising cost |
|
$ |
(7,699) |
11% |
|
$ |
(7,306) |
11% |
|
(5) |
% |
|
|
|
Food & beverage cost |
|
|
(1,594) |
2% |
|
|
(1,592) |
2% |
|
- |
% |
|
|
|
Occupancy expense |
|
|
(4,251) |
6% |
|
|
(3,687) |
6% |
|
(15) |
% |
|
|
|
Other operating expense |
|
|
(5,754) |
8% |
|
|
(5,022) |
8% |
|
(15) |
% |
|
|
|
|
|
$ |
(19,298) |
27% |
|
$ |
(17,607) |
26% |
|
(10) |
% |
|
|
New Zealand |
Film rent and advertising cost |
|
$ |
(2,232) |
3% |
|
$ |
(1,634) |
2% |
|
(37) |
% |
|
|
|
Food & beverage cost |
|
|
(491) |
1% |
|
|
(298) |
0% |
|
(65) |
% |
|
|
|
Occupancy expense |
|
|
(1,344) |
2% |
|
|
(875) |
1% |
|
(54) |
% |
|
|
|
Other operating expense |
|
|
(1,653) |
2% |
|
|
(1,472) |
2% |
|
(12) |
% |
|
|
|
|
|
$ |
(5,720) |
8% |
|
$ |
(4,279) |
6% |
|
(34) |
% |
|
|
|
|
|
|
|
|
|
|
|
|
|
|
|
|
|
Total operating expense |
|
$ |
(57,339) |
79% |
|
$ |
(53,383) |
80% |
|
(7) |
% |
|
|
DEPRECIATION, AMORTIZATION, GENERAL AND ADMINISTRATIVE EXPENSE |
|
|
|
|
|
|
|
|
|
|
|
||
|
|
United States |
Depreciation and amortization |
|
$ |
(2,121) |
3% |
|
$ |
(1,410) |
2% |
|
(50) |
% |
|
|
|
General and administrative expense |
|
|
(545) |
1% |
|
|
(822) |
1% |
|
34 |
% |
|
|
|
|
|
$ |
(2,666) |
4% |
|
$ |
(2,232) |
3% |
|
(19) |
% |
|
|
Australia |
Depreciation and amortization |
|
$ |
(1,204) |
2% |
|
$ |
(1,081) |
2% |
|
(11) |
% |
|
|
|
General and administrative expense |
|
|
(299) |
0% |
|
|
(324) |
0% |
|
8 |
% |
|
|
|
|
|
$ |
(1,503) |
2% |
|
$ |
(1,405) |
2% |
|
(7) |
% |
|
|
New Zealand |
Depreciation and amortization |
|
$ |
(440) |
1% |
|
$ |
(441) |
1% |
|
- |
% |
|
|
|
General and administrative expense |
|
|
(22) |
0% |
|
|
(4) |
0% |
|
nm |
|
|
|
|
|
|
$ |
(462) |
1% |
|
$ |
(445) |
1% |
|
(4) |
% |
|
|
|
|
|
|
|
|
|
|
|
|
|
|
|
|
|
Total depreciation, amortization, general and administrative expense |
|
$ |
(4,631) |
6% |
|
$ |
(4,082) |
6% |
|
(13) |
% |
|
|
OPERATING INCOME – CINEMA |
|
|
|
|
|
|
|
|
|
|
|
||
|
|
United States |
|
$ |
3,000 |
4% |
|
$ |
2,507 |
4% |
|
20 |
% |
|
|
|
Australia |
|
|
5,916 |
8% |
|
|
5,945 |
9% |
|
- |
% |
|
|
|
New Zealand |
|
|
1,369 |
2% |
|
|
641 |
1% |
|
114 |
% |
|
|
|
Total Cinema operating income |
|
$ |
10,285 |
14% |
|
$ |
9,093 |
14% |
|
13 |
% |
|
“nm – not meaningful”
Cinema Segment operating income
Cinema segment operating income increased by 13%, or $1.2 million, to $10.3 million for the quarter ended March 31, 2018 compared to March 31, 2017, primarily driven by the re-opening of our Courtenay Central Cinema in Wellington, New Zealand as well as increased operating income in the U.S. due to higher average ticket price (“ATP”) and higher spend per patron (“SPP”) across the circuit in all jurisdictions.
35
Revenue
Cinema revenue increased by 9%, or $5.7 million, to $72.3 million for the quarter ended March 31, 2018 compared to March 31, 2017, primarily attributable to an increase in attendance in our New Zealand Cinemas, due to the re-opening of Courtenay Central Cinema as well as increases in ATP in our U.S. and Australian Cinemas and an increase in SPP across all jurisdictions. Here are the changes in our cinema revenue by market:
|
· |
U.S. cinema revenue increased by 5%, or $1.8 million, due to a 9% increase in ATP and 2% increase in SPP offset by a 2% decrease in attendance. |
|
· |
Australia cinema revenue increased by 7%, or $1.8 million, primarily due to a 5% increase in ATP, a 6% increase in SPP and a 2% increase due to more favorable foreign exchange rate offset by a 2% decrease in attendance. |
|
· |
New Zealand cinema revenue increased by 41%, or $2.2 million, as a result of the 34% increase in attendance, a 12% increase in SPP and a 4% increase due to more favorable foreign exchange rate offset by a slight decrease in ATP. |
Operating expense
Operating expense for the quarter ended March 31, 2018 increased by 7%, or $4.0 million, primarily attributable to (i) higher film rent due to higher admissions revenue and (ii) higher F&B costs due to higher sales of F&B revenue and (iii) higher occupancy costs due to the opening of Newmarket and the re-opening of Courtenay Central and (iv) the unfavorable impact of foreign currency movements. These increases have been offset by savings on digital projection leasing costs in the U.S. due to the company purchasing the projectors from the lessor at the start of the year, reducing our leasing charges.
Operating expense as a percentage of gross revenue has been steady with a slight decrease of 1%, to 79%.
Depreciation, amortization, general and administrative expense
Depreciation, amortization, general and administrative expense for the quarter ended March 31, 2018 increased by 13%, or $549,000, mainly due to an increase in depreciation due to the purchase of our digital leasing equipment previously leased.
36
Real Estate
The following table details our real estate segment operating results for the quarter ended March 31, 2018 and 2017, respectively:
|
|
|
|
|
|
|
|
|
|
|
|
|
|
|
|
|
|
|
|
Three Months Ended |
|
|
|
||||||
|
(Dollars in thousands) |
|
March 31, 2018 |
% of Revenue |
|
March 31, 2017 |
% of Revenue |
|
% Change - Fav/(Unfav) |
|||||
|
REVENUE |
|
|
|
|
|
|
|
|
|
|
|
||
|
|
United States |
Live theater rental and ancillary income |
|
$ |
599 |
10% |
|
$ |
492 |
11% |
|
22 |
% |
|
|
|
Property rental income |
|
|
56 |
1% |
|
|
94 |
2% |
|
(40) |
% |
|
|
|
|
|
|
655 |
11% |
|
|
586 |
13% |
|
12 |
% |
|
|
Australia |
Property rental income |
|
|
4,104 |
69% |
|
|
3,586 |
80% |
|
14 |
% |
|
|
New Zealand |
Property rental income |
|
|
1,199 |
20% |
|
|
325 |
7% |
|
269 |
% |
|
|
|
|
|
|
|
|
|
|
|
|
|
|
|
|
|
Total revenue |
|
$ |
5,958 |
100% |
|
$ |
4,497 |
100% |
|
32 |
% |
|
|
OPERATING EXPENSE |
|
|
|
|
|
|
|
|
|
|
|
||
|
|
United States |
Live theater cost |
|
$ |
(296) |
5% |
|
$ |
(209) |
5% |
|
(42) |
% |
|
|
|
Property cost |
|
|
(134) |
2% |
|
|
(110) |
2% |
|
(22) |
% |
|
|
|
Occupancy expense |
|
|
(163) |
3% |
|
|
(148) |
3% |
|
(10) |
% |
|
|
|
|
|
|
(593) |
10% |
|
|
(467) |
10% |
|
(27) |
% |
|
|
Australia |
Property cost |
|
|
(752) |
13% |
|
|
(761) |
17% |
|
1 |
% |
|
|
|
Occupancy expense |
|
|
(567) |
10% |
|
|
(537) |
12% |
|
(6) |
% |
|
|
|
|
|
|
(1,319) |
22% |
|
|
(1,298) |
29% |
|
(2) |
% |
|
|
New Zealand |
Property cost |
|
|
(321) |
5% |
|
|
(129) |
3% |
|
(149) |
% |
|
|
|
Occupancy expense |
|
|
(150) |
3% |
|
|
(142) |
3% |
|
(6) |
% |
|
|
|
|
|
|
(471) |
8% |
|
|
(271) |
6% |
|
(74) |
% |
|
|
|
|
|
|
|
|
|
|
|
|
|
|
|
|
|
Total operating expense |
|
$ |
(2,383) |
40% |
|
$ |
(2,036) |
45% |
|
(17) |
% |
|
|
DEPRECIATION, AMORTIZATION, GENERAL AND ADMINISTRATIVE EXPENSE |
|
|
|
|
|
|
|
|
|
|
|
||
|
|
United States |
Depreciation and amortization |
|
$ |
(192) |
3% |
|
$ |
(90) |
2% |
|
(113) |
% |
|
|
|
General and administrative expense |
|
|
(163) |
3% |
|
|
(1) |
0% |
|
nm |
% |
|
|
|
|
|
|
(355) |
6% |
|
|
(91) |
2% |
|
(290) |
% |
|
|
Australia |
Depreciation and amortization |
|
$ |
(909) |
15% |
|
$ |
(619) |
14% |
|
(47) |
% |
|
|
|
General and administrative expense |
|
|
(411) |
7% |
|
|
(261) |
6% |
|
(57) |
% |
|
|
|
|
|
|
(1,320) |
22% |
|
|
(880) |
20% |
|
(50) |
% |
|
|
New Zealand |
Depreciation and amortization |
|
|
(269) |
5% |
|
|
(188) |
4% |
|
(43) |
% |
|
|
|
General and administrative expense |
|
|
- |
0% |
|
|
(8) |
0% |
|
100 |
% |
|
|
|
|
|
|
(269) |
5% |
|
|
(196) |
4% |
|
(37) |
% |
|
|
Total depreciation, amortization, general and administrative expense |
|
$ |
(1,944) |
33% |
|
$ |
(1,167) |
26% |
|
(67) |
% |
|
|
OPERATING INCOME - REAL ESTATE |
|
|
|
|
|
|
|
|
|
|
|
||
|
|
United States |
|
$ |
(293) |
(5)% |
|
$ |
28 |
1% |
|
nm |
% |
|
|
|
Australia |
|
|
1,465 |
25% |
|
|
1,408 |
31% |
|
4 |
% |
|
|
|
New Zealand |
|
|
459 |
8% |
|
|
(142) |
(3)% |
|
nm |
% |
|
|
|
Total real estate operating income |
|
$ |
1,631 |
27% |
|
$ |
1,294 |
29% |
|
26 |
% |
|
“nm – not meaningful”
Real Estate Segment operating income
Real estate segment operating income increased by 26%, or $337,000, to $1.6 million for the quarter ended March 31, 2018 compared to March 31, 2017, primarily attributable to increased operating revenue from our Courtenay Central ETC due to the full quarter of operating in 2018 compared to only a few days in 2017 as well as the increased income due to expansion of our Newmarket and Auburn ETCs in Australia taking effect. This was partially offset due to increases in depreciation due to occupying our headquarters building in Culver City and a decline in lease revenue due to a fire at our property in Chicago. While we have the benefit of business interruption insurance, proceeds of this insurance are not recognized until received. Please refer below for further explanation.
Revenue
Real estate revenue for the quarter increased by 32%, or $1.5 million mainly driven by additional revenue from the re-opening of our Courtenay Central ETC being open for the entire quarter in 2018 as well as increased property rental income in Australia due to new tenancies in our expanded Auburn and Newmarket ETCs as well as increased revenue from our live theater business, offset by the loss of rental revenue due to a fire at our Chicago property.
Operating expense
Operating expense for the quarter ended March 31, 2018 increased by 17%, or $347,000, due to the following:
|
· |
for the U.S, operating expenses on our Corporate Headquarters in Los Angeles; and, |
|
· |
an increase in costs associated with our live theater business. |
|
· |
for Australia increases as a result of the increased operations at Newmarket and Auburn. |
37
|
· |
for New Zealand, relating to the return to normal operations at our Courtenay Central ETC. |
Depreciation, amortization, general and administrative expense
Depreciation, amortization, general and administrative expense for the quarter ended March 31, 2018 increased by 67%, or $777,000, primarily driven by (i) increased depreciation expense due to capital enhancements at various worldwide locations and (ii) increased salary costs due to staff expansion as we continue to develop our internal Real Estate capacity in New York, Australia and New Zealand.
LIQUIDITY AND CAPITAL RESOURCES
Our cinema exhibition business plan is to continue to identify, develop, and acquire cinema properties, where reasonably available, that allow us to leverage our cinema expertise and technology over a larger operating base. In addition, we are refurbishing our cinema properties where feasible and appropriate, by adding (1) premium projection and sound presentation, (2) recliner seating, and (3) enhanced food and beverage options. Our real estate business plan is to re-develop our existing property assets, where appropriate, to be sensitive to opportunities to convert our entertainment assets to higher and better uses, or, when appropriate, to dispose of such assets. In addition, we review opportunities to monetize our assets where such action could lead to a financially acceptable outcome. With the exception of our Cinemas 1,2,3 property, we do not have any plans to sell or convert any of our cinema operating properties, but instead intend, to the extent feasible and appropriate, to continue to upgrade our cinema operations. We also continue to investigate potential synergistic acquisitions that may not readily fall into either of our two cinema or real estate segments.
Liquidity risk is the risk relating to our ability to meet our financial obligations when they come due. In today’s environment, our financial obligations arise mainly from capital expenditure needs, working capital requirements, and debt servicing requirements. We manage the liquidity risk by ensuring our ability to generate sufficient cash flows from operating activities and to obtain adequate, reasonable financing and/or to convert non-performing or non-strategic assets into cash.
The changes in cash and cash equivalents are discussed as follows:
|
|
|
|
|
|
|
|
|
|
|
||
|
|
|
Three Months Ended |
|
|
|
|
|
||||
|
(Dollars in thousands) |
|
March 31, 2018 |
|
March 31, 2017 |
|
% Change |
|||||
|
Net cash provided by operating activities |
|
$ |
2,452 |
|
$ |
311 |
|
688 |
% |
||
|
Net cash used in investing activities |
|
|
(23,491) |
|
|
(10,924) |
|
(115) |
% |
||
|
Net cash provided by financing activities |
|
|
16,161 |
|
|
2,540 |
|
536 |
% |
||
|
Effect of exchange rate changes on cash and cash equivalents |
|
|
(122) |
|
|
87 |
|
(240) |
% |
||
|
Decrease in cash and cash equivalents |
|
$ |
(5,000) |
|
$ |
(7,986) |
|
37 |
% |
||
Operating activities
Cash provided by operating activities for the first three months of 2018 increased by $2.1 million, to $2.5 primarily driven by $1.7 million higher cash inflows from operating activities as well as a $450,000 decrease in net operating assets.
Investing activities
Cash used in investing activities during the quarter ended March 31, 2018 increased by $12.6 million compared to same period of 2017, to net cash used of $23.5 million, primarily due to our ongoing real estate development and cinema refurbishment activities.
Financing Activities
The $16.2 million net cash provided from financing activities during the three months ended March 31, 2018 was primarily related to $16.3 million of new borrowings (net of $9.2 million of repayments).
We manage our cash, investments and capital structure so we are able to meet the short-term and long-term obligations of our business, while maintaining financial flexibility and liquidity. We forecast, analyze and monitor our cash flows to enable investment and financing within the overall constraints of our financial strategy.
At March 31, 2018, our consolidated cash and cash equivalents totaled $8.7 million. Of this amount, $1.9 million and $1.4 million were held by our Australian and New Zealand subsidiaries, respectively. Our intention is to indefinitely reinvest Australian earnings but not indefinitely reinvest New Zealand earnings. If the Australian earnings were used to fund U.S. operations, they would be subject to additional state income taxes upon repatriation.
38
We have historically funded our working capital requirements, capital expenditures, investments in the acquisition of individual properties primarily from internally generated cash flows and lines of credit. As noted in the succeeding table, we have $64.0 million unused/unrestricted capacity of credit facilities at March 31, 2018. In addition, we have $48.3 million and $13.0 million (NZ$18.0 million) unused capacity for Union Square development uses and construction funding for New Zealand, respectively. The Minetta and Orpheum Theatres Loan will become due on June 1, 2018. Currently, we are negotiating with our lender to renew this borrowing on a long-term basis. We have commenced negotiations with our lenders in Australia, New Zealand and the US regarding the renewal and or replacement of corporate debt facilities that mature during 2019. There can be no assurance that we will be able to renew, extend or replace any of these loans on a timely basis or upon favorable terms.
As part of our operating cycle, we utilize cash collected from (i) our cinema business when selling tickets and food and beverage items, and (ii) rental income typically received in advance, to reduce our long term borrowings and realize savings on interest charges. We then settle our operating expenses generally with a lag within traditional trade terms. This generates a temporary working capital deficit. As discussed previously, we review the maturities of our borrowings and negotiate for renewals and extensions, as necessary for liquidity purposes. We believe the cash flow generated from our operations coupled with our ability to renew loans when due will provide sufficient liquidity in the upcoming year.
The table below presents the changes in our total available resources (cash and borrowings), debt-to-equity ratio, working capital and other relevant information addressing our liquidity for the three months ended March 31, 2018 and preceding four years:
|
|
As of and for the 3-Months Ended |
Year Ended December 31 |
|||||||||||||
|
($ in thousands) |
3/31/2018 |
2017 |
2016 |
2015 |
2014 |
||||||||||
|
Total Resources (cash and borrowings) |
|||||||||||||||
|
Cash and cash equivalents (unrestricted) |
$ |
8,668 |
$ |
13,668 |
$ |
19,017 |
$ |
19,702 |
$ |
50,248 | |||||
|
Unused borrowing facility |
125,326 | 137,231 | 117,599 | 70,134 | 45,700 | ||||||||||
|
Restricted for capital projects(1) |
61,375 | 62,280 | 62,024 | 10,263 |
-- |
||||||||||
|
Unrestricted capacity |
63,951 | 74,951 | 55,575 | 59,871 | 45,700 | ||||||||||
|
Total resources at period end |
133,994 | 150,899 | 136,616 | 89,836 | 95,948 | ||||||||||
|
Total unrestricted resources at period end |
72,619 | 88,619 | 74,592 | 79,573 | 95,948 | ||||||||||
|
Debt-to-Equity Ratio |
|||||||||||||||
|
Total contractual facility |
$ |
275,511 |
$ |
271,732 |
$ |
266,134 |
$ |
207,075 |
$ |
201,318 | |||||
|
Total debt (gross of deferred financing costs) |
150,185 | 134,501 | 148,535 | 130,941 | 164,036 | ||||||||||
|
Current |
10,544 | 8,109 | 567 | 15,000 | 38,104 | ||||||||||
|
Non-current |
139,641 | 126,392 | 147,968 | 115,941 | 125,932 | ||||||||||
|
Total book equity |
183,755 | 181,241 | 146,615 | 138,951 | 133,716 | ||||||||||
|
Debt-to-equity ratio |
0.82 | 0.74 | 1.01 | 0.94 | 1.23 | ||||||||||
|
Changes in Working Capital |
|||||||||||||||
|
Working capital (deficit) |
$ |
(40,530) |
$ |
(46,971) |
$ |
6,655 |
$ |
(35,581) |
$ |
(15,119) | |||||
|
Current ratio |
0.39 | 0.42 | 1.10 | 0.51 | 0.84 | ||||||||||
|
Capital Expenditures (including acquisitions) |
$ |
23,231 |
$ |
76,708 |
$ |
49,166 |
$ |
53,119 |
$ |
14,914 | |||||
(1) This relates to the construction facilities specifically negotiated for: (i) Union Square redevelopment project, obtained in December 2016, and (ii) New Zealand construction projects, obtained in May 2015.
CONTRACTUAL OBLIGATIONS, COMMITMENTS AND CONTINGENCIES
The following table provides information with respect to the maturities and scheduled principal repayments of our recorded contractual obligations and certain of our commitments and contingencies, either recorded or off-balance sheet, as of March 31, 2018:
|
|
|||||||||||||||||||||
|
(Dollars in thousands) |
2018 |
2019 |
2020 |
2021 |
2022 |
Thereafter |
Total |
||||||||||||||
|
Debt(1) |
$ |
7,978 |
$ |
103,348 |
$ |
248 |
$ |
258 |
$ |
270 |
$ |
8,485 |
$ |
120,587 | |||||||
|
Subordinated debt(1) |
-- |
-- |
-- |
-- |
-- |
27,913 | 27,913 | ||||||||||||||
|
Pension liability |
513 | 684 | 684 | 684 | 684 | 2,482 | 5,731 | ||||||||||||||
|
Village East purchase option(3) |
5,900 |
-- |
-- |
-- |
-- |
-- |
5,900 | ||||||||||||||
|
Lease obligations |
23,640 | 31,443 | 26,598 | 26,334 | 25,827 | 206,691 | 340,533 | ||||||||||||||
|
Estimated interest on debt (2) |
5,468 | 5,657 | 1,983 | 1,971 | 1,959 | 8,513 | 25,551 | ||||||||||||||
|
Total |
$ |
43,499 |
$ |
141,132 |
$ |
29,513 |
$ |
29,247 |
$ |
28,740 |
$ |
254,084 |
$ |
526,215 | |||||||
(1) Information is presented exclusive of deferred financing costs.
(2) Estimated interest on debt is based on the anticipated loan balances for future periods and current applicable interest rates.
(3) Represents the lease liability of the put right held by our landlord to put to us its ground lessee’s interest in the ground lease underlying our sublease of the Village East cinema.
Refer to Note 13 – Commitments and Contingencies for additional information.
39
Litigation
We are currently involved in certain legal proceedings and, as required, have accrued estimates of probable and estimable losses for the resolution of these claims.
Where we are the plaintiffs, we expense all legal fees on an on-going basis and make no provision for any potential settlement amounts until received. In Australia, the prevailing party is usually entitled to recover its attorneys’ fees, which typically work out to be approximately 60% of the amounts actually spent where first class legal counsel is engaged at customary rates. Where we are a plaintiff, we have likewise made no provision for the liability for the defendant’s attorneys' fees in the event we are determined not to be the prevailing party.
Where we are the defendants, we accrue for probable damages that insurance may not cover as they become known and can be reasonably estimated. In our opinion, any claims and litigation in which we are currently involved are not reasonably likely to have a material adverse effect on our business, results of operations, financial position, or liquidity. It is possible, however, that future results of the operations for any particular quarterly or annual period could be materially affected by the ultimate outcome of the legal proceedings. Please refer to Item 3 – Legal Proceedings in our 2017 Form 10-K for more information. There have been no material changes to our litigation exposure since our 2017 Form 10-K, except as set forth in Note 13 – Commitments and Contingencies in the accompanying consolidated financial statements include in this Form 10-Q.
Off-Balance Sheet Arrangements
Other than the operating lease arrangements mostly relating to our operating cinemas, there are no off-balance sheet arrangements or obligations (including contingent obligations) that have, or are reasonably likely to have, a current or future material effect on our financial condition, changes in the financial condition, revenue or expense, results of operations, liquidity, capital expenditures or capital resources.
CRITICAL ACCOUNTING POLICIES
The SEC defines critical accounting policies as those that are, in management’s view, most important to the portrayal of the Company’s financial condition and results of operations and the most demanding in their calls on judgment. We believe our most critical accounting policies relate to:
|
· |
impairment of long-lived assets, including goodwill and intangible assets; |
|
· |
recognition of gift card and gift certificate breakage income; |
|
· |
deferral of customer loyalty income; |
|
· |
tax valuation allowance and obligations, and, |
|
· |
contingencies (including the insurance recoverability of losses incurred as a result of the recent earthquake in New Zealand). |
We provided detailed discussion regarding these critical accounting policies in our 2017 Form 10-K and advise you to refer to that discussion. Refer to Note 2 – Summary of Significant Accounting Policies – Recently Adopted and Issued Accounting Pronouncements for more information regarding recently adopted and issued accounting pronouncements.
40
FINANCIAL RISK MANAGEMENT
Currency and interest rate risk
The Company’s objective in managing exposure to foreign currency and interest rate fluctuations is to reduce volatility of earnings and cash flows in order to allow management to focus on core business issues and challenges.
We currently manage our currency exposure by creating, whenever possible, natural hedges in Australia and New Zealand. This involves local country sourcing of goods and services as well as borrowing in local currencies to match revenues and expenses. Since we intend to conduct business mostly on a self-funding basis, except for funds used to pay an appropriate share of our domestic corporate overhead), we do not believe the currency fluctuations presents a material risk to the Company. As such, we do not use derivative financial instruments to hedge against the risk of foreign currency exposure.
Set forth below is a chart reflecting the currency trends for the Australian and New Zealand Dollars vis-à-vis the U.S. Dollar since 1996.
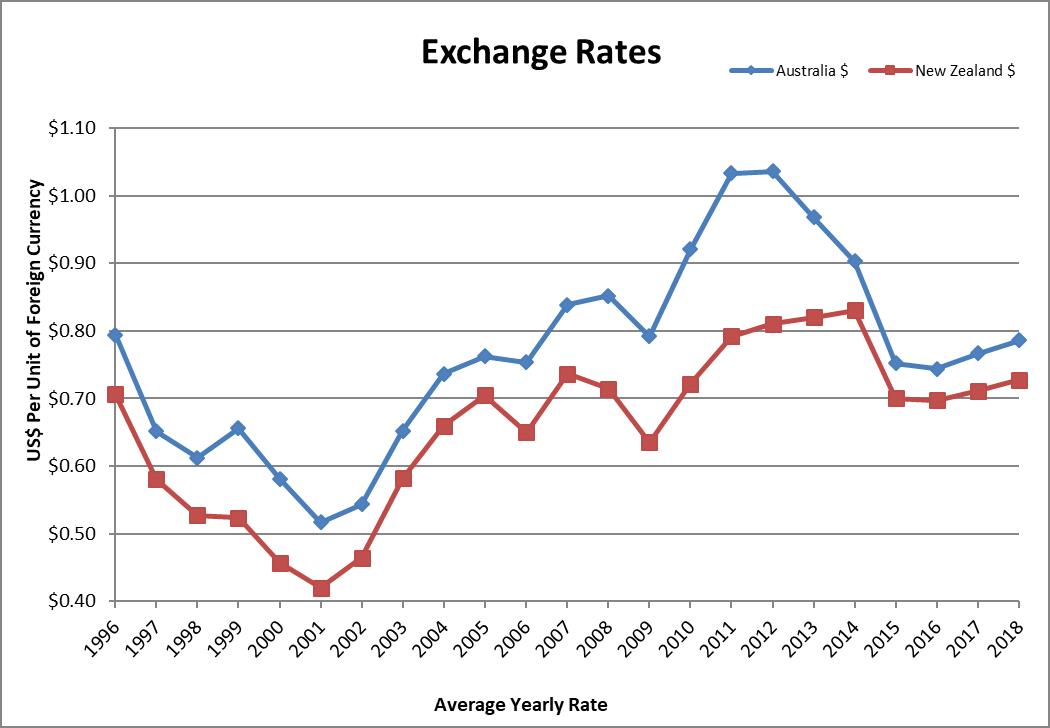
Our exposure to interest rate risk arises out of our intermediate term floating-rate borrowings. To manage the risk, we utilize interest rate derivative contracts to convert certain floating-rate borrowings into fixed-rate borrowings. It is the Company’s policy to enter into interest rate derivative transactions only to the extent considered necessary to meet its objectives as stated above. The Company does not enter into these transactions or any other hedging transactions for speculative purposes.
Inflation
We continually monitor inflation and the effects of changing prices. Inflation increases the cost of goods and services used. Competitive conditions in many of our markets restrict our ability to recover fully the higher costs of acquired goods and services through price increases. We attempt to mitigate the impact of inflation by implementing continuous process improvement solutions to enhance productivity and efficiency and, as a result, lower costs and operating expenses. In our opinion, we have managed the effects of inflation appropriately, and, as a result, it has not had a material impact on our operations and the resulting financial position or liquidity.
41
FORWARD LOOKING STATEMENTS
Our statements in this interim quarterly report contain a variety of forward-looking statements as defined by the Securities Litigation Reform Act of 1995. Forward-looking statements reflect only our expectations regarding future events and operating performance and necessarily speak only as of the date the information was prepared. No guarantees can be given that our expectation will in fact be realized, in whole or in part. You can recognize these statements by our use of words such as, by way of example, “may,” “will,” “expect,” “believe,” and “anticipate” or other similar terminology.
These forward-looking statements reflect our expectation after having considered a variety of risks and uncertainties. However, they are necessarily the product of internal discussion and do not necessarily completely reflect the views of individual members of our Board of Directors or of our management team. Individual Board members and individual members of our management team may have a different view as to the risks and uncertainties involved, and may have different views as to future events or our operating performance.
Among the factors that could cause actual results to differ materially from those expressed in or underlying our forward-looking statements are the following:
|
· |
with respect to our cinema operations: |
|
o |
the number and attractiveness to movie goers of the films released in future periods; |
|
o |
the amount of money spent by film distributors to promote their motion pictures; |
|
o |
the licensing fees and terms required by film distributors from motion picture exhibitors in order to exhibit their films; |
|
o |
the comparative attractiveness of motion pictures as a source of entertainment and willingness and/or ability of consumers (i) to spend their dollars on entertainment and (ii) to spend their entertainment dollars on movies in an outside the home environment; |
|
o |
the extent to which we encounter competition from other cinema exhibitors, from other sources of outside-the-home entertainment, and from inside-the-home entertainment options, such as “home theaters” and competitive film product distribution technology such as, by way of example, cable, satellite broadcast and DVD rentals and sales, and online streaming; |
|
o |
the cost and impact of improvements to our cinemas, such as improved seating, enhanced food and beverage offerings and other improvements; |
|
o |
disruptions from theater improvements; and |
|
o |
the extent to and the efficiency with which we are able to integrate acquisitions of cinema circuits with our existing operations. |
|
· |
with respect to our real estate development and operation activities: |
|
o |
the rental rates and capitalization rates applicable to the markets in which we operate and the quality of properties that we own; |
|
o |
the extent to which we can obtain on a timely basis the various land use approvals and entitlements needed to develop our properties; |
|
o |
the risks and uncertainties associated with real estate development; |
|
o |
the availability and cost of labor and materials; |
|
o |
the ability to obtain all permits to construct improvements; |
|
o |
the ability to finance improvements; |
|
o |
the disruptions from construction; |
|
o |
the possibility of construction delays, work stoppage and material shortage; |
|
o |
competition for development sites and tenants; |
|
o |
environmental remediation issues; |
|
o |
the extent to which our cinemas can continue to serve as an anchor tenant that will, in turn, be influenced by the same factors as will influence generally the results of our cinema operations; |
|
o |
the ability to negotiate and execute joint venture opportunities and relationships; and |
|
o |
certain of our activities are in geologically active areas, creating a risk of damage and/or disruption of real estate and/or cinema businesses from earthquakes. |
|
· |
with respect to our operations generally as an international company involved in both the development and operation of cinemas and the development and operation of real estate; and previously engaged for many years in the railroad business in the United States: |
|
o |
our ability to renew, extend or renegotiate the our loans that mature in 2018; |
|
o |
our ongoing access to borrowed funds and capital and the interest that must be paid on that debt and the returns that must be paid on such capital; |
|
o |
expenses, management and Board distraction and other effects of the litigation efforts mounted by James Cotter, Jr. against the Company, including his efforts to cause a sale of voting control of the Company; |
|
o |
the relative values of the currency used in the countries in which we operate; |
42
|
o |
changes in government regulation, including by way of example, the costs resulting from the implementation of the requirements of Sarbanes-Oxley; |
|
o |
our labor relations and costs of labor (including future government requirements with respect to pension liabilities, disability insurance and health coverage, and vacations and leave); |
|
o |
our exposure from time to time to legal claims and to uninsurable risks such as those related to our historic railroad operations, including potential environmental claims and health-related claims relating to alleged exposure to asbestos or other substances now or in the future recognized as being possible causes of cancer or other health related problems; |
|
o |
our exposure to cyber-security risks, including misappropriation of customer information or other breaches of information security; |
|
o |
changes in future effective tax rates and the results of currently ongoing and future potential audits by taxing authorities having jurisdiction over our various companies; and |
|
o |
changes in applicable accounting policies and practices. |
The above list is not necessarily exhaustive, as business is by definition unpredictable and risky, and subject to influence by numerous factors outside of our control, such as changes in government regulation or policy, competition, interest rates, supply, technological innovation, changes in consumer taste and fancy, weather, and the extent to which consumers in our markets have the economic wherewithal to spend money on beyond-the-home entertainment.
Given the variety and unpredictability of the factors that will ultimately influence our businesses and our results of operation, it naturally follows that no guarantees can be given that any of our forward-looking statements will ultimately prove to be correct. Actual results will undoubtedly vary and there is no guarantee as to how our securities will perform either when considered in isolation or when compared to other securities or investment opportunities.
Finally, we undertake no obligation to update publicly or to revise any of our forward-looking statements, whether as a result of new information, future events or otherwise, except as may be required under applicable law. Accordingly, you should always note the date to which our forward-looking statements speak.
Additionally, certain of the presentations included in this interim quarterly report may contain “non-GAAP financial measures.” In such case, a reconciliation of this information to our GAAP financial statements will be made available in connection with such statements.
43
Item 3 – Quantitative and Qualitative Disclosure about Market Risk
The SEC requires that registrants include information about potential effects of changes in currency exchange and interest rates in their filings. Several alternatives, all with some limitations, have been offered. We base the following discussion on a sensitivity analysis that models the effects of fluctuations in currency exchange rates and interest rates. This analysis is constrained by several factors, including the following:
|
· |
It is based on a single point in time; and |
|
· |
It does not include the effects of other complex market reactions that would arise from the changes modeled. |
Although the results of such an analysis may be useful as a benchmark, they should not be viewed as forecasts.
At March 31, 2018, approximately 39% and 15% of our assets were invested in assets denominated in Australian dollars (Reading Australia) and New Zealand dollars (Reading New Zealand), respectively, including approximately $3.3 million in cash and cash equivalents. At December 31, 2017, approximately 40% and 15% of our assets were invested in assets denominated in Australian dollars (Reading Australia) and New Zealand dollars (Reading New Zealand), including approximately $4.5 million in cash and cash equivalents.
Our policy in Australia and New Zealand is to match revenues and expenses, whenever possible, in local currencies. As a result, we have procured a majority of our expenses in Australia and New Zealand in local currencies. Despite this natural hedge, recent movements in foreign currencies have had an effect on our current earnings. Although foreign currency has had an effect on our current earnings, the effect of the translation adjustment on our assets and liabilities noted in our other comprehensive income was an increase of $0.8 million for the three months ended March 31, 2018. As we continue to progress our acquisition and development activities in Australia and New Zealand, we cannot assure you that the foreign currency effect on our earnings will not be material in the future.
Historically, our policy has been to borrow in local currencies to finance the development and construction of our long-term assets in Australia and New Zealand whenever possible. As a result, the borrowings in local currencies have provided somewhat of a natural hedge against the foreign currency exchange exposure. Even so, and as a result of our issuance of subordinated Trust Preferred Securities in 2007, and their subsequent partial repayment, approximately 76% and 67% of our Australian and New Zealand assets, respectively, remain subject to such exposure, unless we elect to hedge our foreign currency exchange between the US and Australian and New Zealand dollars. If the foreign currency rates were to fluctuate by 10%, the resulting change in Australian and New Zealand assets would be $12.6 million and $4.4 million, respectively, and the change in our quarterly net income would be $432,000 and $32,000, respectively. Presently, we have no plan to hedge such exposure.
We record unrealized foreign currency translation gains or losses that could materially affect our financial position. As of March 31, 2018 and December 31, 2017, the balance of cumulative foreign currency translation adjustments was approximately $22.8 million gain and $23.6 million gain, respectively.
Historically, we maintain most of our cash and cash equivalent balances in short-term money market instruments with original maturities of three months or less. Due to the short-term nature of such investments, a change of 1% in short-term interest rates would not have a material effect on our financial condition.
We have a combination of fixed and variable interest rate loans. In connection with our variable interest rate loans, a change of approximately 1% in short-term interest rates would have resulted in approximately $145,000 increase or decrease in our quarterly interest expense.
44
Item 4 – Controls and Procedures
We maintain disclosure controls and procedures that are designed to ensure that information required to be disclosed in the Company’s reports filed under the Securities Exchange Act of 1934, as amended (the “Exchange Act”), is recorded, processed, summarized and reported within the time periods specified in the SEC’s rules and forms and that such information is accumulated and communicated to our management, including our Chief Executive Officer and Chief Financial Officer, as appropriate, to allow for timely decisions regarding required disclosure. In designing and evaluating the disclosure controls and procedures, management recognizes that any controls and procedures, no matter how well designed and operated, can provide only reasonable assurance of achieving the desired control objectives, and our management is required to apply its judgment in evaluating the cost-benefit relationship of possible controls and procedures.
Under the supervision and with the participation of our management, including our principal executive officer and principal financial officer, we conducted an evaluation of our disclosure controls and procedures, as such, term is defined under Rule 13a-15(e) promulgated under the Exchange Act. Based upon that evaluation, we concluded that, as of March 31, 2018, our disclosure controls and procedures were effective.
Changes in Internal Control over Financial Reporting
During the first quarter of 2018, we implemented the provisions of ASU 2014-09, which impacted certain of our accounting processes and policies around revenue recognition. As a result, we added certain internal controls around the accumulation of information related to our customer loyalty arrangements. There were no other changes in our internal control over financial reporting (as defined in Rule 13a-15(f) and 15d-15(f) under the Exchange Act) that occurred during the quarter ended March 31, 2018 that have materially affected, or are reasonably likely to materially affect, our internal control over financial reporting.
45
The information required under Part II, Item 1 (Legal Proceedings) is incorporated by reference to the information contained in Note 13 – Commitments and Contingencies to the Consolidated Financial Statements included herein in Part I, Item 1 (Financial Statements) on this Quarterly Report on Form 10-Q.
For further details on our legal proceedings, please refer to Item 3, Legal Proceedings, contained in our 2017 Form 10-K.
There have been no material changes in risk factors as previously disclosed in our 2017 Form 10-K.
Item 2 – Unregistered Sales of Equity Securities and Use of Proceeds
There were no unregistered sales of equity securities during the periods covered by this report.
The following table summarizes our repurchases under the March 2, 2017 stock repurchase program up until March 31, 2018:
|
|
|
|
|
|
|
|
|
|
|
|
Period |
|
Total Number of Shares Purchased |
|
Average Price Paid per Share |
|
|
Total Number of Shares Purchased as part of our Stock Buy-Back Program |
|
Approximate Dollar Value of Shares that may yet be Purchased under the Stock Buy-Back Program |
|
March 2017 |
|
41,899 |
|
$ 15.99 |
|
|
41,899 |
|
$ 24,330,149 |
|
May 2017 |
|
98,816 |
|
$ 15.78 |
|
|
98,816 |
|
$ 22,771,316 |
|
June 2017 |
|
70,234 |
|
$ 16.39 |
|
|
70,234 |
|
$ 21,620,212 |
|
August 2017 |
|
187,207 |
|
$ 15.81 |
|
|
187,207 |
|
$ 18,659,580 |
|
September 2017 |
|
5,000 |
|
$ 15.71 |
|
|
5,000 |
|
$ 18,581,038 |
|
December 2017 |
|
6,567 |
|
$ 16.01 |
|
|
6,567 |
|
$ 18,475,900 |
|
February 2018 |
|
8,500 |
|
$ 16.98 |
|
|
8,500 |
|
$ 18,331,570 |
|
March 2018 |
|
10,138 |
|
$ 16.99 |
|
|
10,138 |
|
$ 18,159,364 |
|
|
|
|
|
|
|
|
|
|
|
|
Total |
|
428,361 |
|
$ 15.97 |
|
|
428,361 |
|
$ 18,159,364 |
For a description of grants of stock to certain executives, see the Stock Based Compensation section under see Note 15 – Equity and Stock-Based Compensation to our Consolidated Financial Statements.
Item 3 – Defaults upon Senior Securities
None.
46
Item 5 – Separation Payment Benefit
As discussed in our Report on Form 10-K/A dated April 30, 2018, Mr. Ghose’s employment contract with our Company expires on May 10, 2018. It is currently anticipated that Mr. Ghose will continue with our Company as an employee under terms currently being negotiated. Mr. Ghose will have upon the expiration of his existing employment contract, a vested right to receive a payment of twelve months salary and benefits (determined as of May 10, 2018) upon termination or non-renewal of his employment agreement.
Item 6 – Exhibits
|
31.1 |
Certification Pursuant to Section 302 of the Sarbanes-Oxley Act of 2002, filed herewith. |
|
31.2 |
Certification Pursuant to Section 302 of the Sarbanes-Oxley Act of 2002, filed herewith. |
|
32 |
Certifications Pursuant to Section 906 of the Sarbanes-Oxley Act of 2002, filed herewith. |
|
101.INS |
XBRL Instance Document |
|
101.SCH |
XBRL Taxonomy Extension Schema |
|
101.CAL |
XBRL Taxonomy Extension Calculation |
|
101.DEF |
XBRL Taxonomy Extension Definition |
|
101.LAB |
XBRL Taxonomy Extension Labels |
|
101.PRE |
XBRL Taxonomy Extension Presentation |
47
Pursuant to the requirements of the Securities Exchange Act of 1934, the Registrant has duly caused this report to be signed on its behalf by the undersigned thereunto duly authorized.
READING INTERNATIONAL, INC.
Date: May 10, 2018
By: /s/ Ellen M. Cotter
Ellen M. Cotter
Chief Executive Officer
Date: May 10, 2018
By: /s/ Devasis Ghose
Devasis Ghose
Chief Financial Officer
48