Attached files
| file | filename |
|---|---|
| 8-K - 8-K Q3 INVESTOR PRESENTATION - CenterState Bank Corp | csfl-8k_20181106.htm |
3rd Quarter 2018 Investor Presentation Exhibit 99.1
Forward Looking Statements Information in this presentation, other than statements of historical facts, may constitute forward-looking statements, within the meaning of the Private Securities Litigation Reform Act of 1995. These statements include, but are not limited to, CenterState’s plans, objectives, expectations and intentions, and other statements that are not historical facts. Forward-looking statements may be identified by terminology such as “may,” “will,” “should,” “scheduled,” “plans,” “intends,” “anticipates,” “expects,” “believes,” estimates,” “potential,” or “continue” or negative of such terms or other comparable terminology. All forward-looking statements are subject to risks, uncertainties and other facts that may cause the actual results, performance or achievements of CenterState to differ materially from any results expressed or implied by such forward-looking statements. Such factors include, among others, the impact on failing to implement our business strategy, including our growth and acquisition strategy, including the merger with Charter; any litigation that has been or might be filed in connection with the merger; the ability to successfully integrate our acquisitions; additional capital requirements due to our growth plans; the impact of an increase in our asset size to over $10 billion; the risks of changes in interest rates and the level and composition of deposits; loan demand, the credit and other risks in our loan portfolio and the values of loan collateral; the impact of us not being able to manage our risk; the impact on a loss of management or other experienced employees; the impact if we failed to maintain our culture and attract and retain skilled people; the risk of changes in technology and customer preferences; the impact of any material failure or breach in our infrastructure or the infrastructure of third parties on which we rely including as a result of cyber-attacks; or material regulatory liability in areas such as BSA or consumer protection; reputational risks from such failures or liabilities or other events; legislative and regulatory changes; general competitive, political, legal, economic and market conditions and developments; financial market conditions and the results of financing efforts; changes in commodity prices and interest rates; weather, natural disasters and other catastrophic events; and other factors discussed in our filings with the Securities and Exchange Commission under the Exchange Act. Additional factors that could cause results to differ materially from those contemplated by forward-looking statements can be found in CenterState’s Annual Report on Form 10-K for the year ended December 31, 2017, and otherwise in our SEC reports and filings, which are available in the “Investor Relations” section of CenterState’s website, http://www.centerstatebanks.com. You should not expect us to update any forward-looking statements.
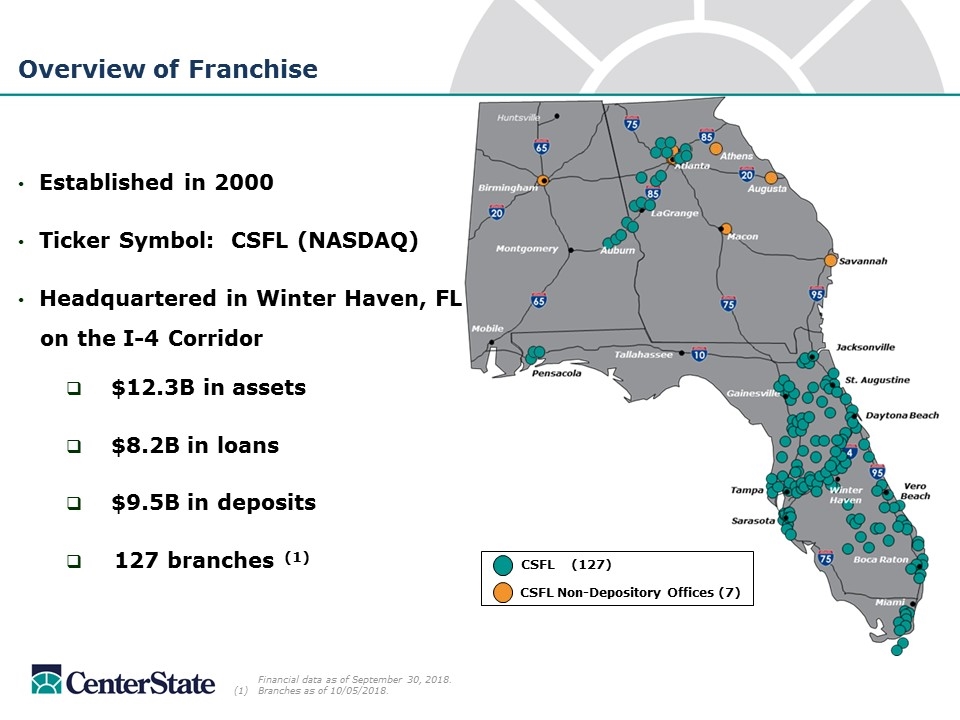
Established in 2000 Ticker Symbol: CSFL (NASDAQ) Headquartered in Winter Haven, FL on the I-4 Corridor $12.3B in assets $8.2B in loans $9.5B in deposits 127 branches (1) Overview of Franchise Financial data as of September 30, 2018. (1)Branches as of 10/05/2018. CSFL (127) CSFL Non-Depository Offices (7)
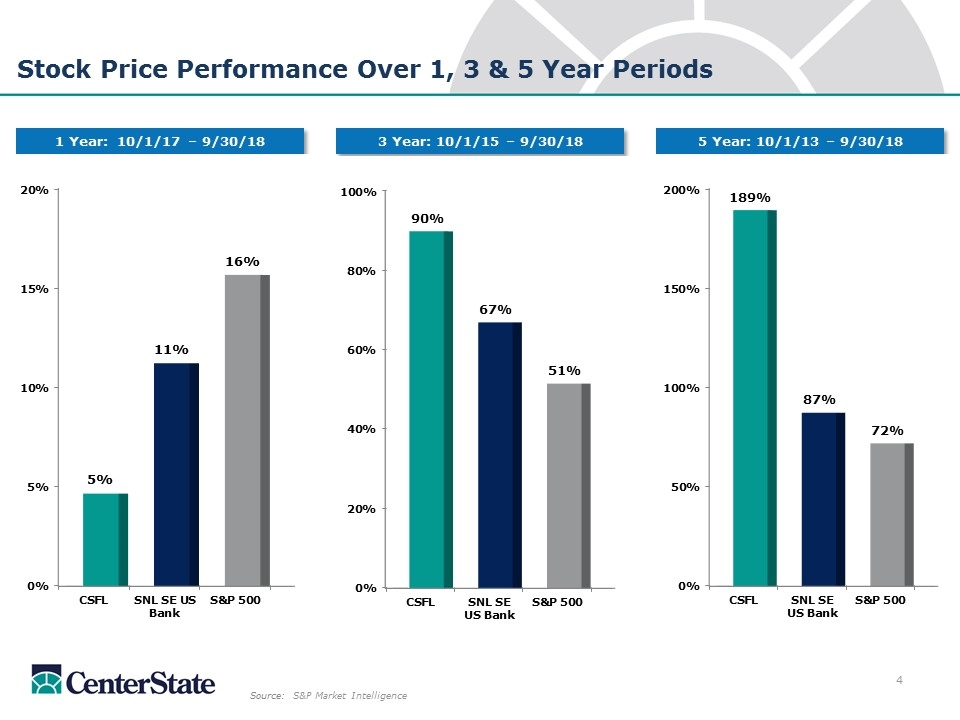
Stock Price Performance Over 1, 3 & 5 Year Periods Source: S&P Market Intelligence 1 Year: 10/1/17 – 9/30/18 3 Year: 10/1/15 – 9/30/18 5 Year: 10/1/13 – 9/30/18
Banking the Sunshine State Image Credit: ESA/NASA
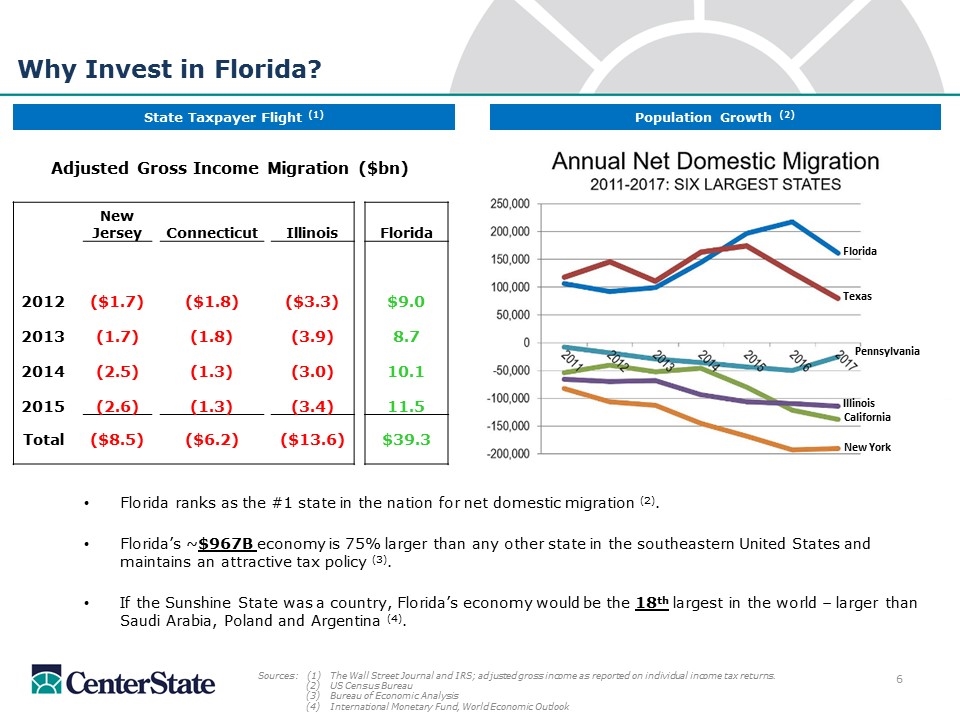
Florida ranks as the #1 state in the nation for net domestic migration (2). Florida’s ~$967B economy is 75% larger than any other state in the southeastern United States and maintains an attractive tax policy (3). If the Sunshine State was a country, Florida’s economy would be the 18th largest in the world – larger than Saudi Arabia, Poland and Argentina (4). Why Invest in Florida? Sources:(1) The Wall Street Journal and IRS; adjusted gross income as reported on individual income tax returns. (2)US Census Bureau (3)Bureau of Economic Analysis (4)International Monetary Fund, World Economic Outlook Population Growth (2) Adjusted Gross Income Migration ($bn) New Jersey Connecticut Illinois Florida 2012 ($1.7) ($1.8) ($3.3) $9.0 2013 (1.7) (1.8) (3.9) 8.7 2014 (2.5) (1.3) (3.0) 10.1 2015 (2.6) (1.3) (3.4) 11.5 Total ($8.5) ($6.2) ($13.6) $39.3 State Taxpayer Flight (1) Florida Texas Pennsylvania Illinois California New York
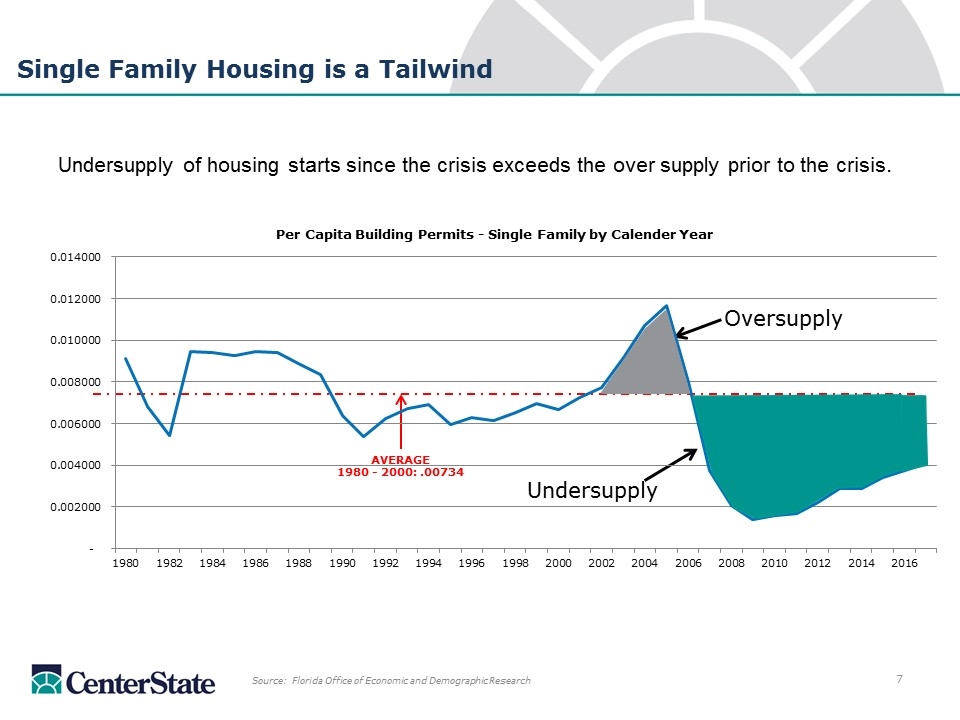
AVERAGE 1980 - 2000: .00734 Single Family Housing is a Tailwind Undersupply of housing starts since the crisis exceeds the over supply prior to the crisis. Source: Florida Office of Economic and Demographic Research Oversupply Undersupply
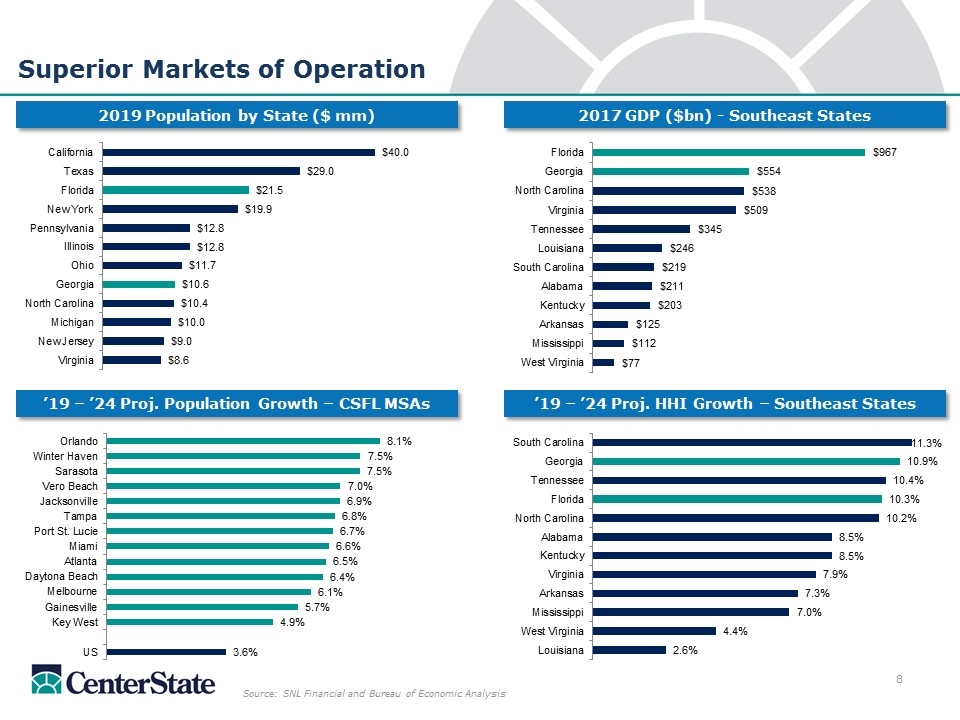
Source: SNL Financial and Bureau of Economic Analysis Superior Markets of Operation 2019 Population by State ($ mm) 2017 GDP ($bn) - Southeast States ’19 – ’24 Proj. HHI Growth – Southeast States ’19 – ’24 Proj. Population Growth – CSFL MSAs
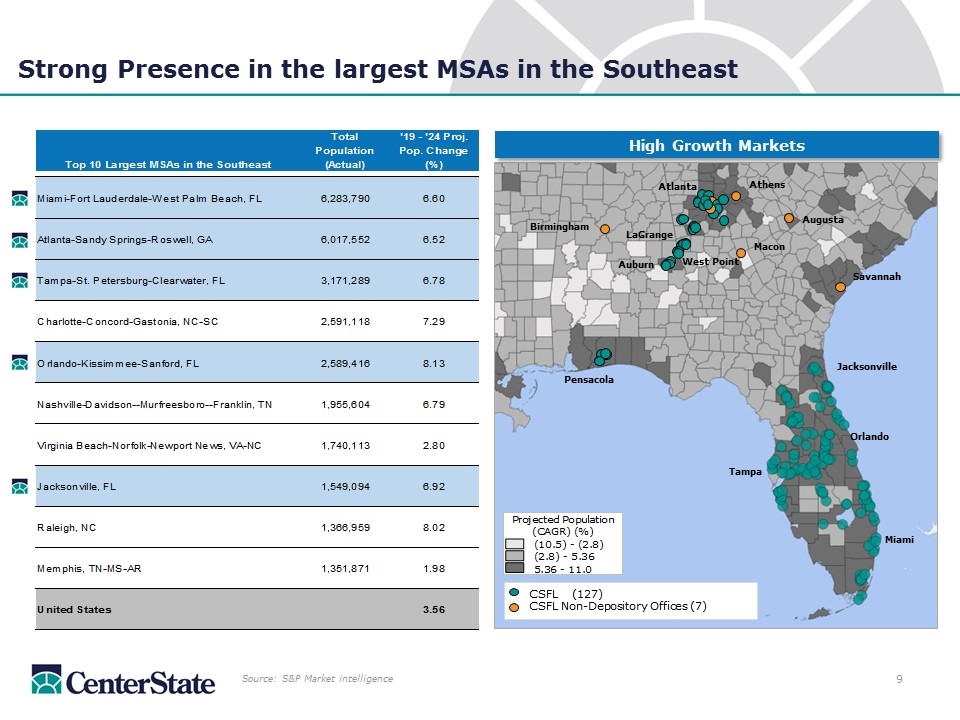
Strong Presence in the largest MSAs in the Southeast Source: S&P Market intelligence Jacksonville Orlando Miami Pensacola Atlanta LaGrange Auburn Tampa High Growth Markets West Point Macon Birmingham CSFL (127) CSFL Non-Depository Offices (7) Savannah Augusta Athens
Capital Management
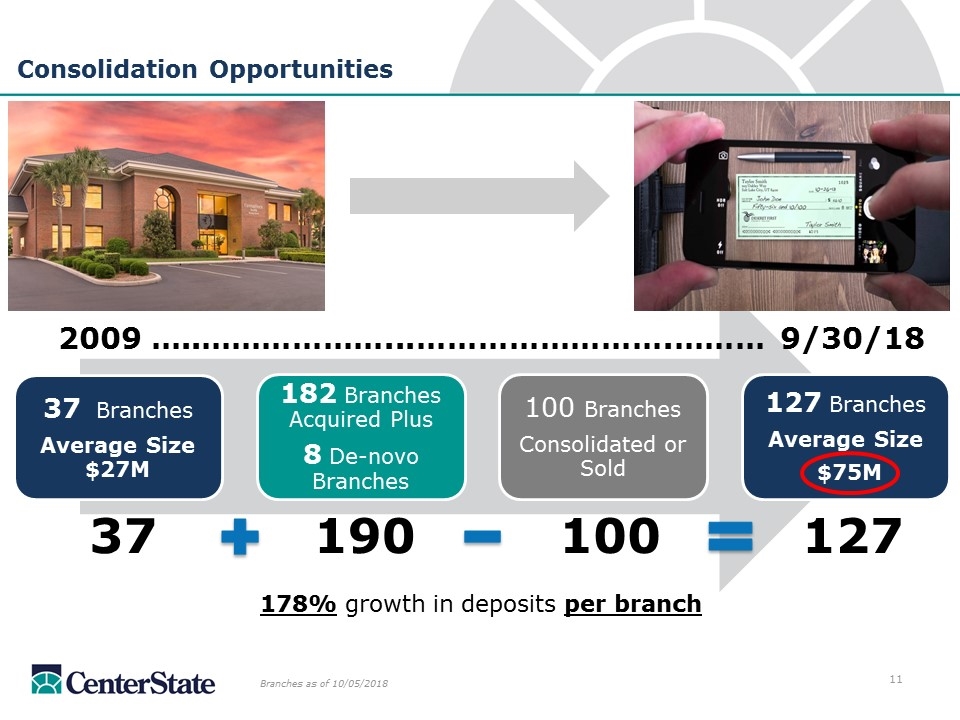
Consolidation Opportunities 178% growth in deposits per branch 37 190 100 127 2009 …..………………...…………………….……… 9/30/18 Branches as of 10/05/2018 37 Branches Average Size $27M 182 Branches Acquired Plus 8 De-novo Branches 100 Branches Consolidated or Sold 127 Branches Average Size $75M
Operating Performance
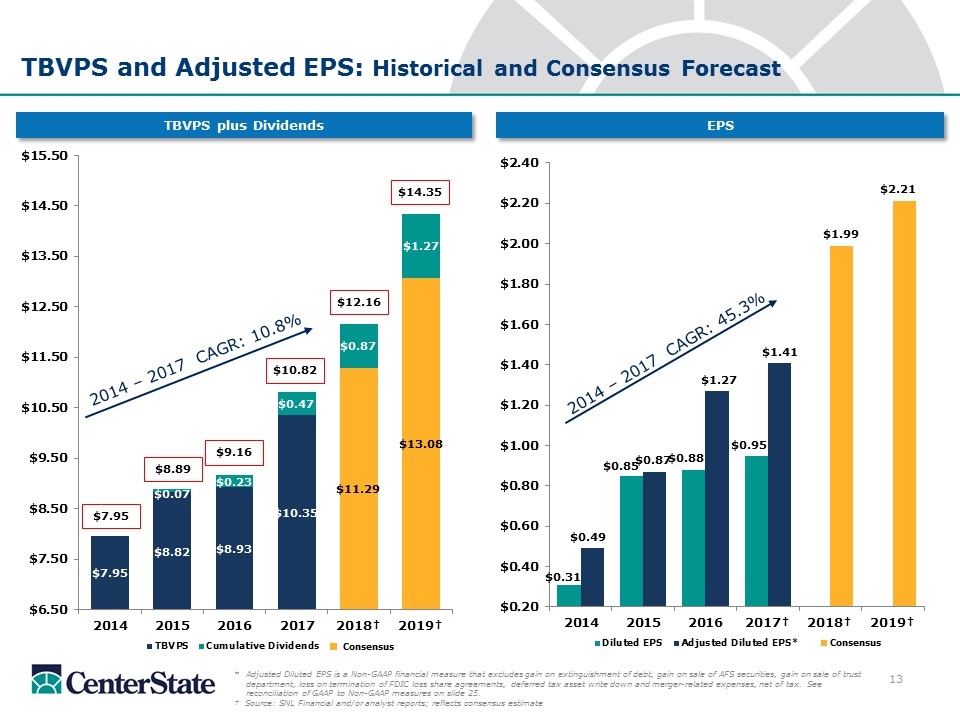
TBVPS and Adjusted EPS: Historical and Consensus Forecast *Adjusted Diluted EPS is a Non-GAAP financial measure that excludes gain on extinguishment of debt, gain on sale of AFS securities, gain on sale of trust department, loss on termination of FDIC loss share agreements, deferred tax asset write down and merger-related expenses, net of tax. See reconciliation of GAAP to Non-GAAP measures on slide 25. † Source: SNL Financial and/or analyst reports; reflects consensus estimate TBVPS plus Dividends EPS $8.89 $9.16 $10.82 Consensus $12.16 $7.95 2014 – 2017 CAGR: 45.3% Consensus $14.35 2014 – 2017 CAGR: 10.8%
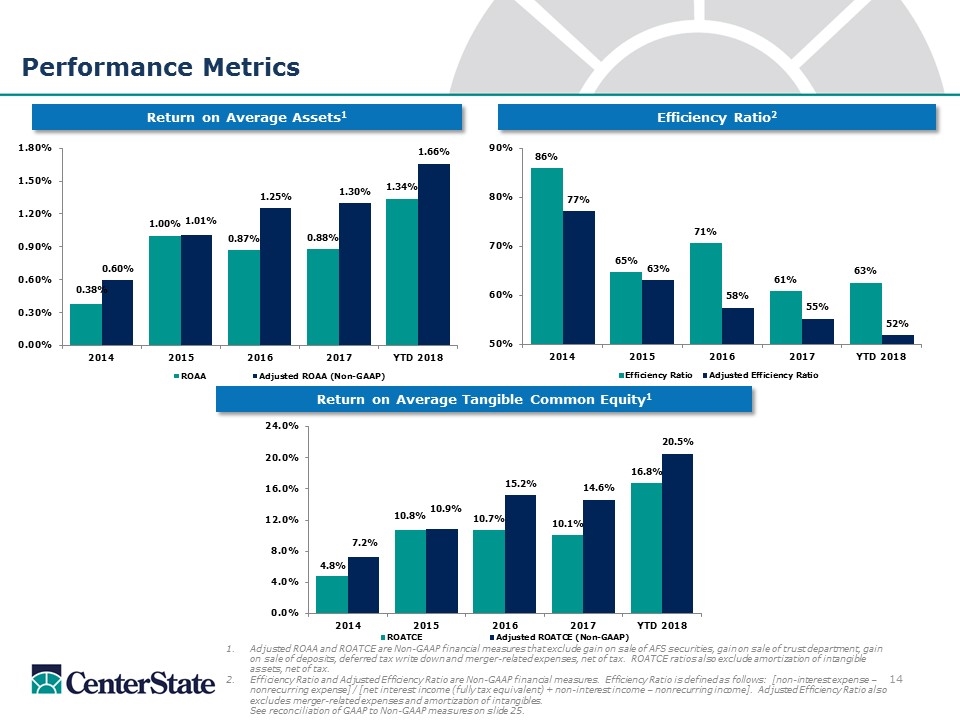
Efficiency Ratio2 Performance Metrics Adjusted ROAA and ROATCE are Non-GAAP financial measures that exclude gain on sale of AFS securities, gain on sale of trust department, gain on sale of deposits, deferred tax write down and merger-related expenses, net of tax. ROATCE ratios also exclude amortization of intangible assets, net of tax. Efficiency Ratio and Adjusted Efficiency Ratio are Non-GAAP financial measures. Efficiency Ratio is defined as follows: [non-interest expense – nonrecurring expense] / [net interest income (fully tax equivalent) + non-interest income – nonrecurring income]. Adjusted Efficiency Ratio also excludes merger-related expenses and amortization of intangibles. See reconciliation of GAAP to Non-GAAP measures on slide 25. Return on Average Tangible Common Equity1 Return on Average Assets1
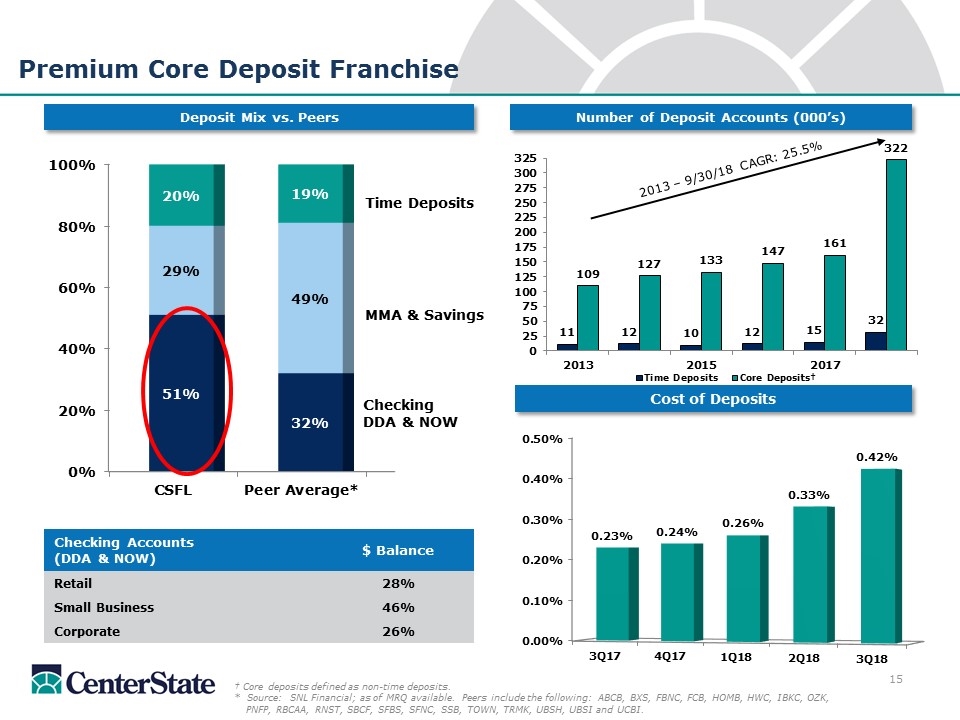
Number of Deposit Accounts (000’s) Premium Core Deposit Franchise Cost of Deposits Deposit Mix vs. Peers † Core deposits defined as non-time deposits. * Source: SNL Financial; as of MRQ available. Peers include the following: ABCB, BXS, FBNC, FCB, HOMB, HWC, IBKC, OZK, PNFP, RBCAA, RNST, SBCF, SFBS, SFNC, SSB, TOWN, TRMK, UBSH, UBSI and UCBI. MMA & Savings Time Deposits Checking Accounts (DDA & NOW) $ Balance Retail 28% Small Business 46% Corporate 26% Checking DDA & NOW 2013 – 9/30/18 CAGR: 25.5%
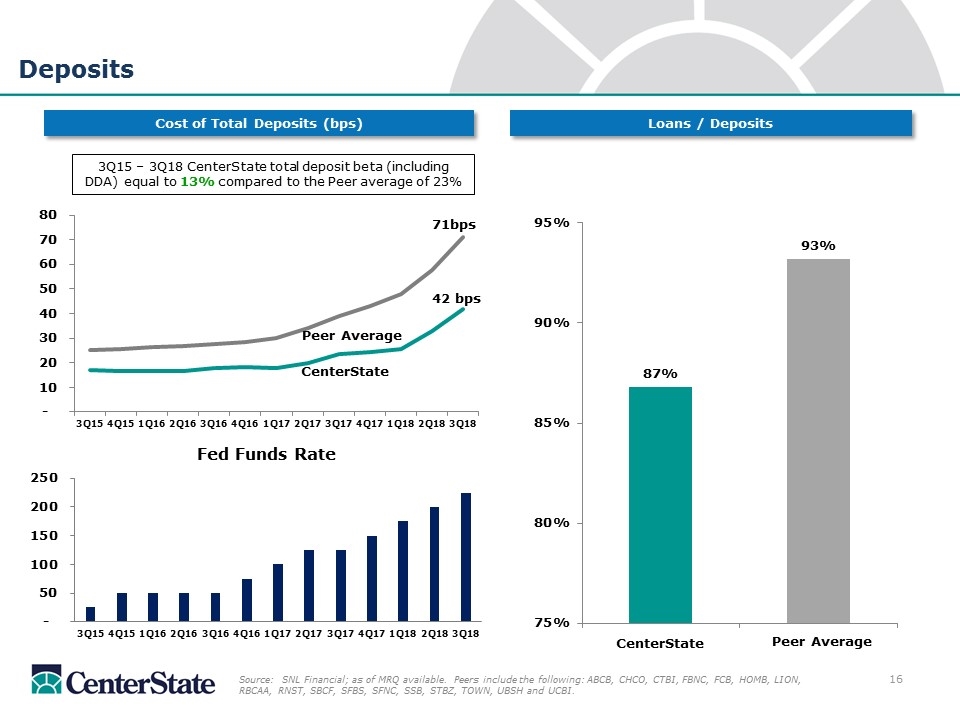
Deposits Loans / Deposits Cost of Total Deposits (bps) 3Q15 – 3Q18 CenterState total deposit beta (including DDA) equal to 13% compared to the Peer average of 23% CenterState Peer Average Source: SNL Financial; as of MRQ available. Peers include the following: ABCB, CHCO, CTBI, FBNC, FCB, HOMB, LION, RBCAA, RNST, SBCF, SFBS, SFNC, SSB, STBZ, TOWN, UBSH and UCBI. Peer Average CenterState 71bps 42 bps
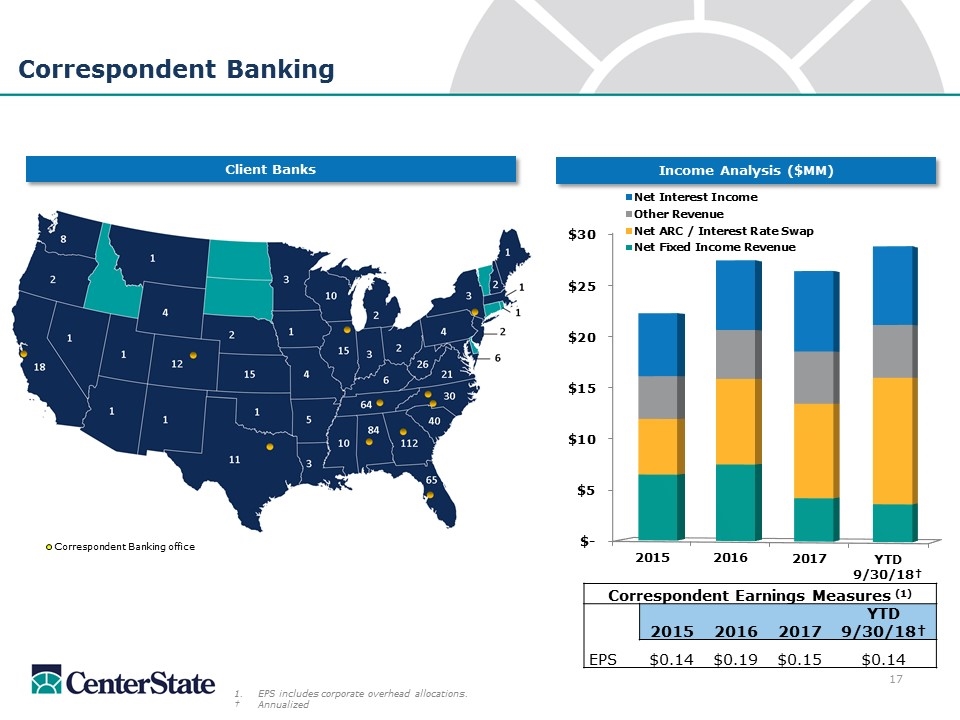
EPS includes corporate overhead allocations. †Annualized Correspondent Banking Income Analysis ($MM) Client Banks Correspondent Banking office Correspondent Earnings Measures (1) 2015 2016 2017 YTD 9/30/18† EPS $0.14 $0.19 $0.15 $0.14
Investment Thesis CenterState is among the largest banking companies headquartered in Florida by assets, market capitalization, deposit market share and branch footprint(1). CenterState’s markets are some of the strongest markets in the Southeastern U.S. with new entry into Atlanta, the largest GDP MSA in Southeastern U.S. Premium core deposit franchise with strong checking account base should outperform peers in a rising rate environment. Source: SNL Financial (1)Data as of MRQ; deposit market share data as of 6/30/17. Note: Community bank defined as institutions with total assets less than $20.0 billion

Supplemental
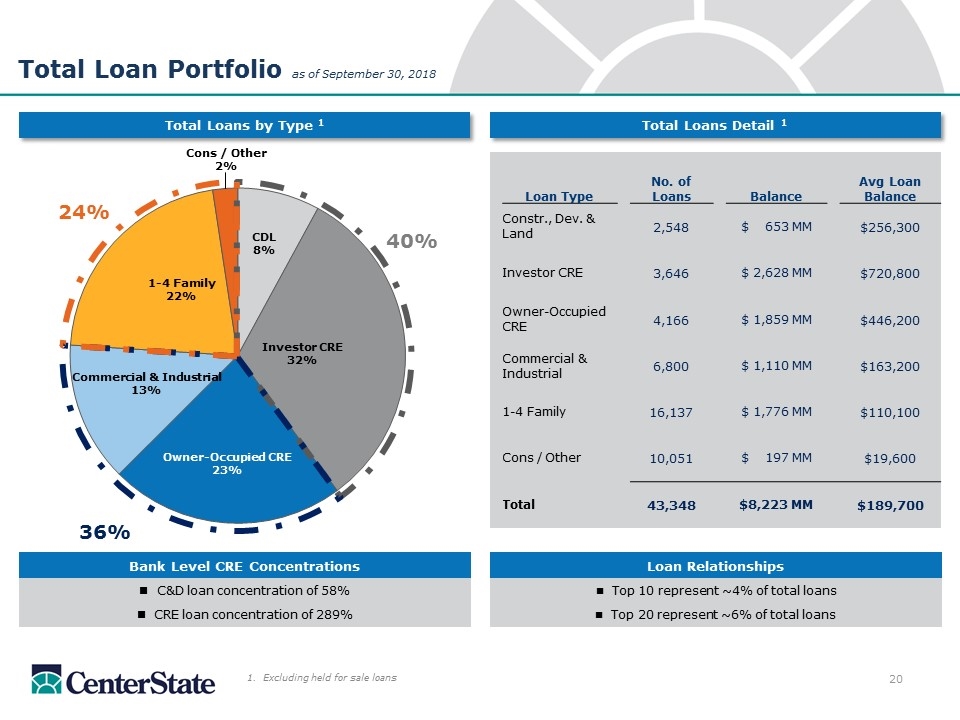
Total Loan Portfolio as of September 30, 2018 Total Loans by Type 1 Total Loans Detail 1 1. Excluding held for sale loans Loan Relationships n Top 10 represent ~4% of total loans n Top 20 represent ~6% of total loans Bank Level CRE Concentrations C&D loan concentration of 58% CRE loan concentration of 289% 40% 36% 24% Loan Type No. of Loans Balance Avg Loan Balance Constr., Dev. & Land 2,548 $ 653 MM $256,300 Investor CRE 3,646 $ 2,628 MM $720,800 Owner-Occupied CRE 4,166 $ 1,859 MM $446,200 Commercial & Industrial 6,800 $ 1,110 MM $163,200 1-4 Family 16,137 $ 1,776 MM $110,100 Cons / Other 10,051 $ 197 MM $19,600 Total 43,348 $8,223 MM $189,700
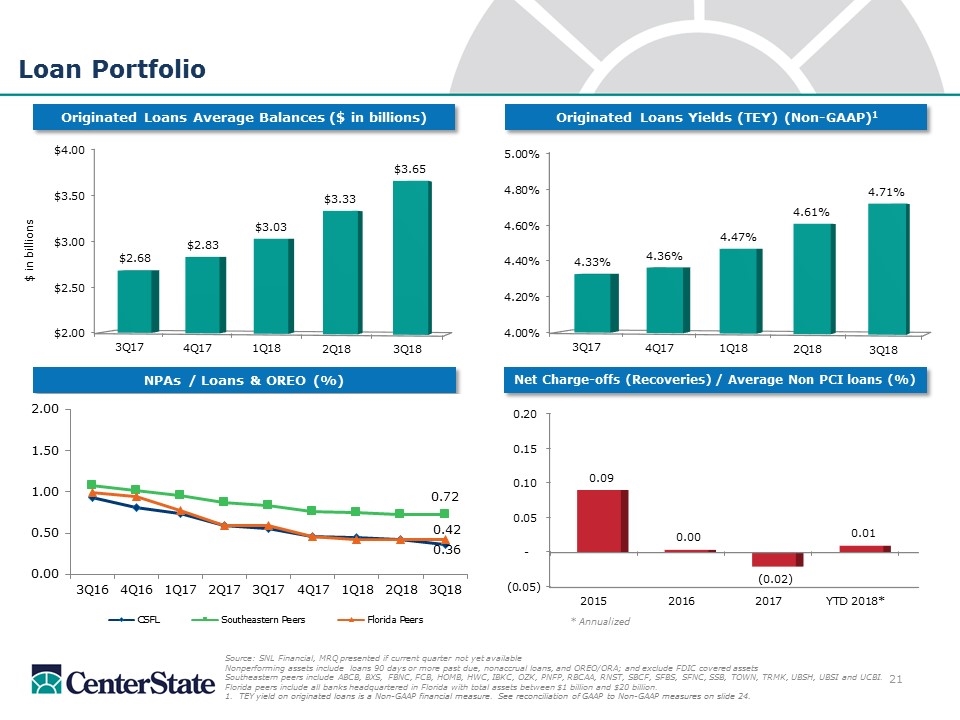
Loan Portfolio Originated Loans Yields (TEY) (Non-GAAP)1 Originated Loans Average Balances ($ in billions) Source: SNL Financial, MRQ presented if current quarter not yet available Nonperforming assets include loans 90 days or more past due, nonaccrual loans, and OREO/ORA; and exclude FDIC covered assets Southeastern peers include ABCB, BXS, FBNC, FCB, HOMB, HWC, IBKC, OZK, PNFP, RBCAA, RNST, SBCF, SFBS, SFNC, SSB, TOWN, TRMK, UBSH, UBSI and UCBI. Florida peers include all banks headquartered in Florida with total assets between $1 billion and $20 billion. 1. TEY yield on originated loans is a Non-GAAP financial measure. See reconciliation of GAAP to Non-GAAP measures on slide 24. NPAs / Loans & OREO (%) Net Charge-offs (Recoveries) / Average Non PCI loans (%) * Annualized
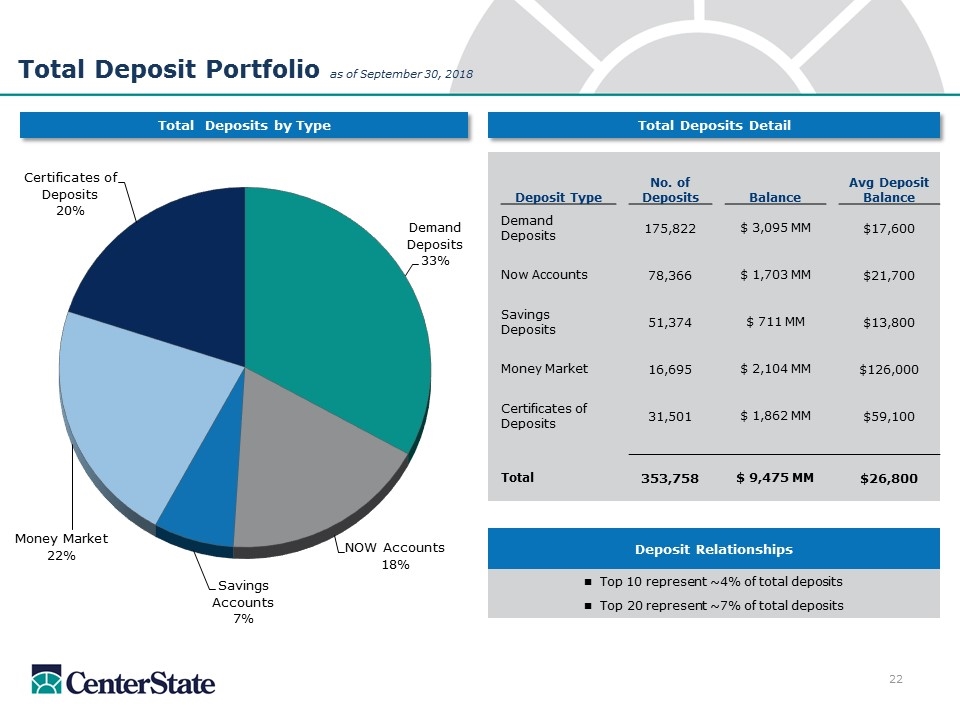
Deposit Relationships n Top 10 represent ~4% of total deposits n Top 20 represent ~7% of total deposits Total Deposits by Type Total Deposits Detail 23 Total Deposit Portfolio as of September 30, 2018 Deposit Type No. of Deposits Balance Avg Deposit Balance Demand Deposits 175,822 $ 3,095 MM $17,600 Now Accounts 78,366 $ 1,703 MM $21,700 Savings Deposits 51,374 $ 711 MM $13,800 Money Market 16,695 $ 2,104 MM $126,000 Certificates of Deposits 31,501 $ 1,862 MM $59,100 Total 353,758 $ 9,475 MM $26,800
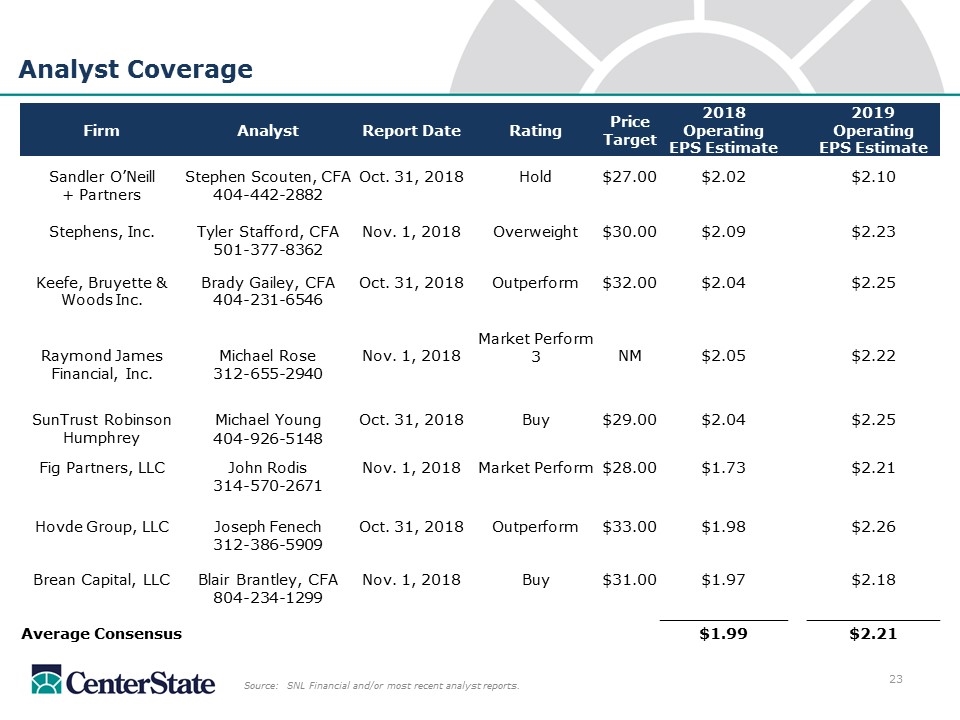
Analyst Coverage Source: SNL Financial and/or most recent analyst reports. Firm Analyst Report Date Rating Price Target 2018 Operating EPS Estimate 2019 Operating EPS Estimate Sandler O’Neill Stephen Scouten, CFA Oct. 31, 2018 Hold $27.00 $2.02 $2.10 + Partners 404-442-2882 Stephens, Inc. Tyler Stafford, CFA Nov. 1, 2018 Overweight $30.00 $2.09 $2.23 501-377-8362 Keefe, Bruyette & Brady Gailey, CFA Oct. 31, 2018 Outperform $32.00 $2.04 $2.25 Woods Inc. 404-231-6546 Raymond James Michael Rose Nov. 1, 2018 Market Perform 3 NM $2.05 $2.22 Financial, Inc. 312-655-2940 SunTrust Robinson Michael Young Oct. 31, 2018 Buy $29.00 $2.04 $2.25 Humphrey 404-926-5148 Fig Partners, LLC John Rodis Nov. 1, 2018 Market Perform $28.00 $1.73 $2.21 314-570-2671 Hovde Group, LLC Joseph Fenech Oct. 31, 2018 Outperform $33.00 $1.98 $2.26 312-386-5909 Brean Capital, LLC Blair Brantley, CFA Nov. 1, 2018 Buy $31.00 $1.97 $2.18 804-234-1299 Average Consensus $1.99 $2.21
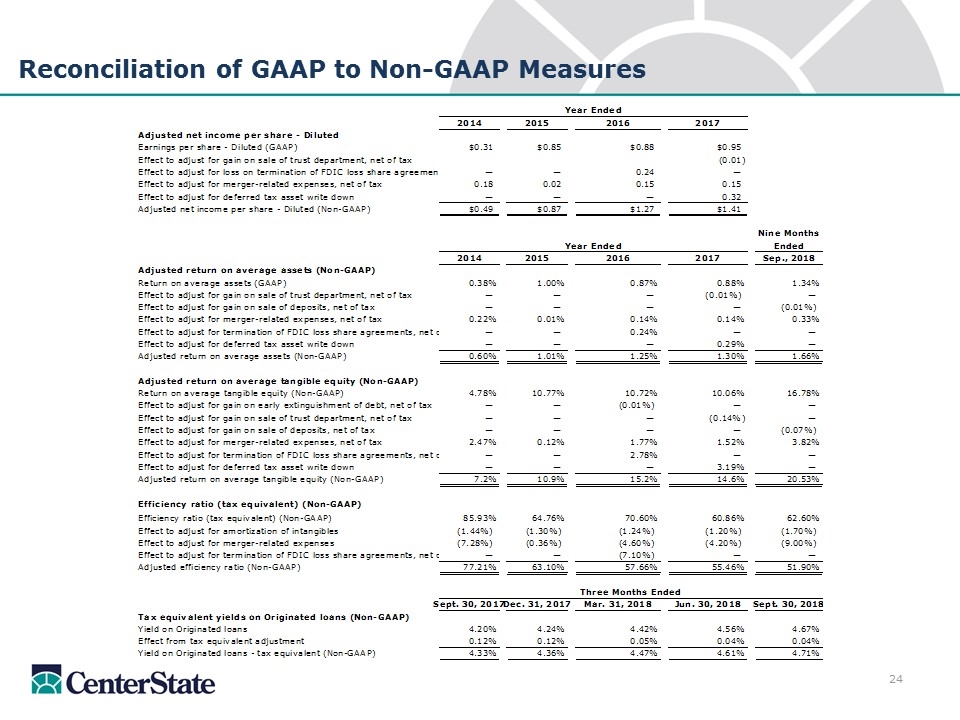
Reconciliation of GAAP to Non-GAAP Measures
Investor Contacts Ernie Pinner John Corbett Executive Chairman President & Chief Executive Officer epinner@centerstatebank.com jcorbett@centerstatebank.com Steve Young Jennifer Idell Chief Operating Officer Chief Financial Officer syoung@centerstatebank.com jidell@centerstatebank.com

