Attached files
| file | filename |
|---|---|
| EXCEL - IDEA: XBRL DOCUMENT - CenterState Bank Corp | Financial_Report.xls |
| EX-31.1 - THE CHAIRMAN, PRESIDENT AND CHIEF EXECUTIVE OFFICER'S CERTIFICATION - CenterState Bank Corp | d731001dex311.htm |
| EX-32.2 - THE CHIEF FINANCIAL OFFICER'S CERTIFICATION - CenterState Bank Corp | d731001dex322.htm |
| EX-32.1 - THE CHAIRMAN, PRESIDENT AND CHIEF EXECUTIVE OFFICER'S CERTIFICATION - CenterState Bank Corp | d731001dex321.htm |
| EX-31.2 - THE CHIEF FINANCIAL OFFICER'S CERTIFICATION - CenterState Bank Corp | d731001dex312.htm |
Table of Contents
U.S. SECURTIES AND EXCHANGE COMMISSION
Washington, D. C. 20549
Form 10-Q
(Mark One)
| x | Quarterly report under Section 13 or 15(d) of the Securities Exchange Act of 1934 |
For the quarterly period ended June 30, 2014
| ¨ | Transition report under Section 13 or 15(d) of the Exchange Act |
For the transition period from to
Commission file number 000-32017
CENTERSTATE BANKS, INC.
(Exact Name of Registrant as Specified in Its Charter)
| Florida | 59-3606741 | |
| (State or Other Jurisdiction of Incorporation or Organization) |
(I.R.S. Employer Identification No.) |
42745 U.S. Highway 27
Davenport, Florida 33837
(Address of Principal Executive Offices)
(863) 419-7750
(Issuer’s Telephone Number, Including Area Code)
Check whether the issuer: (1) filed all reports required to be filed by Section 13 or 15(d) of the Exchange Act during the past 12 months (or for such shorter period that the registrant was required to file such reports), and (2) has been subject to such filing requirements for the past 90 days: YES x NO ¨
Check whether the registrant is a large accelerated filer, an accelerated filer, non-accelerated filer or a smaller reporting company.
| Large accelerated filer | ¨ | Accelerated filer | x | |||
| Non-accelerated filer | ¨ | Smaller reporting company | ¨ | |||
Indicate by check mark whether the registrant has submitted electronically and posted on its corporate Web site, if any, every Interactive Data File required to be submitted and posted pursuant to Rule 405 of Regulation S-T (§ 232.405 of this chapter) during the preceding 12 months (or for such shorter period that the registrant was required to submit and post such files). YES x NO ¨
Indicate by check mark whether the registrant is a shell company (as defined in Rule 12b-2 of the Exchange Act): YES ¨ NO x
State the number of shares outstanding of each of the issuer’s classes of common stock, as of the latest practicable date:
| Common stock, par value $.01 per share |
45,034,032 shares | |
| (class) | Outstanding at July 31, 2014 |
Table of Contents
CENTERSTATE BANKS, INC. AND SUBSIDIARIES
| Page | ||||||
| PART I. |
FINANCIAL INFORMATION |
|||||
| Item 1. |
Financial Statements |
|||||
| Condensed consolidated balance sheets at June 30, 2014 (unaudited) and December 31, 2013 |
3 | |||||
| 4 | ||||||
| 6 | ||||||
| 7 | ||||||
| Notes to condensed consolidated financial statements (unaudited) |
9 | |||||
| Item 2. |
Management’s Discussion and Analysis of Financial Condition and Results of Operations |
44 | ||||
| Item 3. |
71 | |||||
| Item 4. |
72 | |||||
| PART II. |
||||||
| Item 1. |
73 | |||||
| Item 1A. |
73 | |||||
| Item 2. |
73 | |||||
| Item 3. |
73 | |||||
| Item 4. |
73 | |||||
| Item 5. |
73 | |||||
| Item 6. |
73 | |||||
| 74 | ||||||
| CERTIFICATIONS |
||||||
2
Table of Contents
CenterState Banks, Inc. and Subsidiaries
CONDENSED CONSOLIDATED BALANCE SHEETS (unaudited)
(in thousands of dollars, except per share data)
| June 30, 2014 | December 31, 2013 | |||||||
| ASSETS |
||||||||
| Cash and due from banks |
$ | 25,043 | $ | 21,581 | ||||
| Federal funds sold and Federal Reserve Bank deposits |
490,966 | 153,308 | ||||||
|
|
|
|
|
|||||
| Cash and cash equivalents |
516,009 | 174,889 | ||||||
| Trading securities, at fair value |
89 | — | ||||||
| Investment securities available for sale, at fair value |
542,149 | 457,086 | ||||||
| Loans held for sale, at lower of cost or fair value |
1,596 | 1,010 | ||||||
| Loans, excluding purchased credit impaired |
2,042,149 | 1,242,758 | ||||||
| Purchased credit impaired loans |
353,870 | 231,421 | ||||||
| Allowance for loan losses |
(19,200 | ) | (20,454 | ) | ||||
|
|
|
|
|
|||||
| Net Loans |
2,376,819 | 1,453,725 | ||||||
| Bank premises and equipment, net |
98,623 | 96,619 | ||||||
| Accrued interest receivable |
8,216 | 6,337 | ||||||
| Federal Home Loan Bank and Federal Reserve Bank stock, at cost |
17,176 | 8,189 | ||||||
| Goodwill |
76,981 | 44,924 | ||||||
| Core deposit intangible |
15,724 | 4,958 | ||||||
| Trust intangible |
1,070 | 1,158 | ||||||
| Bank owned life insurance |
57,485 | 49,285 | ||||||
| Other repossessed real estate owned covered by FDIC loss share agreements |
30,698 | 19,111 | ||||||
| Other repossessed real estate owned |
12,123 | 6,409 | ||||||
| FDIC indemnification asset |
61,311 | 73,877 | ||||||
| Deferred income tax asset, net |
53,175 | 5,296 | ||||||
| Bank property held for sale |
13,168 | 1,582 | ||||||
| Prepaid expense and other assets |
19,170 | 11,556 | ||||||
|
|
|
|
|
|||||
| TOTAL ASSETS |
$ | 3,901,582 | $ | 2,416,011 | ||||
|
|
|
|
|
|||||
| LIABILITIES AND STOCKHOLDERS’ EQUITY |
||||||||
| Deposits: |
||||||||
| Demand - non-interest bearing |
$ | 1,023,285 | $ | 644,915 | ||||
| Demand - interest bearing |
589,573 | 483,842 | ||||||
| Savings and money market accounts |
982,172 | 542,599 | ||||||
| Time deposits |
526,313 | 384,875 | ||||||
| Deposits held for sale |
185,646 | — | ||||||
|
|
|
|
|
|||||
| Total deposits |
3,306,989 | 2,056,231 | ||||||
| Securities sold under agreement to repurchase |
33,619 | 20,457 | ||||||
| Federal funds purchased |
43,080 | 29,909 | ||||||
| Corporate debentures |
23,829 | 16,996 | ||||||
| Accrued interest payable |
411 | 333 | ||||||
| Payables and accrued expenses |
54,196 | 18,706 | ||||||
|
|
|
|
|
|||||
| Total liabilities |
3,462,124 | 2,142,632 | ||||||
| Stockholders’ equity: |
||||||||
| Common stock, $.01 par value: 100,000,000 shares authorized; 45,022,780 and 30,112,475 shares issued and outstanding at June 30, 2014 and December 31, 2013, respectively |
450 | 301 | ||||||
| Additional paid-in capital |
388,113 | 229,544 | ||||||
| Retained earnings |
49,303 | 48,018 | ||||||
| Accumulated other comprehensive income ( loss) |
1,592 | (4,484 | ) | |||||
|
|
|
|
|
|||||
| Total stockholders’ equity |
439,458 | 273,379 | ||||||
|
|
|
|
|
|||||
| TOTAL LIABILITIES AND STOCKHOLDERS’ EQUITY |
$ | 3,901,582 | $ | 2,416,011 | ||||
|
|
|
|
|
|||||
See notes to the accompanying condensed consolidated financial statements
3
Table of Contents
CenterState Banks, Inc. and Subsidiaries
CONDENSED CONSOLIDATED STATEMENTS OF EARNINGS AND COMPREHENSIVE INCOME (unaudited)
(in thousands of dollars, except per share data)
| Three months ended | Six months ended | |||||||||||||||
| June 30, 2014 | June 30, 2013 | June 30, 2014 | June 30, 2013 | |||||||||||||
| Interest income: |
||||||||||||||||
| Loans |
$ | 28,509 | $ | 21,790 | $ | 54,238 | $ | 43,225 | ||||||||
| Investment securities available for sale: |
||||||||||||||||
| Taxable |
3,809 | 2,097 | 7,286 | 4,485 | ||||||||||||
| Tax-exempt |
337 | 372 | 674 | 729 | ||||||||||||
| Federal funds sold and other |
424 | 228 | 663 | 426 | ||||||||||||
|
|
|
|
|
|
|
|
|
|||||||||
| 33,079 | 24,487 | 62,861 | 48,865 | |||||||||||||
|
|
|
|
|
|
|
|
|
|||||||||
| Interest expense: |
||||||||||||||||
| Deposits |
1,523 | 1,330 | 2,860 | 2,713 | ||||||||||||
| Securities sold under agreement to repurchase |
56 | 21 | 79 | 39 | ||||||||||||
| Federal funds purchased |
5 | 6 | 11 | 11 | ||||||||||||
| Corporate debentures |
238 | 150 | 461 | 300 | ||||||||||||
|
|
|
|
|
|
|
|
|
|||||||||
| 1,822 | 1,507 | 3,411 | 3,063 | |||||||||||||
|
|
|
|
|
|
|
|
|
|||||||||
| Net interest income |
31,257 | 22,980 | 59,450 | 45,802 | ||||||||||||
| Provision for loan losses |
(106 | ) | 1,374 | (147 | ) | 1,014 | ||||||||||
|
|
|
|
|
|
|
|
|
|||||||||
| Net interest income after loan loss provision |
31,363 | 21,606 | 59,597 | 44,788 | ||||||||||||
|
|
|
|
|
|
|
|
|
|||||||||
| Non interest income: |
||||||||||||||||
| Income from correspondent bank capital markets division |
4,192 | 4,904 | 7,340 | 11,044 | ||||||||||||
| Other correspondent banking related revenue |
1,093 | 705 | 1,876 | 1,570 | ||||||||||||
| Service charges on deposit accounts |
2,333 | 2,081 | 4,595 | 3,900 | ||||||||||||
| Debit, prepaid, ATM and merchant card related fees |
1,495 | 1,342 | 3,001 | 2,627 | ||||||||||||
| Wealth management related revenue |
1,104 | 1,130 | 2,321 | 2,200 | ||||||||||||
| FDIC indemnification income |
421 | 1,396 | 1,689 | 2,024 | ||||||||||||
| FDIC indemnification asset amortization |
(5,006 | ) | (3,272 | ) | (10,191 | ) | (5,471 | ) | ||||||||
| Bank owned life insurance income |
356 | 338 | 708 | 677 | ||||||||||||
| Other service charges and fees |
338 | 231 | 747 | 533 | ||||||||||||
| Net gain on sale of securities available for sale |
46 | 1,008 | 46 | 1,038 | ||||||||||||
|
|
|
|
|
|
|
|
|
|||||||||
| Total other income |
6,372 | 9,863 | 12,132 | 20,142 | ||||||||||||
|
|
|
|
|
|
|
|
|
|||||||||
See notes to the accompanying condensed consolidated financial statements.
4
Table of Contents
CenterState Banks, Inc. and Subsidiaries
CONDENSED CONSOLIDATED STATEMENTS OF EARNINGS AND COMPREHENSIVE INCOME (unaudited)
(in thousands of dollars, except per share data)
| Three months ended | Six months ended | |||||||||||||||
| June 30, 2014 | June 30, 2013 | June 30, 2014 | June 30, 2013 | |||||||||||||
| Non interest expense: |
||||||||||||||||
| Salaries, wages and employee benefits |
17,185 | 15,234 | 32,866 | 31,474 | ||||||||||||
| Occupancy expense |
2,479 | 1,942 | 4,439 | 3,834 | ||||||||||||
| Depreciation of premises and equipment |
1,563 | 1,455 | 3,041 | 2,952 | ||||||||||||
| Supplies, stationary and printing |
334 | 285 | 561 | 573 | ||||||||||||
| Marketing expenses |
619 | 586 | 1,239 | 1,114 | ||||||||||||
| Data processing expense |
1,306 | 912 | 2,345 | 1,796 | ||||||||||||
| Legal, audit and other professional fees |
1,376 | 844 | 2,151 | 1,627 | ||||||||||||
| Core deposit intangible (CDI) amortization |
472 | 250 | 803 | 503 | ||||||||||||
| Postage and delivery |
365 | 267 | 633 | 552 | ||||||||||||
| ATM and debit card related expenses |
468 | 428 | 942 | 939 | ||||||||||||
| Bank regulatory expenses |
753 | 635 | 1,384 | 1,216 | ||||||||||||
| Loss on sale of repossessed real estate (“OREO”) |
379 | 563 | 456 | 562 | ||||||||||||
| Valuation write down of repossessed real estate (“OREO”) |
885 | 1,680 | 1,905 | 2,667 | ||||||||||||
| Loss on repossessed assets other than real estate |
19 | 104 | 17 | 346 | ||||||||||||
| Foreclosure related expenses |
1,092 | 787 | 1,821 | 1,580 | ||||||||||||
| Merger and acquisition related expenses |
4,897 | — | 7,244 | — | ||||||||||||
| Branch closure and efficiency initiatives |
29 | — | 3,187 | — | ||||||||||||
| Other expenses |
1,932 | 1,401 | 3,522 | 2,728 | ||||||||||||
|
|
|
|
|
|
|
|
|
|||||||||
| Total other expenses |
36,153 | 27,373 | 68,556 | 54,463 | ||||||||||||
|
|
|
|
|
|
|
|
|
|||||||||
| Income before provision for income taxes |
1,582 | 4,096 | 3,173 | 10,467 | ||||||||||||
| Provision for income taxes |
545 | 1,338 | 1,083 | 3,133 | ||||||||||||
| Net income |
$ | 1,037 | $ | 2,758 | $ | 2,090 | $ | 7,334 | ||||||||
| Other comprehensive income, net of tax: |
||||||||||||||||
| Unrealized securities holding (loss) gain, net of income taxes |
$ | 4,976 | $ | (6,799 | ) | $ | 6,104 | $ | (8,611 | ) | ||||||
| Less: reclassified adjustments for gain included in net income, net of income taxes, of $18, $388, $18, and $400, respectively |
(28 | )[1] | (620 | )[1] | (28 | )[1] | (638 | )[1] | ||||||||
|
|
|
|
|
|
|
|
|
|||||||||
| Net unrealized (loss) gain on available for sale securities, net of income taxes |
4,948 | (7,419 | ) | 6,076 | (9,249 | ) | ||||||||||
| Total comprehensive income (loss) |
$ | 5,985 | $ | (4,661 | ) | $ | 8,166 | $ | (1,915 | ) | ||||||
|
|
|
|
|
|
|
|
|
|||||||||
| Earnings per share: |
||||||||||||||||
| Basic |
$ | 0.03 | $ | 0.09 | $ | 0.06 | $ | 0.24 | ||||||||
| Diluted |
$ | 0.03 | $ | 0.09 | $ | 0.06 | $ | 0.24 | ||||||||
| Common shares used in the calculation of earnings per share: |
||||||||||||||||
| Basic |
38,665,018 | 30,098,853 | 36,576,622 | 30,094,315 | ||||||||||||
| Diluted |
39,051,230 | 30,161,241 | 36,980,234 | 30,155,780 | ||||||||||||
| (1) | Amounts are included in net gain on sale of securities available for sale in total non interest income. Provision for income taxes associated with the reclassification adjustment for the three and six month periods ended June 30, 2014 and 2013 was $18, $388, $18, and $400, respectively. |
See notes to the accompanying condensed consolidated financial statements
5
Table of Contents
CenterState Banks, Inc. and Subsidiaries
CONDENSED CONSOLIDATED STATEMENTS OF CHANGES IN STOCKHOLDERS’ EQUITY
For the six months ended June 30, 2014 and 2013 (unaudited)
(in thousands of dollars, except per share data)
| Number of common shares |
Common stock |
Additional paid in capital |
Retained earnings |
Accumulated Other comprehensive income (loss) |
Total stockholders’ equity |
|||||||||||||||||||
| Balances at January 1, 2013 |
30,079,767 | $ | 301 | $ | 228,952 | $ | 36,979 | $ | 7,299 | $ | 273,531 | |||||||||||||
| Net income |
7,334 | 7,334 | ||||||||||||||||||||||
| Unrealized holding loss on available for sale securities, net of deferred income tax of $5,808 |
(9,249 | ) | (9,249 | ) | ||||||||||||||||||||
| Dividends paid - common ($0.02 per share) |
(602 | ) | (602 | ) | ||||||||||||||||||||
| Stock grants issued |
24,503 | 250 | 250 | |||||||||||||||||||||
| Stock based compensation expense |
152 | 152 | ||||||||||||||||||||||
|
|
|
|
|
|
|
|
|
|
|
|
|
|||||||||||||
| Balances at June 30, 2013 |
30,104,270 | $ | 301 | $ | 229,354 | $ | 43,711 | $ | (1,950 | ) | $ | 271,416 | ||||||||||||
|
|
|
|
|
|
|
|
|
|
|
|
|
|||||||||||||
| Balances at January 1, 2014 |
30,112,475 | $ | 301 | $ | 229,544 | $ | 48,018 | $ | (4,484 | ) | $ | 273,379 | ||||||||||||
| Net income |
2,090 | 2,090 | ||||||||||||||||||||||
| Unrealized holding gain on available for sale securities, net of deferred income tax of $3,816 |
6,076 | 6,076 | ||||||||||||||||||||||
| Dividends paid - common ($0.02 per share) |
(805 | ) | (805 | ) | ||||||||||||||||||||
| Stock grants issued |
26,656 | 274 | 274 | |||||||||||||||||||||
| Stock based compensation expense |
144 | 144 | ||||||||||||||||||||||
| Stock options exercised, including tax benefit |
211,684 | 2 | 892 | 894 | ||||||||||||||||||||
| Stock issued pursuant to Gulfstream acquisition |
5,195,541 | 52 | 53,098 | 53,150 | ||||||||||||||||||||
| Stock options acquired and converted pursuant to Gulfstream acquisition |
3,617 | 3,617 | ||||||||||||||||||||||
| Stock issued pursuant to First Southern acquisition |
9,476,424 | 95 | 100,544 | 100,639 | ||||||||||||||||||||
|
|
|
|
|
|
|
|
|
|
|
|
|
|||||||||||||
| Balances at June 30, 2014 |
45,022,780 | $ | 450 | $ | 388,113 | $ | 49,303 | $ | 1,592 | $ | 439,458 | |||||||||||||
|
|
|
|
|
|
|
|
|
|
|
|
|
|||||||||||||
See notes to the accompanying condensed consolidated financial statements
6
Table of Contents
CenterState Banks, Inc. and Subsidiaries
CONDENSED CONSOLIDATED STATEMENTS OF CASH FLOWS (unaudited)
(in thousands of dollars, except per share data)
| Six months ended June 30, | ||||||||
| 2014 | 2013 | |||||||
| Cash flows from operating activities: |
||||||||
| Net income |
$ | 2,090 | $ | 7,334 | ||||
| Adjustments to reconcile net income to net cash provided by operating activities: |
||||||||
| Provision for loan losses |
(147 | ) | 1,014 | |||||
| Depreciation of premises and equipment |
3,041 | 2,952 | ||||||
| Accretion of purchase accounting adjustments |
(17,159 | ) | (15,866 | ) | ||||
| Net amortization of investment securities |
2,840 | 3,725 | ||||||
| Net deferred loan origination fees |
(412 | ) | (456 | ) | ||||
| Gain on sale of securities available for sale |
(46 | ) | (1,038 | ) | ||||
| Trading securities revenue |
(69 | ) | (131 | ) | ||||
| Purchases of trading securities |
(65,234 | ) | (129,249 | ) | ||||
| Proceeds from sale of trading securities |
65,214 | 134,428 | ||||||
| Repossessed real estate owned valuation write down |
1,905 | 2,667 | ||||||
| Loss on sale of repossessed real estate owned |
456 | 562 | ||||||
| Repossessed assets other than real estate valuation write down |
17 | 52 | ||||||
| Loss on sale of repossessed assets other than real estate |
— | 294 | ||||||
| Gain on sale of loans held for sale |
(183 | ) | (170 | ) | ||||
| Loans originated and held for sale |
(10,991 | ) | (10,887 | ) | ||||
| Proceeds from sale of loans held for sale |
10,835 | 12,006 | ||||||
| Gain on disposal of and or sale of fixed assets |
(11 | ) | — | |||||
| Gain on disposal of bank property held for sale |
— | (31 | ) | |||||
| Impairment on bank property held for sale |
2,506 | — | ||||||
| Deferred income taxes |
(639 | ) | 2,184 | |||||
| Stock based compensation expense |
369 | 289 | ||||||
| Bank owned life insurance income |
(708 | ) | (677 | ) | ||||
| Net cash from changes in: |
||||||||
| Net changes in accrued interest receivable, prepaid expenses, and other assets |
2,480 | 6,905 | ||||||
| Net change in accrued interest payable, accrued expense, and other liabilities |
179 | (680 | ) | |||||
|
|
|
|
|
|||||
| Net cash (used in)/provided by operating activities |
(3,667 | ) | 15,227 | |||||
|
|
|
|
|
|||||
| Cash flows from investing activities: |
||||||||
| Purchases of investment securities available for sale |
— | (31,133 | ) | |||||
| Purchases of mortgage backed securities available for sale |
(176,584 | ) | (183,002 | ) | ||||
| Purchases of FRB/FHLB stock |
(3,580 | ) | — | |||||
| Proceeds from maturities of investment securities available for sale |
— | 165 | ||||||
| Proceeds from called investment securities available for sale |
1,355 | 3,670 | ||||||
| Proceeds from pay-downs of mortgage backed securities available for sale |
39,036 | 57,515 | ||||||
| Proceeds from sales of investment securities available for sale |
62,111 | 31,201 | ||||||
| Proceeds from sales of mortgage backed securities available for sale |
261,426 | 37,691 | ||||||
| Proceeds from sales of FHLB and FRB stock |
1,054 | 1,570 | ||||||
| Net (increase) decrease in loans |
46,263 | (2,589 | ) | |||||
| Cash received from FDIC loss sharing agreements |
7,510 | 28,371 | ||||||
| Purchases of premises and equipment, net |
1,218 | (1,517 | ) | |||||
| Proceeds from sale of repossessed real estate |
14,262 | 12,095 | ||||||
| Proceeds from sale of fixed assets |
56 | 13 | ||||||
| Proceeds from sale of bank property held for sale |
— | 931 | ||||||
| Net cash from bank acquisitions |
130,497 | — | ||||||
|
|
|
|
|
|||||
| Net cash provided by investing activities |
384,624 | (45,019 | ) | |||||
|
|
|
|
|
|||||
See notes to the accompanying condensed consolidated financial statements.
7
Table of Contents
CenterState Banks, Inc. and Subsidiaries
CONDENSED CONSOLIDATED STATEMENTS OF CASH FLOWS (unaudited)
(in thousands of dollars, except per share data)
(continued)
| Six months ended June 30, | ||||||||
| 2014 | 2013 | |||||||
| Cash flows from financing activities: |
||||||||
| Net decrease in deposits |
(80,473 | ) | (20,239 | ) | ||||
| Net increase in securities sold under agreement to repurchase |
5,586 | 3,098 | ||||||
| Net increase in federal funds purchased |
13,171 | 14,342 | ||||||
| Net in other borrowings |
(5,708 | ) | — | |||||
| Net increase in payable to shareholders for acquisitions |
27,527 | — | ||||||
| Stock options exercised, including tax benefit |
894 | — | ||||||
| Dividends paid |
(805 | ) | (602 | ) | ||||
|
|
|
|
|
|||||
| Net cash provided by financing activities |
(39,837 | ) | (3,401 | ) | ||||
|
|
|
|
|
|||||
| Net (decrease)increase in cash and cash equivalents |
341,120 | (33,193 | ) | |||||
| Cash and cash equivalents, beginning of period |
174,889 | 136,748 | ||||||
|
|
|
|
|
|||||
| Cash and cash equivalents, end of period |
$ | 516,009 | $ | 103,555 | ||||
|
|
|
|
|
|||||
| Transfer of loans to other real estate owned |
$ | 8,046 | $ | 15,667 | ||||
|
|
|
|
|
|||||
| Transfers of bank property to held for sale |
$ | 4,647 | $ | — | ||||
|
|
|
|
|
|||||
| Cash paid during the period for: |
||||||||
| Interest |
$ | 3,824 | $ | 3,485 | ||||
|
|
|
|
|
|||||
| Income taxes |
$ | 5,462 | $ | 783 | ||||
|
|
|
|
|
|||||
See notes to the accompanying condensed consolidated financial statements.
8
Table of Contents
CenterState Banks, Inc. and Subsidiaries
NOTES TO CONDENSED CONSOLIDATED FINANCIAL STATEMENTS (unaudited)
(in thousands of dollars, except per share data)
NOTE 1: Nature of Operations and basis of presentation
Our consolidated financial statements include the accounts of CenterState Banks, Inc. (the “Parent Company,” “Company” or “CSFL”), and our wholly owned subsidiary bank, CenterState Bank of Florida, N.A. (“CenterState”), and our non bank subsidiary, R4ALL, Inc. Our subsidiary bank operates through 68 full service banking locations in 21 counties throughout Florida, providing traditional deposit and lending products and services to its commercial and retail customers. Ten of our 68 branches are scheduled to be closed in September 2014. The deposits from 6 and the real estate from 5 have been sold to an unrelated commercial bank. The remaining 4 will be consolidated into existing CenterState branches. R4ALL, Inc. is a separate non bank subsidiary of CSFL. Its purpose is to purchase troubled loans from our subsidiary bank and manage their eventual disposition.
In addition, we also operate a correspondent banking and capital markets division. The division is integrated with and part of our subsidiary bank located in Winter Haven, Florida, although the majority of our bond salesmen, traders and operational personnel are physically housed in leased facilities located in Birmingham, Alabama, Atlanta, Georgia and Winston Salem, North Carolina. The business lines of this division are primarily divided into three inter-related revenue generating activities. The first, and largest, revenue generator is commissions earned on fixed income security sales. The second category includes correspondent bank deposits (i.e. federal funds purchased) and correspondent bank checking account deposits. The third revenue generating category includes fees from safe-keeping activities, bond accounting services for correspondents, asset/liability consulting related activities, international wires, and other clearing and corporate checking account services. The customer base includes small to medium size financial institutions primarily located in the Southeastern United States.
The accompanying unaudited condensed consolidated financial statements have been prepared in accordance with accounting principles generally accepted in the United States of America for interim financial statements and with the instructions to Form 10-Q. Accordingly, they do not include all of the information and footnotes required by accounting principles generally accepted in the United States of America for complete financial statements. These statements should be read in conjunction with the consolidated financial statements included in our Annual Report on Form 10-K for the year ended December 31, 2013. In our opinion, all adjustments, consisting primarily of normal recurring adjustments, necessary for a fair presentation of the results for the interim periods have been made. The results of operations of the three month and six month periods ended June 30, 2014 are not necessarily indicative of the results expected for the full year.
Some items in the prior period financial statements were reclassified to conform to the current presentation. Reclassifications had no effect on prior periods net income or shareholders’ equity.
9
Table of Contents
CenterState Banks, Inc. and Subsidiaries
NOTES TO CONDENSED CONSOLIDATED FINANCIAL STATEMENTS (unaudited)
(in thousands of dollars, except per share data)
NOTE 2: Common stock outstanding and earnings per share data
Basic earnings per share is based on the weighted average number of common shares outstanding during the periods. Diluted earnings per share includes the weighted average number of common shares outstanding during the periods and the further dilution from stock options using the treasury method. Average stock options outstanding that were anti dilutive during the three and six month periods ending June 30, 2014 and 2013 were 973,875, 989,105, 1,121,942 and 1,126,478 respectively. The following is a reconciliation of the numerators and denominators of the basic and diluted earnings per share computations for the periods presented.
| Three months ended June 30, | Six months ended June 30, | |||||||||||||||
| 2014 | 2013 | 2014 | 2013 | |||||||||||||
| Numerator for basic and diluted earnings per share: |
||||||||||||||||
| Net income |
$ | 1,037 | $ | 2,758 | $ | 2,090 | $ | 7,334 | ||||||||
| Denominator: |
||||||||||||||||
| Denominator for basic earnings per share - weighted-average shares |
38,665,018 | 30,098,853 | 36,576,622 | 30,094,315 | ||||||||||||
| Effect of dilutive securities: |
||||||||||||||||
| Stock options and stock grants |
386,212 | 62,388 | 403,612 | 61,465 | ||||||||||||
|
|
|
|
|
|
|
|
|
|||||||||
| Denominator for diluted earnings per share - adjusted weighted-average shares |
39,051,230 | 30,161,241 | 36,980,234 | 30,155,780 | ||||||||||||
|
|
|
|
|
|
|
|
|
|||||||||
| Basic earnings per share |
$ | 0.03 | $ | 0.09 | $ | 0.06 | $ | 0.24 | ||||||||
| Diluted earnings per share |
$ | 0.03 | $ | 0.09 | $ | 0.06 | $ | 0.24 | ||||||||
NOTE 3: Fair value
Generally accepted accounting principles establish a fair value hierarchy which requires an entity to maximize the use of observable inputs and minimize the use of unobservable inputs when measuring fair value. The standard describes three levels of inputs that may be used to measure fair value:
Level 1: Quoted prices (unadjusted) for identical assets or liabilities in active markets that the entity has the ability to access as of the measurement date.
Level 2: Significant other observable inputs other than Level 1 prices such as quoted prices for similar assets or liabilities; quoted prices in markets that are not active; or other inputs that are observable or can be corroborated by observable market data.
Level 3: Significant unobservable inputs that reflect a reporting entity’s own assumptions about the assumptions that market participants would use in pricing and asset or liability.
The fair values of securities available for sale are determined by obtaining quoted prices on nationally recognized securities exchanges (Level 1 inputs) or matrix pricing, which is a mathematical technique widely used in the industry to value debt securities without relying exclusively on quoted prices for the specific securities but rather by relying on the securities’ relationship to other benchmark quoted securities (Level 2 inputs).
The fair values of trading securities are determined as follows: (1) for those securities that have traded prior to the date of the consolidated balance sheet but have not settled (date of sale) until after such date, the sales price is used as the fair value; and, (2) for those securities which have not traded as of the date of the consolidated balance sheet, the fair value was determined by broker price indications of similar or same securities.
10
Table of Contents
CenterState Banks, Inc. and Subsidiaries
NOTES TO CONDENSED CONSOLIDATED FINANCIAL STATEMENTS (unaudited)
(in thousands of dollars, except per share data)
The fair value of derivatives is based on valuation models using observable market data as of the measurement date (Level 2). Assets and liabilities measured at fair value on a recurring basis are summarized below.
| Fair value measurements using | ||||||||||||||||
| Carrying value |
Quoted prices in active markets for identical assets (Level 1) |
Significant other observable inputs (Level 2) |
Significant unobservable inputs (Level 3) |
|||||||||||||
| at June 30, 2014 |
||||||||||||||||
| Assets: |
||||||||||||||||
| Trading securities |
$ | 89 | — | $ | 89 | — | ||||||||||
| Available for sale securities |
||||||||||||||||
| U.S. government sponsored entities and agencies |
4 | — | 4 | — | ||||||||||||
| Mortgage backed securities |
502,590 | — | 502,590 | — | ||||||||||||
| Municipal securities |
39,555 | — | 39,555 | — | ||||||||||||
| Interest rate swap derivatives |
3,467 | — | 3,467 | — | ||||||||||||
| Liabilities: |
||||||||||||||||
| Interest rate swap derivatives |
3,796 | — | 3,796 | — | ||||||||||||
| at December 31, 2013 |
||||||||||||||||
| Assets: |
||||||||||||||||
| Trading securities |
$ | — | — | $ | — | — | ||||||||||
| Available for sale securities |
||||||||||||||||
| U.S. government sponsored entities and agencies |
4 | — | 4 | — | ||||||||||||
| Mortgage backed securities |
416,881 | — | 416,881 | — | ||||||||||||
| Municipal securities |
40,201 | — | 40,201 | — | ||||||||||||
| Interest rate swap derivatives |
2,603 | — | 2,603 | — | ||||||||||||
| Liabilities: |
||||||||||||||||
| Interest rate swap derivatives |
2,496 | — | 2,496 | — | ||||||||||||
The fair value of impaired loans with specific valuation allowance for loan losses and other real estate owned is based on recent real estate appraisals. For residential real estate impaired loans and other real estate owned, appraised values are based on the comparative sales approach. For commercial and commercial real estate impaired loans, and other real estate owned, appraisers may use either a single valuation approach or a combination of approaches such as comparative sales, cost or the income approach. A significant unobservable input in the income approach is the estimated income capitalization rate for a given piece of collateral. At June 30, 2014, the range of capitalization rates utilized to determine the fair value of the underlying collateral ranged from 8% to 11%. Adjustments to appraisals may be made by the appraiser to reflect local market conditions or other economic factors and may result in changes in the fair value of a given asset over time. As such, the fair value of impaired loans and other real estate owned are considered a Level 3 in the fair value hierarchy.
11
Table of Contents
CenterState Banks, Inc. and Subsidiaries
NOTES TO CONDENSED CONSOLIDATED FINANCIAL STATEMENTS (unaudited)
(in thousands of dollars, except per share data)
Assets and liabilities measured at fair value on a non-recurring basis are summarized below.
| Fair value measurements using | ||||||||||||||||
| Carrying value |
Quoted prices in active markets for identical assets (Level 1) |
Significant other observable inputs (Level 2) |
Significant Unobservable Inputs (Level 3) |
|||||||||||||
| at June 30, 2014 |
||||||||||||||||
| Assets: |
||||||||||||||||
| Impaired loans |
||||||||||||||||
| Residential real estate |
$ | 3,184 | — | — | $ | 3,184 | ||||||||||
| Commercial real estate |
6,058 | — | — | 6,058 | ||||||||||||
| Land, land development and construction |
1,248 | — | — | 1,248 | ||||||||||||
| Commercial |
683 | — | — | 683 | ||||||||||||
| Consumer |
150 | — | — | 150 | ||||||||||||
| Other real estate owned |
||||||||||||||||
| Residential real estate |
$ | 1,599 | — | — | $ | 1,599 | ||||||||||
| Commercial real estate |
3,741 | — | — | 3,741 | ||||||||||||
| Land, land development and construction |
1,913 | — | — | 1,913 | ||||||||||||
| Bank property held for sale |
6,049 | — | — | 6,049 | ||||||||||||
| at December 31, 2013 |
||||||||||||||||
| Assets: |
||||||||||||||||
| Impaired loans |
||||||||||||||||
| Residential real estate |
$ | 3,191 | — | — | $ | 3,191 | ||||||||||
| Commercial real estate |
7,515 | — | — | 7,515 | ||||||||||||
| Land, land development and construction |
290 | — | — | 290 | ||||||||||||
| Commercial |
731 | — | — | 731 | ||||||||||||
| Consumer |
157 | — | — | 157 | ||||||||||||
| Other real estate owned |
||||||||||||||||
| Residential real estate |
$ | 27 | — | — | $ | 27 | ||||||||||
| Commercial real estate |
3,837 | — | — | 3,837 | ||||||||||||
| Land, land development and construction |
3,949 | — | — | 3,949 | ||||||||||||
| Bank owned real estate held for sale |
1,582 | — | — | 1,582 | ||||||||||||
Impaired loans with specific valuation allowances and/or partial charge-offs had a recorded investment of $12,796 with a valuation allowance of $1,473, at June 30, 2014, and a recorded investment of $13,528, with a valuation allowance of $1,644, at December 31, 2013. The Company recorded a provision for loan loss expense of $181 and $359 on these loans during the three and six month periods ending June 30, 2014.
Other real estate owned had a decline in fair value of $885, $1,905, $1,680 and $2,667 during the three and six month periods ending June 30, 2014 and 2013, respectively. Changes in fair value were recorded directly to current earnings through non interest expense.
12
Table of Contents
CenterState Banks, Inc. and Subsidiaries
NOTES TO CONDENSED CONSOLIDATED FINANCIAL STATEMENTS (unaudited)
(in thousands of dollars, except per share data)
Bank property held for sale represents certain branch office buildings which the Company has closed and consolidated to other existing branches. The real estate was transferred out of the Bank Premises and Equipment category into bank owned property held for sale. The real estate was transferred at the lower of amortized cost or fair value less estimated costs to sell. The fair values were based upon comparative sales data provided by real estate brokers. The Company closed eight bank branch offices in April 2014, seven owned by the Company and one leased. Five of the properties owned by the Company were transferred to held-for-sale, the remaining two are being used as loan production offices, back office support staff offices and a portion of the second floor of one of the buildings is leased to an existing tenant. The Company recognized an impairment charge of $-0- and $2,326 during the three and six month periods ending June 30, 2014 related to the transfer to held-for-sale. Also during the first quarter of 2014, the Company recognized an additional impairment of $180 on a property previously transferred to held-for-sale in 2012.
Fair Value of Financial Instruments
The methods and assumptions, not previously presented, used to estimate fair value are described as follows:
Cash and Cash Equivalents: The carrying amounts of cash and cash equivalents approximate fair values and are classified as Level 1.
FHLB and FRB Stock: It is not practical to determine the fair value of FHLB and FRB stock due to restrictions placed on their transferability.
Loans held for sale: The fair value of loans held for sale is estimated based upon binding contracts from third party investors resulting in a Level 2 classification.
Loans, net: Fair values of loans, excluding loans held for sale, are estimated as follows: For variable rate loans that reprice frequently and with no significant change in credit risk, fair values are based on carrying values resulting in a Level 3 classification. Fair values for other loans are estimated using discounted cash flow analyses, using interest rates currently being offered for loans with similar terms to borrowers of similar credit quality resulting in a Level 3 classification. Impaired loans are valued as described previously. The methods utilized to estimate the fair value of loans do not necessarily represent an exit price.
FDIC Indemnification Asset: It is not practical to determine the fair value of the FDIC indemnification asset due to restrictions placed on its transferability.
Accrued Interest Receivable: The carrying amount of accrued interest receivable approximates fair value and is classified as Level 3.
Deposits: The fair values disclosed for demand deposits (e.g., interest and non-interest checking, savings, and money market accounts) are, by definition, equal to the amount payable on demand at the reporting date (i.e., their carrying amount) resulting in Level 1 classification. Fair values for fixed rate certificates of deposit are estimated using a discounted cash flows calculation that applies interest rates currently being offered on certificates to a schedule of aggregated expected monthly maturities on time deposits resulting in a Level 2 classification.
13
Table of Contents
CenterState Banks, Inc. and Subsidiaries
NOTES TO CONDENSED CONSOLIDATED FINANCIAL STATEMENTS (unaudited)
(in thousands of dollars, except per share data)
Deposits held for sale: The fair value disclosed is based on the contracted price for the sale of these deposits resulting in a Level 2 classification.
Short-term Borrowings: The carrying amounts of federal funds purchased, borrowings under repurchase agreements, and other short-term borrowings, generally maturing within ninety days, approximate their fair values resulting in a Level 2 classification.
Corporate Debentures: The fair values of the Company’s corporate debentures are estimated using discounted cash flow analyses based on the current borrowing rates for similar types of borrowing arrangements resulting in a Level 3 classification.
Accrued Interest Payable: The carrying amount of accrued interest payable approximates fair value resulting in a Level 2 classification.
Off-balance Sheet Instruments: The fair value of off-balance-sheet items is not considered material.
The following table presents the carry amounts and estimated fair values of the Company’s financial instruments:
| Fair value measurements | ||||||||||||||||||||
| at June 30, 2014 |
Carrying amount | Level 1 | Level 2 | Level 3 | Total | |||||||||||||||
| Financial assets: |
||||||||||||||||||||
| Cash and cash equivalents |
$ | 516,009 | $ | 516,009 | $ | — | $ | — | $ | 516,009 | ||||||||||
| Trading securities |
89 | — | 89 | — | 89 | |||||||||||||||
| Investment securities available for sale |
542,149 | — | 542,149 | — | 542,149 | |||||||||||||||
| FHLB and FRB stock |
17,176 | — | — | — | n/a | |||||||||||||||
| Loans held for sale |
1,596 | — | 1,596 | — | 1,596 | |||||||||||||||
| Loans, less allowance for loan losses of $19,200 |
2,376,819 | — | — | 2,383,572 | 2,383,572 | |||||||||||||||
| FDIC indemnification asset |
61,311 | — | — | — | n/a | |||||||||||||||
| Interest rate swap derivatives |
3,467 | — | 3,467 | — | 3,467 | |||||||||||||||
| Accrued interest receivable |
8,216 | — | — | 8,216 | 8,216 | |||||||||||||||
| Financial liabilities: |
||||||||||||||||||||
| Deposits- without stated maturities |
$ | 2,595,030 | $ | 2,595,030 | $ | — | $ | — | $ | 2,595,030 | ||||||||||
| Deposits- with stated maturities |
526,313 | — | 529,428 | — | 529,428 | |||||||||||||||
| Deposits held for sale |
185,646 | — | 185,646 | — | 185,646 | |||||||||||||||
| Securities sold under agreement to repurchase |
33,619 | — | 33,619 | — | 33,619 | |||||||||||||||
| Federal funds purchased |
43,080 | — | 43,080 | — | 43,080 | |||||||||||||||
| Corporate debentures |
23,829 | — | — | 19,888 | 19,888 | |||||||||||||||
| Interest rate swap derivatives |
3,796 | — | 3,796 | — | 3,796 | |||||||||||||||
| Accrued interest payable |
411 | — | 411 | — | 411 | |||||||||||||||
14
Table of Contents
CenterState Banks, Inc. and Subsidiaries
NOTES TO CONDENSED CONSOLIDATED FINANCIAL STATEMENTS (unaudited)
(in thousands of dollars, except per share data)
| Fair value measurements | ||||||||||||||||||||
| at December 31, 2013 |
Carrying amount | Level 1 | Level 2 | Level 3 | Total | |||||||||||||||
| Financial assets: |
||||||||||||||||||||
| Cash and cash equivalents |
$ | 174,889 | $ | 174,889 | $ | — | $ | — | $ | 174,889 | ||||||||||
| Trading securities |
— | — | — | — | — | |||||||||||||||
| Investment securities available for sale |
457,086 | — | 457,086 | — | 457,086 | |||||||||||||||
| FHLB and FRB stock |
8,189 | — | — | — | n/a | |||||||||||||||
| Loans held for sale |
1,010 | — | 1,010 | — | 1,010 | |||||||||||||||
| Loans, less allowance for loan losses of $20,454 |
1,453,725 | — | — | 1,456,295 | 1,456,295 | |||||||||||||||
| FDIC indemnification asset |
73,433 | — | — | — | n/a | |||||||||||||||
| Interest rate swap derivatives |
2,603 | — | 2,603 | — | 2,603 | |||||||||||||||
| Accrued interest receivable |
6,337 | — | — | 6,337 | 6,337 | |||||||||||||||
| Financial liabilities: |
||||||||||||||||||||
| Deposits- without stated maturities |
$ | 1,671,356 | $ | 1,671,356 | $ | — | $ | — | $ | 1,671,356 | ||||||||||
| Deposits- with stated maturities |
384,875 | — | 389,115 | — | 389,115 | |||||||||||||||
| Securities sold under agreement to repurchase |
20,457 | — | 20,457 | — | 20,457 | |||||||||||||||
| Federal funds purchased |
29,909 | — | 29,909 | — | 29,909 | |||||||||||||||
| Corporate debentures |
16,996 | — | — | 11,091 | 11,091 | |||||||||||||||
| Interest rate swap derivatives |
2,496 | — | 2,496 | — | 2,496 | |||||||||||||||
| Accrued interest payable |
333 | — | 333 | — | 333 | |||||||||||||||
NOTE 4: Reportable segments
The Company’s reportable segments represent the distinct product lines the Company offers and are viewed separately for strategic planning purposes by management. The table below is a reconciliation of the reportable segment revenues, expenses, and profit to the Company’s consolidated total for the three and six month periods ending June 30, 2014 and 2013.
Three month period ending June 30, 2014
| Commercial and retail banking |
Correspondent banking and capital markets division |
Corporate overhead and administration |
Elimination entries |
Total | ||||||||||||||||
| Interest income |
$ | 32,333 | $ | 746 | $ | — | $ | 33,079 | ||||||||||||
| Interest expense |
(1,578 | ) | (6 | ) | (238 | ) | (1,822 | ) | ||||||||||||
|
|
|
|
|
|
|
|
|
|
|
|||||||||||
| Net interest income (expense) |
30,755 | 740 | (238 | ) | 31,257 | |||||||||||||||
| Recovery of prior loan loss provision |
106 | — | — | 106 | ||||||||||||||||
| Non interest income |
1,087 | 5,285 | — | 6,372 | ||||||||||||||||
| Non interest expense |
(30,215 | ) | (5,063 | ) | (875 | ) | (36,153 | ) | ||||||||||||
|
|
|
|
|
|
|
|
|
|
|
|||||||||||
| Net income (loss) before taxes |
1,733 | 962 | (1,113 | ) | 1,582 | |||||||||||||||
| Income tax (provision) benefit |
(589 | ) | (371 | ) | 415 | (545 | ) | |||||||||||||
|
|
|
|
|
|
|
|
|
|
|
|||||||||||
| Net income (loss) |
$ | 1,144 | $ | 591 | $ | (698 | ) | $ | 1,037 | |||||||||||
|
|
|
|
|
|
|
|
|
|
|
|||||||||||
| Total assets |
$ | 3,716,281 | $ | 173,516 | $ | 495,677 | $ | (483,892 | ) | $ | 3,901,582 | |||||||||
|
|
|
|
|
|
|
|
|
|
|
|||||||||||
15
Table of Contents
CenterState Banks, Inc. and Subsidiaries
NOTES TO CONDENSED CONSOLIDATED FINANCIAL STATEMENTS (unaudited)
(in thousands of dollars, except per share data)
Six month period ending June 30, 2014
| Commercial and retail banking |
Correspondent banking and capital markets division |
Corporate overhead and administration |
Elimination entries |
Total | ||||||||||||||||
| Interest income |
$ | 61,403 | $ | 1,458 | $ | — | $ | 62,861 | ||||||||||||
| Interest expense |
(2,939 | ) | (11 | ) | (461 | ) | (3,411 | ) | ||||||||||||
|
|
|
|
|
|
|
|
|
|
|
|||||||||||
| Net interest income (expense) |
58,464 | 1,447 | (461 | ) | 59,450 | |||||||||||||||
| Recovery of prior loan loss provision |
147 | — | — | 147 | ||||||||||||||||
| Non interest income |
2,916 | 9,216 | — | 12,132 | ||||||||||||||||
| Non interest expense |
(57,382 | ) | (9,441 | ) | (1,733 | ) | (68,556 | ) | ||||||||||||
|
|
|
|
|
|
|
|
|
|
|
|||||||||||
| Net income (loss) before taxes |
4,145 | 1,222 | (2,194 | ) | 3,173 | |||||||||||||||
| Income tax (provision) benefit |
(1,438 | ) | (471 | ) | 826 | (1,083 | ) | |||||||||||||
|
|
|
|
|
|
|
|
|
|
|
|||||||||||
| Net income (loss) |
$ | 2,707 | $ | 751 | $ | (1,368 | ) | $ | 2,090 | |||||||||||
|
|
|
|
|
|
|
|
|
|
|
|||||||||||
| Total assets |
$ | 3,716,281 | $ | 173,516 | $ | 495,677 | $ | (483,892 | ) | $ | 3,901,582 | |||||||||
|
|
|
|
|
|
|
|
|
|
|
|||||||||||
Three month period ending June 30, 2013
| Commercial and retail banking |
Correspondent banking and capital markets division |
Corporate overhead and administration |
Elimination entries |
Total | ||||||||||||||||
| Interest income |
$ | 23,875 | $ | 612 | $ | — | — | $ | 24,487 | |||||||||||
| Interest expense |
(1,352 | ) | (5 | ) | (150 | ) | — | (1,507 | ) | |||||||||||
|
|
|
|
|
|
|
|
|
|
|
|||||||||||
| Net interest income (expense) |
22,523 | 607 | (150 | ) | — | 22,980 | ||||||||||||||
| Provision for loan losses |
(1,374 | ) | — | — | — | (1,374 | ) | |||||||||||||
| Non interest income |
4,254 | 5,609 | — | — | 9,863 | |||||||||||||||
| Non interest expense |
(21,212 | ) | (5,363 | ) | (798 | ) | — | (27,373 | ) | |||||||||||
|
|
|
|
|
|
|
|
|
|
|
|||||||||||
| Net income before taxes |
4,191 | 853 | (948 | ) | — | 4,096 | ||||||||||||||
| Income tax (provision) benefit |
(1,368 | ) | (329 | ) | 359 | — | (1,338 | ) | ||||||||||||
|
|
|
|
|
|
|
|
|
|
|
|||||||||||
| Net income (loss) |
$ | 2,823 | $ | 524 | $ | (589 | ) | — | $ | 2,758 | ||||||||||
|
|
|
|
|
|
|
|
|
|
|
|||||||||||
| Total assets |
$ | 2,201,379 | $ | 150,679 | $ | 293,127 | $ | (289,832 | ) | $ | 2,355,353 | |||||||||
|
|
|
|
|
|
|
|
|
|
|
|||||||||||
Six month period ending June 30, 2013
| Commercial and retail banking |
Correspondent banking and capital markets division |
Corporate overhead and administration |
Elimination entries |
Total | ||||||||||||||||
| Interest income |
$ | 47,473 | $ | 1,392 | $ | — | — | $ | 48,865 | |||||||||||
| Interest expense |
(2,752 | ) | (11 | ) | (300 | ) | — | (3,063 | ) | |||||||||||
|
|
|
|
|
|
|
|
|
|
|
|||||||||||
| Net interest income |
44,721 | 1,381 | (300 | ) | — | 45,802 | ||||||||||||||
| Provision for loan losses |
(1,014 | ) | — | — | — | (1,014 | ) | |||||||||||||
| Non interest income |
7,528 | 12,614 | — | — | 20,142 | |||||||||||||||
| Non interest expense |
(41,297 | ) | (11,438 | ) | (1,728 | ) | — | (54,463 | ) | |||||||||||
|
|
|
|
|
|
|
|
|
|
|
|||||||||||
| Net income before taxes |
9,938 | 2,557 | (2,028 | ) | — | 10,467 | ||||||||||||||
| Income tax (provision) benefit |
(3,066 | ) | (986 | ) | 919 | — | (3,133 | ) | ||||||||||||
|
|
|
|
|
|
|
|
|
|
|
|||||||||||
| Net income (loss) |
$ | 6,872 | $ | 1,571 | $ | (1,109 | ) | — | $ | 7,334 | ||||||||||
|
|
|
|
|
|
|
|
|
|
|
|||||||||||
| Total assets |
$ | 2,201,379 | $ | 150,679 | $ | 293,127 | $ | (289,832 | ) | $ | 2,355,353 | |||||||||
|
|
|
|
|
|
|
|
|
|
|
|||||||||||
16
Table of Contents
CenterState Banks, Inc. and Subsidiaries
NOTES TO CONDENSED CONSOLIDATED FINANCIAL STATEMENTS (unaudited)
(in thousands of dollars, except per share data)
Commercial and retail banking: The Company’s primary business is commercial and retail banking. Currently, the Company operates through its subsidiary bank and a non bank subsidiary, R4ALL, with 68 full service banking locations in 21 counties throughout Florida providing traditional deposit and lending products and services to its commercial and retail customers.
Correspondent banking and capital markets division: Operating as a division of our subsidiary bank, its primary revenue generating activities are related to the capital markets division which includes commissions earned on fixed income security sales, fees from hedging services, loan brokerage fees and consulting fees for services related to these activities. Income generated related to the correspondent banking services includes spread income earned on correspondent bank deposits (i.e. federal funds purchased) and fees generated from safe-keeping activities, bond accounting services, asset/liability consulting services, international wires, clearing and corporate checking account services and other correspondent banking related services. The fees derived from the correspondent banking services are less volatile than those generated through the capital markets group. The customer base includes small to medium size financial institutions primarily located in Southeastern United States.
Corporate overhead and administration: Corporate overhead and administration is comprised primarily of compensation and benefits for certain members of management, interest on parent company debt, office occupancy and depreciation of parent company facilities, certain merger related costs and other expenses.
17
Table of Contents
CenterState Banks, Inc. and Subsidiaries
NOTES TO CONDENSED CONSOLIDATED FINANCIAL STATEMENTS (unaudited)
(in thousands of dollars, except per share data)
NOTE 5: Investment Securities Available for Sale
All of the mortgage backed securities listed below were issued by U.S. government sponsored entities and agencies, primarily Fannie Mae, Freddie Mac and Ginnie Mae, institutions which the government has affirmed its commitment to support. The fair value of available for sale securities and the related gross unrealized gains and losses recognized in accumulated other comprehensive income (loss) were as follows:
| June 30, 2014 | ||||||||||||||||
| Amortized Cost |
Gross Unrealized Gains |
Gross Unrealized Losses |
Fair Value |
|||||||||||||
| Obligations of U.S. government sponsored entities and agencies |
$ | 4 | $ | — | $ | — | $ | 4 | ||||||||
| Mortgage backed securities |
501,286 | 6,494 | 5,190 | 502,590 | ||||||||||||
| Municipal securities |
38,267 | 1,428 | 140 | 39,555 | ||||||||||||
|
|
|
|
|
|
|
|
|
|||||||||
| Total |
$ | 539,557 | $ | 7,922 | $ | 5,330 | $ | 542,149 | ||||||||
|
|
|
|
|
|
|
|
|
|||||||||
| December 31, 2013 | ||||||||||||||||
| Amortized Cost |
Gross Unrealized Gains |
Gross Unrealized Losses |
Fair Value |
|||||||||||||
| Obligations of U.S. government sponsored entities and agencies |
$ | 4 | $ | — | $ | — | $ | 4 | ||||||||
| Mortgage backed securities |
424,654 | 4,623 | 12,396 | 416,881 | ||||||||||||
| Municipal securities |
39,728 | 921 | 448 | 40,201 | ||||||||||||
|
|
|
|
|
|
|
|
|
|||||||||
| Total |
$ | 464,386 | $ | 5,544 | $ | 12,844 | $ | 457,086 | ||||||||
|
|
|
|
|
|
|
|
|
|||||||||
The cost of securities sold is determined using the specific identification method. The securities sold during the first quarter of 2014 were securities acquired through the Gulfstream acquisition and the securities sold during the second quarter of 2014 included the securities acquired through the First Southern acquisition. These acquired securities were marked to fair value and subsequently sold after the acquisition date, therefore no gain or loss was recognized from the sale of these securities. Sales of available for sale securities for the six months ended June 30, 2014 and 2013 were as follows:
| For the six months ended: |
June 30, 2014 | June 30, 2013 | ||||||
| Proceeds |
$ | 323,542 | $ | 68,892 | ||||
| Gross gains |
1,175 | 1,038 | ||||||
| Gross losses |
1,129 | — | ||||||
The tax provision related to these net realized gains was $18 and $400, respectively.
18
Table of Contents
CenterState Banks, Inc. and Subsidiaries
NOTES TO CONDENSED CONSOLIDATED FINANCIAL STATEMENTS (unaudited)
(in thousands of dollars, except per share data)
The fair value of available for sale securities at June 30, 2014 by contractual maturity were as follows. Securities not due at a single maturity date, primarily mortgage-backed securities, are shown separately.
| Investment securities available for sale: |
Fair Value | Amortized Cost |
||||||
| Due in one year or less |
$ | 584 | $ | 579 | ||||
| Due after one year through five years |
2,129 | 2,017 | ||||||
| Due after five years through ten years |
14,358 | 13,878 | ||||||
| Due after ten years through thirty years |
22,488 | 21,797 | ||||||
| Mortgage backed securities |
502,590 | 501,286 | ||||||
|
|
|
|
|
|||||
| Total |
$ | 542,149 | $ | 539,557 | ||||
|
|
|
|
|
|||||
Securities pledged at June 30, 2014 and December 31, 2013 had a carrying amount (estimated fair value) of $145,760 and $108,528 respectively. These securities were pledged primarily to secure public deposits and repurchase agreements.
At June 30, 2014 and December 31, 2013, there were no holdings of securities of any one issuer, other than mortgage backed securities issued by U.S. Government sponsored entities and agencies, in an amount greater than 10% of stockholders’ equity.
The following tables show the Company’s investments’ gross unrealized losses and fair value, aggregated by investment category and length of time that individual securities have been in a continuous unrealized loss position, at June 30, 2014 and December 31, 2013.
| June 30, 2014 | ||||||||||||||||||||||||
| Less than 12 months | 12 months or more | Total | ||||||||||||||||||||||
| Fair Value | Unrealized Losses |
Fair Value | Unrealized Losses |
Fair Value | Unrealized Losses |
|||||||||||||||||||
| Mortgage backed securities |
$ | 16,877 | $ | 115 | $ | 144,279 | $ | 5,075 | $ | 161,156 | $ | 5,190 | ||||||||||||
| Municipal securities |
— | — | 3,845 | 140 | 3,845 | 140 | ||||||||||||||||||
|
|
|
|
|
|
|
|
|
|
|
|
|
|||||||||||||
| Total temporarily impaired securities |
$ | 16,877 | $ | 115 | $ | 148,124 | $ | 5,215 | $ | 165,001 | $ | 5,330 | ||||||||||||
|
|
|
|
|
|
|
|
|
|
|
|
|
|||||||||||||
| December 31, 2013 | ||||||||||||||||||||||||
| Less than 12 months | 12 months or more | Total | ||||||||||||||||||||||
| Fair Value | Unrealized Losses |
Fair Value | Unrealized Losses |
Fair Value | Unrealized Losses |
|||||||||||||||||||
| Mortgage backed securities |
$ | 239,641 | $ | 10,221 | $ | 18,793 | $ | 2,175 | $ | 258,434 | $ | 12,396 | ||||||||||||
| Municipal securities |
7,603 | 333 | 1,010 | 115 | 8,613 | 448 | ||||||||||||||||||
|
|
|
|
|
|
|
|
|
|
|
|
|
|||||||||||||
| Total temporarily impaired securities |
$ | 247,244 | $ | 10,554 | $ | 19,803 | $ | 2,290 | $ | 267,047 | $ | 12,844 | ||||||||||||
|
|
|
|
|
|
|
|
|
|
|
|
|
|||||||||||||
19
Table of Contents
CenterState Banks, Inc. and Subsidiaries
NOTES TO CONDENSED CONSOLIDATED FINANCIAL STATEMENTS (unaudited)
(in thousands of dollars, except per share data)
At June 30, 2014, 100% of the mortgage-backed securities held by the Company were issued by U.S. government-sponsored entities and agencies, primarily Fannie Mae, Freddie Mac, and Ginnie Mae, institutions which the government has affirmed its commitment to support. Because the decline in fair value is attributable to changes in interest rates and illiquidity, and not credit quality, and because the Company does not have the intent to sell these mortgage-backed securities and it is likely that it will not be required to sell the securities before their anticipated recovery, the Company does not consider these securities to be other-than-temporarily impaired at June 30, 2014.
Unrealized losses on municipal securities have not been recognized into income because the issuers bonds are of high quality, and because management does not intend to sell these investments or more likely than not will not be required to sell these investments before their anticipated recovery. The fair value is expected to recover as the securities approach maturity.
NOTE 6: Loans
The following table sets forth information concerning the loan portfolio by collateral types as of the dates indicated.
| June 30, 2014 | Dec 31, 2013 | |||||||
| Total loans that are not PCI loans |
||||||||
| Real estate loans |
||||||||
| Residential |
$ | 563,293 | $ | 458,331 | ||||
| Commercial |
1,091,660 | 528,710 | ||||||
| Land, development and construction |
78,444 | 62,503 | ||||||
|
|
|
|
|
|||||
| Total real estate |
1,733,397 | 1,049,544 | ||||||
| Commercial |
251,741 | 143,263 | ||||||
| Consumer and other loans |
56,191 | 49,547 | ||||||
|
|
|
|
|
|||||
| Loans before unearned fees and deferred cost |
2,041,329 | 1,242,354 | ||||||
| Net unearned fees and costs |
820 | 404 | ||||||
|
|
|
|
|
|||||
| Total loans that are not PCI loans |
2,042,149 | 1,242,758 | ||||||
|
|
|
|
|
|||||
| Total PCI loans (note 1) |
||||||||
| Real estate loans |
||||||||
| Residential |
119,005 | 120,030 | ||||||
| Commercial |
195,157 | 100,012 | ||||||
| Land, development and construction |
27,885 | 6,381 | ||||||
|
|
|
|
|
|||||
| Total real estate |
342,047 | 226,423 | ||||||
| Commercial |
10,759 | 3,850 | ||||||
| Consumer and other loans |
1,064 | 1,148 | ||||||
|
|
|
|
|
|||||
| Total PCI loans |
353,870 | 231,421 | ||||||
|
|
|
|
|
|||||
| Allowance for loan losses for loans that are not PCI loans |
(18,240 | ) | (19,694 | ) | ||||
| Allowance for loan losses for PCI loans |
(960 | ) | (760 | ) | ||||
|
|
|
|
|
|||||
| Total loans, net of allowance for loan losses |
$ | 2,376,819 | $ | 1,453,725 | ||||
|
|
|
|
|
|||||
note 1: Purchased credit impaired (“PCI”) loans are being accounted for pursuant to ASC Topic 310-30.
20
Table of Contents
CenterState Banks, Inc. and Subsidiaries
NOTES TO CONDENSED CONSOLIDATED FINANCIAL STATEMENTS (unaudited)
(in thousands of dollars, except per share data)
The following sets forth the covered FDIC loans included in the table above.
| June 30, 2014 | Dec 31, 2013 | |||||||
| FDIC covered loans that are not PCI loans |
||||||||
| Real estate loans |
||||||||
| Residential |
$ | 6,457 | $ | — | ||||
| Commercial |
35,668 | — | ||||||
| Land, development and construction |
857 | — | ||||||
|
|
|
|
|
|||||
| Total real estate |
42,982 | — | ||||||
| Commercial |
459 | — | ||||||
| Consumer and other loans |
— | — | ||||||
|
|
|
|
|
|||||
| FDIC covered loans, excluding PCI loans |
43,441 | — | ||||||
|
|
|
|
|
|||||
| FDIC covered PCI loans (note 1) |
||||||||
| Real estate loans |
||||||||
| Residential |
115,306 | 120,030 | ||||||
| Commercial |
166,932 | 100,012 | ||||||
| Land, development and construction |
20,509 | 6,381 | ||||||
|
|
|
|
|
|||||
| Total real estate |
302,747 | 226,423 | ||||||
| Commercial |
5,184 | 3,850 | ||||||
| Consumer and other loans |
— | — | ||||||
|
|
|
|
|
|||||
| Total FDIC covered PCI loans |
307,931 | 230,273 | ||||||
|
|
|
|
|
|||||
| Allowance for loan losses for FDIC covered loans that are not PCI loans |
— | — | ||||||
| Allowance for loans losses for FDIC covered PCI loans |
(960 | ) | (760 | ) | ||||
|
|
|
|
|
|||||
| Total covered loans, net of allowance for loan losses |
$ | 350,412 | $ | 229,513 | ||||
|
|
|
|
|
|||||
note 1: Purchased credit impaired (“PCI”) loans are being accounted for pursuant to ASC Topic 310-30.
The Company acquired FDIC covered loans that are not PCI loans pursuant to the acquisition of FSB on June 1, 2014. Prior to the FSB acquisition, the Company’s FDIC covered loans were all PCI loans.
21
Table of Contents
CenterState Banks, Inc. and Subsidiaries
NOTES TO CONDENSED CONSOLIDATED FINANCIAL STATEMENTS (unaudited)
(in thousands of dollars, except per share data)
The table below set forth the activity in the allowance for loan losses for the periods presented.
| Allowance for loan losses for loans that are not PCI loans |
Allowance for loan losses on PCI loans |
Total | ||||||||||
| Three months ended June 30, 2014 |
||||||||||||
| Balance at beginning of period |
$ | 18,913 | $ | 1,183 | $ | 20,096 | ||||||
| Loans charged-off |
(902 | ) | — | (902 | ) | |||||||
| Recoveries of loans previously charged-off |
112 | — | 112 | |||||||||
|
|
|
|
|
|
|
|||||||
| Net charge-offs |
(790 | ) | — | (790 | ) | |||||||
| Provision for loan losses |
117 | (223 | ) | (106 | ) | |||||||
|
|
|
|
|
|
|
|||||||
| Balance at end of period |
$ | 18,240 | $ | 960 | $ | 19,200 | ||||||
|
|
|
|
|
|
|
|||||||
| Three months ended June 30, 2013 |
||||||||||||
| Balance at beginning of period |
$ | 22,631 | $ | 2,623 | $ | 25,254 | ||||||
| Loans charged-off |
(2,603 | ) | (515 | ) | (3,118 | ) | ||||||
| Recoveries of loans previously charged-off |
310 | — | 310 | |||||||||
|
|
|
|
|
|
|
|||||||
| Net charge-offs |
(2,293 | ) | (515 | ) | (2,808 | ) | ||||||
| Provision for loan losses |
1,462 | (88 | ) | 1,374 | ||||||||
|
|
|
|
|
|
|
|||||||
| Balance at end of period |
$ | 21,800 | $ | 2,020 | $ | 23,820 | ||||||
|
|
|
|
|
|
|
|||||||
| Allowance for loan losses for loans that are not PCI loans |
Allowance for loan losses on PCI loans |
Total | ||||||||||
| Six months ended June 30, 2014 |
||||||||||||
| Balance at beginning of period |
$ | 19,694 | $ | 760 | $ | 20,454 | ||||||
| Loans charged-off |
(2,062 | ) | — | (2,062 | ) | |||||||
| Recoveries of loans previously charged-off |
955 | — | 955 | |||||||||
|
|
|
|
|
|
|
|||||||
| Net charge-offs |
(1,107 | ) | — | (1,107 | ) | |||||||
| Provision for loan losses |
(347 | ) | 200 | (147 | ) | |||||||
|
|
|
|
|
|
|
|||||||
| Balance at end of period |
$ | 18,240 | $ | 960 | $ | 19,200 | ||||||
|
|
|
|
|
|
|
|||||||
| Six months ended June 30, 2013 |
||||||||||||
| Balance at beginning of period |
$ | 24,033 | $ | 2,649 | $ | 26,682 | ||||||
| Loans charged-off |
(3,834 | ) | (515 | ) | (4,349 | ) | ||||||
| Recoveries of loans previously charged-off |
473 | — | 473 | |||||||||
|
|
|
|
|
|
|
|||||||
| Net charge-offs |
(3,361 | ) | (515 | ) | (3,876 | ) | ||||||
| Provision for loan losses |
1,128 | (114 | ) | 1,014 | ||||||||
|
|
|
|
|
|
|
|||||||
| Balance at end of period |
$ | 21,800 | $ | 2,020 | $ | 23,820 | ||||||
|
|
|
|
|
|
|
|||||||
22
Table of Contents
CenterState Banks, Inc. and Subsidiaries
NOTES TO CONDENSED CONSOLIDATED FINANCIAL STATEMENTS (unaudited)
(in thousands of dollars, except per share data)
The following tables present the activity in the allowance for loan losses by portfolio segment for the periods presented.
| Real Estate Loans | ||||||||||||||||||||||||
| Residential | Commercial | Land, develop., constr. |
Comm. & industrial |
Consumer & other |
Total | |||||||||||||||||||
| Allowance for loan losses for loan that are not PCI loans: |
||||||||||||||||||||||||
| Three months ended June 30, 2014 |
||||||||||||||||||||||||
| Beginning of the period |
$ | 7,812 | $ | 7,338 | $ | 1,788 | $ | 956 | $ | 1,019 | $ | 18,913 | ||||||||||||
| Charge-offs |
(228 | ) | (299 | ) | (23 | ) | (67 | ) | (285 | ) | (902 | ) | ||||||||||||
| Recoveries |
(20 | ) | 61 | 25 | 3 | 43 | 112 | |||||||||||||||||
| Provision for loan losses |
255 | 444 | (1,156 | ) | 208 | 366 | 117 | |||||||||||||||||
|
|
|
|
|
|
|
|
|
|
|
|
|
|||||||||||||
| Balance at end of period |
$ | 7,819 | $ | 7,544 | $ | 634 | $ | 1,100 | $ | 1,143 | $ | 18,240 | ||||||||||||
|
|
|
|
|
|
|
|
|
|
|
|
|
|||||||||||||
| Three months ended June 30, 2013 |
||||||||||||||||||||||||
| Beginning of the period |
$ | 8,100 | $ | 7,093 | $ | 5,326 | $ | 1,224 | $ | 888 | $ | 22,631 | ||||||||||||
| Charge-offs |
(1,569 | ) | (650 | ) | (144 | ) | (7 | ) | (233 | ) | (2,603 | ) | ||||||||||||
| Recoveries |
153 | 13 | 106 | 11 | 27 | 310 | ||||||||||||||||||
| Provision for loan losses |
3,107 | (430 | ) | (1,217 | ) | (164 | ) | 166 | 1,462 | |||||||||||||||
|
|
|
|
|
|
|
|
|
|
|
|
|
|||||||||||||
| Balance at end of period |
$ | 9,791 | $ | 6,026 | $ | 4,071 | $ | 1,064 | $ | 848 | $ | 21,800 | ||||||||||||
|
|
|
|
|
|
|
|
|
|
|
|
|
|||||||||||||
| Real Estate Loans | ||||||||||||||||||||||||
| Residential | Commercial | Land, develop., constr. |
Comm. & industrial |
Consumer & other |
Total | |||||||||||||||||||
| Allowance for loan losses on PCI loans: |
||||||||||||||||||||||||
| Three months ended June 30, 2014 |
||||||||||||||||||||||||
| Beginning of the period |
$ | — | $ | 623 | $ | 89 | $ | 471 | $ | — | $ | 1,183 | ||||||||||||
| Charge-offs |
— | — | — | — | — | — | ||||||||||||||||||
| Recoveries |
— | — | — | — | — | — | ||||||||||||||||||
| Provision for loan losses |
— | (101 | ) | (12 | ) | (110 | ) | — | (223 | ) | ||||||||||||||
|
|
|
|
|
|
|
|
|
|
|
|
|
|||||||||||||
| Balance at end of period |
$ | — | $ | 522 | $ | 77 | $ | 361 | $ | — | $ | 960 | ||||||||||||
|
|
|
|
|
|
|
|
|
|
|
|
|
|||||||||||||
| Three months ended June 30, 2013 |
||||||||||||||||||||||||
| Beginning of the period |
$ | — | $ | 2,310 | $ | — | $ | 313 | $ | — | $ | 2,623 | ||||||||||||
| Charge-offs |
— | (515 | ) | — | — | — | (515 | ) | ||||||||||||||||
| Recoveries |
— | — | — | — | — | — | ||||||||||||||||||
| Provision for loan losses |
— | (218 | ) | 130 | — | — | (88 | ) | ||||||||||||||||
|
|
|
|
|
|
|
|
|
|
|
|
|
|||||||||||||
| Balance at end of period |
$ | — | $ | 1,577 | $ | 130 | $ | 313 | $ | — | $ | 2,020 | ||||||||||||
|
|
|
|
|
|
|
|
|
|
|
|
|
|||||||||||||
23
Table of Contents
CenterState Banks, Inc. and Subsidiaries
NOTES TO CONDENSED CONSOLIDATED FINANCIAL STATEMENTS (unaudited)
(in thousands of dollars, except per share data)
| Allowance for loan losses for loan that are not PCI loans: |
||||||||||||||||||||||||
| Six months ended June 30, 2014 |
||||||||||||||||||||||||
| Beginning of the period |
$ | 8,785 | $ | 6,441 | $ | 3,069 | $ | 510 | $ | 889 | $ | 19,694 | ||||||||||||
| Charge-offs |
(915 | ) | (315 | ) | (100 | ) | (267 | ) | (465 | ) | (2,062 | ) | ||||||||||||
| Recoveries |
435 | 375 | 48 | 4 | 93 | 955 | ||||||||||||||||||
| Provision for loan losses |
(486 | ) | 1,043 | (2,383 | ) | 853 | 626 | (347 | ) | |||||||||||||||
|
|
|
|
|
|
|
|
|
|
|
|
|
|||||||||||||
| Balance at end of period |
$ | 7,819 | $ | 7,544 | $ | 634 | $ | 1,100 | $ | 1,143 | $ | 18,240 | ||||||||||||
|
|
|
|
|
|
|
|
|
|
|
|
|
|||||||||||||
| Six months ended June 30, 2013 |
||||||||||||||||||||||||
| Beginning of the period |
$ | 6,831 | $ | 8,272 | $ | 6,211 | $ | 1,745 | $ | 974 | $ | 24,033 | ||||||||||||
| Charge-offs |
(2,181 | ) | (1,074 | ) | (183 | ) | (59 | ) | (337 | ) | (3,834 | ) | ||||||||||||
| Recoveries |
233 | 40 | 120 | 21 | 59 | 473 | ||||||||||||||||||
| Provision for loan losses |
4,908 | (1,212 | ) | (2,077 | ) | (643 | ) | 152 | 1,128 | |||||||||||||||
|
|
|
|
|
|
|
|
|
|
|
|
|
|||||||||||||
| Balance at end of period |
$ | 9,791 | $ | 6,026 | $ | 4,071 | $ | 1,064 | $ | 848 | $ | 21,800 | ||||||||||||
|
|
|
|
|
|
|
|
|
|
|
|
|
|||||||||||||
| Allowance for loan losses on PCI loans: |
||||||||||||||||||||||||
| Six months ended June 30, 2014 |
||||||||||||||||||||||||
| Beginning of the period |
$ | — | $ | 138 | $ | 89 | $ | 533 | $ | — | $ | 760 | ||||||||||||
| Charge-offs |
— | — | — | — | — | — | ||||||||||||||||||
| Recoveries |
— | — | — | — | — | — | ||||||||||||||||||
| Provision for loan losses |
— | 384 | (12 | ) | (172 | ) | — | 200 | ||||||||||||||||
|
|
|
|
|
|
|
|
|
|
|
|
|
|||||||||||||
| Balance at end of period |
$ | — | $ | 522 | $ | 77 | $ | 361 | $ | — | $ | 960 | ||||||||||||
|
|
|
|
|
|
|
|
|
|
|
|
|
|||||||||||||
| Six months ended June 30, 2013 |
||||||||||||||||||||||||
| Beginning of the period |
$ | — | $ | 2,335 | $ | — | $ | 314 | $ | — | $ | 2,649 | ||||||||||||
| Charge-offs |
— | (515 | ) | — | — | — | (515 | ) | ||||||||||||||||
| Recoveries |
— | — | — | — | — | — | ||||||||||||||||||
| Provision for loan losses |
— | (243 | ) | 130 | (1 | ) | — | (114 | ) | |||||||||||||||
|
|
|
|
|
|
|
|
|
|
|
|
|
|||||||||||||
| Balance at end of period |
$ | — | $ | 1,577 | $ | 130 | $ | 313 | $ | — | $ | 2,020 | ||||||||||||
|
|
|
|
|
|
|
|
|
|
|
|
|
The following tables present the balance in the allowance for loan losses and the recorded investment in loans by portfolio segment and based on impairment method as of June 30, 2014 and December 31, 2013. Accrued interest receivable and unearned loan fees and costs are not included in the recorded investment because they are not material.
| Real Estate Loans | ||||||||||||||||||||||||
| As of June 30, 2014 |
Residential | Commercial | Land, develop., constr. |
Comm. & industrial |
Consumer & other |
Total | ||||||||||||||||||
| Allowance for loan losses: |
||||||||||||||||||||||||
| Ending allowance balance attributable to loans: |
||||||||||||||||||||||||
| Individually evaluated for impairment |
$ | 559 | $ | 1,262 | $ | 6 | $ | 10 | $ | 20 | $ | 1,857 | ||||||||||||
| Collectively evaluated for impairment |
7,260 | 6,282 | 628 | 1,090 | 1,123 | 16,383 | ||||||||||||||||||
| Purchased credit impaired |
0 | 522 | 77 | 361 | 0 | 960 | ||||||||||||||||||
|
|
|
|
|
|
|
|
|
|
|
|
|
|||||||||||||
| Total ending allowance balance |
$ | 7,819 | $ | 8,066 | $ | 711 | $ | 1,461 | $ | 1,143 | $ | 19,200 | ||||||||||||
|
|
|
|
|
|
|
|
|
|
|
|
|
|||||||||||||
| Loans: |
||||||||||||||||||||||||
| Loans individually evaluated for impairment |
$ | 9,725 | $ | 13,028 | $ | 2,068 | $ | 2,127 | $ | 315 | $ | 27,263 | ||||||||||||
| Loans collectively evaluated for impairment |
553,568 | 1,078,632 | 76,376 | 249,614 | 55,876 | 2,014,066 | ||||||||||||||||||
| Purchased credit impaired loans |
119,005 | 195,157 | 27,885 | 10,759 | 1,064 | 353,870 | ||||||||||||||||||
|
|
|
|
|
|
|
|
|
|
|
|
|
|||||||||||||
| Total ending loan balances |
$ | 682,298 | $ | 1,286,817 | $ | 106,329 | $ | 262,500 | $ | 57,255 | $ | 2,395,199 | ||||||||||||
|
|
|
|
|
|
|
|
|
|
|
|
|
|||||||||||||
24
Table of Contents
CenterState Banks, Inc. and Subsidiaries
NOTES TO CONDENSED CONSOLIDATED FINANCIAL STATEMENTS (unaudited)
(in thousands of dollars, except per share data)
| Real Estate Loans | ||||||||||||||||||||||||
| As of December 31, 2013 |
Residential | Commercial | Land, develop., constr. |
Comm. & industrial |
Consumer & other |
Total | ||||||||||||||||||
| Allowance for loan losses: |
||||||||||||||||||||||||
| Ending allowance balance attributable to loans: |
||||||||||||||||||||||||
| Individually evaluated for impairment |
$ | 395 | $ | 1,377 | $ | 16 | $ | 2 | $ | 21 | $ | 1,811 | ||||||||||||
| Collectively evaluated for impairment |
8,390 | 5,064 | 3,053 | 508 | 868 | 17,883 | ||||||||||||||||||
| Purchased credit impaired |
— | 138 | 89 | 533 | — | 760 | ||||||||||||||||||
|
|
|
|
|
|
|
|
|
|
|
|
|
|||||||||||||
| Total ending allowance balance |
$ | 8,785 | $ | 6,579 | $ | 3,158 | $ | 1,043 | $ | 889 | $ | 20,454 | ||||||||||||
|
|
|
|
|
|
|
|
|
|
|
|
|
|||||||||||||
| Loans: |
||||||||||||||||||||||||
| Loans individually evaluated for impairment |
$ | 8,610 | $ | 12,564 | $ | 1,307 | $ | 1,297 | $ | 332 | $ | 24,110 | ||||||||||||
| Loans collectively evaluated for impairment |
449,721 | 516,146 | 61,196 | 141,966 | 49,215 | 1,218,244 | ||||||||||||||||||
| Purchased credit impaired loans |
120,030 | 100,012 | 6,381 | 3,850 | 1,148 | 231,421 | ||||||||||||||||||
|
|
|
|
|
|
|
|
|
|
|
|
|
|||||||||||||
| Total ending loan balance |
$ | 578,361 | $ | 628,722 | $ | 68,884 | $ | 147,113 | $ | 50,695 | $ | 1,473,775 | ||||||||||||
|
|
|
|
|
|
|
|
|
|
|
|
|
|||||||||||||
Loans collectively evaluated for impairment reported at June 30, 2014 include loans acquired from FSB on June 1, 2014 and from Gulfstream on January 17, 2014. The acquired loans were recorded at estimated fair value at acquisition; therefore, no allowance for loan losses was recorded for these loans at June 30, 2014.
The table below summarizes impaired loan data for the periods presented.
| June 30, 2014 | Dec 31, 2014 | |||||||
| Performing TDRs (these are not included in NPLs) |
$ | 12,659 | $ | 10,763 | ||||
| Non performing TDRs (these are included in NPLs) |
2,281 | 4,684 | ||||||
|
|
|
|
|
|||||
| Total TDRs (these are included in impaired loans) |
$ | 14,940 | $ | 15,447 | ||||
| Impaired loans that are not TDRs |
12,323 | 8,663 | ||||||
|
|
|
|
|
|||||
| Total impaired loans |
$ | 27,263 | $ | 24,110 | ||||
|
|
|
|
|
|||||
In certain situations it has become more common to restructure or modify the terms of certain loans under certain conditions (i.e. troubled debt restructure or “TDRs”). In those circumstances it may be beneficial to restructure the terms of a loan and work with the borrower for the benefit of both parties, versus forcing the property into foreclosure and having to dispose of it in an unfavorable real estate market. When the terms of a loan have been modified, usually the monthly payment and/or interest rate is reduced for generally twelve to twenty-four months. Material principal amounts on any loan modifications have not been forgiven to date.
25
Table of Contents
CenterState Banks, Inc. and Subsidiaries
NOTES TO CONDENSED CONSOLIDATED FINANCIAL STATEMENTS (unaudited)
(in thousands of dollars, except per share data)
TDRs as of June 30, 2014 and December 31, 2013 quantified by loan type classified separately as accrual (performing loans) and non-accrual (non performing loans) are presented in the tables below.
| As of June 30, 2014 |
Accruing | Non Accrual | Total | |||||||||
| Real estate loans: |
||||||||||||
| Residential |
$ | 7,932 | $ | 806 | $ | 8,738 | ||||||
| Commercial |
3,247 | 1,292 | 4,539 | |||||||||
| Land, development, construction |
569 | 43 | 612 | |||||||||
|
|
|
|
|
|
|
|||||||
| Total real estate loans |
11,748 | 2,141 | 13,889 | |||||||||
| Commercial |
699 | 37 | 736 | |||||||||
| Consumer and other |
212 | 103 | 315 | |||||||||
|
|
|
|
|
|
|
|||||||
| Total TDRs |
$ | 12,659 | $ | 2,281 | $ | 14,940 | ||||||
|
|
|
|
|
|
|
|||||||
| As of December 31, 2013 |
Accruing | Non-Accrual | Total | |||||||||
| Real estate loans: |
||||||||||||
| Residential |
$ | 7,221 | $ | 1,389 | $ | 8,610 | ||||||
| Commercial |
2,169 | 3,077 | 5,246 | |||||||||
| Land, development, construction |
608 | 47 | 655 | |||||||||
|
|
|
|
|
|
|
|||||||
| Total real estate loans |
9,998 | 4,513 | 14,511 | |||||||||
| Commercial |
555 | 49 | 604 | |||||||||
| Consumer and other |
210 | 122 | 332 | |||||||||
|
|
|
|
|
|
|
|||||||
| Total TDRs |
$ | 10,763 | $ | 4,684 | $ | 15,447 | ||||||
|
|
|
|
|
|
|
|||||||
Our policy is to return non accrual TDR loans to accrual status when all the principal and interest amounts contractually due, pursuant to its modified terms, are brought current and future payments are reasonably assured. Our policy also considers the payment history of the borrower, but is not dependent upon a specific number of payments. The Company recorded a provision for loan loss expense of $339 and $398 and partial charge offs of $40 and $96 on the TDR loans described above during the three and six month periods ending June 30, 2014.
Loans are modified to minimize loan losses when we believe the modification will improve the borrower’s financial condition and ability to repay the loan. We typically do not forgive principal. We generally either reduce interest rates or decrease monthly payments for a temporary period of time and those reductions of cash flows are capitalized into the loan balance. We may also extend maturities, convert balloon loans to longer term amortizing loans, or vice versa, or change interest rates between variable and fixed rate. Each borrower and situation is unique and we try to accommodate the borrower and minimize the Company’s potential losses. Approximately 85% of our TDRs are current pursuant to their modified terms, and $2,281, or approximately 15% of our total TDRs are not performing pursuant to their modified terms. There does not appear to be any significant difference in success rates with one type of concession versus another.
26
Table of Contents
CenterState Banks, Inc. and Subsidiaries
NOTES TO CONDENSED CONSOLIDATED FINANCIAL STATEMENTS (unaudited)
(in thousands of dollars, except per share data)
The following table presents loans by class modified and for which there was a payment default within twelve months following the modification during the period ending June 30, 2014 and December 31, 2013.
| Period ending June 30, 2014 |
Year ending December 31, 2013 |
|||||||||||||||
| Number of loans |
Recorded investment |
Number of loans |
Recorded investment |
|||||||||||||
| Residential |
— | $ | — | 3 | $ | 553 | ||||||||||
| Commercial real estate |
1 | 196 | 6 | 2,244 | ||||||||||||
| Land, development, construction |
— | — | — | — | ||||||||||||
| Commercial and Industrial |
— | — | 2 | 34 | ||||||||||||
| Consumer and other |
— | — | 1 | 17 | ||||||||||||
|
|
|
|
|
|
|
|
|
|||||||||
| Total |
1 | $ | 196 | 12 | $ | 2,848 | ||||||||||
|
|
|
|
|
|
|
|
|
|||||||||
The Company recorded a provision for loan loss expense of $18 and $30 and partial charge offs of $-0- and $4 on TDR loans that subsequently defaulted as described above during the three and six month periods ending June 30, 2014.
The following tables present loans individually evaluated for impairment by class of loans as of June 30, 2014 and December 31, 2013, excluding purchased credit impaired loans accounted for pursuant to ASC Topic 310-30. The recorded investment is less than the unpaid principal balance due to partial charge-offs.
| As of June 30, 2014 |
Unpaid principal balance |
Recorded investment |
Allowance for loan losses allocated |
|||||||||
| With no related allowance recorded: |
||||||||||||
| Residential real estate |
$ | 7,253 | $ | 6,992 | $ | — | ||||||
| Commercial real estate |
6,920 | 6,812 | — | |||||||||
| Land, development, construction |
2,550 | 1,938 | — | |||||||||
| Commercial and industrial |
2,055 | 1,922 | — | |||||||||
| Consumer, other |
— | — | — | |||||||||
| With an allowance recorded: |
||||||||||||
| Residential real estate |
2,885 | 2,733 | 559 | |||||||||
| Commercial real estate |
6,459 | 6,216 | 1,262 | |||||||||
| Land, development, construction |
138 | 130 | 6 | |||||||||
| Commercial and industrial |
251 | 205 | 10 | |||||||||
| Consumer, other |
330 | 315 | 20 | |||||||||
|
|
|
|
|
|
|
|||||||
| Total |
$ | 28,841 | $ | 27,263 | $ | 1,857 | ||||||
|
|
|
|
|
|
|
|||||||
27
Table of Contents
CenterState Banks, Inc. and Subsidiaries
NOTES TO CONDENSED CONSOLIDATED FINANCIAL STATEMENTS (unaudited)
(in thousands of dollars, except per share data)
| As of December 31, 2013 |
Unpaid principal balance |
Recorded investment |
Allowance for loan losses allocated |
|||||||||
| With no related allowance recorded: |
||||||||||||
| Residential real estate |
$ | 5,052 | $ | 4,803 | $ | — | ||||||
| Commercial real estate |
9,330 | 7,439 | — | |||||||||
| Land, development, construction |
1,377 | 1,168 | — | |||||||||
| Commercial and industrial |
1,330 | 1,241 | — | |||||||||
| Consumer, other |
5 | 5 | — | |||||||||
| With an allowance recorded: |
||||||||||||
| Residential real estate |
3,942 | 3,807 | 395 | |||||||||
| Commercial real estate |
5,257 | 5,125 | 1,377 | |||||||||
| Land, development, construction |
147 | 139 | 16 | |||||||||
| Commercial and industrial |
102 | 56 | 2 | |||||||||
| Consumer, other |
340 | 327 | 21 | |||||||||
|
|
|
|
|
|
|
|||||||
| Total |
$ | 26,882 | $ | 24,110 | $ | 1,811 | ||||||
|
|
|
|
|
|
|
|||||||
| Three month period ending June, 30, 2014 |
Average of impaired loans |
Interest income recognized during impairment |
Cash basis interest income recognized |
|||||||||
| Real estate loans: |
||||||||||||
| Residential |
$ | 9,635 | $ | 87 | $ | — | ||||||
| Commercial |
12,858 | 43 | — | |||||||||
| Land, development, construction |
1,764 | 10 | — | |||||||||
|
|
|
|
|
|
|
|||||||
| Total real estate loans |
24,257 | 140 | — | |||||||||
| Commercial and industrial |
2,332 | 18 | — | |||||||||
| Consumer and other loans |
320 | 3 | — | |||||||||
|
|
|
|
|
|
|
|||||||
| Total |
$ | 26,909 | $ | 161 | $ | — | ||||||
|
|
|
|
|
|
|
|||||||
| Six month period ending June, 30, 2014 |
Average of impaired loans |
Interest income recognized during impairment |
Cash basis interest income recognized |
|||||||||
| Real estate loans: |
||||||||||||
| Residential |
$ | 9,358 | $ | 164 | $ | — | ||||||
| Commercial |
12,742 | 71 | — | |||||||||
| Land, development, construction |
1,575 | 19 | — | |||||||||
|
|
|
|
|
|
|
|||||||
| Total real estate loans |
23,675 | 254 | — | |||||||||
| Commercial and industrial |
2,126 | 39 | — | |||||||||
| Consumer and other loans |
324 | 6 | — | |||||||||
|
|
|
|
|
|
|
|||||||
| Total |
$ | 26,125 | $ | 299 | $ | — | ||||||
|
|
|
|
|
|
|
|||||||
28
Table of Contents
CenterState Banks, Inc. and Subsidiaries
NOTES TO CONDENSED CONSOLIDATED FINANCIAL STATEMENTS (unaudited)
(in thousands of dollars, except per share data)
| Three month period ending June, 30, 2013 |
Average of impaired loans |
Interest income recognized during impairment |
Cash basis interest income recognized |
|||||||||
| Real estate loans: |
||||||||||||
| Residential |
$ | 8,777 | $ | 70 | $ | — | ||||||
| Commercial |
27,192 | 288 | — | |||||||||
| Land, development, construction |
1,407 | 6 | — | |||||||||
|
|
|
|
|
|
|
|||||||
| Total real estate loans |
37,376 | 364 | — | |||||||||
| Commercial and industrial |
1,656 | 8 | — | |||||||||
| Consumer and other loans |
366 | 3 | — | |||||||||
|
|
|
|
|
|
|
|||||||
| Total |
$ | 39,398 | $ | 375 | $ | — | ||||||
|
|
|
|
|
|
|
|||||||
| Six month period ending June, 30, 2013 |
Average of impaired loans |
Interest income recognized during impairment |
Cash basis interest income recognized |
|||||||||
| Real estate loans: |
||||||||||||
| Residential |
$ | 9,108 | $ | 143 | $ | — | ||||||
| Commercial |
28,730 | 545 | — | |||||||||
| Land, development, construction |
1,417 | 8 | — | |||||||||
|
|
|
|
|
|
|
|||||||
| Total real estate loans |
39,255 | 696 | — | |||||||||
| Commercial and industrial |
2,124 | 16 | — | |||||||||
| Consumer and other loans |
378 | 6 | — | |||||||||
|
|
|
|
|
|
|
|||||||
| Total |
$ | 41,757 | $ | 718 | $ | — | ||||||
|
|
|
|
|
|
|
|||||||
Nonperforming loans include both smaller balance homogeneous loans that are collectively evaluated for impairment and individually classified impaired loans, excluding purchased credit impaired loans accounted for pursuant to ASC Topic 310-30.
| Nonperforming loans were as follows: |
June 30, 2014 | Dec 31, 2013 | ||||||
| Non accrual loans |
$ | 29,667 | $ | 27,077 | ||||
| Loans past due over 90 days and still accruing interest |
— | — | ||||||
|
|
|
|
|
|||||
| Total non performing loans |
$ | 29,667 | $ | 27,077 | ||||
|
|
|
|
|
|||||
29
Table of Contents
CenterState Banks, Inc. and Subsidiaries
NOTES TO CONDENSED CONSOLIDATED FINANCIAL STATEMENTS (unaudited)
(in thousands of dollars, except per share data)
The following table presents the recorded investment in nonaccrual loans and loans past due over 90 days still on accrual by class of loans as of June 30, 2014 and December 31, 2013, excluding purchased credit impaired loans:
| As of June 30, 2014 |
Nonaccrual | Loans past due over 90 days still accruing |
||||||
| Residential real estate |
$ | 11,292 | $ | — | ||||
| Commercial real estate |
13,991 | — | ||||||
| Land, development, construction |
1,900 | — | ||||||
| Commercial |
2,216 | — | ||||||
| Consumer, other |
268 | — | ||||||
|
|
|
|
|
|||||
| Total |
$ | 29,667 | $ | — | ||||
|
|
|
|
|
|||||
| As of December 31, 2013 |
Nonaccrual | Loans past due over 90 days still accruing |
||||||
| Residential real estate |
$ | 10,162 | $ | — | ||||
| Commercial real estate |
13,925 | — | ||||||
| Land, development, construction |
1,099 | — | ||||||
| Commercial |
1,582 | — | ||||||
| Consumer, other |
309 | — | ||||||
|
|
|
|
|
|||||
| Total |
$ | 27,077 | $ | — | ||||
|
|
|
|
|
|||||
The following table presents the aging of the recorded investment in past due loans as of June 30, 2014 and December 31, 2013, excluding purchased credit impaired loans:
| Accruing Loans | ||||||||||||||||||||||||||||
| As of June 30, 2014 |
Total | 30 - 59 days past due |
60 - 89 days past due |
Greater than 90 days past due |
Total Past Due |
Loans Not Past Due |
Nonaccrual Loans |
|||||||||||||||||||||
| Residential real estate |
$ | 563,293 | $ | 2,402 | $ | 1,892 | $ | — | $ | 4,294 | $ | 547,707 | $ | 11,292 | ||||||||||||||
| Commercial real estate |
1,091,660 | 3,001 | 473 | — | 3,474 | 1,074,195 | 13,991 | |||||||||||||||||||||
| Land/dev/construction |
78,444 | 1,866 | 254 | — | 2,120 | 74,424 | 1,900 | |||||||||||||||||||||
| Commercial |
251,741 | 1,909 | 1,048 | — | 2,957 | 246,568 | 2,216 | |||||||||||||||||||||
| Consumer |
56,191 | 225 | 80 | — | 305 | 55,618 | 268 | |||||||||||||||||||||
|
|
|
|
|
|
|
|
|
|
|
|
|
|
|
|||||||||||||||
| $ | 2,041,329 | $ | 9,403 | $ | 3,747 | $ | — | $ | 13,150 | $ | 1,998,512 | $ | 29,667 | |||||||||||||||
|
|
|
|
|
|
|
|
|
|
|
|
|
|
|
|||||||||||||||
| Accruing Loans | ||||||||||||||||||||||||||||
| As of December 31, 2013 |
Total | 30 - 59 days past due |
60 - 89 days past due |
Greater than 90 days past due |
Total Past Due |
Loans Not Past Due |
Nonaccrual Loans |
|||||||||||||||||||||
| Residential real estate |
$ | 458,331 | $ | 2,801 | $ | 1,942 | $ | — | $ | 4,743 | $ | 443,426 | $ | 10,162 | ||||||||||||||
| Commercial real estate |
528,710 | 2,420 | 1,941 | — | 4,361 | 510,424 | 13,925 | |||||||||||||||||||||
| Land/dev/construction |
62,503 | 136 | 241 | — | 377 | 61,027 | 1,099 | |||||||||||||||||||||
| Commercial |
143,263 | 491 | 1 | — | 492 | 141,189 | 1,582 | |||||||||||||||||||||
| Consumer |
49,547 | 295 | 240 | — | 535 | 48,703 | 309 | |||||||||||||||||||||
|
|
|
|
|
|
|
|
|
|
|
|
|
|
|
|||||||||||||||
| $ | 1,242,354 | $ | 6,143 | $ | 4,365 | $ | — | $ | 10,508 | $ | 1,204,769 | $ | 27,077 | |||||||||||||||
|
|
|
|
|
|
|
|
|
|
|
|
|
|
|
|||||||||||||||
30
Table of Contents
CenterState Banks, Inc. and Subsidiaries
NOTES TO CONDENSED CONSOLIDATED FINANCIAL STATEMENTS (unaudited)
(in thousands of dollars, except per share data)
Credit Quality Indicators:
The Company categorizes loans into risk categories based on relevant information about the ability of borrowers to service their debt such as: current financial information, historical payment experience, credit documentation, public information, and current economic trends, among other factors. The Company analyzes loans individually by classifying the loans as to credit risk. This analysis includes loans with an outstanding balance greater than $500 that are non-homogeneous loans, such as commercial, commercial real estate, land, land development and construction loans. This analysis is performed on at least an annual basis. The Company uses the following definitions for risk ratings:
Special Mention: Loans classified as special mention have a potential weakness that deserves management’s close attention. If left uncorrected, these potential weaknesses may result in deterioration of the repayment prospects for the loan or of the institution’s credit position at some future date.
Substandard: Loans classified as substandard are inadequately protected by the current net worth and paying capacity of the obligor or of the collateral pledged, if any. Loans so classified have a well-defined weakness or weaknesses that jeopardize the liquidation of the debt. They are characterized by the distinct possibility that the institution will sustain some loss if the deficiencies are not corrected.
Doubtful: Loans classified as doubtful have all the weaknesses inherent in those classified as substandard, with the added characteristic that the weaknesses make collection or liquidation in full, on the basis of currently existing facts, conditions, and values, highly questionable and improbable.
Loans not meeting the criteria above that are analyzed individually as part of the above described process are considered to be pass rated loans. As of June 30, 2014 and December 31, 2013, and based on the most recent analysis performed, the risk category of loans by class of loans, excluding purchased credit impaired loans accounted for pursuant to ASC Topic 310-30:
| As of June 30, 2014 | ||||||||||||||||
| Loan Category |
Pass | Special Mention |
Substandard | Doubtful | ||||||||||||
| Residential real estate |
$ | 534,622 | $ | 5,313 | $ | 23,358 | $ | — | ||||||||
| Commercial real estate |
1,012,363 | 39,951 | 39,346 | — | ||||||||||||
| Land/dev/construction |
66,080 | 8,637 | 3,727 | — | ||||||||||||
| Commercial |
243,632 | 2,586 | 5,523 | — | ||||||||||||
| Consumer |
55,491 | 274 | 426 | — | ||||||||||||
|
|
|
|
|
|
|
|
|
|||||||||
| Total |
$ | 1,912,188 | $ | 56,761 | $ | 72,380 | $ | — | ||||||||
|
|
|
|
|
|
|
|
|
|||||||||
31
Table of Contents
CenterState Banks, Inc. and Subsidiaries
NOTES TO CONDENSED CONSOLIDATED FINANCIAL STATEMENTS (unaudited)
(in thousands of dollars, except per share data)
| As of December 31, 2013 | ||||||||||||||||
| Loan Category |
Pass | Special Mention |
Substandard | Doubtful | ||||||||||||
| Residential real estate |
$ | 428,671 | $ | 6,438 | $ | 23,222 | $ | — | ||||||||
| Commercial real estate |
448,762 | 46,427 | 33,521 | — | ||||||||||||
| Land/dev/construction |
50,164 | 9,566 | 2,773 | — | ||||||||||||
| Commercial |
134,901 | 4,490 | 3,872 | — | ||||||||||||
| Consumer |
49,448 | 526 | 573 | — | ||||||||||||
|
|
|
|
|
|
|
|
|
|||||||||
| Total |
$ | 1,110,946 | $ | 67,447 | $ | 63,961 | $ | — | ||||||||
|
|
|
|
|
|
|
|
|
|||||||||
The Company considers the performance of the loan portfolio and its impact on the allowance for loan losses. For residential and consumer loan classes, the Company also evaluates credit quality based on the aging status of the loan, which was previously presented, and by payment activity. The following table presents the recorded investment in residential and consumer loans, excluding purchased credit impaired loans, based on payment activity as of June 30, 2014 and December 31, 2013:
| As of June 30, 2014 |
Residential | Consumer | ||||||
| Performing |
$ | 552,001 | $ | 55,923 | ||||
| Nonperforming |
11,292 | 268 | ||||||
|
|
|
|
|
|||||
| Total |
$ | 563,293 | $ | 56,191 | ||||
|
|
|
|
|
|||||
| As of December 31, 2013 |
Residential | Consumer | ||||||
| Performing |
$ | 448,169 | $ | 49,238 | ||||
| Nonperforming |
10,162 | 309 | ||||||
|
|
|
|
|
|||||
| Total |
$ | 458,331 | $ | 49,547 | ||||
|
|
|
|
|
|||||
Purchased Credit Impaired (“PCI”) loans:
Income is recognized on PCI loans pursuant to ASC Topic 310-30. A portion of the fair value discount has been ascribed as an accretable yield that is accreted into interest income over the estimated remaining life of the loans. The remaining non-accretable difference represents cash flows not expected to be collected.
The table below summarizes the total contractually required principal and interest cash payments, management’s estimate of expected total cash payments and carrying value of the loans as of June 30, 2014 and December 31, 2013. Contractually required principal and interest payments have been adjusted for estimated prepayments.
| Jun 30, 2014 | Dec 31, 2013 | |||||||
| Contractually required principal and interest |
$ | 566,948 | $ | 389,537 | ||||
| Non-accretable difference |
(79,985 | ) | (55,304 | ) | ||||
|
|
|
|
|
|||||
| Cash flows expected to be collected |
486,963 | 334,233 | ||||||
| Accretable yield |
(133,093 | ) | (102,812 | ) | ||||
|
|
|
|
|
|||||
| Carrying value of acquired loans |
$ | 353,870 | $ | 231,421 | ||||
| Allowance for loan losses |
(960 | ) | (760 | ) | ||||
|
|
|
|
|
|||||
| Carrying value less allowance for loan losses |
$ | 352,910 | $ | 230,661 | ||||
|
|
|
|
|
|||||
32
Table of Contents
CenterState Banks, Inc. and Subsidiaries
NOTES TO CONDENSED CONSOLIDATED FINANCIAL STATEMENTS (unaudited)
(in thousands of dollars, except per share data)
We adjusted our estimates of future expected losses, cash flows and renewal assumptions during the current quarter. These adjustments resulted in an increase in expected cash flows and accretable yield, and a decrease in the non-accretable difference. We reclassified approximately $7,946 and $15,240 from non-accretable difference to accretable yield during the three and six month periods ending June 30, 2014, respectively, to reflect our adjusted estimates of future expected cash flows. The table below summarizes the changes in total contractually required principal and interest cash payments, management’s estimate of expected total cash payments and carrying value of the loans during the three and six month periods ending June 30, 2014 and 2013.
| Activity during the three month period ending June 30, 2014 |
Mar 31, 2014 | Effect of acquisitions |
income accretion |
all other adjustments |
June 30, 2014 | |||||||||||||||
| Contractually required principal and interest |
$ | 414,385 | $ | 180,960 | $ | — | $ | (28,397 | ) | $ | 566,948 | |||||||||
| Non-accretable difference |
(56,062 | ) | (33,527 | ) | — | 9,604 | (79,985 | ) | ||||||||||||
|
|
|
|
|
|
|
|
|
|
|
|||||||||||
| Cash flows expected to be collected |
358,323 | 147,433 | — | (18,793 | ) | 486,963 | ||||||||||||||
| Accretable yield |
(107,523 | ) | (25,749 | ) | 8,231 | (8,052 | ) | (133,093 | ) | |||||||||||
|
|
|
|
|
|
|
|
|
|
|
|||||||||||
| Carry value of acquired loans |
$ | 250,800 | 121,684 | 8,231 | $ | (26,845 | ) | $ | 353,870 | |||||||||||
|
|
|
|
|
|
|
|
|
|
|
|||||||||||
| Activity during the six month period ending June 30, 2014 |
Dec 31, 2013 | Effect of acquisitions |
income accretion |
all other adjustments |
June 30, 2014 | |||||||||||||||
| Contractually required principal and interest |
$ | 389,537 | $ | 229,249 | $ | — | $ | (51,838 | ) | $ | 566,948 | |||||||||
| Non-accretable difference |
(55,304 | ) | (45,293 | ) | — | 20,612 | (79,985 | ) | ||||||||||||
|
|
|
|
|
|
|
|
|
|
|
|||||||||||
| Cash flows expected to be collected |
334,233 | 183,956 | — | (31,226 | ) | 486,963 | ||||||||||||||
| Accretable yield |
(102,812 | ) | (32,204 | ) | 16,462 | (14,539 | ) | (133,093 | ) | |||||||||||
|
|
|
|
|
|
|
|
|
|
|
|||||||||||
| Carry value of acquired loans |
$ | 231,421 | 151,752 | 16,462 | (45,765 | ) | $ | 353,870 | ||||||||||||
|
|
|
|
|
|
|
|
|
|
|
|||||||||||
| Activity during the three month period ending June 30, 2013 |
Mar 31, 2013 | income accretion |
all other adjustments |
June 30, 2013 | ||||||||||||
| Contractually required principal and interest |
$ | 486,531 | — | $ | (37,385 | ) | $ | 449,146 | ||||||||
| Non-accretable difference |
(110,243 | ) | — | 20,183 | (90,060 | ) | ||||||||||
|
|
|
|
|
|
|
|
|
|||||||||
| Cash flows expected to be collected |
376,288 | — | (17,202 | ) | 359,086 | |||||||||||
| Accretable yield |
(95,499 | ) | 8,020 | (11,928 | ) | (99,407 | ) | |||||||||
|
|
|
|
|
|
|
|
|
|||||||||
| Carry value of acquired loans |
$ | 280,789 | $ | 8,020 | $ | (29,130 | ) | $ | 259,679 | |||||||
|
|
|
|
|
|
|
|
|
|||||||||
| Activity during the six month period ending June 30, 2013 |
Dec 31, 2012 | income accretion |
all other adjustments |
June 30, 2013 | ||||||||||||
| Contractually required principal and interest |
$ | 534,989 | — | $ | (85,843 | ) | $ | 449,146 | ||||||||
| Non-accretable difference |
(142,855 | ) | — | 52,795 | (90,060 | ) | ||||||||||
|
|
|
|
|
|
|
|
|
|||||||||
| Cash flows expected to be collected |
392,134 | — | (33,048 | ) | 359,086 | |||||||||||
| Accretable yield |
(93,107 | ) | 15,847 | (22,147 | ) | (99,407 | ) | |||||||||
|
|
|
|
|
|
|
|
|
|||||||||
| Carry value of acquired loans |
$ | 299,027 | $ | 15,847 | $ | (55,195 | ) | $ | 259,679 | |||||||
|
|
|
|
|
|
|
|
|
|||||||||
33
Table of Contents
CenterState Banks, Inc. and Subsidiaries
NOTES TO CONDENSED CONSOLIDATED FINANCIAL STATEMENTS (unaudited)
(in thousands of dollars, except per share data)
NOTE 7: FDIC indemnification asset
The FDIC indemnification asset represents the estimated amounts due from the FDIC pursuant to the Loss Share Agreements related to the acquisition of the three failed banks acquired in 2010, the acquisition of two failed banks in 2012 and the assumption of Loss Share Agreements of two failed banks assumed by the Company pursuant to its acquisition of First Southern Bank in June 2014. The activity in the FDIC loss share indemnification asset is as follows (certain items related to true-up payment liabilities per the FDIC agreements, which had previously been netted with the FDIC indemnification asset, have been reclassified as a separate liability):
| Six month period ended June 30, 2014 |
Twelve month period ended Dec 31, 2013 |
|||||||
| Beginning of the year |
$ | 73,877 | $ | 119,691 | ||||
| Effect of acquisition |
2,636 | — | ||||||
| Amortization, net |
(10,161 | ) | (13,765 | ) | ||||
| Indemnification revenue |
1,529 | 6,055 | ||||||
| Indemnification of foreclosure expense |
780 | 4,413 | ||||||
| Proceeds from FDIC |
(7,510 | ) | (42,004 | ) | ||||
| Impairment (recovery) of loan pool |
160 | (513 | ) | |||||
|
|
|
|
|
|||||
| Period end balance |
$ | 61,311 | $ | 73,877 | ||||
|
|
|
|
|
|||||
The FDIC agreements allow for the recovery of some payments made for loss share reimbursements under certain conditions based on the actual performance of the portfolios acquired. This true-up payment is estimated and accrued for as part of the overall FDIC indemnification asset analysis and is reflected as a separate liability. The accrual for this liability is reflected as additional amortization income or expense in noninterest income. The activity in the true-up payment liability is as follows:
| Six month period ended June 30, 2014 |
Twelve month period ended Dec 31, 2013 |
|||||||
| Beginning of the year |
$ | 444 | $ | 402 | ||||
| Effect of acquisition |
682 | — | ||||||
| True-up liability accrual |
30 | 42 | ||||||
|
|
|
|
|
|||||
| Period end balance |
$ | 1,156 | $ | 444 | ||||
|
|
|
|
|
|||||
Impairment of loan pools
When a loan pool (with loss share) is impaired, the impairment expense is included in provision for loan losses, and the percentage of that loss to be reimbursed by the FDIC is recognized as income from FDIC reimbursement, and included in this line item. During the six month period ended June 30, 2014, the estimated amount of impairment increased, which resulted in an additional $160 of indemnification income recognition.
Indemnification revenue
Indemnification revenue represents the percentage of the cost incurred that is reimbursable by the FDIC pursuant to the related Loss Share Agreement for expenses related to the repossession process and losses incurred on the sale of OREO, or writedown of OREO values to current fair value.
34
Table of Contents
CenterState Banks, Inc. and Subsidiaries
NOTES TO CONDENSED CONSOLIDATED FINANCIAL STATEMENTS (unaudited)
(in thousands of dollars, except per share data)
Amortization, net
On the date of an FDIC acquisition, the Company estimates the amount and the timing of expected future losses that will be covered by the FDIC loss sharing agreements. The FDIC indemnification asset is initially recorded as the discounted value of the reimbursement of losses from the FDIC. Discount accretion is recognized over the estimated period of losses. The Company also updates its estimate of future losses and the timing of the losses each quarter. To the extent management estimates that future losses are less than initial estimate of future losses, management adjusts its estimates of future expected reimbursements and any decrease in the expected future reimbursements is amortized over the shorter of the loss share period or the life of the related loan by amortization in this line item. Based upon the most recent estimate of future losses, the Company expects less reimbursements from the FDIC and is amortizing the estimated reduction as described in the previous sentence.
Indemnification of foreclosure expense
Indemnification of foreclosure expense represents the percentage of foreclosure related expenses incurred and reimbursable from the FDIC. Foreclosure expense is included in non interest expense. The amount of the reimbursable portion of the expense reduces foreclosure expense included in non interest expense.
NOTE 8: Business Combinations
Acquisition of Gulfstream Bancshares, Inc.
On January 17, 2014, the Company completed its previously announced acquisition of Gulfstream Bancshares, Inc. (“Gulfstream”) as set forth in the Agreement and Plan of Merger (“Agreement”) whereby Gulfstream merged with and into the Company. Pursuant to and simultaneously with the merger of Gulfstream with and into the Company, Gulfstream’s wholly owned subsidiary bank, Gulfstream Business Bank (“GSB”), merged with and into the Company’s subsidiary bank, CenterState Bank of Florida, N.A.
The Company’s primary reasons for the transaction were to further solidify its market share in the southeast Florida market and expand its customer base to enhance deposit fee income and leverage operating cost through economies of scale. The acquisition increased the Company’s total assets and total deposits by approximately 23% and 23%, respectively, as compared with the balances at December 31, 2013, and is expected to positively affect the Company’s operating results to the extent the Company earns more from interest earning assets than it pays in interest on its interest bearing liabilities.
The acquisition was accounted for under the acquisition method of accounting in accordance with ASC Topic 805, Business Combinations. The Company recognized goodwill on this acquisition of $31,516, after consideration of a measurement period adjustment discussed below, which is nondeductible for tax purposes as this acquisition is a nontaxable transaction. The goodwill is calculated based on the fair values of the assets acquired and liabilities assumed as of the acquisition date. Fair value estimates are based on the information available, and are subject to change for up to one year after the closing date of the acquisition as additional information relative to closing date fair values becomes available. Fair values are preliminary estimates due to pending appraisals on loans and other real estate owned.
35
Table of Contents
CenterState Banks, Inc. and Subsidiaries
NOTES TO CONDENSED CONSOLIDATED FINANCIAL STATEMENTS (unaudited)
(in thousands of dollars, except per share data)
The Company acquired 100% of the outstanding common stock of Gulfstream. The purchase price consisted of both cash and stock. Each share of Gulfstream common stock was exchanged for $14.65 cash and 3.012 shares of the Company’s common stock. Based on the closing price of the Company’s common stock on January 16, 2014, the resulting purchase price was $82,040. The table below summarizes the purchase price calculation.
| Number of shares of Gulfstream common stock outstanding at January 16, 2014 |
1,569,364 | |||
| Gulfstream preferred shares that convert to Gulfstream common shares upon a change in control |
155,629 | |||
|
|
|
|||
| Total Gulfstream common shares including conversion of preferred shares |
1,724,993 | |||
| Per share exchange ratio |
3.012 | |||
|
|
|
|||
| Number of shares of CenterState common stock less 138 of fractional shares |
5,195,541 | |||
| Multiplied by CenterState common stock price per share on January 16, 2014 |
$ | 10.23 | ||
|
|
|
|||
| Fair value of CenterState common stock issued |
$ | 53,150 | ||
|
|
|
|||
| Total Gulfstream common shares including conversion of preferred shares |
1,724,993 | |||
| Multiplied by the cash consideration each Gulfstream share is entitled to receive |
$ | 14.65 | ||
|
|
|
|||
| Total Cash Consideration, not including cash for fractional shares |
$ | 25,271 | ||
|
|
|
|||
| Total Stock Consideration |
$ | 53,150 | ||
| Total Cash Consideration plus $2 for 138 of fractional shares |
25,273 | |||
|
|
|
|||
| Total consideration to be paid to Gulfstream common shareholders |
$ | 78,423 | ||
| Fair value of current Gulfstream stock options to be converted to CenterState stock options |
3,617 | |||
|
|
|
|||
| Total purchase price |
$ | 82,040 | ||
|
|
|
36
Table of Contents
CenterState Banks, Inc. and Subsidiaries
NOTES TO CONDENSED CONSOLIDATED FINANCIAL STATEMENTS (unaudited)
(in thousands of dollars, except per share data)
The list below summarizes the preliminary estimates of the fair value of the assets purchased, including goodwill, and liabilities assumed as of the January 17, 2014 purchase date.
| Jan 17, 2014 | ||||
| Assets: |
||||
| Cash and cash equivalents |
$ | 102,278 | ||
| Loans, held for investment |
329,515 | |||
| Purchased credit impaired loans |
30,068 | |||
| Loans held for sale |
247 | |||
| Investments |
60,816 | |||
| Interest receivable |
1,087 | |||
| Branch real estate |
5,519 | |||
| Furniture and fixtures |
262 | |||
| FHLB stock |
885 | |||
| Bank owned life insurance |
4,939 | |||
| Other repossessed real estate owned |
2,694 | |||
| Core deposit intangible |
4,173 | |||
| Goodwill |
31,516 | |||
| Other assets |
11,261 | |||
|
|
|
|||
| Total assets acquired |
$ | 585,260 | ||
|
|
|
|||
| Liabilities: |
||||
| Deposits |
$ | 478,999 | ||
| Federal Home loan advances |
5,708 | |||
| Repurchase agreements |
7,576 | |||
| Interest payable |
125 | |||
| Official checks outstanding |
826 | |||
| Corporate debentures |
6,745 | |||
| Other liabilities |
3,241 | |||
|
|
|
|||
| Total liabilities assumed |
$ | 503,220 | ||
|
|
|
|||
In the acquisition, the Company purchased $359,583 of loans at fair value, net of $18,267, or 4.8%, estimated discount to the outstanding principal balance, representing 24.4% of the Company’s total loans at December 31, 2013. Of the total loans acquired, management identified $30,068 with credit deficiencies. All loans that were on non-accrual status and all loan relationships that were greater than $500 and identified as impaired as of the acquisition date were considered by management to be credit impaired and are accounted for pursuant to ASC Topic 310-30. The table below summarizes the total contractually required principal and interest cash payments, management’s estimate of expected total cash payments and fair value of the loans as of January 17, 2014 for purchased credit impaired loans. Contractually required principal and interest payments have been adjusted for estimated prepayments.
| Contractually required principal and interest |
$ | 48,289 | ||
| Non-accretable difference |
(11,766 | ) | ||
|
|
|
|||
| Cash flows expected to be collected |
36,523 | |||
| Accretable yield |
(6,455 | ) | ||
|
|
|
|||
| Total purchased credit-impaired loans acquired |
$ | 30,068 | ||
|
|
|
37
Table of Contents
CenterState Banks, Inc. and Subsidiaries
NOTES TO CONDENSED CONSOLIDATED FINANCIAL STATEMENTS (unaudited)
(in thousands of dollars, except per share data)
The table below presents information with respect to the fair value of acquired loans, as well as their unpaid principal balance (“Book Balance”) at acquisition date.
| Book balance |
Fair value |
|||||||
| Loans: |
||||||||
| Single family residential real estate |
33,506 | 32,319 | ||||||
| Commercial real estate |
185,250 | 183,189 | ||||||
| Construction/development/land |
30,387 | 27,704 | ||||||
| Commercial loans |
85,940 | 84,203 | ||||||
| Consumer and other loans |
2,112 | 2,100 | ||||||
| Purchased credit-impaired |
40,655 | 30,068 | ||||||
|
|
|
|
|
|||||
| Total earning assets |
$ | 377,850 | $ | 359,583 | ||||
|
|
|
|
|
|||||
In its assumption of the deposit liabilities, the Company believed the deposits assumed from the acquisition have an intangible value. The Company applied ASC Topic 805, which prescribes the accounting for goodwill and other intangible assets such as core deposit intangibles, in a business combination. The Company determined the estimated fair value of the core deposit intangible asset totaled $4,173, which will be amortized utilizing an accelerated amortization method over an estimated economic life not to exceed ten years. In determining the valuation amount, deposits were analyzed based on factors such as type of deposit, deposit retention, interest rates and age of deposit relationships.
38
Table of Contents
CenterState Banks, Inc. and Subsidiaries
NOTES TO CONDENSED CONSOLIDATED FINANCIAL STATEMENTS (unaudited)
(in thousands of dollars, except per share data)
Measurement period adjustments
On January 17, 2014 the Company purchased Gulfstream. As previously disclosed, the fair values initially assigned to the assets acquired and liabilities assumed were preliminary and subject to refinement for up to one year after the closing date of the acquisition as new information relative to closing date fair values became available. Based on appraisals received subsequent to the acquisition date, the Company adjusted its initial fair value estimates of certain other real estate owned acquired.
| Jan 17, 2014 (as initially reported) |
measurement period adjustments |
Jan 17, 2014 (as adjusted) |
||||||||||
| Assets: |
||||||||||||
| Cash and cash equivalents |
$ | 102,278 | $ | — | $ | 102,278 | ||||||
| Loans, held for investment |
329,515 | 329,515 | ||||||||||
| Purchased credit impaired loans |
30,068 | 30,068 | ||||||||||
| Loans held for sale |
247 | 247 | ||||||||||
| Investments |
60,816 | 60,816 | ||||||||||
| Interest receivable |
1,087 | 1,087 | ||||||||||
| Branch real estate |
5,519 | 5,519 | ||||||||||
| Furniture and fixtures |
262 | 262 | ||||||||||
| FHLB stock |
885 | 885 | ||||||||||
| Bank owned life insurance |
4,939 | 4,939 | ||||||||||
| Other repossessed real estate owned |
3,365 | (671 | ) | 2,694 | ||||||||
| Core deposit intangible |
4,173 | 4,173 | ||||||||||
| Goodwill |
31,104 | 412 | 31,516 | |||||||||
| Other assets |
11,002 | 259 | 11,261 | |||||||||
|
|
|
|
|
|
|
|||||||
| Total assets acquired |
$ | 585,260 | $ | — | $ | 585,260 | ||||||
|
|
|
|
|
|
|
|||||||
| Liabilities: |
||||||||||||
| Deposits |
$ | 478,999 | $ | — | $ | 478,999 | ||||||
| Federal Home loan advances |
5,708 | 5,708 | ||||||||||
| Repurchase agreements |
7,576 | 7,576 | ||||||||||
| Interest payable |
125 | 125 | ||||||||||
| Official checks outstanding |
826 | 826 | ||||||||||
| Trust Preferred Security |
6,745 | 6,745 | ||||||||||
| Other liabilities |
3,241 | 3,241 | ||||||||||
|
|
|
|
|
|
|
|||||||
| Total liabilities assumed |
$ | 503,220 | $ | — | $ | 503,220 | ||||||
|
|
|
|
|
|
|
|||||||
39
Table of Contents
CenterState Banks, Inc. and Subsidiaries
NOTES TO CONDENSED CONSOLIDATED FINANCIAL STATEMENTS (unaudited)
(in thousands of dollars, except per share data)
Acquisition of First Southern Bancorp, Inc.
On June 1, 2014, the Company completed its previously announced acquisition of First Southern Bancorp, Inc. (“FSB”) as set forth in the Agreement and Plan of Merger (“Agreement”) whereby FSB merged with and into the Company. Pursuant to and simultaneously with the merger of FSB with and into the Company, FSB’s subsidiary bank, First Southern Bank, merged with and into the Company’s subsidiary bank, CenterState Bank of Florida, N.A.
The Company’s primary reasons for the transaction were to further solidify its market share in the southeast Florida market as well as in central and northeastern Florida and expand its customer base to enhance deposit fee income and leverage operating cost through economies of scale. The acquisition increased the Company’s total assets and total deposits by approximately 32% and 33%, respectively, as compared with the balances at March 31, 2014, and is expected to positively affect the Company’s operating results to the extent the Company earns more from interest earning assets than it pays in interest on its interest bearing liabilities.
The acquisition was accounted for under the acquisition method of accounting in accordance with ASC Topic 805, Business Combinations. The Company recognized goodwill on this acquisition of $541, which is nondeductible for tax purposes as this acquisition is a nontaxable transaction. The goodwill is calculated based on the fair values of the assets acquired and liabilities assumed as of the acquisition date. Fair value estimates are based on the information available, and are subject to change for up to one year after the closing date of the acquisition as additional information relative to closing date fair values becomes available. Fair values are preliminary estimates due to pending appraisals on loans and other real estate owned.
The Company acquired 100% of the outstanding common stock of FSB. The purchase price consisted of both cash and stock. Each share of FSB common stock was exchanged for $3.00 cash and 0.30 shares of the Company’s common stock. Based on the closing price of the Company’s common stock on May 30, 2014 (the last trading day prior to the June 1, 2014 acquisition date), the resulting purchase price was $195,404. The table below summarizes the purchase price calculation.
| Number of shares of FSB common stock outstanding at May 30, 2014 |
31,539,698 | |||
| FSB preferred shares that convert to FSB common shares upon a change in control |
48,375 | |||
|
|
|
|||
| Total FSB common shares including conversion of preferred shares |
31,588,073 | |||
| Per share exchange ratio |
0.3 | |||
|
|
|
|||
| Number of shares of CenterState common stock |
9,476,424 | |||
| Multiplied by CenterState common stock price per share on May 30, 2014 |
$ | 10.62 | ||
|
|
|
|||
| Fair value of CenterState common stock issued |
$ | 100,639 | ||
|
|
|
|||
| Total FSB common shares including conversion of preferred shares |
31,588,073 | |||
| Multiplied by the cash consideration each FSB share is entitled to receive |
$ | 3.00 | ||
|
|
|
|||
| Total Cash Consideration |
$ | 94,765 | ||
|
|
|
|||
| Total Stock Consideration |
$ | 100,639 | ||
| Total Cash Consideration |
94,765 | |||
|
|
|
|||
| Total purchase price |
$ | 195,404 | ||
|
|
|
40
Table of Contents
CenterState Banks, Inc. and Subsidiaries
NOTES TO CONDENSED CONSOLIDATED FINANCIAL STATEMENTS (unaudited)
(in thousands of dollars, except per share data)
The list below summarizes the preliminary estimates of the fair value of the assets purchased, including goodwill, and liabilities assumed as of the June 1, 2014 purchase date.
| June 1, 2014 | ||||
| Assets: |
||||
| Cash and cash equivalents |
$ | 148,257 | ||
| Loans, excluding purchased credit impaired loans |
477,841 | |||
| Purchased credit impaired loans |
121,684 | |||
| Investments |
204,723 | |||
| Interest receivable |
2,007 | |||
| Branch real estate |
1,594 | |||
| Furniture and fixtures |
1,282 | |||
| Bank property held for sale |
7,119 | |||
| Federal Reserve Bank and Federal Home Loan Bank stock |
5,576 | |||
| Bank owned life insurance |
2,555 | |||
| Other repossessed real estate owned covered by FDIC loss share agreements |
22,731 | |||
| Other repossessed real estate owned |
|
454 |
| |
| Core deposit intangible |
7,396 | |||
| Goodwill |
541 | |||
| Deferred tax asset |
43,889 | |||
| Other assets |
4,581 | |||
|
|
|
|||
| Total assets acquired |
$ | 1,052,230 | ||
|
|
|
|||
| Liabilities: |
||||
| Deposits |
$ | 662,959 | ||
| Deposits held for sale |
189,674 | |||
| Interest payable |
58 | |||
| Other liabilities |
4,135 | |||
|
|
|
|||
| Total liabilities assumed |
$ | 856,826 | ||
|
|
|
|||
In the acquisition, the Company purchased $599,525 of loans at fair value, net of $30,811, or 4.9%, estimated discount to the outstanding principal balance, representing 33% of the Company’s total loans at March 31, 2014. Of the total loans acquired, management identified $121,684 with credit deficiencies. All loans that were on non-accrual status, all TDRs, all impaired loans, all loans previously identified by FSB with credit deficiencies and any other loan identified by the Company with a probable credit deficiency were considered by management to be credit impaired and are accounted for pursuant to ASC Topic 310-30. The table below summarizes the total contractually required principal and interest cash payments, management’s estimate of expected total cash payments and fair value of the loans as of June 1, 2014 for purchased credit impaired loans. Contractually required principal and interest payments have been adjusted for estimated prepayments.
| Contractually required principal and interest |
$ | 180,960 | ||
| Non-accretable difference |
(33,527 | ) | ||
|
|
|
|||
| Cash flows expected to be collected |
147,433 | |||
| Accretable yield |
(25,749 | ) | ||
|
|
|
|||
| Total purchased credit-impaired loans acquired |
$ | 121,684 | ||
|
|
|
41
Table of Contents
CenterState Banks, Inc. and Subsidiaries
NOTES TO CONDENSED CONSOLIDATED FINANCIAL STATEMENTS (unaudited)
(in thousands of dollars, except per share data)
The table below presents information with respect to the fair value of acquired loans, as well as their unpaid principal balance (“Book Balance”) at acquisition date.
| Book balance |
Fair value |
|||||||
| Loans: |
||||||||
| Single family residential real estate |
$ | 60,332 | $ | 57,693 | ||||
| Commercial real estate |
387,589 | 382,162 | ||||||
| Construction/development/land |
17,238 | 15,942 | ||||||
| Commercial loans |
20,267 | 19,906 | ||||||
| Consumer and other loans |
2,496 | 2,138 | ||||||
| Purchased credit-impaired |
142,414 | 121,684 | ||||||
|
|
|
|
|
|||||
| Total earning assets |
$ | 630,336 | $ | 599,525 | ||||
|
|
|
|
|
|||||
In its assumption of the deposit liabilities, the Company believed the deposits assumed from the acquisition have an intangible value. The Company applied ASC Topic 805, which prescribes the accounting for goodwill and other intangible assets such as core deposit intangibles, in a business combination. The Company determined the estimated fair value of the core deposit intangible asset totaled $7,396, which will be amortized utilizing an accelerated amortization method over an estimated economic life not to exceed ten years. In determining the valuation amount, deposits were analyzed based on factors such as type of deposit, deposit retention, interest rates and age of deposit relationships.
Pro-forma information
Pro-forma data for the three and six month periods ending June 30, 2013 listed in the table below presents pro-forma information as if the Gulfstream and FSB acquisitions occurred at the beginning of 2013. The pro-forma information for the three and six month periods ending June 30, 2014 assumes the FSB acquisition occurred at the beginning of 2013. Because the Gulfstream transaction closed on January 17, 2014 and their actual results are included in the Company’s actual operating results for 2014, their actual results were used in the table below for the three and six month periods ending June 30, 2014 instead of a pro-forma amount.
| Three months ended June 30, | Six months ended June 30, | |||||||||||||||
| 2013 | 2014 | 2013 | 2014 | |||||||||||||
| Net interest income |
$ | 37,252 | $ | 37,617 | $ | 74,835 | $ | 75,434 | ||||||||
| Net income available to common shareholders |
5,129 | 5,277 | 11,525 | 8,524 | ||||||||||||
| EPS - basic |
$ | 0.11 | $ | 0.12 | $ | 0.26 | $ | 0.19 | ||||||||
| EPS - diluted |
$ | 0.11 | $ | 0.12 | $ | 0.26 | $ | 0.19 | ||||||||
Disposition of certain branches acquired pursuant to the FSB acquisition.
On June 4, 2014, the Company entered into a Purchase and Assumption Agreement (“P&A Agreement”) with an unrelated bank (“Buyer”) whereby Buyer agreed to purchase and the Company agreed to sell five branch offices acquired by the Company pursuant to its June 1, 2014 acquisition of FSB, as described above. Under the terms of the P&A Agreement, the Buyer will assume substantially all of the customer deposits at the five branches. In addition, Buyer will assume substantially all of the customer deposits of a sixth branch but will not assume the branch lease. The deposits will be moved by Buyer to a new branch office located nearby, and the Company will close the existing leased branch office.
42
Table of Contents
CenterState Banks, Inc. and Subsidiaries
NOTES TO CONDENSED CONSOLIDATED FINANCIAL STATEMENTS (unaudited)
(in thousands of dollars, except per share data)
The purchase price will be approximately $6.5 million for the five branch offices and a premium of 1.5% for the approximately $200 million deposit balances to be assumed by the Buyer from all six branch offices. The Company is not selling, and the Buyer is not purchasing, any loans in the transaction. The consummation of the transaction is subject to customary regulatory approval and is expected to close in September 2014. The June 4, 2014 sales prices were used as the June 1, 2014 acquisition date fair values, therefore, the Company did not recognize an accounting gain or loss on the transaction.
In addition to the disposition of 6 of the acquired branches from FSB, the Company is closing and consolidating 4 additional acquired branches from FSB. Two of the branches are in leased facilities and the other two are owned by the Company as a result of its acquisition of FSB. The real estate, as well as the furniture, fixtures and equipment have been transferred to held-for-sale during June 2014 at estimated fair value less disposition expenses. The required customer notifications have been sent and the offices are expected to close on September 19, 2014, the same date the Company has scheduled to convert FSB’s core IT system to the Company’s core system.
In September, the Company will have 3 leased branch buildings that will no longer be in use. In addition, it will also have several other leased facilities used by FSB for loan operations, deposit operations and IT that will no longer be used as these functions will be consolidated into the Company’s backroom operations. The Company will either negotiate a lease termination with its related counterparty or accrue the remaining lease obligations. Once a written lease termination is recognized, the liability will be recognized in the Company’s financial statements. If there is no termination agreement, the remaining lease obligations will be recognized in the Company’s financial statement at the cease-use date, which is when the premise is completely vacated and the Company expects to derive no future economic benefit from the obligation. As such, no lease related expenses were included in the merger related expenses recognized during the quarter ended June 30, 2014. The Company expects to recognize approximately $1.8 million of expenses related to the termination or accrual of these lease obligations in the third and fourth quarter of the current year, with the majority of the expenses occurring in the third quarter.
NOTE 9: Recently Issued Accounting Standards
ASU No. 2014-09, “Revenue from Contracts with Customers (Topic 606)” was a joint project initiated by the Financial Accounting Standards Board (FASB) and the International Accounting Standards Board (IASB) to clarify the principles for recognizing revenue and to develop a common revenue standard and disclosures for U.S. and international accounting standards that would: (1) remove inconsistencies and weaknesses in revenue requirements; (2) provide a more robust framework for addressing revenue issues; (3) improve comparability of revenue recognition practices across entities, industries, jurisdictions, and capital markets; (4) provide more useful information to users of financial statements through improved disclosure requirements and (5) simplify the preparation of financial statements by reducing the number of requirements to which an entity must refer. The guidance affects any entity that either enters into contracts with customers to transfer goods or services or enters into contracts for the transfer of nonfinancial assets. The core principle is that an entity should recognize revenue to depict the transfer of promised goods or services to customers in an amount that reflects the consideration to which the entity expects to be entitled in exchange for those goods or services. The guidance provides steps to follow to achieve the core principle. An entity should disclose sufficient information to enable users of financial statements to understand the nature, amount, timing and uncertainty of revenue and cash flows arising from contracts with customers. Qualitative and quantitative information is required about contracts with customers, significant judgments and changes in judgments, and assets recognized from the costs to obtain or fulfill a contract. This ASU is effective for annual reporting periods beginning after December 15, 2016, including interim periods within that reporting period. Early application is not permitted. The Company is currently evaluating the effects of this guidance on its financial statements and disclosures, if any.
43
Table of Contents
| ITEM 2: | MANAGEMENT’S DISCUSSION AND ANALYSIS OF FINANCIAL CONDITION AND RESULTS OF OPERATIONS |
(All dollar amounts presented herein are in thousands, except per share data,
or unless otherwise noted.)
COMPARISON OF BALANCE SHEETS AT JUNE 30, 2014 AND DECEMBER 31, 2013
Overview
Our total assets and liabilities increased between year end 2013 and June 30, 2014 primarily due to the January 17, 2014 acquisition of Gulfstream Bancshares, Inc. and its banking subsidiary, Gulfstream Business Bank (collectively “Gulfstream”) and our June 1, 2014 acquisition of First Southern Bancorp, Inc. and its banking subsidiary, First Southern Bank (collectively “FSB”).
The Gulfstream acquisition added approximately $585,260 of assets and $503,220 of liabilities to our consolidated balance sheet as of the acquisition date. We issued approximately 5.2 million common shares and acquired the outstanding options pursuant to the Gulfstream acquisition agreement which added approximately $56,767 to our consolidated shareholders’ equity at the transaction date. Gulfstream’s core processing system was converted to our core system on February 14, 2014.
The FSB acquisition added approximately $1,052,230 of assets and $856,826 of liabilities to our consolidated balance sheet as of the acquisition date. We issued approximately 9.5 million common shares which added approximately $100,639 to our consolidated shareholders’ equity at the transaction date.
On June 4, 2014 we entered into an agreement to sell five of the 17 branch offices we acquired from FSB and approximately $200 million of deposits, which includes the closing of a sixth branch office that was leased. Of the 17 branch offices acquired from FSB, our plan was to consolidate and close 10, and operate the remaining 7 as CenterState branches. The 6 branches sold or closed were included in the 10. The sale and closing of the branches is expected to close in September 2014. The consolidation and closing of the remaining 4 (total of 10 branches to be sold or closed) is also expected to occur on September 19, 2014, the date scheduled for the conversion of FSB’s core processing system into our core processing system.
These changes are discussed and analyzed below and on the following pages.
Federal funds sold and Federal Reserve Bank deposits
Federal funds sold and Federal Reserve Bank deposits were $490,966 at June 30, 2014 (approximately 12.6% of total assets) as compared to $153,308 at December 31, 2013 (approximately 6.3% of total assets). We use our available-for-sale securities portfolio, as well as federal funds sold and Federal Reserve Bank deposits for liquidity management and for investment yields. These accounts, as a group, will fluctuate as a function of loans outstanding, and to some degree the amount of correspondent bank deposits (i.e. federal funds purchased) outstanding. We are holding more liquidity than we historically do in anticipation of transferring about $185,000 of cash to the buyer of our FSB branches and deposits referred to above in September 2014.
44
Table of Contents
Investment securities available for sale
Securities available-for-sale, consisting primarily of U.S. government sponsored enterprises and municipal tax exempt securities, were $542,149 at June 30, 2014 (approximately 13.9% of total assets) compared to $457,086 at December 31, 2013 (approximately 18.9% of total assets), an increase of $85,063 or 18.6%. We use our available-for-sale securities portfolio, as well as federal funds sold and Federal Reserve Bank deposits for liquidity management and for investment yields. These accounts, as a group, will fluctuate as a function of loans outstanding as discussed above, under the caption “Federal funds sold and Federal Reserve Bank deposits.” Our securities are carried at fair value. We classify our securities as “available-for-sale” to provide for greater flexibility to respond to changes in interest rates as well as future liquidity needs.
Trading securities
We also have a trading securities portfolio. Realized and unrealized gains and losses are included in trading securities revenue, a component of our non interest income, in our Condensed Consolidated Statement of Earnings and Comprehensive Income. Securities purchased for this portfolio have primarily been various municipal securities. We held $89 in our trading securities portfolio as of June 30, 2014. A list of the activity in this portfolio is summarized below.
| six month period ended June 30, 2014 |
six month period ended June 30, 2013 |
|||||||
| Beginning balance |
$ | — | $ | 5,048 | ||||
| Purchases |
65,234 | 129,249 | ||||||
| Proceeds from sales |
(65,214 | ) | (134,428 | ) | ||||
| Net realized gain on sales |
69 | 131 | ||||||
|
|
|
|
|
|||||
| Ending balance |
$ | 89 | $ | — | ||||
|
|
|
|
|
|||||
Loans held for sale
We also have a loans held for sale portfolio, whereby we originate single family home loans and sell those mortgages into the secondary market, servicing released. These loans are recorded at the lower of cost or market. Gains and losses on the sale of loans held for sale are included as a component of non interest income in our Condensed Consolidated Statement of Earnings and Comprehensive Income. A list of the activity in this portfolio is summarized below.
| six month period ended June 30, 2014 |
six month period ended June 30, 2013 |
|||||||
| Beginning balance |
$ | 1,010 | $ | 2,709 | ||||
| Acquired from Gulfstream |
247 | — | ||||||
| Loans originated |
10,991 | 10,887 | ||||||
| Proceeds from sales |
(10,835 | ) | (12,006 | ) | ||||
| Net realized gain on sales |
183 | 170 | ||||||
|
|
|
|
|
|||||
| Ending balance |
$ | 1,596 | $ | 1,760 | ||||
|
|
|
|
|
|||||
Loans
Lending-related income is the most important component of our net interest income and is a major contributor to profitability. The loan portfolio is the largest component of earning assets, and it therefore generates the largest portion of revenues. The absolute volume of loans and the volume of loans as a percentage of earning assets is an important determinant of net interest margin as loans are expected to produce higher yields than securities and other earning assets. Average loans during the six months
45
Table of Contents
ended June 30, 2014, were $1,887,253 or 69.9% of average earning assets, as compared to $1,420,367, or 70.0% of average earning assets, for the six month period ending June 30, 2013. Total loans at June 30, 2014 and December 31, 2013 were $2,396,019 and $1,474,179, respectively. This represents a loan to total asset ratio of 61.4% and 61.0% and a loan to deposit ratio of 72.4% and 71.7%, at June 30, 2014 and December 31, 2013, respectively.
PCI loans
At June 30, 2014, we have total Purchased Credit Impaired (“PCI”) loans of $353,870 of which approximately $307,931 are covered by FDIC loss share agreements. Of the $307,931 FDIC covered loans, $207,350 relate to our acquisitions of three failed financial institutions during the third quarter of 2010 and two during the first quarter of 2012. The FDIC is generally obligated to reimburse us for 80% of losses beginning with the first dollar of loss. We acquired the remaining $100,581 of covered PCI loans pursuant to our June 1, 2014 acquisition of FSB. FSB had previously acquired two failed financial institutions with FDIC loss sharing agreements. Those agreements transferred to us as part of the acquisition transaction. These loss share agreements were similar to ours except that the reimbursable loss percentages vary based on certain amounts of losses incurred. See page 47 for a summary of loss share tranches with their respective coverage percentage loss limits. In addition to FDIC covered loans, we have $45,939 of PCI loans without loss share that we acquired from our January 17, 2014 acquisition of Gulfstream, our June 1, 2014 acquisition of FSB and certain loans acquired from our five acquisitions of failed financial institutions that are not covered by loss share agreements. The table below summarizes our PCI loans at June 30, 2014.
| $ | 207,350 | covered by FDIC loss share- 80% of losses reimbursable beginning with first dollar of loss | ||
| 100,581 | covered by FDIC loss share- range of 0% to 75% — see page 47 for summary of tranches | |||
| 45,939 | not covered by FDIC loss share agreements | |||
|
|
|
|||
| $ | 353,870 | total PCI loans at June 30, 2014 | ||
|
|
|
Non-PCI loans
At June 30, 2014, we have total Non-PCI loans of $2,042,149 of which approximately $43,441 are covered by FDIC loss share agreements. The covered loans were acquired from our June 1, 2014 acquisition of FSB and the related transfer of their FDIC loss share agreements to us. Total new loans originated during the six month period ended June 30, 2014 approximated $176 million, of which $138 million were funded. The weighted average interest rate on funded loans was approximately 4.47%. The graph below summarizes total loan production and funded loan production over the past ten quarters.
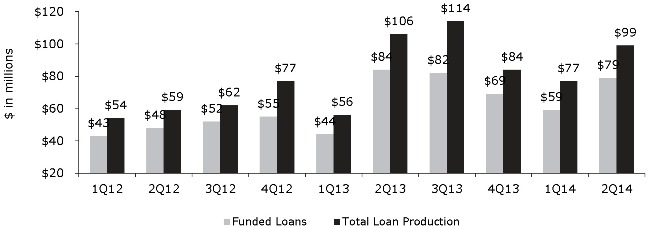
In addition to the increase in production between sequential quarters, our loan origination pipeline increased from $140 million at March 31, 2014 to approximately $238 million at June 30, 2014.
46
Table of Contents
With the acquisition of FSB and assumption of its FDIC loss share agreements we now have FDIC covered loans in our PCI portfolio and our non PCI portfolio. The table below summarizes our FDIC covered loans by PCI and Non-PCI portfolios at June 30, 2014.
| PCI loans | Non-PCI | Total loans | ||||||||||
| FDIC covered |
$ | 307,931 | $ | 43,441 | $ | 351,372 | ||||||
| not covered |
45,939 | 1,998,708 | 2,044,647 | |||||||||
|
|
|
|
|
|
|
|||||||
| Total |
$ | 353,870 | $ | 2,042,149 | $ | 2,396,019 | ||||||
|
|
|
|
|
|
|
|||||||
At June 30, 2014, $144,022 of the $351,372 FDIC covered loans was acquired pursuant to our acquisition of FSB and the related assumption of FSB’s loss share agreements with the FDIC. These loss share agreements are similar to our current FDIC agreements except that the reimbursable loss percentages vary based on certain amounts of losses incurred. The following table summarizes the loss share tranches with their respective coverage percentage loss limits.
| Haven Trust Bank of Florida | ||||||||||||
| Single Family Residential Loans | Non-Single Family Residential Loans | |||||||||||
| range of losses | loss share percentage |
range of losses | loss share percentage |
|||||||||
| 1st Tranche |
$0 — $1,292 | 70 | % | $0 — $28,574 | 70 | % | ||||||
| 2nd Tranche |
$1,293 — $1,878 | 0 | % | $28,575 — $38,169 | 0 | % | ||||||
| 3rd Tranche |
$1,879 — unlimited | 70 | % | $38,170 — unlimited | 70 | % | ||||||
| First Commercial Bank of Florida | ||||||||||||
| Single Family Residential Loans | Non-Single Family Residential Loans | |||||||||||
| range of losses | loss share percentage |
range of losses | loss share percentage |
|||||||||
| 1st Tranche |
$0 — $5,905 | 70 | % | $0 — $95,792 | 70 | % | ||||||
| 2nd Tranche |
$5,906 — $9,902 | 30 | % | $95,793 — $160,396 | 30 | % | ||||||
| 3rd Tranche |
$9,903 — unlimited | 75 | % | $160,397 — unlimited | 75 | % | ||||||
As of the last loss certificate filed, the Company is in the following loss share Tranche:
| Haven Trust Bank of Florida | First Commercial Bank of Florida | |||||||||||||||
| Current Tranche (1) | Remaining (2) | Current Tranche (1) | Remaining (2) | |||||||||||||
| Single Family Residential Loans |
1st Tranche (70 | %) | $ | 500 | 3rd Tranche (75 | %) | unlimited | |||||||||
| Non-Single Family Residential Loans |
2nd Tranche (0 | %) | $ | 8,900 | 2nd Tranche (30 | %) | $ | 29,000 | ||||||||
note 1: The current Tranche as of the last loss share certificate filed with the FDIC and the related loss share percentage.
note 2: The approximate amount of losses eligible for reimbursement remaining in the current Tranche.
Loan concentrations are considered to exist where there are amounts loaned to multiple borrowers engaged in similar activities, which collectively could be similarly impacted by economic or other conditions and when the total of such amounts would exceed 25% of total capital. Due to the lack of diversified industry and the relative proximity of markets served, the Company has concentrations in geographic as well as in types of loans funded.
Total loans at June 30, 2014 are equal to $2,396,019. Of this amount, approximately 86.6% are collateralized by real estate, 11.0% are commercial non real estate loans and the remaining 2.4% are consumer and other non real estate loans. We have approximately $682,298 of single family residential loans which represents about 29% of our total loan portfolio. Our largest category of loans is commercial real estate which represents approximately 54% of our total loan portfolio.
47
Table of Contents
The following table sets forth information concerning the loan portfolio by collateral types as of the dates indicated.
| June 30, 2014 | Dec 31, 2013 | |||||||
| Total loans, excluding PCI loans |
||||||||
| Real estate loans |
||||||||
| Residential |
$ | 563,293 | $ | 458,331 | ||||
| Commercial |
1,091,660 | 528,710 | ||||||
| Land, development and construction |
78,444 | 62,503 | ||||||
|
|
|
|
|
|||||
| Total real estate |
1,733,397 | 1,049,544 | ||||||
| Commercial |
251,741 | 143,263 | ||||||
| Consumer and other loans |
56,191 | 49,547 | ||||||
|
|
|
|
|
|||||
| Loans before unearned fees and deferred cost |
2,041,329 | 1,242,354 | ||||||
| Net unearned fees and costs |
820 | 404 | ||||||
|
|
|
|
|
|||||
| Total loans, excluding PCI loans |
2,042,149 | 1,242,758 | ||||||
|
|
|
|
|
|||||
| Total PCI loans (note 1) |
||||||||
| Real estate loans |
||||||||
| Residential |
119,005 | 120,030 | ||||||
| Commercial |
195,157 | 100,012 | ||||||
| Land, development and construction |
27,885 | 6,381 | ||||||
|
|
|
|
|
|||||
| Total real estate |
342,047 | 226,423 | ||||||
| Commercial |
10,759 | 3,850 | ||||||
| Consumer and other loans |
1,064 | 1,148 | ||||||
|
|
|
|
|
|||||
| Total PCI loans |
353,870 | 231,421 | ||||||
|
|
|
|
|
|||||
| Total loans |
2,396,019 | 1,474,179 | ||||||
| Allowance for loan losses for loans that are not PCI loans |
(18,240 | ) | (19,694 | ) | ||||
| Allowance for loan losses for PCI loans |
(960 | ) | (760 | ) | ||||
|
|
|
|
|
|||||
| Total loans, net of allowance for loan losses |
$ | 2,376,819 | $ | 1,453,725 | ||||
|
|
|
|
|
|||||
note 1: PCI accounted for pursuant to ASC Topic 310-30.
48
Table of Contents
Included in our total loans listed above, are loans covered by FDIC loss share agreements. The following table sets forth information concerning the loan portfolio by collateral types which are covered by FDIC loss sharing agreements.
| June 30, 2014 | Dec 31, 2013 | |||||||
| FDIC covered loans that are not PCI loans |
||||||||
| Real estate loans |
||||||||
| Residential |
$ | 6,457 | $ | — | ||||
| Commercial |
35,668 | — | ||||||
| Land, development and construction |
857 | — | ||||||
|
|
|
|
|
|||||
| Total real estate |
42,982 | — | ||||||
| Commercial |
459 | — | ||||||
| Consumer and other loans |
— | — | ||||||
|
|
|
|
|
|||||
| FDIC covered loans, excluding PCI loans |
43,441 | — | ||||||
|
|
|
|
|
|||||
| FDIC covered PCI loans (note 1) |
||||||||
| Real estate loans |
||||||||
| Residential |
115,306 | 120,030 | ||||||
| Commercial |
166,932 | 100,012 | ||||||
| Land, development and construction |
20,509 | 6,381 | ||||||
|
|
|
|
|
|||||
| Total real estate |
302,747 | 226,423 | ||||||
| Commercial |
5,184 | 3,850 | ||||||
| Consumer and other loans |
— | — | ||||||
|
|
|
|
|
|||||
| Total FDIC covered PCI loans |
307,931 | 230,273 | ||||||
|
|
|
|
|
|||||
| Total FDIC covered loans |
351,372 | 230,273 | ||||||
| Allowance for loan losses for FDIC covered loans that are not PCI loans |
— | — | ||||||
| Allowance for loans losses for FDIC covered PCI loans |
(960 | ) | (760 | ) | ||||
|
|
|
|
|
|||||
| Total covered loans, net of allowance for loan losses |
$ | 350,412 | $ | 229,513 | ||||
|
|
|
|
|
|||||
note 1: PCI loans are accounted for pursuant to ASC Topic 310-30.
Credit quality and allowance for loan losses
We maintain an allowance for loan losses that we believe is adequate to absorb probable losses incurred in our loan portfolio.
The allowance consists of three components. The first component is an allocation for impaired loans, as defined by generally accepted accounting principles. Impaired loans are those loans whereby management has arrived at a determination that the Company will not be repaid according to the original terms of the loan agreement. Each of these loans is required to have a written analysis supporting the amount of specific allowance allocated to the particular loan, if any. That is to say, a loan may be impaired (i.e., not expected to be repaid as agreed), but may be sufficiently collateralized such that we expect to recover all principal and interest eventually, and therefore no specific allowance is warranted.
Commercial, commercial real estate, land, land development and construction loans in excess of $500 are monitored and evaluated for impairment on an individual loan basis. Commercial, commercial real estate, land, land development and construction loans less than $500 are evaluated for impairment on a pool basis. All consumer and single family residential loans are evaluated for impairment on a pool basis.
49
Table of Contents
On at least a quarterly basis, management reviews each impaired loan to determine whether it should have a specific reserve or partial charge-off. Management relies on appraisals to help make this determination. Updated appraisals are obtained for collateral dependent loans when a loan is scheduled for renewal or refinance. In addition, if the classification of the loan is downgraded to substandard, identified as impaired, or placed on non accrual status (collectively “Problem Loans”), an updated appraisal is obtained if the loan amount is greater than $500 and individually evaluated for impairment.
After an updated appraisal is obtained for a Problem Loan, as described above, an additional updated appraisal will be obtained on at least an annual basis. Thus, current appraisals for Problem Loans in excess of $500 will not be older than one year.
After the initial updated appraisal is obtained for a Problem Loan and before its next annual appraisal update is due, management considers the need for a downward adjustment to the current appraisal amount to reflect current market conditions, based on management’s analysis, judgment and experience. In an extremely volatile market, we may update the appraisal prior to the one year anniversary date.
The second component is a general allowance on all of the Company’s loans other than PCI loans and those identified as impaired. The general component covers non-impaired loans and is based on historical loss experience adjusted for current factors. The historical loss experience is determined by portfolio segment and is based on the actual loss history experienced by the Company over the most recent two years. The portfolio segments identified by the Company are residential loans, commercial real estate loans, construction and land development loans, commercial and industrial and consumer and other. This actual loss experience is supplemented with other economic factors based on the risks present for each portfolio segment. These economic, or qualitative, factors include consideration of the following: levels of and trends in delinquencies and impaired loans; levels of and trends in charge-offs and recoveries; trends in volume and terms of loans; effects of any changes in risk selection and underwriting standards; other changes in lending policies, procedures, and practices; experience, ability, and depth of lending management and other relevant staff; national and local economic trends and conditions; industry conditions; and effects of changes in credit concentrations.
The third component consists of amounts reserved for purchased credit impaired loans. On a quarterly basis, the Company updates the amount of loan principal and interest cash flows expected to be collected, incorporating assumptions regarding default rates, loss severities, the amounts and timing of prepayments and other factors that are reflective of current market conditions. Probable decreases in expected loan principal cash flows trigger the recognition of impairment, which is then measured as the present value of the expected principal loss plus any related foregone interest cash flows discounted at the pool’s effective interest rate. Impairments that occur after the acquisition date are recognized through the provision for loan losses. Probable and significant increases in expected principal cash flows would first reverse any previously recorded allowance for loan losses; any remaining increases are recognized prospectively as interest income. The impacts of (i) prepayments, (ii) changes in variable interest rates, and (iii) any other changes in the timing of expected cash flows are recognized prospectively as adjustments to interest income. Disposals of loans, which may include sales of loans, receipt of payments in full by the borrower, or foreclosure, result in removal of the loan from the PCI portfolio. The aggregate of these three components results in our total allowance for loan losses.
50
Table of Contents
In the table below we have shown the components, as discussed above, of our allowance for loan losses at June 30, 2014 and December 31, 2013.
| June 30, 2014 | Dec 31, 2013 | increase (decrease) | ||||||||||||||||||||||||||||||||||
| loan | ALLL | loan | ALLL | loan | ALLL | |||||||||||||||||||||||||||||||
| balance | balance | % | balance | balance | % | balance | balance | |||||||||||||||||||||||||||||
| Non impaired loans |
$ | 1,240,084 | $ | 16,383 | 1.32 | % | $ | 1,218,648 | $ | 17,883 | 1.47 | % | $ | 21,436 | $ | (1,500 | ) | -15 bps | ||||||||||||||||||
| Gulfstream loans (note 1) |
299,823 | — | — | % | — | — | — | % | 299,823 | — | ||||||||||||||||||||||||||
| FSB loans (note 2) |
474,979 | — | — | % | — | — | — | % | 474,979 | — | ||||||||||||||||||||||||||
| Impaired loans |
27,263 | 1,857 | 6.81 | % | 24,110 | 1,811 | 7.51 | % | 3,153 | 46 | -70 bps | |||||||||||||||||||||||||
|
|
|
|
|
|
|
|
|
|
|
|
|
|
|
|
|
|
|
|||||||||||||||||||
| Non-PCI loans |
2,042,149 | 18,240 | 0.89 | % | 1,242,758 | 19,694 | 1.58 | % | 799,391 | (1,454 | ) | -69 bps | ||||||||||||||||||||||||
| PCI loans (note 3) |
353,870 | 960 | 231,421 | 760 | 122,449 | 200 | ||||||||||||||||||||||||||||||
|
|
|
|
|
|
|
|
|
|
|
|
|
|
|
|
|
|
|
|||||||||||||||||||
| Total loans |
$ | 2,396,019 | $ | 19,200 | 0.80 | %* | $ | 1,474,179 | $ | 20,454 | 1.39 | % | $ | 921,840 | $ | (1,254 | ) | -59 bps | ||||||||||||||||||
| * | The significant decrease in this ratio compared to the prior period end is primarily due to the addition of the Gulfstream and FSB loans. |
| note 1: | Loans acquired pursuant to the January 17, 2014 acquisition of Gulfstream that are not PCI loans. These are performing loans recorded at estimated fair value at the acquisition date. The fair value adjustment at the acquisition date was approximately $7,680, or approximately 2.3% of the outstanding aggregate loan balances. These amounts are accreted into interest income over the remaining lives of the related loans on a level yield basis. Because these loans were recorded at estimated fair value on January 17, 2014, no allowance for loan loss was recorded related to these loans at June 30, 2014. |
| note 2: | Loans acquired pursuant to the June 1, 2014 acquisition of FSB that are not PCI loans. These are performing loans recorded at estimated fair value at the acquisition date. The fair value adjustment at the acquisition date was approximately $10,081, or approximately 2.0% of the outstanding aggregate loan balances. This amount is accreted into interest income over the remaining lives of the related loans on a level yield basis. Because these loans were recorded at estimated fair value on June 1, 2014, no allowance for loan loss was recorded related to these loans at June 30, 2014. Included in the $474,979 of FSB non-PCI loans are $43,441 of loans that are covered by FDIC loss sharing agreements. |
| note 3: | Included in the $353,870 PCI loans at June 30, 2014 are $307,931 of loans that are covered by FDIC loss sharing agreements. |
The general loan loss allowance (non-impaired loans) decreased by a net amount of $1,500. This decrease was primarily due to the continued improvement in the local economy and real estate market, and the continued decline in the Company’s two year charge-off history. The Company’s other credit metrics, such as the levels of and trends in the Company’s non-performing loans, past-due loans and impaired loans were also considered when adjusting its qualitative factors, which ultimately increased the current two year historical loss factor ratios.
The specific loan loss allowance (impaired loans) is the aggregate of the results of individual analyses prepared for each one of the impaired loans, excluding PCI loans. The Company recorded partial charge offs in lieu of specific allowance for a number of the impaired loans. The Company’s impaired loans have been written down by $1,578 to $27,263 ($25,406 when the $1,857 specific allowance is considered) from their legal unpaid principal balance outstanding of $28,841. In the aggregate, total impaired loans have been written down to approximately 88% of their legal unpaid principal balance, and non-performing impaired loans have been written down to approximately 81% of their legal unpaid principal balance. The Company’s total non-performing loans (non-accrual loans plus loans past due greater than 90 days and still accruing, $29,667 at June 30, 2014) have been written down to approximately 81% of their legal unpaid principal balance.
Approximately $14,738 of the Company’s impaired loans (54%) are accruing performing loans. This group of impaired loans is not included in the Company’s non-performing loans or non-performing assets categories.
51
Table of Contents
PCI loans, including those covered by FDIC loss sharing agreements, are accounted for pursuant to ASC Topic 310-30. PCI loan pools are evaluated for impairment each quarter. If a pool is impaired, an allowance for loan loss is recorded.
The allowance is increased by the provision for loan losses, which is a charge to current period earnings and decreased by loan charge-offs net of recoveries of prior period loan charge-offs. Loans are charged against the allowance when management believes collection of the principal is unlikely. We believe our allowance for loan losses was adequate at June 30, 2014. However, we recognize that many factors can adversely impact various segments of the Company’s markets and customers, and therefore there is no assurance as to the amount of losses or probable losses which may develop in the future. The tables below summarize the changes in allowance for loan losses during the periods presented.
| Allowance for loan losses for loans that are not PCI loans |
Allowance for loan losses on PCI loans |
Total | ||||||||||
| Three months ended June 30, 2014 |
||||||||||||
| Balance at beginning of period |
$ | 18,913 | $ | 1,183 | $ | 20,096 | ||||||
| Loans charged-off |
(902 | ) | — | (902 | ) | |||||||
| Recoveries of loans previously charged-off |
112 | — | 112 | |||||||||
|
|
|
|
|
|
|
|||||||
| Net charge-offs |
(790 | ) | — | (790 | ) | |||||||
| Provision (recovery) for loan loss |
117 | (223 | ) | (106 | ) | |||||||
|
|
|
|
|
|
|
|||||||
| Balance at end of period |
$ | 18,240 | $ | 960 | $ | 19,200 | ||||||
|
|
|
|
|
|
|
|||||||
| Three months ended June 30, 2013 |
||||||||||||
| Balance at beginning of period |
$ | 22,631 | $ | 2,623 | $ | 25,254 | ||||||
| Loans charged-off |
(2,603 | ) | (515 | ) | (3,118 | ) | ||||||
| Recoveries of loans previously charged-off |
310 | — | 310 | |||||||||
|
|
|
|
|
|
|
|||||||
| Net charge-offs |
(2,293 | ) | (515 | ) | (2,808 | ) | ||||||
| Provision (recovery) for loan losses |
1,462 | (88 | ) | 1,374 | ||||||||
|
|
|
|
|
|
|
|||||||
| Balance at end of period |
$ | 21,800 | $ | 2,020 | $ | 23,820 | ||||||
|
|
|
|
|
|
|
|||||||
| Six months ended June 30, 2014 |
||||||||||||
| Balance at beginning of period |
$ | 19,694 | $ | 760 | $ | 20,454 | ||||||
| Loans charged-off |
(2,062 | ) | — | (2,062 | ) | |||||||
| Recoveries of loans previously charged-off |
955 | — | 955 | |||||||||
|
|
|
|
|
|
|
|||||||
| Net charge-offs |
(1,107 | ) | — | (1,107 | ) | |||||||
| Recovery for loan loss |
(347 | ) | 200 | (147 | ) | |||||||
|
|
|
|
|
|
|
|||||||
| Balance at end of period |
$ | 18,240 | $ | 960 | $ | 19,200 | ||||||
|
|
|
|
|
|
|
|||||||
| Six months ended June 30, 2013 |
||||||||||||
| Balance at beginning of period |
$ | 24,033 | $ | 2,649 | $ | 26,682 | ||||||
| Loans charged-off |
(3,834 | ) | (515 | ) | (4,349 | ) | ||||||
| Recoveries of loans previously charged-off |
473 | — | 473 | |||||||||
|
|
|
|
|
|
|
|||||||
| Net charge-offs |
(3,361 | ) | (515 | ) | (3,876 | ) | ||||||
| Provision (recovery) for loan losses |
1,128 | (114 | ) | 1,014 | ||||||||
|
|
|
|
|
|
|
|||||||
| Balance at end of period |
$ | 21,800 | $ | 2,020 | $ | 23,820 | ||||||
|
|
|
|
|
|
|
|||||||
52
Table of Contents
Nonperforming loans and nonperforming assets
Non performing loans exclude PCI loans and are defined as non accrual loans plus loans past due 90 days or more and still accruing interest. Generally, we place loans on non accrual status when they are past due 90 days and management believes the borrower’s financial condition, after giving consideration to economic conditions and collection efforts, is such that collection of interest is doubtful. When we place a loan on non accrual status, interest accruals cease and uncollected interest is reversed and charged against current income. Interest received on such loans is accounted for on the cash-basis or cost-recovery method, until qualifying for return to accrual. Loans are returned to accrual status when all the principal and interest amounts contractually due are brought current and future payments are reasonably assured. Non performing loans, as defined above, as a percentage of total non-PCI loans, were 1.45% at June 30, 2014, compared to 2.18% at December 31, 2013. The decrease in the ratio was due to the acquisition of non-PCI loans from Gulfstream and FSB during the six month period ending June 30, 2014.
Non performing assets, excluding assets covered by FDIC loss share agreements, (which we define as non performing loans, as defined above, plus (a) OREO (i.e., real estate acquired through foreclosure, in substance foreclosure, or deed in lieu of foreclosure); and (b) other repossessed assets that are not real estate), were $41,923 at June 30, 2014, compared to $33,636 at December 31, 2013. Non performing assets as a percentage of total assets were 1.07% at June 30, 2014, compared to 1.39% at December 31, 2013. The table below summarizes selected credit quality data at the dates indicated. The June 30, 2014 ratios were impacted by the FSB acquisition and the Gulfstream acquisition.
| 6/30/14 | 12/31/13 | |||||||
| Non-accrual loans (note 1) |
$ | 29,667 | $ | 27,077 | ||||
| Past due loans 90 days or more and still accruing interest (note 1) |
— | — | ||||||
|
|
|
|
|
|||||
| Total non-performing loans (“NPLs”) (note 1) |
29,667 | 27,077 | ||||||
| Other real estate owned (“OREO”) (note 2) |
12,123 | 6,409 | ||||||
| Repossessed assets other than real estate (note 1) |
133 | 150 | ||||||
|
|
|
|
|
|||||
| Total non-performing assets (“NPAs”) (note 2) |
$ | 41,923 | $ | 33,636 | ||||
| OREO covered by FDIC loss share agreements: |
||||||||
| 80% covered |
10,423 | 19,111 | ||||||
| 75% covered |
1,052 | — | ||||||
| 30% covered |
16,349 | — | ||||||
| 0% covered |
2,874 | — | ||||||
|
|
|
|
|
|||||
| Total non-performing assets including FDIC covered OREO |
$ | 72,621 | $ | 52,747 | ||||
| Non-performing loans as percentage of total loans excluding PCI loans |
1.45 | % | 2.18 | % | ||||
| Non-performing assets as percentage of total assets |
||||||||
| Excluding FDIC covered OREO |
1.07 | % | 1.39 | % | ||||
| Including FDIC covered OREO |
1.86 | % | 2.18 | % | ||||
| Non-performing assets as percentage of loans and OREO plus other repossessed assets (note 1) |
||||||||
| Excluding FDIC covered OREO |
2.04 | % | 2.69 | % | ||||
| Including FDIC covered OREO |
3.48 | % | 4.16 | % | ||||
| Loans past due 30 thru 89 days and accruing interest as a percentage of total loans (note 1) |
0.64 | % | 0.85 | % | ||||
| Allowance for loan losses as percentage of NPLs (note 1) |
61 | % | 73 | % | ||||
note 1: Excludes PCI loans.
note 2: Excludes OREO covered by FDIC loss share agreements.
53
Table of Contents
As shown in the table above, the largest component of non performing loans excluding loans covered by FDIC loss share agreements is non accrual loans. As of June 30, 2014 the Company had reported a total of 186 non accrual loans with an aggregate carrying value of $29,667 compared to December 31, 2013 when 191 non accrual loans with an aggregate book value of $27,077 were reported. This amount is further delineated by collateral category and number of loans in the table below.
| Collateral category |
total amount in thousands of dollars |
percentage of total non accrual loans |
number of non accrual loans in category |
|||||||||
| Residential real estate |
$ | 11,292 | 38 | % | 81 | |||||||
| Commercial real estate |
13,991 | 48 | % | 42 | ||||||||
| Land, development, construction |
1,900 | 6 | % | 14 | ||||||||
| Commercial |
2,216 | 7 | % | 26 | ||||||||
| Consumer, other |
268 | 1 | % | 23 | ||||||||
|
|
|
|
|
|
|
|||||||
| Total non accrual loans at June 30, 2014 |
$ | 29,667 | 100 | % | 186 | |||||||
|
|
|
|
|
|
|
|||||||
The second largest component of non performing assets after non accrual loans is OREO, excluding OREO covered by FDIC loss share agreements. At June 30, 2014, total OREO was $42,821. Of this amount, $30,698 is covered by FDIC loss sharing agreements. OREO not covered by FDIC loss share agreements is $12,123 at June 30, 2014. OREO is carried at the lower of cost or market less the estimated cost to sell. Further declines in real estate values can affect the market value of these assets. Any further decline in market value beyond its cost basis is recorded as a current expense in the Company’s Condensed Consolidated Statement of Earnings and Comprehensive Income. OREO is further delineated in the table below.
| Description of repossessed real estate |
carrying amount at June 30, 2014 |
|||
| 13 single family homes |
$ | 3,538 | ||
| 5 residential building lots |
751 | |||
| 10 commercial buildings |
4,092 | |||
| Land / various acreages |
3,742 | |||
|
|
|
|||
| Total, excluding OREO covered by FDIC loss share agreements |
$ | 12,123 | ||
Impaired loans are defined as loans that management has determined will not repay as agreed pursuant to the terms of the related loan agreement. Small balance homogeneous loans are not considered for impairment purposes. Once management has determined a loan is impaired, we perform a specific reserve analysis to determine if it is probable that we will eventually collect all contractual cash flows. If management determines that a shortfall is probable, then a specific valuation allowance is placed against the loan. This loan is then placed on non accrual basis, even if the borrower is current with his/her contractual payments, and will remain on non accrual until payments collected reduce the loan balance such that it eliminates the specific valuation allowance or equivalent partial charge-down or other economic conditions change. At June 30, 2014 we have identified a total of $27,263 impaired loans, excluding PCI loans. A specific valuation allowance of $1,857 has been attached to $9,599 of impaired loans included in the total $27,263 of impaired loans identified. It should also be noted that the total carrying balance of the impaired loans, or $27,263, has been partially charged down by $1,578 from their aggregate legal unpaid balance of $28,841. The table below summarizes impaired loan data for the periods presented.
| June 30, 2014 | Dec. 31,2013 | |||||||
| Impaired loans with a specific valuation allowance |
$ | 9,599 | $ | 9,454 | ||||
| Impaired loans without a specific valuation allowance |
17,664 | 14,656 | ||||||
|
|
|
|
|
|||||
| Total impaired loans |
$ | 27,263 | $ | 24,110 | ||||
| Amount of allowance for loan losses allocated to impaired loans |
$ | 1,857 | $ | 1,811 | ||||
| Performing TDRs (these are not included in NPLs) |
$ | 12,659 | $ | 10,763 | ||||
| Non performing TDRs (these are included in NPLs) |
2,281 | 4,684 | ||||||
|
|
|
|
|
|||||
| Total TDRs (these are included in impaired loans) |
14,940 | 15,447 | ||||||
| Impaired loans that are not TDRs |
12,323 | 8,663 | ||||||
|
|
|
|
|
|||||
| Total impaired loans |
$ | 27,263 | $ | 24,110 | ||||
|
|
|
|
|
|||||
54
Table of Contents
We continually analyze our loan portfolio in an effort to recognize and resolve problem assets as quickly and efficiently as possible. As of June 30, 2014, we believe the allowance for loan losses was adequate. However, we recognize that many factors can adversely impact various segments of the market. Accordingly, there is no assurance that losses in excess of such allowance will not be incurred.
Bank premises and equipment
Bank premises and equipment was $98,623 at June 30, 2014 compared to $96,619 at December 31, 2013, an increase of $2,004 or 2.1%. This amount is the result of branch real estate transferred to held for sale of $6,973 prior to impairment charges of $2,326, $5,781 of bank premises and equipment acquired from the Gulfstream acquisition, $2,877 of bank premises and equipment acquired from the FSB acquisition, and construction in progress along with other purchases net of disposals of $3,360 less $3,041 of depreciation expense.
A summary of our bank premises and equipment for the period end indicated is presented in the table below.
| June 30, 2014 | Dec. 31, 2013 | |||||||
| Land |
$ | 32,960 | $ | 32,591 | ||||
| Land improvements |
898 | 864 | ||||||
| Buildings |
55,733 | 56,651 | ||||||
| Leasehold improvements |
3,515 | 2,450 | ||||||
| Furniture, fixtures and equipment |
28,020 | 26,749 | ||||||
| Construction in progress |
8,156 | 5,828 | ||||||
|
|
|
|
|
|||||
| Subtotal |
129,282 | 125,133 | ||||||
| Less: accumulated depreciation |
30,659 | 28,514 | ||||||
|
|
|
|
|
|||||
| Total |
$ | 98,623 | $ | 96,619 | ||||
|
|
|
|
|
|||||
We have transferred branch real estate that is no longer in use to held for sale at estimated fair value less estimated cost to sell. Our branch real estate held for sale at June 30, 2014 and December 31, 2013 was $13,168 and $1,582, respectively. The increase was due to the seven branches and a stand-alone drive thru facility we consolidated and closed in April 2014 as part of our previously announced efficiency and enhanced profitability initiatives and certain branches we acquired from our FSB transaction that are scheduled to be sold and/or closed in September 2014. We have an agreement to sell five of these branches aggregating $6,332 which is expected to close in September 2014.
55
Table of Contents
Deposits
During the six month period ended June 30, 2014, we assumed deposits of $478,999 pursuant to the acquisition of Gulfstream on January 17, 2014 and $852,633 (including $189,674 of deposits held for sale) pursuant to the acquisition of First Southern on June 1, 2014. The acquisition of these deposits included approximately $84,995 and $218,057 of time deposits, respectively. During this period, our total deposits, excluding deposits held for sale, increased by $1,065,112 (time deposits increased by $141,438 and non-time deposits increased by $923,674). The cost of interest bearing deposits in the current quarter decreased by 1basis point (“bp”) to 32bps compared to the prior quarter. The overall cost of total deposits (i.e. includes non-interest bearing checking accounts) in the current quarter remained the same at 0.22% as in the prior quarter. The table below summarizes the Company’s deposit mix over the dates indicated, excluding the deposits held for sale.
| June 30, 2014 | % of total |
Dec 31, 2013 | % of total |
|||||||||||||
| Demand - non-interest bearing |
$ | 1,023,285 | 33 | % | $ | 644,915 | 31 | % | ||||||||
| Demand - interest bearing |
589,573 | 19 | % | 483,842 | 24 | % | ||||||||||
| Savings deposits |
234,492 | 7 | % | 232,942 | 11 | % | ||||||||||
| Money market accounts |
747,680 | 24 | % | 309,657 | 15 | % | ||||||||||
| Time deposits |
526,313 | 17 | % | 384,875 | 19 | % | ||||||||||
|
|
|
|
|
|
|
|
|
|||||||||
| Total deposits, excluding deposits held for sale |
$ | 3,121,343 | 100 | % | $ | 2,056,231 | 100 | % | ||||||||
| Deposits held for sale |
185,646 | — | ||||||||||||||
|
|
|
|
|
|||||||||||||
| Total deposits |
$ | 3,306,989 | $ | 2,056,231 | ||||||||||||
|
|
|
|
|
|||||||||||||
Securities sold under agreement to repurchase
Our subsidiary bank enters into borrowing arrangements with our retail business customers by agreements to repurchase (“securities sold under agreements to repurchase”) under which the bank pledges investment securities owned and under their control as collateral against the one-day borrowing arrangement. These short-term borrowings totaled $33,619 at June 30, 2014 compared to $20,457 at December 31, 2013.
Federal funds purchased
Federal funds purchased are overnight deposits from correspondent banks. Federal funds purchased acquired from other than our correspondent bank deposits are included with Federal Home Loan Bank advances and other borrowed funds as described below, if any. At June 30, 2014 we had $43,080 of correspondent bank deposits or federal funds purchased, compared to $29,909 at December 31, 2013.
Federal Home Loan Bank advances and other borrowed funds
From time to time, we borrow either through Federal Home Loan Bank advances or Federal Funds Purchased, other than correspondent bank deposits (i.e. federal funds purchased) listed above. At June 30, 2014 and December 31, 2013, there were no outstanding advances from the Federal Home Loan Bank.
Corporate debentures
We formed CenterState Banks of Florida Statutory Trust I (the “Trust”) for the purpose of issuing trust preferred securities. On September 22, 2003, we issued a floating rate corporate debenture in the
56
Table of Contents
amount of $10,000. The Trust used the proceeds from the issuance of a trust preferred security to acquire the corporate debenture of the Company. The trust preferred security essentially mirrors the corporate debenture, carrying a cumulative preferred dividend at a variable rate equal to the interest rate on the corporate debenture (three month LIBOR plus 305 bps). The corporate debenture and the trust preferred security each have 30-year lives. The trust preferred security and the corporate debenture are callable by the Company or the Trust, at their respective option, subject to prior approval by the Federal Reserve Board, if then required. The Company has treated the trust preferred security as Tier 1 capital up to the maximum amount allowed under the Federal Reserve guidelines for federal regulatory purposes.
In September 2004, Valrico Bancorp Inc. (“VBI”) formed Valrico Capital Statutory Trust (“Valrico Trust”) for the purpose of issuing trust preferred securities. On September 9, 2004, VBI issued a floating rate corporate debenture in the amount of $2,500. The Trust used the proceeds from the issuance of a trust preferred security to acquire the corporate debenture. On April 2, 2007, the Company acquired all the assets and assumed all the liabilities of VBI pursuant to the merger agreement, including VBI’s corporate debenture and related trust preferred security discussed above. The trust preferred security essentially mirrors the corporate debenture, carrying a cumulative preferred dividend at a variable rate equal to the interest rate on the corporate debenture (three month LIBOR plus 270 bps). The corporate debenture and the trust preferred security each have 30-year lives. The trust preferred security and the corporate debenture are callable by the Company or the Valrico Trust, at their respective option, subject to prior approval by the Federal Reserve, if then required. The Company has treated the trust preferred security as Tier 1 capital up to the maximum amount allowed under the Federal Reserve guidelines for federal regulatory purposes.
In November 2011, we acquired certain assets and assumed certain liabilities of Federal Trust Corporation (“FTC”) from The Hartford Financial Services Group, Inc. (“Hartford”) pursuant to an acquisition agreement, including FTC’s corporate debenture and related trust preferred security issued through FTC’s finance subsidiary Federal Trust Statutory Trust (“FTC Trust) in the amount of $5,000. The trust preferred security essentially mirrors the corporate debenture, carrying a cumulative preferred dividend at a variable rate equal to the interest rate on the corporate debenture (three month LIBOR plus 295 bps). The corporate debenture and the trust preferred security each have 30-year lives maturing in 2033. The trust preferred security and the corporate debenture are callable by the Company or the FTC Trust, at their respective option after five years, and sooner in specific events, subject to prior approval by the Federal Reserve, if then required. The Company has treated the corporate debenture as Tier 1 capital up to the maximum amount allowed under the Federal Reserve guidelines for federal regulatory purposes. The Company is not considered the primary beneficiary of this Trust (variable interest entity), therefore the trust is not consolidated in the Company’s financial statements, but rather the subordinated debentures are shown as a liability.
In January 2005, Gulfstream Bancshares, Inc. (“GBI”) formed Gulfstream Bancshares Capital Trust I (“GBI Trust I”) for the purpose of issuing trust preferred securities. On January 18, 2005, GBI issued a floating rate corporate debenture in the amount of $7,000. The Trust used the proceeds from the issuance of a trust preferred security to acquire the corporate debenture. The trust preferred security essentially mirrors the corporate debenture, carrying a cumulative preferred dividend at a variable rate equal to the interest rate on the corporate debenture (three month LIBOR plus 190 bps). The rate is subject to change quarterly. The corporate debenture and the trust preferred security each have 30-year lives. The trust preferred security and the corporate debenture are callable by the Company or the GBI Trust I, at their respective option, subject to prior approval by the Federal Reserve, if then required. On January 17, 2014, the Company acquired all the assets and assumed all the liabilities of GBI by merger, including GBI’s corporate debenture and related trust preferred security discussed above. The Company has treated the corporate debenture as Tier 1 capital up to the maximum amount allowed under the Federal Reserve guidelines for federal regulatory purposes.
57
Table of Contents
In March 2007, GBI formed Gulfstream Bancshares Capital Trust II (“GBI Trust II”) for the purpose of issuing trust preferred securities. On March 6, 2007, GBI issued a floating rate corporate debenture in the amount of $3,000. The Trust used the proceeds from the issuance of a trust preferred security to acquire the corporate debenture. The trust preferred security essentially mirrors the corporate debenture, carrying a cumulative preferred dividend at a variable rate equal to the interest rate on the corporate debenture (three month LIBOR plus 170 bps). The rate is subject to change quarterly. The corporate debenture and the trust preferred security each have 30-year lives. The trust preferred security and the corporate debenture are callable by the Company or the GBI Trust II, at their respective option, subject to prior approval by the Federal Reserve, if then required. On January 17, 2014, the Company acquired all the assets and assumed all the liabilities of GBI by merger, including GBI’s corporate debenture and related trust preferred security discussed above. The Company has treated the corporate debenture as Tier 1 capital up to the maximum amount allowed under the Federal Reserve guidelines for federal regulatory purposes.
Stockholders’ equity
Stockholders’ equity at June 30, 2014, was $439,458, or 11.3% of total assets, compared to $273,379, or 11.3% of total assets at December 31, 2013. The increase in stockholders’ equity was due to the following items:
| $ | 273,379 | Total stockholders’ equity at December 31, 2013 | ||
| 53,150 | Common stock issued pursuant to the Gulfstream acquisition | |||
| 3,617 | Gulfstream stock options converted to CenterState stock options | |||
| 100,639 | Common stock issued pursuant to the FSB acquisition | |||
| 2,090 | Net income during the period | |||
| (805 | ) | Dividends paid on common shares, $0.02 per common share | ||
| 6,076 | Net increase in market value of securities available for sale, net of deferred taxes | |||
| 894 | Stock options exercised, including tax benefit | |||
| 418 | Employee equity based compensation | |||
|
|
|
|||
| $ | 439,458 | Total stockholders’ equity at June 30, 2014 | ||
|
|
|
The federal bank regulatory agencies have established risk-based capital requirements for banks. These guidelines are intended to provide an additional measure of a bank’s capital adequacy by assigning weighted levels of risk to asset categories. Banks are also required to systematically maintain capital against such “off- balance sheet” activities as loans sold with recourse, loan commitments, guarantees and standby letters of credit. These guidelines are intended to strengthen the quality of capital by increasing the emphasis on common equity and restricting the amount of loan loss reserves and other forms of equity such as preferred stock that may be included in capital. As of June 30, 2014, our subsidiary bank exceeded the minimum capital levels to be considered “well capitalized” under the terms of the guidelines.
58
Table of Contents
Selected consolidated capital ratios at June 30, 2014 and December 31, 2013 for the Company and for the Company’s subsidiary bank, CenterState Bank of Florida, N.A., are presented in the tables below. There is no threshold for “well-capitalized” status for bank holding companies.
| CenterState Banks, Inc. (the Company) |
Actual | Capital Adequacy | Excess | |||||||||||||||||
| Amount | Ratio | Amount | Ratio | Amount | ||||||||||||||||
| June 30, 2014 |
||||||||||||||||||||
| Total capital (to risk weighted assets) |
$ | 360,345 | 15.1 | % | $ | 190,924 | > 8 | % | $ | 169,421 | ||||||||||
| Tier 1 capital (to risk weighted assets) |
341,145 | 14.3 | % | 95,462 | > 4 | % | 245,683 | |||||||||||||
| Tier 1 capital (to average assets) |
341,145 | 10.8 | % | 125,858 | > 4 | % | 215,287 | |||||||||||||
| December 31, 2013 |
||||||||||||||||||||
| Total capital (to risk weighted assets) |
$ | 262,701 | 17.9 | % | $ | 117,450 | > 8 | % | $ | 145,251 | ||||||||||
| Tier 1 capital (to risk weighted assets) |
244,323 | 16.6 | % | 58,725 | > 4 | % | 185,598 | |||||||||||||
| Tier 1 capital (to average assets) |
244,323 | 10.4 | % | 94,182 | > 4 | % | 150,141 | |||||||||||||
| CenterState Bank of Florida, N.A. |
Actual | Well capitalized | Excess | |||||||||||||||||
| Amount | Ratio | Amount | Ratio | Amount | ||||||||||||||||
| June 30, 2014 |
||||||||||||||||||||
| Total capital (to risk weighted assets) |
$ | 333,653 | 14.0 | % | $ | 238,800 | > 10 | % | $ | 94,853 | ||||||||||
| Tier 1 capital (to risk weighted assets) |
314,461 | 13.2 | % | 143,280 | > 6 | % | 171,181 | |||||||||||||
| Tier 1 capital (to average assets) |
314,461 | 9.9 | % | 158,917 | > 5 | % | 155,544 | |||||||||||||
| December 31, 2013 |
||||||||||||||||||||
| Total capital (to risk weighted assets) |
$ | 213,744 | 14.6 | % | $ | 146,277 | > 10 | % | $ | 67,467 | ||||||||||
| Tier 1 capital (to risk weighted assets) |
195,434 | 13.4 | % | 87,766 | > 6 | % | 107,668 | |||||||||||||
| Tier 1 capital (to average assets) |
195,434 | 8.3 | % | 117,444 | > 5 | % | 77,990 | |||||||||||||
In July 2013, the two federal banking regulatory agencies that have authority to regulate the Company’s capital resources and capital structure (the Board of Governors of the Federal Reserve System (FRB) and Federal Deposit Insurance Corporation (FDIC)) took action to finalize the application to the United States banking industry of new regulatory capital requirements that are established by the international banking framework commonly referred to as “Basel III” and to implement certain other changes required by the Dodd-Frank Wall Street Reform and Consumer Protection Act. As anticipated by management of the Company (see the related discussion included in Item 1 of the Company’s annual report on Form 10-K for the year 2013 filed in March 2014), these rules make significant changes to the U.S. bank regulatory capital framework, and generally increase capital requirements for banking organizations. However, in response to concerns expressed by community banks such as the Company, the final rules addressed previous concerns of community banks about the proposed rules’ regulatory capital treatment of trust preferred securities, unrealized gains and losses on available-for-sale securities in accumulated other comprehensive income (“AOCI”) and mortgage risk weights. Therefore, although the Company has not yet had the opportunity to analyze the final rules in detail in order to determine their likely impact upon the Company, and although management does continue to believe that such requirements will in general increase the amount of capital that the Company and the Bank may be required to maintain under these new standards, the Company believes that its prior concerns regarding volatility and trust preferred securities have been favorably addressed by the final rules. The Company does not presently expect that any materially burdensome compliance efforts with these final capital rules will be required of us prior to January 1, 2015.
59
Table of Contents
COMPARISON OF RESULTS OF OPERATIONS FOR THE THREE MONTH PERIODS ENDED June 30, 2014 AND 2013
Overview
We recognized net income of $1,037 or $0.03 per share basic and diluted for the three month period ended June 30, 2014, compared to net income of $2,758 or $0.09 per share basic and diluted for the same period in 2013. A summary of the differences are listed in the table below.
| 3 months ended June 30, 2014 |
3 months ended June 30, 2013 |
increase (decrease) |
||||||||||
| Net interest income |
$ | 31,257 | $ | 22,980 | $ | 8,277 | ||||||
| Provision for loan losses |
(106 | ) | 1,374 | (1,480 | ) | |||||||
|
|
|
|
|
|
|
|||||||
| Net interest income after loan loss provision |
31,363 | 21,606 | 9,757 | |||||||||
| Correspondent banking and capital markets division |
5,285 | 5,609 | (324 | ) | ||||||||
| Gain on sale of available for sale securities |
46 | 1,008 | (962 | ) | ||||||||
| Indemnification Asset (“IA”) amortization |
(5,006 | ) | (3,272 | ) | (1,734 | ) | ||||||
| FDIC revenue |
421 | 1,396 | (975 | ) | ||||||||
| All other non interest income |
5,626 | 5,122 | 504 | |||||||||
|
|
|
|
|
|
|
|||||||
| Total non interest income |
6,372 | 9,863 | (3,491 | ) | ||||||||
| Correspondent banking and capital markets division |
5,063 | 5,363 | (300 | ) | ||||||||
| Credit related expenses |
2,375 | 3,134 | (759 | ) | ||||||||
| All other non interest expense |
23,789 | 18,876 | 4,913 | |||||||||
| Merger related expenses |
4,897 | — | 4,897 | |||||||||
| Branch closure and efficiency initiatives |
29 | — | 29 | |||||||||
|
|
|
|
|
|
|
|||||||
| Total non interest expense |
36,153 | 27,373 | 8,780 | |||||||||
| Net income before provision for income taxes |
1,582 | 4,096 | (2,514 | ) | ||||||||
| Provision for income taxes |
545 | 1,338 | (793 | ) | ||||||||
|
|
|
|
|
|
|
|||||||
| Net income |
$ | 1,037 | $ | 2,758 | ($ | 1,721 | ) | |||||
|
|
|
|
|
|
|
|||||||
The primary differences between the two quarters presented above relate to our January 17, 2014 acquisition of Gulfstream and our June 1, 2014 acquisition of FSB. The increase in our net interest income relates primarily to the increase in our average interest earning assets as a result of these acquisitions. The increase in our non interest expense, which is basically the operating expenses of our commercial/retail banking segment, is also primarily due to these acquisitions. The other significant difference is the FSB merger related expenses. The Gulfstream merger related expenses were recognized in the first quarter of the year. These items along with others are discussed and analyzed below.
Net interest income/margin
Net interest income increased $8,277 or 36% to $31,257 during the three month period ended June 30, 2014 compared to $22,980 for the same period in 2013. The $8,277 increase was the result of an $8,592 increase in interest income and a $315 increase in interest expense.
Interest earning assets averaged $2,904,332 during the three month period ended June 30, 2014 as compared to $2,038,303 for the same period in 2013, an increase of $866,029, or 42.5%. The yield on average interest earning assets decreased 25bps to 4.57% (27bps to 4.62% tax equivalent basis) during the three month period ended June 30, 2014, compared to 4.82% (4.89% tax equivalent basis) for the same period in 2013. The combined effects of the $866,029 increase in average interest earning assets and the 25bps (27bps tax equivalent basis) decrease in yield on average interest earning assets resulted in the $8,592 ($8,654 tax equivalent basis) increase in interest income between the two periods.
60
Table of Contents
Interest bearing liabilities averaged $1,985,055 during the three month period ended June 30, 2014 as compared to $1,510,237 for the same period in 2013, an increase of $474,818 or 31.4%. The cost of average interest bearing liabilities decreased 3bps to 0.37% during the three month period ended June 30, 2014, compared to 0.40% for the same period in 2013. The combined effects of the $474,818 increase in average interest bearing liabilities and the 3bps decrease in cost of average interest bearing liabilities resulted in the $315 increase in interest expense between the two periods.
The table below summarizes the analysis of changes in interest income and interest expense for the three month periods ended June 30, 2014 and 2013 on a tax equivalent basis.
| Three months ended June 30, | ||||||||||||||||||||||||
| 2014 | 2013 | |||||||||||||||||||||||
| Average | Interest | Average | Average | Interest | Average | |||||||||||||||||||
| balance | inc / exp | rate | balance | inc / exp | rate | |||||||||||||||||||
| Loans (notes 1, 2, 8) |
$ | 1,723,242 | $ | 20,507 | 4.77 | % | $ | 1,153,194 | $ | 13,918 | 4.84 | % | ||||||||||||
| PCI loans (note 9) |
285,270 | 8,231 | 11.57 | % | 267,312 | 8,020 | 12.03 | % | ||||||||||||||||
| Securities- taxable |
571,813 | 3,809 | 2.67 | % | 392,974 | 2,097 | 2.14 | % | ||||||||||||||||
| Securities- tax exempt (note 8) |
39,112 | 512 | 5.25 | % | 44,841 | 566 | 5.06 | % | ||||||||||||||||
| Fed funds sold and other (note 3) |
284,895 | 424 | 0.60 | % | 179,982 | 228 | 0.51 | % | ||||||||||||||||
|
|
|
|
|
|
|
|
|
|
|
|
|
|||||||||||||
| Total interest earning assets |
2,904,332 | 33,483 | 4.62 | % | 2,038,303 | 24,829 | 4.89 | % | ||||||||||||||||
| Allowance for loan losses |
(20,052 | ) | (23,962 | ) | ||||||||||||||||||||
| All other assets |
386,383 | 367,969 | ||||||||||||||||||||||
|
|
|
|
|
|||||||||||||||||||||
| Total assets |
$ | 3,270,663 | $ | 2,382,310 | ||||||||||||||||||||
|
|
|
|
|
|||||||||||||||||||||
| Interest bearing deposits (note 4) |
1,882,384 | 1,523 | 0.32 | % | 1,433,806 | 1,330 | 0.37 | % | ||||||||||||||||
| Fed funds purchased |
46,426 | 5 | 0.04 | % | 35,619 | 6 | 0.07 | % | ||||||||||||||||
| Other borrowings (note 5) |
32,384 | 56 | 0.69 | % | 23,831 | 21 | 0.35 | % | ||||||||||||||||
| Corporate debenture (note 10) |
23,861 | 238 | 4.00 | % | 16,981 | 150 | 3.54 | % | ||||||||||||||||
|
|
|
|
|
|
|
|
|
|
|
|
|
|||||||||||||
| Total interest bearing liabilities |
1,985,055 | 1,822 | 0.37 | % | 1,510,237 | 1,507 | 0.40 | % | ||||||||||||||||
| Demand deposits |
906,746 | 574,345 | ||||||||||||||||||||||
| Other liabilities |
25,040 | 22,135 | ||||||||||||||||||||||
| Stockholders’ equity |
353,822 | 275,593 | ||||||||||||||||||||||
|
|
|
|
|
|||||||||||||||||||||
| Total liabilities and stockholders’ equity |
$ | 3,270,663 | $ | 2,382,310 | ||||||||||||||||||||
|
|
|
|
|
|||||||||||||||||||||
| Net interest spread (tax equivalent basis) (note 6) |
4.25 | % | 4.49 | % | ||||||||||||||||||||
|
|
|
|
|
|||||||||||||||||||||
| Net interest income (tax equivalent basis) |
$ | 31,661 | $ | 23,322 | ||||||||||||||||||||
|
|
|
|
|
|||||||||||||||||||||
| Net interest margin (tax equivalent basis) (note 7) |
4.37 | % | 4.59 | % | ||||||||||||||||||||
|
|
|
|
|
|||||||||||||||||||||
| note 1: | Loan balances are net of deferred origination fees and costs. |
| note 2: | Interest income on average loans includes amortization of loan fee recognition of $100 and $190 for the three month periods ended June 30, 2014 and 2013. |
| note 3: | Includes federal funds sold, interest earned on deposits at the Federal Reserve Bank and earnings on Federal Reserve Bank stock and Federal Home Loan Bank stock. |
| note 4: | Includes interest bearing deposits only. Non-interest bearing checking accounts are included in the demand deposits listed above. Also, includes net amortization of fair market value adjustments related to various acquisitions of time deposits of ($247) and ($122) for the three month periods ended June 30, 2014 and 2013. |
| note 5: | Includes securities sold under agreements to repurchase and Federal Home Loan Bank advances. |
| note 6: | Represents the average rate earned on interest earning assets minus the average rate paid on interest bearing liabilities. |
| note 7: | Represents net interest income divided by total interest earning assets. |
| note 8: | Interest income and rates include the effects of a tax equivalent adjustment using applicable statutory tax rates to adjust tax exempt interest income on tax exempt investment securities and loans to a fully taxable basis. |
| note 9: | PCI loans are accounted for pursuant to ASC 310-30. |
| note 10: | Includes amortization of fair value adjustments related to various acquisitions of corporate debentures of $44 and $7 for the three month periods ended June 30, 2014 and 2013. |
61
Table of Contents
Provision for loan losses
The provision for loan losses decreased $1,480 to $(106) during the three month period ending June 30, 2014 compared to a provision of $1,374 for the comparable period in 2013. Our policy is to maintain the allowance for loan losses at a level sufficient to absorb probable incurred losses in the loan portfolio. The allowance is increased by the provision for loan losses, which is a charge to current period earnings, and is decreased by charge-offs, net of recoveries on prior loan charge-offs. Therefore, the provision for loan losses (Income Statement effect) is a residual of management’s determination of allowance for loan losses (Balance Sheet approach). In determining the adequacy of the allowance for loan losses, we consider the conditions of individual borrowers, the historical loan loss experience, the general economic environment, the overall portfolio composition, and other information. As these factors change, the level of loan loss provision changes. Our loss factors associated with our general allowance for loan losses is the primary reason causing the decrease in our provision expense due to our continued improvement in substantially all of our credit metrics, in particular our historical loss factors which is a derivative of our historical charge-off rates. See “Credit quality and allowance for loan losses” for additional information regarding the allowance for loan losses.
Non-interest income
Non-interest income for the three months ended June 30, 2014 was $6,372 compared to $9,863 for the comparable period in 2013. This decrease was the result of the following components listed in the table below.
| Three month period ending: |
June 30, 2014 |
June 30, 2013 |
$ increase (decrease) |
% increase (decrease) |
||||||||||||
| Income from correspondent banking capital markets division |
$ | 4,192 | $ | 4,904 | $ | (712 | ) | (14.5 | %) | |||||||
| Other correspondent banking related revenue |
1,093 | 705 | 388 | 55.0 | % | |||||||||||
| Wealth management related revenue |
1,104 | 1,130 | (26 | ) | (2.3 | %) | ||||||||||
| Service charges on deposit accounts |
2,333 | 2,081 | 252 | 12.1 | % | |||||||||||
| Debit, prepaid, ATM and merchant card related fees |
1,495 | 1,342 | 153 | 11.4 | % | |||||||||||
| BOLI income |
356 | 338 | 18 | 5.3 | % | |||||||||||
| Other service charges and fees |
338 | 231 | 107 | 46.3 | % | |||||||||||
| Gain on sale of securities |
46 | 1,008 | (962 | ) | (95.4 | )% | ||||||||||
|
|
|
|
|
|
|
|
|
|||||||||
| Subtotal |
$ | 10,957 | $ | 11,739 | $ | (782 | ) | (6.7 | %) | |||||||
| FDIC indemnification asset-amortization(see explanation below) |
(5,006 | ) | (3,272 | ) | (1,734 | ) | 53.0 | % | ||||||||
| FDIC indemnification income |
421 | 1,396 | (975 | ) | (69.8 | %) | ||||||||||
|
|
|
|
|
|
|
|
|
|||||||||
| Total non-interest income |
$ | 6,372 | $ | 9,863 | $ | (3,491 | ) | (35.4 | %) | |||||||
|
|
|
|
|
|
|
|
|
|||||||||
When the estimate of future losses in our FDIC covered loans decrease (i.e. future cash flows increase), this increase in cash flows is accreted into interest income, increasing yields, over the remaining life of the related loan pool. The indemnification asset (“IA”) represents the amount that is expected to be collected from the FDIC for reimbursement of a percentage, as set forth in each of the individual agreements, of the estimated losses in the covered pools. When management decreases its estimate of future losses, the expected reimbursement from the FDIC, or IA, is decreased by this related covered percentage. The decrease in estimated reimbursements is expensed (negative accretion) over the lesser of the remaining expected life of the related loan pool(s) or the remaining term of the related loss share agreement(s), and is included in non-interest income as a negative amount.
At June 30, 2014, the total IA on our Condensed Consolidated Balance Sheet was $61,311. Of this amount, we expect to receive reimbursements from the FDIC of approximately $28,898 related to
62
Table of Contents
future estimated losses, and expect to write-off approximately $32,413 for previously estimated losses that are no longer expected. The $32,413 is now expected to be paid by the borrower (or realized upon the sale of OREO) instead of a reimbursement from the FDIC. At June 30, 2014, the $32,413 previously estimated reimbursements from the FDIC will be written off as expense (negative accretion) included in our non-interest income category of our Condensed Consolidated Statement of Earnings and Comprehensive Income as summarized below.
| Year |
Year |
|||||||||||
| 2014 (6 months) |
27.0 | % | 2018 |
6.2 | % | |||||||
| 2015 |
29.1 | % | 2019 |
5.4 | % | |||||||
| 2016 |
19.3 | % | 2020 thru 2022 |
4.9 | % | |||||||
|
|
|
|||||||||||
| 2017 |
8.1 | % | Total |
100.0 | % | |||||||
|
|
|
|||||||||||
When a FDIC covered OREO property is sold at a loss, the loss is included in non-interest expense as loss on sale of OREO, and the percentage of the loss that is covered by the FDIC is recorded as FDIC OREO indemnification income and included in non-interest income. When a FDIC covered loan pool is impaired, the impairment expense is included in loan loss provision expense, and the percentage of the impairment expense that is covered by the FDIC is recorded as FDIC pool impairment indemnification income and included in non-interest income.
Income from correspondent banking and capital markets division means commissions earned on fixed income security sales, fees from hedging services, loan brokerage fees and related consulting fees. This line item is volatile and will vary period to period based on sales volume.
Other correspondent banking related revenue means fees generated from safe-keeping activities, bond accounting services, asset/liability consulting fees, international wires, clearing and corporate checking account services and other correspondent banking related services.
63
Table of Contents
Non-interest expense
Non-interest expense for the three months ended June 30, 2014 increased $8,780, or 32.1%, to $36,153, compared to $27,373 for the same period in 2013. Components of our non-interest expenses are listed in the table below.
| Three month period ending: |
June 30, 2014 |
June 30, 2013 |
$ increase (decrease) |
% increase (decrease) |
||||||||||||
| Salaries and wages |
$ | 13,234 | $ | 12,142 | $ | 1,092 | 9.0 | % | ||||||||
| Incentive/bonus compensation |
1,276 | 1,171 | 105 | 9.0 | % | |||||||||||
| Stock based compensation |
182 | 143 | 39 | 27.3 | % | |||||||||||
| Employer 401K matching contributions |
374 | 308 | 66 | 21.4 | % | |||||||||||
| Deferred compensation expense |
160 | 134 | 26 | 19.4 | % | |||||||||||
| Health insurance and other employee benefits |
1,180 | 796 | 384 | 48.2 | % | |||||||||||
| Payroll taxes |
913 | 733 | 180 | 24.6 | % | |||||||||||
| Other employee related expenses |
401 | 344 | 57 | 16.6 | % | |||||||||||
| Incremental direct cost of loan origination |
(535 | ) | (537 | ) | 2 | (0.4 | %) | |||||||||
|
|
|
|
|
|
|
|
|
|||||||||
| Total salaries, wages and employee benefits |
17,185 | 15,234 | 1,951 | 12.8 | % | |||||||||||
|
|
|
|
|
|
|
|
|
|||||||||
| Loss on sale of OREO |
58 | 177 | (119 | ) | (67.2 | %) | ||||||||||
| Loss on sale of FDIC covered OREO |
321 | 386 | (65 | ) | (16.8 | %) | ||||||||||
| Valuation write down of OREO |
445 | 295 | 150 | 50.9 | % | |||||||||||
| Valuation write down of FDIC covered OREO |
440 | 1,385 | (945 | ) | (68.2 | %) | ||||||||||
| Loss on repossessed assets other than real estate |
19 | 104 | (85 | ) | (81.7 | %) | ||||||||||
| Foreclosure and repossession related expenses |
717 | 438 | 279 | 63.7 | % | |||||||||||
| Foreclosure and repo expense, FDIC (note 1) |
375 | 349 | 26 | 7.5 | % | |||||||||||
|
|
|
|
|
|
|
|
|
|||||||||
| Total credit related expenses |
2,375 | 3,134 | (759 | ) | (24.2 | %) | ||||||||||
|
|
|
|
|
|
|
|
|
|||||||||
| Occupancy expense |
2,479 | 1,942 | 537 | 27.6 | % | |||||||||||
| Depreciation of premises and equipment |
1,563 | 1,455 | 108 | 7.4 | % | |||||||||||
| Supplies, stationary and printing |
334 | 285 | 49 | 17.2 | % | |||||||||||
| Marketing expenses |
619 | 586 | 33 | 5.6 | % | |||||||||||
| Data processing expense |
1,306 | 912 | 394 | 43.2 | % | |||||||||||
| Legal, auditing and other professional fees |
1,376 | 844 | 532 | 63.0 | % | |||||||||||
| Bank regulatory related expenses |
753 | 635 | 118 | 18.6 | % | |||||||||||
| Postage and delivery |
365 | 267 | 98 | 36.7 | % | |||||||||||
| Debit, prepaid, ATM and merchant card related expenses |
468 | 427 | 41 | 9.6 | % | |||||||||||
| CDI and Trust intangible amortization |
515 | 302 | 213 | 70.5 | % | |||||||||||
| Internet and telephone banking |
415 | 239 | 176 | 73.6 | % | |||||||||||
| Operational write-offs and losses |
55 | 14 | 41 | 292.9 | % | |||||||||||
| Correspondent accounts and Federal Reserve charges |
152 | 120 | 32 | 26.7 | % | |||||||||||
| Conferences/Seminars/Education/Training |
98 | 138 | (40 | ) | (29.0 | %) | ||||||||||
| Director fees |
95 | 102 | (7 | ) | (6.9 | %) | ||||||||||
| Travel expenses |
106 | 104 | 2 | 1.9 | % | |||||||||||
| Other expenses |
968 | 633 | 335 | 52.9 | % | |||||||||||
|
|
|
|
|
|
|
|
|
|||||||||
| Subtotal |
31,227 | 27,373 | 3,854 | 14.1 | % | |||||||||||
| Merger related expenses |
4,897 | — | 4,897 | 100.0 | % | |||||||||||
| Branch closure and efficiency initiatives |
29 | — | 29 | 100.0 | % | |||||||||||
|
|
|
|
|
|
|
|
|
|||||||||
| Total non-interest expense |
$ | 36,153 | $ | 27,373 | $ | 8,780 | 32.1 | % | ||||||||
|
|
|
|
|
|
|
|
|
|||||||||
| note 1: | These are foreclosure and repossession related expenses related to FDIC covered assets, and are shown net of FDIC reimbursable amounts pursuant to FDIC loss share agreements. |
The overall increase in our non interest expense is primarily due to our January 17, 2014 acquisition of Gulfstream and our June 1, 2014 acquisition of FSB. The merger related expenses relate to the FSB acquisition. The majority of the Gulfstream merger related expenses were recognized during the first quarter of 2014.
64
Table of Contents
Provision for income taxes
We recognized an income tax provision for the three months ended June 30, 2014 of $545 on pre-tax income of $1,582 (an effective tax rate of 34.5%) compared to an income tax provision of $1,338 on pre-tax income of $4,096 (an effective tax rate of 32.7%) for the comparable quarter in 2013.
COMPARISON OF RESULTS OF OPERATIONS FOR THE SIX MONTH PERIODS ENDED June 30, 2014 AND 2013
Overview
We recognized net income of $2,090 or $0.06 per share basic and diluted for the six month period ended June 30, 2014, compared to net income of $7,334 or $0.24 per share basic and diluted for the same period in 2013. A summary of the differences are listed in the table below.
| 6 months ended June 30, 2014 |
6 months ended June 30, 2013 |
increase (decrease) |
||||||||||
| Net interest income |
$ | 59,450 | $ | 45,802 | $ | 13,648 | ||||||
| Provision for loan losses |
(147 | ) | 1,014 | (1,161 | ) | |||||||
|
|
|
|
|
|
|
|||||||
| Net interest income after loan loss provision |
59,597 | 44,788 | 14,809 | |||||||||
| Correspondent banking and capital markets division |
9,216 | 12,614 | (3,398 | ) | ||||||||
| Gain on sale of available for sale securities |
46 | 1,038 | (992 | ) | ||||||||
| Indemnification Asset (“IA”) amortization |
(10,191 | ) | (5,471 | ) | (4,720 | ) | ||||||
| FDIC revenue |
1,689 | 2,024 | (335 | ) | ||||||||
| All other non interest income |
11,372 | 9,937 | 1,435 | |||||||||
|
|
|
|
|
|
|
|||||||
| Total non interest income |
12,132 | 20,142 | (8,010 | ) | ||||||||
| Correspondent banking and capital markets division |
9,441 | 11,438 | (1,997 | ) | ||||||||
| Credit related expenses |
4,199 | 5,155 | (956 | ) | ||||||||
| All other non interest expense |
44,485 | 37,870 | 6,615 | |||||||||
| Merger related expenses |
7,244 | — | 7,244 | |||||||||
| Branch closure and efficiency initiatives |
3,187 | — | 3,187 | |||||||||
|
|
|
|
|
|
|
|||||||
| Total non interest expense |
68,556 | 54,463 | 14,093 | |||||||||
| Net income before provision for income taxes |
3,173 | 10,467 | (7,294 | ) | ||||||||
| Provision for income taxes |
1,083 | 3,133 | (2,050 | ) | ||||||||
|
|
|
|
|
|
|
|||||||
| Net income |
$ | 2,090 | $ | 7,334 | ($ | 5,244 | ) | |||||
|
|
|
|
|
|
|
|||||||
The primary differences between the two periods presented above relate to our January 17, 2014 acquisition of Gulfstream and our June 1, 2014 acquisition of FSB. The increase in our net interest income relates primarily to the increase in our average interest earning assets as a result of these acquisitions. The increase in our non interest expense, which is basically the operating expenses of our commercial/retail banking segment, is also primarily due to these acquisitions.
Other significant differences between the two periods are merger related expense from our two acquisitions in 2014 and one time charges related to our efficiency and enhanced profitability initiatives we announced in January 2014 which included impairment charges on branch real estate transferred to held for sale and severance payments related to our reduction in force.
65
Table of Contents
Another significant difference between the two periods, that is unrelated to our two acquisitions, is the increase in IA amortization which is due to our FDIC covered loans performing better than previously expected. Each calendar quarter we reforecast estimated expected future cash flows in our FDIC covered loans included in our PCI loan portfolio. As our estimates of future losses decrease, the estimates of future reimbursements from the FDIC included in our IA decreases resulting in writing down the previously expected reimbursements over the shorter of the remaining life of the related loan pool(s) or the remaining term of the related loss share agreement. These items along with others are discussed and analyzed below.
Net interest income/margin
Net interest income increased $13,648 or 30% to $59,450 during the six month period ended June 30, 2014 compared to $45,802 for the same period in 2013. The $13,648 increase was the result of a $13,996 increase in interest income and a $348 increase in interest expense.
Interest earning assets averaged $2,700,601 during the six month period ended June 30, 2014 as compared to $2,028,322 for the same period in 2013, an increase of $672,279, or 33.1%. The yield on average interest earning assets decreased 17bps to 4.69% (17bps to 4.75% tax equivalent basis) during the six month period ended June 30, 2014, compared to 4.86% (4.92% tax equivalent basis) for the same period in 2013. The combined effects of the $672,279 increase in average interest earning assets and the 17bps (17bps tax equivalent basis) decrease in yield on average interest earning assets resulted in the $13,996 ($14,168 tax equivalent basis) increase in interest income between the two periods.
Interest bearing liabilities averaged $1,867,254 during the six month period ended June 30, 2014 as compared to $1,527,288 for the same period in 2013, an increase of $339,966, or 22.3%. The cost of average interest bearing liabilities decreased 3bps to 0.37% during the six month period ended June 30, 2014, compared to 0.40% for the same period in 2013. The combined effects of the $339,966 increase in average interest bearing liabilities and the 3bps decrease in cost of average interest bearing liabilities resulted in the $348 increase in interest expense between the two periods.
66
Table of Contents
The table below summarizes the analysis of changes in interest income and interest expense for the six month periods ended June 30, 2014 and 2013 on a tax equivalent basis.
| Six months ended June 30, | ||||||||||||||||||||||||
| 2014 | 2013 | |||||||||||||||||||||||
| Average balance |
Interest inc / exp |
Average rate |
Average balance |
Interest inc / exp |
Average rate |
|||||||||||||||||||
| Loans (notes 1, 2, 8) |
$ | 1,618,732 | $ | 38,234 | 4.76 | % | $ | 1,143,175 | $ | 27,635 | 4.87 | % | ||||||||||||
| PCI loans (note 9) |
268,521 | 16,462 | 12.36 | % | 277,192 | 15,847 | 11.53 | % | ||||||||||||||||
| Securities- taxable |
532,507 | 7,286 | 2.76 | % | 405,017 | 4,485 | 2.23 | % | ||||||||||||||||
| Securities- tax exempt (note 8) |
39,196 | 1,024 | 5.27 | % | 43,942 | 1,108 | 5.08 | % | ||||||||||||||||
| Fed funds sold and other (note 3) |
241,645 | 663 | 0.55 | % | 158,996 | 426 | 0.54 | % | ||||||||||||||||
|
|
|
|
|
|
|
|
|
|
|
|
|
|||||||||||||
| Total interest earning assets |
2,700,601 | 63,669 | 4.75 | % | 2,028,322 | 49,501 | 4.92 | % | ||||||||||||||||
| Allowance for loan losses |
(20,508 | ) | (25,364 | ) | ||||||||||||||||||||
| All other assets |
391,226 | 383,068 | ||||||||||||||||||||||
|
|
|
|
|
|||||||||||||||||||||
| Total assets |
$ | 3,071,319 | $ | 2,386,026 | ||||||||||||||||||||
|
|
|
|
|
|||||||||||||||||||||
| Interest bearing deposits (note 4) |
1,768,726 | 2,860 | 0.33 | % | 1,448,079 | 2,713 | 0.38 | % | ||||||||||||||||
| Fed funds purchased |
44,224 | 11 | 0.05 | % | 40,115 | 11 | 0.06 | % | ||||||||||||||||
| Other borrowings (note 5) |
31,083 | 79 | 0.51 | % | 22,116 | 39 | 0.36 | % | ||||||||||||||||
| Corporate debenture (note 10) |
23,221 | 461 | 4.00 | % | 16,978 | 300 | 3.56 | % | ||||||||||||||||
|
|
|
|
|
|
|
|
|
|
|
|
|
|||||||||||||
| Total interest bearing liabilities |
1,867,254 | 3,411 | 0.37 | % | 1,527,288 | 3,063 | 0.40 | % | ||||||||||||||||
| Demand deposits |
837,720 | 560,041 | ||||||||||||||||||||||
| Other liabilities |
27,700 | 23,660 | ||||||||||||||||||||||
| Stockholders’ equity |
338,645 | 275,037 | ||||||||||||||||||||||
|
|
|
|
|
|||||||||||||||||||||
| Total liabilities and stockholders’ equity |
$ | 3,071,319 | $ | 2,386,026 | ||||||||||||||||||||
|
|
|
|
|
|||||||||||||||||||||
| Net interest spread (tax equivalent basis) (note 6) |
4.38 | % | 4.52 | % | ||||||||||||||||||||
|
|
|
|
|
|||||||||||||||||||||
| Net interest income (tax equivalent basis) |
$ | 60,258 | $ | 46,438 | ||||||||||||||||||||
|
|
|
|
|
|||||||||||||||||||||
| Net interest margin (tax equivalent basis) (note 7) |
4.50 | % | 4.62 | % | ||||||||||||||||||||
|
|
|
|
|
|||||||||||||||||||||
| note 1: | Loan balances are net of deferred origination fees and costs. |
| note 2: | Interest income on average loans includes amortization of loan fee recognition of $143 and $236 for the six month periods ended June 30, 2014 and 2013. |
| note 3: | Includes federal funds sold, interest earned on deposits at the Federal Reserve Bank and earnings on Federal Reserve Bank stock and Federal Home Loan Bank stock. |
| note 4: | Includes interest bearing deposits only. Non-interest bearing checking accounts are included in the demand deposits listed above. Also, includes net amortization of fair market value adjustments related to various acquisitions of time deposits of ($402) and ($301) for the six month periods ended June 30, 2014 and 2013. |
| note 5: | Includes securities sold under agreements to repurchase and Federal Home Loan Bank advances. |
| note 6: | Represents the average rate earned on interest earning assets minus the average rate paid on interest bearing liabilities. |
| note 7: | Represents net interest income divided by total interest earning assets. |
| note 8: | Interest income and rates include the effects of a tax equivalent adjustment using applicable statutory tax rates to adjust tax exempt interest income on tax exempt investment securities and loans to a fully taxable basis. |
| note 9: | PCI loans are accounted for pursuant to ASC 310-30. |
| note 10: | Includes amortization of fair value adjustments related to various acquisitions of corporate debentures of $88 and $13 for the six month periods ended June 30, 2014 and 2013. |
Provision for loan losses
The provision for loan losses decreased $1,161 to $(147) during the six month period ending June 30, 2014 compared to a provision of $1,014 for the comparable period in 2013. Our policy is to maintain the allowance for loan losses at a level sufficient to absorb probable incurred losses in the loan portfolio. The allowance is increased by the provision for loan losses, which is a charge to current period earnings, and is decreased by charge-offs, net of recoveries on prior loan charge-offs. Therefore, the provision for loan losses (Income Statement effect) is a residual of management’s determination of allowance for loan
67
Table of Contents
losses (Balance Sheet approach). In determining the adequacy of the allowance for loan losses, we consider the conditions of individual borrowers, the historical loan loss experience, the general economic environment, the overall portfolio composition, and other information. As these factors change, the level of loan loss provision changes. Our loss factors associated with our general allowance for loan losses is the primary reason causing the decrease in our provision expense due to our continued improvement in substantially all of our credit metrics, in particular our historical loss factors which is a derivative of our historical charge-off rates. See “Credit quality and allowance for loan losses” for additional information regarding the allowance for loan losses.
Non-interest income
Non-interest income for the six months ended June 30, 2014 was $12,132 compared to $20,142 for the comparable period in 2013. This decrease was the result of the following components listed in the table below.
| Six month period ending: |
June 30, 2014 |
June 30, 2013 |
$ increase (decrease) |
% increase (decrease) |
||||||||||||
| Income from correspondent banking capital markets division |
$ | 7,340 | $ | 11,044 | $ | (3,704 | ) | (33.5 | %) | |||||||
| Other correspondent banking related revenue |
1,876 | 1,570 | 306 | 19.5 | % | |||||||||||
| Wealth management related revenue |
2,321 | 2,200 | 121 | 5.5 | % | |||||||||||
| Service charges on deposit accounts |
4,595 | 3,900 | 695 | 17.8 | % | |||||||||||
| Debit, prepaid, ATM and merchant card related fees |
3,001 | 2,627 | 374 | 14.2 | % | |||||||||||
| BOLI income |
708 | 677 | 31 | 4.6 | % | |||||||||||
| Other service charges and fees |
747 | 533 | 214 | 40.2 | % | |||||||||||
| Gain on sale of securities |
46 | 1,038 | (992 | ) | (95.6 | %) | ||||||||||
|
|
|
|
|
|
|
|
|
|||||||||
| Subtotal |
$ | 20,634 | 23,589 | $ | (2,955 | ) | (12.5 | %) | ||||||||
| FDIC indemnification asset-amortization(see explanation below) |
(10,191 | ) | (5,471 | ) | (4,720 | ) | 86.3 | % | ||||||||
| FDIC indemnification income |
1,689 | 2,024 | (335 | ) | (16.6 | %) | ||||||||||
|
|
|
|
|
|
|
|
|
|||||||||
| Total non-interest income |
$ | 12,132 | $ | 20,142 | $ | (8,010 | ) | (39.8 | %) | |||||||
|
|
|
|
|
|
|
|
|
|||||||||
When the estimate of future losses in our FDIC covered loans decrease (i.e. future cash flows increase), this increase in cash flows is accreted into interest income, increasing yields, over the remaining life of the related loan pool. The indemnification asset (“IA”) represents the amount that is expected to be collected from the FDIC for reimbursement of a percentage, as set forth in each of the individual agreements, of the estimated losses in the covered pools. When management decreases its estimate of future losses, the expected reimbursement from the FDIC, or IA, is decreased by this related covered percentage. The decrease in estimated reimbursements is expensed (negative accretion) over the lesser of the remaining expected life of the related loan pool(s) or the remaining term of the related loss share agreement(s), and is included in non-interest income as a negative amount.
68
Table of Contents
At June 30, 2014, the total IA on our Condensed Consolidated Balance Sheet was $61,311. Of this amount, we expect to receive reimbursements from the FDIC of approximately $28,898 related to future estimated losses, and expect to write-off approximately $32,413 for previously estimated losses that are no longer expected. The $32,413 is now expected to be paid by the borrower (or realized upon the sale of OREO) instead of a reimbursement from the FDIC. At June 30, 2014, the $32,413 previously estimated reimbursements from the FDIC will be written off as expense (negative accretion) included in our non-interest income category of our Condensed Consolidated Statement of Earnings and Comprehensive Income as summarized below.
| Year |
Year |
|||||||||||
| 2014 (6 months) |
27.0 | % | 2018 |
6.2 | % | |||||||
| 2015 |
29.1 | % | 2019 |
5.4 | % | |||||||
| 2016 |
19.3 | % | 2020 thru 2022 |
4.9 | % | |||||||
|
|
|
|||||||||||
| 2017 |
8.1 | % | Total |
100.0 | % | |||||||
|
|
|
|||||||||||
When a FDIC covered OREO property is sold at a loss, the loss is included in non-interest expense as loss on sale of OREO, and the percentage of the loss that is covered by the FDIC is recorded as FDIC OREO indemnification income and included in non-interest income. When a FDIC covered loan pool is impaired, the impairment expense is included in loan loss provision expense, and the percentage of the impairment expense that is covered by the FDIC is recorded as FDIC pool impairment indemnification income and included in non-interest income.
Income from correspondent banking and capital markets division means commissions earned on fixed income security sales, fees from hedging services, loan brokerage fees and related consulting fees. This line item is volatile and will vary period to period based on sales volume.
Other correspondent banking related revenue means fees generated from safe-keeping activities, bond accounting services, asset/liability consulting fees, international wires, clearing and corporate checking account services and other correspondent banking related services.
69
Table of Contents
Non-interest expense
Non-interest expense for the six months ended June 30, 2014 increased $14,093, or 25.9%, to $68,556, compared to $54,463 for the same period in 2013. Components of our non-interest expenses are listed in the table below.
| Six month period ending: |
June 30, 2014 |
June 30, 2013 |
$ increase (decrease) |
% increase (decrease) |
||||||||||||
| Salaries and wages |
$ | 25,107 | $ | 24,807 | $ | 300 | 1.2 | % | ||||||||
| Incentive/bonus compensation |
2,514 | 2,265 | 249 | 11.0 | % | |||||||||||
| Stock based compensation |
369 | 289 | 80 | 27.7 | % | |||||||||||
| Employer 401K matching contributions |
734 | 675 | 59 | 8.7 | % | |||||||||||
| Deferred compensation expense |
267 | 275 | (8 | ) | (2.9 | %) | ||||||||||
| Health insurance and other employee benefits |
2,167 | 1,747 | 420 | 24.0 | % | |||||||||||
| Payroll taxes |
2,033 | 1,750 | 283 | 16.2 | % | |||||||||||
| Other employee related expenses |
659 | 640 | 19 | 3.0 | % | |||||||||||
| Incremental direct cost of loan origination |
(984 | ) | (974 | ) | (10 | ) | 1.0 | % | ||||||||
|
|
|
|
|
|
|
|
|
|||||||||
| Total salaries, wages and employee benefits |
32,866 | 31,474 | 1,392 | 4.4 | % | |||||||||||
|
|
|
|
|
|
|
|
|
|||||||||
| Loss on sale of OREO |
28 | 253 | (225 | ) | (88.9 | %) | ||||||||||
| Loss on sale of FDIC covered OREO |
428 | 309 | 119 | 38.5 | % | |||||||||||
| Valuation write down of OREO |
515 | 637 | (122 | ) | (19.2 | %) | ||||||||||
| Valuation write down of FDIC covered OREO |
1,390 | 2,030 | (640 | ) | (31.5 | %) | ||||||||||
| Loss on repossessed assets other than real estate |
17 | 346 | (329 | ) | (95.1 | %) | ||||||||||
| Loan put back expense |
— | 4 | (4 | ) | (100.0 | %) | ||||||||||
| Foreclosure and repossession related expenses |
1,202 | 879 | 323 | 36.7 | % | |||||||||||
| Foreclosure and repo expense, FDIC (note 1) |
619 | 697 | (78 | ) | (11.2 | %) | ||||||||||
|
|
|
|
|
|
|
|
|
|||||||||
| Total credit related expenses |
4,199 | 5,155 | (956 | ) | (18.5 | %) | ||||||||||
|
|
|
|
|
|
|
|
|
|||||||||
| Occupancy expense |
4.439 | 3,834 | 605 | 15.8 | % | |||||||||||
| Depreciation of premises and equipment |
3,041 | 2,952 | 89 | 3.0 | % | |||||||||||
| Supplies, stationary and printing |
561 | 573 | (12 | ) | (2.1 | %) | ||||||||||
| Marketing expenses |
1,239 | 1,114 | 125 | 11.2 | % | |||||||||||
| Data processing expense |
2,345 | 1,796 | 549 | 30.6 | % | |||||||||||
| Legal, auditing and other professional fees |
2,151 | 1,627 | 524 | 32.2 | % | |||||||||||
| Bank regulatory related expenses |
1,384 | 1,216 | 168 | 13.8 | % | |||||||||||
| Postage and delivery |
633 | 552 | 81 | 14.7 | % | |||||||||||
| Debit, prepaid, ATM and merchant card related expenses |
942 | 953 | (11 | ) | (1.2 | %) | ||||||||||
| CDI and Trust intangible amortization |
891 | 607 | 284 | 46.8 | % | |||||||||||
| Internet and telephone banking |
793 | 463 | 330 | 71.3 | % | |||||||||||
| Put-back option amortization |
— | 37 | (37 | ) | (100.0 | %) | ||||||||||
| Operational write-offs and losses |
91 | 30 | 61 | 203.3 | % | |||||||||||
| Correspondent accounts and Federal Reserve charges |
287 | 229 | 58 | 25.3 | % | |||||||||||
| Conferences/Seminars/Education/Training |
198 | 291 | (93 | ) | (32.0 | %) | ||||||||||
| Director fees |
210 | 204 | 6 | 2.9 | % | |||||||||||
| Travel expenses |
171 | 178 | (7 | ) | (3.9 | %) | ||||||||||
| Other expenses |
1,684 | 1,178 | 506 | 43.0 | % | |||||||||||
|
|
|
|
|
|
|
|
|
|||||||||
| Subtotal |
58,125 | 54,463 | 3,662 | 6.7 | % | |||||||||||
| Merger related expenses |
7,244 | — | 7,244 | 100.0 | % | |||||||||||
| Branch closure and efficiency initiatives |
3,187 | — | 3,187 | 100.0 | % | |||||||||||
|
|
|
|
|
|
|
|
|
|||||||||
| Total non-interest expense |
$ | 68,556 | $ | 54,463 | $ | 14,093 | 25.9 | % | ||||||||
|
|
|
|
|
|
|
|
|
|||||||||
| note 1: | These are foreclosure and repossession related expenses related to FDIC covered assets, and are shown net of FDIC reimbursable amounts pursuant to FDIC loss share agreements. |
The overall increase in our non interest expense is primarily due to our January 17, 2014 acquisition of Gulfstream and our June 1, 2014 acquisition of FSB. The merger related expenses relate to both of these acquisitions. The branch closure and efficiency initiatives expense relates to one-time charges including impairment expenses on closed branch property transferred to held for sale and severance payments from our reduction in force.
70
Table of Contents
Provision for income taxes
We recognized an income tax provision for the six months ended June 30, 2014 of $1,083 on pre-tax income of $3,173 (an effective tax rate of 34.1%) compared to an income tax provision of $3,133 on pre-tax income of $10,467 (an effective tax rate of 29.9%) for the comparable quarter in 2013
Liquidity
Liquidity is defined as the ability to meet anticipated customer demands for funds under credit commitments and deposit withdrawals at a reasonable cost and on a timely basis. We measure liquidity position by giving consideration to both on- and off-balance sheet sources of and demands for funds on a daily and weekly basis.
Our subsidiary bank regularly assesses the amount and likelihood of projected funding requirements through a review of factors such as historical deposit volatility and funding patterns, present and forecasted market and economic conditions, individual client funding needs, and existing and planned business activities. The subsidiary bank’s asset/liability committee (ALCO) provides oversight to the liquidity management process and recommends guidelines, subject to the approval of its board of directors, and courses of action to address actual and projected liquidity needs.
Short term sources of funding and liquidity include cash and cash equivalents, net of federal requirements to maintain reserves against deposit liabilities; investment securities eligible for pledging to secure borrowings from customers pursuant to securities sold under repurchase agreements; loan repayments; deposits and certain interest rate-sensitive deposits; and borrowings under overnight federal fund lines available from correspondent banks. In addition to interest rate-sensitive deposits, the primary demand for liquidity is anticipated fundings under credit commitments to customers.
Off-Balance Sheet Arrangements
We do not have any material off-balance sheet arrangements except for approved and unfunded loans and letters of credit to our customers in the ordinary course of business.
| ITEM 3. | QUANTITATIVE AND QUALITATIVE DISCLOSURES: MARKET RISK |
Market risk
We believe interest rate risk is the most significant market risk impacting us. We monitor and manage interest rate risk using interest rate sensitivity “gap” analysis to measure the impact of market interest rate changes on net interest income. See our Annual Report on Form 10-K for the fiscal year ended December 31, 2013 for disclosure of the quantitative and qualitative information regarding the interest rate risk inherent in interest rate risk sensitive instruments as of December 31, 2013. There have been no changes in the assumptions used in monitoring interest rate risk as of June 30, 2014. The impact of other types of market risk, such as foreign currency exchange risk and equity price risk, is deemed immaterial.
71
Table of Contents
| ITEM 4. | CONTROLS AND PROCEDURES |
As of the end of the period covered by this report, an evaluation was carried out under the supervision and with the participation of our management, including the Chief Executive Officer (CEO) and Chief Financial Officer (CFO), of the effectiveness of the design and operation of our disclosure controls and procedures (as defined in Rules 13a-15(e) or 15d-15(e)). Based on that evaluation, the CEO and CFO have concluded that our disclosure controls and procedures are effective to ensure that information required to be disclosed by us in reports that we file or submit under the Securities Exchange Act of 1934 are recorded, processed, summarized and reported within the time periods specified in Securities and Exchange Commission rules and forms. There was no change in our internal control over financial reporting (as defined in Rules 13a-15(f) or 15d-15(f)) during the quarter covered by this report that has materially affected, or is reasonably likely to materially affect, our internal control over financial reporting.
72
Table of Contents
| Item 1. | Legal Proceedings |
None.
| Item 1a. | Risk Factors |
There has been no material changes in our risk factors from our disclosure in Item 1A of our December 31, 2013 annual report on Form 10-K.
| Item 2. | Unregistered Sales of Equity Securities and Use of Proceeds |
None.
| Item 3. | Defaults Upon Senior Securities |
None.
| Item 4. | [Removed and Reserved] |
| Item 5. | Other Information |
Merger Related Litigation
As disclosed in Form 10-Q filed on May 6, 2014, a class action complaint was filed on April 24, 2014 in the Circuit Court of the 15th Judicial Circuit in and for Palm Beach County, Florida against First Southern Bancorp, Inc. (“First Southern”), its directors and CenterState challenging the merger of First Southern with CenterState. The complaint was subsequently withdrawn.
| Item 6. | Exhibits |
| Exhibit 31.1 |
The Chairman, President and Chief Executive Officer’s certification required under section 302 of the Sarbanes-Oxley Act of 2002 | |
| Exhibit 31.2 |
The Chief Financial Officer’s certification required under section 302 of the Sarbanes-Oxley Act of 2002 | |
| Exhibit 32.1 |
The Chairman, President and Chief Executive Officer’s certification required under section 906 of the Sarbanes-Oxley Act of 2002 | |
| Exhibit 32.2 |
The Chief Financial Officer’s certification required under section 906 of the Sarbanes-Oxley Act of 2002 | |
| Exhibit 101.1 |
Interactive Data File | |
| 101.INS |
XBRL Instance Document | |
| 101.SCH |
XBRL Schema Document | |
| 101.CAL |
XBRL Calculation Linkbase Document | |
| 101.DEF |
XBRL Definition Linkbase Document | |
| 101.LAB |
XBRL Label Linkbase Document | |
| 101.PRE |
XBRL Presentation Linkbase Document | |
73
Table of Contents
SIGNATURES
In accordance with the requirements of the Securities Exchange Act of 1934, the Registrant has duly caused this report to be signed on its behalf by the undersigned thereunto duly authorized.
CENTERSTATE BANKS, INC.
(Registrant)
| Date: | August 5, 2014 |
By: | /s/ Ernest S. Pinner | |||||
| Ernest S. Pinner | ||||||||
| Chairman, President and Chief Executive Officer | ||||||||
| Date: | August 5, 2014 |
By: | /s/ James J. Antal | |||||
| James J. Antal | ||||||||
| Senior Vice President and Chief Financial Officer | ||||||||
74