Attached files
| file | filename |
|---|---|
| EX-32 - EXHIBIT 32 - Mylan II B.V. | myl_ex32x20180930-10q.htm |
| EX-31.2 - EXHIBIT 31.2 - Mylan II B.V. | myl_ex312x20180930-10q.htm |
| EX-31.1 - EXHIBIT 31.1 - Mylan II B.V. | myl_ex311x20180930-10q.htm |
UNITED STATES SECURITIES AND EXCHANGE COMMISSION
Washington, DC 20549
Form 10-Q
þ | QUARTERLY REPORT PURSUANT TO SECTION 13 OR 15(d) OF THE SECURITIES EXCHANGE ACT OF 1934 |
For the quarterly period ended September 30, 2018
OR
¨ | TRANSITION REPORT PURSUANT TO SECTION 13 OR 15(d) OF THE SECURITIES EXCHANGE ACT OF 1934 |
For the transition period from_____________to___________
Commission File Number 333-199861
MYLAN N.V.
(Exact name of registrant as specified in its charter)
The Netherlands | 98-1189497 | |
(State or other jurisdiction of incorporation or organization) | (I.R.S. Employer Identification No.) | |
Building 4, Trident Place, Mosquito Way, Hatfield, Hertfordshire, AL10 9UL, England
(Address of principal executive offices)
+44 (0) 1707-853-000
(Registrant’s telephone number, including area code)
Indicate by check mark whether the registrant (1) has filed all reports required to be filed by Section 13 or 15(d) of the Securities Exchange Act of 1934 during the preceding 12 months (or for such shorter period that the registrant was required to file such reports), and (2) has been subject to such filing requirements for the past 90 days. Yes þ No ¨
Indicate by check mark whether the registrant has submitted electronically every Interactive Data File required to be submitted pursuant to Rule 405 of Regulation S-T (§ 232.405 of this chapter) during the preceding 12 months (or for such shorter period that the registrant was required to submit such files). Yes þ No ¨
Indicate by check mark whether the registrant is a large accelerated filer, an accelerated filer, a non-accelerated filer, smaller reporting company, or an emerging growth company. See the definitions of “large accelerated filer,” “accelerated filer,” “smaller reporting company,” and “emerging growth company” in Rule 12b-2 of the Exchange Act.
Large accelerated filer | þ | Accelerated filer | ¨ | |||
Non-accelerated filer | ¨ | Smaller reporting company | ¨ | |||
Emerging growth company | ¨ | |||||
If an emerging growth company, indicate by check mark if the registrant has elected not to use the extended transition period for complying with any new or revised financial accounting standards provided pursuant to Section 13(a) of the Exchange Act. ¨ | ||||||
Indicate by check mark whether the registrant is a shell company (as defined in Rule 12b-2 of the Exchange Act). Yes ¨ No þ
Indicate the number of shares outstanding of each of the issuer’s classes of common stock, as of the latest practicable date.
As of October 31, 2018, there were 515,631,491 of the issuer’s €0.01 nominal value ordinary shares outstanding.
MYLAN N.V. AND SUBSIDIARIES
INDEX TO FORM 10-Q
For the Quarterly Period Ended
September 30, 2018
Page | ||
PART I — FINANCIAL INFORMATION | ||
ITEM 1. | Condensed Consolidated Financial Statements (unaudited) | |
ITEM 2. | ||
ITEM 3. | ||
ITEM 4. | ||
PART II — OTHER INFORMATION | ||
ITEM 1. | ||
ITEM 1A. | ||
ITEM 5. | ||
ITEM 6. | ||
2
PART I — FINANCIAL INFORMATION
MYLAN N.V. AND SUBSIDIARIES
Condensed Consolidated Statements of Operations
(Unaudited; in millions, except per share amounts)
Three Months Ended | Nine Months Ended | ||||||||||||||
September 30, | September 30, | ||||||||||||||
2018 | 2017 | 2018 | 2017 | ||||||||||||
Revenues: | |||||||||||||||
Net sales | $ | 2,827.3 | $ | 2,956.3 | $ | 8,233.2 | $ | 8,570.2 | |||||||
Other revenues | 35.1 | 30.8 | 122.0 | 98.6 | |||||||||||
Total revenues | 2,862.4 | 2,987.1 | 8,355.2 | 8,668.8 | |||||||||||
Cost of sales | 1,823.2 | 1,809.0 | 5,369.2 | 5,180.3 | |||||||||||
Gross profit | 1,039.2 | 1,178.1 | 2,986.0 | 3,488.5 | |||||||||||
Operating expenses: | |||||||||||||||
Research and development | 144.1 | 182.3 | 555.7 | 580.9 | |||||||||||
Selling, general and administrative | 577.3 | 664.1 | 1,808.1 | 1,915.4 | |||||||||||
Litigation settlements and other contingencies, net | (20.4 | ) | 15.2 | (50.6 | ) | (25.8 | ) | ||||||||
Total operating expenses | 701.0 | 861.6 | 2,313.2 | 2,470.5 | |||||||||||
Earnings from operations | 338.2 | 316.5 | 672.8 | 1,018.0 | |||||||||||
Interest expense | 136.2 | 131.8 | 407.1 | 406.3 | |||||||||||
Other expense, net | 9.8 | 5.1 | 44.3 | 35.8 | |||||||||||
Earnings before income taxes | 192.2 | 179.6 | 221.4 | 575.9 | |||||||||||
Income tax provision (benefit) | 15.5 | 91.3 | (79.9 | ) | 124.2 | ||||||||||
Net earnings | $ | 176.7 | $ | 88.3 | $ | 301.3 | $ | 451.7 | |||||||
Earnings per ordinary share: | |||||||||||||||
Basic | $ | 0.34 | $ | 0.17 | $ | 0.59 | $ | 0.84 | |||||||
Diluted | $ | 0.34 | $ | 0.16 | $ | 0.58 | $ | 0.84 | |||||||
Weighted average ordinary shares outstanding: | |||||||||||||||
Basic | 514.5 | 535.2 | 514.4 | 534.9 | |||||||||||
Diluted | 516.5 | 537.0 | 516.5 | 537.0 | |||||||||||
See Notes to Condensed Consolidated Financial Statements
3
MYLAN N.V. AND SUBSIDIARIES
Condensed Consolidated Statements of Comprehensive Earnings
(Unaudited; in millions)
Three Months Ended | Nine Months Ended | ||||||||||||||
September 30, | September 30, | ||||||||||||||
2018 | 2017 | 2018 | 2017 | ||||||||||||
Net earnings | $ | 176.7 | $ | 88.3 | $ | 301.3 | $ | 451.7 | |||||||
Other comprehensive (loss) earnings, before tax: | |||||||||||||||
Foreign currency translation adjustment | (270.8 | ) | 423.0 | (1,097.6 | ) | 1,831.9 | |||||||||
Change in unrecognized (loss) gain and prior service cost related to defined benefit plans | (6.8 | ) | 1.1 | (8.3 | ) | 2.4 | |||||||||
Net unrecognized (loss) gain on derivatives in cash flow hedging relationships | (51.9 | ) | (4.5 | ) | (146.1 | ) | 29.2 | ||||||||
Net unrecognized gain (loss) on derivatives in net investment hedging relationships | 18.8 | (72.1 | ) | 78.7 | (203.2 | ) | |||||||||
Net unrealized (loss) gain on marketable securities | — | (8.9 | ) | (0.1 | ) | 3.5 | |||||||||
Other comprehensive (loss) earnings, before tax | (310.7 | ) | 338.6 | (1,173.4 | ) | 1,663.8 | |||||||||
Income tax (benefit) provision | (19.1 | ) | (5.8 | ) | (51.2 | ) | 11.3 | ||||||||
Other comprehensive (loss) earnings, net of tax | (291.6 | ) | 344.4 | (1,122.2 | ) | 1,652.5 | |||||||||
Comprehensive (loss) earnings | $ | (114.9 | ) | $ | 432.7 | $ | (820.9 | ) | $ | 2,104.2 | |||||
See Notes to Condensed Consolidated Financial Statements
4
MYLAN N.V. AND SUBSIDIARIES
Condensed Consolidated Balance Sheets
(Unaudited; in millions, except share and per share amounts)
September 30, 2018 | December 31, 2017 | ||||||
ASSETS | |||||||
Assets | |||||||
Current assets: | |||||||
Cash and cash equivalents | $ | 449.2 | $ | 292.1 | |||
Accounts receivable, net | 2,948.7 | 3,612.4 | |||||
Inventories | 2,560.6 | 2,542.7 | |||||
Prepaid expenses and other current assets | 583.2 | 766.1 | |||||
Total current assets | 6,541.7 | 7,213.3 | |||||
Property, plant and equipment, net | 2,119.6 | 2,339.1 | |||||
Intangible assets, net | 14,239.0 | 15,245.8 | |||||
Goodwill | 9,796.6 | 10,205.7 | |||||
Deferred income tax benefit | 514.0 | 496.8 | |||||
Other assets | 244.7 | 305.6 | |||||
Total assets | $ | 33,455.6 | $ | 35,806.3 | |||
LIABILITIES AND EQUITY | |||||||
Liabilities | |||||||
Current liabilities: | |||||||
Accounts payable | $ | 1,401.1 | $ | 1,452.5 | |||
Short-term borrowings | 0.4 | 46.5 | |||||
Income taxes payable | 75.7 | 112.9 | |||||
Current portion of long-term debt and other long-term obligations | 1,176.4 | 1,808.9 | |||||
Other current liabilities | 2,528.4 | 2,964.5 | |||||
Total current liabilities | 5,182.0 | 6,385.3 | |||||
Long-term debt | 13,291.4 | 12,865.3 | |||||
Deferred income tax liability | 1,764.4 | 2,012.4 | |||||
Other long-term obligations | 1,151.6 | 1,235.7 | |||||
Total liabilities | 21,389.4 | 22,498.7 | |||||
Equity | |||||||
Mylan N.V. shareholders’ equity | |||||||
Ordinary shares — nominal value €0.01 per ordinary share | |||||||
Shares authorized: 1,200,000,000 | |||||||
Shares issued: 539,104,104 and 537,902,426 as of September 30, 2018 and December 31, 2017 | 6.0 | 6.0 | |||||
Additional paid-in capital | 8,585.0 | 8,586.0 | |||||
Retained earnings | 5,965.8 | 5,644.5 | |||||
Accumulated other comprehensive loss | (1,490.9 | ) | (361.2 | ) | |||
13,065.9 | 13,875.3 | ||||||
Less: Treasury stock — at cost | |||||||
Ordinary shares: 23,490,867 and 13,695,251 as of September 30, 2018 and December 31, 2017 | 999.7 | 567.7 | |||||
Total equity | 12,066.2 | 13,307.6 | |||||
Total liabilities and equity | $ | 33,455.6 | $ | 35,806.3 | |||
See Notes to Condensed Consolidated Financial Statements
5
MYLAN N.V. AND SUBSIDIARIES
Condensed Consolidated Statements of Cash Flows
(Unaudited; in millions)
Nine Months Ended | |||||||
September 30, | |||||||
2018 | 2017 | ||||||
Cash flows from operating activities: | |||||||
Net earnings | $ | 301.3 | $ | 451.7 | |||
Adjustments to reconcile net earnings to net cash provided by operating activities: | |||||||
Depreciation and amortization | 1,501.0 | 1,279.8 | |||||
Share-based compensation (income) expense | (8.6 | ) | 64.2 | ||||
Deferred income tax (benefit) expense | (149.9 | ) | 17.4 | ||||
Loss from equity method investments | 58.6 | 77.2 | |||||
Other non-cash items | 238.3 | 265.4 | |||||
Litigation settlements and other contingencies, net | (40.9 | ) | (45.2 | ) | |||
Changes in operating assets and liabilities: | |||||||
Accounts receivable | 262.2 | 216.2 | |||||
Inventories | (425.5 | ) | (87.9 | ) | |||
Accounts payable | (14.1 | ) | (187.4 | ) | |||
Income taxes | (97.4 | ) | (149.3 | ) | |||
Other operating assets and liabilities, net | 80.6 | (332.8 | ) | ||||
Net cash provided by operating activities | 1,705.6 | 1,569.3 | |||||
Cash flows from investing activities: | |||||||
Cash paid for acquisitions, net | (65.9 | ) | (71.6 | ) | |||
Capital expenditures | (137.4 | ) | (156.4 | ) | |||
Proceeds from the sale of assets | — | 31.1 | |||||
Purchase of available for sale securities and other investments | (49.4 | ) | (8.9 | ) | |||
Proceeds from the sale of marketable securities | 72.1 | 8.9 | |||||
Payments for product rights and other, net | (854.2 | ) | (558.8 | ) | |||
Net cash used in investing activities | (1,034.8 | ) | (755.7 | ) | |||
Cash flows from financing activities: | |||||||
Proceeds from issuance of long-term debt | 2,577.7 | 555.8 | |||||
Payments of long-term debt | (2,598.6 | ) | (1,747.3 | ) | |||
Purchase of ordinary shares | (432.0 | ) | — | ||||
Change in short-term borrowings, net | (45.9 | ) | (48.3 | ) | |||
Taxes paid related to net share settlement of equity awards | (10.1 | ) | (7.4 | ) | |||
Contingent consideration payments | (0.2 | ) | (10.1 | ) | |||
Payments of financing fees | (20.8 | ) | (8.7 | ) | |||
Proceeds from exercise of stock options | 15.6 | 12.8 | |||||
Other items, net | (0.4 | ) | (0.7 | ) | |||
Net cash used in financing activities | (514.7 | ) | (1,253.9 | ) | |||
Effect on cash of changes in exchange rates | (22.9 | ) | 44.1 | ||||
Net increase (decrease) in cash, cash equivalents and restricted cash | 133.2 | (396.2 | ) | ||||
Cash, cash equivalents and restricted cash — beginning of period | 369.9 | 1,147.0 | |||||
Cash, cash equivalents and restricted cash — end of period | $ | 503.1 | $ | 750.8 | |||
See Notes to Condensed Consolidated Financial Statements
6
MYLAN N.V. AND SUBSIDIARIES
Notes to Condensed Consolidated Financial Statements (Unaudited)
1.General
The accompanying unaudited Condensed Consolidated Financial Statements (“interim financial statements”) of Mylan N.V. and subsidiaries (“Mylan” or the “Company”) were prepared in accordance with accounting principles generally accepted in the United States of America (“U.S. GAAP”) and the rules and regulations of the U.S. Securities and Exchange Commission (the “SEC”) for reporting on Form 10-Q; therefore, as permitted under these rules, certain footnotes and other financial information included in audited financial statements were condensed or omitted. The interim financial statements contain all adjustments (consisting of only normal recurring adjustments) necessary to present fairly the interim results of operations, comprehensive earnings, financial position and cash flows for the periods presented.
These interim financial statements should be read in conjunction with the Consolidated Financial Statements and Notes thereto in Mylan N.V.’s Annual Report on Form 10-K for the year ended December 31, 2017, as amended (the “2017 Form 10-K”). The December 31, 2017 Condensed Consolidated Balance Sheet was derived from audited financial statements.
The interim results of operations and comprehensive earnings for the three and nine months ended September 30, 2018, and cash flows for the nine months ended September 30, 2018 are not necessarily indicative of the results to be expected for the full fiscal year or any other future period. Certain prior year amounts have been reclassified to conform to the current year presentation.
2. | Revenue Recognition and Accounts Receivable |
On January 1, 2018, the Company adopted Accounting Standards Codification (“ASC”) Topic 606 Revenue from Contracts with Customers (“ASC 606”) using the modified retrospective method applied to those contracts which were not completed as of the date of adoption. Results for reporting periods beginning on January 1, 2018 are presented under ASC 606, while prior period amounts are not adjusted and continue to be reported in accordance with ASC Topic 605 Revenue Recognition (“ASC 605”). Under ASC 605, the Company recognized net sales when title and risk of loss passed to its customers and when provisions for estimates, as described below, were reasonably determinable.
Under ASC 606, the Company recognizes net revenue for product sales when control of the promised goods or services is transferred to our customers in an amount that reflects the consideration we expect to be entitled to in exchange for those goods or services. Revenues are recorded net of provisions for variable consideration, including discounts, rebates, governmental rebate programs, price adjustments, returns, chargebacks, promotional programs and other sales allowances. Accruals for these provisions are presented in the interim financial statements as reductions in determining net sales and as a contra asset in accounts receivable, net (if settled via credit) and other current liabilities (if paid in cash). The following briefly describes the nature of our provisions for variable consideration and how such provisions are estimated:
• | Chargebacks: the Company has agreements with certain indirect customers, such as independent pharmacies, managed care organizations, hospitals, nursing homes, governmental agencies and pharmacy benefit managers, which establish contract prices for certain products. The indirect customers then independently select a wholesaler from which to purchase the products at these contracted prices. Alternatively, certain wholesalers may enter into agreements with indirect customers that establish contract pricing for certain products, which the wholesalers provide. Under either arrangement, Mylan will provide credit to the wholesaler for any difference between the contracted price with the indirect party and the wholesaler’s invoice price. Such credits are called chargebacks. The provision for chargebacks is based on expected sell-through levels by our wholesaler customers to indirect customers, as well as estimated wholesaler inventory levels. |
• | Rebates, promotional programs and other sales allowances: this category includes rebate and other programs to assist in product sales. These programs generally provide that the customer receives credit directly related to the amount of purchases or credits upon the attainment of pre-established volumes. Also included in this category are prompt pay discounts, administrative fees and price adjustments to reflect decreases in the selling prices of products. |
• | Returns: consistent with industry practice, Mylan maintains a return policy that allows customers to return a product, which varies country by country in accordance with local practices, generally within a specified period prior (six months) and subsequent (twelve months) to the expiration date. The Company’s estimate of the provision for returns is generally based upon historical experience with actual returns. |
• | Governmental rebate programs: government reimbursement programs include Medicare, Medicaid, and State Pharmacy Assistance Programs established according to statute, regulations and policy. Manufacturers of |
7
MYLAN N.V. AND SUBSIDIARIES
Notes to Condensed Consolidated Financial Statements (Unaudited) - Continued
pharmaceutical products that are covered by the Medicaid program are required to pay rebates to each state based on a statutory formula set forth in the Social Security Act. Medicare beneficiaries are eligible to obtain discounted prescription drug coverage from private sector providers. In addition, certain states have also implemented supplemental rebate programs that obligate manufacturers to pay rebates in excess of those required under federal law. Our estimate of these rebates is based on the historical trends of rebates paid as well as on changes in wholesaler inventory levels and increases or decreases in the level of sales. Also, includes price reductions that are mandated by law outside of the U.S.
Wholesaler and distributor inventory levels of our products can fluctuate throughout the year due to the seasonality of certain products, the timing of product demand and other factors. Such fluctuations may impact the comparability of our net sales between periods.
Consideration received from licenses of intellectual property is recorded as revenue. Royalty or profit share amounts, which are based on sales of licensed products or technology, are recorded when the customer’s subsequent sales or usages occur. Such consideration is included in other revenue in the Consolidated Statements of Operations.
The Company elected to apply the following practical expedients and elections in connection with the adoption of ASC 606: i) taxes collected from customers and remitted to government authorities and that are related to the sales of the Company’s products, primarily in Europe, are excluded from revenues, and ii) shipping and handling activities are accounted for as fulfillment costs and are recorded in selling, general and administrative expense (“SG&A”). Payment terms related to product sales vary by jurisdiction and customer, but revenue for product sales has not been adjusted for the effects of a financing component as we expect that the period between when we transfer control of the product and when we receive payment to be one year or less.
8
MYLAN N.V. AND SUBSIDIARIES
Notes to Condensed Consolidated Financial Statements (Unaudited) - Continued
Revenue Disaggregation
The following table presents the Company’s net sales by therapeutic franchise for each of our reportable segments for the three and nine months ended September 30, 2018:
(In millions) | North America | Europe | Rest of World | Total | |||||||||||
Three Months Ended September 30, 2018 | |||||||||||||||
Central Nervous System & Anesthesia | $ | 154.7 | $ | 219.6 | $ | 92.4 | $ | 466.7 | |||||||
Infectious Disease | 63.1 | 157.8 | 223.2 | 444.1 | |||||||||||
Respiratory & Allergy | 161.8 | 94.8 | 47.4 | 304.0 | |||||||||||
Cardiovascular | 95.9 | 147.3 | 40.9 | 284.1 | |||||||||||
Gastroenterology | 24.5 | 150.0 | 91.1 | 265.6 | |||||||||||
Diabetes & Metabolism | 94.9 | 73.9 | 43.8 | 212.6 | |||||||||||
Dermatology | 86.7 | 62.8 | 18.0 | 167.5 | |||||||||||
Women’s Healthcare | 83.1 | 61.3 | 28.1 | 172.5 | |||||||||||
Oncology | 171.0 | 18.2 | 31.9 | 221.1 | |||||||||||
Immunology | 8.0 | 2.3 | 10.0 | 20.3 | |||||||||||
Other (1) | 68.6 | 53.3 | 146.9 | 268.8 | |||||||||||
Total | $ | 1,012.3 | $ | 1,041.3 | $ | 773.7 | $ | 2,827.3 | |||||||
Nine Months Ended September 30, 2018 | |||||||||||||||
Central Nervous System & Anesthesia | $ | 554.2 | $ | 665.7 | $ | 251.7 | $ | 1,471.6 | |||||||
Infectious Disease | 172.1 | 280.5 | 643.8 | 1,096.4 | |||||||||||
Respiratory & Allergy | 457.3 | 351.8 | 147.7 | 956.8 | |||||||||||
Cardiovascular | 262.4 | 443.2 | 126.6 | 832.2 | |||||||||||
Gastroenterology | 102.5 | 448.3 | 249.3 | 800.1 | |||||||||||
Diabetes & Metabolism | 318.6 | 227.9 | 102.1 | 648.6 | |||||||||||
Dermatology | 265.7 | 217.4 | 70.1 | 553.2 | |||||||||||
Women’s Healthcare | 261.4 | 198.1 | 69.5 | 529.0 | |||||||||||
Oncology | 382.5 | 55.4 | 95.6 | 533.5 | |||||||||||
Immunology | 36.1 | 7.3 | 29.1 | 72.5 | |||||||||||
Other (1) | 185.6 | 174.7 | 379.0 | 739.3 | |||||||||||
Total | $ | 2,998.4 | $ | 3,070.3 | $ | 2,164.5 | $ | 8,233.2 | |||||||
(1) | Other consists of numerous therapeutic franchises, none of which individually exceeds 5% of consolidated net sales. |
9
MYLAN N.V. AND SUBSIDIARIES
Notes to Condensed Consolidated Financial Statements (Unaudited) - Continued
Variable Consideration and Accounts Receivable
The following table presents a reconciliation of gross sales to net sales by each significant category of variable consideration during the three and nine months ended September 30, 2018:
(In millions) | Three Months Ended September 30, 2018 | Nine Months Ended September 30, 2018 | |||||
Gross sales | $ | 4,861.4 | $ | 14,419.0 | |||
Gross to net adjustments: | |||||||
Chargebacks | (835.7 | ) | (2,524.2 | ) | |||
Rebates, promotional programs and other sales allowances | (1,025.6 | ) | (3,144.2 | ) | |||
Returns | (59.4 | ) | (160.5 | ) | |||
Governmental rebate programs | (113.4 | ) | (356.9 | ) | |||
Total gross to net adjustments | $ | (2,034.1 | ) | $ | (6,185.8 | ) | |
Net sales | $ | 2,827.3 | $ | 8,233.2 | |||
No significant revisions were made to the methodology used in determining these provisions or the nature of the provisions during the three and nine months ended September 30, 2018. Such allowances were comprised of the following at September 30, 2018 and December 31, 2017, respectively:
(In millions) | September 30, 2018 | December 31, 2017 | |||||
Accounts receivable, net | $ | 1,642.2 | $ | 1,977.2 | |||
Other current liabilities | 631.9 | 818.0 | |||||
Total | $ | 2,274.1 | $ | 2,795.2 | |||
Accounts receivable, net was comprised of the following at September 30, 2018 and December 31, 2017, respectively:
(In millions) | September 30, 2018 | December 31, 2017 | |||||
Trade receivables, net | $ | 2,591.0 | $ | 3,173.1 | |||
Other receivables | 357.7 | 439.3 | |||||
Accounts receivable, net | $ | 2,948.7 | $ | 3,612.4 | |||
Through its wholly owned subsidiary Mylan Pharmaceuticals Inc. (“MPI”), the Company has access to a $400 million accounts receivable securitization facility (the “Receivables Facility”). The receivables underlying any borrowings are included in accounts receivable, net, in the Condensed Consolidated Balance Sheets. There were $464.0 million and $1.04 billion of securitized accounts receivable at September 30, 2018 and December 31, 2017, respectively.
3. | Recent Accounting Pronouncements |
Accounting Standards Issued Not Yet Adopted
In August 2018, the Financial Accounting Standards Board (the “FASB”) issued Accounting Standards Update 2018-14 (“ASU 2018-14”), Compensation-Retirement Benefits-Defined Benefit Plans-General (Subtopic 715-20): Disclosure Framework-Changes to the Disclosure Requirements for Defined Benefit Plans. ASU 2018-14 removes certain disclosures that are not considered cost beneficial, clarifies certain required disclosures and added additional disclosures. The new standard is effective for fiscal years, including interim periods within those fiscal years, beginning after December 15, 2020 with early adoption in any interim period permitted. The amendments in ASU 2018-14 would need to be applied on a retrospective basis. The Company is currently assessing the impact of the adoption of this guidance on its consolidated financial statements and disclosures.
10
MYLAN N.V. AND SUBSIDIARIES
Notes to Condensed Consolidated Financial Statements (Unaudited) - Continued
In August 2018, the FASB issued Accounting Standards Update 2018-13, Fair Value Measurement (Topic 820) Disclosure Framework—Changes to the Disclosure Requirements for Fair Value Measurement, which modifies the disclosure requirements on fair value measurements. The updated guidance is effective for fiscal years, and interim periods within those fiscal years, beginning after December 15, 2019. Early adoption is permitted for any removed or modified disclosures. The Company is currently assessing the impact of the adoption of this guidance on its consolidated financial statements and disclosures.
In June 2018, the FASB issued Accounting Standards Update 2018-07, Compensation - Stock Compensation (Topic 718): Improvements to Nonemployee Share-Based Payment Accounting, which expands the scope of Topic 718 to include share-based payment transactions for acquiring goods and services from nonemployees. The changes take effect for public companies for fiscal years starting after December 15, 2018, including interim periods within that fiscal year. Early adoption is permitted, but no earlier than an entity’s adoption date of ASC 606. The Company is currently assessing the impact of the adoption of this guidance on its consolidated financial statements and disclosures.
In February 2018, the FASB issued Accounting Standards Update 2018-02, Income Statement - Reporting Comprehensive Income, (Topic 220): Reclassification of Certain Tax Effects from Accumulated Other Comprehensive Income, which allows a reclassification from accumulated other comprehensive income to retained earnings for stranded tax effects resulting from the newly enacted federal corporate income tax rate under the comprehensive tax legislation enacted by the U.S. government on December 22, 2017 commonly referred to as the Tax Cuts and Jobs Act (the “Tax Act”). The amount of the reclassification would be the difference between the historical corporate income tax rate and the newly enacted 21% corporate income tax rate. The new standard is effective for fiscal years, including interim periods within those fiscal years, beginning after December 15, 2018 with early adoption in any interim period permitted. The Company is currently assessing the impact of the adoption of this guidance on its consolidated financial statements and disclosures.
In February 2016, the FASB issued Accounting Standards Update 2016-02, Leases (Topic 842) which supersedes FASB Topic 840, Leases (Topic 840) and provides principles for the recognition, measurement, presentation and disclosure of leases for both lessees and lessors. The new standard requires lessees to apply a dual approach, classifying leases as either finance or operating leases based on the principle of whether or not the lease is effectively a financed purchase by the lessee. This classification will determine whether lease expense is recognized based on an effective interest method or on a straight-line basis over the term of the lease, respectively. A lessee is also required to record a right-of-use asset and a lease liability for all leases with a term of greater than twelve months regardless of classification. Leases with a term of twelve months or less will be accounted for similar to existing guidance for operating leases. In July 2018, the FASB issued Accounting Standards Update 2018-10, Codification Improvements to Topic 842 (Leases), and Accounting Standards Update 2018-11, Leases (Topic 842), Targeted Improvements, which provide (i) narrow amendments to clarify how to apply certain aspects of the new lease standard, (ii) entities with an additional transition method to adopt the new standard, and (iii) lessors with a practical expedient for separating components of a contract. All Accounting Standards Updates related to Topic 842 will be effective for annual and interim periods beginning after December 15, 2018, with early adoption permitted upon issuance. While the Company is continuing to assess the impact of the adoption of this guidance on its consolidated financial statements and disclosures, we expect that the adoption will result in an increase in total assets and total liabilities. For reference, as disclosed in the 2017 Form 10-K, total undiscounted minimum lease payments remaining at December 31, 2017 were approximately $280 million. In addition, we expect to present additional qualitative and quantitative disclosures. The Company is in the process of analyzing its lease portfolio, implementing systems and processes and updating its accounting policies to comply with Topic 842.
Adoption of New Accounting Standards
In August 2017, the FASB issued Accounting Standards Update 2017-12, Derivatives and Hedging (Topic 815): Targeted Improvements to Accounting for Hedging Activities (“ASU 2017-12”). The objective of this update is to improve the financial reporting of hedging relationships to better portray the economic results of an entity’s risk management activities in its financial statements. The amendments in this update also make certain targeted improvements to simplify the application of the hedge accounting guidance in current U.S. GAAP based on feedback received from preparers, auditors, users, and other stakeholders. This guidance is effective for fiscal years beginning after December 15, 2018, and interim periods within those fiscal years, with early adoption permitted, including adoption in any interim period. The Company has elected to early adopt this guidance as of January 1, 2018 and is applying it on a prospective basis. Upon adoption, the Company recorded a cumulative effect adjustment.
In May 2017, the FASB issued Accounting Standards Update 2017-09, Compensation - Stock Compensation (Topic 718): Scope of Modification Accounting (“ASU 2017-09”), which amends the scope of modification accounting for share-based
11
MYLAN N.V. AND SUBSIDIARIES
Notes to Condensed Consolidated Financial Statements (Unaudited) - Continued
payment arrangements. ASU 2017-09 provides guidance on the types of changes to the terms or conditions of share-based payment awards to which an entity would be required to apply modification accounting under Topic 718. Specifically, an entity would not apply modification accounting if the fair value, vesting conditions and classification of the awards are the same immediately before and after the modification. As required, the Company applied the provisions of ASU 2017-09 on a prospective basis as of January 1, 2018 and the adoption did not have a material impact on its condensed consolidated financial statements.
In March 2017, the FASB issued Accounting Standards Update 2017-07, Compensation - Retirement Benefits (Topic 715): Improving the Presentation of Net Periodic Pension Cost and Net Periodic Postretirement Benefit Cost (“ASU 2017-07”), which requires companies to disaggregate the service cost component from the other components of net benefit cost and disclose the amount of net benefit cost that is included in the income statement or capitalized in assets, by line item. This guidance requires companies to report the service cost component in the same line item(s) as other compensation costs and to report other pension-related costs (which include interest costs, amortization of pension-related costs from prior periods and gains or losses on plan assets) separately and exclude them from the subtotal of operating income. This guidance also allows only the service cost component to be eligible for capitalization when applicable. This guidance is effective for fiscal years, and interim periods within those fiscal years, beginning after December 15, 2017. This guidance should be applied retrospectively for the presentation of the service cost component and the other components of net periodic pension cost and net periodic postretirement benefit cost in the income statement and prospectively, on and after the effective date, for the capitalization of the service cost component of net periodic pension cost and net periodic postretirement benefit in assets. The update allows a practical expedient that permits a company to use the amounts disclosed in its pension and other postretirement plan note for the prior comparative periods as the estimation basis for applying the retrospective presentation requirements. As required, the Company applied the provisions of ASU 2017-07 as of January 1, 2018 and the adoption did not have a material impact on its condensed consolidated financial statements.
In November 2016, the FASB issued Accounting Standards Update 2016-18, Statement of Cash Flows (Topic 230) Restricted Cash (“ASU 2016-18”), which requires that the reconciliation of the beginning of period and end of period amounts shown in the statement of cash flows include restricted cash and restricted cash equivalents. If restricted cash is presented separately from cash and cash equivalents on the balance sheet, companies will be required to reconcile the amounts presented on the statement of cash flows to the amounts on the balance sheet. This guidance is effective for fiscal years beginning after December 15, 2017, and interim periods within those fiscal years. As required, the Company applied the provisions of ASU 2016-18 as of January 1, 2018. As a result, the change in restricted cash has been excluded from investing activities and included in the change in cash, cash equivalents and restricted cash and the prior year period has been recast to reflect the new presentation.
In January 2016, the FASB issued Accounting Standards Update 2016-01, Financial Instruments—Overall (Subtopic 825-10): Recognition and Measurement of Financial Assets and Financial Liabilities (“ASU 2016-01”), which supersedes the current guidance to classify equity securities with readily determinable fair values into different categories and requires equity securities to be measured at fair value with changes in the fair value recognized through net income (loss). In February 2018, the FASB issued Accounting Standards Update 2018-03, Technical Corrections and Improvements to Financial Instruments—Overall (Subtopic 825-10): Recognition and Measurement of Financial Assets and Financial Liabilities, which clarifies the guidance in ASU 2016-01. The standards are effective for annual and interim periods beginning after December 15, 2017. As required, the Company applied the provisions of ASU 2016-01 as of January 1, 2018. Upon adoption, the Company recorded a cumulative effect adjustment.
In May 2014, the FASB issued Accounting Standards Update 2014-09 (“ASU 2014-09”), Revenue from Contracts with Customers (updated with Accounting Standards Update 2015-14, 2016-08, 2016-10, 2016-12 and 2016-20), which revises accounting guidance on revenue recognition that will supersede nearly all existing revenue recognition guidance under U.S. GAAP. The core principle of this guidance is that an entity should recognize revenue when it transfers promised goods or services to customers in an amount that reflects the consideration which the entity expects to receive in exchange for those goods or services. This guidance also requires additional disclosure about the nature, amount, timing and uncertainty of revenue and cash flows arising from customer contracts, including significant judgments and changes in judgments and assets recognized from costs incurred to obtain or fulfill a contract. This guidance is effective for fiscal years beginning after December 15, 2017, and for interim periods within those fiscal years, and can be applied using a full retrospective or modified retrospective approach. The Company adopted this standard and its updates as of January 1, 2018 and elected to apply the modified retrospective transition approach. As a result, the Company is recognizing revenue on certain arrangements upon the transfer of control of product shipments rather than upon sell-through by the customer, and is recording certain costs historically in cost of sales as contra revenue.
12
MYLAN N.V. AND SUBSIDIARIES
Notes to Condensed Consolidated Financial Statements (Unaudited) - Continued
The cumulative effect of the changes made to our consolidated January 1, 2018 balance sheet for the adoption of ASU 2014-09, ASU 2016-01 and ASU 2017-12 were as follows:
(In millions) | Balance as of December 31, 2017 | Adjustments Due to ASU 2014-09 | Adjustments Due to ASU 2016-01 | Adjustments Due to ASU 2017-12 | Balance as of January 1, 2018 | ||||||||||||||
Condensed Consolidated Balance Sheet | |||||||||||||||||||
Assets | |||||||||||||||||||
Prepaid expenses and other current assets | $ | 766.1 | $ | 18.5 | $ | — | $ | — | $ | 784.6 | |||||||||
Liabilities | |||||||||||||||||||
Deferred income tax liability | 2,012.4 | 5.7 | — | — | 2,018.1 | ||||||||||||||
Equity | |||||||||||||||||||
Retained earnings | 5,644.5 | 12.8 | 10.0 | (2.5 | ) | 5,664.8 | |||||||||||||
Accumulated other comprehensive loss | (361.2 | ) | — | (10.0 | ) | 2.5 | (368.7 | ) | |||||||||||
In accordance with ASU 2014-09, the disclosure of the impact of adoption on our condensed consolidated statements of operations and balance sheet was as follows:
For the Three Months Ended September 30, 2018 | |||||||||||
(In millions) | As Reported | Balances Without Adoption of ASC 606 | Effect of Change Increase (Decrease) | ||||||||
Condensed Consolidated Statement of Operations | |||||||||||
Revenues | $ | 2,862.4 | $ | 2,914.0 | $ | (51.6 | ) | ||||
Cost of sales | 1,823.2 | 1,876.4 | (53.2 | ) | |||||||
Income tax provision | 15.5 | 15.0 | 0.5 | ||||||||
Net earnings | 176.7 | 175.6 | 1.1 | ||||||||
For the Nine Months Ended September 30, 2018 | |||||||||||
(In millions) | As Reported | Balances Without Adoption of ASC 606 | Effect of Change Increase (Decrease) | ||||||||
Condensed Consolidated Statement of Operations | |||||||||||
Revenues | $ | 8,355.2 | $ | 8,454.0 | $ | (98.8 | ) | ||||
Cost of sales | 5,369.2 | 5,475.5 | (106.3 | ) | |||||||
Income tax benefit | (79.9 | ) | (82.3 | ) | 2.4 | ||||||
Net earnings | 301.3 | 296.2 | 5.1 | ||||||||
September 30, 2018 | |||||||||||
(In millions) | As Reported | Balances Without Adoption of ASC 606 | Effect of Change Increase (Decrease) | ||||||||
Condensed Consolidated Balance Sheet | |||||||||||
Prepaid expenses and other current assets | $ | 583.2 | $ | 575.7 | $ | 7.5 | |||||
Income taxes payable | 75.7 | 73.3 | 2.4 | ||||||||
Retained earnings | 5,965.8 | 5,960.7 | 5.1 | ||||||||
13
MYLAN N.V. AND SUBSIDIARIES
Notes to Condensed Consolidated Financial Statements (Unaudited) - Continued
4. | Acquisitions and Other Transactions |
Apicore Inc.
On October 3, 2017, the Company completed the acquisition of Apicore, Inc. (“Apicore”), a U.S. based developer and manufacturer of active pharmaceutical ingredient (“API”) for approximately $174.9 million, net of cash acquired, which included estimated contingent consideration of approximately $4.0 million related to the potential $15.0 million payment contingent on the achievement of certain 2017 financial results of the acquired business. As of December 31, 2017, the contingent consideration liability was zero as Apicore did not achieve the financial results that would have triggered the contingent consideration payment.
The allocation of the $174.9 million purchase price to the assets acquired and liabilities assumed for this business is as follows:
(In millions) | |||
Current assets (net of cash acquired) | $ | 6.5 | |
Identified intangible assets | 121.0 | ||
Goodwill | 92.2 | ||
Other assets | 1.9 | ||
Total assets acquired | 221.6 | ||
Current liabilities | (4.1 | ) | |
Deferred tax liabilities | (40.9 | ) | |
Other non-current liabilities | (1.7 | ) | |
Net assets acquired | $ | 174.9 | |
The acquisition of Apicore added a diversified portfolio of API products to the Company’s existing portfolio. The identified intangible assets of $121.0 million are comprised of product rights and licenses with a weighted average useful life of seven years and includes in-process research and development (“IPR&D”) with a fair value of $9.0 million at the date of the acquisition. Significant assumptions utilized in the valuation of identified intangible assets were based on company specific information and projections which are not observable in the market and are thus considered Level 3 measurements as defined by U.S. GAAP. The goodwill of $92.2 million arising from the acquisition consisted largely of the value of the employee workforce and the expected value of products to be developed in the future. All of the goodwill was allocated to the North America segment. None of the goodwill recognized in this transaction is currently expected to be deductible for income tax purposes. The acquisition did not have a material impact on the Company’s results of operations since the acquisition date or on a pro forma basis for the three and nine months ended September 30, 2018 and 2017.
Other Transactions
On December 25, 2017, the Company entered into an agreement to reacquire certain intellectual property rights and marketing authorizations related to a product commercialized in Japan for $90.0 million, which was paid during the second quarter of 2018. The Company recognized a liability in its Condensed Consolidated Balance Sheet as of December 31, 2017 for the reacquisition of these rights. The Company accounted for this transaction as an asset acquisition and the asset is being amortized over a useful life of five years.
On February 28, 2018, the Company and Revance Therapeutics, Inc. (“Revance”) entered into a collaboration agreement (the “Revance Collaboration Agreement”) pursuant to which the Company and Revance will collaborate exclusively, on a world-wide basis (excluding Japan), to develop, manufacture and commercialize a biosimilar to the branded biologic product (onabotulinumtoxinA) marketed as BOTOX®.
Under the Revance Collaboration Agreement, the Company will be primarily responsible for (a) clinical development activities outside of North America (excluding Japan) (the “ex-U.S. Mylan territories”), (b) regulatory activities, and (c) commercialization for any approved product. Revance will be primarily responsible for (a) non-clinical development activities, (b) clinical development activities in North America, and (c) manufacturing and supply of clinical drug substance and drug product; Revance will be solely responsible for an initial portion of non-clinical development costs. The remaining portion of any non-clinical development costs and clinical development costs for obtaining approval in the U.S. and Europe
14
MYLAN N.V. AND SUBSIDIARIES
Notes to Condensed Consolidated Financial Statements (Unaudited) - Continued
will be shared equally between the parties, and the Company will be responsible for all other clinical development costs and commercialization expenses. Upon closing, Revance received a non-refundable upfront payment of $25.0 million. In addition, under the Revance Collaboration Agreement, Revance can receive potential development milestone payments of up to $100.0 million, in the aggregate, upon the achievement of specified clinical and regulatory milestones and potential tiered sales milestones of up to $225.0 million. In addition, Mylan will pay Revance royalties on sales of the biosimilar in the ex-U.S. Mylan territories. The Company accounted for this transaction as an asset acquisition of IPR&D and the total upfront payment was expensed as a component of research and development (“R&D”) expense.
On August 31, 2018, the Company completed an agreement with certain subsidiaries of Novartis AG (“Novartis”) to purchase the worldwide rights to their global cystic fibrosis products consisting of the TOBI Podhaler® and TOBI® solution. Tobramycin is the standard of care for treatment of pseudomonas aeruginosa, a leading driver of infection in cystic fibrosis. These products further strengthen our existing presence in cystic fibrosis, especially with our Creon Franchise in Europe, Australia, Japan and Canada. The asset acquisition allows us to further extend our respiratory franchise into rare/orphan disease indications and broaden our portfolio into dry powdered inhalers and nebulized products. Tobi Podhaler™ is manufactured using a proprietary Pulmosphere technology for which we have acquired exclusive rights for use, hence we expect a high barrier for generic entry.
Under the terms of the agreement, Novartis is owed fixed consideration of $463.0 million which consists of $240.0 million which was paid at closing and deferred payments of $130.0 million included in other current liabilities and $93.0 million included in other long-term obligations, due in 2019 and 2020, respectively. Novartis is also eligible to receive a contingent payment of up to $20 million. The Company also entered into a supply agreement with Novartis to purchase the products for up to three years from the date of closing. The Company has recorded a liability of approximately $91 million related to supply obligations.
The Company accounted for this transaction as an asset acquisition and recognized an intangible asset for the product rights of $574.8 million. The intangible asset is being amortized over a useful life of ten years.
During the nine months ended September 30, 2018, the Company completed four agreements to acquire certain intellectual property rights and marketing authorizations for products that were in the development stage, including agreements with Fujifilm Kyowa Kirin Biologics Co., Ltd., Mapi Pharma Ltd., and Lupin Limited. The Company also completed the acquisition of intellectual property rights and marketing authorizations related to a commercialized product in certain rest of world markets for $220.0 million, of which $160.0 million was paid at closing with the remaining amount due within twelve months of the closing of the transaction and included in other current liabilities. The Company is accounting for these transactions as asset acquisitions and a useful life of five years is being used to amortize the asset related to the commercialized product. The Company recorded expense of approximately $53.7 million as a component of R&D expense related to non-refundable upfront payments for agreements for products in development during the nine months ended September 30, 2018. Certain of the agreements include additional development and commercial milestones.
5. | Share-Based Incentive Plan |
The Company’s shareholders have approved the 2003 Long-Term Incentive Plan (as amended, the “2003 Plan”). Under the 2003 Plan, 55,300,000 ordinary shares are reserved for issuance to key employees, consultants, independent contractors and non-employee directors of the Company through a variety of incentive awards, including: stock options, stock appreciation rights (“SAR”), restricted ordinary shares, restricted stock units, performance awards (“PSU”), other stock-based awards and short-term cash awards. Stock option awards are granted with an exercise price equal to the fair market value of the ordinary shares underlying the stock options at the date of the grant, generally become exercisable over periods ranging from three to four years, and generally expire in ten years. Since approval of the 2003 Plan, no further grants of stock options have been made under any other previous plan.
15
MYLAN N.V. AND SUBSIDIARIES
Notes to Condensed Consolidated Financial Statements (Unaudited) - Continued
The following table summarizes stock option and SAR (together, “stock awards”) activity:
Number of Shares Under Stock Awards | Weighted Average Exercise Price per Share | |||||
Outstanding at December 31, 2017 | 7,198,684 | $ | 35.17 | |||
Granted | 847,590 | 40.92 | ||||
Exercised | (720,226 | ) | 21.77 | |||
Forfeited | (286,473 | ) | 48.37 | |||
Outstanding at September 30, 2018 | 7,039,575 | $ | 36.69 | |||
Vested and expected to vest at September 30, 2018 | 6,821,737 | $ | 36.48 | |||
Exercisable at September 30, 2018 | 5,335,545 | $ | 34.76 | |||
As of September 30, 2018, stock awards outstanding, stock awards vested and expected to vest and stock awards exercisable had average remaining contractual terms of 5.5 years, 5.4 years and 4.4 years, respectively. Also, at September 30, 2018, stock awards outstanding, stock awards vested and expected to vest and stock awards exercisable each had an aggregate intrinsic value of $41.1 million, $41.1 million and $40.9 million, respectively.
A summary of the status of the Company’s nonvested restricted ordinary shares and restricted stock unit awards, including PSUs (collectively, “restricted stock awards”), as of September 30, 2018 and the changes during the nine months ended September 30, 2018 are presented below:
Number of Restricted Stock Awards | Weighted Average Grant-Date Fair Value per Share | |||||
Nonvested at December 31, 2017 | 5,964,207 | $ | 41.92 | |||
Granted | 1,542,727 | 41.03 | ||||
Released | (682,557 | ) | 50.06 | |||
Forfeited | (257,208 | ) | 44.88 | |||
Nonvested at September 30, 2018 | 6,567,169 | $ | 40.79 | |||
As of September 30, 2018, the Company had $99.1 million of total unrecognized compensation expense, net of estimated forfeitures, related to all of its stock-based awards, which we expect to recognize over the remaining weighted average vesting period of 1.6 years. The total intrinsic value of stock awards exercised and restricted stock units released during the nine months ended September 30, 2018 and 2017 was $42.8 million and $34.7 million, respectively.
In February 2014, Mylan’s Compensation Committee and the independent members of the Board of Directors adopted the One-Time Special Performance-Based Five-Year Realizable Value Incentive Program (the “2014 Program”) under the 2003 Plan. Under the 2014 Program, certain key employees received a one-time, performance-based incentive award (the “Awards”) either in the form of a grant of SARs or PSUs. The initial Awards were granted in February 2014 and contain a five-year cliff-vesting feature based on the achievement of various performance targets, external market conditions and the employee’s continued services. Additional Awards were granted in 2016 and 2017 and are subject to the same performance conditions as the Awards granted in February 2014 and with a service vesting condition of between two and six years. The market condition was met on June 10, 2015 and is therefore no longer applicable to any of the Awards. During the three months ended June 30, 2018, the Company revised its estimates for the amount of Awards that it expects will ultimately vest under the 2014 Program and recognized a reduction in share-based compensation expense of approximately $23.5 million. During the three months ended September 30, 2018, the Company determined that it was no longer probable that the minimum performance condition would be met and therefore reversed all of the remaining cumulative expense related to the Awards resulting in a reduction in share-based compensation expense of approximately $47.1 million. In addition, during the three months ended September 30, 2018, the Company recorded $20.0 million of compensation expense as an additional discretionary bonus for a certain group of employees. None of the employees who will receive this bonus are named executive officers. As of September 30, 2018, there are approximately 2.6 million Awards outstanding under the 2014 Program. Each Award is equal to one ordinary share with the maximum value of each Award upon vesting subject to varying limitations.
16
MYLAN N.V. AND SUBSIDIARIES
Notes to Condensed Consolidated Financial Statements (Unaudited) - Continued
6. | Pensions and Other Postretirement Benefits |
Defined Benefit Plans
The Company sponsors various defined benefit pension plans in several countries. Benefits provided generally depend on length of service, pay grade and remuneration levels. The Company maintains two fully frozen defined benefit pension plans in the U.S., and employees in the U.S. and Puerto Rico are generally provided retirement benefits through defined contribution plans.
The Company also sponsors other postretirement benefit plans including plans that provide for postretirement supplemental medical coverage. Benefits from these plans are provided to employees and their spouses and dependents who meet various minimum age and service requirements. In addition, the Company sponsors other plans that provide for life insurance benefits and postretirement medical coverage for certain officers and management employees.
Net Periodic Benefit Cost
Components of net periodic benefit cost for the three and nine months ended September 30, 2018 and 2017 were as follows:
Pension and Other Postretirement Benefits | |||||||||||||||
Three Months Ended | Nine Months Ended | ||||||||||||||
September 30, | September 30, | ||||||||||||||
(In millions) | 2018 | 2017 | 2018 | 2017 | |||||||||||
Service cost | $ | 5.0 | $ | 5.0 | $ | 15.1 | $ | 15.1 | |||||||
Interest cost | 3.6 | 3.7 | 10.9 | 11.2 | |||||||||||
Expected return on plan assets | (3.6 | ) | (3.5 | ) | (10.9 | ) | (10.6 | ) | |||||||
Amortization of prior service costs | 0.1 | 0.1 | 0.3 | 0.2 | |||||||||||
Recognized net actuarial losses | 0.1 | 0.2 | 0.1 | 0.5 | |||||||||||
Net periodic benefit cost | $ | 5.2 | $ | 5.5 | $ | 15.5 | $ | 16.4 | |||||||
The Company is making the minimum mandatory contributions to its U.S. defined benefit pension plans in the 2018 plan year. The Company expects to make total benefit payments of approximately $31.1 million from pension and other postretirement benefit plans in 2018. The Company anticipates making contributions to pension and other postretirement benefit plans of approximately $29.9 million in 2018.
7. | Balance Sheet Components |
Selected balance sheet components consist of the following:
Cash and restricted cash
(In millions) | September 30, 2018 | December 31, 2017 | September 30, 2017 | ||||||||
Cash and cash equivalents | $ | 449.2 | $ | 292.1 | $ | 614.9 | |||||
Restricted cash, included in prepaid expenses and other current assets | 53.9 | 77.8 | 135.9 | ||||||||
Cash, cash equivalents and restricted cash | $ | 503.1 | $ | 369.9 | $ | 750.8 | |||||
17
MYLAN N.V. AND SUBSIDIARIES
Notes to Condensed Consolidated Financial Statements (Unaudited) - Continued
Inventories
(In millions) | September 30, 2018 | December 31, 2017 | |||||
Raw materials | $ | 926.0 | $ | 895.5 | |||
Work in process | 369.5 | 384.7 | |||||
Finished goods | 1,265.1 | 1,262.5 | |||||
Inventories | $ | 2,560.6 | $ | 2,542.7 | |||
Prepaid and other current assets
(In millions) | September 30, 2018 | December 31, 2017 | |||||
Prepaid expenses | $ | 117.1 | $ | 119.8 | |||
Restricted cash | 53.9 | 77.8 | |||||
Available-for-sale fixed income securities | 25.3 | 31.5 | |||||
Fair value of financial instruments | 7.1 | 88.9 | |||||
Equity securities | 36.6 | 79.1 | |||||
Other current assets | 343.2 | 369.0 | |||||
Prepaid expenses and other current assets | $ | 583.2 | $ | 766.1 | |||
Prepaid expenses consist primarily of prepaid rent, insurance and other individually insignificant items.
Property, plant and equipment, net
(In millions) | September 30, 2018 | December 31, 2017 | |||||
Machinery and equipment | $ | 2,365.2 | $ | 2,414.5 | |||
Buildings and improvements | 1,170.4 | 1,191.7 | |||||
Construction in progress | 221.1 | 252.9 | |||||
Land and improvements | 133.8 | 143.1 | |||||
Gross property, plant and equipment | 3,890.5 | 4,002.2 | |||||
Accumulated depreciation | 1,770.9 | 1,663.1 | |||||
Property, plant and equipment, net | $ | 2,119.6 | $ | 2,339.1 | |||
Other assets
(In millions) | September 30, 2018 | December 31, 2017 | |||||
Equity method investments, clean energy investments | $ | 149.5 | $ | 226.0 | |||
Other long-term assets | 95.2 | 79.6 | |||||
Other assets | $ | 244.7 | $ | 305.6 | |||
Accounts payable
(In millions) | September 30, 2018 | December 31, 2017 | |||||
Trade accounts payable | $ | 963.7 | $ | 976.0 | |||
Other payables | 437.4 | 476.5 | |||||
Accounts payable | $ | 1,401.1 | $ | 1,452.5 | |||
18
MYLAN N.V. AND SUBSIDIARIES
Notes to Condensed Consolidated Financial Statements (Unaudited) - Continued
Other current liabilities
(In millions) | September 30, 2018 | December 31, 2017 | |||||
Accrued sales allowances | $ | 631.9 | $ | 818.0 | |||
Legal and professional accruals, including litigation accruals | 131.4 | 241.1 | |||||
Payroll and employee benefit liabilities | 372.4 | 404.6 | |||||
Contingent consideration | 223.3 | 167.8 | |||||
Accrued interest | 193.8 | 42.3 | |||||
Restructuring | 80.9 | 91.5 | |||||
Equity method investments, clean energy investments | 38.1 | 56.7 | |||||
Fair value of financial instruments | 114.4 | 31.1 | |||||
Other | 742.2 | 1,111.4 | |||||
Other current liabilities | $ | 2,528.4 | $ | 2,964.5 | |||
In April 2018, the State of New York passed a budget which included the Opioid Stewardship Fund (the “Fund”) pursuant to a law that became effective July 1, 2018. The Fund created an aggregate $100 million annual assessment on all manufacturers and distributors licensed to sell or distribute opioids in New York. Each licensed manufacturer and distributor will be required to pay a portion of the assessment based on its ratable share, as determined by the state, of the total morphine milligram equivalents first sold or distributed within, or into, New York during the applicable calendar year. The initial payment is due on January 1, 2019 for opioids sold or distributed during calendar year 2017. Based upon initial correspondence received from the State of New York, the Company believes its amount related to the Fund for calendar year 2017 will be immaterial.
On March 31, 2017, the Company announced that Meridian Medical Technologies (“Meridian”), a Pfizer company that manufactures the EpiPen® Auto-Injector, expanded a voluntary recall of select lots of EpiPen® Auto-Injector and EpiPen Jr® Auto-Injector to include additional lots distributed in the U.S. and other markets in consultation with the U.S. Food and Drug Administration (“FDA”) (the “EpiPen® Auto-Injector Recall”). This recall was conducted as a result of the receipt of two previously disclosed reports outside of the U.S. of the failure to activate the device due to a potential defect in a supplier component. Both reports were related to the single lot that was previously recalled. The expanded voluntary recall was initiated in the U.S. and also extends to additional markets in Europe, Asia, North and South America. The Company is replacing recalled devices at no cost to the consumer. Estimated costs to Mylan related to product recalls are based on a formal campaign soliciting return of the product and are accrued when they are deemed to be probable and can be reasonably estimated. As of September 30, 2018, the Company recorded an accrual for certain costs of the recall but there can be no assurance that future costs related to the recall will not exceed amounts recorded. In addition, Meridian is contractually obligated to reimburse Mylan for costs related to the EpiPen® Auto-Injector Recall, and the Company has recorded an asset for the recovery of such costs.
Other long-term obligations
(In millions) | September 30, 2018 | December 31, 2017 | |||||
Employee benefit liabilities | $ | 411.7 | $ | 408.2 | |||
Contingent consideration | 195.5 | 285.9 | |||||
Equity method investments, clean energy investments | 151.4 | 171.8 | |||||
Tax related items, including contingencies | 155.6 | 237.7 | |||||
Other | 237.4 | 132.1 | |||||
Other long-term obligations | $ | 1,151.6 | $ | 1,235.7 | |||
19
MYLAN N.V. AND SUBSIDIARIES
Notes to Condensed Consolidated Financial Statements (Unaudited) - Continued
8. | Equity Method Investments |
The Company currently has three equity method investments in limited liability companies that own refined coal production plants (the “clean energy investments”) whose activities qualify for income tax credits under Section 45 of the U.S. Internal Revenue Code of 1986, as amended (the “Code”). The Company does not consolidate these entities as we have determined that we are not the primary beneficiary of these entities and do not have the power to individually direct the activities of these entities. Accordingly, these investments are accounted for under the equity method of accounting. For each of the clean energy investments, the Company has entered into notes payable with the respective project sponsor, which in part will be paid to the sponsor as certain production levels are met.
During the third quarter of 2018, the Company and a project sponsor agreed to terminate two previous investments. Under the termination agreements, the Company returned its ownership interest in the projects to the sponsor and in exchange the Company will have no further obligations with respect to the notes payable for these projects.
Also, during the third quarter of 2018, the Company entered into amended agreements related to the three remaining investments. These amendments effectively reduce the amount of expected future variable debt payments to the respective project sponsor.
As a result of these transactions, during the third quarter of 2018, the Company impaired its investment balance and other assets by approximately $39 million and reduced the related long-term obligations for these investments by approximately $40 million resulting in a net gain of approximately $1 million, which was recognized as a component of the net loss of the equity method investments in the Condensed Consolidated Statement of Operations.
Summarized financial information, in the aggregate, for the Company’s significant equity method investments on a 100% basis for the three and nine months ended September 30, 2018 and 2017 are as follows:
Three Months Ended | Nine Months Ended | ||||||||||||||
September 30, | September 30, | ||||||||||||||
(In millions) | 2018 | 2017 | 2018 | 2017 | |||||||||||
Total revenues | $ | 128.6 | $ | 129.3 | $ | 376.8 | $ | 352.0 | |||||||
Gross loss | (1.3 | ) | (2.4 | ) | (20.0 | ) | (8.8 | ) | |||||||
Operating and non-operating expense | 5.9 | 6.5 | 16.5 | 16.9 | |||||||||||
Net loss | $ | (7.2 | ) | $ | (8.9 | ) | $ | (36.5 | ) | $ | (25.7 | ) | |||
The Company’s net losses from its equity method investments include amortization expense related to the excess of the cost basis of the Company’s investment over the underlying assets of each individual investee. For the three months ended September 30, 2018 and 2017, the Company recognized net losses from equity method investments of $12.6 million and $22.4 million, respectively. For the nine months ended September 30, 2018 and 2017, the Company recognized net losses from equity method investments of $58.6 million and $77.2 million, respectively, which were recognized as a component of other expense, net in the Condensed Consolidated Statements of Operations. The Company recognizes the income tax credits and benefits from the clean energy investments as part of its provision for income taxes.
9. | Earnings per Ordinary Share |
Basic earnings per ordinary share is computed by dividing net earnings by the weighted average number of ordinary shares outstanding during the period. Diluted earnings per ordinary share is computed by dividing net earnings by the weighted average number of ordinary shares outstanding during the period increased by the number of additional shares that would have been outstanding related to potentially dilutive securities or instruments, if the impact is dilutive.
20
MYLAN N.V. AND SUBSIDIARIES
Notes to Condensed Consolidated Financial Statements (Unaudited) - Continued
Basic and diluted earnings per ordinary share are calculated as follows:
Three Months Ended | Nine Months Ended | ||||||||||||||
September 30, | September 30, | ||||||||||||||
(In millions, except per share amounts) | 2018 | 2017 | 2018 | 2017 | |||||||||||
Basic earnings (numerator): | |||||||||||||||
Net earnings | $ | 176.7 | $ | 88.3 | $ | 301.3 | $ | 451.7 | |||||||
Shares (denominator): | |||||||||||||||
Weighted average ordinary shares outstanding | 514.5 | 535.2 | 514.4 | 534.9 | |||||||||||
Basic earnings per ordinary share | $ | 0.34 | $ | 0.17 | $ | 0.59 | $ | 0.84 | |||||||
Diluted earnings (numerator): | |||||||||||||||
Net earnings | $ | 176.7 | $ | 88.3 | $ | 301.3 | $ | 451.7 | |||||||
Shares (denominator): | |||||||||||||||
Weighted average ordinary shares outstanding | 514.5 | 535.2 | 514.4 | 534.9 | |||||||||||
Share-based awards | 2.0 | 1.8 | 2.1 | 2.1 | |||||||||||
Total dilutive shares outstanding | 516.5 | 537.0 | 516.5 | 537.0 | |||||||||||
Diluted earnings per ordinary share | $ | 0.34 | $ | 0.16 | $ | 0.58 | $ | 0.84 | |||||||
Additional stock awards and restricted stock awards were outstanding during the three and nine months ended September 30, 2018 and 2017, but were not included in the computation of diluted earnings per ordinary share for each respective period because the effect would be anti-dilutive. Excluded shares at September 30, 2018 include certain share-based compensation awards and restricted ordinary shares whose performance conditions had not been fully met. Such excluded shares and anti-dilutive awards represented 9.3 million shares and 8.9 million shares for the three and nine months ended September 30, 2018, respectively and 8.9 million shares and 8.6 million shares for the three and nine months ended September 30, 2017, respectively.
21
MYLAN N.V. AND SUBSIDIARIES
Notes to Condensed Consolidated Financial Statements (Unaudited) - Continued
10. | Goodwill and Intangible Assets |
The changes in the carrying amount of goodwill for the nine months ended September 30, 2018 are as follows:
(In millions) | North America Segment | Europe Segment | Rest of World Segment | Total | |||||||||||
Balance at December 31, 2017: | |||||||||||||||
Goodwill | $ | 3,934.6 | $ | 4,967.1 | $ | 1,689.0 | $ | 10,590.7 | |||||||
Accumulated impairment losses | (385.0 | ) | — | — | (385.0 | ) | |||||||||
3,549.6 | 4,967.1 | 1,689.0 | 10,205.7 | ||||||||||||
Foreign currency translation | (16.8 | ) | (255.1 | ) | (137.2 | ) | (409.1 | ) | |||||||
$ | 3,532.8 | $ | 4,712.0 | $ | 1,551.8 | $ | 9,796.6 | ||||||||
Balance at September 30, 2018: | |||||||||||||||
Goodwill | $ | 3,917.8 | $ | 4,712.0 | $ | 1,551.8 | $ | 10,181.6 | |||||||
Accumulated impairment losses | (385.0 | ) | — | — | (385.0 | ) | |||||||||
$ | 3,532.8 | $ | 4,712.0 | $ | 1,551.8 | $ | 9,796.6 | ||||||||
Intangible assets consist of the following components at September 30, 2018 and December 31, 2017:
(In millions) | Weighted Average Life (Years) | Original Cost | Accumulated Amortization | Net Book Value | |||||||||
September 30, 2018 | |||||||||||||
Product rights, licenses and other (1) | 15 | $ | 20,407.7 | $ | 6,857.5 | $ | 13,550.2 | ||||||
In-process research and development | 688.8 | — | 688.8 | ||||||||||
$ | 21,096.5 | $ | 6,857.5 | $ | 14,239.0 | ||||||||
December 31, 2017 | |||||||||||||
Product rights, licenses and other (1) | 15 | $ | 20,338.7 | $ | 5,906.1 | $ | 14,432.6 | ||||||
In-process research and development | 813.2 | — | 813.2 | ||||||||||
$ | 21,151.9 | $ | 5,906.1 | $ | 15,245.8 | ||||||||
(1) | Represents amortizable intangible assets. Other intangible assets consists principally of customer lists and contractual rights. |
In December 2011, the Company completed the acquisition of the exclusive worldwide rights to develop, manufacture and commercialize a generic equivalent to GlaxoSmithKline’s Advair® Diskus and Seretide® Diskus incorporating Pfizer Inc.’s proprietary dry powder inhaler delivery platform (the “respiratory delivery platform”). The Company accounted for this transaction as a purchase of a business and utilized the acquisition method of accounting. As of September 30, 2018, the Company has an IPR&D asset of $347.2 million and a related contingent consideration liability of $326.6 million. The Company performed an analysis and valuation of the IPR&D asset and the fair value of the related contingent consideration liability using a discounted cash flow model. The model contained certain key assumptions including: the expected product launch date, the number of competitors, the timing of competition and a discount factor based on an industry specific weighted average cost of capital. Based on the analysis performed, the Company determined that the fair value of the IPR&D asset was substantially in excess of its carrying value, and the asset was not impaired at September 30, 2018. Additionally, fair value adjustments of $19.3 million and $49.3 million were recorded for the three and nine months ended September 30, 2018, respectively, to reduce the contingent consideration liability. The fair value of the contingent consideration liability was determined based upon detailed valuations employing the income approach which utilized Level 3 inputs, as defined in Note 11 - Financial Instruments and Risk Management. Resolution of the matters with the FDA, market conditions and other factors may result in significant future changes in the projections and assumptions utilized in the discounted cash flow model, which could lead to material adjustments to the amounts recorded for IPR&D and contingent consideration.
22
MYLAN N.V. AND SUBSIDIARIES
Notes to Condensed Consolidated Financial Statements (Unaudited) - Continued
During the three and nine months ended September 30, 2018, the Company recognized impairment charges of $15.5 million and $87.5 million, respectively, which has been recorded as a component of amortization expense, for the impairment of certain IPR&D assets. The impairment charge recorded during the third quarter of 2018 related to certain assets acquired as part of the acquisition of Agila Specialties Private Limited (“Agila”). The remaining impairment charges during the nine months ended September 30, 2018 related to certain assets acquired as part of the acquisition of the non-sterile, topicals-focused business (the “Topicals Business”) of Renaissance Acquisition Holdings, LLC. The impairment charges resulted from the Company’s updated estimate of the fair value of certain assets, which were based upon revised forecasts and future development plans. The Company performed its annual impairment testing of IPR&D assets acquired as part of the Topicals Business acquisition during the three months ended June 30, 2018. The impairment testing involved calculating the fair value of the assets based upon detailed valuations employing the income approach which utilized Level 3 inputs, as defined in Note 11 - Financial Instruments and Risk Management. These valuations reflect, among other things, the impact of changes to the development programs, the projected development and regulatory time frames and the current competitive environment. Changes in any of the Company’s assumptions may result in a further reduction to the estimated fair values of these IPR&D assets and could result in additional future impairment charges.
The Company has performed its annual goodwill impairment test as of April 1, 2018 on a quantitative basis for its four reporting units, North America Generics, North America Brands, Europe and Rest of World. In estimating each reporting unit’s fair value, the Company performed an extensive valuation analysis, utilizing both income and market-based approaches, except for the North America Brands reporting unit where the fair value was estimated utilizing the income approach. The determination of the fair value of the reporting units requires the Company to make significant estimates and assumptions that affect the reporting unit’s expected future cash flows. These estimates and assumptions, utilizing Level 3 inputs, primarily include, but are not limited to, market multiples, control premiums, the discount rate, terminal growth rates, operating income before depreciation and amortization, and capital expenditures forecasts. Due to the inherent uncertainty involved in making these estimates, actual results could differ from those estimates. In addition, changes in underlying assumptions, especially as it relates to the key assumptions detailed, could have a significant impact on the fair value of the reporting units.
As of the date of our annual impairment test, the allocation of the Company’s total goodwill was as follows: North America Generics $2.89 billion, North America Brands $0.66 billion, Europe $4.97 billion and Rest of World $1.80 billion. The fair value of the North America Generics, North America Brands and Rest of World reporting units was substantially in excess of the respective unit’s carrying value. For the Europe reporting unit, the estimated fair value exceeded its carrying value by approximately $800 million or 6.0%. The excess fair value for the Europe reporting unit is consistent with the result of the Company’s 2017 annual impairment test. As it relates to the income approach for the Europe reporting unit at April 1, 2018, the Company forecasted cash flows for the next 5 years. During the forecast period, the revenue compound annual growth rate was approximately 3.5%. A terminal value year was calculated with a 2% revenue growth rate applied. The discount rate utilized was 9.0% and the estimated tax rate was 24.0%. Under the market-based approach, we utilized an estimated range of market multiples of 9.0 to 10.5 times EBITDA plus a control premium of 15.0%. If all other assumptions are held constant, a reduction in the terminal value growth rate by 2.0% or an increase in discount rate by 1.5% would result in an impairment charge for the Europe reporting unit.
Amortization expense, which is classified primarily within cost of sales in the Condensed Consolidated Statements of Operations for the three and nine months ended September 30, 2018 and 2017 totaled:
Three Months Ended | Nine Months Ended | ||||||||||||||
September 30, | September 30, | ||||||||||||||
(In millions) | 2018 | 2017 | 2018 | 2017 | |||||||||||
Intangible asset amortization expense | $ | 412.2 | $ | 369.4 | $ | 1,191.9 | $ | 1,052.6 | |||||||
Intangible asset impairment charges | 15.5 | — | 87.5 | 13.0 | |||||||||||
Total Intangible asset amortization expense (including impairment charges) | $ | 427.7 | $ | 369.4 | $ | 1,279.4 | $ | 1,065.6 | |||||||
23
MYLAN N.V. AND SUBSIDIARIES
Notes to Condensed Consolidated Financial Statements (Unaudited) - Continued
Intangible asset amortization expense over the remainder of 2018 and for the years ended December 31, 2019 through 2022 is estimated to be as follows:
(In millions) | |||
2018 | $ | 383 | |
2019 | 1,446 | ||
2020 | 1,283 | ||
2021 | 1,203 | ||
2022 | 1,137 | ||
11. | Financial Instruments and Risk Management |
The Company is exposed to certain financial risks relating to its ongoing business operations. The primary financial risks that are managed by using derivative instruments are foreign currency risk and interest rate risk.
Foreign Currency Risk Management
In order to manage certain foreign currency risks, the Company enters into foreign exchange forward contracts to mitigate risk associated with changes in spot exchange rates of mainly non-functional currency denominated assets or liabilities. The foreign exchange forward contracts are measured at fair value and reported as current assets or current liabilities on the Condensed Consolidated Balance Sheets. Any gains or losses on the foreign exchange forward contracts are recognized in earnings in the period incurred in the Condensed Consolidated Statements of Operations.
The Company has also entered into forward contracts to hedge forecasted foreign currency denominated sales from certain international subsidiaries. These contracts are designated as cash flow hedges to manage foreign currency transaction risk and are measured at fair value and reported as current assets or current liabilities on the Condensed Consolidated Balance Sheets. Any changes in the fair value of designated cash flow hedges are deferred in accumulated other comprehensive earnings (“AOCE”) and are reclassified into earnings when the hedged item impacts earnings.
Net Investment Hedges
The Company may hedge the foreign currency risk associated with certain net investment positions in foreign subsidiaries by either borrowing directly in foreign currencies and designating all or a portion of the foreign currency debt as a hedge of the applicable net investment position or entering into foreign currency swaps that are designated as hedges of net investments.
The Company has designated certain Euro borrowings as a hedge of its investment in certain Euro-functional currency subsidiaries in order to manage foreign currency translation risk. Borrowings designated as net investment hedges are marked-to-market using the current spot exchange rate as of the end of the period, with gains and losses included in the foreign currency translation component of AOCE until the sale or substantial liquidation of the underlying net investments. In addition, the Company manages the related foreign exchange risk of the Euro borrowings not designated as net investment hedges through certain Euro denominated financial assets and forward currency swaps.
24
MYLAN N.V. AND SUBSIDIARIES
Notes to Condensed Consolidated Financial Statements (Unaudited) - Continued
The following table summarizes the principal amounts of the Company’s outstanding Euro borrowings and the notional amounts of the Euro borrowings designated as net investment hedges:
Notional Amount Designated as a Net Investment Hedge | ||||||||||||
(in millions) | Principal Amount | September 30, 2018 | December 31, 2017 | |||||||||
2.250% Euro Senior Notes due 2024 | € | 1,000.0 | € | 1,000.0 | € | 1,000.0 | ||||||
3.125% Euro Senior Notes due 2028 | 750.0 | 750.0 | 750.0 | |||||||||
1.250% Euro Senior Notes due 2020 | 750.0 | 104.0 | 104.0 | |||||||||
2.125% Euro Senior Notes due 2025 | 500.0 | 500.0 | — | |||||||||
Floating Rate Euro Notes due 2018 | 500.0 | — | — | |||||||||
Floating Rate Euro Notes due 2020 | 500.0 | — | — | |||||||||
Total | € | 4,000.0 | € | 2,354.0 | € | 1,854.0 | ||||||
Interest Rate Risk Management
The Company enters into interest rate swaps in order to manage interest rate risk associated with the Company’s fixed-rate and floating-rate debt. Interest rate swaps that meet specific accounting criteria are accounted for as fair value or cash flow hedges. All derivative instruments used to manage interest rate risk are measured at fair value and reported as current assets or current liabilities in the Condensed Consolidated Balance Sheets. For fair value hedges, the changes in the fair value of both the hedging instrument and the underlying debt obligations are included in interest expense. For cash flow hedges, the change in fair value of the hedging instrument is deferred through AOCE and is reclassified into earnings when the hedged item impacts earnings.
Credit Risk Management
The Company regularly reviews the creditworthiness of its financial counterparties and does not expect to incur a significant loss from the failure of any counterparties to perform under any agreements. The Company is not subject to any obligations to post collateral under derivative instrument contracts. Certain derivative instrument contracts entered into by the Company are governed by master agreements, which contain credit-risk-related contingent features that would allow the counterparties to terminate the contracts early and request immediate payment should the Company trigger an event of default on other specified borrowings. The Company records all derivative instruments on a gross basis in the Condensed Consolidated Balance Sheets. Accordingly, there are no offsetting amounts that net assets against liabilities.
The Effect of Derivative Instruments on the Condensed Consolidated Balance Sheets
Fair Values of Derivative Instruments
Derivatives Designated as Hedging Instruments
Asset Derivatives | |||||||||||
September 30, 2018 | December 31, 2017 | ||||||||||
(In millions) | Balance Sheet Location | Fair Value | Balance Sheet Location | Fair Value | |||||||
Interest rate swaps | Prepaid expenses and other current assets | $ | — | Prepaid expenses and other current assets | $ | 16.2 | |||||
Foreign currency forward contracts | Prepaid expenses and other current assets | — | Prepaid expenses and other current assets | 63.4 | |||||||
Total | $ | — | $ | 79.6 | |||||||
Liability Derivatives | |||||||||||
September 30, 2018 | December 31, 2017 | ||||||||||
(In millions) | Balance Sheet Location | Fair Value | Balance Sheet Location | Fair Value | |||||||
Interest rate swaps | Other current liabilities | $ | 11.1 | Other current liabilities | $ | — | |||||
Foreign currency forward contracts | Other current liabilities | 76.8 | Other current liabilities | — | |||||||
Total | $ | 87.9 | $ | — | |||||||
25
MYLAN N.V. AND SUBSIDIARIES
Notes to Condensed Consolidated Financial Statements (Unaudited) - Continued
The Effect of Derivative Instruments on the Condensed Consolidated Balance Sheets
Fair Values of Derivative Instruments
Derivatives Not Designated as Hedging Instruments
Asset Derivatives | |||||||||||
September 30, 2018 | December 31, 2017 | ||||||||||
(In millions) | Balance Sheet Location | Fair Value | Balance Sheet Location | Fair Value | |||||||
Foreign currency forward contracts | Prepaid expenses and other current assets | $ | 7.1 | Prepaid expenses and other current assets | $ | 9.3 | |||||
Total | $ | 7.1 | $ | 9.3 | |||||||
Liability Derivatives | |||||||||||
September 30, 2018 | December 31, 2017 | ||||||||||
(In millions) | Balance Sheet Location | Fair Value | Balance Sheet Location | Fair Value | |||||||
Foreign currency forward contracts | Other current liabilities | $ | 26.5 | Other current liabilities | $ | 31.1 | |||||
Total | $ | 26.5 | $ | 31.1 | |||||||
The Effect of Derivative Instruments on the Condensed Consolidated Statements of Operations
Derivatives in Fair Value Hedging Relationships
Location of Gain (Loss) Recognized in Earnings on Derivatives | Amount of Gain (Loss) Recognized in Earnings on Derivatives | ||||||||||||||||
(In millions) | Three Months Ended | Nine Months Ended | |||||||||||||||
September 30, | September 30, | ||||||||||||||||
2018 | 2017 | 2018 | 2017 | ||||||||||||||
Interest rate swaps | Interest expense | $ | (5.0 | ) | $ | (2.5 | ) | $ | (27.3 | ) | $ | (1.0 | ) | ||||
Total | $ | (5.0 | ) | $ | (2.5 | ) | $ | (27.3 | ) | $ | (1.0 | ) | |||||
Location of Gain (Loss) Recognized in Earnings on Hedged Items | Amount of Gain (Loss) Recognized in Earnings on Hedged Items | ||||||||||||||||
(In millions) | Three Months Ended | Nine Months Ended | |||||||||||||||
September 30, | September 30, | ||||||||||||||||
2018 | 2017 | 2018 | 2017 | ||||||||||||||
2023 Senior Notes (3.125% coupon) | Interest expense | $ | 5.0 | $ | 2.5 | $ | 27.3 | $ | 1.0 | ||||||||
Total | $ | 5.0 | $ | 2.5 | $ | 27.3 | $ | 1.0 | |||||||||
The Effect of Derivative Instruments on the Condensed Consolidated Statements of Comprehensive Earnings
Derivatives in Cash Flow Hedging Relationships
Amount of Gain (Loss) Recognized in AOCE (Net of Tax) on Derivative | ||||||||||||||||
Three Months Ended | Nine Months Ended | |||||||||||||||
September 30, | September 30, | |||||||||||||||
(In millions) | 2018 | 2017 | 2018 | 2017 | ||||||||||||
Foreign currency forward contracts | $ | (33.9 | ) | $ | (8.8 | ) | $ | (87.7 | ) | $ | 7.5 | |||||
Interest rate swaps | — | (3.3 | ) | — | (2.0 | ) | ||||||||||
Total | $ | (33.9 | ) | $ | (12.1 | ) | $ | (87.7 | ) | $ | 5.5 | |||||
26
MYLAN N.V. AND SUBSIDIARIES
Notes to Condensed Consolidated Financial Statements (Unaudited) - Continued
The Effect of Derivative Instruments on the Condensed Consolidated Statements of Comprehensive Earnings
Derivatives in Net Investment Hedging Relationships
Amount of Gain (Loss) Recognized in AOCE (Net of Tax) on Derivative | ||||||||||||||||
Three Months Ended | Nine Months Ended | |||||||||||||||
September 30, | September 30, | |||||||||||||||
(In millions) | 2018 | 2017 | 2018 | 2017 | ||||||||||||
Foreign currency borrowings and forward contracts | $ | 17.9 | $ | (72.1 | ) | $ | 77.7 | $ | (203.2 | ) | ||||||
Total | $ | 17.9 | $ | (72.1 | ) | $ | 77.7 | $ | (203.2 | ) | ||||||
The Effect of Derivative Instruments on the Condensed Consolidated Statements of Operations
Derivatives in Cash Flow Hedging Relationships
Location of Gain (Loss) Reclassified from AOCE into Earnings (Effective Portion) | Amount of Gain (Loss) Reclassified from AOCE into Earnings | ||||||||||||||||
Three Months Ended | Nine Months Ended | ||||||||||||||||
September 30, | September 30, | ||||||||||||||||
(In millions) | 2018 | 2017 | 2018 | 2017 | |||||||||||||
Foreign currency forward contracts | Net sales | $ | 0.9 | $ | 2.0 | $ | 8.1 | $ | (3.8 | ) | |||||||
Interest rate swaps | Interest expense | (1.9 | ) | (1.9 | ) | (5.7 | ) | (5.5 | ) | ||||||||
Total | $ | (1.0 | ) | $ | 0.1 | $ | 2.4 | $ | (9.3 | ) | |||||||
Location of Gain (Loss) Excluded from the Assessment of Hedge Effectiveness | Amount of Gain (Loss) Excluded from the Assessment of Hedge Effectiveness | ||||||||||||||||
Three Months Ended | Nine Months Ended | ||||||||||||||||
September 30, | September 30, | ||||||||||||||||
(In millions) | 2018 | 2017 | 2018 | 2017 | |||||||||||||
Foreign currency forward contracts | Other expense, net | $ | — | $ | 3.3 | $ | — | $ | 6.9 | ||||||||
Total | $ | — | $ | 3.3 | $ | — | $ | 6.9 | |||||||||
At September 30, 2018, the Company expects that approximately $85 million of pre-tax net losses on cash flow hedges will be reclassified from AOCE into earnings during the next twelve months.
The Effect of Derivative Instruments on the Condensed Consolidated Statements of Operations
Derivatives Not Designated as Hedging Instruments
Location of Gain (Loss) Recognized in Earnings on Derivatives | Amount of Gain (Loss) Recognized in Earnings on Derivatives | ||||||||||||||||
Three Months Ended | Nine Months Ended | ||||||||||||||||
September 30, | September 30, | ||||||||||||||||
(In millions) | 2018 | 2017 | 2018 | 2017 | |||||||||||||
Foreign currency option and forward contracts | Other expense, net | $ | (25.1 | ) | $ | (43.0 | ) | $ | 2.5 | $ | (60.1 | ) | |||||
Total | $ | (25.1 | ) | $ | (43.0 | ) | $ | 2.5 | $ | (60.1 | ) | ||||||
Fair Value Measurement
Fair value is based on the price that would be received from the sale of an identical asset or paid to transfer an identical liability in an orderly transaction between market participants at the measurement date. In order to increase consistency and comparability in fair value measurements, a fair value hierarchy has been established that prioritizes observable and unobservable inputs used to measure fair value into three broad levels, which are described below:
• | Level 1: Quoted prices (unadjusted) in active markets that are accessible at the measurement date for identical assets or liabilities. The fair value hierarchy gives the highest priority to Level 1 inputs. |
27
MYLAN N.V. AND SUBSIDIARIES
Notes to Condensed Consolidated Financial Statements (Unaudited) - Continued
• | Level 2: Observable market-based inputs other than quoted prices in active markets for identical assets or liabilities. |
• | Level 3: Unobservable inputs are used when little or no market data is available. The fair value hierarchy gives the lowest priority to Level 3 inputs. |
In determining fair value, the Company utilizes valuation techniques that maximize the use of observable inputs and minimize the use of unobservable inputs to the extent possible, as well as considers counterparty credit risk in its assessment of fair value.
The Company recognized unrealized gains of $1.3 million and unrealized losses of $7.8 million during the three months ended September 30, 2018 and September 30, 2017, respectively, and unrealized gains of $2.0 million and $6.6 million during the nine months ended September 30, 2018 and September 30, 2017, respectively, attributable to the changes in fair value of equity securities.
Financial assets and liabilities carried at fair value are classified in the tables below in one of the three categories described above:
September 30, 2018 | |||||||||||||||
(In millions) | Level 1 | Level 2 | Level 3 | Total | |||||||||||
Recurring fair value measurements | |||||||||||||||
Financial Assets | |||||||||||||||
Cash equivalents: | |||||||||||||||
Money market funds | $ | 27.5 | $ | — | $ | — | $ | 27.5 | |||||||
Total cash equivalents | 27.5 | — | — | 27.5 | |||||||||||
Equity securities: | |||||||||||||||
Exchange traded funds | 35.7 | — | — | 35.7 | |||||||||||
Marketable securities | 0.9 | — | — | 0.9 | |||||||||||
Total equity securities | 36.6 | — | — | 36.6 | |||||||||||
Available-for-sale fixed income investments: | |||||||||||||||
Corporate bonds | — | 10.4 | — | 10.4 | |||||||||||
U.S. Treasuries | — | 8.7 | — | 8.7 | |||||||||||
Agency mortgage-backed securities | — | 1.7 | — | 1.7 | |||||||||||
Asset backed securities | — | 3.2 | — | 3.2 | |||||||||||
Other | — | 1.3 | — | 1.3 | |||||||||||
Total available-for-sale fixed income investments | — | 25.3 | — | 25.3 | |||||||||||
Foreign exchange derivative assets | — | 7.1 | — | 7.1 | |||||||||||
Total assets at recurring fair value measurement | $ | 64.1 | $ | 32.4 | $ | — | $ | 96.5 | |||||||
Financial Liabilities | |||||||||||||||
Interest rate swap derivative liabilities | $ | — | $ | 11.1 | $ | — | $ | 11.1 | |||||||
Foreign exchange derivative liabilities | — | 103.3 | — | 103.3 | |||||||||||
Contingent consideration | — | — | 418.8 | 418.8 | |||||||||||
Total liabilities at recurring fair value measurement | $ | — | $ | 114.4 | $ | 418.8 | $ | 533.2 | |||||||
28
MYLAN N.V. AND SUBSIDIARIES
Notes to Condensed Consolidated Financial Statements (Unaudited) - Continued
December 31, 2017 | |||||||||||||||
(In millions) | Level 1 | Level 2 | Level 3 | Total | |||||||||||
Recurring fair value measurements | |||||||||||||||
Financial Assets | |||||||||||||||
Cash equivalents: | |||||||||||||||
Money market funds | $ | 8.4 | $ | — | $ | — | $ | 8.4 | |||||||
Total cash equivalents | 8.4 | — | — | 8.4 | |||||||||||
Equity securities: | |||||||||||||||
Exchange traded funds | 33.9 | — | — | 33.9 | |||||||||||
Marketable securities | 45.2 | — | — | 45.2 | |||||||||||
Total equity securities | 79.1 | — | — | 79.1 | |||||||||||
Available-for-sale fixed income investments: | |||||||||||||||
Corporate bonds | — | 16.5 | — | 16.5 | |||||||||||
U.S. Treasuries | — | 7.4 | — | 7.4 | |||||||||||
Agency mortgage-backed securities | — | 4.1 | — | 4.1 | |||||||||||
Asset backed securities | — | 2.1 | — | 2.1 | |||||||||||
Other | — | 1.4 | — | 1.4 | |||||||||||
Total available-for-sale fixed income investments | — | 31.5 | — | 31.5 | |||||||||||
Foreign exchange derivative assets | — | 72.7 | — | 72.7 | |||||||||||
Interest rate swap derivative assets | — | 16.2 | — | 16.2 | |||||||||||
Total assets at recurring fair value measurement | $ | 87.5 | $ | 120.4 | $ | — | $ | 207.9 | |||||||
Financial Liabilities | |||||||||||||||
Foreign exchange derivative liabilities | $ | — | $ | 31.1 | $ | — | $ | 31.1 | |||||||
Contingent consideration | — | — | 453.7 | 453.7 | |||||||||||
Total liabilities at recurring fair value measurement | $ | — | $ | 31.1 | $ | 453.7 | $ | 484.8 | |||||||
For financial assets and liabilities that utilize Level 2 inputs, the Company utilizes both direct and indirect observable price quotes, including the LIBOR yield curve, foreign exchange forward prices and bank price quotes. Below is a summary of valuation techniques for Level 1 and Level 2 financial assets and liabilities:
• | Cash equivalents — valued at observable net asset value prices. |
• | Equity securities, exchange traded funds — valued at the active quoted market prices from broker or dealer quotations or transparent pricing sources at the reporting date. Unrealized gains and losses attributable to changes in fair value are included in other expense, net, in the Condensed Consolidated Statements of Operations. |
• | Equity securities, marketable securities — valued using quoted stock prices from public exchanges at the reporting date. Unrealized gains and losses attributable to changes in fair value are included in other expense, net, in the Condensed Consolidated Statements of Operations. |
• | Available-for-sale fixed income investments — valued at the quoted market prices from broker or dealer quotations or transparent pricing sources at the reporting date. Unrealized gains and losses attributable to changes in fair value, net of income taxes, are included in accumulated other comprehensive loss as a component of shareholders’ equity. |
• | Foreign exchange derivative assets and liabilities — valued using quoted forward foreign exchange prices and spot rates at the reporting date. Counterparties to these contracts are highly rated financial institutions. |
• | Interest rate swap derivative assets and liabilities — valued using the LIBOR/EURIBOR yield curves at the reporting date. Counterparties to these contracts are highly rated financial institutions. |
29
MYLAN N.V. AND SUBSIDIARIES
Notes to Condensed Consolidated Financial Statements (Unaudited) - Continued
Contingent Consideration
The fair value measurement of contingent consideration is determined using Level 3 inputs. The Company’s contingent consideration represents a component of the total purchase consideration for the respiratory delivery platform, the acquisition of Agila, the acquisition of certain female healthcare businesses from Famy Care Limited (such businesses “Jai Pharma Limited”) and certain other acquisitions. The measurement is calculated using unobservable inputs based on the Company’s own assumptions. For the respiratory delivery platform, Jai Pharma Limited and certain other acquisitions, significant unobservable inputs in the valuation include the probability and timing of future development and commercial milestones and future profit sharing payments. When valuing the contingent consideration related to the respiratory delivery platform and Jai Pharma Limited, the value of the obligations is derived from a probability assessment based on expectations of when certain milestones or profit share payments occur which are discounted using a market rate of return. At September 30, 2018 and December 31, 2017, discount rates ranging from 2.1% to 10.5% were utilized in the valuations. Significant changes in unobservable inputs could result in material changes to the contingent consideration liability.
A rollforward of the activity in the Company’s fair value of contingent consideration from December 31, 2017 to September 30, 2018 is as follows:
(In millions) | Current Portion (1) | Long-Term Portion (2) | Total Contingent Consideration | ||||||||
Balance at December 31, 2017 | $ | 167.8 | $ | 285.9 | $ | 453.7 | |||||
Payments | (1.1 | ) | — | (1.1 | ) | ||||||
Reclassifications | 53.6 | (53.6 | ) | — | |||||||
Accretion | — | 15.1 | 15.1 | ||||||||
Fair value adjustments (3) | 3.0 | (51.9 | ) | (48.9 | ) | ||||||
Balance at September 30, 2018 | $ | 223.3 | $ | 195.5 | $ | 418.8 | |||||
(1) | Included in other current liabilities on the Condensed Consolidated Balance Sheets. |
(2) | Included in other long-term obligations on the Condensed Consolidated Balance Sheets. |
(3) | Included in litigation settlements and other contingencies, net in the Condensed Consolidated Statements of Operations. |
2018 Significant Changes to Contingent Consideration: During the three and nine months ended September 30, 2018, the Company recorded fair value gains of $19.3 million and $49.3 million, respectively, related to the respiratory delivery platform contingent consideration.
Although the Company has not elected the fair value option for other financial assets and liabilities, any future transacted financial asset or liability will be evaluated for the fair value election.
12. | Debt |
Short-Term Borrowings
(In millions) | September 30, 2018 | December 31, 2017 | |||||
Receivables Facility | $ | — | $ | 45.0 | |||
Other | 0.4 | 1.5 | |||||
Short-term borrowings | $ | 0.4 | $ | 46.5 | |||
The Receivables Facility matures in January 2019.
On July 27, 2018, the Company established an unsecured commercial paper program (the “Commercial Paper Program”) pursuant to which Mylan Inc. may issue short-term, unsecured commercial paper notes (the “CP Notes”) that are guaranteed by the Company pursuant to the exemption from registration contained in Section 4(a)(2) of the Securities Act of 1933, as amended (the “Securities Act”), which replaced Mylan N.V.’s existing commercial paper program established June 8, 2017 (the “Existing Commercial Paper Program”) on substantially identical terms to the Existing Commercial Paper Program.
30
MYLAN N.V. AND SUBSIDIARIES
Notes to Condensed Consolidated Financial Statements (Unaudited) - Continued
Amounts available under the Commercial Paper Program may be borrowed, repaid and re-borrowed from time to time, with the aggregate principal amount of the commercial paper notes outstanding under the Commercial Paper Program at any time not to exceed $1.65 billion. The net proceeds of issuances of the CP Notes are expected to be used for general corporate purposes. The Company’s 2018 Revolving Facility (as defined below) will be available to pay the CP Notes, if necessary. The maturities of the CP Notes will vary but will not exceed 364 days from the date of issue.
The Company uses net proceeds from its Commercial Paper Program and the Receivables Facility as a source of liquidity for general corporate purposes, including for business development transactions, working capital and share repurchases. Commercial paper borrowings and the Receivables Facility may vary during a particular period, as a result of fluctuations in working capital requirements and timing of cash receipts.
31
MYLAN N.V. AND SUBSIDIARIES
Notes to Condensed Consolidated Financial Statements (Unaudited) - Continued
Long-Term Debt
A summary of long-term debt is as follows:
(In millions) | Interest Rate as of September 30, 2018 | September 30, 2018 | December 31, 2017 | |||||||
Current portion of long-term debt: | ||||||||||
2018 Senior Notes * | 2.600 | % | $ | — | $ | 649.9 | ||||
2018 Floating Rate Euro Notes (a) ** | 580.2 | 600.2 | ||||||||
2018 Senior Notes ** | 3.000 | % | — | 499.8 | ||||||
2019 Senior Notes ** | 2.500 | % | 549.9 | — | ||||||
Other | 6.3 | 2.4 | ||||||||
Deferred financing fees | (0.8 | ) | (3.1 | ) | ||||||
Current portion of long-term debt | $ | 1,135.6 | $ | 1,749.2 | ||||||
Non-current portion of long-term debt: | ||||||||||
2016 Term Facility (b) ** | 3.617 | % | 100.0 | 100.0 | ||||||
2019 Senior Notes ** | 2.500 | % | — | 999.5 | ||||||
2019 Senior Notes * | 2.550 | % | — | 499.7 | ||||||
2020 Floating Rate Euro Notes (c) ** | 580.2 | 600.2 | ||||||||
2020 Euro Senior Notes ** | 1.250 | % | 868.4 | 897.6 | ||||||
2020 Senior Notes ** | 3.750 | % | 499.9 | 499.9 | ||||||
2021 Senior Notes ** | 3.150 | % | 2,248.5 | 2,248.2 | ||||||
2023 Senior Notes * | 3.125 | % | 738.2 | 765.4 | ||||||
2023 Senior Notes * | 4.200 | % | 498.9 | 498.8 | ||||||
2024 Euro Senior Notes ** | 2.250 | % | 1,158.1 | 1,197.7 | ||||||
2025 Euro Senior Notes * | 2.125 | % | 578.9 | — | ||||||
2026 Senior Notes ** | 3.950 | % | 2,236.1 | 2,235.0 | ||||||
2028 Euro Senior Notes ** | 3.125 | % | 862.7 | 892.0 | ||||||
2028 Senior Notes * | 4.550 | % | 748.2 | — | ||||||
2043 Senior Notes * | 5.400 | % | 497.1 | 497.1 | ||||||
2046 Senior Notes ** | 5.250 | % | 999.8 | 999.8 | ||||||
2048 Senior Notes * | 5.200 | % | 747.6 | — | ||||||
Other | 5.9 | 6.3 | ||||||||
Deferred financing fees | (77.1 | ) | (71.9 | ) | ||||||
Long-term debt | $ | 13,291.4 | $ | 12,865.3 | ||||||
(a) | Instrument bears interest at a rate of three-month EURIBOR plus 0.870% per annum, reset quarterly. |
(b) | The 2016 Term Facility bears interest at LIBOR plus a base rate, which margins can fluctuate based on the Company’s credit ratings. |
(c) | Instrument bears interest at a rate of three-month EURIBOR plus 0.50% per annum, reset quarterly. |
* | Instrument was issued by Mylan Inc. |
** | Instrument was issued by Mylan N.V. |
For additional information, see Note 8 Debt in Mylan N.V.’s 2017 Form 10-K.
32
MYLAN N.V. AND SUBSIDIARIES
Notes to Condensed Consolidated Financial Statements (Unaudited) - Continued
2016 Revolving Facility, 2018 Revolving Facility and 2016 Term Facility
On November 22, 2016, the Company entered into a revolving credit facility among the Company, as borrower, Mylan Inc., as a guarantor, certain lenders and issuing banks and Bank of America, N.A., as the administrative agent, pursuant to which the Company may obtain extensions of credit in an aggregate principal amount not to exceed $2.0 billion (the “2016 Revolving Facility”). On the same day, the Company entered into a term credit facility among the Company, as borrower, Mylan Inc., as a guarantor, certain lenders and Goldman Sachs Bank USA, as administrative agent, pursuant to which the Company has outstanding $100.0 million in term loans (the “2016 Term Facility”) at September 30, 2018. On July 27, 2018, the Company entered into a revolving credit facility among Mylan Inc., as borrower, the Company, as a guarantor, certain lenders and issuing banks and Bank of America, N.A., as the administrative agent, which replaced the 2016 Revolving Facility on substantially identical terms to the 2016 Revolving Facility and pursuant to which Mylan Inc. may obtain extensions of credit in an aggregate principal amount not to exceed $2.0 billion (the “2018 Revolving Facility”).
The 2016 Term Facility and 2016 Revolving Facility contain a maximum consolidated leverage ratio financial covenant requiring maintenance of a maximum ratio of 3.75 to 1.00 for consolidated total indebtedness as of the end of any quarter to consolidated EBITDA for the trailing four quarters as defined in the related credit agreements (“leverage ratio”).
Following the acquisition of Meda AB (publ.) (“Meda”) (a qualifying acquisition), the leverage ratio changed to 4.25 to 1.00 through June 30, 2017. On November 3, 2017, the Company entered into an amendment to the agreements for the 2016 Term Facility and 2016 Revolving Facility to extend the leverage ratio covenant of 4.25 to 1.00 through the December 31, 2018 reporting period. The 2018 Revolving Facility similarly provides for a leverage ratio covenant of 4.25 to 1.00 through the December 31, 2018 reporting period and a leverage ratio of 3.75 to 1.00 thereafter. The Company is in compliance at September 30, 2018 and expects to remain in compliance for the next twelve months.
April 2018 Senior Notes Offering
The following table provides the amounts of senior unsecured debt issued by Mylan Inc., and guaranteed by Mylan N.V., on April 9, 2018 (the “April 2018 Senior Notes”). The April 2018 Senior Notes were issued pursuant to an indenture dated April 9, 2018. The April 2018 Senior Notes were issued in a private offering exempt from the registration requirements of the Securities Act to qualified institutional buyers in accordance with Rule 144A under the Securities Act and to persons outside of the U.S. pursuant to Regulation S under the Securities Act. The Company has entered into a registration rights agreement, dated as of April 9, 2018 pursuant to which Mylan Inc. and Mylan N.V. are required to use commercially reasonable efforts to file a registration statement with respect to an offer to exchange each series of the April 2018 Senior Notes for new notes with the same aggregate principal amount and terms substantially identical in all material respects.
(In millions) | Interest Rate | Principal Amount | ||||
2028 Senior Notes (1) | 4.550 | % | $ | 750.0 | ||
2048 Senior Notes (1) | 5.200 | % | 750.0 | |||
Total April 2018 Senior Notes | $ | 1,500.0 | ||||
(1) | Redeemable, in whole or in part, at our option at any time prior to three months (in the case of the 2028 Senior Notes) or six months (in the case of the 2048 Senior Notes) of the maturity date at the greater of 100% of the principal amount or the sum of the present values of the remaining scheduled payments of principal and interest discounted at the U.S. Treasury rate plus an incremental spread of 0.30% (in the case of the 2028 Senior Notes) or 0.35% (in the case of the 2048 Senior Notes), plus, in each case, accrued and unpaid interest. |
On April 28, 2018, the Company redeemed all of the outstanding $650 million principal amount of Mylan Inc.’s 2.600% senior notes due 2018, all of the outstanding $500 million principal amount of Mylan N.V.’s 3.000% senior notes due 2018 and $350 million of the outstanding $500 million principal amount of Mylan Inc.’s 2.550% senior notes due 2019. The redemption of these notes was funded with the net proceeds from the April 2018 Senior Notes offering.
33
MYLAN N.V. AND SUBSIDIARIES
Notes to Condensed Consolidated Financial Statements (Unaudited) - Continued
May 2018 Euro Senior Notes Offering
On May 23, 2018, Mylan Inc. completed the offering of €500 million aggregate principal amount of its 2.125% Euro Senior Notes due 2025 (the “May 2018 Euro Senior Notes”). The May 2018 Euro Senior Notes were issued pursuant to an indenture dated May 23, 2018. The May 2018 Euro Senior Notes are guaranteed by Mylan N.V. and were issued in a private offering exempt from the registration requirements of the Securities Act, to persons outside of the United States pursuant to Regulation S under the Securities Act. The May 2018 Euro Notes are redeemable, in whole or in part, at our option at any time prior to three months of the maturity date at the greater of 100% of the principal amount or the sum of the present values of the remaining scheduled payments of principal and interest discounted at the applicable Bund Rate plus an incremental spread of 0.30%, plus, in each case, accrued and unpaid interest.
On June 15, 2018, the Company redeemed the remaining $150 million outstanding principal amount of Mylan Inc.’s 2.550% Senior Notes due 2019 and $450 million of the outstanding $1.0 billion principal amount of Mylan N.V.’s 2.500% Senior Notes due 2019. The redemption of these notes was funded with the net proceeds from the May 2018 Euro Senior Notes offering.
Fair Value
At September 30, 2018 and December 31, 2017, the fair value of the Company’s 2.500% Senior Notes due 2019, 3.750% Senior Notes due 2020, 3.150% Senior Notes due 2021, 3.125% Senior Notes due 2023, 4.200% Senior Notes due 2023, 3.950% Senior Notes due 2026, 4.550% Senior Notes due 2028, 5.400% Senior Notes due 2043, 5.250% Senior Notes due 2046 and 5.200% Senior Notes due 2048 (collectively, the “Senior Notes”), 1.250% Euro Senior Notes due 2020, 2.250% Euro Senior Notes due in 2024, 2.125% Euro Senior Notes due in 2025, 3.125% Euro Senior Notes due in 2028, 2018 Floating Rate Euro Notes and 2020 Floating Rate Euro Notes (collectively, the “Euro Notes”) was approximately $14.1 billion and $14.9 billion, respectively. The fair values of the Senior Notes and Euro Notes were valued at quoted market prices from broker or dealer quotations and were classified as Level 2 in the fair value hierarchy. Based on quoted market rates of interest and maturity schedules of similar debt issues, the fair value of the Company’s 2016 Term Facility determined based on Level 2 inputs, approximates its carrying value at September 30, 2018 and December 31, 2017.
Mandatory minimum repayments remaining on the notional amount of outstanding long-term debt at September 30, 2018 were as follows for each of the periods ending December 31:
(In millions) | Total | ||
2018 | $ | 580 | |
2019 | 650 | ||
2020 | 1,951 | ||
2021 | 2,250 | ||
2022 | — | ||
Thereafter | 9,111 | ||
Total | $ | 14,542 | |
34
MYLAN N.V. AND SUBSIDIARIES
Notes to Condensed Consolidated Financial Statements (Unaudited) - Continued
13. | Comprehensive Earnings |
Accumulated other comprehensive loss, as reflected on the Condensed Consolidated Balance Sheets, is comprised of the following:
(In millions) | September 30, 2018 | December 31, 2017 | |||||
Accumulated other comprehensive loss: | |||||||
Net unrealized gain on marketable securities, net of tax | $ | — | $ | 10.1 | |||
Net unrecognized (losses) gains and prior service cost related to defined benefit plans, net of tax | (0.5 | ) | 6.0 | ||||
Net unrecognized losses on derivatives in cash flow hedging relationships, net of tax | (96.9 | ) | (3.7 | ) | |||
Net unrecognized losses on derivatives in net investment hedging relationships, net of tax | (162.1 | ) | (239.8 | ) | |||
Foreign currency translation adjustment | (1,231.4 | ) | (133.8 | ) | |||
$ | (1,490.9 | ) | $ | (361.2 | ) | ||
Components of accumulated other comprehensive loss, before tax, consist of the following, for the three and nine months ended September 30, 2018 and 2017:
Three Months Ended September 30, 2018 | |||||||||||||||||||||||||||||
Gains and Losses on Derivatives in Cash Flow Hedging Relationships | Gains and Losses on Net Investment Hedges | Gains and Losses on Marketable Securities | Defined Pension Plan Items | Foreign Currency Translation Adjustment | Totals | ||||||||||||||||||||||||
(In millions) | Foreign Currency Forward Contracts | Interest Rate Swaps | Total | ||||||||||||||||||||||||||
Balance at June 30, 2018, net of tax | $ | (63.0 | ) | $ | (180.0 | ) | $ | — | $ | 4.3 | $ | (960.6 | ) | $ | (1,199.3 | ) | |||||||||||||
Other comprehensive (loss) earnings before reclassifications, before tax | (52.9 | ) | 18.8 | — | (7.0 | ) | (270.8 | ) | (311.9 | ) | |||||||||||||||||||
Amounts reclassified from accumulated other comprehensive loss, before tax: | |||||||||||||||||||||||||||||
Gain on foreign exchange forward contracts classified as cash flow hedges, included in net sales | (0.9 | ) | (0.9 | ) | (0.9 | ) | |||||||||||||||||||||||
Loss on interest rate swaps classified as cash flow hedges, included in interest expense | 1.9 | 1.9 | 1.9 | ||||||||||||||||||||||||||
Amortization of prior service costs included in SG&A | 0.1 | 0.1 | |||||||||||||||||||||||||||
Amortization of actuarial loss included in SG&A | 0.1 | 0.1 | |||||||||||||||||||||||||||
Net other comprehensive (loss) earnings, before tax | (51.9 | ) | 18.8 | — | (6.8 | ) | (270.8 | ) | (310.7 | ) | |||||||||||||||||||
Income tax (benefit) provision | (18.0 | ) | 0.9 | — | (2.0 | ) | — | (19.1 | ) | ||||||||||||||||||||
Balance at September 30, 2018, net of tax | $ | (96.9 | ) | $ | (162.1 | ) | $ | — | $ | (0.5 | ) | $ | (1,231.4 | ) | $ | (1,490.9 | ) | ||||||||||||
35
MYLAN N.V. AND SUBSIDIARIES
Notes to Condensed Consolidated Financial Statements (Unaudited) - Continued
Nine Months Ended September 30, 2018 | |||||||||||||||||||||||||||||
Gains and Losses on Derivatives in Cash Flow Hedging Relationships | Gains and Losses on Net Investment Hedges | Gains and Losses on Marketable Securities | Defined Pension Plan Items | Foreign Currency Translation Adjustment | Totals | ||||||||||||||||||||||||
(In millions) | Foreign Currency Forward Contracts | Interest Rate Swaps | Total | ||||||||||||||||||||||||||
Balance at December 31, 2017, net of tax | $ | (3.7 | ) | $ | (239.8 | ) | $ | 10.1 | $ | 6.0 | $ | (133.8 | ) | $ | (361.2 | ) | |||||||||||||
Other comprehensive (loss) earnings before reclassifications, before tax | (143.7 | ) | 78.7 | (0.1 | ) | (8.7 | ) | (1,097.6 | ) | (1,171.4 | ) | ||||||||||||||||||
Amounts reclassified from accumulated other comprehensive loss, before tax: | |||||||||||||||||||||||||||||
Gain on foreign exchange forward contracts classified as cash flow hedges, included in net sales | (8.1 | ) | (8.1 | ) | (8.1 | ) | |||||||||||||||||||||||
Loss on interest rate swaps classified as cash flow hedges, included in interest expense | 5.7 | 5.7 | 5.7 | ||||||||||||||||||||||||||
Amortization of prior service costs included in SG&A | 0.3 | 0.3 | |||||||||||||||||||||||||||
Amortization of actuarial loss included in SG&A | 0.1 | 0.1 | |||||||||||||||||||||||||||
Net other comprehensive (loss) earnings, before tax | (146.1 | ) | 78.7 | (0.1 | ) | (8.3 | ) | (1,097.6 | ) | (1,173.4 | ) | ||||||||||||||||||
Income tax (benefit) provision | (50.4 | ) | 1.0 | — | (1.8 | ) | — | (51.2 | ) | ||||||||||||||||||||
Cumulative effect of the adoption of new accounting standards | 2.5 | — | (10.0 | ) | — | — | (7.5 | ) | |||||||||||||||||||||
Balance at September 30, 2018, net of tax | $ | (96.9 | ) | $ | (162.1 | ) | $ | — | $ | (0.5 | ) | $ | (1,231.4 | ) | $ | (1,490.9 | ) | ||||||||||||
36
MYLAN N.V. AND SUBSIDIARIES
Notes to Condensed Consolidated Financial Statements (Unaudited) - Continued
Three Months Ended September 30, 2017 | |||||||||||||||||||||||||||||
Gains and Losses on Derivatives in Cash Flow Hedging Relationships | Gains and Losses on Net Investment Hedges | Gains and Losses on Marketable Securities | Defined Pension Plan Items | Foreign Currency Translation Adjustment | Totals | ||||||||||||||||||||||||
(In millions) | Foreign Currency Forward Contracts | Interest Rate Swaps | Total | ||||||||||||||||||||||||||
Balance at June 30, 2017, net of tax | $ | (17.1 | ) | $ | (132.5 | ) | $ | 22.3 | $ | 0.5 | $ | (828.8 | ) | $ | (955.6 | ) | |||||||||||||
Other comprehensive (loss) earnings before reclassifications, before tax | (4.4 | ) | (72.1 | ) | (8.9 | ) | 0.8 | 423.0 | 338.4 | ||||||||||||||||||||
Amounts reclassified from accumulated other comprehensive loss, before tax: | |||||||||||||||||||||||||||||
Gain on foreign exchange forward contracts classified as cash flow hedges, included in net sales | (2.0 | ) | (2.0 | ) | (2.0 | ) | |||||||||||||||||||||||
Loss on interest rate swaps classified as cash flow hedges, included in interest expense | 1.9 | 1.9 | 1.9 | ||||||||||||||||||||||||||
Amortization of prior service costs included in SG&A | 0.1 | 0.1 | |||||||||||||||||||||||||||
Amortization of actuarial loss included in SG&A | 0.2 | 0.2 | |||||||||||||||||||||||||||
Net other comprehensive (loss) earnings, before tax | (4.5 | ) | (72.1 | ) | (8.9 | ) | 1.1 | 423.0 | 338.6 | ||||||||||||||||||||
Income tax (benefit) provision | (2.8 | ) | — | (3.2 | ) | 0.2 | — | (5.8 | ) | ||||||||||||||||||||
Balance at September 30, 2017, net of tax | $ | (18.8 | ) | $ | (204.6 | ) | $ | 16.6 | $ | 1.4 | $ | (405.8 | ) | $ | (611.2 | ) | |||||||||||||
37
MYLAN N.V. AND SUBSIDIARIES
Notes to Condensed Consolidated Financial Statements (Unaudited) - Continued
Nine Months Ended September 30, 2017 | |||||||||||||||||||||||||||||
Gains and Losses on Derivatives in Cash Flow Hedging Relationships | Gains and Losses on Net Investment Hedges | Gains and Losses on Marketable Securities | Defined Pension Plan Items | Foreign Currency Translation Adjustment | Totals | ||||||||||||||||||||||||
(In millions) | Foreign Currency Forward Contracts | Interest Rate Swaps | Total | ||||||||||||||||||||||||||
Balance at December 31, 2016, net of tax | $ | (38.6 | ) | $ | (1.4 | ) | $ | 14.5 | $ | (0.5 | ) | $ | (2,237.7 | ) | $ | (2,263.7 | ) | ||||||||||||
Other comprehensive earnings (loss) before reclassifications, before tax | 19.9 | (203.2 | ) | 3.5 | 1.7 | 1,831.9 | 1,653.8 | ||||||||||||||||||||||
Amounts reclassified from accumulated other comprehensive loss, before tax: | |||||||||||||||||||||||||||||
Loss on foreign exchange forward contracts classified as cash flow hedges, included in net sales | 3.8 | 3.8 | 3.8 | ||||||||||||||||||||||||||
Loss on interest rate swaps classified as cash flow hedges, included in interest expense | 5.5 | 5.5 | 5.5 | ||||||||||||||||||||||||||
Amortization of prior service costs included in SG&A | 0.2 | 0.2 | |||||||||||||||||||||||||||
Amortization of actuarial gain included in SG&A | 0.5 | 0.5 | |||||||||||||||||||||||||||
Net other comprehensive earnings (loss), before tax | 29.2 | (203.2 | ) | 3.5 | 2.4 | 1,831.9 | 1,663.8 | ||||||||||||||||||||||
Income tax provision | 9.4 | — | 1.4 | 0.5 | — | 11.3 | |||||||||||||||||||||||
Balance at September 30, 2017, net of tax | $ | (18.8 | ) | $ | (204.6 | ) | $ | 16.6 | $ | 1.4 | $ | (405.8 | ) | $ | (611.2 | ) | |||||||||||||
14. | Shareholders’ Equity |
A summary of the changes in shareholders’ equity for the nine months ended September 30, 2018 and 2017 is as follows:
(In millions) | Total | ||
December 31, 2017 | $ | 13,307.6 | |
Net earnings | 301.3 | ||
Other comprehensive loss, net of tax | (1,122.2 | ) | |
Stock option activity | 15.4 | ||
Ordinary share repurchase | (432.0 | ) | |
Share-based compensation expense | (8.6 | ) | |
Issuance of restricted stock, net of shares withheld | (8.1 | ) | |
Cumulative effect of the adoption of new accounting standards | 12.8 | ||
September 30, 2018 | $ | 12,066.2 | |
38
MYLAN N.V. AND SUBSIDIARIES
Notes to Condensed Consolidated Financial Statements (Unaudited) - Continued
(In millions) | Total Mylan N.V. Shareholders' Equity | Noncontrolling Interest | Total | ||||||||
December 31, 2016 | $ | 11,116.2 | $ | 1.4 | $ | 11,117.6 | |||||
Net earnings | 451.7 | — | 451.7 | ||||||||
Other comprehensive earnings, net of tax | 1,652.5 | — | 1,652.5 | ||||||||
Stock option activity | 12.8 | — | 12.8 | ||||||||
Share-based compensation expense | 64.2 | — | 64.2 | ||||||||
Issuance of restricted stock, net of shares withheld | (5.8 | ) | — | (5.8 | ) | ||||||
Other | — | (1.4 | ) | (1.4 | ) | ||||||
September 30, 2017 | $ | 13,291.6 | $ | — | $ | 13,291.6 | |||||
15. | Segment Information |
Mylan reports segment information on a geographic basis. This approach reflects the company’s focus on bringing its broad and diversified portfolio of generic, branded generic, brand-name and over-the-counter products to people in markets everywhere. Our North America segment comprises our operations in the U.S. and Canada. Our Europe segment comprises our operations in more than 35 countries, including France, Italy, Germany, the U.K. and Spain. Our Rest of World segment reflects our operations in more than 120 countries, including Japan, Australia, China, Brazil, Russia, India, South Africa and certain markets in the Middle East and Southeast Asia.
The Company’s chief operating decision maker is the Chief Executive Officer, who evaluates the performance of its segments based on total revenues and segment profitability. Segment profitability represents segment gross profit less direct R&D and direct SG&A. Certain general and administrative and R&D expenses not allocated to the segments, including certain special items, net charges for litigation settlements and other contingencies, amortization of intangible assets, impairment charges and other expenses not directly attributable to the segments are reported separately or outside of segment profitability. Items below the earnings from operations line on the Company’s Condensed Consolidated Statements of Operations are not presented by segment, since they are excluded from the measure of segment profitability. The Company has revised segment profitability for Rest of World to conform with the current presentation by reclassifying approximately $78.2 million of net gains to litigation settlements and other contingencies for the nine months ended September 30, 2017. The Company does not report depreciation expense, total assets and capital expenditures by segment, as such information is not used by the chief operating decision maker.
The accounting policies of the segments are the same as those described in Note 2 Revenue Recognition and Accounts Receivable above and the “Summary of Significant Accounting Policies” included in the 2017 Form 10-K. Intersegment revenues are accounted for at current market values and are eliminated at the consolidated level.
39
MYLAN N.V. AND SUBSIDIARIES
Notes to Condensed Consolidated Financial Statements (Unaudited) - Continued
Presented in the table below is segment information for the periods identified and a reconciliation of segment information to total consolidated information.
(In millions) | North America | Europe | Rest of World | Eliminations | Consolidated | ||||||||||||||
Three Months Ended September 30, 2018 | |||||||||||||||||||
Net sales | $ | 1,012.3 | $ | 1,041.3 | $ | 773.7 | $ | — | $ | 2,827.3 | |||||||||
Other revenue | 20.9 | 7.4 | 6.8 | — | 35.1 | ||||||||||||||
Intersegment revenue | 19.5 | 23.2 | 97.3 | (140.0 | ) | — | |||||||||||||
Total | $ | 1,052.7 | $ | 1,071.9 | $ | 877.8 | $ | (140.0 | ) | $ | 2,862.4 | ||||||||
Segment profitability | $ | 446.0 | $ | 310.5 | $ | 194.6 | $ | — | $ | 951.1 | |||||||||
Intangible asset amortization expense | (412.2 | ) | |||||||||||||||||
Intangible asset impairment charges | (15.5 | ) | |||||||||||||||||
Globally managed research and development costs | (61.9 | ) | |||||||||||||||||
Corporate costs and special items | (143.7 | ) | |||||||||||||||||
Litigation settlements & other contingencies | 20.4 | ||||||||||||||||||
Earnings from operations | $ | 338.2 | |||||||||||||||||
Nine Months Ended September 30, 2018 | |||||||||||||||||||
Net sales | $ | 2,998.4 | $ | 3,070.3 | $ | 2,164.5 | $ | — | $ | 8,233.2 | |||||||||
Other revenue | 84.5 | 19.8 | 17.7 | — | 122.0 | ||||||||||||||
Intersegment revenue | 55.5 | 74.2 | 287.1 | (416.8 | ) | — | |||||||||||||
Total | $ | 3,138.4 | $ | 3,164.3 | $ | 2,469.3 | $ | (416.8 | ) | $ | 8,355.2 | ||||||||
Segment profitability | $ | 1,281.3 | $ | 806.8 | $ | 475.2 | $ | — | $ | 2,563.3 | |||||||||
Intangible asset amortization expense | (1,191.9 | ) | |||||||||||||||||
Intangible asset impairment charges | (87.5 | ) | |||||||||||||||||
Globally managed research and development costs | (213.6 | ) | |||||||||||||||||
Corporate costs and special items | (448.1 | ) | |||||||||||||||||
Litigation settlements & other contingencies | 50.6 | ||||||||||||||||||
Earnings from operations | $ | 672.8 | |||||||||||||||||
40
MYLAN N.V. AND SUBSIDIARIES
Notes to Condensed Consolidated Financial Statements (Unaudited) - Continued
(In millions) | North America | Europe | Rest of World | Eliminations | Consolidated | ||||||||||||||
Three Months Ended September 30, 2017 | |||||||||||||||||||
Net sales | $ | 1,172.2 | $ | 1,040.8 | $ | 743.3 | $ | — | $ | 2,956.3 | |||||||||
Other revenue | 20.0 | 8.9 | 1.9 | — | 30.8 | ||||||||||||||
Intersegment revenue | 15.5 | 18.4 | 87.7 | (121.6 | ) | — | |||||||||||||
Total | $ | 1,207.7 | $ | 1,068.1 | $ | 832.9 | $ | (121.6 | ) | $ | 2,987.1 | ||||||||
Segment profitability | $ | 575.8 | $ | 290.3 | $ | 133.9 | $ | — | $ | 1,000.0 | |||||||||
Intangible asset amortization expense | (369.4 | ) | |||||||||||||||||
Globally managed research and development costs | (76.8 | ) | |||||||||||||||||
Corporate costs and special items | (222.1 | ) | |||||||||||||||||
Litigation settlements & other contingencies | (15.2 | ) | |||||||||||||||||
Earnings from operations | $ | 316.5 | |||||||||||||||||
Nine Months Ended September 30, 2017 | |||||||||||||||||||
Net sales | $ | 3,666.7 | $ | 2,887.1 | $ | 2,016.4 | $ | — | $ | 8,570.2 | |||||||||
Other revenue | 67.3 | 25.0 | 6.3 | — | 98.6 | ||||||||||||||
Intersegment revenue | 60.5 | 87.6 | 275.4 | (423.5 | ) | — | |||||||||||||
Total | $ | 3,794.5 | $ | 2,999.7 | $ | 2,298.1 | $ | (423.5 | ) | $ | 8,668.8 | ||||||||
Segment profitability | $ | 1,810.5 | $ | 776.8 | $ | 358.9 | $ | — | $ | 2,946.2 | |||||||||
Intangible asset amortization expense | (1,052.6 | ) | |||||||||||||||||
Intangible asset impairment charges | (13.0 | ) | |||||||||||||||||
Globally managed research and development costs | (269.0 | ) | |||||||||||||||||
Corporate costs and special items | (619.4 | ) | |||||||||||||||||
Litigation settlements & other contingencies | 25.8 | ||||||||||||||||||
Earnings from operations | $ | 1,018.0 | |||||||||||||||||
16. | Subsidiary Guarantors |
The following tables present condensed consolidating financial information for (a) Mylan N.V., the issuer of the 2.500% Senior Notes due 2019, 3.750% Senior Notes due 2020, 3.150% Senior Notes due 2021, 3.950% Senior Notes due 2026 and 5.250% Senior Notes due 2046 (collectively, the “Mylan N.V. Senior Notes”), which are guaranteed on a senior unsecured basis by Mylan Inc.; (b) Mylan Inc., the issuer of the 3.125% Senior Notes due 2023, 4.200% Senior Notes due 2023, 4.550% Senior Notes due 2028, 5.400% Senior Notes due 2043 and 5.200% Senior Notes due 2048 (collectively, the “Mylan Inc. Senior Notes”), which are guaranteed on a senior unsecured basis by Mylan N.V.; and (c) all other subsidiaries of the Company on a combined basis, none of which guarantee the Mylan N.V. Senior Notes or guarantee the Mylan Inc. Senior Notes (“Non-Guarantor Subsidiaries”). The consolidating adjustments primarily relate to eliminations of investments in subsidiaries and intercompany balances and transactions. The condensed consolidating financial statements present investments in subsidiaries using the equity method of accounting.
The following financial information presents the unaudited Condensed Consolidating Statements of Operations for the three and nine months ended September 30, 2018 and 2017, the unaudited Condensed Consolidating Statements of Comprehensive Earnings for the three and nine months ended September 30, 2018 and 2017, the unaudited Condensed Consolidating Balance Sheets as of September 30, 2018 and December 31, 2017 and the unaudited Condensed Consolidating Statements of Cash Flows for the nine months ended September 30, 2018 and 2017. This unaudited condensed consolidating
41
MYLAN N.V. AND SUBSIDIARIES
Notes to Condensed Consolidated Financial Statements (Unaudited) - Continued
financial information has been prepared and presented in accordance with SEC Regulation S-X Rule 3-10 “Financial Statements of Guarantors and Issuers of Guaranteed Securities Registered or Being Registered.”
The Company has revised its condensed consolidating balance sheet as previously presented in the 2017 Form 10-K to appropriately present intercompany activity relating to certain subsidiaries which were included in the Mylan Inc. column. The Company overstated the line items investment in subsidiaries and total equity within the Mylan Inc. column with a corresponding offset to the elimination column. Specifically, the balance sheet caption investment in subsidiaries has been revised from the previously reported amount of $15.3 billion as of December 31, 2017 to $13.7 billion with an offset to total equity. There is no impact to the consolidated financial statements of Mylan N.V. as previously filed in the 2017 Form 10-K.
42
MYLAN N.V. AND SUBSIDIARIES
Notes to Condensed Consolidated Financial Statements (Unaudited) - Continued
UNAUDITED CONDENSED CONSOLIDATING STATEMENT OF OPERATIONS
Three Months Ended September 30, 2018
(In millions) | Mylan N.V. | Mylan Inc. | Guarantor Subsidiaries | Non-Guarantor Subsidiaries | Eliminations | Consolidated | |||||||||||||||||
Revenues: | |||||||||||||||||||||||
Net sales | $ | — | $ | — | $ | — | $ | 2,827.3 | $ | — | $ | 2,827.3 | |||||||||||
Other revenues | — | — | — | 35.1 | — | 35.1 | |||||||||||||||||
Total revenues | — | — | — | 2,862.4 | — | 2,862.4 | |||||||||||||||||
Cost of sales | — | — | — | 1,823.2 | — | 1,823.2 | |||||||||||||||||
Gross profit | — | — | — | 1,039.2 | — | 1,039.2 | |||||||||||||||||
Operating expenses: | |||||||||||||||||||||||
Research and development | — | — | — | 144.1 | — | 144.1 | |||||||||||||||||
Selling, general and administrative | 11.5 | 117.6 | — | 448.2 | — | 577.3 | |||||||||||||||||
Litigation settlements and other contingencies, net | — | 0.1 | — | (20.5 | ) | — | (20.4 | ) | |||||||||||||||
Total operating expenses | 11.5 | 117.7 | — | 571.8 | — | 701.0 | |||||||||||||||||
(Loss) earnings from operations | (11.5 | ) | (117.7 | ) | — | 467.4 | — | 338.2 | |||||||||||||||
Interest expense | 84.0 | 42.9 | — | 9.3 | — | 136.2 | |||||||||||||||||
Other (income) expense, net | (47.9 | ) | (79.0 | ) | — | 136.7 | — | 9.8 | |||||||||||||||
(Loss) earnings before income taxes | (47.6 | ) | (81.6 | ) | — | 321.4 | — | 192.2 | |||||||||||||||
Income tax (benefit) provision | (8.0 | ) | 18.1 | — | 5.4 | — | 15.5 | ||||||||||||||||
Earnings of equity interest subsidiaries | 216.3 | 143.3 | — | — | (359.6 | ) | — | ||||||||||||||||
Net earnings | $ | 176.7 | $ | 43.6 | $ | — | $ | 316.0 | $ | (359.6 | ) | $ | 176.7 | ||||||||||
43
MYLAN N.V. AND SUBSIDIARIES
Notes to Condensed Consolidated Financial Statements (Unaudited) - Continued
UNAUDITED CONDENSED CONSOLIDATING STATEMENT OF OPERATIONS
Nine Months Ended September 30, 2018
(In millions) | Mylan N.V. | Mylan Inc. | Guarantor Subsidiaries | Non-Guarantor Subsidiaries | Eliminations | Consolidated | |||||||||||||||||
Revenues: | |||||||||||||||||||||||
Net sales | $ | — | $ | — | $ | — | $ | 8,233.2 | $ | — | $ | 8,233.2 | |||||||||||
Other revenues | — | — | — | 122.0 | — | 122.0 | |||||||||||||||||
Total revenues | — | — | — | 8,355.2 | — | 8,355.2 | |||||||||||||||||
Cost of sales | — | — | — | 5,369.2 | — | 5,369.2 | |||||||||||||||||
Gross profit | — | — | — | 2,986.0 | — | 2,986.0 | |||||||||||||||||
Operating expenses: | |||||||||||||||||||||||
Research and development | — | — | — | 555.7 | — | 555.7 | |||||||||||||||||
Selling, general and administrative | 31.0 | 367.7 | — | 1,409.4 | — | 1,808.1 | |||||||||||||||||
Litigation settlements and other contingencies, net | — | 7.1 | — | (57.7 | ) | — | (50.6 | ) | |||||||||||||||
Total operating expenses | 31.0 | 374.8 | — | 1,907.4 | — | 2,313.2 | |||||||||||||||||
(Loss) earnings from operations | (31.0 | ) | (374.8 | ) | — | 1,078.6 | — | 672.8 | |||||||||||||||
Interest expense | 266.1 | 110.9 | — | 30.1 | — | 407.1 | |||||||||||||||||
Other (income) expense, net | (211.5 | ) | (205.0 | ) | — | 460.8 | — | 44.3 | |||||||||||||||
(Loss) earnings before income taxes | (85.6 | ) | (280.7 | ) | — | 587.7 | — | 221.4 | |||||||||||||||
Income tax (benefit) provision | (23.3 | ) | 13.5 | — | (70.1 | ) | — | (79.9 | ) | ||||||||||||||
Earnings of equity interest subsidiaries | 363.6 | 217.2 | — | — | (580.8 | ) | — | ||||||||||||||||
Net earnings (loss) | $ | 301.3 | $ | (77.0 | ) | $ | — | $ | 657.8 | $ | (580.8 | ) | $ | 301.3 | |||||||||
44
MYLAN N.V. AND SUBSIDIARIES
Notes to Condensed Consolidated Financial Statements (Unaudited) - Continued
UNAUDITED CONDENSED CONSOLIDATING STATEMENT OF OPERATIONS
Three Months Ended September 30, 2017
(In millions) | Mylan N.V. | Mylan Inc. | Guarantor Subsidiaries | Non-Guarantor Subsidiaries | Eliminations | Consolidated | |||||||||||||||||
Revenues: | |||||||||||||||||||||||
Net sales | $ | — | $ | — | $ | — | $ | 2,956.3 | $ | — | $ | 2,956.3 | |||||||||||
Other revenues | — | — | — | 30.8 | — | 30.8 | |||||||||||||||||
Total revenues | — | — | — | 2,987.1 | — | 2,987.1 | |||||||||||||||||
Cost of sales | — | — | — | 1,809.0 | — | 1,809.0 | |||||||||||||||||
Gross profit | — | — | — | 1,178.1 | — | 1,178.1 | |||||||||||||||||
Operating expenses: | |||||||||||||||||||||||
Research and development | — | — | — | 182.3 | — | 182.3 | |||||||||||||||||
Selling, general and administrative | 6.5 | 184.3 | — | 473.3 | — | 664.1 | |||||||||||||||||
Litigation settlements and other contingencies, net | — | 17.0 | — | (1.8 | ) | — | 15.2 | ||||||||||||||||
Total operating expenses | 6.5 | 201.3 | — | 653.8 | — | 861.6 | |||||||||||||||||
(Loss) earnings from operations | (6.5 | ) | (201.3 | ) | — | 524.3 | — | 316.5 | |||||||||||||||
Interest expense | 93.3 | 26.7 | — | 11.8 | — | 131.8 | |||||||||||||||||
Other (income) expense, net | (122.3 | ) | (44.7 | ) | — | 172.1 | — | 5.1 | |||||||||||||||
Earnings (loss) before income taxes | 22.5 | (183.3 | ) | — | 340.4 | — | 179.6 | ||||||||||||||||
Income tax provision (benefit) | 2.4 | (0.6 | ) | — | 89.5 | — | 91.3 | ||||||||||||||||
Earnings of equity interest subsidiaries | 68.2 | 129.9 | — | — | (198.1 | ) | — | ||||||||||||||||
Net earnings (loss) | $ | 88.3 | $ | (52.8 | ) | $ | — | $ | 250.9 | $ | (198.1 | ) | $ | 88.3 | |||||||||
45
MYLAN N.V. AND SUBSIDIARIES
Notes to Condensed Consolidated Financial Statements (Unaudited) - Continued
UNAUDITED CONDENSED CONSOLIDATING STATEMENT OF OPERATIONS
Nine Months Ended September 30, 2017
(In millions) | Mylan N.V. | Mylan Inc. | Guarantor Subsidiaries | Non-Guarantor Subsidiaries | Eliminations | Consolidated | |||||||||||||||||
Revenues: | |||||||||||||||||||||||
Net sales | $ | — | $ | — | $ | — | $ | 8,570.2 | $ | — | $ | 8,570.2 | |||||||||||
Other revenues | — | — | — | 98.6 | — | 98.6 | |||||||||||||||||
Total revenues | — | — | — | 8,668.8 | — | 8,668.8 | |||||||||||||||||
Cost of sales | — | — | — | 5,180.3 | — | 5,180.3 | |||||||||||||||||
Gross profit | — | — | — | 3,488.5 | — | 3,488.5 | |||||||||||||||||
Operating expenses: | |||||||||||||||||||||||
Research and development | — | — | — | 580.9 | — | 580.9 | |||||||||||||||||
Selling, general and administrative | 32.4 | 477.6 | — | 1,405.4 | — | 1,915.4 | |||||||||||||||||
Litigation settlements and other contingencies, net | — | 17.0 | — | (42.8 | ) | — | (25.8 | ) | |||||||||||||||
Total operating expenses | 32.4 | 494.6 | — | 1,943.5 | — | 2,470.5 | |||||||||||||||||
(Loss) earnings from operations | (32.4 | ) | (494.6 | ) | — | 1,545.0 | — | 1,018.0 | |||||||||||||||
Interest expense | 285.6 | 77.8 | — | 42.9 | — | 406.3 | |||||||||||||||||
Other (income) expense, net | (331.3 | ) | (161.5 | ) | — | 528.6 | — | 35.8 | |||||||||||||||
Earnings (loss) before income taxes | 13.3 | (410.9 | ) | — | 973.5 | — | 575.9 | ||||||||||||||||
Income tax provision | 1.4 | 5.1 | — | 117.7 | — | 124.2 | |||||||||||||||||
Earnings of equity interest subsidiaries | 439.8 | 788.8 | — | — | (1,228.6 | ) | — | ||||||||||||||||
Net earnings | $ | 451.7 | $ | 372.8 | $ | — | $ | 855.8 | $ | (1,228.6 | ) | $ | 451.7 | ||||||||||
46
MYLAN N.V. AND SUBSIDIARIES
Notes to Condensed Consolidated Financial Statements (Unaudited) - Continued
UNAUDITED CONDENSED CONSOLIDATING STATEMENT OF COMPREHENSIVE EARNINGS
Three Months Ended September 30, 2018
(In millions) | Mylan N.V. | Mylan Inc. | Guarantor Subsidiaries | Non-Guarantor Subsidiaries | Eliminations | Consolidated | |||||||||||||||||
Net earnings | $ | 176.7 | $ | 43.6 | $ | — | $ | 316.0 | $ | (359.6 | ) | $ | 176.7 | ||||||||||
Other comprehensive (loss) earnings, before tax: | |||||||||||||||||||||||
Foreign currency translation adjustment | (270.8 | ) | — | — | (270.8 | ) | 270.8 | (270.8 | ) | ||||||||||||||
Change in unrecognized (loss) gain and prior service cost related to defined benefit plans | (6.8 | ) | 0.1 | — | (6.9 | ) | 6.8 | (6.8 | ) | ||||||||||||||
Net unrecognized (loss) gain on derivatives in cash flow hedging relationships | (51.9 | ) | 1.9 | — | (53.8 | ) | 51.9 | (51.9 | ) | ||||||||||||||
Net unrecognized gain on derivatives in net investment hedging relationships | 18.8 | 4.0 | — | — | (4.0 | ) | 18.8 | ||||||||||||||||
Other comprehensive (loss) earnings, before tax | (310.7 | ) | 6.0 | — | (331.5 | ) | 325.5 | (310.7 | ) | ||||||||||||||
Income tax benefit | (19.1 | ) | (1.6 | ) | — | (17.5 | ) | 19.1 | (19.1 | ) | |||||||||||||
Other comprehensive (loss) earnings, net of tax | (291.6 | ) | 7.6 | — | (314.0 | ) | 306.4 | (291.6 | ) | ||||||||||||||
Comprehensive (loss) earnings | $ | (114.9 | ) | $ | 51.2 | $ | — | $ | 2.0 | $ | (53.2 | ) | $ | (114.9 | ) | ||||||||
47
MYLAN N.V. AND SUBSIDIARIES
Notes to Condensed Consolidated Financial Statements (Unaudited) - Continued
UNAUDITED CONDENSED CONSOLIDATING STATEMENT OF COMPREHENSIVE EARNINGS
Nine Months Ended September 30, 2018
(In millions) | Mylan N.V. | Mylan Inc. | Guarantor Subsidiaries | Non-Guarantor Subsidiaries | Eliminations | Consolidated | |||||||||||||||||
Net earnings (loss) | $ | 301.3 | $ | (77.0 | ) | $ | — | $ | 657.8 | $ | (580.8 | ) | $ | 301.3 | |||||||||
Other comprehensive (loss) earnings, before tax: | |||||||||||||||||||||||
Foreign currency translation adjustment | (1,097.6 | ) | — | — | (1,097.6 | ) | 1,097.6 | (1,097.6 | ) | ||||||||||||||
Change in unrecognized (loss) gain and prior service cost related to defined benefit plans | (8.3 | ) | 0.2 | — | (8.5 | ) | 8.3 | (8.3 | ) | ||||||||||||||
Net unrecognized (loss) gain on derivatives in cash flow hedging relationships | (146.1 | ) | 5.7 | — | (151.8 | ) | 146.1 | (146.1 | ) | ||||||||||||||
Net unrecognized gain on derivatives in net investment hedging relationships | 78.7 | 4.6 | — | — | (4.6 | ) | 78.7 | ||||||||||||||||
Net unrealized loss on marketable securities | (0.1 | ) | — | — | (0.1 | ) | 0.1 | (0.1 | ) | ||||||||||||||
Other comprehensive (loss) earnings, before tax | (1,173.4 | ) | 10.5 | — | (1,258.0 | ) | 1,247.5 | (1,173.4 | ) | ||||||||||||||
Income tax benefit | (51.2 | ) | (2.4 | ) | — | (48.8 | ) | 51.2 | (51.2 | ) | |||||||||||||
Other comprehensive (loss) earnings, net of tax | (1,122.2 | ) | 12.9 | — | (1,209.2 | ) | 1,196.3 | (1,122.2 | ) | ||||||||||||||
Comprehensive loss | $ | (820.9 | ) | $ | (64.1 | ) | $ | — | $ | (551.4 | ) | $ | 615.5 | $ | (820.9 | ) | |||||||
48
MYLAN N.V. AND SUBSIDIARIES
Notes to Condensed Consolidated Financial Statements (Unaudited) - Continued
UNAUDITED CONDENSED CONSOLIDATING STATEMENT OF COMPREHENSIVE EARNINGS
Three Months Ended September 30, 2017
(In millions) | Mylan N.V. | Mylan Inc. | Guarantor Subsidiaries | Non-Guarantor Subsidiaries | Eliminations | Consolidated | |||||||||||||||||
Net earnings (loss) | $ | 88.3 | $ | (52.8 | ) | $ | — | $ | 250.9 | $ | (198.1 | ) | $ | 88.3 | |||||||||
Other comprehensive earnings (loss), before tax: | |||||||||||||||||||||||
Foreign currency translation adjustment | 423.0 | — | — | 423.0 | (423.0 | ) | 423.0 | ||||||||||||||||
Change in unrecognized gain and prior service cost related to defined benefit plans | 1.1 | 0.1 | — | 1.2 | (1.3 | ) | 1.1 | ||||||||||||||||
Net unrecognized (loss) gain on derivatives in cash flow hedging relationships | (4.5 | ) | 1.9 | — | (6.4 | ) | 4.5 | (4.5 | ) | ||||||||||||||
Net unrecognized loss on derivatives in net investment hedging relationships | (72.1 | ) | — | — | — | — | (72.1 | ) | |||||||||||||||
Net unrealized loss on marketable securities | (8.9 | ) | (8.9 | ) | — | — | 8.9 | (8.9 | ) | ||||||||||||||
Other comprehensive earnings (loss), before tax | 338.6 | (6.9 | ) | — | 417.8 | (410.9 | ) | 338.6 | |||||||||||||||
Income tax (benefit) provision | (5.8 | ) | 2.5 | — | (8.0 | ) | 5.5 | (5.8 | ) | ||||||||||||||
Other comprehensive earnings (loss), net of tax | 344.4 | (9.4 | ) | — | 425.8 | (416.4 | ) | 344.4 | |||||||||||||||
Comprehensive earnings (loss) | $ | 432.7 | $ | (62.2 | ) | $ | — | $ | 676.7 | $ | (614.5 | ) | $ | 432.7 | |||||||||
49
MYLAN N.V. AND SUBSIDIARIES
Notes to Condensed Consolidated Financial Statements (Unaudited) - Continued
UNAUDITED CONDENSED CONSOLIDATING STATEMENT OF COMPREHENSIVE EARNINGS
Nine Months Ended September 30, 2017
(In millions) | Mylan N.V. | Mylan Inc. | Guarantor Subsidiaries | Non-Guarantor Subsidiaries | Eliminations | Consolidated | |||||||||||||||||
Net earnings | $ | 451.7 | $ | 372.8 | $ | — | $ | 855.8 | $ | (1,228.6 | ) | $ | 451.7 | ||||||||||
Other comprehensive earnings, before tax: | |||||||||||||||||||||||
Foreign currency translation adjustment | 1,831.9 | — | — | 1,831.9 | (1,831.9 | ) | 1,831.9 | ||||||||||||||||
Change in unrecognized gain and prior service cost related to defined benefit plans | 2.4 | 0.3 | — | 2.1 | (2.4 | ) | 2.4 | ||||||||||||||||
Net unrecognized gain on derivatives in cash flow hedging relationships | 29.2 | 5.5 | — | 23.7 | (29.2 | ) | 29.2 | ||||||||||||||||
Net unrecognized loss on derivatives in net investment hedging relationships | (203.2 | ) | — | — | — | — | (203.2 | ) | |||||||||||||||
Net unrealized gain (loss) on marketable securities | 3.5 | 3.7 | — | (0.2 | ) | (3.5 | ) | 3.5 | |||||||||||||||
Other comprehensive earnings, before tax | 1,663.8 | 9.5 | — | 1,857.5 | (1,867.0 | ) | 1,663.8 | ||||||||||||||||
Income tax provision (benefit) | 11.3 | (3.5 | ) | — | 14.8 | (11.3 | ) | 11.3 | |||||||||||||||
Other comprehensive earnings, net of tax | 1,652.5 | 13.0 | — | 1,842.7 | (1,855.7 | ) | 1,652.5 | ||||||||||||||||
Comprehensive earnings | $ | 2,104.2 | $ | 385.8 | $ | — | $ | 2,698.5 | $ | (3,084.3 | ) | $ | 2,104.2 | ||||||||||
50
MYLAN N.V. AND SUBSIDIARIES
Notes to Condensed Consolidated Financial Statements (Unaudited) - Continued
UNAUDITED CONDENSED CONSOLIDATING BALANCE SHEET
As of September 30, 2018
(In millions) | Mylan N.V. | Mylan Inc. | Guarantor Subsidiaries | Non-Guarantor Subsidiaries | Eliminations | Consolidated | |||||||||||||||||
ASSETS | |||||||||||||||||||||||
Assets | |||||||||||||||||||||||
Current assets: | |||||||||||||||||||||||
Cash and cash equivalents | $ | — | $ | 27.1 | $ | — | $ | 422.1 | $ | — | $ | 449.2 | |||||||||||
Accounts receivable, net | — | 5.0 | — | 2,943.7 | — | 2,948.7 | |||||||||||||||||
Inventories | — | — | — | 2,560.6 | — | 2,560.6 | |||||||||||||||||
Intercompany receivables | 446.0 | 572.8 | — | 11,946.6 | (12,965.4 | ) | — | ||||||||||||||||
Prepaid expenses and other current assets | 4.9 | 67.9 | — | 510.4 | — | 583.2 | |||||||||||||||||
Total current assets | 450.9 | 672.8 | — | 18,383.4 | (12,965.4 | ) | 6,541.7 | ||||||||||||||||
Property, plant and equipment, net | — | 263.7 | — | 1,855.9 | — | 2,119.6 | |||||||||||||||||
Investments in subsidiaries | 18,939.5 | 12,829.4 | — | — | (31,768.9 | ) | — | ||||||||||||||||
Intercompany notes and interest receivable | 6,479.2 | 10,615.5 | — | 2,932.3 | (20,027.0 | ) | — | ||||||||||||||||
Intangible assets, net | — | — | — | 14,239.0 | — | 14,239.0 | |||||||||||||||||
Goodwill | — | 17.1 | — | 9,779.5 | — | 9,796.6 | |||||||||||||||||
Other assets | 0.3 | 58.3 | — | 700.1 | — | 758.7 | |||||||||||||||||
Total assets | $ | 25,869.9 | $ | 24,456.8 | $ | — | $ | 47,890.2 | $ | (64,761.3 | ) | $ | 33,455.6 | ||||||||||
LIABILITIES AND EQUITY | |||||||||||||||||||||||
Liabilities | |||||||||||||||||||||||
Current liabilities: | |||||||||||||||||||||||
Accounts payable | $ | — | $ | 55.8 | $ | — | $ | 1,345.3 | $ | — | $ | 1,401.1 | |||||||||||
Short-term borrowings | — | — | — | 0.4 | — | 0.4 | |||||||||||||||||
Income taxes payable | — | 4.5 | — | 71.2 | — | 75.7 | |||||||||||||||||
Current portion of long-term debt and other long-term obligations | 1,129.3 | 0.2 | — | 46.9 | — | 1,176.4 | |||||||||||||||||
Intercompany payables | 875.5 | 12,019.3 | — | 70.6 | (12,965.4 | ) | — | ||||||||||||||||
Other current liabilities | 138.1 | 315.2 | — | 2,075.1 | — | 2,528.4 | |||||||||||||||||
Total current liabilities | 2,142.9 | 12,395.0 | — | 3,609.5 | (12,965.4 | ) | 5,182.0 | ||||||||||||||||
Long-term debt | 9,507.9 | 3,777.8 | — | 5.7 | — | 13,291.4 | |||||||||||||||||
Intercompany notes payable | 2,152.9 | 3,127.2 | — | 14,746.9 | (20,027.0 | ) | — | ||||||||||||||||
Other long-term obligations | — | 50.7 | — | 2,865.3 | — | 2,916.0 | |||||||||||||||||
Total liabilities | 13,803.7 | 19,350.7 | — | 21,227.4 | (32,992.4 | ) | 21,389.4 | ||||||||||||||||
Total equity | 12,066.2 | 5,106.1 | — | 26,662.8 | (31,768.9 | ) | 12,066.2 | ||||||||||||||||
Total liabilities and equity | $ | 25,869.9 | $ | 24,456.8 | $ | — | $ | 47,890.2 | $ | (64,761.3 | ) | $ | 33,455.6 | ||||||||||
51
MYLAN N.V. AND SUBSIDIARIES
Notes to Condensed Consolidated Financial Statements (Unaudited) - Continued
UNAUDITED CONDENSED CONSOLIDATING BALANCE SHEET
As of December 31, 2017
(In millions) | Mylan N.V. | Mylan Inc. | Guarantor Subsidiaries | Non-Guarantor Subsidiaries | Eliminations | Consolidated | |||||||||||||||||
ASSETS | |||||||||||||||||||||||
Assets | |||||||||||||||||||||||
Current assets: | |||||||||||||||||||||||
Cash and cash equivalents | $ | — | $ | 0.2 | $ | — | $ | 291.9 | $ | — | $ | 292.1 | |||||||||||
Accounts receivable, net | — | 1.0 | — | 3,611.4 | — | 3,612.4 | |||||||||||||||||
Inventories | — | — | — | 2,542.7 | — | 2,542.7 | |||||||||||||||||
Intercompany receivables | 317.2 | 462.1 | — | 11,828.5 | (12,607.8 | ) | — | ||||||||||||||||
Prepaid expenses and other current assets | 5.6 | 171.1 | — | 589.4 | — | 766.1 | |||||||||||||||||
Total current assets | 322.8 | 634.4 | — | 18,863.9 | (12,607.8 | ) | 7,213.3 | ||||||||||||||||
Property, plant and equipment, net | — | 294.1 | — | 2,045.0 | — | 2,339.1 | |||||||||||||||||
Investments in subsidiaries | 19,736.5 | 13,683.3 | — | — | (33,419.8 | ) | — | ||||||||||||||||
Intercompany notes and interest receivable | 7,822.6 | 10,271.2 | — | 2,186.3 | (20,280.1 | ) | — | ||||||||||||||||
Intangible assets, net | — | — | — | 15,245.8 | — | 15,245.8 | |||||||||||||||||
Goodwill | — | 17.1 | — | 10,188.6 | — | 10,205.7 | |||||||||||||||||
Other assets | 4.9 | 56.5 | — | 741.0 | — | 802.4 | |||||||||||||||||
Total assets | $ | 27,886.8 | $ | 24,956.6 | $ | — | $ | 49,270.6 | $ | (66,307.7 | ) | $ | 35,806.3 | ||||||||||
LIABILITIES AND EQUITY | |||||||||||||||||||||||
Liabilities | |||||||||||||||||||||||
Current liabilities: | |||||||||||||||||||||||
Accounts payable | $ | — | $ | 45.3 | $ | — | $ | 1,407.2 | $ | — | $ | 1,452.5 | |||||||||||
Short-term borrowings | — | — | — | 46.5 | — | 46.5 | |||||||||||||||||
Income taxes payable | — | — | — | 112.9 | — | 112.9 | |||||||||||||||||
Current portion of long-term debt and other long-term obligations | 1,097.8 | 649.1 | — | 62.0 | — | 1,808.9 | |||||||||||||||||
Intercompany payables | 664.7 | 11,911.5 | — | 31.6 | (12,607.8 | ) | — | ||||||||||||||||
Other current liabilities | 35.5 | 397.0 | — | 2,532.0 | — | 2,964.5 | |||||||||||||||||
Total current liabilities | 1,798.0 | 13,002.9 | — | 4,192.2 | (12,607.8 | ) | 6,385.3 | ||||||||||||||||
Long-term debt | 10,614.3 | 2,244.5 | — | 6.5 | — | 12,865.3 | |||||||||||||||||
Intercompany notes payable | 2,166.9 | 3,312.7 | — | 14,800.5 | (20,280.1 | ) | — | ||||||||||||||||
Other long-term obligations | — | 57.3 | — | 3,190.8 | — | 3,248.1 | |||||||||||||||||
Total liabilities | 14,579.2 | 18,617.4 | — | 22,190.0 | (32,887.9 | ) | 22,498.7 | ||||||||||||||||
Total equity | 13,307.6 | 6,339.2 | — | 27,080.6 | (33,419.8 | ) | 13,307.6 | ||||||||||||||||
Total liabilities and equity | $ | 27,886.8 | $ | 24,956.6 | $ | — | $ | 49,270.6 | $ | (66,307.7 | ) | $ | 35,806.3 | ||||||||||
52
MYLAN N.V. AND SUBSIDIARIES
Notes to Condensed Consolidated Financial Statements (Unaudited) - Continued
UNAUDITED CONDENSED CONSOLIDATING STATEMENT OF CASH FLOWS
Nine Months Ended September 30, 2018
(In millions) | Mylan N.V. | Mylan Inc. | Guarantor Subsidiaries | Non-Guarantor Subsidiaries | Eliminations | Consolidated | |||||||||||||||||
Cash flows from operating activities: | |||||||||||||||||||||||
Net cash (used in) provided by operating activities | $ | (68.6 | ) | $ | (1,201.6 | ) | $ | — | $ | 2,975.8 | $ | — | $ | 1,705.6 | |||||||||
Cash flows from investing activities: | |||||||||||||||||||||||
Capital expenditures | — | (17.8 | ) | — | (119.6 | ) | — | (137.4 | ) | ||||||||||||||
Purchase of available for sale securities and other investments | — | — | — | (49.4 | ) | — | (49.4 | ) | |||||||||||||||
Proceeds from the sale of marketable securities | — | 36.3 | — | 35.8 | — | 72.1 | |||||||||||||||||
Cash paid for acquisitions, net | — | — | — | (65.9 | ) | — | (65.9 | ) | |||||||||||||||
Investments in affiliates | — | (22.0 | ) | — | — | 22.0 | — | ||||||||||||||||
Dividends from affiliates | 65.3 | — | — | — | (65.3 | ) | — | ||||||||||||||||
Loans to affiliates | (470.6 | ) | — | — | (4,577.1 | ) | 5,047.7 | — | |||||||||||||||
Repayments of loans from affiliates | 1,810.8 | — | — | 3,205.0 | (5,015.8 | ) | — | ||||||||||||||||
Payments for product rights and other, net | — | (0.4 | ) | — | (853.8 | ) | — | (854.2 | ) | ||||||||||||||
Net cash provided by (used in) investing activities | 1,405.5 | (3.9 | ) | — | (2,425.0 | ) | (11.4 | ) | (1,034.8 | ) | |||||||||||||
Cash flows from financing activities: | |||||||||||||||||||||||
Payments of financing fees | (0.5 | ) | (20.2 | ) | — | (0.1 | ) | — | (20.8 | ) | |||||||||||||
Purchase of ordinary shares | (432.0 | ) | — | — | — | — | (432.0 | ) | |||||||||||||||
Change in short-term borrowings, net | — | — | — | (45.9 | ) | — | (45.9 | ) | |||||||||||||||
Proceeds from issuance of long-term debt | 496.5 | 2,079.2 | — | 2.0 | — | 2,577.7 | |||||||||||||||||
Payments of long-term debt | (1,446.5 | ) | (1,150.0 | ) | — | (2.1 | ) | — | (2,598.6 | ) | |||||||||||||
Proceeds from exercise of stock options | 15.6 | — | — | — | — | 15.6 | |||||||||||||||||
Taxes paid related to net share settlement of equity awards | (10.1 | ) | — | — | — | — | (10.1 | ) | |||||||||||||||
Contingent consideration payments | — | — | — | (0.2 | ) | — | (0.2 | ) | |||||||||||||||
Capital contribution from affiliates | — | — | — | 22.0 | (22.0 | ) | — | ||||||||||||||||
Capital payments to affiliates | — | — | — | (65.3 | ) | 65.3 | — | ||||||||||||||||
Payments on borrowings from affiliates | (1,273.9 | ) | (3,010.1 | ) | — | (731.8 | ) | 5,015.8 | — | ||||||||||||||
Proceeds from borrowings from affiliates | 1,314.0 | 3,309.9 | — | 423.8 | (5,047.7 | ) | — | ||||||||||||||||
Other items, net | — | — | — | (0.4 | ) | — | (0.4 | ) | |||||||||||||||
Net cash (used in) provided by financing activities | (1,336.9 | ) | 1,208.8 | — | (398.0 | ) | 11.4 | (514.7 | ) | ||||||||||||||
Effect on cash of changes in exchange rates | — | — | — | (22.9 | ) | — | (22.9 | ) | |||||||||||||||
Net increase in cash, cash equivalents and restricted cash | — | 3.3 | — | 129.9 | — | 133.2 | |||||||||||||||||
Cash, cash equivalents and restricted cash — beginning of period | — | 23.8 | — | 346.1 | — | 369.9 | |||||||||||||||||
Cash, cash equivalents and restricted cash — end of period | $ | — | $ | 27.1 | $ | — | $ | 476.0 | $ | — | $ | 503.1 | |||||||||||
53
MYLAN N.V. AND SUBSIDIARIES
Notes to Condensed Consolidated Financial Statements (Unaudited) - Continued
UNAUDITED CONDENSED CONSOLIDATING STATEMENT OF CASH FLOWS
Nine Months Ended September 30, 2017
(In millions) | Mylan N.V. | Mylan Inc. | Guarantor Subsidiaries | Non-Guarantor Subsidiaries | Eliminations | Consolidated | |||||||||||||||||
Cash flows from operating activities: | |||||||||||||||||||||||
Net cash (used in) provided by operating activities | $ | (175.1 | ) | $ | (338.8 | ) | $ | — | $ | 2,083.2 | $ | — | $ | 1,569.3 | |||||||||
Cash flows from investing activities: | |||||||||||||||||||||||
Capital expenditures | — | (31.4 | ) | — | (125.0 | ) | — | (156.4 | ) | ||||||||||||||
Purchase of available for sale securities and other investments | — | — | — | (8.9 | ) | — | (8.9 | ) | |||||||||||||||
Proceeds from the sale of assets | — | — | — | 31.1 | — | 31.1 | |||||||||||||||||
Proceeds from the sale of marketable securities | — | — | — | 8.9 | — | 8.9 | |||||||||||||||||
Cash paid for acquisitions, net | (71.6 | ) | — | — | — | — | (71.6 | ) | |||||||||||||||
Investments in affiliates | — | (21.1 | ) | — | — | 21.1 | — | ||||||||||||||||
Dividends from affiliates | 168.1 | — | — | — | (168.1 | ) | — | ||||||||||||||||
Loans to affiliates | (143.7 | ) | (364.1 | ) | — | (2,558.0 | ) | 3,065.8 | — | ||||||||||||||
Repayments of loans from affiliates | 1,066.4 | 0.3 | — | 943.6 | (2,010.3 | ) | — | ||||||||||||||||
Payments for product rights and other, net | — | (0.3 | ) | — | (558.5 | ) | — | (558.8 | ) | ||||||||||||||
Net cash provided by (used in) investing activities | 1,019.2 | (416.6 | ) | — | (2,266.8 | ) | 908.5 | (755.7 | ) | ||||||||||||||
Cash flows from financing activities: | |||||||||||||||||||||||
Payments of financing fees | (8.3 | ) | (0.4 | ) | — | — | — | (8.7 | ) | ||||||||||||||
Change in short-term borrowings, net | — | — | — | (48.3 | ) | — | (48.3 | ) | |||||||||||||||
Proceeds from issuance of long-term debt | 554.5 | — | — | 1.3 | — | 555.8 | |||||||||||||||||
Payments of long-term debt | (1,500.0 | ) | — | — | (247.3 | ) | — | (1,747.3 | ) | ||||||||||||||
Proceeds from exercise of stock options | 12.8 | — | — | — | — | 12.8 | |||||||||||||||||
Taxes paid related to net share settlement of equity awards | (7.4 | ) | — | — | — | — | (7.4 | ) | |||||||||||||||
Contingent consideration payments | — | — | — | (10.1 | ) | — | (10.1 | ) | |||||||||||||||
Capital contribution from affiliates | — | — | — | 21.1 | (21.1 | ) | — | ||||||||||||||||
Capital payments to affiliates | — | — | — | (168.1 | ) | 168.1 | — | ||||||||||||||||
Payments on borrowings from affiliates | — | (1,664.4 | ) | — | (345.9 | ) | 2,010.3 | — | |||||||||||||||
Proceeds from borrowings from affiliates | 104.0 | 2,497.5 | — | 464.3 | (3,065.8 | ) | — | ||||||||||||||||
Other items, net | — | (7.4 | ) | — | 6.7 | — | (0.7 | ) | |||||||||||||||
Net cash (used in) provided by financing activities | (844.4 | ) | 825.3 | — | (326.3 | ) | (908.5 | ) | (1,253.9 | ) | |||||||||||||
Effect on cash of changes in exchange rates | — | — | — | 44.1 | — | 44.1 | |||||||||||||||||
Net (decrease) increase in cash, cash equivalents and restricted cash | (0.3 | ) | 69.9 | — | (465.8 | ) | — | (396.2 | ) | ||||||||||||||
Cash, cash equivalents and restricted cash — beginning of period | 0.3 | 85.4 | — | 1,061.3 | — | 1,147.0 | |||||||||||||||||
Cash, cash equivalents and restricted cash — end of period | $ | — | $ | 155.3 | $ | — | $ | 595.5 | $ | — | $ | 750.8 | |||||||||||
54
MYLAN N.V. AND SUBSIDIARIES
Notes to Condensed Consolidated Financial Statements (Unaudited) - Continued
The following tables provide a reconciliation of cash and cash equivalents, as reported on our unaudited condensed consolidating balance sheets, to cash, cash equivalents and restricted cash, as reported on our unaudited condensed consolidating statements of cash flows (in millions):
September 30, 2018 | |||||||||||||||||||||||
Mylan N.V. | Mylan Inc. | Guarantor Subsidiaries | Non-Guarantor Subsidiaries | Eliminations | Consolidated | ||||||||||||||||||
Cash and cash equivalents | $ | — | $ | 27.1 | $ | — | $ | 422.1 | $ | — | $ | 449.2 | |||||||||||
Restricted cash, included in prepaid expenses and other current assets | — | — | — | 53.9 | — | 53.9 | |||||||||||||||||
Cash, cash equivalents and restricted cash | $ | — | $ | 27.1 | $ | — | $ | 476.0 | $ | — | $ | 503.1 | |||||||||||
December 31, 2017 | |||||||||||||||||||||||
Mylan N.V. | Mylan Inc. | Guarantor Subsidiaries | Non-Guarantor Subsidiaries | Eliminations | Consolidated | ||||||||||||||||||
Cash and cash equivalents | $ | — | $ | 0.2 | $ | — | $ | 291.9 | $ | — | $ | 292.1 | |||||||||||
Restricted cash, included in prepaid expenses and other current assets | — | 23.6 | — | 54.2 | — | 77.8 | |||||||||||||||||
Cash, cash equivalents and restricted cash | $ | — | $ | 23.8 | $ | — | $ | 346.1 | $ | — | $ | 369.9 | |||||||||||
September 30, 2017 | |||||||||||||||||||||||
Mylan N.V. | Mylan Inc. | Guarantor Subsidiaries | Non-Guarantor Subsidiaries | Eliminations | Consolidated | ||||||||||||||||||
Cash and cash equivalents | $ | — | $ | 82.2 | $ | — | $ | 532.7 | $ | — | $ | 614.9 | |||||||||||
Restricted cash, included in prepaid expenses and other current assets | — | 73.1 | — | 62.8 | — | 135.9 | |||||||||||||||||
Cash, cash equivalents and restricted cash | $ | — | $ | 155.3 | $ | — | $ | 595.5 | $ | — | $ | 750.8 | |||||||||||
55
MYLAN N.V. AND SUBSIDIARIES
Notes to Condensed Consolidated Financial Statements (Unaudited) - Continued
17. | Restructuring |
On December 5, 2016, the Company announced restructuring programs in certain locations representing initial steps in a series of actions that are anticipated to further streamline its operations globally. Since 2015, the Company has made a number of significant acquisitions, and as part of the holistic, global integration of these acquisitions, the Company is focused on how to best optimize and maximize all of its assets across the organization and across all geographies.
Charges for restructuring and ongoing cost reduction initiatives are recorded in the period the Company commits to a restructuring or cost reduction plan, or executes specific actions contemplated by the plan and all criteria for liability recognition have been met.
The Company continues to develop the details of the cost reduction initiatives, including workforce actions and other potential restructuring activities beyond the programs announced, including potential shutdown or consolidation of certain operations. During the second quarter of 2018, the Company commenced a restructuring and remediation program at its Morgantown, West Virginia facility, for which activities and initiatives are ongoing. The continued restructuring actions other than for this facility are expected to be implemented through fiscal year 2018. The Company anticipates total aggregate pre-tax charges for committed restructuring activities ranging between $500.0 million and $600.0 million, inclusive of all restructuring charges incurred through September 30, 2018. As additional restructuring activities are undertaken, the Company expects to incur additional costs including employee related costs, such as severance and continuation of healthcare and other benefits; asset impairments; accelerated depreciation; costs associated with contract terminations; and other closure costs. At this time, the expenses related to the additional restructuring activities cannot be reasonably estimated.
The following table summarizes the restructuring charges and the reserve activity from December 31, 2017 to September 30, 2018:
(In millions) | Employee Related Costs | Other Exit Costs | Total | ||||||||
Balance at December 31, 2017: | $ | 92.9 | $ | 14.1 | $ | 107.0 | |||||
Charges (1) | 15.1 | 30.3 | 45.4 | ||||||||
Cash payment | (28.7 | ) | (2.8 | ) | (31.5 | ) | |||||
Utilization | — | (30.8 | ) | (30.8 | ) | ||||||
Foreign currency translation | 0.6 | — | 0.6 | ||||||||
Balance at March 31, 2018: | $ | 79.9 | $ | 10.8 | $ | 90.7 | |||||
Charges (1) | 35.1 | 41.0 | 76.1 | ||||||||
Cash payment | (31.1 | ) | (8.2 | ) | (39.3 | ) | |||||
Utilization | — | (28.0 | ) | (28.0 | ) | ||||||
Foreign currency translation | (2.7 | ) | (0.6 | ) | (3.3 | ) | |||||
Balance at June 30, 2018: | $ | 81.2 | $ | 15.0 | $ | 96.2 | |||||
Charges (1) | 16.2 | 64.6 | 80.8 | ||||||||
Cash payment | (19.3 | ) | (7.5 | ) | (26.8 | ) | |||||
Utilization | — | (54.6 | ) | (54.6 | ) | ||||||
Foreign currency translation | (0.3 | ) | 0.2 | (0.1 | ) | ||||||
Balance at September 30, 2018: | $ | 77.8 | $ | 17.7 | $ | 95.5 | |||||
(1) | For the three months ended September 30, 2018, total restructuring charges in North America, Europe, and Rest of World were approximately $49.7 million, $28.5 million, and $2.6 million, respectively. For the nine months ended September 30, 2018, total restructuring charges in North America, Europe, Rest of World and corporate were approximately $108.1 million, $79.9 million, $13.3 million and $1.0 million, respectively. |
At September 30, 2018 and December 31, 2017, accrued liabilities for restructuring and other cost reduction programs were primarily included in other current liabilities on the Condensed Consolidated Balance Sheets.
56
MYLAN N.V. AND SUBSIDIARIES
Notes to Condensed Consolidated Financial Statements (Unaudited) - Continued
18. | Collaboration and Licensing Agreements |
We periodically enter into collaboration and licensing agreements with other pharmaceutical companies for the development, manufacture, marketing and/or sale of pharmaceutical products. Our significant collaboration agreements are focused on the development, manufacturing, supply and commercialization of multiple, high-value generic biologic compounds, insulin analog products and respiratory products, among other complex products. Under these agreements, we have future potential milestone payments and co-development expenses payable to third parties as part of our licensing, development and co-development programs. Payments under these agreements generally become due and are payable upon the satisfaction or achievement of certain developmental, regulatory or commercial milestones or as development expenses are incurred on defined projects. Milestone payment obligations are uncertain, including the prediction of timing and the occurrence of events triggering a future obligation and are not reflected as liabilities in the Condensed Consolidated Balance Sheets, except for milestone and royalty obligations reflected as acquisition related contingent consideration. Refer to Note 11 Financial Instruments and Risk Management for contingent consideration amounts recorded. Our potential maximum development milestones not accrued for at September 30, 2018 totaled approximately $430 million, which includes the new agreements entered into as described in Note 4 Acquisitions and Other Transactions, and excludes potential milestone payments to Momenta Pharmaceuticals, Inc. (“Momenta”). We estimate the amounts that may be paid within the next year to be approximately $70 million. These agreements may also include potential sales-based milestones and call for us to pay a percentage of amounts earned from the sale of the product as a royalty or a profit share. The amounts disclosed do not include sales-based milestones or royalty obligations on future sales of product as the timing and amount of future sales levels and costs to produce products subject to these obligations is not reasonably estimable. These sales-based milestones or royalty obligations may be significant depending upon the level of commercial sales for each product.
On October 1, 2018, Momenta announced that it had initiated discussions with Mylan, to exit its participation in the development of five biosimilar programs including M834, a proposed biosimilar to ORENCIA®. Momenta also announced that it intends to continue the development of M710, a proposed biosimilar to EYLEA® (aflibercept) injection. While the Company is in the process of discussing the transition of collaboration activities with Momenta, it remains committed to invest strategically in biosimilar programs through the evaluation of regulatory data and market dynamics.
There have been no other significant changes to our collaboration and licensing agreements as disclosed in our 2017 Form 10-K.
19. | Income Taxes |
On December 22, 2017, the U.S. government enacted the Tax Act. The Tax Act makes broad and complex changes to the Code including, but not limited to, reducing the U.S. federal corporate income tax rate and requiring a one-time transition tax on certain unrepatriated earnings of non-U.S. corporate subsidiaries of large U.S. shareholders that may electively be paid over eight years. While the Tax Act reduces the U.S. federal corporate income tax rate from 35% to 21% for tax years beginning after December 31, 2017, ASC Topic 740 required the Company to remeasure its deferred tax balances in 2017 in accordance with the 2018 rate reduction.
The Tax Act also puts in place new tax laws that impact our taxable income beginning in 2018, which include, but are not limited to (1) creating a Base Erosion Anti-Abuse Tax (“BEAT”), which is a new minimum tax, (2) generally eliminating U.S. federal income taxes on dividends from foreign subsidiaries (the “participation exemption”), (3) a new provision designed to tax currently global intangible low-taxed income (“GILTI”) earned by non-U.S. corporate subsidiaries of large U.S. shareholders and a deduction generally equal to 50 percent of GILTI (37.5 percent for tax years beginning after December 31, 2025) to offset the income tax liability, (4) a provision limiting the amount of deductible interest expense in the U.S., (5) the repeal of the domestic manufacturing deduction, (6) limitations on the deductibility of certain executive compensation, and (7) limitations on the utilization of foreign tax credits to reduce the U.S. income tax liability.
Shortly after the Tax Act was enacted, the SEC staff issued Staff Accounting Bulletin No. 118, Income Tax Accounting Implications of the Tax Cuts and Jobs Act (“SAB 118”) which provides guidance on accounting for the Tax Act’s impact. SAB 118 provides a measurement period, which in no case should extend beyond one year from the Tax Act enactment date, during which a company acting in good faith may complete the accounting for the impacts of the Tax Act under ASC Topic 740. In accordance with SAB 118, the Company must reflect the income tax effects of the Tax Act in the reporting period in which the accounting under ASC Topic 740 is complete.
57
MYLAN N.V. AND SUBSIDIARIES
Notes to Condensed Consolidated Financial Statements (Unaudited) - Continued
To the extent that the accounting for certain income tax effects of the Tax Act is incomplete, a company can determine a reasonable estimate for those effects and record a provisional estimate in the financial statements in the first reporting period in which a reasonable estimate can be determined. The Company recorded a provisional net tax charge of $128.6 million related to the Tax Act in the year ended December 31, 2017. This net charge primarily consisted of a net expense of $15.0 million due to the remeasurement of our net deferred tax accounts to reflect the U.S. federal corporate income tax rate reduction to 21% and a net expense for the transition tax of $113.6 million.
The transition tax is a 2017 tax on the previously untaxed accumulated and current earnings and profits of certain of our foreign subsidiaries, which the Company expects to pay, net of certain tax attributes and credit carryforwards, over eight years beginning in 2018. This amount is presented in other long-term liabilities in the Condensed Consolidated Balance Sheets.
Proposed regulations issued by the U.S. Department of the Treasury on August 1, 2018, provided further interpretive guidance on the transition tax. During the three months ended September 30, 2018, the Company revised its estimated liability for the transition tax from $113.6 million to $92.3 million. The $21.3 million benefit was recorded as a component of the Company’s tax provision during the three months ended September 30, 2018.
The Tax Act includes a provision designed to currently tax GILTI earned by non-U.S. corporate subsidiaries of large U.S. shareholders starting in 2018. The Company has elected, as permitted in FASB Staff Q&A - Topic 740 - No. 5, to treat any future GILTI tax liabilities as period costs and will expense those liabilities in the period incurred. The Company therefore will not record deferred taxes associated with the GILTI provision of the Tax Act.
As of December 31, 2017, the Company’s practice and intention was to reinvest the earnings in our non-U.S. subsidiaries outside of the U.S., and no U.S. deferred income taxes or foreign withholding taxes were recorded. The transition tax noted above will result in the previously untaxed foreign earnings being included in the federal and state 2017 taxable income. We are currently analyzing our global working capital requirements and the potential tax liabilities that would be incurred if the non-U.S. subsidiaries distribute cash to the U.S. parent, which include local country withholding tax and potential U.S. state taxation. For these reasons, we were not yet able to reasonably estimate the effect of this provision of the Tax Act and have not recorded any withholding or state tax liabilities.
The Company is also analyzing other provisions of the Tax Act that come into effect for tax years starting in 2018 to determine if these items would impact the effective tax rate. These provisions include BEAT, the participation exemption, the treatment of amounts in accumulated other comprehensive income, the new provision that could limit the amount of deductible interest expense in the U.S., and the limitations on the deductibility of certain executive compensation.
Tax Examinations
The Company is subject to income taxes and tax audits in many jurisdictions. A certain degree of estimation is thus required in recording the assets and liabilities related to income taxes. Tax audits and examinations can involve complex issues, interpretations, and judgments and the resolution of matters that may span multiple years, particularly if subject to litigation or negotiation.
Although the Company believes that adequate provisions have been made for these uncertain tax positions, the Company’s assessment of uncertain tax positions is based on estimates and assumptions that the Company believes are reasonable but the estimates for unrecognized tax benefits and potential tax benefits may not be representative of actual outcomes, and variations from such estimates could materially affect the Company’s financial condition, results of operations or cash flows in the period of resolution, settlement or when the statutes of limitations expire.
Mylan is subject to ongoing U.S. Internal Revenue Service (“IRS”) examinations and is a voluntary participant in the IRS Compliance Assurance Process (“CAP”), which allows Mylan to work collaboratively with the IRS to identify and review tax matters on an ongoing basis. The years 2015, 2016 and 2017 are open years under examination. The years 2012, 2013 and 2014 have one matter open, and a Tax Court petition has been filed regarding the matter and trial has tentatively been scheduled for December 2018. On February 27, 2015, Mylan N.V. acquired Mylan Inc. and Abbott Laboratories’ non-U.S. developed markets specialty and branded generics business (collectively, the “EPD Business Acquisition”). In connection with the EPD Business Acquisition, we entered into intercompany transactions with our affiliates that affect our U.S. tax liability. Mylan N.V. is not incorporated in the U.S. and expects to be treated as a non-U.S. corporation for U.S. federal income tax purposes. As part of our ongoing participation and cooperation in the CAP, we have received and responded to various IRS requests for information about, among other matters, the EPD Business Acquisition, including the interest rates used for intercompany loans
58
MYLAN N.V. AND SUBSIDIARIES
Notes to Condensed Consolidated Financial Statements (Unaudited) - Continued
and our status as a non-U.S. corporation for U.S. federal income tax purposes. As previously disclosed, the IRS may challenge our positions on the EPD Business Acquisition. If the IRS chooses to challenge our positions, and if the IRS succeeds, a successful challenge may have a material effect on our U.S. tax liability beginning February 27, 2015.
The Company’s major state taxing jurisdictions remain open from fiscal year 2008 through 2017, with several state audits currently in progress. The Company’s major international taxing jurisdictions remain open from 2011 through 2017, some of which are indemnified by Strides Arcolab Limited (“Strides Arcolab”) for tax assessments.
Tax Court Proceeding
The Company's U.S. federal income tax returns for 2007 through 2011 had been subject to proceedings in U.S. Tax Court involving a dispute with the IRS regarding whether the proceeds received by the Company in connection with the 2008 sale of its rights in nebivolol constituted a capital gain or ordinary income. The Company and the IRS filed a joint stipulation of settled issues with the Tax Court that resolved all issues in this dispute and the Tax Court issued the final order closing the case during the three months ended March 31, 2018.
Accounting for Uncertainty in Income Taxes
During the nine months ended September 30, 2018, as a result of federal and state audits and settlements and expirations of certain state, federal, and foreign statutes of limitations, the Company reduced its liability for unrecognized tax benefits by approximately $85.3 million, which resulted in a net benefit to the income tax provision of approximately $52.3 million.
20. | Litigation |
The Company is involved in various disputes, governmental and/or regulatory inquiries, investigations and proceedings, tax proceedings and litigation matters, both in the U.S. and abroad, that arise from time to time, some of which could result in losses, including damages, fines and/or civil penalties, and/or criminal charges against the Company. These matters are often complex and have outcomes that are difficult to predict. The Company is also party to certain proceedings and litigation matters for which it may be entitled to indemnification under the respective sale and purchase agreements relating to the acquisitions of the former Merck Generics business, Agila, Abbott Laboratories’ (“Abbott”) non-U.S. developed markets specialty and branded generics business, and certain other acquisitions.
While the Company believes that it has meritorious defenses with respect to the claims asserted against it and intends to vigorously defend its position, the process of resolving these matters is inherently uncertain and may develop over a long period of time, and so it is not possible to predict the ultimate resolution of any such matter. It is possible that an unfavorable resolution of any of the ongoing matters or the inability or denial of Merck KGaA, Strides Arcolab, Abbott, or another indemnitor or insurer to pay an indemnified claim, could have a material effect on the Company’s business, financial condition, results of operations, cash flows and/or ordinary share price.
Some of these governmental inquiries, investigations, proceedings and litigation matters with which the Company is involved are described below, and unless otherwise disclosed, the Company is unable to predict the outcome of the matter or to provide an estimate of the range of reasonably possible material losses. The Company records accruals for loss contingencies to the extent we conclude it is probable that a liability has been incurred and the amount of the loss can be reasonably estimated. The Company is also involved in other pending proceedings for which, in the opinion of the Company based upon facts and circumstances known at the time, either the likelihood of loss is remote or any reasonably possible loss associated with the resolution of such proceedings is not expected to be material to the Company’s business, financial position, results of operations, cash flows and/or ordinary share price. If and when any reasonably possible losses associated with the resolution of such other pending proceedings, in the opinion of the Company, become material, the Company will disclose such matters.
Legal costs are recorded as incurred and are classified in SG&A in the Company’s Condensed Consolidated Statements of Operations.
Lorazepam and Clorazepate
On June 1, 2005, a jury verdict was rendered against Mylan, MPI, and co-defendants Cambrex Corporation and Gyma Laboratories in the U.S. District Court for the District of Columbia in the amount of approximately $12.0 million in an antitrust
59
MYLAN N.V. AND SUBSIDIARIES
Notes to Condensed Consolidated Financial Statements (Unaudited) - Continued
case brought by four health insurers who opted out of earlier class action settlements agreed to by the Company in 2001. The Court entered final judgment on August 30, 2017 in the amount of approximately $67.0 million (not including post-judgment interest and fees and costs). Mylan filed a notice of appeal on September 15, 2017 with the United States Court of Appeals for the District of Columbia Circuit. This matter has been resolved by way of settlement and the case is closed. The Company paid approximately $34.5 million during 2018 related to this matter.
The Company maintained a surety bond underwritten by a third-party insurance company in the amount of $66.6 million which has been released.
Pricing and Medicaid Litigation
Dey L.P. (now known as Mylan Specialty L.P. and herein as “Mylan Specialty”), a wholly owned subsidiary of the Company, was named in 1997 as a defendant in a case brought by the United States as well as in later filed class actions brought by consumers and third-party payors. All of the cases and claims brought against Mylan Specialty have been fully resolved and dismissed.
Under the terms of the purchase agreement with Merck KGaA, Mylan is fully indemnified for the claims in the preceding paragraph and Merck KGaA is entitled to any income tax benefit the Company realizes for any deductions of amounts paid for such pricing litigation. In the second quarter, the Company paid approximately $23.5 million, and in October 2018, the Company paid approximately $42.2 million. No further amounts are owed by the Company.
Modafinil Antitrust Litigation
Beginning in April 2006, Mylan and four other drug manufacturers were named as defendants in civil lawsuits filed in or transferred to the U.S. District Court for the Eastern District of Pennsylvania (“EDPA”) by a variety of plaintiffs purportedly representing direct and indirect purchasers of the drug modafinil and in a lawsuit filed by Apotex, Inc., a manufacturer of generic drugs. These actions alleged violations of federal antitrust and state laws in connection with the generic defendants’ settlement of patent litigation with Cephalon relating to modafinil. Mylan entered into a settlement agreement with the putative indirect purchasers for approximately $16.0 million, which is subject to court approval. Mylan has settled with the putative direct purchaser class and the retailer opt-out plaintiffs for $165 million, a portion of which was paid by the Company prior to 2018, and a final amount of approximately $89.2 million was paid in April 2018. Mylan and Apotex have also settled Apotex’s claims. The Company has also received subpoenas from certain state attorneys general requesting documents related to the modafinil patent litigation.
On July 10, 2015, the Louisiana Attorney General filed in the 19th Judicial District Court in Louisiana a petition against Mylan and three other drug manufacturers asserting state law claims based on the same underlying allegations as those made in the litigation then pending in the EDPA. On December 8, 2016, Mylan’s peremptory exceptions of no cause of action with respect to the supplemental and amended petition were granted in their entirety and with prejudice. The State of Louisiana appealed this decision. The First Circuit Court of Appeal subsequently returned the case to the District Court with instructions to include certain decretal language in order to make the District Court’s decision final and appealable.
On July 28, 2016, United Healthcare filed a complaint against Mylan Inc. and four other drug manufacturers in the United States District Court for the District of Minnesota, asserting state law claims based on the same underlying allegations as those made in the litigation then pending in the EDPA. On January 6, 2017, the case was transferred to the EDPA and is still pending. MPI has since been included as an additional party. A trial date has been scheduled for July 2019.
The Company believes that it has strong defenses to these remaining cases. Although it is reasonably possible that the Company may incur additional losses from these matters, any amount cannot be reasonably estimated at this time.
The Company has a total accrual of approximately $16.0 million related to this matter at September 30, 2018, which is included in other current liabilities in the Condensed Consolidated Balance Sheets.
60
MYLAN N.V. AND SUBSIDIARIES
Notes to Condensed Consolidated Financial Statements (Unaudited) - Continued
Pioglitazone
Beginning in December 2013, Mylan, Takeda, and several other drug manufacturers have been named as defendants in civil lawsuits consolidated in the U.S. District Court for the Southern District of New York by plaintiffs which purport to represent direct and indirect purchasers of branded or generic Actos® and Actoplus Met®. These actions allege violations of state and federal competition laws in connection with the defendants’ settlements of patent litigation in 2010 related to Actos® and Actoplus Met®. Mylan’s motion to dismiss the indirect purchasers’ complaint was granted and no appeal was filed as to Mylan. Following the appellate decision relating to other defendants, the direct purchasers filed an amended complaint against Mylan and the other manufacturers. Mylan’s motion to dismiss the amended complaint is pending.
SEC Investigation
On September 10, 2015, Mylan N.V. received a subpoena from the SEC seeking documents with regard to certain related party matters. Mylan has received additional requests for information and will continue to fully cooperate with the SEC.
Trade Agreements Act (“TAA”)
On April 9, 2018, a subsidiary of Mylan N.V. received a civil investigative demand from the Commercial Litigation Branch of the U.S. Department of Justice (“DOJ”) concerning its TAA compliance for certain products. The company fully cooperated with DOJ. On September 14, 2018, the United States District Court for the Southern District of Ohio unsealed a qui tam lawsuit filed against the Mylan N.V. subsidiary concerning its TAA compliance for the same products identified in DOJ’s civil investigative demand. DOJ has declined to intervene in the lawsuit and has closed its investigation. We believe that the claims in this lawsuit are without merit and intend to defend against them vigorously.
EpiPen® Auto-Injector and Certain Congressional Matters
Classification of EpiPen® Auto-Injector and EpiPen Jr® Auto-Injector
In November 2014, the Company received a subpoena from the DOJ related to the classification of the EpiPen® Auto-Injector for purposes of the Medicaid Drug Rebate Program (“MDRP”). On August 17, 2017, two of Mylan’s subsidiaries - Mylan Inc. and Mylan Specialty - signed an agreement for a $465 million settlement, plus interest, with the DOJ, state government agencies and two relators (the “MDRP Settlement”). The settlement with the DOJ, two relators and all 50 states plus the District of Columbia has been completed and both the federal and state matters have been dismissed through stipulations of dismissal. In connection with the settlement, Mylan Inc. and Mylan Specialty entered into a Corporate Integrity Agreement (the “CIA”) with the Office of Inspector General of the Department of Health and Human Services. The CIA has a five-year term and requires, among other things, that an independent review organization annually review various matters relating to the MDRP. Neither the settlement agreement nor the CIA contains an admission or finding of wrongdoing. In connection with the settlement, Mylan Specialty has reclassified EpiPen® Auto-Injector as an innovator product for purposes of the MDRP effective April 1, 2017. The Company recorded an accrual for the full settlement amount during the year ended December 31, 2016 and recorded an additional accrual for interest related to the settlement amount prior to the payment made in 2017.
Department of Veterans Affairs Request for Information
On June 30, 2017, the Company responded to a request for information from the Department of Veterans Affairs (“VA”) (acting on behalf of itself and other government agencies) requesting certain historical pricing data related to the EpiPen® Auto-Injector. The Company and the VA are engaged in a continuing dialogue regarding the classification of the EpiPen® Auto-Injector as a covered drug under Section 603 of the Veterans Health Care Act of 1992, Public Law 102-585. The EpiPen® Auto-Injector has been classified as a non covered drug with the VA based upon long standing written guidance from the federal government. The Company is fully cooperating with the VA.
SEC Request for Information/Subpoenas
On October 7, 2016, Mylan received a document request from the SEC’s Division of Enforcement seeking communications with the Centers for Medicare and Medicaid Services and documents concerning Mylan products sold and related to the MDRP, and any related complaints. On November 15, 2016, Mylan received a follow-up letter, modifying the
61
MYLAN N.V. AND SUBSIDIARIES
Notes to Condensed Consolidated Financial Statements (Unaudited) - Continued
initial document request, seeking information on and public disclosures regarding the MDRP Settlement and the classification of the EpiPen® Auto-Injector under the MDRP. Mylan has received subpoenas and additional requests for information in this matter and will continue to fully cooperate with the SEC.
On April 25, 2017, Mylan received a comment letter from the staff of the SEC’s Division of Corporation Finance (“Corporation Finance”) with respect to Mylan’s Annual Report on Form 10-K for the year ended December 31, 2016, requesting information regarding Mylan’s accounting treatment of the MDRP Settlement, including with respect to the determinations that the settlement amount should be recorded as a charge against earnings in the third quarter of 2016 rather than against any earlier periods, and that the settlement amount should be classified as an expense rather than a reduction of revenue. The Company responded to the comment letter in May 2017 and we will continue to respond to any additional correspondence from Corporation Finance. We believe that our accounting treatment for the aforementioned settlement is appropriate and consistent with all applicable accounting standards.
FTC Request for Information
On November 18, 2016, Mylan received a request from the U.S. Federal Trade Commission (“FTC”) Bureau of Competition seeking documents and information relating to its preliminary investigation into potential anticompetitive practices relating to epinephrine auto-injectors. Mylan is fully cooperating with the FTC.
Federal Securities Litigation
Purported class action complaints were filed in October 2016 against Mylan N.V., Mylan Inc. and certain of their current and former directors and officers (collectively, for purposes of this paragraph, the “defendants”) in the United States District Court for the Southern District of New York on behalf of certain purchasers of securities of Mylan N.V. and/or Mylan Inc. on the NASDAQ. The complaints alleged that defendants made false or misleading statements and omissions of purportedly material fact, in violation of federal securities laws, in connection with disclosures relating to Mylan N.V. and Mylan Inc.’s classification of their EpiPen® Auto-Injector as a non-innovator drug for purposes of the MDRP. The complaints sought damages, as well as the plaintiffs’ fees and costs. On March 20, 2017, after the actions were consolidated, a consolidated amended complaint was filed, alleging substantially similar claims and seeking substantially similar relief, but adding allegations that defendants made false or misleading statements and omissions of purportedly material fact in connection with allegedly anticompetitive conduct with respect to EpiPen® Auto-Injector and certain generic drugs, and alleging violations of both federal securities laws (on behalf of a purported class of certain purchasers of securities of Mylan N.V. and/or Mylan Inc. on the NASDAQ) and Israeli securities laws (on behalf of a purported class of certain purchasers of securities of Mylan N.V. on the Tel Aviv Stock Exchange). On March 28, 2018, defendants’ motion to dismiss the consolidated amended complaint was granted in part (including the dismissal of claims arising under Israeli securities laws) and denied in part. On July 6, 2018, the Plaintiffs filed a second amended complaint, including certain current and former directors and officers and additional allegations in connection with purportedly anticompetitive conduct with respect to EpiPen® Auto-Injector and certain generic drugs. On August 6, 2018, defendants filed a motion to dismiss the second amended complaint, which is currently pending. We believe that the claims in this lawsuit are without merit and intend to defend against them vigorously.
62
MYLAN N.V. AND SUBSIDIARIES
Notes to Condensed Consolidated Financial Statements (Unaudited) - Continued
Israeli Securities Litigation
On October 13, 2016, a purported shareholder of Mylan N.V. filed a lawsuit, together with a motion to certify the lawsuit as a class action on behalf of certain Mylan N.V. shareholders on the Tel Aviv Stock Exchange, against Mylan N.V. and four of its directors and officers (collectively, for purposes of this paragraph, the “defendants”) in the Tel Aviv District Court (Economic Division) (the “Friedman Action”). The plaintiff alleges that the defendants made false or misleading statements and omissions of purportedly material fact in Mylan N.V.’s reports to the Tel Aviv Stock Exchange regarding Mylan N.V.’s classification of its EpiPen® Auto-Injector for purposes of the MDRP, in violation of both U.S. and Israeli securities laws, the Israeli Companies Law and the Israeli Torts Ordinance. The plaintiff seeks damages, among other remedies. On April 30, 2017, another purported shareholder of Mylan N.V. filed a separate lawsuit, together with a motion to certify the lawsuit as a class action on behalf of certain Mylan N.V. shareholders on the Tel Aviv Stock Exchange, in the Tel Aviv District Court (Economic Division), alleging substantially similar claims and seeking substantially similar relief against the defendants and other directors and officers of Mylan N.V., but alleging also that this group of defendants made false or misleading statements and omissions of purportedly material fact in connection with allegedly anticompetitive conduct with respect to EpiPen® Auto-Injector and certain generic drugs, and alleging violations of both U.S. federal securities laws and Israeli law (the “IEC Fund Action”). On April 10, 2018, the Tel Aviv District Court granted the motion filed by plaintiffs in both the Friedman Action and the IEC Fund Action, voluntarily dismissing the Friedman Action and staying the IEC Fund Action until a judgment is issued in the securities litigation pending in the United States. We believe that the claims in these lawsuits are without merit and intend to defend against them vigorously.
EpiPen® Auto-Injector Civil Litigation
Mylan Specialty and other Mylan-affiliated entities have been named as defendants in putative class actions relating to the pricing and/or marketing of the EpiPen® Auto-Injector. The plaintiffs in these cases assert violations of various federal and state antitrust and consumer protection laws, the Racketeer Influenced and Corrupt Organizations Act, as well as common law claims. Plaintiffs’ claims include purported challenges to the prices charged for the EpiPen® Auto-Injector and/or the marketing of the product in packages containing two auto-injectors, as well as allegedly anti-competitive conduct. A Mylan officer and other non-Mylan affiliated companies were also named as defendants in some of the class actions. These lawsuits were filed in the various federal and state courts and have either been dismissed or transferred into a multidistrict litigation (“MDL”) in the U.S. District Court for the District of Kansas and have been consolidated. Mylan filed a motion to dismiss the consolidated amended complaint, which was granted in part and denied in part. A trial date has been scheduled for July 2020. We believe that the remaining claims in these lawsuits are without merit and intend to defend against them vigorously.
On April 24, 2017, Sanofi-Aventis U.S., LLC (“Sanofi”) filed a lawsuit against Mylan Inc. and Mylan Specialty in the U.S. District Court for the District of New Jersey. This lawsuit has been transferred into the aforementioned MDL. In this lawsuit, Sanofi alleges exclusive dealings and anti-competitive marketing practices in violation of the antitrust laws in connection with the sale and marketing of the EpiPen® Auto-Injector. On November 1, 2018, Sanofi filed a Motion for a Suggestion of Remand of the case to the U.S. District Court for the District of New Jersey. This Motion remains pending. We believe that Sanofi’s claims in this lawsuit are without merit and intend to defend against them vigorously.
EpiPen® Auto-Injector State AG Investigations
The Company and certain of its affiliated entities received subpoenas and informal requests from various state attorneys general seeking information and documents relating to the pricing and/or marketing of the EpiPen® Auto-Injector. The Company has cooperated and is fully cooperating with the various state attorneys general.
U.S. Congress/State Requests for Information and Documents
Mylan received several requests for information and documents from various Committees of the U.S. Congress and federal and state lawmakers concerning the marketing, distribution and sales of Mylan products. Mylan cooperated with federal and state lawmakers as appropriate in response to their requests.
The Company has a total accrual of approximately $10.0 million related to this matter at September 30, 2018, which is included in other current liabilities in the Condensed Consolidated Balance Sheets. During the year ended December 31, 2017, the Company made payments of approximately $472.7 million related to this matter. The Company believes that it has strong defenses to current and future potential civil litigation, as well as governmental investigations and enforcement proceedings,
63
MYLAN N.V. AND SUBSIDIARIES
Notes to Condensed Consolidated Financial Statements (Unaudited) - Continued
discussed in this “EpiPen® Auto-Injector and Certain Congressional Matters” section of this Note 20 Litigation. Although it is reasonably possible that the Company may incur additional losses from these matters, any amount cannot be reasonably estimated at this time. In addition, the Company expects to incur additional legal and other professional service expenses associated with such matters in future periods and will recognize these expenses as services are received. The Company believes that the ultimate amount paid for these services and claims could have a material effect on the Company's business, financial condition, results of operations, cash flows and/or ordinary share price in future periods.
Opioids
On July 27, 2017, Mylan N.V. received a subpoena from the DOJ seeking information relating to opioids manufactured, marketed or sold by Mylan during the period from January 1, 2013 to December 31, 2016. On August 29, 2017, Mylan N.V. received a civil investigative demand from the Attorney General of the State of Missouri seeking information relating to opioids manufactured, marketed or sold by Mylan during the period from January 1, 2010 to the present and related subject matter. Mylan is fully cooperating with these subpoena requests.
Mylan also has responded to a letter from the ranking member of the U.S. Senate Committee on Homeland Security and Governmental Affairs seeking information relating to sales, marketing and educational strategies for opioid products manufactured by Mylan. In connection with this matter, Senator Claire McCaskill issued a report on February 15, 2018 relating to payments by five drug manufacturers to third-party advocacy groups and professional societies. This report positively differentiated Mylan, finding that Mylan is “[a]t the other end of the spectrum” from the other companies whose payments were examined because Mylan made only de minimis payments, and to only one of the fourteen third-parties cited in the report.
Mylan has been named in the United States and Canada, along with numerous other manufacturers, distributors, pharmacies, pharmacy benefit managers, and/or individual healthcare professionals, in certain civil lawsuits brought by plaintiffs, including local governmental entities, generally asserting statutory and/or common law claims arising from the manufacture, distribution, marketing, promotion, and sale of purported prescription opioids. The lawsuits seek damages, including punitive and/or exemplary damages, injunctive relief, attorneys’ fees and costs, and other relief. Mylan believes that the claims in these lawsuits are without merit and intends to defend against them vigorously.
Drug Pricing Matters
Department of Justice
On December 3, 2015, a subsidiary of Mylan N.V. received a subpoena from the Antitrust Division of the DOJ seeking information relating to the marketing, pricing, and sale of our generic Doxycycline products and any communications with competitors about such products.
On September 8, 2016, a subsidiary of Mylan N.V., as well as certain employees and a member of senior management, received subpoenas from the DOJ seeking additional information relating to the marketing, pricing and sale of our generic Cidofovir, Glipizide-metformin, Propranolol and Verapamil products and any communications with competitors about such products. Related search warrants also were executed.
On May 10, 2018, a subsidiary of Mylan N.V. received a civil investigative demand from the Civil Division of the DOJ seeking information relating to the pricing and sale of its generic drug products.
The Company is fully cooperating with the DOJ.
64
MYLAN N.V. AND SUBSIDIARIES
Notes to Condensed Consolidated Financial Statements (Unaudited) - Continued
Civil Litigation
The Company, along with other manufacturers, has been named as a defendant in putative class action lawsuits filed in 2016 and 2017 generally alleging anticompetitive conduct with respect to doxycycline hyclate (regular and delayed release), digoxin, divalproex, levothyroxine, propranolol, clomipramine, albuterol, benazepril and amitriptyline products (as well as a number of non-Mylan products). The lawsuits have been filed by putative classes of direct purchasers, indirect purchasers and indirect resellers and allege harm under federal and state antitrust laws, state consumer protection laws and unjust enrichment. These lawsuits have been consolidated in an MDL proceeding in the EDPA. The Court has sequenced these lawsuits into three separate product groups. Defendants filed motions to dismiss complaints in the first product group. On October 16, 2018, the Court denied the motions with respect to the federal law claims and a decision on the state law claims remains pending. On January 22, 2018, three direct purchaser retailers filed a complaint against Mylan and other manufacturers asserting similar allegations with respect to the products identified above, as well as doxycycline monohydrate, glipizide-metformin, and verapamil (as well as other non-Mylan products). Subsequently, putative classes of direct purchasers, indirect purchasers, and indirect resellers filed complaints against Mylan and other manufacturers alleging harm under federal and state antitrust laws, state consumer protection laws and unjust enrichment and asserting similar allegations with respect to a number of products, including Mylan’s doxycycline products, glipizide-metformin, and verapamil (as well as other non-Mylan products). These complaints also name Mylan’s President as a defendant and include allegations against him with respect to doxycycline hyclate delayed release. On August 3, 2018, a complaint was filed by a plaintiff claiming to be a direct and indirect purchaser against Mylan and other defendants alleging anti-competitive conduct with respect to certain of the products identified above as well as pravastatin. On September 25, 2018, a complaint was filed by plaintiffs on behalf of putative classes of direct and indirect purchasers against Mylan and other defendants alleging anti-competitive conduct with respect to generic drugs. The Company believes that the claims in these lawsuits are without merit and intends to defend against them vigorously.
Attorneys General Litigation
On December 21, 2015, the Company received a subpoena and interrogatories from the Connecticut Office of the Attorney General seeking information relating to the marketing, pricing and sale of certain of the Company’s generic products (including generic doxycycline) and communications with competitors about such products. On December 14, 2016, attorneys general of twenty states filed a complaint in the United States District Court for the District of Connecticut against several generic pharmaceutical drug manufacturers, including Mylan, alleging anticompetitive conduct with respect to, among other things, Doxycycline Hyclate Delayed Release. The complaint was subsequently amended to add certain attorneys general alleging violations of federal and state antitrust laws, as well as violations of various states’ consumer protection laws. This lawsuit has been transferred to the aforementioned MDL proceeding in the EDPA. On October 31, 2017, attorneys general of forty-five states, the District of Columbia and the Commonwealth of Puerto Rico filed a motion for leave to file a consolidated amended complaint (“proposed amended complaint”) against various drug manufacturers, including Mylan. The proposed amended complaint was permitted and was filed on June 18, 2018 and included two additional states. Mylan is alleged to have engaged in anticompetitive conduct with respect to Doxycycline Hyclate Delayed Release, Doxycycline Monohydrate, Glipizide-Metformin, and Verapamil. The amended complaint also includes claims asserted by attorneys general of thirty-seven states and the Commonwealth of Puerto Rico against certain individuals, including Mylan’s President, with respect to Doxycycline Hyclate Delayed Release. The allegations in the amended complaint are similar to those in the previously filed complaints. We believe that the claims in this lawsuit are without merit and intend to defend against them vigorously.
European Commission Proceedings
Perindopril
On July 9, 2014, the European Commission (the “Commission”) issued a decision finding that Mylan Laboratories Limited and Mylan, as well as several other companies, had violated European Union (“EU”) competition rules relating to the product Perindopril and fined Mylan Laboratories Limited approximately €17.2 million, including approximately €8.0 million jointly and severally with Mylan Inc. The Company paid approximately $21.7 million related to this matter during the fourth quarter of 2014. In September 2014, the Company filed an appeal of the Commission’s decision to the General Court of the EU. A hearing on the appeal before the General Court of the EU was held in June 2017 and a decision is pending.
65
MYLAN N.V. AND SUBSIDIARIES
Notes to Condensed Consolidated Financial Statements (Unaudited) - Continued
Citalopram
On June 19, 2013, the Commission issued a decision finding that Generics [U.K.] Limited, as well as several other companies, had violated EU competition rules relating to the product Citalopram and fined Generics [U.K.] Limited approximately €7.8 million, jointly and severally with Merck KGaA. Generics [U.K.] Limited appealed the Commission’s decision to the General Court of the EU. The case is currently on appeal to the European Court of Justice. The United Kingdom applied and was granted permission to intervene in this proceeding. The Company has accrued approximately €7.4 million as of September 30, 2018 and December 31, 2017, respectively, related to this matter. Generics [U.K.] Limited has received notices from European NHS Departments and health insurers stating an intention to commence follow-on litigation and asserting damages. Generics [U.K.] Limited has also sought indemnification from Merck KGaA with respect to the €7.8 million portion of the fine for which Merck KGaA and Generics [U.K.] Limited were held jointly and severally liable. Merck KGaA has counterclaimed against Generics [U.K.] Limited seeking the same indemnification. In June 2018, the Frankfurt Regional Court issued a judgment dismissing Generics [U.K.] Limited’s claims against Merck KGaA and ordered Generics [U.K.] Limited to indemnify Merck KGaA with respect to the amount for which the parties were held jointly and severally liable. Generics [U.K.] Limited has appealed this decision, which remains pending. It is reasonably possible that we will incur additional losses above the amount accrued but we cannot estimate a range of such reasonably possible losses at this time. There are no assurances, however, that settlements reached and/or adverse judgments received, if any, will not exceed amounts accrued.
U.K. Competition and Markets Authority
Paroxetine
On August 12, 2011, Generics [U.K.] Limited received notice that the Office of Fair Trading (subsequently changed to the Competition and Markets Authority (the “CMA”)) opened an investigation to explore the possible infringement of the Competition Act 1998 and Articles 101 and 102 of the Treaty on the Functioning of the EU, with respect to alleged agreements related to Paroxetine. The CMA issued a decision on February 12, 2016, finding that, Generics [U.K.] Limited, Merck KGaA and other companies were liable for infringing EU and U.K. competition rules. With respect to Merck KGaA and Generics [U.K.] Limited, the CMA issued a penalty of approximately £5.8 million, for which Merck KGaA is liable for the entire amount; and of that amount Generics [U.K.] Limited is jointly and severally liable for approximately £2.7 million, which has been accrued for as of September 30, 2018. The matter is currently on appeal to the Competition Appeals Tribunal, which on March 8, 2018, referred certain questions of law to the European Court of Justice (“CJEU”). The CJEU sought written observations from Generics [U.K.] Limited, which were filed in September 2018.
Nefopam
On October 10, 2017, Mylan N.V. and Meda Pharmaceuticals Limited received notice that the CMA was opening an investigation to explore the possible infringement of the Competition Act 1998 and Article 101 of the Treaty on the Functioning of the EU, with respect to alleged agreements related to Nefopam, a product from Meda’s portfolio. On October 16, 2017, the CMA issued a notice under Section 26 of the Competition Act 1998 to Mylan N.V. and Meda Pharmaceuticals Limited to provide specified information and produce specified documents. The Company is fully cooperating with the CMA.
Italy Investigation
On April 18, 2018, certain employees of Mylan S.p.A. were served with search warrants issued by the Public Prosecutor’s Office in Milan, Italy seeking information concerning interactions with an Italian hospital and sales of certain reimbursable Mylan S.p.A. drugs. The Company is assisting its employees in their cooperation with the investigation.
Product Liability
The Company is involved in a number of product liability lawsuits and claims related to alleged personal injuries arising out of certain products manufactured and/or distributed by the Company. The Company believes that it has meritorious defenses to these lawsuits and claims and is vigorously defending itself with respect to those matters. From time to time, the Company has agreed to settle or otherwise resolve certain lawsuits and claims on terms and conditions that are in the best interests of the Company. The Company has accrued approximately $9.6 million and $8.4 million at September 30, 2018 and December 31, 2017, respectively. It is reasonably possible that we will incur additional losses and fees above the amount accrued but we cannot estimate a range of such reasonably possible losses or legal fees related to these claims at this time.
66
MYLAN N.V. AND SUBSIDIARIES
Notes to Condensed Consolidated Financial Statements (Unaudited) - Continued
There are no assurances, however, that settlements reached and/or adverse judgments received, if any, will not exceed amounts accrued.
Intellectual Property
MPI filed with the FDA a Paragraph IV certification stating that approval of MPI’s Abbreviated New Drug Application (“ANDA”) for glatiramer acetate injection, 20 mg/mL will not infringe any valid claim of patents owned or controlled by Teva Pharmaceuticals USA, Inc., Yeda Research and Development Co., or their affiliates (for purposes of these paragraphs, “Plaintiffs”), listed in the FDA’s Orange Book. There are currently no unexpired patents for the product listed in the FDA’s Orange Book. On October 3, 2017, MPI received final FDA approval and launched its 20 mg/mL glatiramer acetate product in the United States.
MPI filed with the FDA a Paragraph IV certification stating that approval of MPI’s ANDA for glatiramer acetate injection, 40 mg/mL will not infringe any valid claim of patents owned or controlled by the Plaintiffs listed in the FDA’s Orange Book. On October 6, 2014, Plaintiffs filed suit against MPI and Mylan Inc. in the District Court for the District of Delaware alleging infringement of the Orange Book patents and seeking monetary damages, injunctive relief, attorneys’ fees, costs and other relief. On January 30, 2017, the Delaware District Court found, after trial, the asserted claims of the Orange Book patents-in-suit invalid as obvious.
In February and March 2015, MPI and Mylan Inc. filed petitions with the Patent Trial and Appeal Board requesting inter partes review of the claims of three asserted patents. On August 24, 2016 and September 1, 2016, respectively, the Patent Trial and Appeal Board issued final written decisions finding all claims of three asserted patents unpatentable as obvious. After Plaintiffs’ requests for reconsideration of those decisions, the Patent Trial and Appeal Board issued revised final written decisions addressing issues raised in the requests for reconsideration and again finding all claims of three asserted patents unpatentable as obvious.
Plaintiffs appealed both the District Court decision and the Patent and Trial and Appeal Board decision to the Federal Circuit. On October 12, 2018, the Federal Circuit affirmed both decisions finding the asserted claims of the Orange Book-listed patents invalid.
On October 19, 2017, Teva Pharmaceutical Industries Ltd. (“Teva”) commenced an action with the Irish High Court against Mylan Teoranta alleging that Mylan’s glatiramer acetate 40mg/mL product, which is manufactured in Ireland, approved by the FDA and is currently being sold in the U.S., infringes two European patents, EP (IE) 2 949 335 and EP (IE) 3 050 556. Teva subsequently dropped its infringement allegation related to the EP (IE) 3 050 556 patent. Teva is seeking damages and/or an account of profits from Mylan for the alleged infringement. Teva has also requested the Irish High Court to enjoin Mylan Teoranta from making, offering, putting on the market and/or using its glatiramer acetate 40mg/mL product in Ireland pending final determination of the action. On June 5, 2018, the Irish High Court refused Teva’s request for an injunction pending final determination. Teva is appealing the decision.
On June 4, 2018, the FDA approved Mylan’s Fulphila® (pegfilgrastim-jmdb), a biosimilar to Neulasta® (pegfilgrastim), co-developed with Biocon. In July 2018, Mylan began selling Fulphila®. On September 22, 2017, Amgen Inc. and Amgen Manufacturing Limited (“Amgen”) sued Mylan Inc., Mylan N.V., Mylan GMBH, and MPI in the Western District of Pennsylvania asserting that Mylan’s Fulphila® infringes U.S. patent numbers 8,273,707 and 9,643,997. Amgen is seeking monetary damages, injunctive relief, attorneys’ fees, costs and other relief. No trial date is currently scheduled.
With respect to the Copaxone 40mg and Fulphila® litigations, the Company believes that the asserted patents are invalid and that its products do not infringe.
The Company has used its business judgment in connection with the decision to launch the 40mg/mL glatiramer acetate and Fulphila® products and has also used its business judgment in certain other situations to decide to market and sell products, notwithstanding the fact that allegations of patent infringement(s) or other potential third party rights have not been finally resolved by the courts. The risk involved in doing so can be substantial because the remedies available to the owner of a patent for infringement may include, a reasonable royalty on sales or damages measured by the profits lost by the patent owner. If there is a finding of willful infringement, damages may be increased up to three times. Moreover, because of the discount pricing typically involved with bioequivalent products, patented branded products generally realize a substantially higher profit
67
MYLAN N.V. AND SUBSIDIARIES
Notes to Condensed Consolidated Financial Statements (Unaudited) - Continued
margin than generic and biosimilar products. An adverse decision could have an adverse effect that is material to our business, financial condition, results of operations, cash flows and/or ordinary share price.
Other Litigation
The Company is involved in various other legal proceedings that are considered normal to its business. The Company has approximately $4.6 million accrued related to these various other legal proceedings at September 30, 2018.
68
ITEM 2. MANAGEMENT’S DISCUSSION AND ANALYSIS OF FINANCIAL CONDITION AND RESULTS OF OPERATIONS
The following discussion and analysis addresses material changes in the financial condition and results of operations of Mylan N.V. and subsidiaries for the periods presented. Unless context requires otherwise, the “Company”, “Mylan”, “our”, or “we” refer to Mylan N.V. and its subsidiaries. This discussion and analysis should be read in conjunction with the Consolidated Financial Statements, the related Notes to Consolidated Financial Statements and Management’s Discussion and Analysis of Financial Condition and Results of Operations included in Mylan N.V.’s Annual Report on Form 10-K for the year ended December 31, 2017, as amended (the “2017 Form 10-K”), the unaudited interim financial statements and related Notes included in Part I — ITEM 1 of this Quarterly Report on Form 10-Q (“Form 10-Q”) and our other Securities and Exchange Commission (the “SEC”) filings and public disclosures. The interim results of operations and comprehensive earnings for the three and nine months ended September 30, 2018, and cash flows for the nine months ended September 30, 2018 are not necessarily indicative of the results to be expected for the full fiscal year or any other future period.
This Form 10-Q contains “forward-looking statements.” These statements are made pursuant to the safe harbor provisions of the Private Securities Litigation Reform Act of 1995. Such forward-looking statements may include, without limitation, statements about Mylan’s future operations, anticipated business levels, future earnings, planned activities, anticipated growth, market opportunities, strategies, competition, and other expectations and targets for future periods. These may often be identified by the use of words such as “will,” “may,” “could,” “should,” “would,” “project,” “believe,” “anticipate,” “expect,” “plan,” “estimate,” “forecast,” “potential,” “pipeline,” “intend,” “continue,” “target” and variations of these words or comparable words. Because forward-looking statements inherently involve risks and uncertainties, actual future results may differ materially from those expressed or implied by such forward-looking statements. Factors that could cause or contribute to such differences include, but are not limited to: actions and decisions of healthcare and pharmaceutical regulators; failure to achieve expected or targeted future financial and operating performance and results; uncertainties regarding future demand, pricing and reimbursement for our products; any regulatory, legal, or other impediments to Mylan’s ability to bring new products to market, including, but not limited to, where Mylan uses its business judgment and decides to manufacture, market, and/or sell products, directly or through third parties, notwithstanding the fact that allegations of patent infringement(s) have not been finally resolved by the courts (i.e., an “at-risk launch”); success of clinical trials and Mylan’s ability to execute on new product opportunities; any changes in or difficulties with our manufacturing facilities, supply chain or inventory or our ability to meet anticipated demand; the scope, timing, and outcome of any ongoing legal proceedings, including government investigations, and the impact of any such proceedings on our financial condition, results of operations, and/or cash flows; the ability to meet expectations regarding the accounting and tax treatments of acquisitions, including Mylan’s acquisition of Mylan Inc. and Abbott Laboratories’ non-U.S. developed markets specialty and branded generics business (the “EPD Business”); changes in relevant tax and other laws, including but not limited to changes in the U.S. tax code and healthcare and pharmaceutical laws and regulations in the U.S. and abroad; any significant breach of data security or data privacy or disruptions to our information technology systems; the ability to protect intellectual property and preserve intellectual property rights; the effect of any changes in customer and supplier relationships and customer purchasing patterns; the ability to attract and retain key personnel; the impact of competition; identifying, acquiring, and integrating complementary or strategic acquisitions of other companies, products, or assets being more difficult, time-consuming or costly than anticipated; the possibility that Mylan may be unable to achieve expected synergies and operating efficiencies in connection with strategic acquisitions or restructuring programs within the expected time-frames or at all; uncertainties and matters beyond the control of management, including but not limited to general political and economic conditions and global exchange rates; and inherent uncertainties involved in the estimates and judgments used in the preparation of financial statements, and the providing of estimates of financial measures, in accordance with accounting principles generally accepted in the United States of America (“U.S. GAAP”) and related standards or on an adjusted basis. For more detailed information on the risks and uncertainties associated with Mylan’s business activities, see the risks described in the 2017 Form 10-K, and our other filings with the SEC. You can access Mylan’s filings with the SEC through the SEC website at www.sec.gov or through our website, and Mylan strongly encourages you to do so. Mylan routinely posts information that may be important to investors on our website at investor.mylan.com, and we use this website address as a means of disclosing material information to the public in a broad, non-exclusionary manner for purposes of the SEC’s Regulation Fair Disclosure (Reg FD). The contents of our website are not incorporated by reference in this Form 10-Q and shall not be deemed “filed” under the Securities Exchange Act of 1934, as amended. Mylan undertakes no obligation to update any statements herein for revisions or changes after the filing date of this Form 10-Q.
69
Company Overview
Mylan is a global pharmaceutical company committed to setting new standards in healthcare and providing 7 billion people access to high quality medicine. We offer a growing portfolio of more than 7,500 products, including prescription generic, branded generic and brand-name drugs and over-the-counter (“OTC”) remedies. We market our products in more than 165 countries and territories. Every member of our approximately 35,000-strong workforce is dedicated to delivering better health for a better world.
Over the last several years, Mylan has transformed itself through a clear, consistent and differentiated strategy into a company that is built to last. Fueling that durability is a business model anchored in providing access, Mylan’s core purpose.
Providing access requires that we satisfy the needs of an incredibly diverse global marketplace whose economic and political systems, approaches to delivering and paying for healthcare, languages and traditions, and customer and patient requirements vary by location and over time.
With these considerations in mind, we have scaled our commercial, operational and scientific platforms to meet customers’ evolving needs in ways that are globally consistent and locally sensitive. As a result, not only are we succeeding in expanding people’s access to medicine, we are continually diversifying our business.
That diversification is what drives our durability. Durability allows us to withstand and overcome competitive pressures while continuing to innovate. It also allows us to generate consistent financial results, including reliable cash flows capable of supporting ongoing investments in long-term growth.
Financial Summary
The tables below are a summary of the Company’s financial results for the three and nine months ended September 30, 2018 compared to the prior year periods:
Three Months Ended | ||||||||||||||
September 30, | ||||||||||||||
(In millions, except per share amounts) | 2018 | 2017 | Change | % Change | ||||||||||
Total revenues | $ | 2,862.4 | $ | 2,987.1 | $ | (124.7 | ) | (4 | )% | |||||
Gross profit | 1,039.2 | 1,178.1 | (138.9 | ) | (12 | )% | ||||||||
Earnings from operations | 338.2 | 316.5 | 21.7 | 7 | % | |||||||||
Net earnings | 176.7 | 88.3 | 88.4 | 100 | % | |||||||||
Diluted earnings per ordinary share | $ | 0.34 | $ | 0.16 | $ | 0.18 | 113 | % | ||||||
Nine Months Ended | ||||||||||||||
September 30, | ||||||||||||||
(In millions, except per share amounts) | 2018 | 2017 | Change | % Change | ||||||||||
Total revenues | $ | 8,355.2 | $ | 8,668.8 | $ | (313.6 | ) | (4 | )% | |||||
Gross profit | 2,986.0 | 3,488.5 | (502.5 | ) | (14 | )% | ||||||||
Earnings from operations | 672.8 | 1,018.0 | (345.2 | ) | (34 | )% | ||||||||
Net earnings | 301.3 | 451.7 | (150.4 | ) | (33 | )% | ||||||||
Diluted earnings per ordinary share | $ | 0.58 | $ | 0.84 | $ | (0.26 | ) | (31 | )% | |||||
Certain Market and Industry Factors
As more fully explained in the 2017 Form 10-K, the global pharmaceutical industry is a highly competitive and highly regulated industry. As a result, we face a number of industry-specific factors and challenges, which can significantly impact our results. The following discussion highlights some of these key factors and market conditions.
70
Generic products, particularly in the U.S., generally contribute most significantly to revenues and gross margins at the time of their launch, and even more so in periods of market exclusivity, or in periods of limited generic competition. As such, the timing of new product introductions can have a significant impact on the Company’s financial results. The entrance into the market of additional competition generally has a negative impact on the volume and pricing of the affected products. Additionally, pricing is often affected by factors outside of the Company’s control.
For branded products, the majority of the product’s commercial value is usually realized during the period in which the product has market exclusivity. In the U.S. and some other countries, when market exclusivity expires and generic versions of a product are approved and marketed, there can often be very substantial and rapid declines in the branded product’s sales. OTC products also participate in a competitive environment that includes both branded and private label products. In the OTC space, value is realized through innovation, access and consumer activation.
Certain markets in which we do business outside of the U.S. have undergone government-imposed price reductions, and further government-imposed price reductions are expected in the future. Such measures, along with the tender systems discussed below, are likely to have a negative impact on sales and gross profit in these markets. However, government initiatives in certain markets that appear to favor generic products could help to mitigate this unfavorable effect by increasing rates of generic substitution and penetration.
Additionally, a number of markets in which we operate outside of the U.S. have implemented, or may implement, tender systems for generic pharmaceuticals in an effort to lower prices. Generally speaking, tender systems can have an unfavorable impact on sales and profitability. Under such tender systems, manufacturers submit bids that establish prices for generic pharmaceutical products. Upon winning the tender, the winning company will receive priority placement for a period of time. The tender system often results in companies underbidding one another by proposing low pricing in order to win the tender. The loss of a tender by a third party to whom we supply active pharmaceutical ingredient (“API”) can also have a negative impact on our sales and profitability. Sales continue to be negatively affected by the impact of tender systems in certain countries.
Recent Developments
In the fourth quarter of 2016, the Company announced restructuring programs in certain locations representing initial steps in a series of actions that are anticipated to further streamline our operations globally. The Company continues to develop the details of the cost reduction initiatives, including workforce actions and other potential restructuring activities beyond the programs already announced. During the three and nine months ended September 30, 2018, the Company recorded pre-tax charges of $80.8 million and $202.3 million, respectively. Included within the charges during the nine months ended September 30, 2018 were $108.6 million for non-cash asset impairment charges with the remaining charges primarily related to severance and employee benefits. The continued restructuring actions, other than the activities at the Morgantown, West Virginia facility described below, are expected to be implemented through fiscal year 2018. The Company anticipates total aggregate pre-tax charges for committed restructuring activities ranging between $500.0 million and $600.0 million, inclusive of all restructuring charges incurred through the third quarter of 2018. In addition, as a result of the restructuring activities that have been undertaken to date, management believes the potential annual savings will be between approximately $400.0 million and $475.0 million once fully implemented, with the majority of these savings improving operating cash flow. At this time, the expenses related to the additional restructuring activities cannot be reasonably estimated.
In April 2018, the State of New York passed a budget which included the Opioid Stewardship Fund (the “Fund”). The Fund created an aggregate $100 million annual assessment on all manufacturers and distributors licensed to sell or distribute opioids in New York. Each licensed manufacturer and distributor will be required to pay a portion of the assessment based on its ratable share, as determined by the state, of the total morphine milligram equivalents sold or distributed in New York during the applicable calendar year. The initial payment is due on January 1, 2019 for opioids sold or distributed during calendar year 2017. Based upon initial correspondence received from the State of New York, the Company believes its amount related to the Fund for calendar year 2017 will be immaterial.
The U.S. Food and Drug Administration (“FDA”) completed an inspection at Mylan’s plant in Morgantown, West Virginia earlier this year and made observations through a Form 483. The Company has submitted a comprehensive response to the FDA and committed to a robust improvement plan. During the second quarter of 2018, the Company commenced a restructuring and remediation program aimed at reducing complexity at the Morgantown manufacturing facility. The program includes the discontinuation and transfer to other manufacturing sites of a number of products, a reduction of the workforce and extensive remediation activities. These actions have led to a temporary disruption in supply of certain products.
71
Once the remediation and restructuring activities in Morgantown are completed, the Company anticipates improved costs, efficiencies and profitability from the operations at the plant. The value and profitability related to the rationalized products is not proportionate to the reduced volumes of those products as the Company expects that manufacturing costs related to transferred products will be reduced and many of the discontinued products have lower than average gross margins. In addition, as it relates to North America, no significant new product revenue is forecasted from the Morgantown facility in 2019, and only eight of our top 50 gross margin generating products and only one out of the top 10 are currently manufactured in Morgantown.
The Company has incurred expenses amounting to approximately $97.7 million and $184.2 million for the three and nine months ended September 30, 2018, respectively, for incremental manufacturing variances, site remediation and restructuring charges. Mylan remains committed to maintaining the highest quality manufacturing standards at its facilities around the world and to continuous improvement in a time of evolving industry dynamics and regulatory expectations.
A detailed discussion of the Company’s financial results can be found below in the section titled “Results of Operations.” As part of this discussion, we also report sales performance using the non-GAAP financial measures of “constant currency” net sales and total revenues. These measures provide information on the change in net sales and total revenues assuming that foreign currency exchange rates had not changed between the prior and current period. The comparisons presented at constant currency rates reflect comparative local currency sales at the prior year’s foreign exchange rates. We routinely evaluate our net sales and total revenues performance at constant currency so that sales results can be viewed without the impact of foreign currency exchange rates, thereby facilitating a period-to-period comparison of our operational activities, and believe that this presentation also provides useful information to investors for the same reason.
More information about non-GAAP measures used by the Company as part of this discussion, including adjusted cost of sales, adjusted gross margins, adjusted net earnings and adjusted EPS (all of which are defined below) can be found in “Item 2. Management’s Discussion and Analysis of Financial Condition and Results of Operations - Results of Operations - Use of Non-GAAP Financial Measures.”
72
Results of Operations
Three Months Ended September 30, 2018 Compared to Three Months Ended September 30, 2017
Three Months Ended | |||||||||||||||||||||
September 30, | |||||||||||||||||||||
(In millions) | 2018 | 2017 | % Change | 2018 Currency Impact (1) | 2018 Constant Currency Revenues | Constant Currency % Change (2) | |||||||||||||||
Net sales | |||||||||||||||||||||
North America | $ | 1,012.3 | $ | 1,172.2 | (14 | )% | $ | 2.5 | $ | 1,014.8 | (13 | )% | |||||||||
Europe | 1,041.3 | 1,040.8 | — | % | 17.2 | 1,058.5 | 2 | % | |||||||||||||
Rest of World | 773.7 | 743.3 | 4 | % | 55.0 | 828.7 | 11 | % | |||||||||||||
Total net sales | 2,827.3 | 2,956.3 | (4 | )% | $ | 74.7 | $ | 2,902.0 | (2 | )% | |||||||||||
Other revenues (3) | 35.1 | 30.8 | 14 | % | 0.3 | 35.4 | 15 | % | |||||||||||||
Consolidated total revenues (4) | $ | 2,862.4 | $ | 2,987.1 | (4 | )% | $ | 75.0 | $ | 2,937.4 | (2 | )% | |||||||||
(1) | Currency impact is shown as unfavorable (favorable). |
(2) | The constant currency percentage change is derived by translating net sales or revenues for the current period at prior year comparative period exchange rates, and in doing so shows the percentage change from 2018 constant currency net sales or revenues to the corresponding amount in the prior year. |
(3) | For the three months ended September 30, 2018, other revenues in North America, Europe, and Rest of World were approximately $20.9 million, $7.4 million, and $6.8 million, respectively. |
(4) | Amounts exclude intersegment revenue that eliminates on a consolidated basis. |
Total Revenues
For the current quarter, Mylan reported total revenues of $2.86 billion, compared to $2.99 billion for the comparable prior year period, representing a decrease of $124.7 million, or 4%. Total revenues include both net sales and other revenues from third parties. Net sales for the current quarter were $2.83 billion, compared to $2.96 billion for the comparable prior year period, representing a decrease of $129.0 million, or 4%. Other revenues for the current quarter were $35.1 million, compared to $30.8 million for the comparable prior year period, an increase of $4.3 million.
The decrease in total revenues included lower net sales in the North America segment of 14%. This decrease was partially offset by increased net sales in the Rest of World segment of 4%. Net sales in the Europe segment were essentially flat. The overall decrease in total revenues was primarily driven by a decrease in net sales from existing products. Net sales from existing products, partially offset by new product launches, decreased on a constant currency basis by approximately $14.6 million primarily as a result of lower volumes, and to a lesser extent, pricing. Net sales were also negatively impacted by approximately $39.8 million due to the adoption of new accounting standards. Mylan’s total revenues were unfavorably impacted by the effect of foreign currency translation, primarily reflecting changes in the U.S. Dollar as compared to the currencies of Mylan’s subsidiaries in India, Australia and the European Union. The unfavorable impact of foreign currency translation on current quarter total revenues was approximately $75.0 million, resulting in a decrease in constant currency total revenues of approximately $49.7 million, or 2%.
Wholesaler and distributor inventory levels of our products can fluctuate throughout the year due to the seasonality of certain products, the timing of product demand and other factors. Such fluctuations may impact the comparability of our net sales between periods.
From time to time, a limited number of our products may represent a significant portion of our net sales, gross profit and net earnings. Generally, this is due to the timing of new product introductions and the amount, if any, of additional competition in the market. Our top ten products in terms of net sales, in the aggregate, represented approximately 23% and 23% for the three months ended September 30, 2018 and 2017, respectively.
73
Net sales are derived from our three geographic reporting segments: North America, Europe and Rest of World. The graph below shows net sales by segment for the three months ended September 30, 2018 and 2017 and the net change period over period:
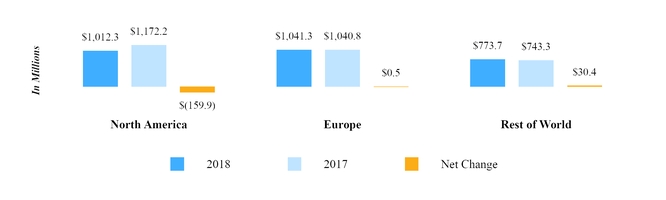
North America Segment
Net sales from North America decreased by $159.9 million or 14% during the three months ended September 30, 2018 when compared to the prior year period. This decrease was due primarily to lower volumes on existing products, including the EpiPen® Auto-Injector, partially offset by new product sales, including the recent launch of Fulphila™, a biosimilar to Neulasta® (pegfilgrastim). The decline in volumes was primarily driven by the timing of purchases of our products by customers, the divestiture of certain contract manufacturing assets, the loss of exclusivity of a product, and actions associated with the restructuring and remediation program at the Morgantown manufacturing facility. In addition, net sales were negatively impacted by approximately $50.4 million related to the implementation of new accounting standards. Pricing slightly decreased when compared to the prior year period. The impact of foreign currency translation on current period net sales was insignificant within North America.
Europe Segment
Net sales from Europe increased by $0.5 million during the three months ended September 30, 2018 when compared to the prior year period. This increase was primarily the result of new product sales and higher volumes on existing products. These were partially offset by lower pricing and the unfavorable impact of foreign currency translation which was approximately $17.2 million, or 2%. Constant currency net sales increased by approximately $17.7 million, or 2% when compared to the prior year period.
Rest of World Segment
Net sales from Rest of World increased by $30.4 million, or 4% during the three months ended September 30, 2018 when compared to the prior year period. This increase was primarily the result of new product sales, partially offset by the unfavorable impact of foreign currency translation and lower pricing. The increase in net sales as a result of new products was primarily due to new product sales from the Company’s anti-retroviral therapy franchise combined with new product sales in Australia and China. Also, volumes were essentially flat as an increase in sales of key brands in China was offset by decreases in other markets. Overall, net sales from Rest of World were unfavorably impacted by the effect of foreign currency translation by approximately $55.0 million, or 7% during the three months ended September 30, 2018. Constant currency net sales increased by approximately $85.4 million, or 11%.
74
Cost of Sales and Gross Profit
Cost of sales increased from $1.81 billion for the three months ended September 30, 2017 to $1.82 billion for the three months ended September 30, 2018. Cost of sales was primarily impacted by purchase accounting related amortization of acquired intangible assets and other special items, which are described further in the section titled Use of Non-GAAP Financial Measures. Gross profit for the three months ended September 30, 2018 was $1.04 billion and gross margins were 36%. For the three months ended September 30, 2017, gross profit was $1.18 billion and gross margins were 39%. Gross margins were negatively impacted by approximately 230 basis points related to the incremental amortization from product acquisitions and in-process research and development (“IPR&D”) impairment charges. Gross margins were also negatively affected by approximately 340 basis points as a result of incremental manufacturing expenses, site remediation expenses and incremental restructuring charges incurred during the current quarter principally as a result of the activities at the Company’s Morgantown facility. In addition, gross margins were negatively impacted in the current quarter as a result of lower gross profit from the sales of existing products in North America. The unfavorable impact of these items was partially offset by the favorable impact from new product sales and the impact of incremental sales of certain global key brands. Adjusted gross margins were 55% for the three months ended September 30, 2018, compared to 53% for the three months ended September 30, 2017. Adjusted gross margins were favorably impacted by new product sales and the impact of incremental sales of certain global key brands.
A reconciliation between cost of sales, as reported under U.S. GAAP, and adjusted cost of sales and adjusted gross margin for the three months ended September 30, 2018 compared to the three months ended September 30, 2017 is as follows:
Three Months Ended | |||||||
September 30, | |||||||
(In millions) | 2018 | 2017 | |||||
U.S. GAAP cost of sales | $ | 1,823.2 | $ | 1,809.0 | |||
Deduct: | |||||||
Purchase accounting amortization and other related items | (426.9 | ) | (361.4 | ) | |||
Restructuring and related costs | (51.8 | ) | (21.0 | ) | |||
Acquisition related items | (1.4 | ) | 0.2 | ||||
Other special items | (65.4 | ) | (12.3 | ) | |||
Adjusted cost of sales | $ | 1,277.7 | $ | 1,414.5 | |||
Adjusted gross profit (a) | $ | 1,584.7 | $ | 1,572.6 | |||
Adjusted gross margin (a) | 55 | % | 53 | % | |||
____________
(a) | Adjusted gross profit is calculated as total revenues less adjusted cost of sales. Adjusted gross margin is calculated as adjusted gross profit divided by total revenues. |
Operating Expenses
Research & Development Expense
Research and development (“R&D”) expense for the three months ended September 30, 2018 was $144.1 million, compared to $182.3 million for the comparable prior year period, a decrease of $38.2 million. This decrease was primarily due to lower expenditures related to the Company’s respiratory programs, lower expenses due to the reprioritization of global programs, and to higher payments in the prior year period related to licensing arrangements for products in development.
75
Selling, General & Administrative Expense
Selling, general and administrative (“SG&A”) expense for the current quarter was $577.3 million, compared to $664.1 million for the comparable prior year period, a decrease of $86.8 million. The decrease is due to ongoing integration activities and reduced share-based compensation expense primarily due to the Company’s determination that it was no longer probable that the minimum performance condition would be met and the reversal of all of the remaining cumulative expense related to the Company’s One-Time Special Performance-Based Five-Year Realizable Value Incentive Program (the “2014 Program”) that resulted in the Company recognizing a reduction in share-based compensation expense of approximately $47.1 million during the three months ended September 30, 2018. In addition, the Company experienced lower restructuring and acquisition-related expenses in the current quarter when compared to the prior year period. Partially offsetting these items, the Company recorded $20.0 million of compensation expense as an additional discretionary bonus for a certain group of employees during the three months ended September 30, 2018. None of the employees who will receive this bonus are named executive officers.
Litigation Settlements and Other Contingencies, Net
During the three months ended September 30, 2018, the Company recorded a net gain of $20.4 million, while during the three months ended September 30, 2017, the Company recorded a net charge of $15.2 million. During the three months ended September 30, 2018, the Company recorded a gain of approximately $19.3 million for a fair value adjustment related to the contingent consideration for the acquisition of the exclusive worldwide rights to develop, manufacture and commercialize a generic equivalent to GlaxoSmithKline’s Advair® Diskus and Seretide® Diskus incorporating Pfizer Inc.’s proprietary dry powder inhaler delivery platform (the “respiratory delivery platform”). The fair value adjustment was the result of changes to assumptions relating to the timing of product launch along with other competitive and market factors. The net charge in the prior year period consists primarily of an increase to a litigation accrual for an anti-trust related matter.
Interest Expense
Interest expense for the three months ended September 30, 2018 totaled $136.2 million, compared to $131.8 million for the three months ended September 30, 2017, an increase of $4.4 million. The increase is primarily due to slightly higher average interest rates on debt issued in 2018 when compared to the debt instruments redeemed during 2018.
Other Expense, Net
Other expense, net, was $9.8 million for the three months ended September 30, 2018, compared to $5.1 million for the comparable prior year period. Other expense, net, includes losses from equity affiliates, foreign exchange gains and losses, interest, and other investment gains and losses. Other expense, net was comprised of the following for the three months ended September 30, 2018 and 2017, respectively:
Three Months Ended | |||||||
September 30, | |||||||
(In millions) | 2018 | 2017 | |||||
Losses from equity affiliates, primarily clean energy investments | $ | 12.6 | $ | 22.4 | |||
Foreign exchange losses/(gains), net | 1.6 | (14.9 | ) | ||||
Other gains, net | (4.4 | ) | (2.4 | ) | |||
Other expense, net | $ | 9.8 | $ | 5.1 | |||
Income Tax Provision
For the three months ended September 30, 2018, the Company recognized an income tax provision of $15.5 million, compared to an income tax provision of $91.3 million for the comparable prior year period. The effective tax rate for the three months ended September 30, 2018 versus the comparable prior year period was impacted by the changing mix of income earned in jurisdictions with differing tax rates. In addition, the prior year period was impacted by changes in valuation allowances applied to certain tax attributes. During the current quarter, the Company also recorded a benefit of approximately $6.2 million related to the finalization of previously recorded 2017 tax estimates upon the filing of tax returns.
76
Nine Months Ended September 30, 2018 Compared to Nine Months Ended September 30, 2017
Nine Months Ended | |||||||||||||||||||||
September 30, | |||||||||||||||||||||
(In millions) | 2018 | 2017 | % Change | 2018 Currency Impact (1) | 2018 Constant Currency Revenues | Constant Currency % Change (2) | |||||||||||||||
Net sales | |||||||||||||||||||||
North America | $ | 2,998.4 | $ | 3,666.7 | (18 | )% | $ | (3.2 | ) | $ | 2,995.2 | (18 | )% | ||||||||
Europe | 3,070.3 | 2,887.1 | 6 | % | (184.0 | ) | 2,886.3 | — | % | ||||||||||||
Rest of World | 2,164.5 | 2,016.4 | 7 | % | 33.4 | 2,197.9 | 9 | % | |||||||||||||
Total net sales | 8,233.2 | 8,570.2 | (4 | )% | (153.8 | ) | 8,079.4 | (6 | )% | ||||||||||||
Other revenues (3) | 122.0 | 98.6 | 24 | % | (2.6 | ) | 119.4 | 21 | % | ||||||||||||
Consolidated total revenues (4) | $ | 8,355.2 | $ | 8,668.8 | (4 | )% | $ | (156.4 | ) | $ | 8,198.8 | (5 | )% | ||||||||
(1) | Currency impact is shown as unfavorable (favorable). |
(2) | The constant currency percentage change is derived by translating net sales or revenues for the current period at prior year comparative period exchange rates, and in doing so shows the percentage change from 2018 constant currency net sales or revenues to the corresponding amount in the prior year. |
(3) | For the nine months ended September 30, 2018, other revenues in North America, Europe, and Rest of World were approximately $84.5 million, $19.8 million, and $17.7 million, respectively. |
(4) | Amounts exclude intersegment revenue that eliminates on a consolidated basis. |
Total Revenues
For the nine months ended September 30, 2018, Mylan reported total revenues of $8.36 billion, compared to $8.67 billion for the comparable prior year period, representing a decrease of $313.6 million, or 4%. Total revenues include both net sales and other revenues from third parties. Net sales for the nine months ended September 30, 2018 were $8.23 billion, compared to $8.57 billion for the comparable prior year period, representing a decrease of $337.0 million, or 4%. Other revenues for the nine months ended September 30, 2018 were $122.0 million, compared to $98.6 million for the comparable prior year period. The increase in other revenues was primarily the result of consideration received from a license of intellectual property during the current year period.
The decrease in total revenues included lower net sales in the North America segment of 18%. This decrease was partially offset by increased net sales in the Europe segment of 6%, and in the Rest of World segment of 7%. The overall decrease in total revenues was primarily driven by a decrease in net sales from existing products. Net sales from existing products, partially offset by new product sales, decreased on a constant currency basis by approximately $426.5 million primarily as a result of lower volumes, and to a lesser extent, pricing. Net sales were also negatively impacted by approximately $64.4 million due to the adoption of new accounting standards. Mylan’s total revenues were favorably impacted by the effect of foreign currency translation, primarily reflecting changes in the U.S. Dollar as compared to the currencies of Mylan’s subsidiaries in the European Union, the United Kingdom, and Japan. The favorable impact of foreign currency translation on current year total revenues was approximately $156.4 million. On a constant currency basis, the decline in total revenues for the nine months ended September 30, 2018 was approximately $470.0 million, or 5%.
Wholesaler and distributor inventory levels of our products can fluctuate throughout the year due to the seasonality of certain products, the timing of product demand and other factors. Such fluctuations may impact the comparability of our net sales between periods.
From time to time, a limited number of our products may represent a significant portion of our net sales, gross profit and net earnings. Generally, this is due to the timing of new product introductions and the amount, if any, of additional competition in the market. Our top ten products in terms of net sales, in the aggregate, represented approximately 20% and 22% for the nine months ended September 30, 2018 and 2017, respectively.
77
Net sales are derived from our three geographic reporting segments: North America, Europe and Rest of World. The graph below shows net sales by segment for the nine months ended September 30, 2018 and 2017 and the net change period over period:
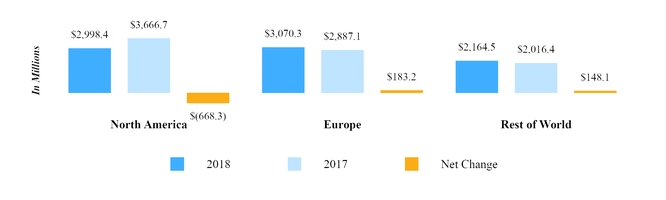
North America Segment
Net sales from North America decreased by $668.3 million or 18% during the nine months ended September 30, 2018 when compared to the prior year period. This decrease was due primarily to lower volumes on existing products, including the EpiPen® Auto-Injector, partially offset by new product sales. The decline in volumes was primarily driven by the timing of purchases of our products by customers, the divestiture of certain contract manufacturing assets, the loss of exclusivity of certain products, and actions associated with the restructuring and remediation program at the Morgantown manufacturing facility. In addition, net sales were negatively impacted by $99.1 million related to the implementation of new accounting standards. Pricing also declined when compared to the prior year. The impact of foreign currency translation on current period net sales was insignificant within North America.
Europe Segment
Net sales from Europe increased by $183.2 million or 6% during the nine months ended September 30, 2018 when compared to the prior year period. This increase was primarily the result of the favorable impact of foreign currency translation, new product sales, and to a lesser extent, higher volumes of existing products. The favorable impact of foreign currency translation was approximately $184.0 million or 6%. Partially offsetting these items was lower pricing on existing products. Constant currency net sales were essentially flat compared to the prior year period.
Rest of World Segment
Net sales from Rest of World increased by $148.1 million or 7% during the nine months ended September 30, 2018 when compared to the prior year period. This increase was primarily the result of new product sales, and to a lesser extent, higher volumes of existing products including higher sales of key brands in China. The increase in net sales as a result of new products was primarily due to new product sales from the Company’s anti-retroviral therapy franchise combined with new product sales in Australia, Japan and China. This increase was partially offset by lower pricing on existing products and the unfavorable impact of foreign currency translation. Overall, net sales from Rest of World were unfavorably impacted by the effect of foreign currency translation of approximately $33.4 million, or 2%. Constant currency net sales increased by approximately $181.5 million or 9% when compared to the prior year period.
78
Cost of Sales and Gross Profit
Cost of sales increased from $5.18 billion for the nine months ended September 30, 2017 to $5.37 billion for the nine months ended September 30, 2018. Cost of sales was primarily impacted by purchase accounting related amortization of acquired intangible assets and other special items, which are described further in the section titled Use of Non-GAAP Financial Measures. Gross profit for the nine months ended September 30, 2018 was $2.99 billion and gross margins were 36%. For the nine months ended September 30, 2017, gross profit was $3.49 billion and gross margins were 40%. Gross margins were negatively impacted by approximately 260 basis points related to the incremental amortization from product acquisitions and IPR&D impairment charges. Gross margins were also negatively affected by approximately 220 basis points as a result of incremental manufacturing expenses, site remediation expenses and incremental restructuring charges incurred during the current period principally as a result of the activities at the Company’s Morgantown facility. In addition, gross margins were negatively impacted in the current quarter as a result of lower gross profit from the sales of existing products in North America. The unfavorable impact of these items was partially offset by the impact from new product sales. Adjusted gross margins were 54% for the nine months ended September 30, 2018, compared to 53% for the nine months ended September 30, 2017.
A reconciliation between cost of sales, as reported under U.S. GAAP, and adjusted cost of sales and adjusted gross margin for the nine months ended September 30, 2018 compared to the nine months ended September 30, 2017 is as follows:
Nine Months Ended | |||||||
September 30, | |||||||
(In millions) | 2018 | 2017 | |||||
U.S. GAAP cost of sales | $ | 5,369.2 | $ | 5,180.3 | |||
Deduct: | |||||||
Purchase accounting amortization and other related items | (1,275.2 | ) | (1,054.9 | ) | |||
Acquisition related items | (2.4 | ) | (1.9 | ) | |||
Restructuring and related costs | (97.2 | ) | (37.3 | ) | |||
Other special items | (139.4 | ) | (39.2 | ) | |||
Adjusted cost of sales | $ | 3,855.0 | $ | 4,047.0 | |||
Adjusted gross profit (a) | $ | 4,500.2 | $ | 4,621.8 | |||
Adjusted gross margin (a) | 54 | % | 53 | % | |||
(a) | Adjusted gross profit is calculated as total revenues less adjusted cost of sales. Adjusted gross margin is calculated as adjusted gross profit divided by total revenues. |
Operating Expenses
Research & Development Expense
R&D expense for the nine months ended September 30, 2018 was $555.7 million, compared to $580.9 million for the comparable prior year period, a decrease of $25.2 million. This decrease was primarily due to lower expenditures related to the Company’s respiratory programs, and lower expenses due to the reprioritization of global programs. Partially offsetting this decrease were slightly higher payments in the current year related to licensing arrangements for products in development which totaled approximately $100.5 million during the nine months ended September 30, 2018, compared to approximately $89.9 million in the prior year period.
79
Selling, General & Administrative Expense
SG&A expense for the nine months ended September 30, 2018 was $1.81 billion, compared to $1.92 billion for the comparable prior year period, a decrease of $107.3 million. The decrease is primarily due to ongoing integration activities, lower acquisition-related costs of approximately $41.8 million, and reduced share-based compensation expense primarily due to the reversal of all of the remaining cumulative expense related to the 2014 Program that resulted in the Company recognizing a reduction in share-based compensation expense of approximately $70.6 million during the nine months ended September 30, 2018. These decreases were partially offset by an increase in bad debt expense of approximately $23.0 million primarily related to a special business interruption event for one customer, and $20.0 million of compensation expense as an additional discretionary bonus for a certain group of employees. None of the employees who will receive this bonus are named executive officers.
Litigation Settlements and Other Contingencies, Net
During the nine months ended September 30, 2018 and 2017, the Company recorded a net gain of $50.6 million and $25.8 million, respectively, for litigation settlements and other contingencies. During the nine months ended September 30, 2018, the Company recognized a net gain of $49.3 million for fair value adjustments related to the respiratory delivery platform contingent consideration. The fair value adjustments were the net result of changes to assumptions relating to the timing of product launch along with other competitive and market factors. In addition, the Company recognized a gain of approximately $14.7 million related to a favorable litigation settlement, which was partially offset by litigation related charges of approximately $13.3 million, primarily related to an anti-trust matter and a patent infringement matter. During the nine months ended September 30, 2017, the Company recorded a gain of approximately $88.1 million for fair value adjustments related to the contingent consideration for the respiratory delivery platform. Offsetting this gain were accruals of approximately $52.5 million primarily related to the modafinil and EpiPen® Auto-Injector litigation matters and an accrual increase related to an anti-trust related matter. In addition, a fair value loss of $9.9 million related to the contingent consideration related to the acquisition of certain female healthcare businesses from Famy Care Limited was recognized during the prior year period.
Interest Expense
Interest expense for the nine months ended September 30, 2018 totaled $407.1 million, compared to $406.3 million for the nine months ended September 30, 2017, an increase of $0.8 million. The increase is primarily due to slightly higher average interest rates on debt issued in 2018 when compared to the debt instruments redeemed during 2018, which was partially offset by the impact of lower average long-term debt balances during the nine months ended September 30, 2018 as compared to the prior year period.
Other Expense, Net
Other expense, net was $44.3 million for the nine months ended September 30, 2018, compared to $35.8 million for the comparable prior year period. Other expense, net includes losses from equity affiliates, foreign exchange gains and losses and interest and dividend income. Other expense, net was comprised of the following for the nine months ended September 30, 2018 and 2017, respectively:
Nine Months Ended | |||||||
September 30, | |||||||
(In millions) | 2018 | 2017 | |||||
Losses from equity affiliates, primarily clean energy investments | $ | 58.6 | $ | 77.2 | |||
Foreign exchange gains, net | (16.0 | ) | (33.0 | ) | |||
Other losses/(gains), net | 1.7 | (8.4 | ) | ||||
Other expense, net | $ | 44.3 | $ | 35.8 | |||
Income Tax (Benefit) Provision
For the nine months ended September 30, 2018, the Company recognized an income tax benefit of $79.9 million, compared to an income tax provision of $124.2 million for the comparable prior year period. During the nine months ended September 30, 2018, as a result of federal and state audits and settlements and expirations of certain state, federal, and foreign statutes of limitations, the Company reduced its liability for unrecognized tax benefits by approximately $86.0 million, which resulted in a net benefit to the income tax provision of approximately $53.0 million. Partially offsetting this benefit was an
80
increase in the reserve for uncertain tax benefits of approximately $18.0 million for certain other matters. Additionally, during the nine months ended September 30, 2018, income tax benefits of approximately $30.0 million were recognized upon revaluations of certain deferred tax items upon statutory rate changes in certain non-U.S. jurisdictions, $6.9 million of valuation allowance releases in certain jurisdictions, and a benefit of approximately $6.2 million related to the finalization of previously recorded 2017 tax estimates upon the filing of tax returns. Also impacting the current year income tax benefit was the changing mix of income earned in jurisdictions with differing tax rates, and changes in valuation allowances applied to certain tax attributes.
Use of Non-GAAP Financial Measures
Whenever the Company uses non-GAAP financial measures, we provide a reconciliation of the non-GAAP financial measures to their most directly comparable U.S. GAAP financial measure. Investors and other readers are encouraged to review the related U.S. GAAP financial measures and the reconciliation of non-GAAP measures to their most directly comparable U.S. GAAP measure and should consider non-GAAP measures only as a supplement to, not as a substitute for or as a superior measure to, measures of financial performance prepared in accordance with U.S. GAAP. Additionally, since these are not measures determined in accordance with U.S. GAAP, non-GAAP financial measures have no standardized meaning across companies, or as prescribed by U.S. GAAP and, therefore, may not be comparable to the calculation of similar measures or measures with the same title used by other companies.
Management uses these measures internally for forecasting, budgeting, measuring its operating performance, and incentive-based awards. In addition, primarily due to acquisitions, we believe that an evaluation of our ongoing operations (and comparisons of our current operations with historical and future operations) would be difficult if the disclosure of our financial results was limited to financial measures prepared only in accordance with U.S. GAAP. We believe that non-GAAP financial measures are useful supplemental information for our investors and when considered together with our U.S. GAAP financial measures and the reconciliation to the most directly comparable U.S. GAAP financial measure, provide a more complete understanding of the factors and trends affecting our operations. The financial performance of the Company is measured by senior management, in part, using adjusted metrics as described below, along with other performance metrics. Management’s annual incentive compensation is derived, in part, based on the adjusted EPS (as defined below) metric.
Adjusted Cost of Sales and Adjusted Gross Margin
We use the non-GAAP financial measure “adjusted cost of sales” and the corresponding non-GAAP financial measure “adjusted gross margin.” The principal items excluded from adjusted cost of sales include restructuring, acquisition related and other special items and purchase accounting amortization and other related items, which are described in greater detail below.
Adjusted Net Earnings and Adjusted EPS
Adjusted net earnings is a non-GAAP financial measure and provides an alternative view of performance used by management. Management believes that, primarily due to acquisition activity, an evaluation of the Company’s ongoing operations (and comparisons of its current operations with historical and future operations) would be difficult if the disclosure of its financial results were limited to financial measures prepared only in accordance with U.S. GAAP. Management believes that adjusted net earnings and adjusted net earnings per diluted share (“adjusted EPS”) are two of the most important internal financial metrics related to the ongoing operating performance of the Company, and are therefore useful to investors and that their understanding of our performance is enhanced by these adjusted measures. Actual internal and forecasted operating results and annual budgets used by management include adjusted net earnings and adjusted EPS.
The significant items excluded from adjusted cost of sales, adjusted net earnings and adjusted EPS include:
Purchase Accounting Amortization and Other Related Items
The ongoing impact of certain amounts recorded in connection with acquisitions of both businesses and assets is excluded from adjusted cost of sales, adjusted net earnings and adjusted EPS. These amounts include the amortization of intangible assets, inventory step-up and intangible asset impairment charges, including IPR&D. For the acquisition of businesses accounted for under the provisions of the Financial Accounting Standards Board Accounting Standards Codification (“ASC”) Topic 805, these purchase accounting impacts are excluded regardless of the financing method used for the acquisitions, including the use of cash, long-term debt, the issuance of ordinary shares, contingent consideration or any combination thereof.
81
Upfront and Milestone-Related R&D Expenses
These expenses and payments are excluded from adjusted net earnings and adjusted EPS because they generally occur at irregular intervals and are not indicative of the Company’s ongoing operations. Also included in this adjustment are certain expenses related to the Company’s collaboration agreement with Momenta Pharmaceuticals, Inc. (“Momenta”) including certain milestone related costs. Such costs include payments related to Mylan’s future decisions, on a product by product basis, to continue with the development of such product in the collaboration after certain R&D work is performed. Related amounts are excluded from adjusted net earnings and adjusted EPS as Mylan considers such payments as additional upfront buy-in payments for the products.
Accretion of Contingent Consideration Liability and Other Fair Value Adjustments
The impact of changes to the fair value of contingent consideration and accretion expense are excluded from adjusted net earnings and adjusted EPS because they are not indicative of the Company’s ongoing operations due to the variability of the amounts and the lack of predictability as to the occurrence and/or timing and management believes their exclusion is helpful to understanding the underlying, ongoing operational performance of the business.
Restructuring, Acquisition Related and Other Special Items
Costs related to restructuring, acquisition and integration activities and other actions are excluded from adjusted cost of sales, adjusted net earnings and adjusted EPS, as applicable. These amounts include items such as:
• | Costs related to formal restructuring programs and actions, including costs associated with facilities to be closed or divested, employee separation costs, impairment charges, accelerated depreciation, incremental manufacturing variances, equipment relocation costs and other restructuring related costs; |
• | Certain acquisition related remediation and integration and planning costs, as well as other costs associated with acquisitions such as advisory and legal fees and certain financing related costs, and other business transformation and/or optimization initiatives, which are not part of a formal restructuring program, including employee separation and post-employment costs; |
• | The pre-tax loss of the Company’s clean energy investments, whose activities qualify for income tax credits under the U.S. Internal Revenue Code of 1986, as amended; only included in adjusted net earnings and adjusted EPS is the net tax effect of the entity’s activities; |
• | The pre-tax mark-to-market gains and losses of the Company’s investments in marketable equity securities historically accounted for as available for sale securities; only included in adjusted net earnings and adjusted EPS are cumulative realized gains and losses; |
• | Other costs, incurred from time to time, related to certain special events or activities that lead to gains or losses, including, but not limited to, incremental manufacturing variances, asset write-downs, or liability adjustments; and |
• | Certain costs to further develop and optimize our global enterprise resource planning systems, operations and supply chain. |
The Company has undertaken restructurings and other optimization initiatives of differing types, scope and amount during the covered periods and, therefore, these charges should not be considered non-recurring; however, management excludes these amounts from adjusted net earnings and adjusted EPS because it believes it is helpful to understanding the underlying, ongoing operational performance of the business.
Litigation Settlements, Net
Charges and gains related to legal matters, such as those discussed in Note 20 Litigation included in Part I, Item 1 of this Form 10-Q are generally excluded from adjusted earnings and adjusted EPS. Normal, ongoing defense costs of the Company made in the normal course of our business are not excluded.
82
Reconciliation of Adjusted Net Earnings and Adjusted EPS
A reconciliation between net earnings and diluted earnings per share, as reported under U.S. GAAP, and adjusted net earnings and adjusted EPS for the periods shown follows:
Three Months Ended September 30, | Nine Months Ended September 30, | ||||||||||||||||||||||||||||||
(In millions, except per share amounts) | 2018 | 2017 | 2018 | 2017 | |||||||||||||||||||||||||||
U.S. GAAP net earnings and U.S. GAAP EPS | $ | 176.7 | $ | 0.34 | $ | 88.3 | $ | 0.16 | $ | 301.3 | $ | 0.58 | $ | 451.7 | $ | 0.84 | |||||||||||||||
Purchase accounting related amortization (primarily included in cost of sales) (a) | 428.7 | 370.7 | 1,282.4 | 1,074.9 | |||||||||||||||||||||||||||
Litigation settlements and other contingencies, net | (20.4 | ) | 15.2 | (50.6 | ) | (25.8 | ) | ||||||||||||||||||||||||
Interest expense (primarily clean energy investment financing and accretion of contingent consideration) | 12.1 | 10.3 | 31.0 | 37.2 | |||||||||||||||||||||||||||
Clean energy investments pre-tax loss | 12.6 | 22.4 | 58.6 | 66.4 | |||||||||||||||||||||||||||
Acquisition related costs (primarily included in SG&A and cost of sales) (b) | 4.9 | 15.2 | 17.4 | 60.2 | |||||||||||||||||||||||||||
Restructuring related costs (c) | 80.8 | 73.4 | 202.3 | 112.8 | |||||||||||||||||||||||||||
Other special items included in: | |||||||||||||||||||||||||||||||
Cost of sales (d) | 65.4 | 12.3 | 139.4 | 39.2 | |||||||||||||||||||||||||||
Research and development expense (e) | 3.2 | 15.1 | 100.3 | 89.9 | |||||||||||||||||||||||||||
Selling, general and administrative expense (f) | (0.7 | ) | 4.0 | 33.2 | 12.7 | ||||||||||||||||||||||||||
Other expense, net (g) | 1.3 | (3.1 | ) | 25.5 | 4.8 | ||||||||||||||||||||||||||
Tax effect of the above items and other income tax related items | (116.6 | ) | (34.1 | ) | (445.7 | ) | (244.5 | ) | |||||||||||||||||||||||
Adjusted net earnings and adjusted EPS | $ | 648.0 | $ | 1.25 | $ | 589.7 | $ | 1.10 | $ | 1,695.1 | $ | 3.28 | $ | 1,679.5 | $ | 3.13 | |||||||||||||||
Weighted average diluted ordinary shares outstanding | 516.5 | 537.0 | 516.5 | 537.0 | |||||||||||||||||||||||||||
Significant items for the three and nine months ended September 30, 2018 include the following:
(a) | The increase in purchase accounting related amortization is primarily due to the increase in amortization expense as a result of the full impact of certain product rights acquisitions which occurred in 2017, the current year impact of the 2018 product rights acquisitions and IPR&D impairment charges of $15.5 million and $87.5 million during the three and nine months ended September 30, 2018, respectively. |
(b) | Acquisition related costs incurred in 2017 and through the nine months ended September 30, 2018 consist primarily of integration activities. |
(c) | For the three months ended September 30, 2018, approximately $51.8 million is included in cost of sales, $0.3 million is included in R&D, and $28.7 million is included in SG&A. For the nine months ended September 30, 2018, approximately $97.2 million is included in cost of sales, $17.0 million is included in R&D, and $88.4 million is included in SG&A. Refer to Note 17 Restructuring included in Part I, Item 1 of this Form 10-Q for additional information. |
(d) | The three and nine months ended September 30, 2018 increases relate primarily to expenses of $48.9 million and $104.9 million, respectively, for certain incremental manufacturing variances and site remediation activities as a result of the activities at the Company’s Morgantown facility. |
(e) | R&D expense for the three months ended September 30, 2018 includes expenses related to on-going collaboration agreements, including Momenta. For the nine months ended September 30, 2018, R&D expense includes $73.5 million |
83
related to four non-refundable upfront payments for development agreements entered into during the current period. The remaining expense relates to the on-going collaboration agreements, including Momenta. R&D expense for the three months ended September 30, 2017 includes $8.0 million related to Momenta collaboration expense. For the nine months ended September 30, 2017, R&D expense includes an upfront expense of approximately $50.0 million related to a joint development and marketing agreement for a respiratory product, $22.5 million related to Momenta collaboration expense, and other similar smaller agreements.
(f) | The decrease for the three months ended September 30, 2018 is primarily related to a gain from the sale of assets. The increase for the nine months ended September 30, 2018 is primarily related to bad debt expense of approximately $26.5 million related to a special business interruption event for one customer. |
(g) | The increase for the nine months ended September 30, 2018 is primarily related to mark-to-market losses of investments in equity securities historically accounted for as available-for-sale securities and the cumulative realized gains on such investments. |
Liquidity and Capital Resources
Our primary source of liquidity is net cash provided by operations, which was $1.71 billion for the nine months ended September 30, 2018. We believe that net cash provided by operating activities and available liquidity will continue to allow us to meet our needs for working capital, capital expenditures and interest and principal payments on debt obligations. Nevertheless, our ability to satisfy our working capital requirements and debt service obligations, or fund planned capital expenditures, will substantially depend upon our future operating performance (which will be affected by prevailing economic conditions), and financial, business and other factors, some of which are beyond our control.
Operating Activities
Net cash provided by operating activities increased by $136.3 million to $1.71 billion for the nine months ended September 30, 2018, as compared to net cash provided by operating activities of $1.57 billion for the nine months ended September 30, 2017. Net cash provided by operating activities is derived by net earnings adjusted for non-cash operating items, gains and losses attributed to investing and financing activities and changes in operating assets and liabilities resulting from timing differences between the receipts and payments of cash, including changes in cash primarily reflecting the timing of cash collections from customers, payments to vendors and employees and tax payments in the ordinary course of business.
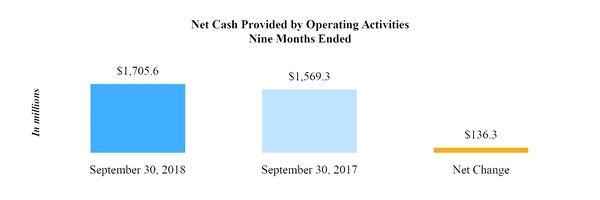
The net increase in net cash provided by operating activities was principally due to the following:
• | a net increase in cash provided by other operating assets and liabilities, net of $413.4 million, principally a result of payments made of approximately $255.2 million related to the MDRP Settlement and payments of other accruals in the prior year period; |
• | a net decrease in the amount of cash used through changes in accounts payable of $173.3 million as a result of the timing of cash payments; |
• | a net decrease in the amount of cash used through changes in income taxes of $51.9 million as a result of the level and timing of estimated tax payments made during the current period; and |
• | a net increase in the amount of cash provided by accounts receivable of $46.0 million, reflecting the timing of sales and cash collections. |
84
These items were partially offset by the following:
• | a decrease in net earnings of approximately $150.4 million, principally as a result of a decrease in earnings from operations; |
• | a net decrease in non-cash expenses of $60.3 million. The net decrease in non-cash expenses was primarily due to a net increase in the deferred income tax benefit of $167.3 million, a decrease in share-based compensation expense of $72.8 million, a net decrease in other non-cash items of $27.1 million and a decrease in the loss from equity method investments of $18.6 million, partially offset by increased depreciation and amortization of $221.2 million; and |
• | a net increase of $337.6 million in the amount of cash used through changes in inventory balances. |
Investing Activities
Net cash used in investing activities was $1.03 billion for the nine months ended September 30, 2018, as compared to $755.7 million for the nine months ended September 30, 2017, a net increase of $279.1 million.
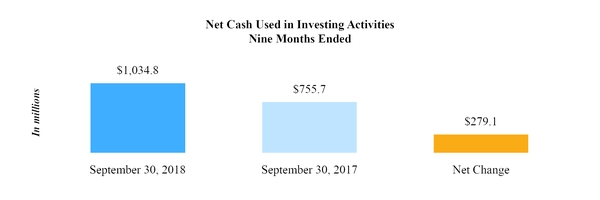
In 2018, significant items in investing activities included the following:
• | cash paid for acquisitions, net totaling approximately $65.9 million related to deferred non-contingent purchase price payments for the acquisition of Apicore, Inc.; |
• | payments for product rights and other, net totaling approximately $854.2 million, which included payments of approximately $817 million related to commercialized product rights, primarily related to the worldwide rights to the TOBI Podhaler® and TOBI® solution, Betadine in certain European markets and other products in certain rest of world markets; and |
• | capital expenditures, primarily for equipment and facilities, totaling approximately $137.4 million. While there can be no assurance that current expectations will be realized, capital expenditures for the 2018 calendar year are expected to be approximately $250 million to $300 million. |
In 2017, significant items in investing activities included the following:
• | cash paid for acquisitions totaling approximately $71.6 million related to the Company’s acquisition of Meda AB (publ.) (“Meda”); |
• | payments for product rights and other, net totaled approximately $558.8 million, which included a payment of $50.0 million related to the acquisition of intellectual property rights for the Cold-EEZE® brand cold remedy line, a payment of $168.0 million related to the acquisition of additional intellectual property rights and marketing authorizations and a payment of $277.9 million related to the acquisition of a portfolio of generic product rights in the United States; |
• | proceeds from the sale of certain European assets for approximately $31.1 million; and |
• | capital expenditures, primarily for equipment and facilities, totaled approximately $156.4 million. |
85
Financing Activities
Net cash used in financing activities was $514.7 million for the nine months ended September 30, 2018, compared to net cash used in financing activities of $1.25 billion for the nine months ended September 30, 2017, a net decrease of $739.2 million.
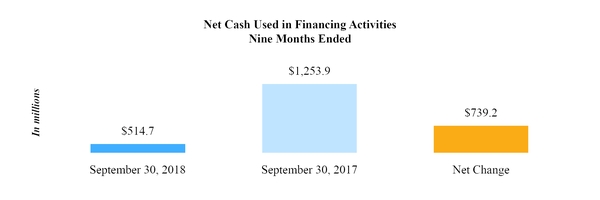
In 2018, significant items in financing activities included the following:
• | the Company repurchased 9.8 million ordinary shares at a cost of approximately $432.0 million completing the previously authorized share repurchase program; |
• | long-term debt proceeds of approximately $2.58 billion primarily related to borrowings of approximately $498.4 million under the 2016 Revolving Facility, proceeds from the April 2018 Senior Notes offering of approximately $1.50 billion, and proceeds from the May 2018 Euro Senior Notes offering of approximately €500.0 million; |
• | long-term debt payments of approximately $2.60 billion consisting primarily of repayments of borrowings of approximately $498.0 million under the 2016 Revolving Facility, redemptions of $1.50 billion principal amount of senior notes in connection with the April 2018 Senior Notes offering and redemptions of $600.0 million principal amount of senior notes in connection with the May 2018 Euro Senior Notes offering; and |
• | a net decrease in short-term borrowings of $45.9 million. |
In 2017, significant items in financing activities included the following:
• | proceeds of €500 million related to the issuance of the 2020 Floating Rate Euro Notes; |
• | a voluntary prepayment of $1.5 billion of the 2016 Term Facility and $245 million of the Meda 2.0kr billion term loan; and |
• | net repayments of short-term borrowings of $48.3 million. |
Capital Resources
Our cash and cash equivalents totaled $449.2 million at September 30, 2018, and the majority of these funds are held by our non-U.S. subsidiaries. The Company anticipates having sufficient liquidity, including existing borrowing capacity under the 2018 Revolving Facility, including the Commercial Paper Program, and the Receivables Facility (each as defined below) combined with cash to be generated from operations, to fund foreseeable cash needs without requiring the repatriation of non-U.S. cash.
The Company has access to $2.0 billion under the 2018 Revolving Facility which matures in 2023. Up to $1.65 billion of the 2018 Revolving Facility may be used to support borrowings under our Commercial Paper Program.
In addition to the 2018 Revolving Facility, Mylan Pharmaceuticals Inc., a wholly owned subsidiary of the Company, has a $400 million receivables facility (the “Receivables Facility”). In January 2018, the maturity of the Receivables Facility was extended to January 2019. From time-to-time, the available amount of the Receivables Facility may be less than $400 million based on accounts receivable concentration limits and other eligibility requirements. As of September 30, 2018, the Company had no amounts outstanding under the Receivables Facility.
86
At September 30, 2018, our long-term debt, including the current portion, totaled $14.43 billion, as compared to $14.61 billion at December 31, 2017. Total long-term debt is calculated net of deferred financing fees which were $77.9 million and $75.0 million at September 30, 2018 and December 31, 2017, respectively.
For additional information regarding our debt and debt agreements refer to Note 12 Debt in Part I, Item 1 of this Form 10-Q.
Long-term Debt Maturity
Mandatory minimum repayments remaining on the outstanding notional amount of long-term debt at September 30, 2018 was as follows for each of the periods ending December 31:
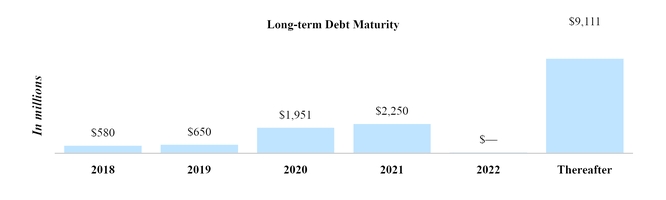
The Company’s term credit facility dated as of November 22, 2016 (as amended, supplemented or otherwise modified from time to time, the “2016 Term Facility”), among the Company, certain affiliates and subsidiaries of the Company from time to time party thereto as guarantors, each lender from time to time party thereto and Goldman Sachs Bank USA, as administrative agent and the Company’s revolving credit facility dated as of July 27, 2018 (as amended, supplemented or otherwise modified from time to time, the “2018 Revolving Facility”), among Mylan Inc., as borrower, the Company, as a guarantor, certain lenders and issuing banks and Bank of America, N.A., as the administrative agent, contain customary affirmative covenants for facilities of this type, including among others, covenants pertaining to the delivery of financial statements, notices of default and certain material events, maintenance of corporate existence and rights, property, and insurance and compliance with laws, as well as customary negative covenants for facilities of this type, including limitations on the incurrence of subsidiary indebtedness, liens, mergers and certain other fundamental changes, investments and loans, acquisitions, transactions with affiliates, payments of dividends and other restricted payments and changes in our lines of business.
The 2016 Term Facility and 2016 Revolving Facility contain a maximum consolidated leverage ratio financial covenant requiring maintenance of a maximum ratio of 3.75 to 1.00 for consolidated total indebtedness as of the end of any quarter to consolidated EBITDA for the trailing four quarters as defined in the related credit agreements (“leverage ratio”).
Following the acquisition of Meda (a qualifying acquisition), the leverage ratio changed to 4.25 to 1.00 through June 30, 2017. On November 3, 2017, the Company entered into an amendment to the agreements for the 2016 Term Facility and 2016 Revolving Facility to extend the leverage ratio covenant of 4.25 to 1.00 through the December 31, 2018 reporting period. The 2018 Revolving Facility similarly provides for a leverage ratio covenant of 4.25 to 1.00 through the December 31, 2018 reporting period and a leverage ratio of 3.75 to 1.00 thereafter. The Company is in compliance at September 30, 2018 and expects to remain in compliance for the next twelve months.
87
Collaboration and Licensing Agreements
We periodically enter into collaboration and licensing agreements with other pharmaceutical companies for the development, manufacture, marketing and/or sale of pharmaceutical products. Our significant collaboration agreements are focused on the development, manufacturing, supply and commercialization of multiple, high-value generic biologic compounds, insulin analog products and respiratory products, among other complex products. Under these agreements, we have future potential milestone payments and co-development expenses payable to third parties as part of our licensing, development and co-development programs. Payments under these agreements generally become due and are payable upon the satisfaction or achievement of certain developmental, regulatory or commercial milestones or as development expenses are incurred on defined projects. Milestone payment obligations are uncertain, including the prediction of timing and the occurrence of events triggering a future obligation and are not reflected as liabilities in the Condensed Consolidated Balance Sheets, except for milestone and royalty obligations reflected as acquisition related contingent consideration. Our potential maximum development milestones not accrued for at September 30, 2018 totaled approximately $430 million, which includes the new agreements entered into during 2018 and excludes potential milestone payments to Momenta. We estimate the amounts that may be paid within the next year to be approximately $70 million. These agreements may also include potential sales based milestones and call for us to pay a percentage of amounts earned from the sale of the product as a royalty or a profit share. The amounts disclosed do not include sales-based milestones or royalty obligations on future sales of product as the timing and amount of future sales levels and costs to produce products subject to these obligations is not reasonably estimable. These sales-based milestones or royalty obligations may be significant depending upon the level of commercial sales for each product.
On October 1, 2018, Momenta announced that it had initiated discussions with Mylan, to exit its participation in the development of five biosimilar programs including M834, a proposed biosimilar to ORENCIA®. Momenta also announced that it intends to continue the development of M710, a proposed biosimilar to EYLEA® (aflibercept) injection. While the Company is in the process of discussing the transition of collaboration activities with Momenta, it remains committed to invest strategically in biosimilar programs through the evaluation of regulatory data and market dynamics.
We are contractually obligated to make potential future development, regulatory and commercial milestone, royalty and/or profit sharing payments in conjunction with acquisitions we have entered into with third parties. The most significant of these relates to the potential future consideration related to the respiratory delivery platform. These payments are contingent upon the occurrence of certain future events and, given the nature of these events, it is unclear when, if ever, we may be required to pay such amounts. The amount of the contingent consideration liabilities was $418.8 million at September 30, 2018. In addition, the Company expects to incur approximately $20 million to $25 million of non-cash accretion expense related to the increase in the net present value of the contingent consideration liabilities in 2018.
Other Commitments
The Company is involved in various disputes, governmental and/or regulatory inquiries, investigations and proceedings, tax proceedings and litigation matters, both in the U.S. and abroad, that arise from time to time, some of which could result in losses, including damages, fines and/or civil penalties, and/or criminal charges against the Company. These matters are often complex and have outcomes that are difficult to predict. The Company is also party to certain proceedings and litigation matters for which it may be entitled to indemnification under the respective sale and purchase agreements relating to the acquisitions of the former Merck Generics business, Agila Specialties Private Limited, the EPD Business, and certain other acquisitions. We have approximately $52 million accrued for legal contingencies at September 30, 2018.
While the Company believes that it has meritorious defenses with respect to the claims asserted against it and intends to vigorously defend its position, the process of resolving these matters is inherently uncertain and may develop over a long period of time, and so it is not possible to predict the ultimate resolution of any such matter. It is possible that an unfavorable resolution of any of the ongoing matters or the inability or denial of Merck KGaA, Strides Arcolab Limited, Abbott Laboratories, or another indemnitor or insurer to pay an indemnified claim, could have a material adverse effect on the Company’s business, financial condition, results of operations, cash flows and/or ordinary share price.
In the normal course of business, Mylan periodically enters into employment, legal settlement and other agreements which incorporate indemnification provisions. While the maximum amount to which Mylan may be exposed under such agreements cannot be reasonably estimated, the Company maintains insurance coverage, which management believes will effectively mitigate the Company’s obligations under these indemnification provisions. No amounts have been recorded in the Condensed Consolidated Financial Statements with respect to the Company’s obligations under such agreements.
88
The Company has also entered into employment and other agreements with certain executives and other employees that provide for compensation, retirement and certain other benefits. These agreements provide for severance payments under certain circumstances. Additionally, the Company has split-dollar life insurance agreements with certain retired executives.
We are continuously evaluating the potential acquisition of products, as well as companies, as a strategic part of our future growth. Consequently, we may utilize current cash reserves or incur additional indebtedness to finance any such acquisitions, which could impact future liquidity. In addition, on an ongoing basis, we review our operations including the evaluation of potential divestitures of products and businesses as part of our future strategy. Any divestitures could impact future liquidity.
Application of Critical Accounting Policies
We prepare our consolidated financial statements in accordance with U.S. GAAP. In doing so, we have to make estimates and assumptions that affect our reported amounts of assets, liabilities, revenues, and expenses, as well as related disclosure of contingent assets and liabilities. On January 1, 2018, we adopted ASC Topic 606 Revenue from Contracts with Customers (“ASC 606”) using the modified retrospective method applied to those contracts which were not completed as of the date of adoption. Under ASC 606, we recognize net revenue for product sales and services when control of the promised goods is transferred to our customers in an amount that reflects the consideration we expect to be entitled to in exchange for those goods and services. The adoption of this standard did not have a material impact of the Company’s consolidated financial position nor is it expected to have a material impact on future net earnings. Please see Note 2 Revenue Recognition and Accounts Receivable of Part I, Item 1 of this Form 10-Q for additional information regarding the adoption of ASC 606. In addition, please see Part II, Item 7, Application Critical Accounting Policies in the 2017 Form 10-K. There have been no other material changes to our critical accounting policies and estimates since our 2017 Form 10-K.
ITEM 3. | QUANTITATIVE AND QUALITATIVE DISCLOSURES ABOUT MARKET RISK |
For a discussion of the Company’s market risk, see “Item 7A. Quantitative and Qualitative Disclosures about Market Risk” in Mylan N.V.’s Annual Report filed on Form 10-K for the year ended December 31, 2017, as amended.
ITEM 4. | CONTROLS AND PROCEDURES |
An evaluation was performed under the supervision and with the participation of the Company’s management, including the Principal Executive Officer and the Principal Financial Officer, of the effectiveness of the design and operation of the Company’s disclosure controls and procedures as of September 30, 2018. Based upon that evaluation, the Principal Executive Officer and the Principal Financial Officer concluded that the Company’s disclosure controls and procedures were effective.
Management has not identified any changes in the Company’s internal control over financial reporting that occurred during the third quarter of 2018 that have materially affected, or are reasonably likely to materially affect, the Company’s internal control over financial reporting.
89
PART II — OTHER INFORMATION
ITEM 1. | LEGAL PROCEEDINGS |
For information regarding legal proceedings, refer to Note 20 Litigation, in the accompanying Notes to interim financial statements in this Form 10-Q.
ITEM 1A. | RISK FACTORS |
There have been no material changes in the Company’s risk factors from those disclosed in Mylan’s Annual Report on Form 10-K for the year ended December 31, 2017, as amended.
ITEM 5. | OTHER INFORMATION |
Pursuant to Section 8(e) of the Executive Employment Agreements with Heather Bresch, Chief Executive Officer of Mylan N.V., and Rajiv Malik, President of Mylan N.V., we intend to enter into new or renewed agreements and commenced discussions regarding the contracts during the third quarter.
The terms of the existing agreements have been extended through April 1, 2019, by which time the parties expect to have finalized the terms of the agreements.
ITEM 6. EXHIBITS | |
Revolving Credit Agreement, dated as of July 27, 2018, among Mylan Inc., as borrower, Mylan N.V., as a guarantor, the other guarantors party thereto, certain lenders and issuing banks and Bank of America, N.A., as administrative agent, filed as Exhibit 10.1 to the Report on Form 8-K filed with the SEC on July 30, 2018, and incorporated herein by reference. | |
Form of Dealer Agreement among Mylan N.V., Mylan Inc. and the Dealer thereto, filed as Exhibit 10.2 to the Report on Form 8-K filed with the SEC on July 30, 2018, and incorporated herein by reference. | |
Certification of Principal Executive Officer pursuant to Section 302 of the Sarbanes-Oxley Act of 2002. | |
Certification of Principal Financial Officer pursuant to Section 302 of the Sarbanes-Oxley Act of 2002. | |
Certification of Principal Executive Officer and Principal Financial Officer pursuant to Section 906 of the Sarbanes-Oxley Act of 2002. | |
101.INS | XBRL Instance Document |
101.SCH | XBRL Taxonomy Extension Schema |
101.CAL | XBRL Taxonomy Extension Calculation Linkbase |
101.DEF | XBRL Taxonomy Definition Linkbase |
101.LAB | XBRL Taxonomy Extension Label Linkbase |
101.PRE | XBRL Taxonomy Extension Presentation Linkbase |
90
SIGNATURES
Pursuant to the requirements of the Securities Exchange Act of 1934, the registrant has duly caused this report to be signed on its behalf by the undersigned thereunto duly authorized.
Mylan N.V. (Registrant) | ||
By: | /s/ HEATHER BRESCH | |
Heather Bresch | ||
Chief Executive Officer | ||
(Principal Executive Officer) | ||
November 6, 2018
/s/ KENNETH S. PARKS | ||
Kenneth S. Parks | ||
Chief Financial Officer | ||
(Principal Financial Officer) | ||
November 6, 2018
91