Attached files
| file | filename |
|---|---|
| 8-K - 8-K - CENTERSPACE | a11062018form8-k.htm |

Investor Presentation NAREIT REITworld | San Francisco, CA November 2018

SAFE HARBOR STATEMENT AND LEGAL DISCLOSURE Certain statements in this presentation are “forward-looking statements” within the meaning of the Private Securities Litigation Reform Act of 1995. Such statements involve known and unknown risks, uncertainties, and other factors that may cause actual results to differ materially from expected results. These statements may be identified by our use of words such as “expects,” “plans,” “estimates,” “anticipates,” “projects,” “intends,” “believes,” and similar expressions that do not relate to historical matters. Such risks, uncertainties, and other factors include, but are not limited to, changes in general and local economic and real estate market conditions, fluctuations in interest rates, the effect of government regulations, the availability and cost of capital, risks associated with our value add and redevelopment opportunities, property acquisition and disposition activities, the financial condition of our tenants, competition from other developers, our ability to attract and retain skilled personnel, our ability to maintain our tax status as a real estate investment trust (REIT), and those risks and uncertainties detailed from time to time in our filings with the Securities and Exchange Commission, including the “Management’s Discussion and Analysis of Financial Condition and Results of Operations” and “Risk Factors” contained in our Annual Report on Form 10-K for the fiscal year ended April 30, 2018, and in subsequent quarterly reports on Form 10-Q. We assume no obligation to update or supplement forward-looking statements that become untrue due to subsequent events. www.iretapartments.com NAREIT REITworld | November 2018 2

COMPANY SNAPSHOT We are a premier multifamily company delivering exposure to strong Midwest markets Minot Grand Forks % of Q1 Average Bismarck Billings (1) Region FY19 NOI Homes Rent St. Cloud Revenue Growth CAGR Minneapolis, MN 20.0% 1,988 $1,441 Minneapolis For communities built since 2010 Rapid City Rochester Rochester, MN 14.2% 1,711 $1,223 Sioux Falls 3.9% 4.1% Denver, CO 9.3% 664 $1,807 Sioux City 3.1% Omaha 2.3% Grand Forks, ND 9.2% 1,554 $923 Lincoln Denver 1.9% Omaha, NE 8.3% 1,370 $874 Topeka Bismarck, ND 8.1% 1,259 $957 St. Cloud, MN 7.2% 1,190 $931 Midwest South West Northeast National Avg Topeka, KS 5.7% 1,042 $807 • Newer communities in the Midwest Sioux Falls, SD 5.2% 969 $838 have shown strong performance Billings, MT 4.9% 770 $914 during this economic expansion Minot, ND 4.6% 712 $1,002 • 36% of IRET’s expected FY19 NOI from communities built since 2010 Rapid City, SD 3.3% 474 $925 Total / Average 100.0% 13,703 $1,066 Source: Axiometrics (1) Q1FY19 Weighted Average Rent per Occupied Home per Month www.iretapartments.com NAREIT REITworld | November 2018 3

PROFORMA CAPITAL STRUCTURE AS OF 10/31/18 $ in thousands, except where noted $1.5B Total Capitalization % of Weighted Weighted Debt Summary(1) Amount Total Avg. Rate Avg. Maturity $99M $664M Total Secured Debt $449,451 68% 4.59% 4.5 Years Preferred Total Debt Equity Secured Debt Unsecured LOC Balance $69,500 10% 3.79% 3.8 Years Preferred Equity 30% 7% Unsecured Term Loans $145,000 22% 4.10% 6.1 Years Unsecured Debt Total Unsecured Debt $214,500 32% 4.00% 5.3 Years 14% Total Debt $663,951 100% 4.40% 4.8 Years Common Equity 49% Fixed Rate $594,451 90% 4.47% 4.9 Years $722M Common Variable Rate $69,500 10% 3.79% 3.8 Years Equity (1) PROFORMA As of 10/31/18 Note: 10/31/18 closing price, (2) LOC commitments total $250 million shares and units outstanding as of 9/30/18 $109,557 $104,899 $94,010 $82,094 $70,000 Term Loan $55,274 $55,733 LOC $49,571 B Term Loan $21,114 A $7,199 CY19 CY20 CY21 CY22 CY23 CY24 CY25 CY26 CY27 Thereafter % of Total Maturing 3.3% 12.6% 16.2% 14.5% 7.6% 10.8% 16.9% 8.5% 8.6% 1.1% Weighted Average Interest Rate 6.02% 5.56% 5.24% 3.90% 4.02% 3.61% 4.29% 3.74% 3.47% 5.40% www.iretapartments.com NAREIT REITworld | November 2018 4
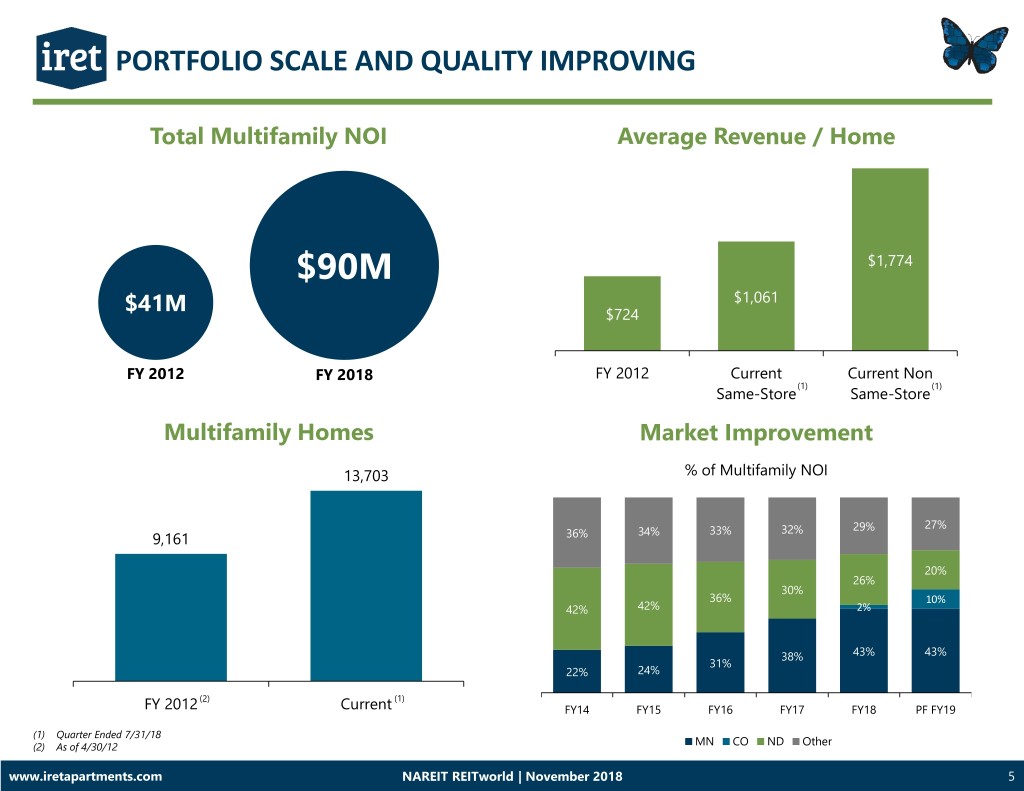
PORTFOLIO SCALE AND QUALITY IMPROVING Total Multifamily NOI Average Revenue / Home $90M $1,774 $1,061 $41M $724 FY 2012 FY 2018 FY 2012 Current Current Non (1) (1) Same-Store Same-Store Multifamily Homes Market Improvement 13,703 % of Multifamily NOI 27% 34% 33% 32% 29% 9,161 36% 20% 26% 30% 36% 10% 42% 42% 2% 38% 43% 43% 31% 22% 24% (2) (1) FY 2012 Current FY14 FY15 FY16 FY17 FY18 PF FY19 (1) Quarter Ended 7/31/18 (2) As of 4/30/12 MN CO ND Other www.iretapartments.com NAREIT REITworld | November 2018 5
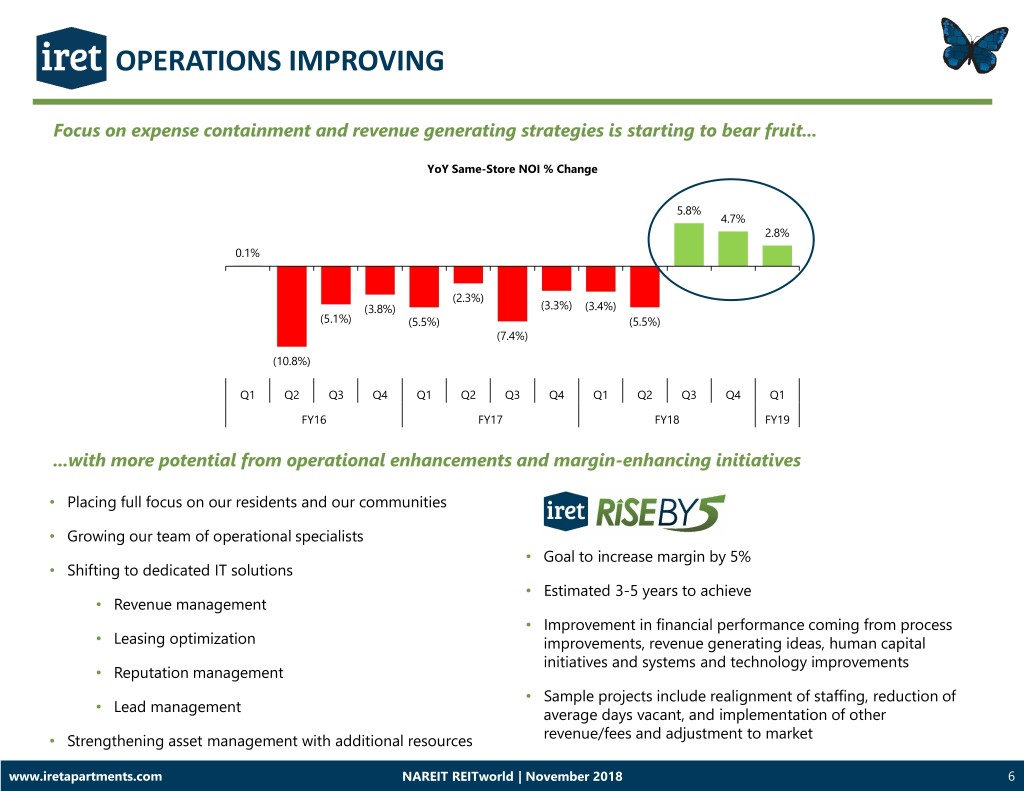
OPERATIONS IMPROVING Focus on expense containment and revenue generating strategies is starting to bear fruit... YoY Same-Store NOI % Change 5.8% 4.7% 2.8% 0.1% (2.3%) (3.8%) (3.3%) (3.4%) (5.1%) (5.5%) (5.5%) (7.4%) (10.8%) Q1 Q2 Q3 Q4 Q1 Q2 Q3 Q4 Q1 Q2 Q3 Q4 Q1 FY16 FY17 FY18 FY19 ...with more potential from operational enhancements and margin-enhancing initiatives • Placing full focus on our residents and our communities • Growing our team of operational specialists • Goal to increase margin by 5% • Shifting to dedicated IT solutions • Estimated 3-5 years to achieve • Revenue management • Improvement in financial performance coming from process • Leasing optimization improvements, revenue generating ideas, human capital initiatives and systems and technology improvements • Reputation management • Sample projects include realignment of staffing, reduction of • Lead management average days vacant, and implementation of other • Strengthening asset management with additional resources revenue/fees and adjustment to market www.iretapartments.com NAREIT REITworld | November 2018 6

CAPITAL ALLOCATION PRIORITIES Prudent capital allocation provides greater opportunities to reinvest in and grow our business Continue Disciplined Investment Strategy • Improve portfolio efficiency and quality through targeted redevelopment of existing assets and new acquisitions • Continue active portfolio management • Increase economies of scale Maintain Stronger, More Flexible Balance Sheet • Redeemed Series A ($29M, 8.25%) and Series B ($115M, 7.95%) preferred stock; issued Series C ($103M, 6.625%) preferred stock • Increased unsecured borrowing capacity to $395 million with the recast of our revolving line of credit and placement of two unsecured term loans. This recast improves pricing, flattens the debt maturity schedule and most importantly, includes a re-valuation of all real estate assets providing additional liquidity. • Targeting debt metrics in-line with investment grade benchmarks Enhance Per-Share Metrics • Increase cash flow per share • Generate durable cash flow through higher-quality apartment portfolio • Improve dividend payout ratio www.iretapartments.com NAREIT REITworld | November 2018 7
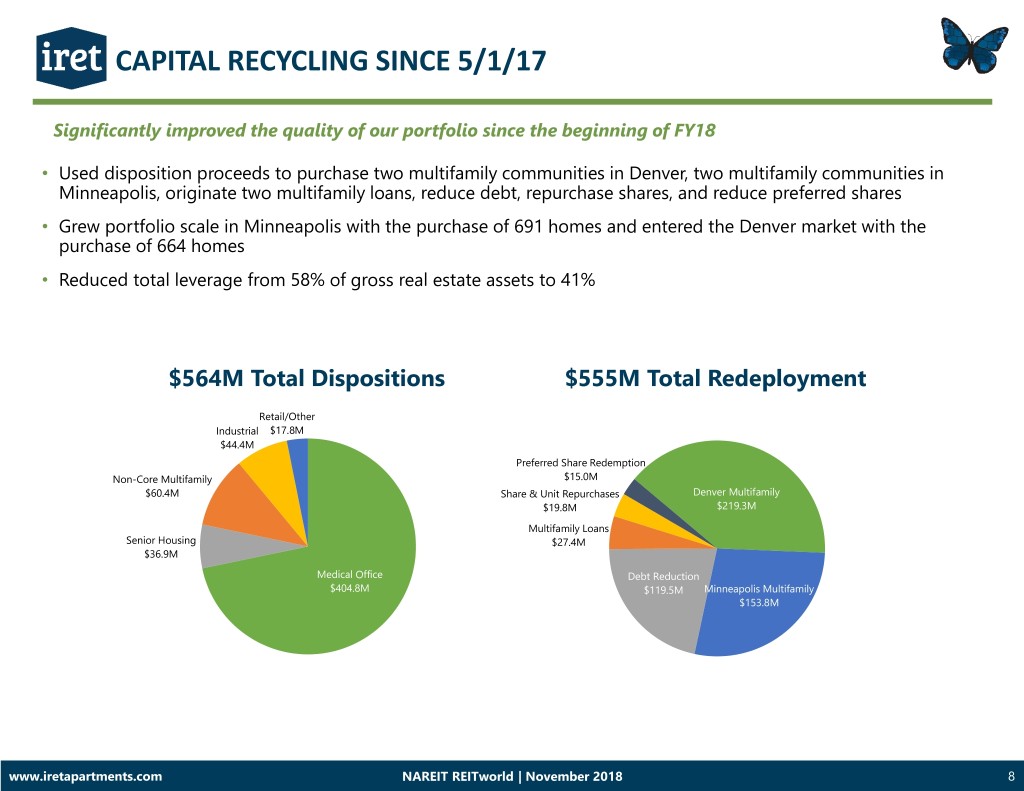
CAPITAL RECYCLING SINCE 5/1/17 Significantly improved the quality of our portfolio since the beginning of FY18 • Used disposition proceeds to purchase two multifamily communities in Denver, two multifamily communities in Minneapolis, originate two multifamily loans, reduce debt, repurchase shares, and reduce preferred shares • Grew portfolio scale in Minneapolis with the purchase of 691 homes and entered the Denver market with the purchase of 664 homes • Reduced total leverage from 58% of gross real estate assets to 41% $564M Total Dispositions $555M Total Redeployment Retail/Other Industrial $17.8M $44.4M Preferred Share Redemption Non-Core Multifamily $15.0M $60.4M Share & Unit Repurchases Denver Multifamily $19.8M $219.3M Multifamily Loans Senior Housing $27.4M $36.9M Medical Office Debt Reduction $404.8M $119.5M Minneapolis Multifamily $153.8M www.iretapartments.com NAREIT REITworld | November 2018 8

MINNEAPOLIS & DENVER VS. OTHER TOP 25 MSAs Targeted geography has strong market fundamentals DENVER 2010-2017 Population CAGR 1.77% Unemployment Rate 3.3% Median Household Income $76,643 Median Home Price $462,900 TWIN CITIES Multifamily % of Housing Stock(1) 26.8% 2010-2017 Population CAGR 1.01% 2014-2017 Rent CAGR 5.38% Unemployment Rate 2.5% 2014-2017 Average Vacancy 4.82% Median Household Income $76,856 Median Home Price $280,200 Multifamily % of Housing Stock(1) 22.9% 2014-2017 Rent CAGR 3.01% 2014-2017 Average Vacancy 3.32% TOP 25 MSAs(2) 2010-2017 Population CAGR 1.19% Unemployment Rate 4.0% Median Household Income $70,005 Median Home Price $375,500 Multifamily % of Housing Stock(1) 24.6% 2014-2017 Rent CAGR 3.79% 2014-2017 Average Vacancy 4.77% Sources: US Census Bureau, Bureau of Labor Statistics, National Association of Realtors, and Axiometrics (1) 5+ units; mobile homes and RVs excluded from total stock (2) Top 25 MSAs defined as 25 highest populated metro areas as of most recent US Census Bureau data Top 25 MSA statistics are averages excluding Denver and Twin Cities www.iretapartments.com NAREIT REITworld | November 2018 9
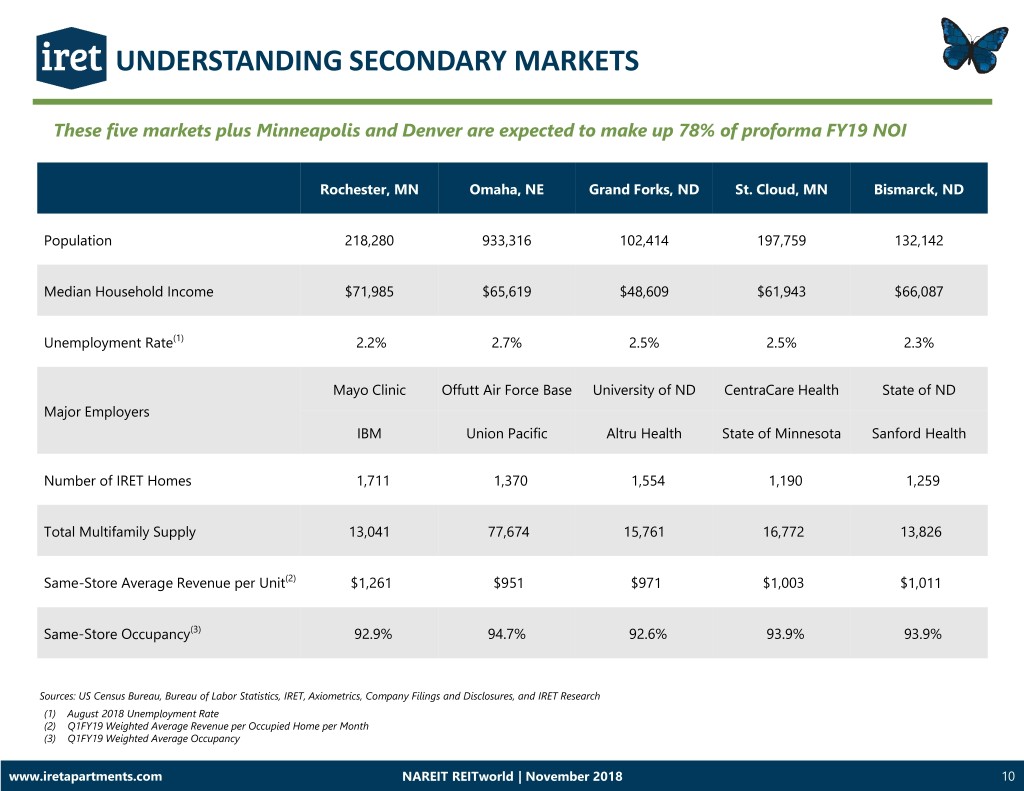
UNDERSTANDING SECONDARY MARKETS These five markets plus Minneapolis and Denver are expected to make up 78% of proforma FY19 NOI Rochester, MN Omaha, NE Grand Forks, ND St. Cloud, MN Bismarck, ND Population 218,280 933,316 102,414 197,759 132,142 Median Household Income $71,985 $65,619 $48,609 $61,943 $66,087 Unemployment Rate(1) 2.2% 2.7% 2.5% 2.5% 2.3% Mayo Clinic Offutt Air Force Base University of ND CentraCare Health State of ND Major Employers IBM Union Pacific Altru Health State of Minnesota Sanford Health Number of IRET Homes 1,711 1,370 1,554 1,190 1,259 Total Multifamily Supply 13,041 77,674 15,761 16,772 13,826 Same-Store Average Revenue per Unit(2) $1,261 $951 $971 $1,003 $1,011 Same-Store Occupancy(3) 92.9% 94.7% 92.6% 93.9% 93.9% Sources: US Census Bureau, Bureau of Labor Statistics, IRET, Axiometrics, Company Filings and Disclosures, and IRET Research (1) August 2018 Unemployment Rate (2) Q1FY19 Weighted Average Revenue per Occupied Home per Month (3) Q1FY19 Weighted Average Occupancy www.iretapartments.com NAREIT REITworld | November 2018 10
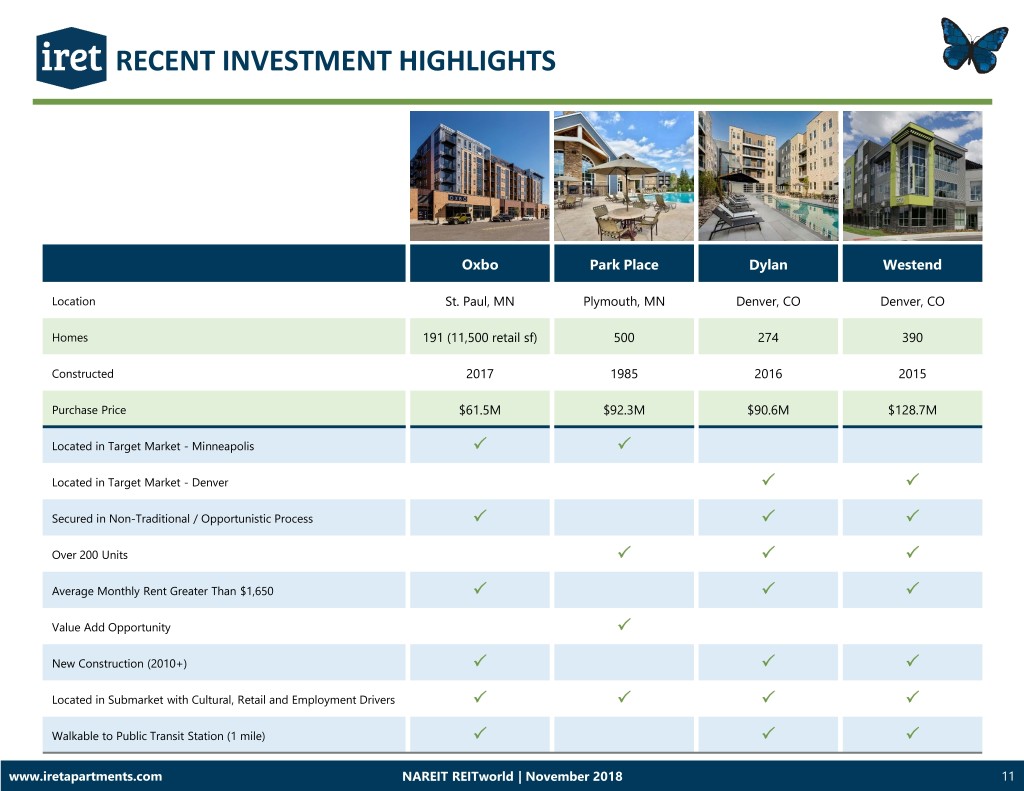
RECENT INVESTMENT HIGHLIGHTS Oxbo Park Place Dylan Westend Location St. Paul, MN Plymouth, MN Denver, CO Denver, CO Homes 191 (11,500 retail sf) 500 274 390 Constructed 2017 1985 2016 2015 Purchase Price $61.5M $92.3M $90.6M $128.7M Located in Target Market - Minneapolis Located in Target Market - Denver Secured in Non-Traditional / Opportunistic Process Over 200 Units Average Monthly Rent Greater Than $1,650 Value Add Opportunity New Construction (2010+) Located in Submarket with Cultural, Retail and Employment Drivers Walkable to Public Transit Station (1 mile) www.iretapartments.com NAREIT REITworld | November 2018 11
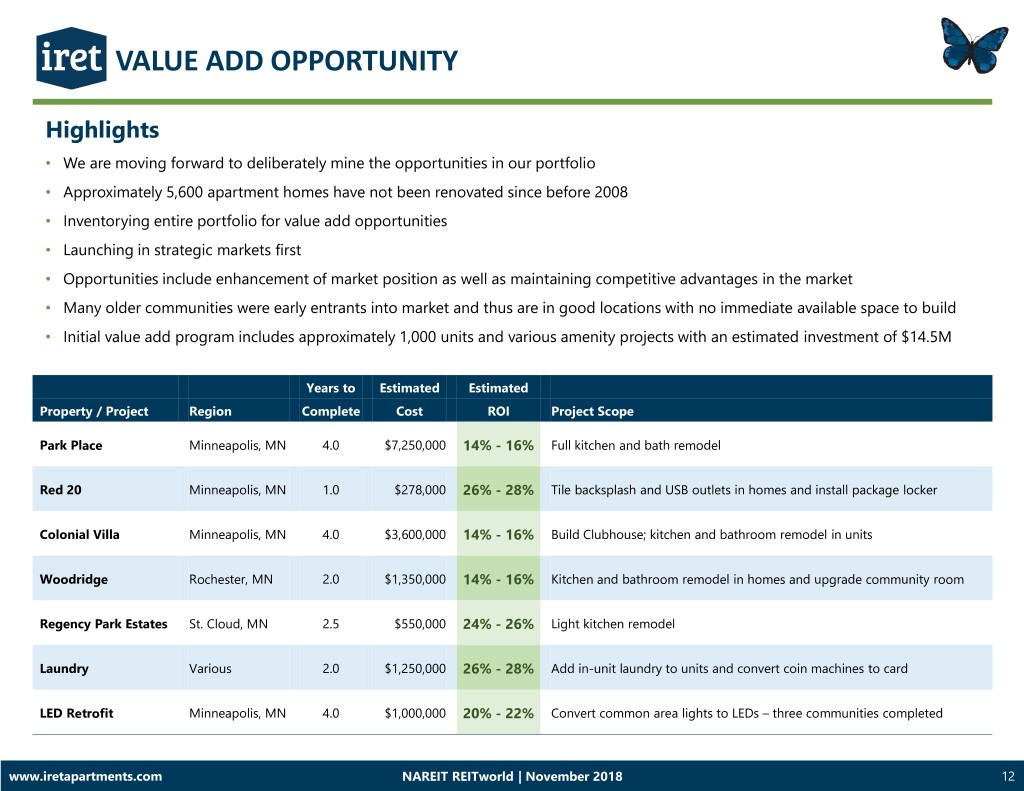
VALUE ADD OPPORTUNITY Highlights • We are moving forward to deliberately mine the opportunities in our portfolio • Approximately 5,600 apartment homes have not been renovated since before 2008 • Inventorying entire portfolio for value add opportunities • Launching in strategic markets first • Opportunities include enhancement of market position as well as maintaining competitive advantages in the market • Many older communities were early entrants into market and thus are in good locations with no immediate available space to build • Initial value add program includes approximately 1,000 units and various amenity projects with an estimated investment of $14.5M Years to Estimated Estimated Property / Project Region Complete Cost ROI Project Scope Park Place Minneapolis, MN 4.0 $7,250,000 14% - 16% Full kitchen and bath remodel Red 20 Minneapolis, MN 1.0 $278,000 26% - 28% Tile backsplash and USB outlets in homes and install package locker Colonial Villa Minneapolis, MN 4.0 $3,600,000 14% - 16% Build Clubhouse; kitchen and bathroom remodel in units Woodridge Rochester, MN 2.0 $1,350,000 14% - 16% Kitchen and bathroom remodel in homes and upgrade community room Regency Park Estates St. Cloud, MN 2.5 $550,000 24% - 26% Light kitchen remodel Laundry Various 2.0 $1,250,000 26% - 28% Add in-unit laundry to units and convert coin machines to card LED Retrofit Minneapolis, MN 4.0 $1,000,000 20% - 22% Convert common area lights to LEDs – three communities completed www.iretapartments.com NAREIT REITworld | November 2018 12

VALUE ADD CASE STUDY – PARK PLACE Opportunity • Redevelop up to 488 homes at Park Place Apartments, a Class B BEFORE multifamily community located in a highly desirable suburb of Minneapolis • Take advantage of significant disparity between current rents and rents on newer, Class A product and other similar vintage properties with recently renovated homes in the submarket Scope • Upgrades include: • New cabinets • New flooring • Quartz countertop • Kitchen tile backsplash • New bathroom vanities and countertops AFTER • Stainless steel appliances • Light fixtures Results Homes to % Cost Achieved Renovate Renovated(1) Complete per Unit Premium(2) ROI 488 67 13.7% $15,952 $233 17.5% (1) Monthly premium on completed and leased units through 10/31/18 www.iretapartments.com NAREIT REITworld | November 2018 13

VALUE ADD CASE STUDY – RED 20 Opportunity • Upgrade 130 homes at Red 20 Apartments, a Class A multifamily BEFORE community located near downtown in the highly desirable Northeast Minneapolis submarket • Take advantage of the gap in rents at newer assets in the immediate vicinity of Red 20, and maintain a competitive advantage Scope • Upgrades include: • Tile backsplashes in the kitchen • USB outlets in the kitchen and all bedrooms AFTER Expected Results Homes to % Est. Cost Expected Est. Renovate Renovated Complete per Unit Premium(1) ROI 130 79 60.8% $1,051 $24 27.4% (1) Work is being completed in occupied units with first completions seeing premium charges in November 2018 rents www.iretapartments.com NAREIT REITworld | November 2018 14

INVESTMENT HIGHLIGHTS Stronger Balance Sheet Operational Enhancements Stronger Markets Value Add Opportunities Best in Class Governance www.iretapartments.com NAREIT REITworld | November 2018 15

Investor Relations Contact: Jon Bishop ir@iret.com 952.401.4827

APPENDIX: MINNEAPOLIS–ST. PAUL IS STRONG Economic Drivers 19 Fortune 500 Companies • The Minneapolis–St. Paul economy is supported by large Rank Company Rank Company corporations in diverse industries that generate stable job 5 United Health Group 216 Land O' Lakes growth. Nineteen Fortune 500 companies and eight 39 Target 252 Ameriprise Financial companies on Forbes’ list of America’s 225 largest private companies, including Cargill at #1, are headquartered in 72 Best Buy 266 Xcel Energy Minnesota. 96 CHS 323 Hormel Foods • Minneapolis–St. Paul’s skilled labor force powers companies 97 3M 343 Thrivent Financial in a mix of industries including agriculture, manufacturing, 122 U.S. Bancorp 382 Mosaic retail, medical devices, biosciences, healthcare, IT, and clean 180 Supervalu 462 Securian Financial energy. 182 General Mills 490 Patterson • Axiometrics forecasts rental growth of 3.6% and vacancy of 3.4% in 2018, which ranks 7 and 2, respectively, among the 193 C.H. Robinson 496 Polaris top 50 multifamily markets. 215 Ecolab Effective Apartment Rent Growth Apartment Vacancy 6% 8% 5.3% 4.9% 7% 5% 4.7% 6% 3.8% 3.8% 3.9% 4% 5% 5.2% 3.3% 3.3% 3.1% 3.1% 3.2% 3.1% 4% 3% 2.6% 2.5% 2.2% 2.3% 3.3% 3% 2% 2% 1% 1% 0% 0% 2011 2012 2013 2014 2015 2016 2017 2018 YTD 2011 2012 2013 2014 2015 2016 2017 2018 YTD Twin Cities National Twin Cities National Sources: Bureau of Labor Statistics, US Census Bureau, Fortune, and Axiometrics Note: 2018 YTD through 6/30/18 www.iretapartments.com NAREIT REITworld | November 2018 17
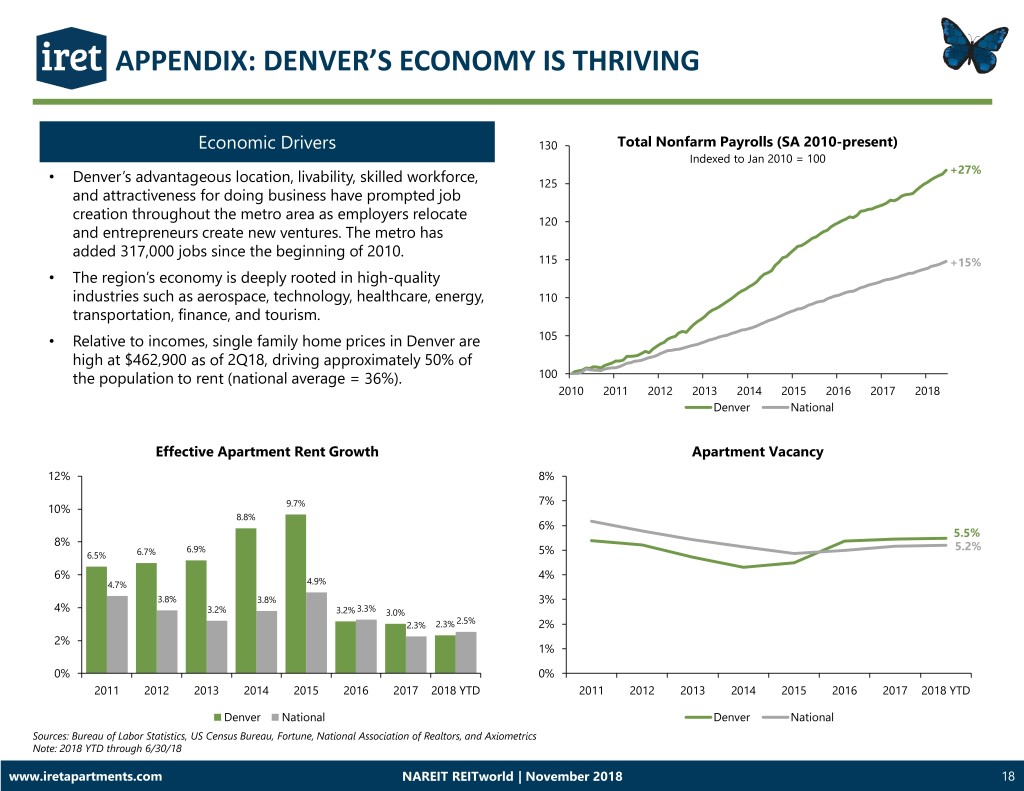
APPENDIX: DENVER’S ECONOMY IS THRIVING Economic Drivers 130 Total Nonfarm Payrolls (SA 2010-present) Indexed to Jan 2010 = 100 +27% • Denver’s advantageous location, livability, skilled workforce, 125 and attractiveness for doing business have prompted job creation throughout the metro area as employers relocate 120 and entrepreneurs create new ventures. The metro has added 317,000 jobs since the beginning of 2010. 115 +15% • The region’s economy is deeply rooted in high-quality industries such as aerospace, technology, healthcare, energy, 110 transportation, finance, and tourism. • Relative to incomes, single family home prices in Denver are 105 high at $462,900 as of 2Q18, driving approximately 50% of the population to rent (national average = 36%). 100 2010 2011 2012 2013 2014 2015 2016 2017 2018 Denver National Effective Apartment Rent Growth Apartment Vacancy 12% 8% 9.7% 7% 10% 8.8% 6% 5.5% 8% 6.9% 5.2% 6.5% 6.7% 5% 6% 4% 4.7% 4.9% 3.8% 3.8% 3% 4% 3.2% 3.2% 3.3% 3.0% 2.5% 2.3% 2.3% 2% 2% 1% 0% 0% 2011 2012 2013 2014 2015 2016 2017 2018 YTD 2011 2012 2013 2014 2015 2016 2017 2018 YTD Denver National Denver National Sources: Bureau of Labor Statistics, US Census Bureau, Fortune, National Association of Realtors, and Axiometrics Note: 2018 YTD through 6/30/18 www.iretapartments.com NAREIT REITworld | November 2018 18

APPENDIX: COMPETITIVE WITH COASTAL MARKETS The Twin Cities and Denver boast extremely tight job markets, characterized by a highly educated workforce % of Adult Population with Bachelor's Degree or Higher Unemployment Rate (1) Washington-Arlington-Alexandria, DC-VA-MD-WV 50.8% 3.5% San Francisco-Oakland-Hayward, CA 49.3% 3.3% 3.3% Boston-Cambridge-Newton, MA-NH 47.6% 2.8% Denver-Aurora-Lakewood, CO 43.9% 2.5% Seattle-Tacoma-Bellevue, WA 41.9% Minneapolis-St. Paul-Bloomington, MN-WI 41.7% Portland-Vancouver-Hillsboro, OR-WA 40.3% New York-Newark-Jersey City, NY-NJ-PA 39.6% Baltimore-Columbia-Towson, MD 39.5% San Diego-Carlsbad, CA 38.8% Atlanta-Sandy Springs-Roswell, GA 37.9% Twin Cities, MN MSA San Francisco,CA MSA Denver, CO MSA Washington DC MSA Boston, MA MSA Both of these characteristics support strong incomes Rank Metropolitan Area Median Household Income 1 San Francisco-Oakland-Hayward, CA MSA $101,714 2 Washington-Arlington-Alexandria, DC-VA-MD-WV MSA $99,669 3 Boston-Cambridge-Newton, MA-NH MSA $85,691 4 Seattle-Tacoma-Bellevue, WA MSA $82,133 5 Baltimore-Columbia-Towson, MD MSA $77,394 6 Minneapolis-St. Paul-Bloomington, MN-WI MSA $76,856 7 Denver-Aurora-Lakewood, CO MSA $76,643 8 San Diego-Carlsbad, CA $76,207 9 New York-Newark-Jersey City, NY-NJ-PA $75,368 10 Portland-Vancouver-Hillsboro, OR-WA $71,931 Sources: US Census Bureau and Bureau of Labor Statistics (1) August 2018 Unemployment Rate www.iretapartments.com NAREIT REITworld | November 2018 19

APPENDIX: RECENT INVESTMENTS – OXBO New construction acquired off-market at 44% leased occupancy and 27% physical occupancy IRET EDGE: • IRET initiated dialogue based on relationship with developer and equity partner • Ability to acquire in midstream lease-up outside of a process • Understanding and belief in West 7th Street submarket dynamics, drivers, growth and desirability • Understanding of St. Paul as underserved Twin Cities market and identification of investment as top three multifamily community in this market INVESTMENT STRENGTHS: • Located one-half block from Xcel Energy Center – home of Minnesota Wild (NHL) and dozens of large name arena concerts per year • Sits on West 7th Street, a vibrant stretch of restaurants, bars and hotels and is Location: St. Paul, MN “ground zero” for many city events throughout the year including St. Patrick’s Day (175,000 people), Red Bull Crashed Ice (150,000 people) and Minnesota Constructed: 2017 High School Hockey Tournament (100,000 people) • Homes: 191 (11,500 retail sf) Located one-half block from St. Paul RiverCentre, 0.3 miles from Science Museum of Minnesota, 0.4 miles from Mississippi River riverfront and trail system, 0.5 miles from a city park and is walkable to St. Paul CBD employers Purchase Price: $61.5M (U.S. Bank, Wells Fargo, UBS, Travelers, Ecolob, Infor, Securian Financial) and three large hospitals Profile: Mid-rise Urban Core Mobility Score: 89; excellent mobility Walk Score: 90; walker’s paradise www.iretapartments.com NAREIT REITworld | November 2018 20
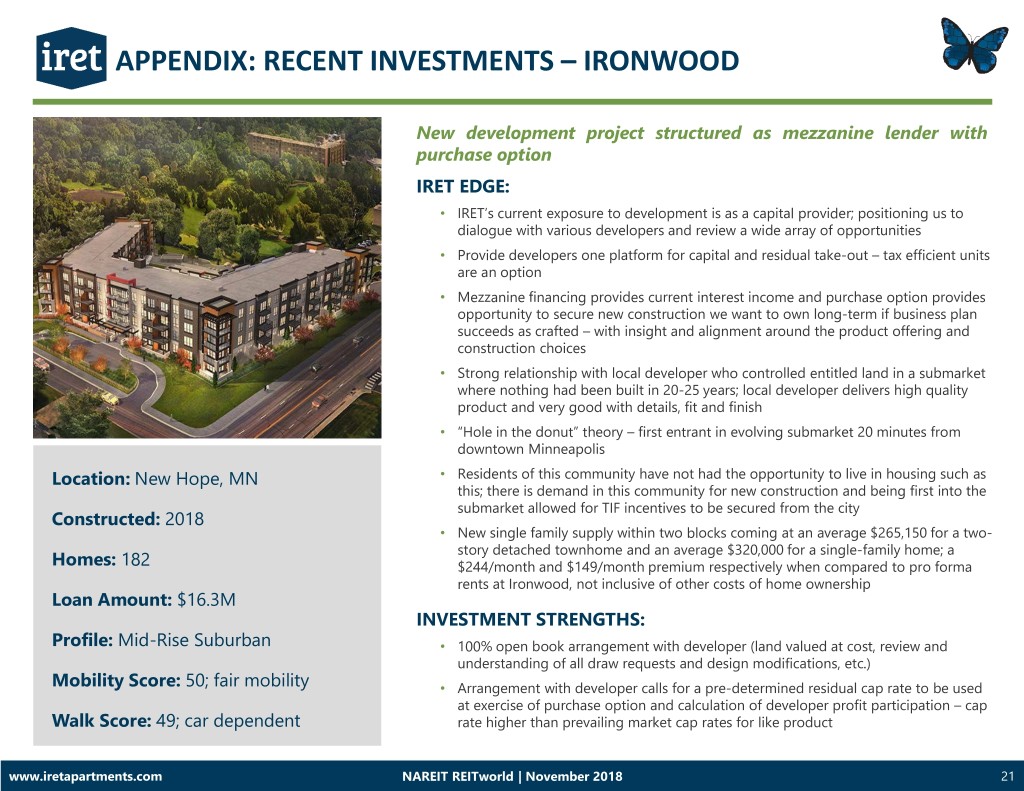
APPENDIX: RECENT INVESTMENTS – IRONWOOD New development project structured as mezzanine lender with purchase option IRET EDGE: • IRET’s current exposure to development is as a capital provider; positioning us to dialogue with various developers and review a wide array of opportunities • Provide developers one platform for capital and residual take-out – tax efficient units are an option • Mezzanine financing provides current interest income and purchase option provides opportunity to secure new construction we want to own long-term if business plan succeeds as crafted – with insight and alignment around the product offering and construction choices • Strong relationship with local developer who controlled entitled land in a submarket where nothing had been built in 20-25 years; local developer delivers high quality product and very good with details, fit and finish • “Hole in the donut” theory – first entrant in evolving submarket 20 minutes from downtown Minneapolis Location: New Hope, MN • Residents of this community have not had the opportunity to live in housing such as this; there is demand in this community for new construction and being first into the submarket allowed for TIF incentives to be secured from the city Constructed: 2018 • New single family supply within two blocks coming at an average $265,150 for a two- story detached townhome and an average $320,000 for a single-family home; a Homes: 182 $244/month and $149/month premium respectively when compared to pro forma rents at Ironwood, not inclusive of other costs of home ownership Loan Amount: $16.3M INVESTMENT STRENGTHS: Profile: Mid-Rise Suburban • 100% open book arrangement with developer (land valued at cost, review and understanding of all draw requests and design modifications, etc.) Mobility Score: 50; fair mobility • Arrangement with developer calls for a pre-determined residual cap rate to be used at exercise of purchase option and calculation of developer profit participation – cap Walk Score: 49; car dependent rate higher than prevailing market cap rates for like product www.iretapartments.com NAREIT REITworld | November 2018 21

APPENDIX: RECENT INVESTMENTS – PARK PLACE Class B, value-add project in a well-developed and highly desirable inner ring suburb of Twin Cities IRET EDGE: • Community was sold as part of a fully-marketed offering (only IRET purchase in past 18 months as part of a fully-marketed offering) • Larger deal size positioned IRET well as an all cash buyer who could move with speed and surety • Understanding and belief of Plymouth, MN submarket dynamics, drivers and desirability • Understanding of property’s operational requirements via IRET personnel’s historical experience with the asset (SVP of Asset Management and Operations Support had directly been involved with Park Place operations and transaction diligence since 2010) INVESTMENT STRENGTHS: Location: Plymouth, MN • Located in a top tier inner ring Twin Cities suburb • Strong incomes, proximity to major employers, an adjacent park, significant Constructed: 1985 shopping and entertainment • Quick and easy access to major freeway and located in highly sought after Homes: 500 Wayzata School District • Opportunity to implement value-add unit renovation program Purchase Price: $92.3M • Large piece of land (32 acres) close to Plymouth central infrastructure that may Profile: Garden Style Suburban have redevelopment opportunity over long-term Mobility Score: 42; fair mobility Walk Score: 44; car dependent www.iretapartments.com NAREIT REITworld | November 2018 22
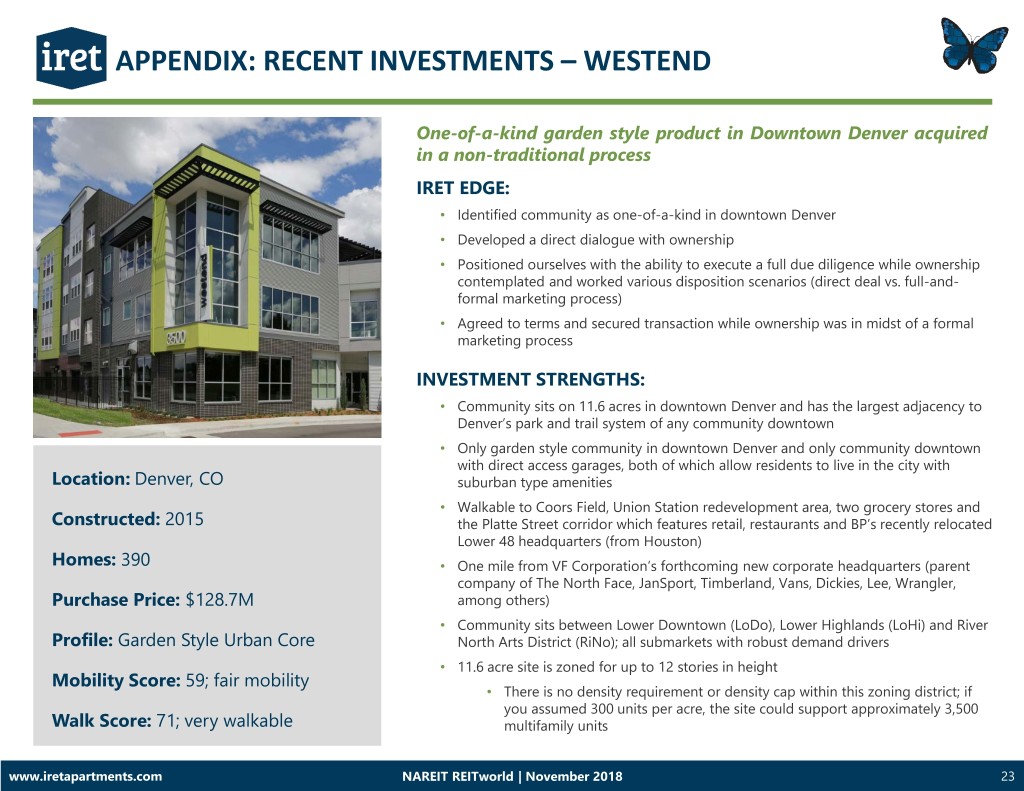
APPENDIX: RECENT INVESTMENTS – WESTEND One-of-a-kind garden style product in Downtown Denver acquired in a non-traditional process IRET EDGE: • Identified community as one-of-a-kind in downtown Denver • Developed a direct dialogue with ownership • Positioned ourselves with the ability to execute a full due diligence while ownership contemplated and worked various disposition scenarios (direct deal vs. full-and- formal marketing process) • Agreed to terms and secured transaction while ownership was in midst of a formal marketing process INVESTMENT STRENGTHS: • Community sits on 11.6 acres in downtown Denver and has the largest adjacency to Denver’s park and trail system of any community downtown • Only garden style community in downtown Denver and only community downtown with direct access garages, both of which allow residents to live in the city with Location: Denver, CO suburban type amenities • Walkable to Coors Field, Union Station redevelopment area, two grocery stores and Constructed: 2015 the Platte Street corridor which features retail, restaurants and BP’s recently relocated Lower 48 headquarters (from Houston) Homes: 390 • One mile from VF Corporation’s forthcoming new corporate headquarters (parent company of The North Face, JanSport, Timberland, Vans, Dickies, Lee, Wrangler, Purchase Price: $128.7M among others) • Community sits between Lower Downtown (LoDo), Lower Highlands (LoHi) and River Profile: Garden Style Urban Core North Arts District (RiNo); all submarkets with robust demand drivers • 11.6 acre site is zoned for up to 12 stories in height Mobility Score: 59; fair mobility • There is no density requirement or density cap within this zoning district; if you assumed 300 units per acre, the site could support approximately 3,500 Walk Score: 71; very walkable multifamily units www.iretapartments.com NAREIT REITworld | November 2018 23

APPENDIX: RECENT INVESTMENTS – DYLAN New construction acquired in limited, non-traditional marketing process at 79% occupancy IRET EDGE: • Developer, equity partner and brokerage advisor identified four potential preferred buyers in a targeted sale approach • Spent time with developer discussing investment strategies and touring their portfolio; developer advised their equity partner we should be included in the sale process for Dylan • Moved thoroughly and swiftly in analysis and conveying of interest • Given time spent in Denver and submarket diligence, we had identified the River North Arts District (RiNo) submarket as an evolving submarket with long- term demand drivers; an opportunity for long-term value creation in entering the submarket early INVESTMENT STRENGTHS: Location: Denver, CO • Submarket is located one mile north of Denver CBD in an area that was an industrial warehouse, manufacturing and railyard district 15 years ago Constructed: 2016 • RiNo features historical industrial uses, but has transformed greatly into a vibrant and innovative district with a heavy focus on arts, culinary and brewery Homes: 274 establishments, music venues, working studios and 38th and Blake light rail transit station Purchase Price: $90.6M • Has been noted as a top emerging U.S. neighborhood in multiple publications Profile: Mid-rise Urban Core • Transformation of RiNo has attracted robust office, retail, hotel and multifamily Mobility Score: 66; good mobility development Walk Score: 54; somewhat walkable www.iretapartments.com NAREIT REITworld | November 2018 24

APPENDIX: RECENT INVESTMENTS – DYLAN (CONT.) INVESTMENT THESIS • High-end unit finishes not replicated by RiNo competitive set – gas ranges, wine fridges, artistic design and details • Early entry in an area where valuation is increasing: • 4.6 acre site adjacent to Dylan purchased for $30M ($150 psf); programmed for 403 units and 11,000 sf of retail for a multifamily land basis of $74,000 per unit not accounting for retail adjustment • Applying the same $150 psf land value to Dylan land site ($19.6M land valuation) implies a $259,000 per unit purchase price on the real estate • Prior to our investment, 2.44 acre site purchased for $15M ($141 psf); constructing 232 units and 3,500 sf of retail for a multifamily land basis of $64,000 per unit not accounting for retail adjustment • RiNo is at the forefront of new development in Denver: • Office – 985,000 sf recently completed; 1,312,000 sf under construction; 1,354,000 sf proposed • Retail – 189,000 sf recently completed; 156,000 sf under construction; 295,000 sf proposed Location: Denver, CO • Hotel – 370 rooms recently completed or under construction; 435 rooms proposed Constructed: 2016 • Other large-scale mixed-use development projects in the submarket include: • 250-acre National Western Campus development Homes: 274 • 13-acre Denargo Market development Purchase Price: $90.6M • One-mile Platte River promenade redevelopment (adjacent to Dylan) • 3,950 capacity state-of-the-art music venue by AEG as part of a broader Profile: Mid-rise Urban Core 14-acre mixed-use development with office, retail, and hotel • We like our position within RiNo as we sit directly in the middle of the submarket, Mobility Score: 66; good mobility closer to the current and proposed office, retail and entertainment destinations • Many existing multifamily competitors sit to the south of Dylan, closer to the southern Walk Score: 54; somewhat walkable border of RiNo and, in some cases, closer to the Ballpark District than the social and cultural drivers of RiNo www.iretapartments.com NAREIT REITworld | November 2018 25
