Attached files
| file | filename |
|---|---|
| EX-32.2 - EXHIBIT 32.2 - CENTERSPACE | iret4301810kex322.htm |
| EX-32.1 - EXHIBIT 32.1 - CENTERSPACE | iret4301810kex321.htm |
| EX-31.2 - EXHIBIT 31.2 - CENTERSPACE | iret4301810kex312.htm |
| EX-31.1 - EXHIBIT 31.1 - CENTERSPACE | iret4301810kex311.htm |
| EX-23.1 - EXHIBIT 23.1 - CENTERSPACE | iret4301810kex231.htm |
| EX-21.1 - EXHIBIT 21.1 - CENTERSPACE | iret4301810kex211.htm |
| EX-12.1 - EXHIBIT 12.1 - CENTERSPACE | iret4301810kex121.htm |
UNITED STATES
SECURITIES AND EXCHANGE COMMISSION
Washington, D.C. 20549
FORM 10-K
☑ANNUAL REPORT PURSUANT TO SECTION 13 OR 15(d) OF THE SECURITIES EXCHANGE ACT OF 1934
For the fiscal year ended April 30, 2018
or
☐TRANSITION REPORT PURSUANT TO SECTION 13 OR 15(d) OF THE SECURITIES EXCHANGE ACT OF 1934
For the transition period from ____________ to ____________
Commission File Number 001-35624
INVESTORS REAL ESTATE TRUST
(Exact name of Registrant as specified in its charter)
North Dakota | 45-0311232 |
(State or other jurisdiction of incorporation or organization) | (IRS Employer Identification No.) |
1400 31st Avenue SW, Suite 60 | |
Post Office Box 1988 | |
Minot, ND 58702-1988 | |
(Address of principal executive offices) (Zip code) | |
701-837-4738
(Registrant’s telephone number, including area code)
Securities registered pursuant to Section 12(b) of the Act:
Common Shares of Beneficial Interest (no par value) - New York Stock Exchange
6.625% Series C Cumulative Redeemable Preferred Shares of Beneficial Interest (no par value) -
New York Stock Exchange
Securities registered pursuant to Section 12(g) of the Act:
None
Indicate by check mark if the Registrant is a well-known seasoned issuer, as defined in Rule 405 of the Securities Act.
þ Yes ¨ No
Indicate by check mark if the Registrant is not required to file reports pursuant to Section 13 or Section 15(d) of the Exchange Act.
¨ Yes þ No
Indicate by check mark whether the Registrant: (1) has filed all reports required to be filed by Section 13 or 15(d) of the Securities Exchange Act of 1934 during the preceding 12 months (or for such shorter period that the Registrant was required to file such reports), and (2) has been subject to such filing requirements for the past 90 days.
þ Yes ¨ No
Indicate by checkmark whether the Registrant has submitted electronically and posted on its corporate Website, if any, every Interactive Data File required to be submitted and posted pursuant to Rule 405 of Regulation S-T (§229.405 of this chapter) during the preceding 12 months (or for such shorter period that the Registrant was required to submit and post such files).
þ Yes ¨ No
Indicate by check mark if disclosure of delinquent filers pursuant to Item 405 of Regulation S-K is not contained herein, and will not be contained, to the best of Registrant’s knowledge, in definitive proxy or information statements incorporated by reference in Part III of this Form 10-K or any amendment to this Form 10-K.
¨ Yes þ No
Indicate by check mark whether the Registrant is a large accelerated filer, an accelerated filer, a non-accelerated filer, or a smaller reporting company. See the definitions of “large accelerated filer,” “accelerated filer,” “smaller reporting company” and “emerging growth company” in Rule 12b-2 of the Exchange Act.
þ Large accelerated filer | ¨ Accelerated filer | ¨ Emerging growth company | ||
¨ Non-accelerated filer | ¨ Smaller reporting company | |||
If an emerging growth company, indicate by check mark if the Registrant has elected not to use the extended transition period for complying with any new or revised financial accounting standards provided pursuant to Section 13(a) of the Exchange Act. ☐
Indicate by check mark whether the Registrant is a shell company (as defined in Rule 12b-2 of the Exchange Act).
¨ Yes þ No
The aggregate market value of the Registrant’s outstanding common shares of beneficial interest held by non-affiliates of the Registrant as of October 31, 2017 was 695,861,225 based on the last reported sale price on the New York Stock Exchange on October 31, 2017. For purposes of this calculation, the Registrant has assumed that its trustees and executive officers are affiliates.
The number of common shares of beneficial interest outstanding as of June 20, 2018, was 119,406,963.
References in this Annual Report on Form 10-K to the “Company,” “IRET,” “we,” “us,” or “our” include consolidated subsidiaries, unless the context indicates otherwise.
Documents Incorporated by Reference: Portions of IRET’s definitive Proxy Statement for its 2018 Annual Meeting of Shareholders to be held on September 18, 2018 are incorporated by reference into Part III (Items 10, 11, 12, 13 and 14) hereof.
INVESTORS REAL ESTATE TRUST
INDEX
PAGE | ||
PART I | ||
Item 1. | Business | |
Item 1A. | Risk Factors | |
Item 1B. | Unresolved Staff Comments | |
Item 2. | Properties | |
Item 3. | Legal Proceedings | |
Item 4. | Mine Safety Disclosures | |
PART II | ||
Item 5. | Market for Registrant’s Common Equity, Related Stockholder Matters and Issuer Purchases of Equity Securities | |
Item 6. | Selected Financial Data | |
Item 7. | Management’s Discussion and Analysis of Financial Condition and Results of Operations | |
Item 7A. | Quantitative and Qualitative Disclosures about Market Risk | |
Item 8. | Financial Statements and Supplementary Data | |
Item 9. | Changes in and Disagreements with Accountants on Accounting and Financial Disclosure | |
Item 9A. | Controls and Procedures | |
Item 9B. | Other Information | |
PART III | ||
Item 10. | Trustees, Executive Officers and Corporate Governance | |
Item 11. | Executive Compensation | |
Item 12. | Security Ownership of Certain Beneficial Owners and Management and Related Stockholder Matters | |
Item 13. | Certain Relationships and Related Transactions, and Trustee Independence | |
Item 14. | Principal Accountant Fees and Services | |
PART IV | ||
Item 15. | Exhibits, Financial Statement Schedules | |
Exhibit Index | ||
Signatures | ||
Reports of Independent Registered Public Accounting Firm and Financial Statements | ||
1
Special Note Regarding Forward-Looking Statements
Certain statements included in this Annual Report on Form 10-K and the documents incorporated into this document by reference are “forward-looking statements” within the meaning of Section 27A of the Securities Act of 1933, as amended (the “Securities Act”), and Section 21E of the Securities Exchange Act of 1934, as amended (the “Exchange Act”). Such forward-looking statements include statements about our plans and objectives, including our future financial condition, anticipated capital expenditures, anticipated distributions, and our belief that we have the liquidity and capital resources necessary to meet our known obligations and to make additional real estate acquisitions and capital improvements when appropriate to enhance long-term growth. Forward-looking statements are typically identified by the use of terms such as “expects,” “anticipates,” “intends,” “plans,” “believes,” “seeks,” “estimates,” and variations of those words and similar expressions. These forward-looking statements involve known and unknown risks, uncertainties, and other factors that may cause the actual results, performance, or achievements to be materially different from the results of operations, financial conditions, or plans expressed or implied by the forward-looking statements. Although we believe the expectations reflected in our forward-looking statements are based upon reasonable assumptions, we can give no assurance that our expectations will be achieved. Any statements contained herein that are not statements of historical fact should be deemed forward-looking statements. As a result, reliance should not be placed on these forward-looking statements, as these statements are subject to known and unknown risks, uncertainties, and other factors beyond our control and could differ materially from our actual results and performance.
The following factors, among others, could cause our future results to differ materially from those expressed in the forward-looking statements:
• | economic conditions in the markets where we own properties or markets in which we may invest in the future; |
• | rental conditions in our markets, including occupancy levels and rental rates, our potential inability to renew tenants or obtain new tenants upon expiration of existing leases, changes in tax and housing laws, or other factors; |
• | adverse changes in real estate markets, including future demand for apartment homes in our significant markets, barriers of entry into new markets, limitations on our ability to increase rental rates, our ability to identify and consummate acquisitions and dispositions on favorable terms, our ability to reinvest sales proceeds successfully, and our ability to accommodate any significant decline in the market value of real estate serving as collateral for our mortgage obligations; |
• | inability to succeed in any new markets we may enter; |
• | failure of new acquisitions to achieve anticipated results or be efficiently integrated; |
• | inability to complete lease-up of our projects on schedule and on budget; |
• | inability to sell our non-core properties on terms that are acceptable; |
• | failure to reinvest proceeds from sales of properties into tax-deferred exchanges, which could necessitate special dividend and tax protection payments; |
• | inability to fund capital expenditures out of cash flow; |
• | inability to pay, or need to reduce, dividends on our common shares; |
• | financing risks, including our potential inability to obtain debt or equity financing on favorable terms, or at all; |
• | level and volatility of interest or capitalization rates or capital market conditions; |
• | changes in operating costs, including real estate taxes, utilities, and insurance costs; |
• | the availability and cost of casualty insurance for losses; |
• | inability to continue to satisfy complex rules in order to maintain our status as a REIT for federal income tax purposes, inability of the Operating Partnership to satisfy the rules to maintain its status as a partnership for federal income tax purposes, and the risk of changes in laws affecting REITs; |
• | inability to attract and retain qualified personnel; |
• | cyber liability or potential liability for breaches of our privacy or information security systems; |
• | inability to comply with environmental laws and regulations; and |
• | other risks identified in this Report, in other SEC reports, or in other documents that we publicly disseminate. |
Readers should carefully review our financial statements and the notes thereto, as well as the section entitled “Risk Factors” in Item 1A of this Annual Report on Form 10-K and the other documents we file from time to time with the Securities and Exchange Commission (“SEC”).
In light of these uncertainties, the events anticipated by our forward-looking statements might not occur. We undertake no obligation to update or revise any forward-looking statements, whether as a result of new information, future events or otherwise. The foregoing review of factors that could cause our actual results to differ materially from those contemplated in any forward-looking statements included in this Annual Report on Form 10-K should not be construed as exhaustive.
2
PART I
Item 1. Business
OVERVIEW
Investors Real Estate Trust (“we,” “us,” “IRET” or the “Company”) is a real estate investment trust (“REIT”) organized under the laws of North Dakota, that is focused on the ownership, management, acquisition, development, and redevelopment of apartment communities. Over the past several years, we have extensively repositioned our portfolio from a diversified, multi-segment collection of properties into a single segment focused on apartment communities. During the fiscal year ended April 30, 2018, we substantially completed this transformation by selling 50 commercial and other non-core multifamily properties for an aggregate sales price of $515.1 million. We used a portion of the proceeds from these sales to purchase four apartment communities with 1,355 homes for $373.1 million. Our current focus is on making operational enhancements that will improve our residents' experience, redeveloping some of our existing apartment communities to meet current market demands, and acquiring new apartment communities in the Minneapolis/St. Paul and Denver metropolitan areas.
We focus on investing in markets characterized by stable and growing economic conditions, strong employment, and an attractive quality of life that we believe, in combination, lead to higher demand for our apartment homes and retention of our residents. As of April 30, 2018, we owned interests in 90 multifamily communities, containing 14,176 apartment homes and having a total real estate investment amount, net of accumulated depreciation, of $1.3 billion. Our corporate headquarters is located in Minot, North Dakota. We also have corporate offices in Minneapolis and St. Cloud, Minnesota, and additional property management offices located in the states where we own properties.
STRUCTURE
We were organized under the laws of North Dakota on July 31, 1970, and have operated as a REIT under Sections 856-858 of the Internal Revenue Code since our formation. On February 1, 1997, we were restructured as an Umbrella Partnership Real Estate Investment Trust, or UPREIT, and we conduct our daily business operations primarily through our operating partnership, IRET Properties, a North Dakota Limited Partnership (“IRET Properties” or the “Operating Partnership”). The sole general partner of IRET Properties is IRET, Inc., a North Dakota corporation and our wholly owned subsidiary. All of our assets (except for qualified REIT subsidiaries) and liabilities were contributed to IRET Properties, through IRET, Inc., in exchange for the sole general partnership interest in IRET Properties. IRET Properties holds substantially all of the assets of the Company. IRET Properties conducts the operations of the business and is structured as a partnership with no publicly traded equity. Contributions of properties to the Company can be structured as tax-deferred transactions through the issuance of Operating Partnership limited partnership units (“OP Units”), which is one of the reasons the Company is structured in this manner. As of April 30, 2018, IRET, Inc. owned an 89.4% interest in IRET Properties. The remaining interest in IRET Properties is held by individual limited partners.
BUSINESS STRATEGIES
Our business depends on successful investment in property acquisition and development in key geographic markets as well as effective management of those properties. The following is a discussion of our business strategies with respect to real estate investment and management.
Investment Strategy
Our business objective under our current strategic plan is to increase shareholder value by employing a disciplined investment strategy that includes the following elements:
• | Investing in income-producing apartment communities in key geographic markets with populations ranking in the top 25 of metropolitan statistical areas, including expansion in the Minneapolis and Denver markets; |
• | Selecting markets with favorable market characteristics, including occupancy rates, supply pipeline, rent growth, income growth and employment forecasts; |
• | Focusing on our Midwest-centered portfolio that seeks to take advantage of our heightened market knowledge and regional experience; |
• | Building a strong market presence in new markets but limiting over-exposure to any given market; and |
• | Deemphasizing our exposure to tertiary markets. |
3
Operations Strategy
We manage our apartment communities by focusing on activities that should capitalize on market rental growth, tenant satisfaction and retention, and long-term asset appreciation. We intend to achieve these goals by utilizing the following strategies:
• | Overseeing the quality and financial performance of our multifamily portfolio; |
• | Focusing on rigorous asset management in order to maximize value from new acquisitions and create value within the existing portfolio; |
• | Building and maintaining in-house expertise, including acquisitions and dispositions of apartment communities and redevelopment projects for existing apartment communities to improve the financial and physical aspects of these properties; |
• | Developing and maintaining strong internal systems and reporting mechanisms and using technology to unlock value within our portfolio; and |
• | Maintaining strong, vibrant apartment communities that maximize resident satisfaction. |
We believe that providing quality apartment communities, maximizing rent collections and rates as market conditions allow, maintaining property occupancy at optimal levels, and controlling operating costs will help us maximize our financial results and enhance resident satisfaction.
FINANCING AND DISTRIBUTIONS
To fund our investment and capital activities, we rely on a combination of issuance of senior securities, borrowed funds, and offering securities in exchange for property. We regularly issue dividends to our shareholders. Each of these is described below.
Issuance of Senior Securities
On August 7, 2012, we issued 4,600,000 shares of 7.95% Series B Cumulative Redeemable Preferred Shares of Beneficial Interest (the “Series B preferred shares”), and on October 2, 2017, we issued 4,118,460 shares of 6.625% Series C Cumulative Redeemable Preferred Shares of Beneficial Interest (the "Series C preferred shares"). All of the outstanding Series B preferred shares were redeemed on October 30, 2017. Depending on future interest rates and market conditions, we may issue additional preferred shares or other senior securities which would have dividend and liquidation preference over our common shares.
Bank Financing and Other Debt
As of April 30, 2018, we owned 99 properties, of which 58 properties served as collateral for mortgage loans and 41 properties were unencumbered by mortgages. Of the 58 properties that served as collateral for mortgage loans, the majority of these mortgages payable were non-recourse to us other than for standard carve-out obligations. Our primary unsecured credit facility is a revolving, multi-bank line of credit, with borrowing capacity based on the value of properties contained in the unencumbered asset pool. This credit facility matures on January 31, 2021, with one 12-month option to extend the maturity date at our election. In December 2017, we also entered into a $70.0 million unsecured term loan, which matures on January 31, 2023. In addition, we increased the credit capacity of our revolving line of credit from $250.0 million to $300.0 million, and maintain a $200.0 million accordion option that can be accessed by increasing lending commitments under the current agreement. In addition to this credit capacity, in March 2018, we entered into a $6.0 million operating line of credit, which is designed to enhance treasury management activities and more effectively manage cash balances. As of April 30, 2018, our ratio of total indebtedness to total real estate investments was 41.7%.
Issuance of Securities in Exchange for Property
Our organizational structure allows us to issue shares and limited partnership units (or OP Units) of IRET Properties in exchange for real estate. The OP Units generally are redeemable, at the option of the holder, for cash, or, at our option, common shares on a one-for-one basis. Generally, limited partnership units receive the same per unit cash distributions as the per share dividends paid on common shares
Our Declaration of Trust, as amended (our “Declaration of Trust”), does not contain any restrictions on our ability to offer limited partnership units of IRET Properties in exchange for property. As a result, any decision to do so is vested solely in our Board of Trustees. For the three most recent fiscal years ended April 30, we have issued the following limited partnership units of IRET Properties in exchange for properties:
4
(in thousands) | ||||||||||
2018 | 2017 | 2016 | ||||||||
Limited partnership units issued | — | — | 2,559 | |||||||
Value at issuance, net of issue costs | $ | — | $ | — | $ | 18,226 | ||||
Acquiring or Repurchasing Shares and Units
It is our intention to invest only in real estate assets. Our Declaration of Trust does not prohibit the acquisition or repurchase of our common or preferred shares or other securities so long as such activity does not prohibit us from operating as a REIT under the Internal Revenue Code.
During fiscal year 2018, our Board of Trustees reauthorized a share repurchase program of up to $50.0 million worth of our common shares, under which we repurchased approximately 1.8 million common shares on the open market at an average price of $5.58 per share during fiscal year 2018. Subsequent to April 30, 2018, we repurchased approximately 118,000 common shares at an average price of $5.18 per share through June 20, 2018.
During fiscal year 2018, we redeemed all of our outstanding Preferred B Shares for an aggregate redemption price of $115.0 million. Such shares were redeemed on October 30, 2017, and were delisted from trading on the NYSE. During fiscal year 2018, we redeemed for cash approximately 1.5 million units held by limited partners at an average price of $5.89 per unit.
Distributions to Shareholders
Distributions to shareholders and holders of limited partnership units. The Internal Revenue Code requires a REIT to distribute 90% of its net taxable income, excluding net capital gains, to its shareholders, and a separate requirement to distribute net capital gains or pay a corporate level tax in lieu thereof. We have distributed, and intend to continue to distribute, enough of our taxable income to satisfy these requirements. Our general practice has been to make cash distributions to our common shareholders and the holders of limited partnership units of approximately 65% to 90% of our funds from operations and to use the remaining funds for capital improvements or the purchase of additional properties. Distributions to our common shareholders and unitholders in fiscal years 2018 and 2017 totaled approximately 104% and 115%, respectively, on a per share and unit basis of our funds from operations.
For additional information on our sources of liquidity and funds from operations, see Item 7, "Management's Discussion and Analysis of Financial Condition and Results of Operations -- Liquidity and Capital Resources."
Employees
As of April 30, 2018, we had 527 employees, of which 472 were full-time and 55 were part-time.
ENVIRONMENTAL MATTERS
See the discussion under the caption "Risks Related to Real Estate Investments and Our Operations -- The Company's portfolio may have environmental liabilities" in Item 1A, Risk Factors, for information concerning the potential effects of environmental matters on our business, which discussion under "The Company's portfolio may have environmental liabilities" is incorporated by reference into this Item 1.
INSURANCE
We purchase general liability and property insurance coverage for each of our properties. We also purchase limited terrorism, environmental and flood insurance as well as other types of insurance coverage related to a variety of risks and exposures. There are certain types of losses that may not be covered or could exceed coverage limits. Our insurance policies are also subject to deductibles and coverage limits. Although we believe that we have adequate insurance coverage on our properties, we may incur losses, which could be material, due to uninsured risks, deductibles and/or losses in excess of coverage limits, any of which could have a material adverse effect on our business.
5
COMPETITION
There are numerous housing alternatives that compete with our apartment communities in attracting residents. Our apartment communities compete directly with other apartment communities, condominiums, and single-family homes in the areas in which our properties are located. If the demand for our apartment communities is reduced or competitors develop or acquire competing housing, rental and occupancy rates may decrease, which could have a material adverse effect on our business. Additionally, we compete with other real estate investors, including other REITs, businesses, and other entities to acquire properties. This competition affects our ability to acquire properties we want to add to our portfolio and the price we pay for acquisitions.
Website and Available Information
Our internet address is www.iretapartments.com. We make available, free of charge, through the “SEC filings” tab under the Investors section of our website, our annual reports on Form 10-K, quarterly reports on Form 10-Q, current reports on Form 8-K, and amendments to such reports, and proxy statement for our Annual Meeting of Shareholders, filed or furnished pursuant to Section 13(a) or 15(d) of the Exchange Act as soon as reasonably practicable after such reports are filed with or furnished to the SEC. We also file press releases, investor presentations, and certain supplemental information on our website. Current copies of our Code of Conduct; Code of Ethics for Senior Financial Officers; and Charters for the Audit, Compensation, Executive and Nominating and Governance Committees of our Board of Trustees are also available on our website under the “Corporate Governance” tab under the Investors section of our website. Copies of these documents are also available free of charge to shareholders upon request addressed to the Secretary at Investors Real Estate Trust, P.O. Box 1988, Minot, North Dakota 58702-1988. Information on our website does not constitute part of this Annual Report on Form 10-K.
Item 1A. Risk Factors
Risks Related to Our Properties and Operations
We face certain risks related to our ownership of apartment communities and operation of our business. Set forth below are the risks that we believe are material to IRET’s shareholders and unitholders. You should carefully consider the following risks in evaluating our properties, business, and operations. Our business, financial condition, cash flows, results of operations, value of our real estate assets and/or the value of an investment in our stock or units are subject to various risks and uncertainties, including those set forth below, any of which could cause our actual operating results to vary materially from our recent results or from our anticipated future results.
Our financial performance is subject to risks associated with the real estate industry and ownership of apartment communities. Our financial performance risks include, but are not limited to, the following:
• | downturns in national, regional, and local economic conditions (particularly increases in unemployment); |
• | competition from other apartment communities; |
• | local real estate market conditions, including an oversupply of apartments or other housing, or a reduction in demand for apartment communities; |
• | the attractiveness of our apartment communities to tenants as well as tenants' perceptions of the safety, convenience, and attractiveness of our apartment communities and the areas in which they are located; |
• | changes in interest rates and availability of attractive financing that might make other housing options, like home ownership, more attractive; |
• | our ability to collect rents from our tenants; |
• | vacancies, changes in rental rates, and the periodic need to repair, renovate, and redevelop our apartment communities; |
• | increases in operating costs, including real estate taxes, state and local taxes, insurance expenses, utilities, and security costs, many of which are not reduced significantly when circumstances cause a reduction in revenues from a property; |
• | our ability to provide adequate maintenance and insurance on our apartment communities; and |
• | changes in tax laws and other government regulations that could affect the value of REITs generally or our business in particular. |
6
Our property acquisition activities may not produce the cash flows expected and could subject us to various risks that could adversely affect our operating results. We have acquired and intend to continue to pursue the acquisition of apartment communities, but the success of our acquisition activities is subject to numerous risks, including the following:
• | acquisition agreements are subject to customary closing conditions, including completion of due diligence investigations, and we may be unable to complete an acquisition after making a non-refundable deposit and incurring other acquisition-related costs; |
• | expected occupancy, rental rates, and operating expenses of acquired apartment communities may differ from the actual results, or from those of our existing apartment communities; |
• | we may be unable to obtain financing for acquisitions on favorable terms, or at all; |
• | competition for these properties could cause us to pay higher prices for new properties or prevent us from purchasing a desired property at all; |
• | we may be subject to unknown liabilities from acquired properties, with either no recourse or limited recourse against prior owners or other third parties with respect to these unknown liabilities; and |
• | we may be unable to quickly and efficiently integrate new acquisitions into our existing operations. |
We may be unable to acquire or develop properties and expand our operations into new or existing markets successfully. We intend to explore acquisitions or developments of properties in new and existing geographic markets. Acquiring or developing new properties and expanding into new markets introduces several risks, including but not limited to the following:
• | we may not be successful in identifying suitable properties or other assets that meet our acquisition or development criteria or in consummating acquisitions or developments on satisfactory terms, or at all; |
• | we may be unable to maintain consistent standards, controls, policies, and procedures, or realize the anticipated benefits of the acquisitions within the anticipated timeframe, or at all; |
• | acquisitions and divestitures could divert our attention from our existing properties and could cause us to lose key employees or be unable to attract highly qualified new employees; |
• | unfamiliarity with the dynamics and prevailing conditions of any new geographic markets could adversely affect our ability to successfully expand into or operate within those markets or cause us to become more dependent on third parties in new markets due to our inability to directly and efficiently manage and otherwise monitor new properties in new markets; |
• | we may make assumptions regarding the expected future performance of acquired properties, including expected occupancy, rental rates, and cash flows, that prove to be inaccurate; and |
• | we may improperly estimate the costs of repositioning or redeveloping an acquired property. |
Risks related to properties under development, redevelopment or newly developed properties may adversely affect our financial performance. We may be unable to obtain, or may suffer delays in obtaining, necessary zoning, land-use, building, occupancy, and other required governmental permits and authorizations, which could lead to increased costs or abandonment of projects. We may not be able to obtain financing on favorable terms, or at all, and we may not be able to complete lease-up of a property on schedule. The resulting time required for development, redevelopment, and lease-up means that we may have to wait years for significant cash returns.
Competition may negatively impact our earnings. We compete with many kinds of institutions, including other REITs, private partnerships, individuals, pension funds, and banks in attracting tenants and finding investment opportunities. Many of these institutions are active in the markets in which we invest and have greater financial and other resources than we do. Our apartment communities compete directly with other multifamily apartment communities, single-family homes, condominiums, and other short-term rentals.
Short-term leases could expose us to the effects of declining market rents. Our apartment leases are generally for a term of 18 months or less. Because these leases generally allow residents to leave at the expiration of the lease term without penalty, our rental revenues are impacted by declines in market rents more quickly than if our leases were for longer terms.
Because real estate investments are relatively illiquid, and various factors limit our ability to dispose of assets, we may not be able to sell properties when appropriate. We may have limited ability to change our portfolio of properties quickly in response to our strategic plan and changes in economic or other conditions, and the prohibitions under the federal income tax laws on REITs holding property for sale and related regulations may affect our ability to sell properties. Under certain circumstances, the Code
7
imposes penalties on a REIT that sells property held for less than two years and limits the number of properties it can sell in a given year. Our ability to dispose of assets also may be limited by constraints on our ability to use disposition proceeds to make acquisitions on financially attractive terms and the requirement that we take additional impairment charges on certain assets. More specifically, we are required to distribute or pay tax on all capital gains generated from the sale of assets. Some of our properties were acquired using limited partnership units of IRET Properties, our operating partnership, and are subject to certain agreements that restrict our ability to sell these properties in transactions that would create current taxable income to the former owners. As a result, we are motivated to structure the sale of these assets as tax-free exchanges, the requirements of which are technical and may be difficult to achieve.
Our real estate assets may be subject to impairment charges. We periodically evaluate the recoverability of the carrying value of our real estate assets under United States generally accepted accounting principles (“GAAP”). Factors considered in evaluating impairment of our real estate assets held for investment include significant declines in net operating income, recurring net operating losses, and other significant adverse changes in general market conditions that are considered permanent in nature. Generally, a real estate asset held for investment is not considered impaired if the estimated undiscounted future cash flows of the asset over its estimated holding period are in excess of the asset’s net book value at the balance sheet date. Assumptions used to estimate annual and residual cash flow and the estimated holding period of these assets require the judgment of management.
Inability to manage growth effectively may adversely affect our operating results. We have experienced significant growth at various times in the past, principally through the acquisition of additional real estate properties. Effective management of rapid growth presents challenges, including:
• | the need to expand our management team and staff; |
• | the need to enhance internal operating systems and controls; and |
• | the ability to consistently achieve targeted returns on individual properties. |
We may not be able to maintain similar rates of growth in the future or manage our growth effectively.
Adverse changes in taxes and other laws may affect our liabilities relating to our properties and operations. Increases in real estate taxes and service and transfer taxes may adversely affect our cash available for distributions and our ability to pay amounts due on our debt. Similarly, changes in laws that increase the potential liability for environmental conditions or that affect development, construction, and safety requirements may result in significant unanticipated costs. Future enactment of rent control or rent stabilization laws or other laws regulating apartment communities may reduce rental revenues or increase operating costs.
We may be unable to retain or attract qualified management. We are dependent upon our senior officers for essentially all aspects of our business operations. Our senior officers have experience in the real estate industry, and the loss of them would likely have a material adverse effect on our operations and could adversely impact our relationships with lenders and industry personnel. We do not have employment contracts with any of our senior officers. As a result, any senior officer may terminate his or her relationship with us at any time, without providing advance notice. If we fail to effectively manage a transition to new personnel, or if we fail to attract and retain qualified and experienced personnel on acceptable terms, it could adversely affect our business.
Risks related to joint ventures may adversely affect our financial performance and results of operations. We have entered into, and may continue in the future to enter into, partnerships or joint ventures with other persons or entities. Joint venture investments involve risks that may not be present with other methods of ownership, including the possibility that:
• | our partner might become insolvent, refuse to make capital contributions when due, or otherwise fail to meet its obligations, which may result in certain liabilities to us for guarantees and other commitments; |
• | our partner might at any time have economic or other business interests or goals that are or become inconsistent with our interests or goals; |
• | we could become engaged in a dispute with our partner, which could require us to expend additional resources to resolve such disputes; or |
• | our partner may be in a position to take action or withhold consent contrary to our instructions or requests, which could restrict our ability to transfer our interest in a joint venture to a third party. |
In some instances, we and/or our partner may have the right to trigger a buy-sell arrangement, which could cause us to sell our interest, or acquire our partner’s interest, at a time when we otherwise would not have initiated such a transaction. Our ability to acquire our partner’s interest may be limited if we do not have sufficient cash, available borrowing capacity, or other capital resources. In such event, we may be forced to sell our interest in the joint venture when we would otherwise prefer to retain it. Joint ventures may require us to share decision-making authority with our partners, which could limit our ability to control the
8
properties in the joint ventures. Even when we have a controlling interest, certain major decisions may require partner approval, such as the sale, acquisition, or financing of a property.
We face risks associated with security breaches through cyber-attacks, cyber intrusions, or otherwise, which could pose a risk to our systems, networks, and services. We face risks associated with security breaches or disruptions, whether through cyber-attacks or cyber intrusions over the Internet, malware, computer viruses, attachments to emails, or persons inside our organization. The risk of a security breach or disruption, particularly through cyber-attacks or cyber intrusion, including by computer hackers, foreign governments and cyber terrorists, has generally increased as the number, intensity, and sophistication of attempted attacks and intrusions around the world have increased. In the normal course of business, we and our service providers (including service providers engaged in providing web hosting, property management, leasing, accounting and/or payroll software/services) collect and retain certain personal information provided by our tenants, employees, and vendors. We also rely extensively on computer systems to process transactions and manage our business. While we and our service providers employ a variety of data security measures to protect confidential information on our systems and periodically review and improve our data security measures, we cannot provide assurance that we or our service providers will be able to prevent unauthorized access to this personal information, that our efforts to maintain the security and integrity of the information that we and our service providers collect will be effective, or that attempted security breaches or disruptions would not be successful or damaging. Even the most well-protected information, networks, systems, and facilities remain potentially vulnerable because the techniques used in such attempted security breaches evolve and generally are not recognized until launched against a target. In some cases, these breaches are designed not to be detected and, in fact, may not be detected. Accordingly, we and our service providers may be unable to anticipate these techniques or to implement adequate security barriers or other preventative measures, thereby making it impossible to entirely mitigate this risk. A security breach or other significant disruption involving computer networks and related systems could cause substantial costs and other negative measures, including litigation, remediation costs, costs to deploy additional protection strategies, compromising of confidential information, and reputational damage adversely affecting investor confidence.
Complying with laws benefiting disabled persons or other safety regulations and requirements may affect our costs and investment strategies. Federal, state, and local laws and regulations designed to improve disabled persons’ access to and use of buildings, including the Americans with Disabilities Act of 1990, may require modifications to, or restrict renovations of, existing buildings that may require unexpected expenditures. These laws and regulations may require that structural features be added to buildings under construction. Legislation or regulations that may be adopted in the future may impose further burdens or restrictions on us with respect to improved access to, and use of these buildings by, disabled persons. Noncompliance could result in the imposition of fines by government authorities or the award of damages to private litigants. The costs of complying with these laws and regulations may be substantial, and limits or restrictions on construction, or the completion of required renovations, may limit the implementation of our investment strategy or reduce overall returns on our investments.
We may be responsible for potential liabilities under environmental laws. Under various federal, state, and local laws, ordinances and regulations, we, as a current or previous owner or operator of real estate, may be liable for the costs of removal or remediation of hazardous or toxic substances in, on, around, or under that property. These laws may impose liability without regard to whether we knew of, or were responsible for, the presence of the hazardous or toxic substances. The presence of these substances, or the failure to properly remediate any property containing these substances, may adversely affect our ability to sell or rent the affected property or to borrow funds using the property as collateral. In arranging for the disposal or treatment of hazardous or toxic substances, we also may be liable for the costs of removal of, or remediation of, these substances at that disposal or treatment facility, whether or not we own or operate the facility. In connection with our current or former ownership (direct or indirect), operation, management, development, and/or control of real properties, we may be potentially liable for removal or remediation costs with respect to hazardous or toxic substances at those properties, as well as certain other costs, including governmental fines and claims for injuries to persons and property. Although we are not aware of any such claims associated with our existing properties that would have a material adverse effect on our business, potential future costs and damage claims may be substantial and could exceed any insurance coverage we may have for such events or such coverage may not exist. The presence of such substances, or the failure to properly remediate any such impacts, may adversely affect our ability to borrow against, develop, sell, or rent the affected property. Some environmental laws create or allow a government agency to impose a lien on the impacted property in favor of the government for damages and costs it incurs as a result of responding to hazardous or toxic substances.
Environmental laws also govern the presence, maintenance, and removal of asbestos, and require that owners or operators of buildings containing asbestos properly manage and maintain the asbestos; notify and train those who may come into contact with asbestos; and undertake special precautions if asbestos would be disturbed during renovation or demolition of a building. Indoor air quality issues may also necessitate special investigation and remediation. These air quality issues can result from inadequate ventilation, chemical contaminants from indoor or outdoor sources, or biological contaminants such as molds, pollen, viruses and bacteria. Asbestos or air quality remediation programs could be costly, necessitate the temporary relocation of some or all of the property’s tenants, or require rehabilitation of an affected property.
9
It is generally our policy to obtain a Phase I environmental study on each property that we seek to acquire. A Phase I environmental study generally includes a visual inspection of the property and the surrounding areas, an examination of current and historical uses of the property and the surrounding areas, and a review of relevant state and federal documents but does not involve invasive techniques such as soil and ground water sampling. If the Phase I indicates any possible environmental problems, our policy is to order a Phase II study, which involves testing the soil and ground water for actual hazardous substances. However, Phase I and Phase II environmental studies, or any other environmental studies undertaken with respect to any of our current or future properties, may not reveal the full extent of potential environmental liabilities. We currently do not carry insurance for environmental liabilities.
Our current or future insurance may not protect us against possible losses. We carry comprehensive liability, fire, extended coverage, and other insurance with respect to our properties at levels that we believe to be adequate and comparable to coverage customarily obtained by owners of similar properties. However, the coverage limits of our current or future policies may be insufficient to cover the full cost of repair or replacement of all potential losses, or our level of coverage may not continue to be available in the future or, if available, may be available only at unacceptable cost or with unacceptable terms. We also do not maintain coverage for certain catastrophic events like hurricanes and earthquakes due to the location of our properties. In most cases, we have to renew our insurance policies on an annual basis and negotiate acceptable terms for coverage, exposing us to the volatility of the insurance markets, including the possibility of rate increases. Any material increases in insurance rates or decrease in available coverage in the future could adversely affect our results of operations.
Litigation risks could affect our business. As a publicly traded owner, manager, and developer of apartment communities, we may incur liability based on various conditions at our properties and the buildings thereon. In the past, we have been, and in the future may become, involved in legal proceedings, including consumer, employment, tort, or commercial litigation, any of which if decided adversely to us or settled by us and not adequately covered by insurance, could result in liability that could be material to our results of operations.
Catastrophic weather, natural events, and climate change could adversely affect our business. Some of our apartment communities are located in areas that may experience catastrophic weather and other natural events from time to time, including snow or ice storms, flooding, mudslides, tornadoes, or other severe or inclement weather. These adverse and natural events could cause damage or losses that may be greater than insured levels. In the event of a loss in excess of insured limits, we could lose all or a portion of our investment in an affected property as well as additional revenue from that apartment community. We may continue to be obligated to repay mortgage indebtedness or other obligations related to an affected apartment community.
To the extent that we experience any significant changes in the climate in areas where our apartment communities are located, we may experience extreme weather conditions and prolonged changes in precipitation and temperature, all of which could result in physical damage to, and/or a decrease in demand for, our apartment communities located in these areas. If the impact of any such climate change were to be material, or occur for a lengthy period of time, our business may be adversely affected.
Actual or threatened terrorist attacks may adversely affect our business. Actual or threatened terrorist attacks and other acts of war or violence could adversely affect our business. Attacks that directly impact one or more of our apartment communities could significantly affect our ability to operate these communities, thereby impairing our ability to achieve our expected results. Our insurance may not adequately cover all losses from a terrorist attack, and the ongoing effects of any terrorist attacks or threatened terrorist attacks could adversely affect the U.S. economy generally and our business in particular.
Potential changes to the condition of Fannie Mae and Freddie Mac and in government support for apartment communities may adversely affect our business. Historically, we have depended on the Federal National Mortgage Association (“Fannie Mae”) and the Federal Home Loan Mortgage Corporation (“Freddie Mac”) to provide financing for certain apartment communities. Although Fannie Mae and Freddie Mac have a mandate to support multifamily housing through their financing activities, there are current government proposals relating to the future of agency mortgage finance in the U.S. that could involve the phase-out of Fannie Mae and Freddie Mac. Although we believe that Fannie Mae and Freddie Mac will continue to provide liquidity to the multifamily sector, any phase-out of Fannie Mae and Freddie Mac, change in their mandate, or reduction in government support for apartment communities generally could result in adverse changes to interest rates, capital availability, development of additional apartment communities, and the value of these communities.
Expanding social media usage could present new risks. The use of social media could cause us to suffer broad reputational damage. Negative posts or comments about us on any social networking website, or disclosure of any non-public sensitive information relating to our business, could damage our reputation. The continuing evolution of social media will present us with new and ongoing challenges and risks.
Employee theft or fraud could result in loss. Certain employees have access to, or signature authority with respect to, our bank accounts or assets, which exposes us to the risk of fraud or theft. Certain employees also have access to key information technology
10
(“IT”) infrastructure and to tenant and other information that may be commercially valuable. If any employee were to compromise our IT systems, or misappropriate tenant or other information, we could incur losses, including potentially significant financial or reputational harm. We may not have insurance that covers any losses in full or covers losses from particular criminal acts.
Risks Related to Our Indebtedness and Financings
Our inability to renew, repay, or refinance our debt may result in losses. We incur a significant amount of debt in the ordinary course of our business and in connection with acquisitions of real properties. Because we have a limited ability to retain earnings as a result of the REIT distribution requirements, we will generally be required to refinance debt that matures with additional debt or equity. We are subject to the normal risks associated with debt financing, including the risks that:
• | our cash flow will be insufficient to meet required payments of principal and interest; |
• | we will not be able to renew, refinance, or repay our indebtedness when due; and |
• | the terms of any renewal or refinancing will be less favorable than the terms of our current indebtedness. |
These risks increase when credit markets are tight. In general, when the credit markets are tight, we may encounter resistance from lenders when we seek financing or refinancing for properties or proposed acquisitions, and the terms of such financing or refinancing are likely to be less favorable to us than the terms of our current indebtedness.
We anticipate that we will need to refinance a significant portion of our outstanding debt as it matures. We cannot guarantee that any refinancing of debt with other debt will be possible on terms that are favorable or acceptable to us. If we cannot refinance, extend, or pay principal payments due at maturity with the proceeds of other capital transactions, our cash flows may not be sufficient in all years to repay debt as it matures. If we are unable to refinance our indebtedness on acceptable terms, or at all, we may be forced to dispose of one or more properties on disadvantageous terms, which may result in losses. These losses could have a material adverse effect on our business, our ability to make distributions to our shareholders, and our ability to pay amounts due on our debt. If a property is mortgaged to secure payment of indebtedness and we are unable to meet mortgage payments or refinance the debt at maturity, the mortgagor could foreclose upon the property, appoint a receiver, and receive an assignment of rents and leases or pursue other remedies, including taking ownership of the property, all with a consequent loss of revenues and asset value. Foreclosures also could affect our ability to obtain new debt and could create taxable income without accompanying cash proceeds, thereby hindering our ability to meet the REIT distribution requirements of the Code and impeding our ability to obtain financing for our other properties.
The restrictive terms of indebtedness may cause acceleration of debt payments and constrain our ability to conduct certain transactions. At April 30, 2018, we and our Operating Partnership had outstanding borrowings of approximately $706.1 million. Some of this indebtedness contains financial covenants relating to fixed charge coverage ratios, maximum secured debt, maintenance of unencumbered asset value, and total debt to gross assets, among others. Some covenants present new constraints as we navigate investments and dispositions with respect to our ability to invest in certain markets, add incremental secured and recourse debt, and add overall leverage. If an event of default occurs, our lenders may declare borrowings under the loan agreements to be due and payable immediately, which could have an adverse effect our ability to make distributions to our shareholders and pay amounts due on our debt.
Rising interest rates may affect our cost of capital and financing activities. Interest rates have been rising recently, and some of our mortgage debt has varying interest rates dependent upon certain market indexes. Rising interest rates could limit our ability to refinance portions of our fixed-rate indebtedness when it matures and would increase our interest costs. We also have an unsecured credit facility that bears interest at variable rates based on amounts drawn. As a result, any further increase in interest rates could increase our interest expense on our variable rate debt, increase our interest rates when refinancing fixed-rate debt, increase the cost of issuing new debt, and reduce the cash available for distribution to shareholders.
Interest rate hedging arrangements may result in losses. From time to time, we use interest rate swaps and other hedging instruments to manage our interest rate risks. Although these arrangements may partially protect us against rising interest rates, they also may reduce the benefits to us if interest rates decline. If a hedging arrangement is not indexed to the same rate as the indebtedness that is hedged, we may be exposed to losses to the extent that the rate governing the indebtedness and the rate governing the hedging arrangement change independently of each other, and nonperformance by the other party to the hedging arrangement also may subject us to increased credit risks. In order to minimize any counterparty credit risk, we enter into hedging arrangements only with investment grade financial institutions.
11
Risks Related to Our Shares
Our stock price may fluctuate significantly. The market price and trading volume of our common shares are subject to fluctuation due to general market conditions, the risks discussed in this report, and several other factors, including the following:
• | regional, national, and global economic and business conditions; |
• | actual or anticipated changes in our quarterly operating results or dividends; |
• | changes in our funds from operations or earnings estimates; |
• | investor interest in our property portfolio; |
• | the market perception and performance of REITs in general; |
• | the market perception or trading volume of REITs relative to other investment opportunities; |
• | the market perception of our financial condition, performance, distributions, and growth potential; |
• | general stock and bond market conditions, including potential increases in interest rates that could lead investors to seek high annual yield from dividends; |
• | shifts in our investor base to a higher concentration of passive investors, including exchange-traded funds and index funds, that could have an adverse effect on our ability to communicate with our shareholders; |
• | our ability to access capital markets, which could impact our cost of capital; |
• | a change in our credit rating or analyst ratings; |
• | changes in minimum dividend requirements; |
• | terrorism or other factors that adversely impact the markets in which our stock trades; and |
• | changes in tax laws or government regulations that could affect the attractiveness of our stock. |
Rising interest rates could have an adverse effect on our share price, and low trading volume on the NYSE may prevent the timely resale of our shares. If interest rates continue to increase, this could cause holders of our common stock and other investors to seek higher dividends on our shares or higher yields through other investments, which could adversely affect the market price of our shares. Although our common shares are listed on the NYSE, the daily trading volume of our shares may be lower than the trading volume for other companies. As a result of lower trading volume, an owner of our common shares may encounter difficulty in selling our shares in a timely manner and may incur a substantial loss.
Failure to generate sufficient revenue or other liquidity needs could limit cash flow available for distributions to our shareholders. A decrease in rental revenue, an increase in funding to support our acquisition and development needs, or other unmet liquidity needs could have an adverse effect on our ability to pay distributions to our shareholders or the Operating Partnership's unitholders.
Payment of distributions on our common shares is not guaranteed. Our Board of Trustees must approve any stock distributions and may elect at any time, or from time to time, and for an indefinite duration, to reduce or not pay the distributions payable on our common shares. Our Board may reduce distributions for a variety of reasons, including but not limited to the following:
• | operating and financial results cannot support the current distribution payment; |
• | unanticipated costs, capital requirements, or cash requirements; |
• | annual distribution requirements under the REIT provisions of the Code; |
• | a conclusion that the payment of distributions would cause us to breach the terms of certain agreements or contracts, such as financial ratio covenants in our debt financing documents; or |
• | other factors the Board of Trustees may consider relevant. |
Our future growth depends, in part, on our ability to raise additional equity capital, which will have the effect of diluting the interests of our common shareholders. Our future growth depends upon, among other things, our ability to raise equity capital and issue limited partnership units of IRET Properties. Sales of substantial amounts of our common or preferred shares in the public market, or substantial issuances of our common shares in connection with redemption requests for limited partnership units, or the perception that such sales or issuances might occur, will dilute the interests of the current common shareholders and could adversely affect the market price of our common shares.
12
We may issue additional classes or series of our shares of beneficial interest with rights and preferences that are superior to the rights and preferences of our common shares. Without the approval of our common shareholders, our Board of Trustees may establish additional classes or series of our shares of beneficial interest, and such classes or series may have dividend rights, conversion rights, voting rights, terms of redemption, redemption prices, liquidation preferences, or other rights and preferences that are superior to the rights of the holders of our common shares. In that regard, in September 2017, we filed a new shelf registration statement with the SEC that enables us to sell an undetermined number of equity and debt securities as defined in the prospectus. Future sales of common stock, preferred stock, or convertible debt securities may dilute current shareholders and could have an adverse impact on the market price of our common stock.
Our rating by proxy advisory firms or other corporate governance consultants advising institutional investors could have an adverse effect on the perception of our corporate governance and thereby negatively impact the market price of our common stock. Various proxy advisory firms and other corporate governance consultants advising institutional investors provide scores or ratings of our corporate governance, executive compensation practices, and other matters that may be submitted to shareholders in connection with our annual meetings. From time to time, certain matters that we propose for approval may not receive a favorable score or rating or might even result in a negative score or rating or recommendation against the matter proposed. In these situations, unfavorable scores or ratings may lead to rejected proposals, which could lead to decreases in our market price. Although we periodically review our corporate governance measures and consider implementing changes that we believe to be responsive to concerns that have been raised, there may be times when we decide not to implement changes recommended by proxy advisors or other corporate governance consultants because we do not believe that such changes are in the best interests of IRET and our shareholders, notwithstanding the negative effect that such a decision could have on our ratings or stock price.
Any material weaknesses identified in our internal control over financial reporting could adversely affect our stock price. Section 404 of the Sarbanes-Oxley Act of 2002 requires us to evaluate and report on our internal control over financial reporting. If we were to identify one or more material weaknesses in our internal control over financial reporting, we could lose investor confidence in our financial reporting and results of operations, which in turn could have an adverse effect on our stock price.
Risks Related to Our Tax Status
We may incur tax liabilities as a consequence of failing to qualify as a REIT, which could force us to borrow funds during unfavorable market conditions. We have elected to be taxed as a REIT under the Code. Qualification as a REIT involves the application of highly technical and complex Code provisions, including income, asset, and distribution tests, for which there are only limited judicial or administrative interpretations. Even a technical or inadvertent mistake could endanger our REIT status. The determination that we qualify as a REIT requires an ongoing analysis of various factual matters and circumstances, some of which may not be within our control. For example, in order to qualify as a REIT, at least 95% of our gross income in any year must come from certain passive sources that are itemized in the REIT tax laws, and we are prohibited from owning specified amounts of debt or equity securities of some issuers. Thus, to the extent revenues from non-qualifying sources, such as income from third-party management services, represent more than 5% of our gross income in any taxable year, we will not satisfy the 95% income test and may fail to qualify as a REIT, unless certain relief provisions contained in the Code apply. Even if relief provisions apply, however, a tax would be imposed with respect to excess net income. We are also required to make distributions to the holders of our securities of at least 90% of our REIT taxable income, determined before a deduction for dividends paid and excluding any net capital gain. To the extent that we satisfy the 90% test but distribute less than 100% of our REIT taxable income, we will be subject to corporate income tax on such undistributed income and could be subject to an additional 4% excise tax. Because we need to meet these tests to maintain our qualification as a REIT, it could cause us to have to forego certain business opportunities and potentially require us to liquidate otherwise attractive investments. The fact that we hold substantially all of our assets (except for qualified REIT subsidiaries) through IRET Properties, our operating partnership, and its subsidiaries, and our ongoing reliance on factual determinations, such as determinations related to the valuation of our assets, further complicates the application of the REIT requirements for us. If IRET Properties or one or more of our subsidiaries is determined to be taxable as a corporation, we may fail to qualify as a REIT. Either our failure to qualify as a REIT, for any reason, or the imposition of taxes on excess net income from non-qualifying sources, could adversely affect our business and our ability to make distributions to our shareholders and pay amounts due on our debt. New legislation, regulations, administrative interpretations or court decisions could change the tax laws with respect to our qualification as a REIT or the federal income tax consequences of our qualification.
If we were to fail to qualify as a REIT, we would be subject to federal income tax on our taxable income at regular corporate rates, could be subject to increased state and local taxes and, unless entitled to relief under applicable statutory provisions, would be disqualified from treatment as a REIT for the four taxable years following the year during which we lost our qualification, which would likely have a material adverse effect on us, our ability to make distributions to our shareholders, and our ability to pay amounts due on our debt. This treatment would reduce funds available for investment or distributions to the holders of our securities due to the additional tax liability to us for the year or years involved, and we would no longer be able to deduct, and would not be required to make, distributions to our shareholders. To the extent that distributions to the holders of our securities had been
13
made in anticipation of qualifying as a REIT, we may need short-term debt or long-term debt or proceeds from asset sales or sales of common shares to fund required distributions as a result of differences in timing between the actual receipt of income and the recognition of income for federal income tax purposes, or the effect of non-deductible capital expenditures, the creation of reserves or required debt or amortization payments. The inability of our cash flows to cover our distribution requirements could have an adverse impact on our ability to raise short and long-term debt or sell equity securities in order to fund distributions required to maintain our REIT status.
Failure of our operating partnership to qualify as a partnership would adversely affect us. We believe that IRET Properties, our operating partnership, qualifies as a partnership for federal income tax purposes. However, we can provide no assurance that the IRS will not challenge its status as a partnership for federal income tax purposes or that a court would not sustain such a challenge. If the IRS were to be successful in treating IRET Properties as an entity taxable as a corporation (such as a publicly traded partnership taxable as a corporation), we would cease to qualify as a REIT because the value of our ownership interest in IRET Properties would exceed 5% of our assets and because we would be considered to hold more than 10% of the voting securities and value of the outstanding securities of another corporation. The imposition of a corporate tax on IRET Properties would significantly reduce the amount of cash available for distribution.
Certain provisions of our Declaration of Trust may limit a change in control and deter a takeover. In order to maintain our qualification as a REIT, our Declaration of Trust provides that any transaction that would result in our disqualification as a REIT under Section 856 of the Code will be void, including any transaction that would result in the following:
• | a person owning in excess of the ownership limit of 9.8%, in number or value, of our outstanding shares; |
• | less than 100 people owning our shares; |
• | our being “closely held” within the meaning of Section 856(h) of the Code; or |
• | 50% or more of the fair market value of our shares being held by persons other than “United States persons.” |
If the transaction is not void, then the shares in violation of the foregoing conditions will automatically be exchanged for an equal number of excess shares, and these excess shares will be transferred to an excess share trustee for the exclusive benefit of the charitable beneficiaries named by our Board of Trustees. These limitations may have the effect of preventing a change in control or takeover of us by a third party, even if the change in control or takeover would be in the best interests of our shareholders.
Legislative or regulatory actions affecting REITs could have an adverse effect on us or our shareholders. Changes to the tax laws could adversely affect us or our shareholders. In 2017, Congress passed tax legislation (the “2017 Tax Cuts and Jobs Act”) that significantly changed the U.S. federal income taxation of U.S. businesses and their owners, including REITs and their shareholders. Although the 2017 Tax Cuts and Jobs Act was recently passed, there can be no assurance that future changes to the U.S. federal income tax laws or regulations will not be proposed or enacted that could impact our business and financial results. The REIT rules are constantly under review by persons involved in the legislative process and by the Internal Revenue Service and the U.S. Treasury Department, which may result in revisions to regulations and interpretations as well as statutory changes. If enacted, certain changes could have an adverse impact on our business. The Tax Cuts and Jobs Act of 2017 also contained provisions that may reduce the relative competitive advantage of operating as a REIT. For example, the Tax Cuts and Jobs Act of 2017 lowered income tax rates on individuals and corporations, easing the burden of double taxation on corporate dividends and potentially causing the single level of taxation on REIT distributions to be relatively less attractive. The Tax Cuts and Jobs Act of 2017 also contains provisions allowing the expensing of capital expenditures, which could result in the bunching of taxable income and required distributions for REITs, and provisions further limiting the deductibility of interest expense, which could disrupt the real estate market. We cannot predict whether, when, or to what extent the Tax Cuts and Jobs Act of 2017 and any new U.S. federal tax laws, regulations, interpretations, or rulings will impact the real estate investment industry or REITs. Prospective investors are urged to consult their tax advisers regarding the effect of the Tax Cuts and Jobs Act of 2017 and potential future changes to the federal tax laws of an investment in our shares or units.
Dividends payable by REITs may be taxed at higher rates than dividends of non-REIT corporations, which could reduce the net cash received by our shareholders and may be detrimental to our ability to raise additional funds through any future sale of our stock. Dividends paid by REITs to U.S. shareholders that are individuals, trusts, or estates are generally not eligible for the reduced tax rate applicable to qualified dividends received from non-REIT corporations but, under the 2017 Tax Cuts and Jobs Act, U.S. shareholders that are individuals, trusts, and estates generally may deduct 20% of ordinary dividends from a REIT (for taxable years beginning after December 31, 2017 and before January 1, 2026). Although this deduction reduces the effective tax rate applicable to certain dividends paid by REITs, such tax rate is still higher than the tax rate applicable to regular corporate qualified dividends. This may cause investors to view REIT investments as less attractive than investments in non-REIT corporations, which in turn may adversely affect the value of stock in REITs, including our stock. Investors should consult with their tax advisers regarding the U.S. tax consequences of an investment in our stock or units.
14
We may face risks in connection with Section 1031 exchanges. From time to time, we dispose of properties in transactions intended to qualify as “like-kind exchanges” under Section 1031 of the Code. If a transaction intended to qualify as a Section 1031 exchange is later determined to be taxable, we may face adverse consequences, and if the laws applicable to such transactions are amended or repealed, we may not be able to dispose of properties on a tax-deferred basis. If we are unable to meet the technical requirements of a desired Section 1031 exchange, we may be required to make a special dividend payment to our shareholders if we are unable to mitigate the taxable gains realized.
Complying with REIT requirements may force us to forego otherwise attractive opportunities or liquidate otherwise attractive investments. To qualify and maintain our status as a REIT, we must satisfy certain requirements with respect to the character of our assets. If we fail to comply with these requirements at the end of any quarter, we must correct such failure within 30 days after the end of the quarter (by, possibly, selling assets notwithstanding their prospects as an investment) to avoid losing our REIT status. This could include potentially selling otherwise attractive assets or liquidating or foregoing otherwise attractive investments. These actions could reduce our income and amounts available for distribution to our shareholders.
Even if we qualify as a REIT, we may face other tax liabilities that reduce our cash flows. Even if we qualify for taxation as a REIT, we may be subject to certain federal, state, and local taxes on our income and assets, including taxes on any undistributed income, tax on income from some activities conducted as a result of a foreclosure, and state or local income, property, and transfer taxes, such as mortgage recording taxes. Any of these taxes would decrease cash available for distribution to our shareholders.
The tax imposed on REITs engaging in prohibited transactions and our agreements entered into with certain contributors of our properties may limit our ability to engage in transactions that would be treated as sales for federal income tax purposes. The federal income tax provisions applicable to REITs provide that any gain realized by a REIT on the sale of property held as inventory or other property held primarily for sale to customers in the ordinary course of business is treated as income from a “prohibited transaction” that is subject to a 100% penalty tax. Under current law, unless a sale of real property qualifies for a safe harbor, the question of whether the sale of a property constitutes the sale of property held primarily for sale to customers is generally a question of the facts and circumstances regarding a particular transaction. We may make sales that do not satisfy the requirements of the safe harbors, or the IRS may successfully assert that one or more of our sales are prohibited transactions and, as a result, we may be required to pay a penalty tax. To avert this penalty tax, we may hold some of our assets through a taxable REIT subsidiary (“TRS”). While the TRS structure would allow the economic benefits of ownership to flow to us, a TRS is subject to tax on its income at the federal and state level. We have entered into agreements with certain contributors of our properties that contain limitations on our ability to dispose of certain properties in taxable transactions. The restrictions on taxable dispositions are effective for varying periods. Such agreements may require that we make a payment to the contributor in the event that we dispose of a covered property in a taxable sale during the restriction period.
Our ownership of TRSs is limited, and our transactions with TRSs will cause us to be subject to a 100% penalty tax on certain income or deductions if those transactions are not conducted on arm's-length terms. A REIT may own up to 100% of the stock of one or more TRSs. A TRS may hold assets and earn income that would not be qualifying assets or income if held or earned directly by a REIT. Both the subsidiary and the REIT must jointly elect to treat the subsidiary as a TRS. A corporation of which a TRS directly or indirectly owns more than 35% of the voting power or value of the stock will automatically be treated as a TRS. Overall, no more than 20% of the value of a REIT's assets may consist of stock or securities of one or more TRSs, and the TRS rules limit the deductibility of interest paid or accrued by a TRS to its parent REIT to assure that the TRS is subject to an appropriate level of corporate taxation. The rules also impose a 100% excise tax on certain transactions between a TRS and its parent REIT that are not conducted on an arm’s-length basis.
Our TRS is subject to applicable federal, state, and local income tax on its taxable income, and its after-tax net income will be available for distribution to us but is not required to be distributed to us. We believe that the aggregate value of the stock and securities of our TRS is and will continue to be less than 20% of the value of our total assets (including our TRS stock and securities). We will continue to monitor the value of our investments in our TRS for the purpose of ensuring compliance with TRS ownership limitations. We will scrutinize all of our transactions with our TRS to ensure that they are entered into on arm's-length terms to avoid incurring the 100% excise tax described above. There can be no assurance, however, that we will be able to comply with the 20% limitation discussed above or to avoid application of the 100% excise tax discussed above.
Our Board of Trustees may make changes to our major policies without approval of our shareholders. Our operating and financial policies, including policies relating to development and acquisition of real estate, financing, growth, operations, indebtedness, capitalization, and distributions are exclusively determined by our Board of Trustees. Our Board of Trustees may amend or revoke those policies, and other policies, without advance notice to, or the approval of, our shareholders.
15
Item 1B. Unresolved Staff Comments
None.
Item 2. Properties
We are organized as a REIT under Section 856-858 of the Code and are structured as an UPREIT. We conduct the business of owning, leasing, developing and acquiring real estate properties through our Operating Partnership. These real estate investments are managed by our own employees and by third-party professional real estate management companies on our behalf.
Certain Lending Requirements
In certain instances, in connection with the financing of investment properties, the lender may require, as a condition of the loan, that the properties be owned by a “single asset entity.” Accordingly, we have organized a number of wholly owned subsidiary entities for the purpose of holding title in an entity that complies with such lending conditions. All financial statements of these subsidiaries are consolidated into our financial statements.
Management and Leasing of Our Real Estate Assets
We conduct our corporate operations from offices in Minot, North Dakota and Minneapolis and St. Cloud, Minnesota. We also have property management offices located in the states where we own properties. The day-to-day management of our properties is carried out by our own employees and in certain cases by third-party property management companies. In markets where the amount of rentable square footage we own does not justify self-management, when properties acquired have effective pre-existing property management in place, or when for other reasons particular properties are in our judgment not attractive candidates for self-management, we utilize third-party professional management companies for day-to-day management. However, all decisions relating to purchase, sale, insurance coverage, capital improvements, approval of leases, annual operating budgets and major renovations are made exclusively by our employees and implemented by the third-party management companies. Generally, our management contracts are for terms of one year or less and provide for compensation ranging from 2.5% to 5.0% of gross rent collections and, typically, we may terminate these contracts upon 60 days or less notice for cause or upon the property manager’s failure to meet certain specified financial performance goals. We believe that the broker commissions paid by us conform to market and industry standards and are commercially reasonable.
Summary of Individual Properties Owned as of April 30, 2018
The following table presents information regarding our 99 apartment communities and other properties held for investment, as well as unimproved land as of April 30, 2018. We own the following interests in real estate either through our wholly-owned subsidiaries or by ownership of a controlling interest in an entity owning the real estate. We account for these interests on a consolidated basis. Additional information is included in Schedule III to our financial statements included in this Annual Report on Form 10-K.
16
(in thousands) | ||||||||
Investment | ||||||||
Number of | (initial cost plus | Occupancy | ||||||
Apartment | improvements less | as of | ||||||
Community Name and Location | Homes | impairment) | April 30, 2018 | |||||
MULTIFAMILY | ||||||||
71 France - Edina, MN (1) (2) (3) (4) | 241 | $ | 66,545 | 90.5 | % | |||
Alps Park - Rapid City, SD (1) | 71 | 6,194 | 100.0 | % | ||||
Arbors - S Sioux City, NE (1) | 192 | 9,350 | 97.4 | % | ||||
Arcata - Golden Valley, MN (3) (4) | 165 | 33,222 | 98.2 | % | ||||
Ashland - Grand Forks, ND (1) | 84 | 8,578 | 92.9 | % | ||||
Avalon Cove - Rochester, MN (4) | 187 | 35,965 | 97.9 | % | ||||
Boulder Court - Eagan, MN | 115 | 9,568 | 98.3 | % | ||||
Brookfield Village - Topeka, KS (1) | 160 | 9,092 | 94.4 | % | ||||
Canyon Lake - Rapid City, SD (1) | 109 | 6,393 | 95.4 | % | ||||
Cardinal Point - Grand Forks, ND (3) (4) | 251 | 35,000 | 95.6 | % | ||||
Cascade Shores - Rochester, MN (1) (4) | 90 | 18,361 | 98.9 | % | ||||
Castlerock - Billings, MT (1) | 166 | 7,959 | 87.3 | % | ||||
Chateau I & II - Minot, ND (3) (4) | 104 | 21,239 | 98.1 | % | ||||
Cimarron Hills - Omaha, NE (1) | 234 | 14,994 | 98.7 | % | ||||
Colonial Villa - Burnsville, MN | 239 | 23,006 | 98.3 | % | ||||
Colony - Lincoln, NE (1) | 232 | 18,673 | 97.4 | % | ||||
Commons and Landing at Southgate - Minot, ND (1) (2) | 341 | 54,593 | 97.1 | % | ||||
Cottage West Twin Homes - Sioux Falls, SD (1) | 50 | 5,327 | 100.0 | % | ||||
Cottonwood - Bismarck, ND (1) | 268 | 23,839 | 95.5 | % | ||||
Country Meadows - Billings, MT (1) | 133 | 10,036 | 96.2 | % | ||||
Crestview - Bismarck, ND (1) | 152 | 6,731 | 96.7 | % | ||||
Crown Colony - Topeka, KS (1) | 220 | 14,318 | 98.2 | % | ||||
Crystal Bay - Rochester, MN (4) | 76 | 12,082 | 94.7 | % | ||||
Cypress Court - St. Cloud, MN (1) (2) | 196 | 20,684 | 95.4 | % | ||||
Dakota Commons - Williston, ND | 44 | 4,057 | 100.0 | % | ||||
Deer Ridge - Jamestown, ND (1) (3) (4) | 163 | 25,015 | 95.7 | % | ||||
Dylan - Denver, CO (3) | 274 | 89,529 | 83.9 | % | ||||
Evergreen - Isanti, MN (1) | 72 | 7,017 | 98.6 | % | ||||
Forest Park - Grand Forks, ND (1) | 268 | 14,592 | 95.1 | % | ||||
French Creek - Rochester, MN (4) | 40 | 5,082 | 100.0 | % | ||||
Gables Townhomes - Sioux Falls, SD (1) | 24 | 2,507 | 100.0 | % | ||||
Gardens - Grand Forks, ND (4) | 74 | 9,329 | 93.2 | % | ||||
Grand Gateway - St. Cloud, MN | 116 | 9,760 | 94.0 | % | ||||
GrandeVille at Cascade Lake - Rochester, MN (1) (4) | 276 | 56,917 | 93.8 | % | ||||
Greenfield - Omaha, NE | 96 | 6,014 | 95.8 | % | ||||
Heritage Manor - Rochester, MN (1) | 182 | 10,598 | 98.9 | % | ||||
Homestead Garden - Rapid City, SD (1) | 152 | 15,308 | 95.4 | % | ||||
Indian Hills - Sioux City, IA | 120 | 7,577 | 98.3 | % | ||||
Kirkwood Manor - Bismarck, ND (1) | 108 | 5,006 | 92.6 | % | ||||
Lakeside Village - Lincoln, NE (1) | 208 | 18,063 | 96.2 | % | ||||
Landmark - Grand Forks, ND | 90 | 2,873 | 97.8 | % | ||||
Legacy - Grand Forks, ND (1) | 360 | 33,485 | 94.7 | % | ||||
Legacy Heights - Bismarck, ND (3) (4) | 119 | 15,333 | 96.6 | % | ||||
17
(in thousands) | ||||||||
Investment | ||||||||
Number of | (initial cost plus | Occupancy | ||||||
Apartment | improvements less | as of | ||||||
Community Name and Location | Homes | impairment) | April 30, 2018 | |||||
Mariposa - Topeka, KS (1) | 54 | $ | 6,443 | 96.3 | % | |||
Meadows - Jamestown, ND | 81 | 7,031 | 93.8 | % | ||||
Monticello Crossings - Monticello, MN (3) (4) | 202 | 31,897 | 99.0 | % | ||||
Monticello Village - Monticello, MN | 60 | 5,299 | 98.3 | % | ||||
North Pointe - Bismarck, ND (1) | 73 | 5,550 | 100.0 | % | ||||
Northridge - Bismarck, ND | 68 | 8,582 | 95.6 | % | ||||
Oakmont Estates - Sioux Falls, SD | 79 | 6,621 | 94.9 | % | ||||
Oakwood Estates - Sioux Falls, SD | 160 | 8,068 | 96.3 | % | ||||
Olympic Village - Billings, MT (1) | 274 | 15,423 | 96.0 | % | ||||
Olympik Village - Rochester, MN (1) | 140 | 9,740 | 95.7 | % | ||||
Oxbo - St Paul, MN (3) | 191 | 57,461 | 73.3 | % | ||||
Oxbow Park - Sioux Falls, SD | 120 | 7,263 | 95.0 | % | ||||
Park Meadows - Waite Park, MN (1) | 360 | 19,928 | 96.9 | % | ||||
Park Place - Plymouth, MN (3) | 500 | 93,357 | 91.4 | % | ||||
Pebble Springs - Bismarck, ND | 16 | 983 | 93.8 | % | ||||
Pinehurst - Billings, MT | 21 | 1,217 | 85.7 | % | ||||
Plaza - Minot, ND (1) | 71 | 16,515 | 100.0 | % | ||||
Pointe West - Rapid City, SD (1) | 90 | 5,800 | 97.8 | % | ||||
Ponds at Heritage Place - Sartell, MN | 58 | 5,400 | 100.0 | % | ||||
Prairie Winds - Sioux Falls, SD (1) | 48 | 2,692 | 91.7 | % | ||||
Quarry Ridge - Rochester, MN (1) | 313 | 34,336 | 96.5 | % | ||||
Red 20 - Minneapolis, MN (1) (4) | 130 | 26,057 | 95.4 | % | ||||
Regency Park Estates - St. Cloud, MN (1) | 145 | 13,256 | 97.2 | % | ||||
Renaissance Heights - Williston, ND (1) (2) (3) (4) | 288 | 18,734 | 95.1 | % | ||||
Ridge Oaks - Sioux City, IA (1) | 132 | 7,172 | 99.2 | % | ||||
Rimrock West - Billings, MT (1) | 78 | 5,837 | 91.0 | % | ||||
River Ridge - Bismarck, ND | 146 | 26,116 | 96.6 | % | ||||
Rocky Meadows - Billings, MT (1) | 98 | 7,913 | 94.9 | % | ||||
Rum River - Isanti, MN (1) | 72 | 6,057 | 100.0 | % | ||||
Sherwood - Topeka, KS (1) | 300 | 20,862 | 96.3 | % | ||||
Sierra Vista - Sioux Falls, SD | 44 | 2,919 | 93.2 | % | ||||
Silver Springs - Rapid City, SD (1) | 52 | 3,861 | 100.0 | % | ||||
South Pointe - Minot, ND (1) | 196 | 15,306 | 96.9 | % | ||||
Southpoint - Grand Forks, ND | 96 | 10,635 | 96.9 | % | ||||
Southwind - Grand Forks, ND (1) | 164 | 8,987 | 96.3 | % | ||||
Sunset Trail - Rochester, MN (1) | 146 | 16,389 | 96.6 | % | ||||
Thomasbrook - Lincoln, NE (1) | 264 | 16,045 | 98.5 | % | ||||
Valley Park - Grand Forks, ND (1) | 167 | 8,381 | 96.4 | % | ||||
Villa West - Topeka, KS (1) | 308 | 19,014 | 99.4 | % | ||||
Village Green - Rochester, MN | 36 | 3,577 | 97.2 | % | ||||
Westend - Denver, CO (3) | 390 | 127,705 | 93.8 | % | ||||
West Stonehill - Waite Park, MN (1) | 312 | 18,699 | 98.1 | % | ||||
Westwood Park - Bismarck, ND (1) | 65 | 4,068 | 93.8 | % | ||||
Whispering Ridge - Omaha, NE (1) | 336 | 29,105 | 96.7 | % | ||||
Williston Garden - Williston, ND (1) (2) | 145 | 11,936 | 98.6 | % | ||||
Winchester - Rochester, MN | 115 | 8,886 | 94.8 | % | ||||
Woodridge - Rochester, MN (1) | 110 | 9,487 | 94.5 | % | ||||
TOTAL MULTIFAMILY | 14,176 | $ | 1,606,421 | 95.6 | % | |||
18
(in thousands) | ||||||||
Investment | ||||||||
Net Rentable | (initial cost plus | Occupancy | ||||||
Square | improvements less | as of | ||||||
Property Name and Location | Footage | impairment) | April 30, 2018 | |||||
OTHER - MIXED USE | ||||||||
71 France - Edina, MN (1) | 20,955 | $ | 6,653 | 100.0 | % | |||
Oxbo - St Paul, MN | 11,477 | 3,525 | 100.0 | % | ||||
Plaza - Minot, ND (1) | 50,610 | 9,597 | 100.0 | % | ||||
Red 20 - Minneapolis, MN (1) | 10,508 | 2,880 | 77.3 | % | ||||
TOTAL OTHER - MIXED USE | 93,550 | $ | 22,655 | |||||
OTHER - COMMERCIAL | ||||||||
Bloomington 2000 W 94th Street - Bloomington, MN | 100,850 | $ | 3,997 | 100.0 | % | |||
Dakota West Plaza - Minot, ND | 16,921 | 615 | 52.3 | % | ||||
Fresenius - Duluth, MN | 9,052 | 1,572 | 100.0 | % | ||||
Minot 1400 31st Ave - Minot, ND | 48,960 | 11,591 | 76.3 | % | ||||
Minot 2505 16th Street SW - Minot, ND | 15,000 | 2,318 | — | % | ||||
Minot Arrowhead - Minot, ND | 81,594 | 8,902 | 92.4 | % | ||||
Minot IPS - Minot, ND | 27,698 | 6,368 | 100.0 | % | ||||
Minot Southgate Retail - Minot, ND | 7,849 | 1,925 | 39.1 | % | ||||
Woodbury 1865 Woodlane - Woodbury, MN | 69,600 | 3,400 | 100.0 | % | ||||
TOTAL OTHER - COMMERCIAL | 377,524 | $ | 40,688 | |||||
UNIMPROVED LAND | ||||||||
Badger Hills - Rochester, MN | $ | 1,404 | ||||||
Creekside Crossing - Bismarck, ND | 4,270 | |||||||
Grand Forks - Grand Forks, ND | 2,800 | |||||||
Minot 1525 24th Ave SW - Minot, ND | 506 | |||||||
Rapid City Unimproved- Rapid City, SD | 1,376 | |||||||
Renaissance Heights - Williston, ND(2) | 750 | |||||||
Weston - Weston, WI | 370 | |||||||
TOTAL UNIMPROVED LAND | $ | 11,476 | ||||||
TOTAL APARTMENT HOMES | 14,176 | |||||||
TOTAL SQUARE FOOTAGE - OTHER | 471,074 | |||||||
TOTAL REAL ESTATE INVESTMENTS, EXCLUDING MORTGAGE NOTES RECEIVABLE | $ | 1,681,240 | ||||||
(1) | Encumbered by mortgage debt. |
(2) | Owned by a joint venture entity and consolidated in our financial statements. We have an approximately 52.6% ownership in 71 France, 64.1% ownership in Commons & Landing at Southgate, 86.1% ownership in Cypress Court, 87.1% ownership in Renaissance Heights, 70% ownership in Renaissance Heights Unimproved and 69.6% ownership in Williston Garden. |
(3) | Non-same-store for the comparison of fiscal years 2018 and 2017. Refer to Item 7 for definition of non-same-store. |
(4) | Non-same-store for the comparison of fiscal years 2017 and 2016. |
19
Properties by State
The following table presents, as of April 30, 2018, the total amount of property owned, net of accumulated depreciation, by state:
(in thousands) | ||||||||||||
State | Multifamily | Other | Total | % of Total | ||||||||
Minnesota | $ | 557,280 | $ | 20,660 | $ | 577,940 | 42.5 | % | ||||
North Dakota | 330,537 | 25,836 | 356,373 | 26.3 | % | |||||||
Colorado | 215,549 | — | 215,549 | 15.9 | % | |||||||
Nebraska | 84,530 | — | 84,530 | 6.2 | % | |||||||
South Dakota | 49,290 | — | 49,290 | 3.6 | % | |||||||
Kansas | 38,309 | — | 38,309 | 2.8 | % | |||||||
Montana | 26,802 | — | 26,802 | 2.0 | % | |||||||
Iowa | 9,647 | — | 9,647 | 0.7 | % | |||||||
Total | $ | 1,311,944 | $ | 46,496 | $ | 1,358,440 | 100.0 | % | ||||
Item 3. Legal Proceedings
In the ordinary course of our operations, we become involved in litigation. At this time, we know of no material pending or threatened legal proceedings, or other proceedings contemplated by governmental authorities, that would have a material impact upon us.
Item 4. Mine Safety Disclosures
Not Applicable
20
PART II
Item 5. Market for Registrant’s Common Equity, Related Stockholder Matters, and Issuer Purchases of Equity Securities
Quarterly Share and Distribution Data
Our common shares of beneficial interest trade on the NYSE under the symbol “IRET.” The following table shows the high and low sales prices for our common shares for the periods indicated, as reported by the NYSE, and the distributions per common share and limited partnership unit declared with respect to each period.
Distributions Declared | ||||||||||
Quarter Ended | High | Low | (per share and unit) | |||||||
April 30, 2018 | $ | 5.58 | $ | 4.65 | $ | 0.07 | ||||
January 31, 2018 | 6.06 | 5.52 | 0.07 | |||||||
October 31, 2017 | 6.32 | 5.81 | 0.07 | |||||||
July 31, 2017 | 6.72 | 5.64 | 0.07 | |||||||
Distributions Declared | ||||||||||
Quarter Ended | High | Low | (per share and unit) | |||||||
April 30, 2017 | $ | 6.61 | $ | 5.67 | $ | 0.07 | ||||
January 31, 2017 | 7.20 | 5.81 | 0.13 | |||||||
October 31, 2016 | 6.67 | 5.67 | 0.13 | |||||||
July 31, 2016 | 6.63 | 6.01 | 0.13 | |||||||
We pay quarterly distributions to our common shareholders and unitholders, at the discretion of our Board of Trustees, based on our funds from operations, financial condition and capital requirements, annual distribution requirements under the REIT provisions of the Code, and such other factors as our Board of Trustees deems relevant. Since July 1, 1971, we have paid quarterly cash distributions in the months of January, April, July and October.
Shareholders
As of June 20, 2018, there were approximately 3,144 common shareholders of record.
Unregistered Sales of Shares
Under the terms of IRET Properties’ Agreement of Limited Partnership, limited partners have the right to require IRET Properties to redeem their limited partnership units for cash generally any time following the first anniversary of the date they acquired such units (“Exchange Right”). When a limited partner exercises the Exchange Right, we have the right, in our sole discretion, to redeem such units by either making a cash payment or exchanging the units for our common shares, on a one-for-one basis. The Exchange Right is subject to certain conditions and limitations, including that the limited partner may not exercise the Exchange Right more than two times during a calendar year and the limited partner may not exercise for less than 1,000 units, or, if such limited partner holds less than 1,000 units, for less than all of the units held by such limited partner. IRET Properties and some limited partners have contractually agreed to a holding period of greater than one year, a greater number of redemptions during a calendar year or other limitations to their Exchange Right.
During the fiscal years ended April 30, 2018, 2017, and 2016, respectively, we issued an aggregate of 28,924, 304,709, and 36,156 unregistered common shares to limited partners of IRET Properties upon exercise of their Exchange Rights for an equal number of units. All such issuances of our common shares were exempt from registration as private placements under Section 4(a)(2) of the Securities Act, including Regulation D promulgated thereunder. We have registered the resale of such common shares under the Securities Act.
21
Issuer Purchases of Equity Securities
Maximum Dollar | |||||||||||
Total Number of Shares | Amount of Shares That | ||||||||||
Total Number of | Average Price | Purchased as Part of | May Yet Be Purchased | ||||||||
Shares and Units | Paid per | Publicly Announced | Under the Plans or | ||||||||
Period | Purchased(1) | Share and Unit | Plans or Programs | Programs(2) | |||||||
May 1 - 31, 2017 | 1,010,613 | $ | 5.81 | 601,425 | $ | 42,032,798 | |||||
June 1 - 30, 2017 | 225,844 | 5.95 | 47,178 | 41,758,230 | |||||||
July 1 - 31, 2017 | 405,808 | 6.01 | 33,755 | 41,562,451 | |||||||
August 1 - 31, 2017 | 23,622 | 6.23 | — | 41,562,451 | |||||||
September 1 - 30, 2017 | 332,249 | 5.82 | 316,249 | 39,722,239 | |||||||
October 1 - 31, 2017 | 81,839 | 5.80 | 81,839 | 39,245,936 | |||||||
November 1 - 30, 2017 | 165,972 | 5.83 | 151,604 | 38,363,643 | |||||||
December 1 - 31, 2017 | 73,286 | 5.97 | — | 38,363,643 | |||||||
January 1 - 31, 2018 | 362,228 | 5.71 | — | 38,363,643 | |||||||
March 1 - 31, 2018 | 321,519 | 4.99 | 288,526 | 36,921,432 | |||||||
April 1 - 30, 2018 | 265,788 | 5.21 | 259,333 | 35,563,523 | |||||||
Total | 3,268,768 | $ | 5.71 | 1,779,909 | |||||||
(1) | Includes 16,153 shares surrendered to us by employees in satisfaction of tax withholding obligations associated with the vesting of restricted shares. |
(2) | As disclosed in our Form 10-Q for the fiscal quarter ended January 31, 2018, represents amounts outstanding under our $50,000,000 share repurchase program, which was authorized by our Board of Trustees on December 7, 2016 and reauthorized on December 5, 2017 and expires after a one year period. |
Comparative Stock Performance
The information contained in this Comparative Stock Performance section shall not be deemed to be “soliciting material” or “filed” or incorporated by reference into our future filings with the SEC, or subject to the liabilities of Section 18 of the Exchange Act, except to the extent that we specifically incorporate it by reference into a document filed under the Securities Act or the Exchange Act.
Set forth below is a graph that compares, for the five fiscal years commencing May 1, 2013, and ending April 30, 2018, the cumulative total returns for our common shares with the comparable cumulative total return of two indexes, the Standard & Poor’s 500 Index (“S&P 500”) and the FTSE NAREIT Equity REITs Index, the latter of which is an index prepared by the FTSE Group for the National Association of Real Estate Investment Trusts, which includes all tax-qualified equity REITs listed on the NYSE and the NASDAQ Market.
The performance graph assumes that at the close of trading on April 30, 2013, the last trading day of fiscal year 2013, $100 was invested in our common shares and in each of the indexes. The comparison assumes the reinvestment of all distributions. Cumulative total shareholder returns for our common shares, the S&P 500, and the FTSE NAREIT Equity REITs Index are based on our fiscal year ending April 30.
22
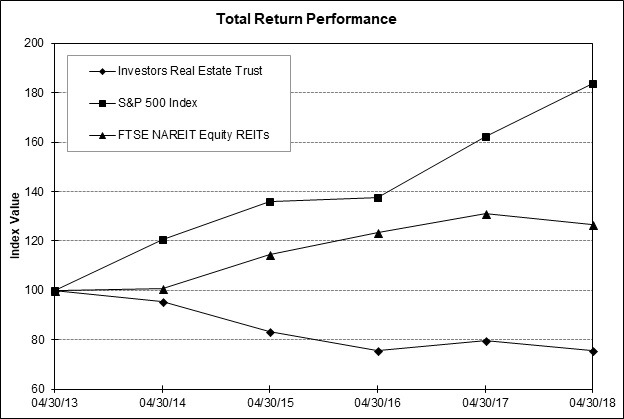
Period Ending | ||||||||||||
Index | 4/30/2013 | 4/30/2014 | 4/30/2015 | 4/30/2016 | 4/30/2017 | 4/30/2018 | ||||||
Investors Real Estate Trust | 100.00 | 95.31 | 83.51 | 75.48 | 79.70 | 75.53 | ||||||
S&P 500 Index | 100.00 | 120.44 | 136.07 | 137.71 | 162.39 | 183.93 | ||||||
FTSE NAREIT Equity REITs | 100.00 | 100.87 | 114.38 | 123.37 | 131.05 | 126.77 | ||||||
Source: S&P Global Market Intelligence
23
Item 6. Selected Financial Data
Set forth below is selected financial data on a historical basis for the five most recent fiscal years ended April 30. This information should be read in conjunction with the consolidated financial statements and notes appearing elsewhere in this Annual Report on Form 10-K.
(in thousands, except per share data) | ||||||||||||||||
2018 | 2017 | 2016 | 2015 | 2014 | ||||||||||||
Consolidated Income Statement Data | ||||||||||||||||
Revenue | $ | 169,745 | $ | 160,104 | $ | 145,500 | $ | 141,294 | $ | 127,124 | ||||||
Impairment of real estate investments in continuing and discontinued operations | 18,065 | 57,028 | 5,983 | 6,105 | 44,426 | |||||||||||
Gain (loss) on debt extinguishment in continuing and discontinued operations | (7,448 | ) | (4,889 | ) | 29,230 | — | — | |||||||||
Gain on sale of discontinued operations and real estate and other investments | 183,687 | 74,847 | 33,422 | 6,093 | 6,948 | |||||||||||
Income (loss) from continuing operations | (37,194 | ) | (46,228 | ) | 9,182 | 10,237 | (2,003 | ) | ||||||||
Income (loss) from discontinued operations | 164,823 | 76,753 | 67,420 | 18,447 | (14,937 | ) | ||||||||||
Net income (loss) | (127,629 | ) | 30,525 | 76,602 | 28,684 | (16,940 | ) | |||||||||
Net (income) loss attributable to noncontrolling interests – Operating Partnership | (12,702 | ) | (4,059 | ) | (7,032 | ) | (1,526 | ) | 4,676 | |||||||
Net income (loss) attributable to Investors Real Estate Trust | (116,788 | ) | 43,347 | 72,006 | 24,087 | (13,174 | ) | |||||||||
Consolidated Balance Sheet Data | ||||||||||||||||
Total real estate investments | 1,380,245 | 1,121,385 | 1,204,654 | 1,057,356 | 910,077 | |||||||||||
Total assets | 1,426,658 | 1,474,514 | 1,755,022 | 1,992,092 | 1,862,990 | |||||||||||
Mortgages payable | 509,919 | 565,978 | 648,173 | 453,928 | 462,380 | |||||||||||
Revolving lines of credit | 124,000 | 57,050 | 17,500 | 60,500 | 22,500 | |||||||||||
Term loan | 69,514 | — | — | — | — | |||||||||||
Total Investors Real Estate Trust shareholders’ equity | 613,409 | 560,937 | 618,758 | 652,110 | 592,184 | |||||||||||
Consolidated Per Common Share Data (basic and diluted) | ||||||||||||||||
Loss from continuing operations – Investors Real Estate Trust | $ | (0.36 | ) | $ | (0.30 | ) | $ | — | $ | (0.04 | ) | $ | (0.11 | ) | ||
Income (loss) from discontinued operations – Investors Real Estate Trust | $ | 1.23 | $ | 0.56 | $ | 0.49 | $ | 0.15 | $ | (0.12 | ) | |||||
Net income (loss) | $ | 0.87 | $ | 0.26 | $ | 0.49 | $ | 0.11 | $ | (0.23 | ) | |||||
Distributions | $ | 0.28 | $ | 0.46 | $ | 0.52 | $ | 0.52 | $ | 0.52 | ||||||
CALENDAR YEAR | 2017 | 2016 | 2015 | 2014 | 2013 | ||||||
Tax status of distributions | |||||||||||
Capital gain | 48.87 | % | 87.57 | % | 11.99 | % | 23.09 | % | 3.09 | % | |
Ordinary income | 14.59 | % | 12.43 | % | 36.28 | % | 25.74 | % | 28.41 | % | |
Return of capital | 36.54 | % | — | 51.73 | % | 51.17 | % | 68.50 | % | ||
For the fiscal year ended April 30, 2018, we recognized approximately $42 million of net capital gain for federal income tax purposes. We designate the entire $42 million of net capital gain as capital gain dividends.
24
Item 7. Management’s Discussion and Analysis of Financial Condition and Results of Operations
The following discussion and analysis should be read in conjunction with the consolidated financial statements and notes appearing elsewhere in this report. Historical results and trends which might appear in the consolidated financial statements should not be interpreted as being indicative of future operations.
We consider this and other sections of this Report to contain forward-looking statements within the meaning of Section 27A of the Securities Act of 1933, as amended, and Section 21E of the Exchange Act, with respect to our expectations for future periods. Forward-looking statements do not discuss historical fact, but instead include statements related to expectations, projections, intentions or other items related to the future.
Executive Summary
We own, manage, acquire, redevelop, and develop apartment communities. We primarily focus on investing in markets characterized by stable and growing economic conditions, strong employment, and an attractive quality of life that we believe, in combination, lead to higher demand for our apartment homes and retention of our residents. As of April 30, 2018, we owned interests in 90 apartment communities consisting of 14,176 apartment homes as detailed in Item 2 - Properties. Total cost of property owned was $1.7 billion at April 30, 2018, compared to $1.4 billion at April 30, 2017.
Renting apartment homes is our primary source of revenue, and our business objective is to provide great homes. We strive to maximize resident satisfaction and retention by investing in high-quality assets in desirable locations and creating vibrant apartment communities through service-oriented operations. We believe that delivering superior resident experiences will drive consistent profitability for our shareholders. We have paid quarterly distributions continuously since our first distribution in 1971.
Fiscal 2018 Significant Events and Transactions
During fiscal year 2018, we successfully completed the following significant transactions, including acquisition, disposition and financing transactions, and experienced the following significant events:
• | Substantially completed our transformation into a multifamily company by selling 50 commercial and other non-core multifamily properties for an aggregate sales price of $515.1 million. We used a portion of the proceeds from these sales to purchase four apartment communities with 1,355 homes for $373.1 million. |
• | Issued 4,118,460 shares of 6.625% Series C preferred shares for gross proceeds of $103.0 million and redeemed all 4,600,000 shares of 7.95% Series B preferred shares for an aggregate cost, including accrued dividends, of $115.8 million, which will result in a reduction of $2.3 million in annual preferred dividend payments. |
• | Increased the commitments to our unsecured line of credit by $50 million to a current total of $300 million. Closed a $70 million unsecured term loan and executed a swap agreement to synthetically fix the interest rate for the full duration of the loan. Closed a $6.0 million operating line of credit. |
• | Established a new senior management team to complete the portfolio transition and continue the operational improvements and added two new trustees to enhance corporate governance. |
Implementation of our Strategic Plan; Acquisitions and Dispositions:
In June 2016, we announced our intention to transition to a multifamily REIT and sell our remaining commercial properties. In furtherance of this strategic plan, during fiscal year 2018, we sold 28 medical office properties, our remaining 2 senior housing properties, 5 other commercial properties and 1 parcel of unimproved land for a total sales price of approximately $496.2 million, compared to dispositions of $283.4 million for fiscal year 2017. During fiscal year 2018, we added $373.1 million of new apartment communities to our portfolio through property acquisitions.
Share Repurchase Program:
As described in further detail under "Financial Condition" below, on December 7, 2016, our Board of Trustees authorized a share repurchase program to repurchase up to $50 million of our common shares and/or Series B preferred shares over a one-year period. On December 5, 2017, our Board of Trustees reauthorized this share repurchase program for common shares for an additional one-year period. During the fiscal year ended April 30, 2018, we repurchased approximately 1.8 million common shares for an aggregate cost of $9.9 million, including commissions, at an average price per share of $5.56, excluding
25
commissions. As of April 30, 2018, $35.6 million remained available under the $50 million authorized share repurchase program.
Redemption of Series B Preferred Shares:
On September 20, 2017, our Board of Trustees authorized the redemption of all of the Series B preferred shares. On September 29, 2017, we delivered notice to holders of the Series B preferred shares that we intended to redeem all 4,600,000 Series B preferred shares at a redemption price equal to $25.00 per share plus any accrued but unpaid distributions per share up to and including the redemption date of October 30, 2017. On October 30, 2017, we completed the redemption of the Series B preferred shares for an aggregate redemption price of $115.0 million, and such shares are no longer deemed outstanding as of such date and were delisted from trading on the NYSE.
Credit Agreement:
In January 2017, our Operating Partnership entered into a credit agreement for a new unsecured, variable interest rate line of credit with BMO Harris Bank N.A. as lead agent bank and book runner (the “Line of Credit”). The Line of Credit has a termination date of January 31, 2021, which may be extended for an additional one-year period subject to the satisfaction of certain conditions. In fiscal year 2018, we amended the Line of Credit to increase commitments from $250.0 million to $300.0 million and also entered into a $70.0 million unsecured term loan and a $6.0 operating line of credit. The maximum borrowing capacity under the Line of Credit is based on the value of an unencumbered asset pool (“UAP”) that secures both the Line of Credit and the unsecured term loan. The UAP may not consist of less than 15 properties that meet certain eligibility criteria, and eligible properties may be added and removed from the UAP, subject to the satisfaction of certain conditions. The UAP provided for a borrowing capacity under the Line of Credit of approximately $300.0 million as of April 30, 2018, offering additional borrowing availability of $176.0 million beyond the $124.0 million drawn at an interest rate of 3.66% as of April 30, 2018. At April 30, 2017, the line of credit borrowing capacity was $206.0 million based on the UAP, of which $57.1 million was drawn on the line.
During the quarter ended January 31, 2018, we entered into a $70.0 million unsecured term loan that matures on January 31, 2023. In addition, we increased the credit capacity of our revolving Line of Credit to $300.0 million, and maintain a $200.0 million accordion option that can be accessed by increasing our lending commitments under the current agreement.
The Line of Credit is guaranteed, jointly and severally, by us, the general partner of our Operating Partnership, and each subsidiary that owns a UAP property. Borrowings under the Line of Credit accrue interest at a rate based either on a margin percentage over the lender’s base rate, ranging from 0.6% to 1.25%, or on a margin percentage over LIBOR, ranging from 1.6% to 2.25%, based on our total leverage ratio. The line also requires the payment of customary fees and contains covenants, representations, warranties, and events of default customary for credit facilities of this type, including a covenant on a fiscal quarterly-end basis that the consolidated leverage ratio will not be greater than 0.60 to 1.00. As of April 30, 2018, participants included the following financial institutions: BMO Harris Bank N.A., KeyBank, National Association, PNC Bank, National Association, Royal Bank of Canada, U.S. Bank National Association, Associated Bank, National Association, Bank of North Dakota and Raymond James Bank, N.A.; with KeyBank, National Association and PNC Bank, National Association as syndication agents and BMO Capital Markets Corp., Keybanc Capital Markets Inc. and PNC Capital Markets, LLC as joint lead arrangers and joint book runners.
Operating LOC:
On March 20, 2018, we closed on a $6.0 million operating line of credit with Wells Fargo Bank. This operating line of credit will be utilized to enhance treasury management activities and more effectively manage cash balances. The operating line has a one-year term, with pricing based on a market spread plus the one-month LIBOR index rate. As of April 30, 2018, we had $6.0 million available under this line.
Changes in our Board of Trustees:
On January 8, 2018, trustee John D. Stewart notified our Board of Trustees that he was resigning, effective immediately, from the Board and all committees of the Board. On February 15, 2018, the Board of Trustees appointed Emily Nagle Green and Mary J. Twinem as trustees, whose terms of office expire at the 2018 Annual Meeting of Shareholders and until their successors are elected and qualified. The Board determined that both Ms. Green and Ms. Twinem qualify as "independent directors" in accordance with the listing standards of the New York Stock Exchange.
26
Market Conditions and Outlook
The demand for investment and institutional quality real estate in our markets is strong. Investors have abundant equity and access to debt to facilitate acquisitions and developments, although anecdotally we sense that development capital, particularly debt capital, is moderating due, in part, to heightened supply concerns in certain areas. Prices and sale volumes remain strong. Despite recent increases in Treasury rates, capitalization rates have remained at pre-Treasury rate increase levels and, in some cases, have continued experiencing compression. Multifamily fundamentals remain strong in our markets.
We experienced generally stable trends across most of our apartment investments during the quarter ended April 30, 2018. Our ability to maintain occupancy levels and raise rents remains dependent on continued healthy employment and wage growth. We continue to observe considerable apartment community development activity in our markets, and as this new construction is completed, we will experience increased competition for residents. Many existing apartment owners of modestly older properties are making significant upgrades to their apartment homes and raising rents.
RESULTS OF OPERATIONS
Consolidated Results of Operations
The discussion that follows is based on our consolidated results of operations for the fiscal years ended April 30, 2018, 2017 and 2016.
(in thousands) | ||||||||||||||||||||
Year Ended April 30, | 2018 vs. 2017 | 2017 vs. 2016 | ||||||||||||||||||
2018 | 2017 | 2016 | $ Change | % Change | $ Change | % Change | ||||||||||||||
REVENUE | $ | 169,745 | $ | 160,104 | $ | 145,500 | $ | 9,641 | 6.0 | % | $ | 14,604 | 10.0 | % | ||||||
Property operating expenses, excluding real estate taxes | 54,292 | 47,587 | 43,741 | 6,705 | 14.1 | % | 3,846 | 8.8 | % | |||||||||||
Real estate taxes | 18,742 | 16,739 | 14,407 | 2,003 | 12.0 | % | 2,332 | 16.2 | % | |||||||||||
Property management expense | 5,526 | 5,046 | 3,714 | 480 | 9.5 | % | 1,332 | 35.9 | % | |||||||||||
Casualty loss | 500 | 414 | 238 | 86 | 20.8 | % | 176 | 73.9 | % | |||||||||||
Depreciation and amortization | 82,070 | 44,253 | 39,273 | 37,817 | 85.5 | % | 4,980 | 12.7 | % | |||||||||||
Impairment of real estate investments | 18,065 | 57,028 | 5,543 | (38,963 | ) | (68.3 | )% | 51,485 | 928.8 | % | ||||||||||
General and administrative expenses | 14,203 | 15,871 | 13,498 | (1,668 | ) | (10.5 | )% | 2,373 | 17.6 | % | ||||||||||
Acquisition and investment related costs | 51 | 3,276 | 830 | (3,225 | ) | (98.4 | )% | 2,446 | 294.7 | % | ||||||||||
TOTAL EXPENSES | 193,449 | 190,214 | 121,244 | 3,235 | 1.7 | % | 68,970 | 56.9 | % | |||||||||||
Operating income (loss) | (23,704 | ) | (30,110 | ) | 24,256 | 6,406 | (21.3 | )% | (54,366 | ) | (224.1 | )% | ||||||||
Interest expense | (34,178 | ) | (34,314 | ) | (28,417 | ) | 136 | (0.4 | )% | (5,897 | ) | 20.8 | % | |||||||
Loss on extinguishment of debt | (940 | ) | (1,651 | ) | (106 | ) | 711 | (43.1 | )% | (1,545 | ) | 1,457.5 | % | |||||||
Interest income | 1,197 | 366 | 78 | 831 | 227.0 | % | 288 | 369.2 | % | |||||||||||
Other income | 311 | 780 | 307 | (469 | ) | (60.1 | )% | 473 | 154.1 | % | ||||||||||
Income (loss) before gain on sale of real estate and other investments and income from discontinued operations | (57,314 | ) | (64,929 | ) | (3,882 | ) | 7,615 | (11.7 | )% | (61,047 | ) | 1,572.6 | % | |||||||
Gain on sale of real estate and other investments | 20,120 | 18,701 | 9,640 | 1,419 | 7.6 | % | 9,061 | 94.0 | % | |||||||||||
Gain on bargain purchase | — | — | 3,424 | — | — | (3,424 | ) | (100.0 | )% | |||||||||||
Income (loss) from continuing operations | (37,194 | ) | (46,228 | ) | 9,182 | 9,034 | (19.5 | )% | (55,410 | ) | (603.5 | )% | ||||||||
Income from discontinued operations | 164,823 | 76,753 | 67,420 | 88,070 | 114.7 | % | 9,333 | 13.8 | % | |||||||||||
NET INCOME | 127,629 | 30,525 | 76,602 | 97,104 | 318.1 | % | (46,077 | ) | (60.2 | )% | ||||||||||
Net (income) loss attributable to noncontrolling interests – Operating Partnership | (12,702 | ) | (4,059 | ) | (7,032 | ) | (8,643 | ) | 212.9 | % | 2,973 | (42.3 | )% | |||||||
Net (income) loss attributable to noncontrolling interests – consolidated real estate entities | 1,861 | 16,881 | 2,436 | (15,020 | ) | (89.0 | )% | 14,445 | 593.0 | % | ||||||||||
Net income attributable to Investors Real Estate Trust | 116,788 | 43,347 | 72,006 | 73,441 | 169.4 | % | (28,659 | ) | (39.8 | )% | ||||||||||
Dividends to preferred shareholders | (8,569 | ) | (10,546 | ) | (11,514 | ) | 1,977 | (18.7 | )% | 968 | (8.4 | )% | ||||||||
Redemption of Preferred Shares | (3,657 | ) | (1,435 | ) | — | (2,222 | ) | 154.8 | % | (1,435 | ) | — | ||||||||
NET INCOME AVAILABLE TO COMMON SHAREHOLDERS | $ | 104,562 | $ | 31,366 | $ | 60,492 | $ | 73,196 | 233.4 | % | $ | (29,126 | ) | (48.1 | )% | |||||
27
Revenue. Revenue increased by 6.0% to $169.7 million in fiscal year 2018, compared to $160.1 million in fiscal year 2017, primarily due to apartment communities acquired during fiscal year 2018 and improved performance at same-store apartment communities. Revenue increased by 10.0% to $160.1 million in fiscal year 2017, compared to $145.5 million in fiscal year 2016, primarily due to apartment communities acquired and developments placed into service during fiscal year 2016.
For fiscal year 2018, the increase in revenue of $9.6 million resulted from:
(in thousands) | |||
Increase in revenue from non-same-store apartment communities | $ | 14,876 | |
Increase in revenue from same-store apartment communities | 5,164 | ||
Decrease in revenue from other properties and dispositions | (10,399 | ) | |
Net increase in revenue | $ | 9,641 | |
For fiscal year 2017, the increase in revenue of $14.6 million resulted from:
(in thousands) | |||
Increase in revenue from non-same-store apartment communities | $ | 14,896 | |
Decrease in revenue from same-store apartment communities | (1,731 | ) | |
Increase in revenue from other properties and dispositions | 1,439 | ||
Net increase in revenue | $ | 14,604 | |
Property operating expenses, excluding real estate taxes. Property operating expenses, excluding real estate taxes, increased by 14.1% to $54.3 million in fiscal year 2018 compared to $47.6 million in fiscal year 2017. $3.7 million of the increase was attributable to non-same-store apartment communities, while expenses at same-store communities increased by $4.0 million and were offset by a $1.0 million decrease from other properties and dispositions.
Property operating expenses, excluding real estate taxes, increased by 8.8% to $47.6 million in fiscal year 2017 compared to $43.7 million in fiscal year 2016. $3.0 million of the increase was attributable to non-same-store apartment communities and other properties, while expenses at same-store communities increased by $803,000.
Real Estate Taxes. Real estate taxes increased by 12.0% to $18.7 million in fiscal year 2018 compared to $16.7 million in fiscal year 2017. An increase of $2.0 million was attributable to non-same-store apartment communities and same-store communities saw an increase of $888,000 compared to the prior fiscal year, which was offset by a decrease of $870,000 from other properties and dispositions.
Real estate taxes increased by 16.2% to $16.7 million in fiscal year 2017 compared to $14.4 million in fiscal year 2016. An increase of $2.1 million was attributable to the non-same-store apartment communities, while the remaining increase of $219,000 was attributable to same-store apartment communities, other properties, and dispositions.
Property management expense. Property management expense increased by 9.5% to $5.5 million in fiscal year 2018 compared to $5.0 million in fiscal year 2017, primarily due to technology initiatives and an increase in the average apartment homes under management.
Property management expense increased by 35.9% to $5.0 million in fiscal year 2017 compared to $3.7 million in fiscal year 2016, primarily due to the reallocation of fixed costs after the sale of our office and retail portfolios.
Depreciation and Amortization. Depreciation and amortization increased by 85.5% to $82.1 million in fiscal year 2018, compared to $44.3 million in fiscal year 2017. This increase was primarily due to a change in the estimated useful lives of our real estate assets. See Note 2 to our consolidated financial statements contained in this Annual Report on Form 10-K for additional information.
Depreciation and amortization increased by 12.7% to $44.3 million in fiscal year 2017, compared to $39.3 million in fiscal year 2016. This increase was primarily attributable to the addition of depreciable assets from acquisitions, development projects placed in service, and capital expenditures during fiscal years 2017 and 2016.
28
Impairment of Real Estate Investments. During fiscal years 2018, 2017, and 2016, we incurred impairment losses of $18.1 million, $57.0 million, and $5.5 million, respectively, in continuing operations. See Note 2 to our consolidated financial statements contained in this Annual Report on Form 10-K for additional information.
General and Administrative Expenses. General and administrative expenses decreased by 10.5% to $14.2 million in fiscal year 2018, compared to $15.9 million in fiscal year 2017, primarily due to decreased salary and benefit costs of $2.3 million related to a reduction in full time equivalent employees, but partially offset by transition costs of $951,000.
General and administrative expenses increased by 17.6% to $15.9 million in fiscal year 2017, compared to $13.5 million in fiscal year 2016. This increase was primarily a result of transition and severance costs, an increase in health insurance costs, and increased legal and consulting expenses.
Acquisition and Investment Related Costs. Acquisition and investment related costs in fiscal years 2018, 2017, and 2016 were $51,000, $3.3 million, and $830,000, respectively, and varied based on the write-off of development pursuit costs in each year.
Interest Expense. Interest expense decreased 0.4% to $34.2 million in fiscal year 2018, compared to $34.3 million in fiscal year 2017, due to a decrease in the average balance of our outstanding indebtedness and changes in variable rates.
Interest expense increased 20.8% to $34.3 million in fiscal year 2017, compared to $28.4 million in fiscal year 2016, primarily due to an increase in the average balance of our outstanding indebtedness.
Loss on Extinguishment of Debt. We recorded loss on extinguishment of debt in fiscal years 2018, 2017 and 2016 of $940,000, $1.7 million, and $106,000, respectively, due to prepayment penalties associated with the disposal of assets and the write-off of unamortized loan costs.
Interest Income and Other Income. We recorded interest income in fiscal years 2018, 2017, and 2016 of $1.2 million, $366,000 and $78,000, respectively. The increase from fiscal year 2017 to fiscal year 2018 was due to seller-financing associated with a disposition and funding a note receivable for a third-party apartment development. The increase in interest income from fiscal year 2016 to fiscal year 2017 was primarily due to interest earned on notes receivable from our joint venture partners.
Gain on Sale of Real Estate and Other Investments. In fiscal years 2018, 2017, and 2016, we recorded gains on sale of real estate and other investments in continuing operations of $20.1 million, $18.7 million and $9.6 million, respectively.
Income from Discontinued Operations. Income from discontinued operations in fiscal years 2018, 2017, and 2016 was $164.8 million, $76.8 million and $67.4 million, respectively. We realized a gain on sale of discontinued operations for fiscal years 2018, 2017, and 2016 of $163.6 million, $56.1 million and $23.8 million, respectively. See Note 10 of the Notes to Consolidated Financial Statements in this report for further information on discontinued operations.
Net Operating Income
Net Operating Income (“NOI”) is a non-GAAP measure which we define as total real estate revenues less property operating expenses and real estate tax expense combined (referred to as "Real estate expense"). We believe that NOI is an important supplemental measure of operating performance for a REIT’s operating real estate because it provides a measure of operations that is unaffected by depreciation, amortization, financing, and general and administrative expense. NOI does not represent cash generated by operating activities in accordance with GAAP and should not be considered an alternative to net income, net income available for common shareholders, or cash flow from operating activities as a measure of financial performance.
Throughout this Annual Report on Form 10-K, we have provided certain information on a same-store and non-same-store properties basis. Same-store properties are properties owned or in service for the entirety of the periods being compared, and, in the case of development or re-development properties, which have achieved a target level of occupancy of 90%. Effective for the comparison of fiscal years 2018 and 2017, sold properties and properties designated as held for sale are moved to Other. For the comparison of fiscal years 2017 and 2016, sold properties and properties designated as held for sale were moved to the non-same-store category.
This comparison allows us to evaluate the performance of existing properties and their contribution to net income. Management believes that measuring performance on a same-store property basis is useful to investors because it enables evaluation of how our properties are performing year over year. Management uses this measure to assess whether or not it has been successful in increasing net operating income, renewing the leases of existing tenants, controlling operating costs, and making prudent capital improvements. The discussion below focuses on the main factors affecting real estate revenue and real estate expenses
29
from same-store properties, since changes from one fiscal year to another in real estate revenue and expenses from non-same-store properties are due to the addition of those properties to our real estate portfolio, and accordingly provide less useful information for evaluating the ongoing operational performance of our real estate portfolio.
For the comparison of fiscal years ended April 30, 2018 and 2017, 12 apartment communities were non-same-store, of which seven were in-service development communities. For the comparison of fiscal years 2017 and 2016, 37 apartment communities were non-same-store, of which eight were in-service development communities and 22 were held for sale or sold. See Item 2 - Properties for the held for investment communities classified as non-same-store.
The following table of selected operating data reconciles NOI to net income and provides the basis for our discussion of NOI in fiscal years 2018, 2017, and 2016.
Year Ended April 30, | |||||||||||||||||||||||
2018 vs 2017 | 2017 vs 2016 | ||||||||||||||||||||||
2018 | 2017 | $ Change | % Change | 2017 | 2016 | $ Change | % Change | ||||||||||||||||
Revenue | |||||||||||||||||||||||
Same-store | $ | 126,415 | $ | 121,252 | $ | 5,163 | 4.3 | % | $ | 108,347 | $ | 110,078 | $ | (1,731 | ) | (1.6 | )% | ||||||
Non-same-store | 33,568 | 20,962 | 12,606 | 60.1 | % | 33,867 | 18,971 | 14,896 | 78.5 | % | |||||||||||||
Other properties and dispositions | 9,762 | 17,890 | (8,128 | ) | (45.4 | )% | 17,890 | 16,451 | 1,439 | 8.7 | % | ||||||||||||
Total | 169,745 | 160,104 | 9,641 | 6.0 | % | 160,104 | 145,500 | 14,604 | 10.0 | % | |||||||||||||
Real estate expenses | |||||||||||||||||||||||
Same-store | 56,773 | 51,862 | 4,911 | 9.5 | % | 46,988 | 46,099 | 889 | 1.9 | % | |||||||||||||
Non-same-store | 13,687 | 9,033 | 4,654 | 51.5 | % | 13,907 | 8,663 | 5,244 | 60.5 | % | |||||||||||||
Other properties and dispositions | 2,574 | 3,431 | (857 | ) | (25.0 | )% | 3,431 | 3,386 | 45 | 1.3 | % | ||||||||||||
Total | 73,034 | 64,326 | 8,708 | 13.5 | % | 64,326 | 58,148 | 6,178 | 10.6 | % | |||||||||||||
Net operating income | |||||||||||||||||||||||
Same-store | 69,642 | 69,390 | 252 | 0.4 | % | 61,359 | 63,979 | (2,620 | ) | (4.1 | )% | ||||||||||||
Non-same-store | 19,881 | 11,929 | 7,952 | 66.7 | % | 19,960 | 10,308 | 9,652 | 93.6 | % | |||||||||||||
Other properties and dispositions | 7,188 | 14,459 | (7,271 | ) | (50.3 | )% | 14,459 | 13,065 | 1,394 | 10.7 | % | ||||||||||||
Total | $ | 96,711 | $ | 95,778 | $ | 933 | 1.0 | % | $ | 95,778 | $ | 87,352 | $ | 8,426 | 9.6 | % | |||||||
Property management | (5,526 | ) | (5,046 | ) | (5,046 | ) | (3,714 | ) | |||||||||||||||
Casualty loss | (500 | ) | (414 | ) | (414 | ) | (238 | ) | |||||||||||||||
Depreciation/amortization | (82,070 | ) | (44,253 | ) | (44,253 | ) | (39,273 | ) | |||||||||||||||
Impairment of real estate investments | (18,065 | ) | (57,028 | ) | (57,028 | ) | (5,543 | ) | |||||||||||||||
General and administrative expenses | (14,203 | ) | (15,871 | ) | (15,871 | ) | (13,498 | ) | |||||||||||||||
Acquisition and investment related costs | (51 | ) | (3,276 | ) | (3,276 | ) | (830 | ) | |||||||||||||||
Interest expense | (34,178 | ) | (34,314 | ) | (34,314 | ) | (28,417 | ) | |||||||||||||||
Loss on debt extinguishment | (940 | ) | (1,651 | ) | (1,651 | ) | (106 | ) | |||||||||||||||
Interest and other income | 1,508 | 1,146 | 1,146 | 385 | |||||||||||||||||||
Income (loss) before gain on sale of real estate and other investments and income from discontinued operations | (57,314 | ) | (64,929 | ) | (64,929 | ) | (3,882 | ) | |||||||||||||||
Gain on sale of real estate and other investments | 20,120 | 18,701 | 18,701 | 9,640 | |||||||||||||||||||
Gain on bargain purchase | — | — | — | 3,424 | |||||||||||||||||||
Income (loss) from continuing operations | (37,194 | ) | (46,228 | ) | (46,228 | ) | 9,182 | ||||||||||||||||
Income from discontinued operations | 164,823 | 76,753 | 76,753 | 67,420 | |||||||||||||||||||
Net income | $ | 127,629 | $ | 30,525 | $ | 30,525 | $ | 76,602 | |||||||||||||||
30
Years Ended April 30 | |||||||||||
Occupancy (1) | 2018 | 2017 | 2017 | 2016 | |||||||
Same-store | 96.5 | % | 93.8 | % | 94.2 | % | 94.9 | % | |||
Non-same-store | 92.1 | % | 88.5 | % | 88.8 | % | 73.7 | % | |||
Total | 95.6 | % | 93.1 | % | 93.1 | % | 90.8 | % | |||
Number of Apartment Homes | 2018 | 2017 | 2017 | 2016 | |||||||
Same-store | 11,320 | 11,320 | 10,511 | 10,511 | |||||||
Non-same-store | 2,856 | 1,892 | 2,701 | 2,463 | |||||||
Total | 14,176 | 13,212 | 13,212 | 12,974 | |||||||
(1) | Occupancy represents the actual number of apartment homes leased divided by the total number of apartment homes at the end of the period. |
Revenue from same-store properties increased by 4.3% or $5.2 million in the twelve months ended April 30, 2018, compared to the same period in the prior fiscal year. Approximately 2.4% of the increase was due to higher occupancy and 1.9% of the increase was attributable to growth in average rental revenue.
Real estate expenses at same-store properties increased by 9.5% or $4.9 million in the twelve months ended April 30, 2018, compared to the same period in the prior fiscal year. The increase was primarily attributable to the previously disclosed change in our capitalization policies, additional costs related to increasing occupancy, and an increase in real estate tax levy rates in select markets.
Real estate revenue from same-store properties decreased by 1.6% or $1.7 million in the twelve months ended April 30, 2017, compared to the same period in the prior fiscal year. A decrease of $2.0 million was attributable to increased vacancy, primarily in our energy impacted markets of Williston, North Dakota and Minot, North Dakota. This decrease in revenue was offset by an increase of $1.1 million that was the result of a ratio utility billings system implemented in the current year to recapture tenant utility expenses.
Real estate expenses at same-store properties increased by 1.9% or $889,000 in the twelve months ended April 30, 2017, compared to the same period in the prior fiscal year. The primary factors were increased administrative and maintenance expenses of $810,000 and $911,000, respectively, due to increased labor costs and snow removal. These increases were offset by a decrease in insurance expenses of $267,000, due to a decrease in insurance premiums as well as a decrease in deductibles paid on insurance claims.
Acquisitions
We added $373.1 million in new apartment communities to our portfolio through acquisitions during fiscal year 2018, compared to no acquisitions in fiscal year 2017. The fiscal year 2018 acquisitions are detailed below.
Fiscal 2018 (May 1, 2017 to April 30, 2018)
(in thousands) | |||||||||||||||||
Form of | |||||||||||||||||
Total | Consideration | Investment Allocation | |||||||||||||||
Date | Acquisition | Intangible | |||||||||||||||
Acquisitions | Acquired | Cost | Cash | Land | Building | Assets | |||||||||||
Multifamily | |||||||||||||||||
191 homes - Oxbo - St. Paul, MN (1) | May 26, 2017 | $ | 61,500 | $ | 61,500 | $ | 5,809 | $ | 54,910 | $ | 781 | ||||||
500 homes - Park Place - Plymouth, MN | September 13, 2017 | 92,250 | 92,250 | 10,609 | 80,711 | 930 | |||||||||||
274 homes - Dylan - Denver, CO | November 28, 2017 | 90,600 | 90,600 | 12,155 | 77,249 | 1,196 | |||||||||||
390 homes - Westend - Denver, CO | March 28, 2018 | 128,700 | 128,700 | 25,525 | 102,101 | 1,074 | |||||||||||
Total Acquisitions | $ | 373,050 | $ | 373,050 | $ | 54,098 | $ | 314,971 | $ | 3,981 | |||||||
(1) | Property includes 11,477 square feet of retail space. |
31
Development Projects Placed in Service
We placed no development projects in service during fiscal year 2018, compared to $102.9 million in fiscal year 2017. The fiscal year 2017 development projects placed in service are detailed below.
Fiscal 2017 (May 1, 2016 to April 30, 2017)
(in thousands) | |||||||||||
Date Placed | Development | ||||||||||
Development Projects Placed in Service | in Service | Land | Building | Cost | |||||||
Multifamily | |||||||||||
241 homes - 71 France - Edina, MN(1) | May 1, 2016 | $ | 4,721 | $ | 67,641 | $ | 72,362 | ||||
202 homes - Monticello Crossings - Monticello, MN(2) | March 1, 2017 | $ | 1,734 | $ | 28,782 | $ | 30,516 | ||||
Total Development Projects Placed in Service | $ | 6,455 | $ | 96,423 | $ | 102,878 | |||||
(1) | Costs paid prior to fiscal year 2017 totaled $70.9 million. Additional costs incurred in fiscal year 2017 totaled $1.5 million, for a total project cost at April 30, 2017 of $72.4 million. The project is owned by a joint venture entity in which we currently have an approximately 52.6% interest. The joint venture is consolidated in our financial statements. |
(2) | Costs paid prior to fiscal year 2017 totaled $15.5 million. Additional costs incurred in fiscal year 2017 totaled $15.0 million, for a total project cost at April 30, 2017 of $30.5 million. |
Dispositions
During fiscal year 2018 we sold 15 apartment communities, 2 senior housing properties, 28 medical office properties, 5 commercial properties, and 2 parcels of unimproved land for a total sales price of $515.1 million, compared to dispositions totaling $286.9 million in fiscal year 2017. The fiscal year 2018 and 2017 dispositions are detailed below.
Fiscal 2018 (May 1, 2017 to April 30, 2018)
(in thousands) | ||||||||||||||
Date | Book Value | |||||||||||||
Dispositions | Disposed | Sales Price | and Sales Cost | Gain/(Loss) | ||||||||||
Multifamily | ||||||||||||||
327 homes - 13 apartment communities - Minot, ND (1)(2) | August 22, 2017 | $ | 12,263 | $ | 11,562 | $ | 701 | |||||||
48 homes - Crown - Rochester, MN | December 1, 2017 | 5,700 | 3,318 | 2,382 | ||||||||||
16 homes - Northern Valley - Rochester, MN | December 1, 2017 | 950 | 690 | 260 | ||||||||||
$ | 18,913 | $ | 15,570 | $ | 3,343 | |||||||||
Other | ||||||||||||||
4,998 sq ft Minot Southgate Wells Fargo Bank - Minot, ND | May 15, 2017 | $ | 3,440 | $ | 3,332 | $ | 108 | |||||||
90,260 sq ft Lexington Commerce Center - Eagan, MN | August 22, 2017 | 9,000 | 3,963 | 5,037 | ||||||||||
17,640 sq ft Duckwood Medical - Eagan, MN | August 24, 2017 | 2,100 | 1,886 | 214 | ||||||||||
279,834 sq ft Edgewood Vista Hermantown I & II - Hermantown, MN | October 19, 2017 | 36,884 | 24,697 | 12,187 | ||||||||||
518,161 sq ft Urbandale - Urbandale, IA | November 22, 2017 | 16,700 | 12,857 | 3,843 | ||||||||||
36,053 sq ft 3075 Long Lake Road - Roseville, MN | November 28, 2017 | 18,650 | 12,766 | 5,884 | ||||||||||
1,205,432 sq ft 25 Healthcare properties (3)(4) | December 29, 2017 | 370,268 | 232,778 | 137,490 | ||||||||||
43,404 sq ft Garden View - St. Paul, MN | January 19, 2018 | 14,000 | 6,191 | 7,809 | ||||||||||
52,116 sq ft Ritchie Medical - St. Paul, MN | January 19, 2018 | 16,500 | 10,419 | 6,081 | ||||||||||
22,187 sq ft Bismarck 715 East Broadway and Unimproved Land - Bismarck, ND | March 7, 2018 | 5,500 | 3,215 | 2,285 | ||||||||||
$ | 493,042 | $ | 312,104 | $ | 180,938 | |||||||||
Unimproved Land | ||||||||||||||
Bismarck 4916 Unimproved Land - Bismarck, ND | August 8, 2017 | 3,175 | 3,188 | (13 | ) | |||||||||
Total Dispositions | $ | 515,130 | $ | 330,862 | $ | 184,268 | ||||||||
(1) | These communities include: 4th Street 4 Plex, 11th Street 3 Plex, Apartments on Main, Brooklyn Heights, Colton Heights, Fairmont, First Avenue (Apartments and Office), Pines, Southview, Summit Park, Temple (includes 17 South Main Retail), Terrace Heights, and Westridge. |
(2) | $626,000 of the gain on sale was deferred. See Note 2 for additional information on the related mortgage note receivable. |
(3) | The properties included: 2800 Medical, 2828 Chicago Avenue, Airport Medical, Billings 2300 Grand Road, Burnsville 303 Nicollet Medical, Burnsville 305 Nicollet Medical, Duluth Denfeld Clinic, Edina 6363 France Medical, Edina 6405 France Medical, Edina 6517 Drew Avenue, Edina 6225 France SMC II, Edina 6545 France SMC I, Gateway Clinic, High Pointe Health Campus, Lakeside Medical Plaza, Mariner Clinic, Minneapolis 701 25th Avenue Medical, Missoula 3050 Great Northern, Park Dental, Pavilion I, Pavilion II, PrairieCare Medical, St. Michael Clinic, Trinity at Plaza 16 and Wells Clinic. |
(4) | Sale price includes $2.5 million that was deposited into escrow pending the resolution of certain post-closing items. As of April 30, 2018 these items had not yet been resolved. |
32
Fiscal 2017 (May 1, 2016 to April 30, 2017)
(in thousands) | ||||||||||||||
Date | Book Value | |||||||||||||
Dispositions | Disposed | Sales Price | and Sales Cost | Gain/(Loss) | ||||||||||
Multifamily | ||||||||||||||
24 unit Pinecone Villas - Sartell, MN | April 20, 2017 | $ | 3,540 | $ | 2,732 | $ | 808 | |||||||
Healthcare | ||||||||||||||
189,244 sq ft 9 Idaho Spring Creek Senior Housing Properties(1) | October 31, 2016 | $ | 43,900 | $ | 37,397 | $ | 6,503 | |||||||
426,652 sq ft 5 Edgewood Vista Senior Housing Properties(2) | January 18, 2017 | 69,928 | 50,393 | 19,535 | ||||||||||
286,854 sq ft 5 Wyoming Senior Housing Properties(3) | February 1, 2017 | 49,600 | 45,469 | 4,131 | ||||||||||
169,001 sq ft 9 Edgewood Vista Senior Housing Properties(4) | February 15, 2017 | 30,700 | 24,081 | 6,619 | ||||||||||
169,562 sq ft 4 Edgewood Vista Senior Housing Properties(5) | March 1, 2017 | 35,348 | 14,511 | 20,837 | ||||||||||
114,316 sq ft Healtheast St. John & Woodwinds - Maplewood & Woodbury MN | March 6, 2017 | 20,700 | 13,777 | 6,923 | ||||||||||
59,760 sq ft Sartell 2000 23rd Street South - Sartell, MN | March 31, 2017 | 5,600 | 5,923 | (323 | ) | |||||||||
98,174 sq ft Legends at Heritage Place - Sartell, MN | April 20, 2017 | 9,960 | 11,439 | (1,479 | ) | |||||||||
$ | 265,736 | $ | 202,990 | $ | 62,746 | |||||||||
Other | ||||||||||||||
195,075 sq ft Stone Container - Fargo, ND | July 25, 2016 | $ | 13,400 | $ | 4,418 | $ | 8,982 | |||||||
28,528 sq ft Grand Forks Carmike - Grand Forks, ND | December 29, 2016 | 4,000 | 1,563 | 2,437 | ||||||||||
$ | 17,400 | $ | 5,981 | $ | 11,419 | |||||||||
Unimproved Land | ||||||||||||||
Georgetown Square Unimproved Land - Grand Chute, WI | May 6, 2016 | 250 | 274 | (24 | ) | |||||||||
Total Property Dispositions | $ | 286,926 | $ | 211,977 | $ | 74,949 | ||||||||
(1) | The properties included in this portfolio are: Spring Creek American Falls, Spring Creek Boise, Spring Creek Eagle, Spring Creek Fruitland, Spring Creek Fruitland Unimproved, Spring Creek Meridian, Spring Creek Overland, Spring Creek Soda Springs and Spring Creek Ustick. |
(2) | The properties included in this portfolio are: Edgewood Vista Bismarck, Edgewood Vista Brainerd, Edgewood Vista East Grand Forks, Edgewood Vista Fargo, and Edgewood Vista Spearfish. |
(3) | The properties included in this portfolio are: Casper 1930 E 12th Street (Park Place), Casper 3955 E 12th Street (Meadow Wind), Cheyenne 4010 N College Drive (Aspen Wind), Cheyenne 4606 N College Drive (Sierra Hills) and Laramie 1072 N 22nd Street (Spring Wind). |
(4) | The properties included in this portfolio are: Edgewood Vista Belgrade, Edgewood Vista Billings, Edgewood Vista Columbus, Edgewood Vista Fremont, Edgewood Vista Grand Island, Edgewood Vista Minot, Edgewood Vista Missoula, Edgewood Vista Norfolk and Edgewood Vista Sioux Falls. |
(5) | The properties included in this portfolio are: Edgewood Vista Hastings, Edgewood Vista Kalispell, Edgewood Vista Omaha and Edgewood Vista Virginia. |
Funds From Operations
We consider Funds from Operations (“FFO”) to be a useful measure of performance for an equity REIT. We use the definition of FFO adopted by the National Association of Real Estate Investment Trusts, Inc. (“NAREIT”). NAREIT currently defines FFO as net income or loss attributable to common shareholders computed in accordance with GAAP, adjusted for:
• | gains or losses on sales of previously depreciated operating properties; |
• | cumulative effect of changes in accounting principles; |
• | impairment write-downs of depreciable real estate assets; |
• | write-downs of investments in affiliates due to a decrease in value of depreciable real estate assets held by affiliates; |
• | depreciation of real estate assets; and |
• | adjustments for unconsolidated partnerships and joint ventures. |
Due to limitations of the FFO definition adopted by NAREIT, we have made certain interpretations in applying the definition. We believe all such interpretations not specifically provided for in the NAREIT definition are consistent with the definition. Beginning with the third quarter of fiscal year 2018, we included impairment charges for nondepreciable assets in FFO.
We believe that FFO, which is a standard supplemental measure for equity real estate investment trusts, is helpful to investors in understanding our operating performance, primarily because its calculation excludes depreciation and amortization expense on real estate assets, thereby providing an additional perspective on our operating results. We believe that GAAP historical cost
33
depreciation of real estate assets generally is not correlated with changes in the value of those assets, whose value does not diminish predictably over time, as historical cost depreciation implies. The exclusion in NAREIT’s definition of FFO of impairment write-downs and gains and losses from the sale of previously depreciated operating real estate assets helps to identify the operating results of the long-term assets that form the base of our investments, and assists management and investors in comparing those operating results between periods. FFO is also used by our management and investors to identify trends in occupancy rates, rental rates and operating costs.
While FFO is widely used by us as a primary performance metric, not all real estate companies use the same definition of FFO or calculate FFO the same way. Accordingly, FFO presented here is not necessarily comparable to FFO presented by other real estate companies. FFO should not be considered as an alternative to net income or any other GAAP measurement of performance, but rather should be considered as an additional, supplemental measure. FFO also does not represent cash generated from operating activities in accordance with GAAP, and is not necessarily indicative of sufficient cash flow to fund all of our needs or our ability to service indebtedness or make distributions.
FFO applicable to Common Shares and Units for the fiscal year ended April 30, 2018, decreased to $36.3 million compared to $55.2 million for the fiscal year ended April 30, 2017, a change of 34.2%, primarily due to a reduction of NOI as a result of disposition activities, costs related to the redemption of preferred shares, and impairment of unimproved land. FFO applicable to common shares and limited partnership units for the fiscal year ended April 30, 2017 was $55.2 million, compared to $103.9 million for the fiscal year ended April 30, 2016.
Reconciliation of Net Income Attributable to Investors Real Estate Trust to Funds From Operations
For the years ended April 30, 2018, 2017 and 2016:
(in thousands, except per share and unit amounts) | |||||||||||||||||||||||||||||||||
Fiscal Years Ended April 30, | 2018 | 2017 | 2016 | ||||||||||||||||||||||||||||||
Per | Per | Per | |||||||||||||||||||||||||||||||
Weighted Avg | Share | Weighted Avg | Share | Weighted Avg | Share | ||||||||||||||||||||||||||||
Shares and | and | Shares and | and | Shares and | and | ||||||||||||||||||||||||||||
Amount | Units(1) | Unit(2) | Amount | Units(1) | Unit(2) | Amount | Units(1) | Unit(2) | |||||||||||||||||||||||||
Net income attributable to Investors Real Estate Trust | $ | 116,788 | $ | 43,347 | $ | 72,006 | |||||||||||||||||||||||||||
Less dividends to preferred shareholders | (8,569 | ) | (10,546 | ) | (11,514 | ) | |||||||||||||||||||||||||||
Less redemption of preferred shares | (3,657 | ) | (1,435 | ) | — | ||||||||||||||||||||||||||||
Net income available to common shareholders | 104,562 | 119,977 | $ | 0.87 | 31,366 | 121,169 | $ | 0.26 | 60,492 | 123,094 | $ | 0.49 | |||||||||||||||||||||
Adjustments: | |||||||||||||||||||||||||||||||||
Noncontrolling interests – Operating Partnership | 12,702 | 14,617 | 4,059 | 16,130 | 7,032 | 14,278 | |||||||||||||||||||||||||||
Depreciation and amortization | 87,299 | 52,564 | 63,789 | ||||||||||||||||||||||||||||||
Impairment of real estate attributable to Investors Real Estate Trust | 15,448 | 42,065 | 5,983 | ||||||||||||||||||||||||||||||
Gains on depreciable property sales attributable to Investors Real Estate Trust | (183,687 | ) | (74,847 | ) | (33,422 | ) | |||||||||||||||||||||||||||
Funds from operations applicable to common shares and Units | $ | 36,324 | 134,594 | $ | 0.27 | $ | 55,207 | 137,299 | $ | 0.40 | $ | 103,874 | 137,372 | $ | 0.76 | ||||||||||||||||||
(1) | Pursuant to Exchange Rights, limited partnership units of the Operating Partnership are redeemable for cash, or, at our discretion, may be exchangeable for common shares on a one-for-one basis. |
(2) | Net income attributable to us is calculated on a per common share basis. FFO is calculated on a per common share and limited partnership unit basis. |
Cash Distributions
The following cash distributions per common share/unit were paid to our common shareholders and unitholders during fiscal years 2018, 2017 and 2016:
34
Fiscal Years | ||||||||||||
Quarter Ended | 2018 | 2017 | 2016 | |||||||||
April 30 | $ | 0.07 | $ | 0.07 | $ | 0.13 | ||||||
January 31 | 0.07 | 0.13 | 0.13 | |||||||||
October 31 | 0.07 | 0.13 | 0.13 | |||||||||
July 31 | 0.07 | 0.13 | 0.13 | |||||||||
$ | 0.28 | $ | 0.46 | $ | 0.52 | |||||||
Liquidity and Capital Resources
Overview
We desire to create and maintain a strong balance sheet that offers financial flexibility and enables us to pursue and acquire properties that enhance our portfolio composition, operating metrics, and cash flow growth prospects. We intend to strengthen our capital and liquidity positions by continuing to focus on improving our core fundamentals, which include generating positive cash flows from operations, maintaining appropriate debt levels and leverage ratios, and controlling overhead costs.
Our primary sources of liquidity are cash and cash equivalents on hand and cash flows generated from operations. Other sources include availability under our unsecured line of credit and term loan, proceeds from property dispositions, offerings of preferred and common stock under our shelf registration statement, and other short-term unsecured borrowings or long-term secured mortgages.
Our primary liquidity demands are normally-recurring operating and overhead expenses, debt service and repayments, capital improvements to our properties, distributions to the holders of our preferred shares, Common Shares, and Units, value-add redevelopment, and acquisition of additional properties.
We intend to maintain a strong balance sheet and preserve our financial flexibility, which we believe should enhance our ability to capitalize on appropriate investment opportunities as they may arise. We intend to maintain a conservative capital structure by taking certain actions, including:
• | extending and sequencing our debt maturity dates; |
• | managing interest rate exposure through the appropriate use of a mix of fixed and floating debt and utilizing our line of credit and term loan as appropriate; |
• | maintaining adequate coverage ratios on our debt obligations; |
• | where appropriate, accessing the equity markets through our shelf registration statement. |
We also intend to strengthen our liquidity and capital resource position by focusing on the operations of our business, which include generating positive cash flows from operations, maintaining appropriate debt and debt-to-equity ratios, and controlling overhead costs. We have historically met our short-term liquidity requirements through net cash flows provided by our operating activities, and, from time to time, through draws on our line of credit. Management considers our ability to generate cash from property operating activities and draws on our line of credit to be adequate to meet all operating requirements and to make distributions to our shareholders in accordance with the REIT provisions of the Internal Revenue Code. Budgeted expenditures for ongoing maintenance and capital improvements and renovations to our real estate portfolio are also generally expected to be funded from existing cash on hand, cash flow generated from property operations, draws on our line of credit and/or new borrowings, and we believe we will have sufficient cash to meet our commitments over the next twelve months.
To maintain our qualification as a REIT, we must pay dividends to our shareholders aggregating annually at least 90% of our REIT taxable income, excluding net capital gains. While we have historically satisfied this distribution requirement by making cash distributions to our shareholders, we may choose to satisfy this requirement by making distributions of other property, including, in limited circumstances, our own common stock. As a result of this distribution requirement, our Operating Partnership cannot rely on retained earnings to fund ongoing operations to the same extent that other companies whose parent companies are not REITs can. We pay dividends from cash available for distribution. Until it is distributed, cash available for distribution is typically invested in investment grade securities held available for sale or is used to reduce balances outstanding under our line of credit. In the event of deterioration in property operating results, we may need to consider additional cash preservation alternatives, including reducing development activities, capital improvements, and renovations. For the fiscal year ended April 30, 2018, we paid distributions of $37.8 million in cash to common shareholders and unitholders of IRET Properties, as compared to net cash provided by operating activities of $48.0 million and FFO of $36.3 million.
35
Factors that could increase or decrease our future liquidity include, but are not limited to, changes in interest rates or sources of financing, general volatility in capital and credit markets, changes in minimum REIT dividend requirements, and our ability to access the capital markets on favorable terms, or at all, As a result of the foregoing conditions or general economic conditions in our markets that affect our ability to attract and retain tenants, we may not generate sufficient cash flow from operations or otherwise have access to capital on favorable terms, or at all. If we are unable to obtain capital from other sources, we may not be able to pay the distribution required to maintain our status as a REIT, make required principal and interest payments, make strategic acquisitions or make necessary routine capital improvements or undertake re-development opportunities with respect to our existing portfolio of operating assets.
Capital Resources and Cash Flows
As of April 30, 2018, we had total liquidity of approximately $193.9 million, which includes $176.0 million available on our Line of Credit based on the value of properties contained in our UAP, $11.9 million of cash and cash equivalents, and $6.0 million under an operating line of credit described below. As of April 30, 2017, we had total liquidity of approximately $177.7 million, which included $148.9 million available under our Line of Credit based on the UAP and $28.8 million of cash and cash equivalents.
As of April 30, 2018, we also had restricted cash consisting of $4.2 million of escrows held by lenders for real estate taxes, insurance, and capital additions. As of April 30, 2017, we had restricted cash consisting of $23.7 million of net tax-deferred exchange proceeds remaining from a portion of our senior housing sale, and $4.3 million of escrows held by lenders for real estate taxes, insurance and capital additions.
Our Line of Credit has total commitments of up to $300.0 million, with borrowing capacity based on the UAP. The UAP provided for a borrowing capacity of approximately $300.0 million at year-end, offering additional borrowing availability of $176.0 million beyond the $124.0 million drawn as of April 30, 2018. In addition, during the year ended April 30, 2018, we entered into a $70.0 million unsecured term loan that matures on January 31, 2023. In addition, we increased the credit capacity of our revolving Line of Credit from $250.0 million to $300.0 million, and maintain a $200.0 million accordion option that can be accessed by increasing lending commitments under the current agreement. In comparison, at April 30, 2017, the line of credit borrowing capacity was $206.0 million based on the UAP, of which $57.1 million was drawn on the line.
During the quarter ended April 30, 2018, we also closed on a $6.0 million operating line of credit. This operating line of credit is designed to enhance treasury management activities and more effectively manage cash balances. This operating line has a one-year term, with pricing based on a market spread plus the one-month LIBOR index rate.
For information regarding our cash flows for the years ended April 30, 2018, and 2017, see the Consolidated Statements of Cash Flows in Item 15.
In addition to cash flow from operations, during the year ended April 30, 2018, we generated capital from various activities, including:
• | Disposing of 15 apartment communities, 35 other properties, and two land parcels for total proceeds of approximately $515.1 million; |
• | Issuing $103.0 million of 6.625% Series C Cumulative Redeemable Preferred Shares, with net proceeds of approximately $99.5 million; and |
• | Received proceeds from a $70.0 million term loan that expires in 2023. |
During the year ended April 30, 2018, we used capital for various activities, including:
• | Acquiring four apartment communities for approximately $373.1 million; |
• | Redeeming the full outstanding balance of our 7.95% Series B Cumulative Redeemable Preferred Shares for approximately $115.0 million; |
• | Repaying approximately $198.3 million of mortgage principal; |
• | Repurchasing approximately 1.8 million Common Shares and redeeming approximately 1.5 million Units for an aggregate total cost of approximately $18.7 million; |
• | Seller-financing associated with a disposition of approximately $11.0 million and funding a note receivable for a third-party apartment development of approximately $15.5 million; and |
• | Funding capital expenditures for apartment communities of approximately $12.7 million. |
36
Financial Condition
Mortgage Loan Indebtedness. Mortgage loan indebtedness, including mortgages on properties held for sale, was $512.1 million on April 30, 2018, and $687.2 million on April 30, 2017. Approximately 95.6% of such mortgage debt is at fixed rates of interest, with staggered maturities. This reduces the exposure to changes in interest rates, which minimizes the effect of interest rate fluctuations on our results of operations and cash flows. As of April 30, 2018, the weighted average rate of interest on our mortgage debt was 4.69% compared to 4.71% on April 30, 2017. We believe there are no material defaults or material compliance issues in regards to any of these mortgage loans. Refer to Note 5 of our consolidated financial statements contained in this Annual Report on Form 10-K for the principal payments due on our mortgage indebtedness.
Construction Loan Indebtedness. Construction loan indebtedness was $0.0 million on April 30, 2018, and $41.8 million on April 30, 2017. The weighted average rate of interest on construction loan indebtedness was 3.27% on April 30, 2017.
Revolving Unsecured Line of Credit. As of April 30, 2018, our Line of Credit had a credit limit of $300.0 million based on the unencumbered asset pool, of which $124.0 million was drawn, at an interest rate of 3.66%. The multi-bank line of credit bears interest either at the lender's base rate plus 60 to 125 basis points or of LIBOR plus 160 to 225 basis points, both of which are based on corporate leverage. The line of credit is utilized to refinance existing indebtedness, to finance property acquisitions, to finance capital expenditures, and for general corporate purposes.
Property Owned. Property owned was $1.7 billion and $1.4 billion at April 30, 2018 and 2017, respectively. The increase is primarily due to acquisitions of apartment communities partially offset by dispositions and impairment charges during fiscal year 2018.
Cash and Cash Equivalents. Cash and cash equivalents on April 30, 2018, totaled $11.9 million, compared to $28.8 million on April 30, 2017. The decrease in cash on hand on April 30, 2018, as compared to April 30, 2017, was due primarily to payments on mortgage and construction debt and repurchases of common and preferred shares, net of proceeds from sales of property.
Operating Partnership Units. Outstanding limited partnership units in the Operating Partnership owned by limited partners decreased to 14.1 million units on April 30, 2018, compared to 15.6 million units on April 30, 2017. The decrease in units outstanding at April 30, 2018, as compared to April 30, 2017, resulted from the redemption of units for cash or shares.
Common and Preferred Shares. Common shares outstanding on April 30, 2018, totaled 119.5 million, compared to 121.2 million common shares outstanding on April 30, 2017. This decrease in common shares outstanding from April 30, 2017 to April 30, 2018 was due to repurchases of outstanding common shares under the share repurchase program.
During fiscal years 2018 and 2017, respectively, approximately 28,900 and 503,000 Units were redeemed in exchange for common shares in connection with Unitholders exercising their Exchange Rights, with a total book value of $34,000 and $875,000 included in equity.
Pursuant to the exercise of Exchange Rights, during fiscal years 2018 and 2017, respectively, we redeemed approximately 1.5 million and 165,000 Units for an aggregate purchase price of $8.8 million and $966,000 at an average price per unit of $5.89 and $5.84.
During fiscal year 2018, we issued approximately 93,000 Common Shares, with a total grant-date value of $536,000, under our 2015 Incentive Award Plan, for executive officer and trustee share based compensation for future performance. During fiscal year 2018, 2,000 common shares were forfeited under the 2015 Incentive Award Plan. During fiscal year 2017, we issued approximately 604,000 Common Shares, with a total grant-date value of $2.6 million, under our 2015 Incentive Award Plan, for executive officer and trustee share based compensation for future performance. We also issued approximately 59,000 Common Shares, with a total grant-date value of approximately $352,000, under our 2008 Incentive Award Plan, for trustee share based compensation for fiscal year 2016 performance. During fiscal year 2017, 274,000 common shares were forfeited under the 2015 Incentive Award Plan.
On December 7, 2016, our Board of Trustees authorized a share repurchase program to repurchase up to $50 million of our common shares and/or Series B preferred shares over a one-year period. On December 5, 2017, our Board of Trustees reauthorized this share repurchase program for our common shares for an additional one-year period. Under this program, we may repurchase Common Shares in open-market purchases including pursuant to Rule 10b5-1 or Rule 10b-18 plans, as determined by management and in accordance with the requirements of the Securities and Exchange Commission. The extent to which we repurchase our shares, and the timing of such repurchases, will depend upon a variety of factors, including market conditions, regulatory requirements and other corporate considerations, as determined by the executive management team. The
37
program may be suspended or discontinued at any time. During fiscal year 2018, we repurchased and retired approximately 1,780,000 common shares for an aggregate cost of $9.9 million, including commissions, at an average price per share of $5.58. During fiscal year 2017, we repurchased and retired approximately 778,000 common shares for an aggregate cost of $4.5 million, including commissions, at an average price per share of $5.77.
As of April 30, 2018, we had 4.1 million Series C preferred shares outstanding. On October 30, 2017, we completed the redemption of all the outstanding 7.95% Series B Cumulative Redeemable Preferred Shares ("Preferred B Shares") for an aggregate redemption price of $115.0 million, as such shares are no longer outstanding as of such date. On December 2, 2016, we completed the redemption of all of the outstanding 8.25% Series A Cumulative Redeemable Preferred Shares (“Preferred A Shares”) for an aggregate redemption price of $29.2 million, and such shares are no longer outstanding as of such date.
Contractual Obligations and Other Commitments
Our primary contractual obligations relate to our borrowings under the line of credit, term loan, and mortgage notes payable. The line of credit matures in January 2021 and had $124.0 million in credit outstanding at April 30, 2018. The term loan has a balance of $70.0 million at April 30, 2018 and matures in January 2023. The principal and interest payments on the mortgage notes payable, including mortgages on properties held for sale, for the years subsequent to April 30, 2018, are included in the table below as “Long-term debt.” Interest due on variable rate mortgage notes is calculated using rates in effect on April 30, 2018.
(in thousands) | ||||||||||||||||||||
Less than | More than | |||||||||||||||||||
Total | 1 Year | 1-3 Years | 3-5 Years | 5 Years | ||||||||||||||||
Long-term debt (principal and interest) | $ | 603,432 | $ | 48,466 | $ | 241,319 | $ | 115,060 | $ | 198,587 | ||||||||||
Line of credit (principal and interest)(1) | $ | 136,959 | $ | 4,579 | $ | 132,380 | $ | — | $ | — | ||||||||||
Term loan (principal and interest) | $ | 83,256 | $ | 2,740 | $ | 5,487 | $ | 75,029 | $ | — | ||||||||||
Total | $ | 823,647 | $ | 55,785 | $ | 379,186 | $ | 190,089 | $ | 198,587 | ||||||||||
(1) | The future interest payments on the line of credit were estimated using the outstanding principal balance and interest rate in effect as of April 30, 2018. |
Off-Balance-Sheet Arrangements
As of April 30, 2018, we had no significant off-balance-sheet arrangements, as defined in Item 303(a)(4)(ii) of SEC Regulation S-K.
Inflation
Substantially all of our apartment leases are for a term generally ranging from six to eighteen months. In an inflationary environment, we may realize increased rents at the commencement of new leases or upon the renewal of existing leases. We believe the short-term nature of our leases generally minimizes our risk from the adverse effects of inflation.
Critical Accounting Policies
Set forth below is a summary of the accounting policies that management believes are critical to the preparation of the consolidated financial statements included in this Annual Report on Form 10-K.
Real Estate. Real estate is carried at cost, net of accumulated depreciation, less an adjustment for impairment, if any. Depreciation requires an estimate by management of the useful life of each property as well as an allocation of the costs associated with a property to its various components. As described further below, the process of allocating property costs to its components involves a considerable amount of subjective judgments to be made by management. If we do not allocate these costs appropriately or incorrectly estimate the useful lives of our real estate, depreciation expense may be misstated. Depreciation is computed on a straight-line basis over the estimated useful lives of the assets. We use a 10-37 year estimated life for buildings and improvements and a 5-10 year estimated life for furniture, fixtures and equipment. Maintenance and repairs are charged to operations as incurred. Renovations and improvements that improve and/or extend the useful life of the asset are capitalized over their estimated useful life, generally five to ten years.
In the first quarter of fiscal year 2018, we determined it was appropriate to review and adjust our estimated useful lives to be specific to our remaining asset portfolio. Effective May 1, 2017, we changed the estimated useful lives of our real estate assets
38
to better reflect the estimated periods during which they will be of economic benefit. Refer to Note 2 of our consolidated financial statements contained in this Annual Report on Form 10-K for further discussion on this change and its impact.
Property sales or dispositions are recorded when title transfers, we receive sufficient consideration, and we have no significant continuing involvement with the property sold.
Acquisition of Investments in Real Estate. Upon acquisitions of real estate, we assess the fair value of acquired tangible assets (including land, buildings and personal property), which is determined by valuing the property as if it were vacant, and consider whether there were significant intangible assets acquired (for example, above-and below-market leases, the value of acquired in-place leases and tenant relationships) and assumed liabilities, and allocate the purchase price based on these assessments. The as-if-vacant value is allocated to land, buildings and personal property based on management’s determination of the relative fair value of these assets. Techniques used to estimate fair value include discounted cash flow analysis and reference to recent sales of comparable properties. Estimates of future cash flows are based on a number of factors including the historical operating results, known trends and market/economic conditions that may affect the property. Land value is assigned based on the purchase price if land is acquired separately or based on a relative fair value allocation if acquired in a merger or in a portfolio acquisition.
Other intangible assets acquired include amounts for in-place lease values that are based upon our evaluation of the specific characteristics of the leases. Factors considered in the fair value analysis include an estimate of carrying costs and foregone rental income during hypothetical expected lease-up periods, consideration of current market conditions and costs to execute similar leases. We also consider information about each property obtained during our pre-acquisition due diligence, marketing and leasing activities in estimating the relative fair value of the tangible and intangible assets acquired.
Capitalization of Costs. We follow the real estate project costs guidance in ASC 970, Real Estate – General in accounting for the costs of development and re-development projects. As real estate is undergoing development or redevelopment, all project costs directly associated with and attributable to the development and construction of a project, including interest expense and real estate tax expense, are capitalized to the cost of the real property. The capitalization period begins when development activities and expenditures begin and ends upon completion, which is when the asset is ready for its intended use. Generally, rental property is considered substantially complete upon issuance of a certificate of occupancy.
Real Estate Held For Sale. Properties are classified as held for sale when they meet the necessary criteria, which include: (a) management, having the authority to approve the action, commits to a plan to sell the asset and (b) the sale of the asset is probable and expected to be completed within one year. We generally consider these criteria met when the transaction has been approved by our Board of Trustees, there are no known significant contingencies related to the sale and management believes it is probable that the sale will be completed within one year. Real estate held for sale is stated at the lower of its carrying amount or estimated fair value less disposal costs. Depreciation is not recorded on assets classified as held for sale.
We report in discontinued operations the results of operations and the related gains or losses on the sales of properties that have either been disposed of or classified as held for sale and meet the classification of a discontinued operation as described in ASC 205 - Presentation of Financial Statements and ASC 360 - Property, Plant, and Equipment: Reporting Discontinued Operations and Disclosures of Disposals of Components of an Entity. Under this standard, a disposal (or classification as held for sale) of a component of an entity or a group of components of an entity is required to be reported in discontinued operations if the disposal represents a strategic shift that has (or will have) a major effect on an entity’s operations and financial results.
Impairment. We periodically evaluate our long-lived assets, including our investments in real estate, for impairment indicators. The impairment evaluation is performed on assets by property such that assets for a property form an asset group. The judgments regarding the existence of impairment indicators are based on factors such as operational performance, market conditions, expected holding period of each asset group, and legal and environmental concerns. If indicators exist, we compare the expected future undiscounted cash flows for the long-lived asset group against the carrying amount of that asset group. If the sum of the estimated undiscounted cash flows is less than the carrying amount of the asset group, an impairment loss is recorded for the difference between the estimated fair value and the carrying amount of the asset group. If our anticipated holding period for properties, the estimated fair value of properties or other factors change based on market conditions or otherwise, our evaluation of impairment charges may be different and such differences could be material to our consolidated financial statements. The evaluation of anticipated cash flows is subjective and is based, in part, on assumptions regarding future occupancy, rental rates and capital requirements that could differ materially from actual results. Plans to hold properties over longer periods decrease the likelihood of recording impairment losses.
Revenue Recognition. The Company primarily leases apartment communities under operating leases with terms generally of one year or less. Rental revenue is recognized on the straight-line basis, which averages minimum required rents over the terms
39
of the leases. Rental income represents gross market rent less adjustments for concessions, vacancy loss, and bad debt. Rents recognized in advance of collection are reflected as receivable arising from straight-lining of rents, net of allowance for doubtful accounts. Rent concessions, including free rent, are amortized on a straight-line basis over the terms of the related leases.
REIT Status. We operate in a manner intended to enable us to continue to qualify as a REIT under Sections 856-860 of the Internal Revenue Code. Under those sections, a REIT which distributes at least 90% of its REIT taxable income, excluding net capital gains, as a distribution to its shareholders each year and which meets certain other conditions will not be taxed on that portion of its taxable income which is distributed to its shareholders. We intend to distribute to our shareholders 100% of our taxable income. Therefore, no provision for Federal income taxes is required. If we fail to distribute the required amount of income to our shareholders, we would fail to qualify as a REIT and substantial adverse tax consequences may result.
We have one TRS, acquired during fiscal year 2014, which is subject to corporate federal and state income taxes on its taxable income at regular statutory rates. For fiscal year 2018, we estimate that the TRS will have no taxable income. There were no income tax provisions or material deferred income tax items for our TRS for the fiscal years ended April 30, 2018, 2017, and 2016.
Our taxable income is affected by a number of factors, including, but not limited to, the following: our tenants perform their obligations under their leases and our tax and accounting positions do not change. These factors, which impact our taxable income, are subject to change and many are outside of our control. If actual results vary, our taxable income may change.
Recent Accounting Pronouncements
For disclosure regarding recent accounting pronouncements and the anticipated impact they will have on our operations, please refer to Note 2 to our consolidated financial statements appearing elsewhere in this Annual Report on Form 10-K.
Item 7A. Quantitative and Qualitative Disclosures About Market Risk
Our exposure to market risk is primarily related to fluctuations in the general level of interest rates on our current and future fixed and variable rate debt obligations. We currently use an interest rate swap to offset the impact of interest rate fluctuations on our $70 million variable-rate term loan. The swap has a notional amount of $70 million, an average pay rate of 2.161%, and a fair value of $1.8 million. We do not enter into derivative instruments for trading or speculative purposes. The interest rate swap exposes us to credit risk in the event of non-performance by the counterparty under the terms of the agreement.
As of April 30, 2018, we had $22.7 million of variable-rate mortgage debt outstanding and $124 million of variable-rate borrowings under our line of credit. We estimate that an increase in 30-day LIBOR of 100 basis points with constant risk spreads would result in our net income being reduced by approximately $1.5 million on an annual basis. We estimate that a decrease in 30-day LIBOR of 100 basis points would increase the amount of net income by a similar amount.
Mortgage loan indebtedness, including mortgages on properties held for sale, decreased by $175.1 million as of April 30, 2018, compared to April 30, 2017, primarily due to loan payoffs related to property dispositions. As of April 30, 2018, 95.6% of our $512.1 million of mortgage debt was at fixed rates of interest, with staggering maturities, compared to 91.6% as of April 30, 2017. As of April 30, 2018, the weighted average rate of interest on our mortgage debt was 4.69%, compared to 4.71% on April 30, 2017. Even though our goal is to maintain a fairly low exposure to interest rate risk, we may become vulnerable to significant fluctuations in interest rates on any future repricing or refinancing of our fixed or variable rate debt or future debt.
The following table provides information about our financial instruments that are sensitive to changes in interest rates. For debt obligations, the table presents principal cash flows and related weighted average interest rates by expected maturity dates. Average variable rates are based on rates in effect at the reporting date.
Future Principal Payments (in thousands, except percentages) | |||||||||||||||||||||||||
Fair | |||||||||||||||||||||||||
Debt | Fiscal 2019 | Fiscal 2020 | Fiscal 2021 | Fiscal 2022 | Fiscal 2023 | Thereafter | Total | Value | |||||||||||||||||
Fixed Rate | $ | 24,264 | $ | 92,519 | $ | 92,182 | $ | 70,509 | $ | 27,498 | $ | 182,430 | $ | 489,402 | $ | 488,064 | |||||||||
Avg Fixed Interest Rate | 4.55 | % | 4.32 | % | 3.74 | % | 3.50 | % | 3.45 | % | |||||||||||||||
Variable Rate(1) | $ | 737 | $ | 22,002 | $ | — | $ | 124,000 | $ | — | $ | 70,000 | $ | 216,739 | $ | 216,739 | |||||||||
Avg Variable Interest Rate | 5.24 | % | 5.29 | % | — | % | 3.66 | % | — | % | |||||||||||||||
(1) | Includes $124 million under our line of credit and $70 million on our term loan. |
40
Item 8. Financial Statements and Supplementary Data
Our consolidated financial statements and related notes, together with the Report of the Independent Registered Public Accounting Firm, are set forth beginning on page F-1 of this Annual Report on Form 10-K and are incorporated herein by reference.
Item 9. Changes in and Disagreements with Accountants on Accounting and Financial Disclosure
Not applicable.
Item 9A. Controls and Procedures
Disclosure Controls and Procedures: As of April 30, 2018, the end of the period covered by this Annual Report on Form 10-K, our management carried out an evaluation, under the supervision and with the participation of our Chief Executive Officer and Chief Financial Officer, of the effectiveness of the design and operation of our disclosure controls and procedures (as such term is defined in Rule 13a-15(e) under the Exchange Act). Based upon that evaluation, our Chief Executive Officer and Chief Financial Officer concluded that our disclosure controls and procedures were effective to ensure that information required to be disclosed by us in the reports that we file or submit under the Exchange Act is recorded, processed, summarized and reported within the time periods specified in the Commission’s rules and forms, and is accumulated and communicated to management, including our principal executive and principal financial officers, as appropriate to allow timely decisions regarding required disclosure.
Changes in Internal Control Over Financial Reporting: There have been no changes in our internal control over financial reporting (as defined in Rule 13a-15(f) under the Exchange Act) during the fourth quarter of the fiscal year to which this report relates that have materially affected, or are reasonably likely to materially affect, our internal control over financial reporting.
MANAGEMENT’S REPORT ON INTERNAL CONTROL OVER FINANCIAL REPORTING
Our management is responsible for establishing and maintaining adequate internal control over financial reporting and for performing an assessment of the effectiveness of internal control over financial reporting as of April 30, 2018. Our internal control over financial reporting is a process designed under the supervision of our principal executive and principal financial officers to provide reasonable assurance regarding the reliability of financial reporting and the preparation of our financial statements for external reporting purposes in accordance with GAAP.
As of April 30, 2018, management conducted an assessment of the effectiveness of our internal control over financial reporting, based on the framework established in Internal Control – Integrated Framework (2013) issued by the Committee of Sponsoring Organizations of the Treadway Commission (“COSO”). Based on this assessment, management has determined that our internal control over financial reporting as of April 30, 2018, was effective.
Our internal control over financial reporting includes policies and procedures that:
• | pertain to the maintenance of records that, in reasonable detail, accurately and fairly reflect transactions, acquisitions and dispositions of assets; |
• | provide reasonable assurance that transactions are recorded as necessary to permit preparation of financial statements in accordance with GAAP, and that receipts and expenditures are being made only in accordance with authorizations of our management and the trustees; and |
• | provide reasonable assurance regarding prevention or timely detection of unauthorized acquisition, use or disposition of our assets that could have a material effect on our financial statements. |
Due to its inherent limitations, internal control over financial reporting may not prevent or detect misstatements. Also, projections of any evaluation of effectiveness to future periods are subject to the risk that controls may become inadequate due to changes in conditions or deterioration in the degree of compliance with the policies or procedures.
Our internal control over financial reporting as of April 30, 2018 has been audited by Grant Thornton LLP, an independent registered public accounting firm, as stated in their report on page F-3 of our consolidated financial statements contained in our Annual Report on Form 10-K, which expresses an unqualified opinion on the effectiveness of our internal control over financial reporting as of April 30, 2018.
Item 9B. Other Information
None.
41
PART III
The information required in Item 10 (Directors, Executive Officers and Corporate Governance), Item 11 (Executive Compensation), Item 12 (Security Ownership of Certain Beneficial Owners and Management and Related Stockholder Matters), Item 13 (Certain Relationships and Related Transactions, and Director Independence), and Item 14 (Principal Accountant Fees and Services) will be incorporated by reference to our definitive proxy statement for our 2018 Annual Meeting of Shareholders to be filed with the SEC no later than 120 days after the end of the fiscal year covered by this Annual Report on Form 10-K.
PART IV
Item 15. Exhibits, Financial Statement Schedules
The following documents are filed as part of this report:
1. Financial Statements
See the “Table of Contents” to our consolidated financial statements on page F-1 of this Annual Report on Form 10-K.
2. Financial Statement Schedules
See the “Table of Contents” to our consolidated financial statements on page F-1 of this Annual Report on Form 10-K.
The following financial statement schedules should be read in conjunction with the financial statements referenced in Part II, Item 8 of this Annual Report on Form 10-K: Schedule III Real Estate and Accumulated Depreciation
3. Exhibits
See the Exhibit Index set forth in part (b) below.
The Exhibit Index below lists the exhibits to this Annual Report on Form 10-K. We will furnish a printed copy of any exhibit listed below to any security holder who requests it upon payment of a fee of 15 cents per page. All Exhibits are either contained in this Annual Report on Form 10-K or are incorporated by reference as indicated below.
42
EXHIBIT INDEX
EXHIBIT NO. | DESCRIPTION | |
3.1. | ||
3.2 | ||
3.3 | ||
3.4 | ||
10.1** | ||
10.2** | ||
10.3 | ||
10.4** | ||
10.5** | ||
10.6** | ||
10.7** | ||
10.8** | ||
10.9** | ||
10.10** | ||
10.11** | ||
10.12** | ||
10.13** | ||
43
EXHIBIT NO. | DESCRIPTION | |
10.14 | ||
10.15 | ||
10.16 | ||
10.17 | ||
10.18 | ||
10.19 | ||
10.20 | ||
10.21 | ||
10.22 | ||
10.23 | ||
10.24 | ||
44
EXHIBIT NO. | DESCRIPTION | |
10.25 | ||
10.26 | ||
10.27** | ||
10.28** | ||
10.29** | ||
12.1† | ||
21.1† | ||
23.1† | ||
24.1† | Power of Attorney (included on the signature page to this Annual Report on Form 10-K and incorporated by reference herein). | |
31.1† | ||
31.2† | ||
32.1† | ||
32.2† | ||
101† | The following materials from our Annual Report on Form 10-K for the fiscal year ended April 30, 2018 formatted in eXtensible Business Reporting Language ("XBRL"): (i) the Consolidated Balance Sheets, (ii) the Consolidated Statements of Operations, (iii) the Consolidated Statements of Equity, (iv) the Consolidated Statements of Cash Flows, and (v) notes to these consolidated financial statements. | |
** Indicates management compensatory plan, contract or arrangement.
45
Signatures
Pursuant to the requirements of Section 13 or 15(d) of the Securities Exchange Act of 1934, the Registrant has duly caused this report to be signed on its behalf by the undersigned, thereunto duly authorized.
Date: June 27, 2018 | Investors Real Estate Trust | |
By: | /s/ Mark O. Decker, Jr. | |
Mark O. Decker, Jr. | ||
President & Chief Executive Officer | ||
Pursuant to the requirements of the Securities Exchange Act of 1934, this report has been signed below by the following persons on behalf of the Registrant and in the capacities and on the dates indicated:
Signature | Title | Date | ||
/s/ Jeffrey P. Caira | ||||
Jeffrey P. Caira | Trustee & Chairman | June 27, 2018 | ||
/s/ Mark O. Decker, Jr. | ||||
Mark O. Decker, Jr. | President & Chief Executive Officer (Principal Executive Officer); Trustee | June 27, 2018 | ||
/s/ John A. Kirchmann | ||||
John A. Kirchmann | Executive Vice President and Chief Financial Officer (Principal Financial and Accounting Officer) | June 27, 2018 | ||
/s/ Michael T. Dance | ||||
Michael T. Dance | Trustee | June 27, 2018 | ||
/s/ Emily Nagle Green | ||||
Emily Nagle Green | Trustee | June 27, 2018 | ||
/s/ Linda J. Hall | ||||
Linda J. Hall | Trustee | June 27, 2018 | ||
/s/ Terrance P. Maxwell | ||||
Terrance P. Maxwell | Trustee | June 27, 2018 | ||
/s/ Jeffrey L. Miller | ||||
Jeffrey L. Miller | Trustee | June 27, 2018 | ||
/s/ John A. Schissel | ||||
John A. Schissel | Trustee | June 27, 2018 | ||
/s/ Mary J. Twinem | ||||
Mary J. Twinem | Trustee | June 27, 2018 | ||
46
INVESTORS REAL ESTATE TRUST AND SUBSIDIARIES
TABLE OF CONTENTS
PAGE | ||
REPORTS OF INDEPENDENT REGISTERED PUBLIC ACCOUNTING FIRM | ||
CONSOLIDATED FINANCIAL STATEMENTS | ||
Consolidated Balance Sheets | ||
Consolidated Statements of Operations | ||
Consolidated Statement of Comprehensive Income | ||
Consolidated Statements of Equity | ||
Consolidated Statements of Cash Flows | ||
Notes to Consolidated Financial Statements | ||
ADDITIONAL INFORMATION | ||
Schedule III - Real Estate and Accumulated Depreciation | ||
Schedules other than those listed above are omitted since they are not required or are not applicable, or the required information is shown in the consolidated financial statements or notes thereon.
F-1
REPORT OF INDEPENDENT REGISTERED PUBLIC ACCOUNTING FIRM
Board of Trustees and Shareholders
Investors Real Estate Trust
Opinion on the financial statements
We have audited the accompanying consolidated balance sheets of Investors Real Estate Trust (a North Dakota real estate investment trust) and subsidiaries (the “Company”) as of April 30, 2018 and 2017, the related consolidated statements of operations, comprehensive income, equity, and cash flows for each of the three years in the period ended April 30, 2018 and the related notes and schedule (collectively referred to as the "financial statements"). In our opinion, the financial statements present fairly, in all material respects, the financial position of the Company as of April 30, 2018 and 2017, and the results of its operations and its cash flows for each of the three years in the period ended April 30, 2018, in conformity with accounting principles generally accepted in the United States of America.
We also have audited, in accordance with the standards of the Public Company Accounting Oversight Board (United States) (“PCAOB”), the Company’s internal control over financial reporting as of April 30, 2018, based on criteria established in the 2013 Internal Control-Integrated Framework issued by the Committee of Sponsoring Organizations of the Treadway Commission (“COSO”), and our report dated June 27, 2018 expressed an unqualified opinion.
Basis for opinion
These financial statements are the responsibility of the Company’s management. Our responsibility is to express an opinion on the Company’s financial statements based on our audits. We are a public accounting firm registered with the PCAOB and are required to be independent with respect to the Company in accordance with the U.S. federal securities laws and the applicable rules and regulations of the Securities and Exchange Commission and the PCAOB.
We conducted our audits in accordance with the standards of the PCAOB. Those standards require that we plan and perform the audit to obtain reasonable assurance about whether the financial statements are free of material misstatement, whether due to error or fraud. Our audits included performing procedures to assess the risks of material misstatement of the financial statements, whether due to error or fraud, and performing procedures that respond to those risks. Such procedures included examining, on a test basis, evidence supporting the amounts and disclosures in the financial statements. Our audits also included evaluating the accounting principles used and significant estimates made by management, as well as evaluating the overall presentation of the financial statements. We believe that our audits provide a reasonable basis for our opinion.
/s/ GRANT THORNTON LLP
We have served as the Company’s auditor since 2013.
Minneapolis, Minnesota
June 27, 2018
F-2
REPORT OF INDEPENDENT REGISTERED PUBLIC ACCOUNTING FIRM
Board of Trustees and Shareholders
Investors Real Estate Trust
Opinion on internal control over financial reporting
We have audited the internal control over financial reporting of Investors Real Estate Trust (a North Dakota real estate investment trust) and subsidiaries (the “Company”) as of April 30, 2018, based on criteria established in the 2013 Internal Control-Integrated Framework issued by the Committee of Sponsoring Organizations of the Treadway Commission (“COSO”). In our opinion, the Company maintained, in all material respects, effective internal control over financial reporting as of April 30, 2018, based on criteria established in the 2013 Internal Control-Integrated Framework issued by COSO.
We also have audited, in accordance with the standards of the Public Company Accounting Oversight Board (United States) (“PCAOB”), the consolidated financial statements of the Company as of and for the year ended April 30, 2018, and our report dated June 27, 2018 expressed an unqualified opinion on those financial statements.
Basis for opinion
The Company’s management is responsible for maintaining effective internal control over financial reporting and for its assessment of the effectiveness of internal control over financial reporting, included in the accompanying Managements Report on Internal Control over Financial Reporting. Our responsibility is to express an opinion on the Company’s internal control over financial reporting based on our audit. We are a public accounting firm registered with the PCAOB and are required to be independent with respect to the Company in accordance with the U.S. federal securities laws and the applicable rules and regulations of the Securities and Exchange Commission and the PCAOB.
We conducted our audit in accordance with the standards of the PCAOB. Those standards require that we plan and perform the audit to obtain reasonable assurance about whether effective internal control over financial reporting was maintained in all material respects. Our audit included obtaining an understanding of internal control over financial reporting, assessing the risk that a material weakness exists, testing and evaluating the design and operating effectiveness of internal control based on the assessed risk, and performing such other procedures as we considered necessary in the circumstances. We believe that our audit provides a reasonable basis for our opinion.
Definition and limitations of internal control over financial reporting
A company’s internal control over financial reporting is a process designed to provide reasonable assurance regarding the reliability of financial reporting and the preparation of consolidated financial statements for external purposes in accordance with generally accepted accounting principles. A company’s internal control over financial reporting includes those policies and procedures that (1) pertain to the maintenance of records that, in reasonable detail, accurately and fairly reflect the transactions and dispositions of the assets of the company; (2) provide reasonable assurance that transactions are recorded as necessary to permit preparation of consolidated financial statements in accordance with generally accepted accounting principles, and that receipts and expenditures of the company are being made only in accordance with authorizations of management and directors of the company; and (3) provide reasonable assurance regarding prevention or timely detection of unauthorized acquisition, use, or disposition of the company’s assets that could have a material effect on the consolidated financial statements.
Because of its inherent limitations, internal control over financial reporting may not prevent or detect misstatements. Also, projections of any evaluation of effectiveness to future periods are subject to the risk that controls may become inadequate because of changes in conditions, or that the degree of compliance with the policies or procedures may deteriorate.
/s/ GRANT THORNTON LLP
Minneapolis, Minnesota
June 27, 2018
F-3
INVESTORS REAL ESTATE TRUST AND SUBSIDIARIES
CONSOLIDATED BALANCE SHEETS
(in thousands) | |||||||
April 30, 2018 | April 30, 2017 | ||||||
ASSETS | |||||||
Real estate investments | |||||||
Property owned | $ | 1,669,764 | $ | 1,358,529 | |||
Less accumulated depreciation | (311,324 | ) | (255,599 | ) | |||
1,358,440 | 1,102,930 | ||||||
Unimproved land | 11,476 | 18,455 | |||||
Mortgage loans receivable | 10,329 | — | |||||
Total real estate investments | 1,380,245 | 1,121,385 | |||||
Assets held for sale and assets of discontinued operations | — | 283,023 | |||||
Cash and cash equivalents | 11,891 | 28,819 | |||||
Restricted cash | 4,225 | 27,981 | |||||
Other assets | 30,297 | 13,306 | |||||
TOTAL ASSETS | $ | 1,426,658 | $ | 1,474,514 | |||
LIABILITIES, REDEEMABLE NONCONTROLLING INTERESTS AND EQUITY | |||||||
LIABILITIES | |||||||
Liabilities held for sale and liabilities of discontinued operations | $ | — | $ | 130,904 | |||
Accounts payable and accrued expenses | 29,018 | 35,566 | |||||
Revolving line of credit | 124,000 | 57,050 | |||||
Term loan, net of unamortized loan costs of $486 and $0, respectively | 69,514 | — | |||||
Mortgages payable, net of unamortized loan costs of $2,221 and $3,054, respectively | 509,919 | 565,978 | |||||
Construction debt | — | 41,741 | |||||
TOTAL LIABILITIES | 732,451 | 831,239 | |||||
COMMITMENTS AND CONTINGENCIES (NOTE 13) | |||||||
REDEEMABLE NONCONTROLLING INTERESTS – CONSOLIDATED REAL ESTATE ENTITIES | 6,708 | 7,181 | |||||
EQUITY | |||||||
Investors Real Estate Trust shareholders’ equity | |||||||
Series B Preferred Shares of Beneficial Interest (Cumulative redeemable preferred shares, no par value, no shares issued and outstanding at April 30, 2018 and 4,600,000 shares issued and outstanding at April 30, 2017, aggregate liquidation preference of $115,000,000) | — | 111,357 | |||||
Series C Preferred Shares of Beneficial Interest (Cumulative redeemable preferred shares, no par value, 4,118,460 shares issued and outstanding at April 30, 2018 and no shares issued and outstanding at April 30, 2017, aggregate liquidation preference of $102,971,475) | 99,456 | — | |||||
Common Shares of Beneficial Interest (Unlimited authorization, no par value, 119,525,975 shares issued and outstanding at April 30, 2018 and 121,199,299 shares issued and outstanding at April 30, 2017) | 907,843 | 916,121 | |||||
Accumulated distributions in excess of net income | (395,669 | ) | (466,541 | ) | |||
Accumulated other comprehensive income | 1,779 | — | |||||
Total Investors Real Estate Trust shareholders’ equity | 613,409 | 560,937 | |||||
Noncontrolling interests – Operating Partnership (14,099,434 units at April 30, 2018 and 15,617,216 units at April 30, 2017) | 73,012 | 73,233 | |||||
Noncontrolling interests – consolidated real estate entities | 1,078 | 1,924 | |||||
Total equity | 687,499 | 636,094 | |||||
TOTAL LIABILITIES, REDEEMABLE NONCONTROLLING INTERESTS AND EQUITY | $ | 1,426,658 | $ | 1,474,514 | |||
See Notes to Consolidated Financial Statements.
F-4
INVESTORS REAL ESTATE TRUST AND SUBSIDIARIES
CONSOLIDATED STATEMENTS OF OPERATIONS
(in thousands, except per share data) | ||||||||||
Years Ended April 30, | ||||||||||
2018 | 2017 | 2016 | ||||||||
REVENUE | $ | 169,745 | $ | 160,104 | $ | 145,500 | ||||
EXPENSES | ||||||||||
Property operating expenses, excluding real estate taxes | 54,292 | 47,587 | 43,741 | |||||||
Real estate taxes | 18,742 | 16,739 | 14,407 | |||||||
Property management expense | 5,526 | 5,046 | 3,714 | |||||||
Casualty loss | 500 | 414 | 238 | |||||||
Depreciation and amortization | 82,070 | 44,253 | 39,273 | |||||||
Impairment of real estate investments | 18,065 | 57,028 | 5,543 | |||||||
General and administrative expenses | 14,203 | 15,871 | 13,498 | |||||||
Acquisition and investment related costs | 51 | 3,276 | 830 | |||||||
TOTAL EXPENSES | 193,449 | 190,214 | 121,244 | |||||||
Operating income (loss) | (23,704 | ) | (30,110 | ) | 24,256 | |||||
Interest expense | (34,178 | ) | (34,314 | ) | (28,417 | ) | ||||
Loss on extinguishment of debt | (940 | ) | (1,651 | ) | (106 | ) | ||||
Interest income | 1,197 | 366 | 78 | |||||||
Other income | 311 | 780 | 307 | |||||||
Loss before gain on sale of real estate and other investments, gain on bargain purchase and income from discontinued operations | (57,314 | ) | (64,929 | ) | (3,882 | ) | ||||
Gain on sale of real estate and other investments | 20,120 | 18,701 | 9,640 | |||||||
Gain on bargain purchase | — | — | 3,424 | |||||||
Income (loss) from continuing operations | (37,194 | ) | (46,228 | ) | 9,182 | |||||
Income from discontinued operations | 164,823 | 76,753 | 67,420 | |||||||
NET INCOME | 127,629 | 30,525 | 76,602 | |||||||
Net income attributable to noncontrolling interests – Operating Partnership | (12,702 | ) | (4,059 | ) | (7,032 | ) | ||||
Net loss attributable to noncontrolling interests – consolidated real estate entities | 1,861 | 16,881 | 2,436 | |||||||
Net income attributable to Investors Real Estate Trust | 116,788 | 43,347 | 72,006 | |||||||
Dividends to preferred shareholders | (8,569 | ) | (10,546 | ) | (11,514 | ) | ||||
Redemption of preferred shares | (3,657 | ) | (1,435 | ) | — | |||||
NET INCOME AVAILABLE TO COMMON SHAREHOLDERS | $ | 104,562 | $ | 31,366 | $ | 60,492 | ||||
Earnings (loss) per common share from continuing operations – Investors Real Estate Trust – basic and diluted | $ | (0.36 | ) | $ | (0.30 | ) | $ | — | ||
Earnings per common share from discontinued operations – Investors Real Estate Trust – basic and diluted | 1.23 | 0.56 | 0.49 | |||||||
NET INCOME PER COMMON SHARE – BASIC & DILUTED | $ | 0.87 | $ | 0.26 | $ | 0.49 | ||||
See Notes to Consolidated Financial Statements.
F-5
INVESTORS REAL ESTATE TRUST AND SUBSIDIARIES
CONSOLIDATED STATEMENTS OF COMPREHENSIVE INCOME
(in thousands) | |||||||||||
Years Ended April 30, | |||||||||||
2018 | 2017 | 2016 | |||||||||
Net income | $ | 127,629 | $ | 30,525 | $ | 76,602 | |||||
Other comprehensive income: | |||||||||||
Unrealized gain from derivative instrument | 1,627 | — | — | ||||||||
Loss on derivative instrument reclassified into earnings | 152 | — | — | ||||||||
Total comprehensive income | $ | 129,408 | $ | 30,525 | $ | 76,602 | |||||
Comprehensive income attributable to noncontrolling interests – Operating Partnership | (12,888 | ) | (4,059 | ) | (7,032 | ) | |||||
Net loss attributable to noncontrolling interests – consolidated real estate entities | 1,861 | 16,881 | 2,436 | ||||||||
Comprehensive income attributable to controlling interests | $ | 118,381 | $ | 43,347 | $ | 72,006 | |||||
See Notes to Consolidated Financial Statements.
F-6
INVESTORS REAL ESTATE TRUST AND SUBSIDIARIES
CONSOLIDATED STATEMENTS OF EQUITY
(in thousands) | |||||||||||||||||||||
NUMBER | ACCUMULATED | ACCUMULATED | |||||||||||||||||||
OF | DISTRIBUTIONS | OTHER | NONREDEEMABLE | ||||||||||||||||||
PREFERRED | COMMON | COMMON | IN EXCESS OF | COMPREHENSIVE | NONCONTROLLING | TOTAL | |||||||||||||||
SHARES | SHARES | SHARES | NET INCOME | INCOME | INTERESTS | EQUITY | |||||||||||||||
Balance at April 30, 2015 | $ | 138,674 | 124,455 | $ | 951,868 | $ | (438,432 | ) | $ | — | $ | 88,844 | $ | 740,954 | |||||||
Net income attributable to Investors Real Estate Trust and noncontrolling interests | 72,006 | 4,562 | 76,568 | ||||||||||||||||||
Distributions – common shares and units | (64,060 | ) | (7,230 | ) | (71,290 | ) | |||||||||||||||
Distributions – Series A preferred shares | (2,372 | ) | (2,372 | ) | |||||||||||||||||
Distributions – Series B preferred shares | (9,142 | ) | (9,142 | ) | |||||||||||||||||
Distribution reinvestment and share purchase plan | 821 | 5,619 | 5,619 | ||||||||||||||||||
Shares issued and share-based compensation | 185 | 1,728 | 1,728 | ||||||||||||||||||
Partnership units issued | 18,226 | 18,226 | |||||||||||||||||||
Redemption of units for common shares | 273 | 1,477 | (1,477 | ) | — | ||||||||||||||||
Shares repurchased | (4,643 | ) | (35,000 | ) | (35,000 | ) | |||||||||||||||
Distributions to nonredeemable noncontrolling interests – consolidated real estate entities | (7,029 | ) | (7,029 | ) | |||||||||||||||||
Adjustments to prior year redemption of units for common shares | (3,608 | ) | 3,608 | — | |||||||||||||||||
Balance at April 30, 2016 | $ | 138,674 | 121,091 | $ | 922,084 | $ | (442,000 | ) | $ | — | $ | 99,504 | $ | 718,262 | |||||||
Net income attributable to Investors Real Estate Trust and nonredeemable noncontrolling interests | 43,347 | (12,400 | ) | 30,947 | |||||||||||||||||
Distributions – common shares and units | (55,907 | ) | (7,453 | ) | (63,360 | ) | |||||||||||||||
Distributions – Series A preferred shares | (1,403 | ) | (1,403 | ) | |||||||||||||||||
Distributions – Series B preferred shares | (9,143 | ) | (9,143 | ) | |||||||||||||||||
Shares issued and share-based compensation | 389 | 358 | 358 | ||||||||||||||||||
Redemption of units for common shares | 503 | 875 | (875 | ) | — | ||||||||||||||||
Redemption of units for cash | (966 | ) | (966 | ) | |||||||||||||||||
Shares repurchased | (27,317 | ) | (778 | ) | (4,501 | ) | (1,435 | ) | (33,253 | ) | |||||||||||
Contributions from nonredeemable noncontrolling interests – consolidated real estate entities | 7,188 | 7,188 | |||||||||||||||||||
Conversion to equity of notes receivable from nonredeemable noncontrolling interests – consolidated real estate entities | (7,366 | ) | (7,366 | ) | |||||||||||||||||
Acquisition of nonredeemable noncontrolling interests – consolidated real estate entities | (2,677 | ) | (2,261 | ) | (4,938 | ) | |||||||||||||||
Other | (6 | ) | (18 | ) | (214 | ) | (232 | ) | |||||||||||||
Balance at April 30, 2017 | $ | 111,357 | 121,199 | $ | 916,121 | $ | (466,541 | ) | $ | — | $ | 75,157 | $ | 636,094 | |||||||
See Notes to Consolidated Financial Statements.
F-7
INVESTORS REAL ESTATE TRUST AND SUBSIDIARIES
CONSOLIDATED STATEMENTS OF EQUITY (continued)
NUMBER | ACCUMULATED | ACCUMULATED | |||||||||||||||||||
OF | DISTRIBUTIONS | OTHER | NONREDEEMABLE | ||||||||||||||||||
PREFERRED | COMMON | COMMON | IN EXCESS OF | COMPREHENSIVE | NONCONTROLLING | TOTAL | |||||||||||||||
SHARES | SHARES | SHARES | NET INCOME | INCOME | INTERESTS | EQUITY | |||||||||||||||
Balance at April 30, 2017 | $ | 111,357 | 121,199 | $ | 916,121 | $ | (466,541 | ) | $ | — | $ | 75,157 | $ | 636,094 | |||||||
Net income attributable to Investors Real Estate Trust and nonredeemable noncontrolling interests | 116,788 | 11,582 | 128,370 | ||||||||||||||||||
Other comprehensive income - derivative instrument | 1,779 | 1,779 | |||||||||||||||||||
Distributions – common shares and units | (33,689 | ) | (4,096 | ) | (37,785 | ) | |||||||||||||||
Distributions – Series B preferred shares | (4,571 | ) | (4,571 | ) | |||||||||||||||||
Distributions – Series C preferred shares | (3,999 | ) | (3,999 | ) | |||||||||||||||||
Share-based compensation, net of forfeitures | 96 | 1,663 | 1,663 | ||||||||||||||||||
Issuance of Series C preferred shares | 99,456 | 99,456 | |||||||||||||||||||
Redemption of units for common shares | 29 | 34 | (34 | ) | — | ||||||||||||||||
Redemption of units for cash | (8,775 | ) | (8,775 | ) | |||||||||||||||||
Shares repurchased | (111,357 | ) | (1,780 | ) | (9,935 | ) | (3,657 | ) | (124,949 | ) | |||||||||||
Contributions from nonredeemable noncontrolling interests – consolidated real estate entities | 619 | 619 | |||||||||||||||||||
Conversion to equity of notes receivable from nonredeemable noncontrolling interests – consolidated real estate entities | (246 | ) | (246 | ) | |||||||||||||||||
Other | (18 | ) | (40 | ) | (117 | ) | (157 | ) | |||||||||||||
Balance at April 30, 2018 | $ | 99,456 | 119,526 | $ | 907,843 | $ | (395,669 | ) | $ | 1,779 | $ | 74,090 | $ | 687,499 | |||||||
See Notes to Consolidated Financial Statements.
F-8
(in thousands) | ||||||||||
Year Ended April 30, | ||||||||||
2018 | 2017 | 2016 | ||||||||
CASH FLOWS FROM OPERATING ACTIVITIES | ||||||||||
Net income | $ | 127,629 | $ | 30,525 | $ | 76,602 | ||||
Adjustments to reconcile net income to net cash provided by operating activities: | ||||||||||
Depreciation and amortization | 83,276 | 46,135 | 41,098 | |||||||
Depreciation and amortization from discontinued operations | 8,526 | 10,477 | 24,357 | |||||||
Gain on sale of real estate, land, other investments and discontinued operations | (183,687 | ) | (74,847 | ) | (33,423 | ) | ||||
(Gain) loss on extinguishment of debt and discontinued operations | 608 | 1,041 | (35,552 | ) | ||||||
Gain on bargain purchase | — | — | (3,424 | ) | ||||||
Share-based compensation expense | 1,587 | 6 | 2,256 | |||||||
Impairment of real estate investments | 18,065 | 57,028 | 5,983 | |||||||
Other, net | 1,457 | 499 | 651 | |||||||
Write off of development pursuit costs | — | 3,161 | — | |||||||
Changes in other assets and liabilities: | ||||||||||
Other assets | (1,575 | ) | (2,529 | ) | 2,237 | |||||
Accounts payable and accrued expenses | (7,851 | ) | 2,434 | (14,292 | ) | |||||
Net cash provided (used) by operating activities | 48,035 | 73,930 | 66,493 | |||||||
CASH FLOWS FROM INVESTING ACTIVITIES | ||||||||||
Proceeds from real estate deposits | 154,927 | 1,370 | 5,203 | |||||||
Payments for real estate deposits | (131,268 | ) | (25,029 | ) | (2,714 | ) | ||||
Increase in loans receivable | (15,480 | ) | — | — | ||||||
Decrease in other investments | — | 50 | 279 | |||||||
Decrease in lender holdbacks for improvements | 1,619 | 2,665 | 4,347 | |||||||
Increase in lender holdbacks for improvements | (1,201 | ) | (903 | ) | (1,136 | ) | ||||
Proceeds from sale of discontinued operations | 426,131 | 237,135 | 365,845 | |||||||
Proceeds from sale of real estate and other investments | 64,639 | 47,354 | 40,306 | |||||||
Insurance proceeds received | 584 | 88 | 1,320 | |||||||
Payments for acquisitions of real estate assets | (374,081 | ) | — | (121,821 | ) | |||||
Payments for development and re-development of real estate assets | (2,655 | ) | (18,274 | ) | (122,801 | ) | ||||
Payments for improvements of real estate assets | (17,980 | ) | (41,083 | ) | (26,904 | ) | ||||
Payments for improvements of real estate assets from discontinued operations | (1,046 | ) | (1,110 | ) | (7,672 | ) | ||||
Net cash provided (used) by investing activities | 104,189 | 202,263 | 134,252 | |||||||
CASH FLOWS FROM FINANCING ACTIVITIES | ||||||||||
Proceeds from mortgages payable | — | 84,150 | 143,574 | |||||||
Principal payments on mortgages payable | (198,320 | ) | (295,136 | ) | (234,885 | ) | ||||
Proceeds from revolving lines of credit | 370,350 | 246,000 | 82,000 | |||||||
Principal payments on revolving lines of credit | (303,400 | ) | (206,450 | ) | (125,000 | ) | ||||
Proceeds from notes payable and other debt | 3,252 | 19,341 | 94,142 | |||||||
Principal payments on notes payable and other debt | (21,689 | ) | (49,080 | ) | (24,754 | ) | ||||
Payoff of financing liability | (7,900 | ) | — | — | ||||||
Proceeds from term loan | 69,462 | — | — | |||||||
Proceeds from sale of common shares under distribution reinvestment and share purchase program | — | — | 1,493 | |||||||
Additions to notes receivable from noncontrolling partner – consolidated real estate entities | — | (9,211 | ) | — | ||||||
Proceeds from noncontrolling partner – consolidated real estate entities | — | 9,749 | 1,120 | |||||||
Payments for acquisition of noncontrolling interests – consolidated real estate entities | — | (4,938 | ) | — | ||||||
Proceeds from sale of preferred shares | 99,467 | — | — | |||||||
Repurchase of common shares | (9,935 | ) | (4,501 | ) | (35,000 | ) | ||||
Repurchase of preferred shares | (115,017 | ) | (28,752 | ) | — | |||||
Repurchase of partnership units | (8,775 | ) | (966 | ) | — | |||||
Distributions paid to common shareholders | (33,689 | ) | (55,907 | ) | (60,063 | ) | ||||
Distributions paid to preferred shareholders | (8,763 | ) | (10,744 | ) | (11,514 | ) | ||||
Distributions paid to noncontrolling interests – Unitholders of the Operating Partnership | (4,096 | ) | (7,453 | ) | (7,101 | ) | ||||
Distributions paid to noncontrolling interests – consolidated real estate entities | (99 | ) | (174 | ) | (7,029 | ) | ||||
Net cash provided (used) by financing activities | (169,152 | ) | (314,072 | ) | (183,017 | ) | ||||
NET INCREASE (DECREASE) IN CASH AND CASH EQUIVALENTS | (16,928 | ) | (37,879 | ) | 17,728 | |||||
CASH AND CASH EQUIVALENTS AT BEGINNING OF YEAR | 28,819 | 66,698 | 48,970 | |||||||
CASH AND CASH EQUIVALENTS AT END OF YEAR | $ | 11,891 | $ | 28,819 | $ | 66,698 | ||||
F-9
INVESTORS REAL ESTATE TRUST AND SUBSIDIARIES
CONSOLIDATED STATEMENTS OF CASH FLOWS (continued)
(in thousands) | ||||||||||
Year Ended April 30, | ||||||||||
2018 | 2017 | 2016 | ||||||||
SUPPLEMENTARY SCHEDULE OF NON-CASH INVESTING AND FINANCING ACTIVITIES | ||||||||||
Distribution reinvestment plan – shares issued | — | — | 3,997 | |||||||
Operating partnership distribution reinvestment plan – shares issued | — | — | 130 | |||||||
Operating partnership units converted to shares | 34 | 875 | 1,477 | |||||||
Real estate assets acquired through the issuance of operating partnership units | — | — | 18,226 | |||||||
(Decrease) increase to accounts payable included within real estate investments | (3,415 | ) | (1,851 | ) | (10,420 | ) | ||||
Conversion to equity of notes receivable from noncontrolling interests – consolidated real estate entities | — | 9,846 | — | |||||||
Construction debt reclassified to mortgages payable | 23,300 | 10,549 | 123,553 | |||||||
Increase in mortgage notes receivable | 10,329 | — | — | |||||||
Decrease in real estate assets in connection with transfer of real estate assets in settlement of debt | — | — | 87,213 | |||||||
Decrease in debt in connection with transfer of real estate assets in settlement of debt | — | — | 122,610 | |||||||
SUPPLEMENTAL DISCLOSURE OF CASH FLOW INFORMATION | ||||||||||
Cash paid for interest, net of amounts capitalized of $4, $431 and $4,396, respectively | 35,758 | 34,432 | 39,668 | |||||||
See Notes to Consolidated Financial Statements.
F-10
INVESTORS REAL ESTATE TRUST AND SUBSIDIARIES
NOTES TO CONSOLIDATED FINANCIAL STATEMENTS
April 30, 2018, 2017, and 2016
NOTE 1 • ORGANIZATION
Investors Real Estate Trust (“IRET,” “we” or “us”) is a real estate investment trust (“REIT”) focused on the ownership, management, acquisition, redevelopment and development of apartment communities. As of April 30, 2018, we held for investment 90 apartment communities with 14,176 apartment homes. We conduct a majority of our business activities through our consolidated operating partnership, IRET Properties, a North Dakota Limited Partnership (the “Operating Partnership”), as well as through a number of other subsidiary entities.
All references to IRET, we, or us refer to Investors Real Estate Trust and its consolidated subsidiaries.
NOTE 2 • BASIS OF PRESENTATION AND SIGNIFICANT ACCOUNTING POLICIES
BASIS OF PRESENTATION
The accompanying consolidated financial statements include our accounts and the accounts of all our subsidiaries in which we maintain a controlling interest, including the Operating Partnership. All intercompany balances and transactions are eliminated in consolidation. Our fiscal year ends April 30th. Our interest in the Operating Partnership was 89.4% and 88.6%, respectively, of the limited partnership units of the Operating Partnership (“Units”) as of April 30, 2018 and 2017, which includes 100% of the general partnership interest.
The consolidated financial statements also reflect the ownership by the Operating Partnership of certain joint venture entities in which the Operating Partnership has a general partner's or controlling interest. These entities are consolidated into our other operations with noncontrolling interests reflecting the noncontrolling partners’ share of ownership, income, and expenses.
USE OF ESTIMATES
The preparation of financial statements in conformity with GAAP requires management to make estimates and assumptions that affect the reported amounts of assets and liabilities and disclosure of contingent assets and liabilities at the date of the financial statements and the reported amounts of revenues and expenses during the reporting period. Actual results could differ from those estimates.
TAX CUTS AND JOBS ACT OF 2017
The Tax Cuts and Jobs Act of 2017 was passed on December 22, 2017. This Act includes a number of changes to the corporate income tax system, including (1) a reduction in the statutory federal corporate income tax rate from 35% to 21% for non-REIT “C” corporations, (2) changes to deductions for certain pass-through business income, and (3) potential limitations on interest expense, depreciation, and the deductibility of executive compensation. As a REIT, we generally will not be subject to federal income tax on our taxable income at the corporate level and do not believe that any of the changes from the Tax Cut and Jobs Act of 2017 will have a material impact on our consolidated financial statements. However, the full impact of this Act is not yet fully known, and there can be no assurance that it will not have an adverse impact on our results of operations.
RECENT ACCOUNTING PRONOUNCEMENTS
The following table provides a brief description of recent GAAP accounting standards updates (“ASUs”).
F-11
Standard | Description | Date of Adoption | Effect on the Financial Statements or Other Significant Matters |
ASU 2014-09, Revenue from Contracts with Customers | This ASU will eliminate the transaction- and industry-specific revenue recognition guidance under current GAAP and replace it with a principle based approach for determining revenue recognition. The standard outlines a five-step model whereby revenue is recognized as performance obligations within a contract are satisfied. | This ASU is effective for annual reporting periods beginning after December 15, 2017, as a result of a deferral of the effective date arising from the issuance of ASU 2015-14, Revenue from Contracts with Customers - Deferral of the Effective Date. Early adoption is permitted. We will adopt the new standard effective May 1, 2018 using the modified retrospective approach. | The majority of our revenue is derived from rental income, which is scoped out from this standard and will be accounted for under ASC 840, Leases. Our other revenue streams were evaluated under this ASU and we determined the new standard will not have a material impact on our consolidated financial statements. |
ASU 2016-02, Leases | This ASU amends existing accounting standards for lease accounting, including by requiring lessees to recognize most leases on the balance sheet and making certain changes to lessor accounting. | This ASU is effective for annual reporting periods beginning after December 15, 2018. Early adoption is permitted. | We do not anticipate significant changes in the timing of income from our leases with residents. However, in certain circumstances where we are a lessee, primarily in leases for office space, we will be required to recognize right of use assets and related lease liabilities on our consolidated balance sheets. We do not anticipate the adoption of this standard will have a material impact on our financial condition or results of operations. We are in the process of determining the amount of the right of use assets and related lease liabilities that will be recognized upon adoption. |
ASU 2016-09, Improvements to Employee Share-Based Payment Accounting | This ASU amends several aspects of the accounting for share-based payment transactions, including the income tax consequences, accrual of compensation cost, classification of awards as either equity or liabilities, and classification on the statement of cash flows. | This ASU is effective for annual reporting periods beginning after December 15, 2016. We adopted this guidance effective May 1, 2017. | Upon adoption of the standard, we elected to account for forfeitures when they occur instead of estimating the forfeitures. The new standard did not have a material effect on our financial position, results of operations or earnings per share. |
ASU 2016-15, Classification of Certain Cash Receipts and Cash Payments | This ASU addresses eight specific cash flow issues with the objective of reducing diversity in practice. The cash flow issues include debt prepayment or debt extinguishment costs and proceeds from the settlement of insurance claims. | This ASU is effective for fiscal years beginning after December 15, 2017, and interim periods within those fiscal years. Early adoption is permitted. | This guidance is effective May 1, 2018. Payments related to debt prepayment or debt extinguishment costs are required to be classified within financing activities. While overall cash flows will not change, there will be changes between cash flow classifications due primarily to the debt prepayment penalties incurred in comparative periods. |
ASU 2017-01, Clarifying the Definition of a Business | This ASU clarifies the definition of a business and provides further guidance for evaluating whether a transaction will be accounted for as an acquisition of an asset or a business. This new standard is required to be applied prospectively to transactions occurring after the date of adoption. | This ASU is effective for annual periods beginning after December 15, 2017, including interim periods within those annual periods. Early adoption is permitted. We adopted this standard effective May 1, 2017. | We believe that most of our future acquisitions of operating properties will qualify as asset acquisitions and most future transaction costs associated with these acquisitions will be capitalized. Adoption of the standard did not have a material effect on our financial position or results of operations. During the fiscal year ended April 30, 2018, acquisition costs totaling $411,536 were capitalized and allocated to the assets acquired based on the relative fair market value of those underlying assets. |
F-12
Standard | Description | Date of Adoption | Effect on the Financial Statements or Other Significant Matters |
ASU 2017-05, Other Income – Gains and Losses from the Derecognition of Nonfinancial Assets (Subtopic 610-20): Clarifying the Scope of Asset Derecognition Guidance and Accounting for Partial Sales of Nonfinancial Assets | This ASU clarifies the definition of an in-substance nonfinancial asset and changes the accounting for partial sales of nonfinancial assets to be more consistent with the accounting for a sale of a business pursuant to ASU 2017-01. This ASU allows for either a retrospective or modified retrospective approach. | This ASU is effective for annual reporting periods beginning after December 15, 2017, including interim reporting periods within that reporting period. Early adoption is permitted. | This standard allows for either a retrospective or modified retrospective approach. We are currently evaluating the impact this standard may have on our consolidated financial statements and related disclosures upon adoption. |
ASU 2017-12, Derivatives and Hedging (Topic 815): Targeted Improvements to Accounting for Hedging Activities | This ASU clarifies hedge accounting requirements, improves disclosure of hedging arrangements, and better aligns risk management activities and financial reporting for hedging relationships. | This ASU is effective for annual periods beginning after December 15, 2018, and interim periods within those annual periods. Early adoption is permitted. We adopted ASU 2017-12 on November 1, 2017. | Adoption of the new standard did not have a material effect on our financial position or results of operations. See Note 6 for additional information. |
RECLASSIFICATIONS
Certain previously reported amounts have been reclassified to conform to the current financial statement presentation, these reclassifications had no impact on net income as reported in the consolidated statement of operations, total assets, liabilities or equity as reported in the consolidated balance sheets and total shareholder’s equity. We report in discontinued operations the results of operations and the related gains or losses of properties that have either been disposed or classified as held for sale and for which the disposition represents a strategic shift that has or will have a major effect on our operations and financial results. As the result of discontinued operations, retroactive reclassifications that change prior period numbers have been made. We classified as discontinued operations 27 healthcare properties that sold during fiscal year 2018. See Note 10 for additional information.
REAL ESTATE INVESTMENTS
Real estate investments are recorded at cost less accumulated depreciation and an adjustment for impairment, if any. Property, consisting primarily of real estate investments, totaled $1.4 billion and $1.1 billion as of April 30, 2018 and 2017, respectively. We allocate the purchase price based on the relative fair values of the tangible and intangible assets of an acquired property (which includes the land, building, and personal property) which are determined by valuing the property as if it were vacant and fair value of the intangible assets (which include in-place leases.) The as-if-vacant value is allocated to land, buildings and personal property based on management’s determination of the relative fair values of these assets. The estimated fair value of the property is the amount that would be recoverable upon the disposition of the property. Techniques used to estimate fair value include discounted cash flow analysis and reference to recent sales of comparables. A land value is assigned based on the purchase price if land is acquired separately or based on estimated fair value if acquired in a single or portfolio acquisition.
Acquired above- and below-market lease values are recorded as the difference between the contractual amounts to be paid pursuant to the in-place leases and management’s estimate of fair market value lease rates for the corresponding in-place leases. The capitalized above- and below-market lease values are amortized as adjustments to rental revenue over the remaining terms of the respective leases, which includes fixed rate renewal options for below-market leases if it is determined probable the tenant will execute a bargain renewal option.
F-13
Other intangible assets acquired include amounts for in-place lease values that are based upon our evaluation of the specific characteristics of the leases. Factors considered in the fair value analysis include an estimate of carrying costs and foregone rental income during hypothetical expected lease-up periods, considering current market conditions, and costs to execute similar leases. We also consider information about each property obtained during pre-acquisition due diligence, marketing, and leasing activities in estimating the relative fair value of the tangible and intangible assets acquired.
Depreciation is computed on a straight-line basis over the estimated useful lives of the assets. We use a 10-37 year estimated life for buildings and improvements and a 5-10 year estimated life for furniture, fixtures, and equipment.
We follow the real estate project costs guidance in ASC 970, Real Estate – General, in accounting for the costs of development and redevelopment projects. As real estate is undergoing development or redevelopment, all project costs directly associated with and attributable to the development and construction of a project, including interest expense and real estate tax expense, are capitalized to the cost of the real property. The capitalization period begins when development activities and expenditures begin and are identifiable to a specific property and ends upon completion, which is when the asset is ready for its intended use. Generally, rental property is considered substantially complete and ready for its intended use, which is generally upon issuance of a certificate of occupancy (in the case of apartment communities). General and administrative costs are expensed as incurred. Interest of approximately $4,000, $431,000, and $4.9 million has been capitalized in continuing and discontinue operations for the years ended April 30, 2018, 2017, and 2016, respectively.
Expenditures for ordinary maintenance and repairs are expensed to operations as incurred. Renovations and improvements that improve and/or extend the useful life of the asset are capitalized and depreciated over their estimated useful life, generally five to ten years. Property sales or dispositions are recorded when title transfers, we have received sufficient consideration, and we have no significant continuing involvement with the property sold.
We periodically evaluate our long-lived assets, including real estate investments, for impairment indicators. The judgments regarding the existence of impairment indicators are based on factors such as operational performance, market conditions, expected holding period of each asset group, and legal and environmental concerns. If indicators exist, we compare the expected future undiscounted cash flows for the long-lived asset group against the carrying amount of that asset. If the sum of the estimated undiscounted cash flows is less than the carrying amount of the asset, an impairment loss is recorded for the difference between the estimated fair value and the carrying amount of the asset group. If our anticipated holding period for properties, the estimated fair value of properties or other factors change based on market conditions or otherwise, our evaluation of impairment charges may be different and such differences could be material to our consolidated financial statements. The evaluation of anticipated cash flows is subjective and is based, in part, on assumptions regarding future occupancy, rental rates, and capital requirements that could differ materially from actual results. Plans to hold properties over longer periods decrease the likelihood of recording impairment losses.
During fiscal year 2018, we incurred a loss of $18.1 million due to impairment of one apartment community, three other commercial properties, and four parcels of land. We recognized impairments of $12.2 million on one apartment community in Grand Forks, North Dakota; $1.4 million on an industrial property in Bloomington, Minnesota; $922,000 on an industrial property in Woodbury, Minnesota; $630,000 on a retail property in Minot, North Dakota. These properties were written-down to estimated fair value based on independent appraisals and market data or, in the case of the retail property, receipt of a market offer to purchase and our intent to dispose of the property. We recognized impairments of $428,000 on a parcel of land in Williston, North Dakota; $1.5 million on a parcel of land in Grand Forks, North Dakota; $256,000 and $709,000 on two parcels of land in Bismarck, North Dakota. These parcels were written down to estimated fair value based on independent appraisals and market data.
During fiscal year 2017, we incurred a loss of $57.0 million due to impairment of 16 apartment communities and two parcels of unimproved land. We recognized impairments of $40.9 million, $5.8 million, $4.7 million, and $2.8 million, respectively, on three apartment communities and one parcel of unimproved land in Williston, North Dakota, due to deterioration of this energy-impacted market, which resulted in poor leasing activity and declining rental rates during the three months ended July 31, 2016, which should generally be a strong leasing period. These properties were written down to estimated fair value based on an independent appraisal in the case of one property and management cash flow estimates and market data in the case of the remaining assets. The properties impaired for $40.9 million, $4.7 million, and $2.8 million are owned by joint venture entities in which, at the time of impairment, we had an approximately 70%, 60%, and 70% interest, respectively, but which are consolidated in our consolidated financial statements. We recognized impairments of $2.9 million on 13 properties and one parcel of land in Minot, North Dakota. These properties were written down to estimated fair value based on management cash flow estimates and market data and, in the case of the 13 properties, our intent to dispose of the properties.
F-14
During fiscal year 2016, we incurred a loss of $6.0 million due to impairment of one office property, one healthcare property, two parcels of land, and eight apartment communities of which approximately $440,000 is reflected in discontinued operations. See Note 10 for additional information on discontinued operations. We recognized impairments of approximately $440,000 on an office property in Eden Prairie, Minnesota; $1.9 million on a healthcare property in Sartell, Minnesota; $1.6 million on a parcel of land in Grand Chute, Wisconsin; $1.9 million on eight apartment communities in St. Cloud, Minnesota; and $162,000 on a parcel of land in River Falls, Wisconsin. These properties were written down to estimated fair value during fiscal year 2016 based on receipt of individual market offers to purchase and our intent to dispose of the properties or, in the case of the Grand Chute, Wisconsin, the sale listing price and our intent to dispose of the property. The Sartell, Minnesota property was classified as held for sale at April 30, 2016.
CHANGE IN DEPRECIABLE LIVES OF REAL ESTATE ASSETS
We review the estimated useful lives of our real estate assets on an ongoing basis. Prior to our strategic shift to become a multifamily-focused REIT, which began in fiscal year 2016, we operated in five segments (office, retail, industrial, healthcare and multifamily). Accordingly, our estimated useful lives represented a blend of these segments.
During fiscal years 2016 and 2017, we disposed of the bulk of our office, retail, and industrial portfolios as well as a portion of our healthcare portfolio. In the first quarter of fiscal year 2018, we determined it was appropriate to review and adjust our estimated useful lives to be specific to our remaining asset portfolio. Effective May 1, 2017, we changed the estimated useful lives of our real estate assets to better reflect the estimated periods during which they will be of economic benefit. Generally, the estimated lives of buildings and improvements that previously were 20-40 years have been decreased to 10-37 years, while those that were previously nine years were changed to 5-10 years. The effect of this change in estimate for the fiscal year ended April 30, 2018, was to increase depreciation expense by approximately $29.3 million, decrease net income by $29.3 million, and decrease earnings per share by $0.22. In the first quarter of fiscal year 2018, $9.0 million, or $0.07 per share, represented depreciation on assets that became fully depreciated under the new estimated useful lives.
REAL ESTATE HELD FOR SALE
Real estate held for sale is stated at the lower of its carrying amount or estimated fair value less disposal costs. Our determination of fair value is based on inputs management believes are consistent with those that market participants would use. Estimates are significantly impacted by estimates of sales price, selling velocity, and other factors. Due to uncertainties in the estimation process, actual results could differ from such estimates. Depreciation is not recorded on assets classified as held for sale.
We classify properties as held for sale when they meet the GAAP criteria, which include: (a) management commits to and initiates a plan to sell the asset (disposal group), (b) the sale is probable and expected to be completed within one year under terms that are usual and customary for sales of such assets (disposal groups), and (c) actions required to complete the plan indicate that it is unlikely that significant changes to the plan will be made or that the plan will be withdrawn. We generally consider these criteria met when the transaction has been approved by our Board of Trustees, there are no known significant contingencies related to the sale and management believes it is probable that the sale will be completed within one year. We had no properties classified as held for sale at April 30, 2018. Thirteen apartment communities, two healthcare properties, and two retail properties were classified as held for sale at April 30, 2017.
We report in discontinued operations the results of operations and the related gains or losses on the sales of properties that have either been disposed of or classified as held for sale and meet the classification of a discontinued operation as described in ASC 205 - Presentation of Financial Statements and ASC 360 - Property, Plant, and Equipment: Reporting Discontinued Operations and Disclosures of Disposals of Components of an Entity. Under this standard, a disposal (or classification as held for sale) of a component of an entity or a group of components of an entity is required to be reported in discontinued operations if the disposal represents a strategic shift that has (or will have) a major effect on an entity’s operations and financial results.
PROPERTY AND EQUIPMENT
Property and equipment consists primarily of office equipment contained at our headquarters in Minot, North Dakota, corporate offices in Minneapolis and St. Cloud, Minnesota, and additional property management offices located in the states where we own properties. The Consolidated Balance Sheets reflects these assets at cost, net of accumulated depreciation and are included within Other Assets. As of April 30, 2018 and 2017, property and equipment cost was $2.1 million and $2.1 million, respectively. Accumulated depreciation was $1.3 million and $1.2 million as of April 30, 2018 and 2017, respectively, and are included within other assets in the Consolidated Balance Sheets.
F-15
CASH AND CASH EQUIVALENTS
Cash and cash equivalents include all cash and highly liquid investments purchased with maturities of three months or less. Cash and cash equivalents consist of our bank deposits, short-term investment certificates acquired subject to repurchase agreements, and our deposits in a money market mutual fund. We are potentially exposed to credit risk for cash deposited with FDIC-insured financial institutions in accounts which, at times, may exceed federally insured limits. We have not experienced any losses in such accounts.
RESTRICTED CASH
As of April 30, 2018 and 2017, restricted cash consisted of $4.2 million and $4.3 million, respectively, of escrows held by lenders for real estate taxes, insurance, and capital additions. As of April 30, 2017, we held $23.7 million of net tax-deferred exchange proceeds remaining from the sale of properties. Tax, insurance, and other escrows include funds deposited with a lender for payment of real estate taxes and insurance and reserves for funds to be used for replacement of structural elements and mechanical equipment of certain projects. The funds are under the control of the lender. Disbursements are made after supplying written documentation to the lender.
OTHER ASSETS
As of April 30, 2018 and 2017, other assets consisted of the following amounts:
in thousands | ||||||
2018 | 2017 | |||||
Receivable arising from straight line rents | $ | 1,458 | $ | 2,145 | ||
Accounts receivable | 2,583 | 2,626 | ||||
Fair value of interest rate swap | 1,779 | — | ||||
Loans receivable | 15,480 | — | ||||
Prepaid and other assets | 2,832 | 2,741 | ||||
Intangible assets | 1,469 | 202 | ||||
Property and equipment, net of accumulated depreciation | 820 | 901 | ||||
Goodwill | 1,553 | 1,572 | ||||
Deferred charges and leasing costs | 2,323 | 3,119 | ||||
Total Other Assets | $ | 30,297 | $ | 13,306 | ||
INCOME TAXES
We operate in a manner intended to enable us to continue to qualify as a REIT under Sections 856-860 of the Internal Revenue Code of 1986, as amended. Under those sections, a REIT which distributes at least 90% of its REIT taxable income, excluding capital gains, as a dividend to its shareholders each year and which meets certain other conditions will not be taxed on that portion of its taxable income which is distributed to shareholders. For the fiscal years ended April 30, 2018, 2017, and 2016, we distributed in excess of 90% of our taxable income and realized capital gains from property dispositions within the prescribed time limits. Accordingly, no provision has been made for federal income taxes in the accompanying consolidated financial statements. If we fail to qualify as a REIT in any taxable year, we will be subject to federal income tax on our taxable income at regular corporate rates (including any alternative minimum tax) and may not be able to qualify as a REIT for the four subsequent taxable years. Even as a REIT, we may be subject to certain state and local income and property taxes, and to federal income and excise taxes on undistributed taxable income. In general, however, if we qualify as a REIT, no provisions for federal income taxes are necessary except for taxes on undistributed REIT taxable income and taxes on the income generated by a taxable REIT subsidiary (TRS).
We have one TRS, acquired during the second quarter of fiscal year 2014, which is subject to corporate federal and state income taxes on its taxable income at regular statutory rates. For the fiscal year ended April 30, 2018, we estimate that the TRS will have no taxable income. There were no income tax provisions or material deferred income tax items for our TRS for the fiscal years ended April 30, 2018, 2017, and 2016.
F-16
We conduct our business activity as an Umbrella Partnership Real Estate Investment Trust (“UPREIT”) through our Operating Partnership. UPREIT status allows us to accept the contribution of real estate in exchange for Units. Generally, such a contribution to a limited partnership allows for the deferral of gain by an owner of appreciated real estate.
Distributions for the calendar year ended December 31, 2017, were characterized, for federal income tax purposes, as 14.59% ordinary income, 48.87% capital gain, and 36.54% return of capital. Distributions for the calendar year ended December 31, 2016 were characterized, for federal income tax purposes, as 12.43% ordinary income and 87.57% capital gain.
REVENUE RECOGNITION
The Company primarily leases apartment homes under operating leases with terms generally of one year or less. Rental revenue is recognized on the straight-line basis, which averages minimum required rents over the terms of the leases. Rental income represents gross market rent less adjustments for concessions, vacancy loss, and bad debt. Rents recognized in advance of collection are reflected as receivable arising from straight-lining of rents, net of allowance for doubtful accounts. Rent concessions, including free rent, are amortized on a straight-line basis over the terms of the related leases.
PROCEEDS FROM FINANCING LIABILITY
During the first quarter of fiscal year 2014, we sold a senior housing property in exchange for $7.9 million in cash and a $29.0 million contract for deed which matures August 1, 2018. The buyer leased the property back to us, and also granted us an option to repurchase the property at a specified price at or prior to July 31, 2018. We accounted for the transaction as a financing due to our continuing involvement with the property and recorded the $7.9 million in sales proceeds within liabilities held for sale and liabilities from discontinued operations on the Consolidated Balance Sheets. As of April 30, 2018, we no longer have the liability as we exercised our option to repurchase the property during the year ended April 30, 2018.
MORTGAGE LOANS RECEIVABLE AND NOTES RECEIVABLE
In August 2017, we sold 13 apartment communities in exchange for cash and a note secured by a mortgage on the assets. The sale was recorded using the installment method, under which cash receipts are apportioned between cost recovered and the gain on sale. The $11.0 million note is presented net of $626,000 of deferred gain in mortgage loans receivable on our Consolidated Balance Sheets. The note bears an interest rate of 5.5% and matures in August 2020. Monthly payments are interest-only, with the principal balance payable at maturity. During the fiscal year ended April 30, 2018, we received and recognized approximately $372,000 of interest income.
In July 2017, we originated a $16.2 million loan in a multifamily development located in New Hope, MN, a Minneapolis suburb. The investment will be funded in installments through the first quarter of fiscal year 2019. As of April 30, 2018, we had funded $15.5 million, which appears in other assets on our Consolidated Balance Sheets. The note bears an interest rate of 6%, matures in July 2023, and provides us an option to purchase the development prior to the loan maturity date.
VARIABLE INTEREST ENTITY
As discussed in the Recent Accounting Pronouncements section, effective May 1, 2016, we adopted the guidance in ASU 2015-02. As a result, the Operating Partnership and each of our less-than-wholly owned real estate partnerships have been deemed to have the characteristics of a variable interest entity (“VIE”). However, we were not required to consolidate any previously unconsolidated entities or deconsolidate any previously consolidated entities as a result of the change in classification. Accordingly, there has been no change to the recognized amounts in our consolidated balance sheets and statements of operations or amounts reported in our consolidated statements of cash flows. We determined that an additional six consolidated partnerships, including the Operating Partnership, are VIEs under the new standard because the limited partners are not able to exercise substantive kick-out or participating rights. We are the VIEs primary beneficiary and the partnerships are required to be consolidated on our balance sheet because we have a controlling financial interest in the VIEs and have both the power to direct the activities of the VIEs that most significantly impact the VIE’s economic performance as well as the obligation to absorb losses or the right to receive benefits from the VIEs that could potentially be significant to the VIEs. Because the Operating Partnership is a VIE, all of our assets and liabilities are held through a VIE.
F-17
GAIN ON BARGAIN PURCHASE
During fiscal year 2016, we acquired an apartment community in Rochester, MN, which had a fair value at acquisition of approximately $36.3 million, as appraised by a third party. The consideration exchanged for the property consisted of $15.0 million cash and approximately 2.5 million Units, valued at approximately $17.8 million. The fair value of the Units transferred was based on the closing market price of our common shares on the acquisition date of $7.09 per share. The acquisition resulted in a gain on bargain purchase because the fair value of assets acquired exceeded the total of the fair value of the consideration paid by approximately $3.4 million. The seller accepted consideration below the fair value of the property in order to do a partial tax-deferred exchange for Units.
NOTE 3 • NONCONTROLLING INTERESTS
Interests in the Operating Partnership held by limited partners are represented by Units. The Operating Partnership’s income is allocated to holders of Units based upon the ratio of their holdings to the total Units outstanding during the period. Capital contributions, distributions, and profits and losses are allocated to noncontrolling interests in accordance with the terms of the Operating Partnership’s Agreement of Limited Partnership.
We reflect noncontrolling interests in consolidated real estate entities on the Balance Sheet for the portion of properties consolidated by us that are not wholly owned by us. The earnings or losses from these properties attributable to the noncontrolling interests are reflected as net income attributable to noncontrolling interests – consolidated real estate entities in the Consolidated Statements of Operations. Our noncontrolling interests – consolidated real estate entities at April 30, 2018 and 2017 were as follows:
(in thousands) | |||||||
April 30, 2018 | April 30, 2017 | ||||||
IRET-71 France, LLC | $ | 6,604 | $ | 7,425 | |||
IRET-Cypress Court Apartments, LLC | 897 | 986 | |||||
IRET-Williston Garden Apartments, LLC | 1,371 | 1,057 | |||||
IRET - WRH 1, LLC | (8,018 | ) | (7,904 | ) | |||
WRH Holding, LLC | 224 | 360 | |||||
Noncontrolling interests – consolidated real estate entities | $ | 1,078 | $ | 1,924 | |||
NOTE 4 • REDEEMABLE NONCONTROLLING INTERESTS
Redeemable noncontrolling interests on our Consolidated Balance Sheets represent the noncontrolling interest in a joint venture in which our unaffiliated partner, at its election, could require us to buy its interest at a purchase price to be determined by an appraisal conducted in accordance with the terms of the agreement, or at a negotiated price. Redeemable noncontrolling interests are presented at the greater of their carrying amount or redemption value at the end of each reporting period. Changes in the value from period to period are charged to common shares on our Consolidated Balance Sheets. We currently have one joint venture, which owns Commons and Landing at Southgate in Minot, North Dakota, in which our joint venture partner can, for the four-year period from February 6, 2016 through February 5, 2020, compel us to acquire its interest for a price to be determined in accordance with the provisions of the joint venture agreement. Below is a table reflecting the activity of the redeemable noncontrolling interests.
(in thousands) | ||||||||||
2018 | 2017 | 2016 | ||||||||
Balance at beginning of fiscal year | $ | 7,181 | $ | 7,522 | $ | 6,368 | ||||
Contributions | 268 | 81 | 1,120 | |||||||
Net (loss) income | (741 | ) | (422 | ) | 34 | |||||
Balance at close of fiscal year | $ | 6,708 | $ | 7,181 | $ | 7,522 | ||||
NOTE 5 • DEBT
As of April 30, 2018, we owned 99 properties, of which 58 multifamily and other properties (with a carrying amount of $512.1 million) served as collateral for mortgage loans and 41 multifamily and other properties were unencumbered by mortgages. Of the 58 properties that served as collateral for mortgage loans, the majority of these mortgages payable were non-recourse to us
F-18
other than for standard carve-out obligations. Interest rates on mortgage loans range from 3.47% to 6.66%, and the mortgage loans have varying maturity dates from June 1, 2018, through May 31, 2035. As of April 30, 2018, we believe there are no material defaults or material compliance issues in regards to any of these mortgage loans.
The aggregate amount of required future principal payments on mortgages payable as of April 30, 2018 is as follows:
Year Ended April 30, | (in thousands) | |||
2019 | $ | 25,002 | ||
2020 | 114,520 | |||
2021 | 92,182 | |||
2022 | 70,509 | |||
2023 | 27,497 | |||
Thereafter | 182,430 | |||
Total payments | $ | 512,140 | ||
As noted above, as of April 30, 2018, we owned 41 multifamily and other properties that were not encumbered by mortgages, with 30 of these properties providing credit support for our unsecured borrowings. Our primary unsecured credit facility is a revolving, multi-bank line of credit, with the BMO Harris Bank N.A. serving as administrative agent. Our line of credit has total commitments of $300.0 million (the “Line of Credit”), with borrowing capacity based on the value of properties contained in the unencumbered asset pool (“UAP”). The UAP provided for a borrowing capacity of $300.0 million at fiscal year-end, providing additional borrowing availability of $176.0 million beyond the $124.0 million drawn as of April 30, 2018, priced at an interest rate of 3.66%. This credit facility matures on January 31, 2021, with one 12-month option to extend the maturity date at our election. At April 30, 2017, the line of credit borrowing capacity was $206.0 million based on the UAP, of which $57.1 million was drawn on the line.
During the fiscal year ended April 30, 2018, we entered into a $70.0 million unsecured term loan, which matures on January 31, 2023. In addition, we increased the credit capacity of our revolving Line of Credit from $250.0 million to $300.0 million, and maintain a $200.0 million accordion option that can be accessed by increasing lending commitments under the current agreement.
The interest rates on the line of credit and term loan are based on the lender's base rate plus a margin, ranging from 60-125 basis points, or the London Interbank Offered Rate (“LIBOR”) plus a margin that ranges from 160-225 basis points based on our consolidated leverage. Our line of credit and term loan are subject to customary financial covenants and limitations. We believe that we are in compliance with all such financial covenants and limitations as of April 30, 2018.
During the quarter ended April 30, 2018, we also closed on a $6.0 million operating line of credit. This operating line of credit is designed to enhance treasury management activities and more effectively manage cash balances. This operating line has a one-year term, with pricing based on a market spread plus the one-month LIBOR index rate. As of April 30, 2018, we have not drawn on this line of credit.
Our remaining construction debt was paid off during the year ended April 30, 2018. Construction debt at April 30, 2017, was $41.7 million, with a weighted average rate of interest of 3.27%.
F-19
The following table summarizes our indebtedness at April 30, 2018:
(in thousands) | ||||||||
April 30, 2018 | April 30, 2017 | Weighted Average Maturity in Years | ||||||
Unsecured line of credit | $ | 124,000 | $ | 57,050 | 3.0 | |||
Term loan | 70,000 | — | 4.0 | |||||
Unsecured debt | 194,000 | 57,050 | ||||||
Mortgages payable - fixed (1) | 489,401 | 629,535 | 6.3 | |||||
Mortgages payable - variable(1) | 22,739 | 57,708 | 3.3 | |||||
Construction debt - variable | — | 41,737 | ||||||
Total debt | $ | 706,140 | $ | 786,030 | ||||
Weighted average interest rate on unsecured line of credit | 3.35 | % | 2.67 | % | ||||
Weighted average interest rate on term loan (rate with swap) | 3.86 | % | — | |||||
Weighted average interest rate on mortgages payable(1) | 4.69 | % | 4.71 | % | ||||
Weighted average interest rate on construction debt | — | 3.27 | % | |||||
(1) | Includes mortgages payable related to assets held for sale and assets of discontinued operations at April 30, 2017. |
NOTE 6 • DERIVATIVE INSTRUMENT
Our objective in using an interest rate derivative is to hedge our exposure to the variability in cash flows of our floating-rate debt. To accomplish this objective, during the fiscal year ended April 30, 2018, we entered into an interest rate swap contract to fix the variable interest rate on our term loan. The interest rate swap had a $70.0 million notional amount and qualified as a cash flow hedge.
Under ASU 2017-12, Derivatives and Hedging (Topic 815): Targeted Improvements to Accounting for Hedging Activities, which we adopted on November 1, 2017, the ineffective portion of a hedging instrument is no longer required to be recognized currently in earnings or disclosed. Changes in the fair value of cash flow hedges are recorded in accumulated other comprehensive income and subsequently reclassified into earnings in the period that the hedged transaction affects earnings. Amounts reported in accumulated other comprehensive income for our interest rate swap will be reclassified to interest expense as interest payments are made on our term loan.
The gain recognized in other comprehensive income for the fiscal year ended April 30, 2018, was $1.6 million, and the amount reclassified from accumulated other comprehensive income into interest expense during this period was $152,000. We anticipate reclassifying approximately $21,000 of hedge gains from accumulated other comprehensive income into earnings within the next 12 months to offset the variability of cash flows of the hedged item during this period. At April 30, 2018, the fair value of our interest rate swap included in other assets on our Consolidated Balance Sheets was $1.8 million.
NOTE 7 • TRANSACTIONS WITH RELATED PARTIES
Transactions with BMO Capital Markets
We have an historical and ongoing relationship with BMO Capital Markets (“BMO”). On July 17, 2017, we engaged BMO to provide financial advisory services in connection with the proposed disposition of our healthcare property portfolio. A family member of Mark O. Decker, Jr., our President and Chief Executive Officer, is an employee of BMO and could have an indirect material interest in any such engagement and related transaction(s). The Board pre-approved the engagement of BMO. During the fiscal year ended April 30, 2018, we completed the disposition of 27 of our 28 healthcare properties and paid BMO a transaction fee of $1.8 million in connection with this engagement.
NOTE 8 • ACQUISITIONS, DEVELOPMENT PROJECTS PLACED IN SERVICE AND DISPOSITIONS
ACQUISITIONS
We added $373.1 million of new apartment communities to our portfolio through acquisitions during the fiscal year ended April 30, 2018, compared to $0 in the fiscal year ended April 30, 2017. Our acquisitions during fiscal year 2018 qualified as asset acquisitions under ASU 2017-01, Clarifying the Definition of a Business, and are detailed below.
F-20
Fiscal 2018 (May 1, 2017 to April 30, 2018)
(in thousands) | |||||||||||||||||
Total | Form of Consideration | Investment Allocation | |||||||||||||||
Date | Acquisition | Intangible | |||||||||||||||
Acquisitions | Acquired | Cost | Cash | Land | Building | Assets | |||||||||||
Multifamily | |||||||||||||||||
191 homes - Oxbo - St. Paul, MN (1) | May 26, 2017 | $ | 61,500 | $ | 61,500 | $ | 5,809 | $ | 54,910 | $ | 781 | ||||||
500 homes - Park Place - Plymouth, MN | September 13, 2017 | 92,250 | 92,250 | 10,609 | 80,711 | 930 | |||||||||||
274 homes - Dylan - Denver, CO | November 28, 2017 | 90,600 | 90,600 | 12,155 | 77,249 | 1,196 | |||||||||||
390 homes - Westend - Denver, CO | March 28, 2018 | 128,700 | 128,700 | 25,525 | 102,101 | 1,074 | |||||||||||
Total Acquisitions | $ | 373,050 | $ | 373,050 | $ | 54,098 | $ | 314,971 | $ | 3,981 | |||||||
(1) | Property includes 11,477 square feet of retail space. |
DEVELOPMENT PROJECTS PLACED IN SERVICE
We placed $0 of development projects in service during fiscal year 2018, compared to$102.9 million in fiscal year 2017. The fiscal year 2017 development projects placed in service are detailed below.
Fiscal 2017 (May 1, 2016 to April 30, 2017)
(in thousands) | |||||||||||
Date Placed | Development | ||||||||||
Development Projects Placed in Service | in Service | Land | Building | Cost | |||||||
Multifamily | |||||||||||
241 homes - 71 France - Edina, MN(1) | May 1, 2016 | $ | 4,721 | $ | 67,641 | $ | 72,362 | ||||
202 homes - Monticello Crossings - Monticello, MN(2) | March 1, 2017 | $ | 1,734 | $ | 28,782 | $ | 30,516 | ||||
Total Development Projects Placed in Service | $ | 6,455 | $ | 96,423 | $ | 102,878 | |||||
(1) | Costs paid in prior fiscal years totaled $70.9 million. Additional costs incurred in fiscal year 2017 totaled $1.5 million, for a total project cost at April 30, 2017 of $72.4 million. The project is owned by a joint venture entity in which we currently have an approximately 52.6% interest. The joint venture is consolidated in our financial statements. |
(2) | Costs paid in prior fiscal years totaled $15.5 million. Additional costs incurred in fiscal year 2017 totaled $15.0 million, for a total project cost at April 30, 2017 of $30.5 million. |
DISPOSITIONS
During the fiscal year ended April 30, 2018, we sold 15 apartment communities, 2 senior housing properties, 28 medical office properties, 5 commercial properties and 2 parcels of unimproved land for a total sales price of $515.1 million. Dispositions totaled $286.9 million in fiscal year 2017. The fiscal year 2018 and 2017 dispositions are detailed below.
F-21
Fiscal 2018 (May 1, 2017 to April 30, 2018)
(in thousands) | |||||||||||
Date | Book Value | ||||||||||
Dispositions | Disposed | Sales Price | and Sales Cost | Gain/(Loss) | |||||||
Multifamily | |||||||||||
327 homes - 13 apartment communities - Minot, ND (1)(2) | August 22, 2017 | $ | 12,263 | $ | 11,562 | $ | 701 | ||||
48 homes - Crown - Rochester, MN | December 1, 2017 | 5,700 | 3,318 | 2,382 | |||||||
16 homes - Northern Valley - Rochester, MN | December 1, 2017 | 950 | 690 | 260 | |||||||
18,913 | 15,570 | 3,343 | |||||||||
Other | |||||||||||
4,998 sq ft Minot Southgate Wells Fargo Bank - Minot, ND | May 15, 2017 | 3,440 | 3,332 | 108 | |||||||
90,260 sq ft Lexington Commerce Center - Eagan, MN | August 22, 2017 | 9,000 | 3,963 | 5,037 | |||||||
17,640 sq ft Duckwood Medical - Eagan, MN | August 24, 2017 | 2,100 | 1,886 | 214 | |||||||
279,834 sq ft Edgewood Vista Hermantown I & II - Hermantown, MN | October 19, 2017 | 36,884 | 24,697 | 12,187 | |||||||
518,161 sq ft Urbandale - Urbandale, IA | November 22, 2017 | 16,700 | 12,857 | 3,843 | |||||||
36,053 sq ft 3075 Long Lake Road - Roseville, MN | November 28, 2017 | 18,650 | 12,766 | 5,884 | |||||||
1,205,432 sq ft 25 Healthcare properties (3)(4) | December 29, 2017 | 370,268 | 232,778 | 137,490 | |||||||
43,404 sq ft Garden View - St. Paul, MN | January 19, 2018 | 14,000 | 6,191 | 7,809 | |||||||
52,116 sq ft Ritchie Medical - St. Paul, MN | January 19, 2018 | 16,500 | 10,419 | 6,081 | |||||||
22,187 sq ft Bismarck 715 East Broadway and Unimproved Land - Bismarck, ND | March 7, 2018 | 5,500 | 3,215 | 2,285 | |||||||
493,042 | 312,104 | 180,938 | |||||||||
Unimproved Land | |||||||||||
Bismarck 4916 Unimproved Land - Bismarck, ND | August 8, 2017 | 3,175 | 3,188 | (13 | ) | ||||||
Total Dispositions | $ | 515,130 | $ | 330,862 | $ | 184,268 | |||||
(1) | These communities include: 4th Street 4 Plex, 11th Street 3 Plex, Apartments on Main, Brooklyn Heights, Colton Heights, Fairmont, First Avenue (Apartments and Office), Pines, Southview, Summit Park, Temple (includes 17 South Main Retail), Terrace Heights, and Westridge. |
(2) | $626,000 of the gain on sale was deferred. See Note 2 for additional information on the related mortgage note receivable. |
(3) | The properties included: 2800 Medical, 2828 Chicago Avenue, Airport Medical, Billings 2300 Grand Road, Burnsville 303 Nicollet Medical, Burnsville 305 Nicollet Medical, Duluth Denfeld Clinic, Edina 6363 France Medical, Edina 6405 France Medical, Edina 6517 Drew Avenue, Edina 6225 France SMC II, Edina 6545 France SMC I, Gateway Clinic, High Pointe Health Campus, Lakeside Medical Plaza, Mariner Clinic, Minneapolis 701 25th Avenue Medical, Missoula 3050 Great Northern, Park Dental, Pavilion I, Pavilion II, PrairieCare Medical, St. Michael Clinic, Trinity at Plaza 16 and Wells Clinic. |
(4) | Sale price includes $2.5 million that was deposited into escrow pending the resolution of certain post-closing items. As of April 30, 2018 these items had not yet been resolved. |
F-22
Fiscal 2017 (May 1, 2016 to April 30, 2017)
(in thousands) | |||||||||||
Date | Book Value | ||||||||||
Dispositions | Disposed | Sales Price | and Sales Cost | Gain/(Loss) | |||||||
Multifamily | |||||||||||
24 homes Pinecone Villas - Sartell, MN | April 20, 2017 | $ | 3,540 | $ | 2,732 | $ | 808 | ||||
Healthcare | |||||||||||
189,244 sq ft 9 Idaho Spring Creek Senior Housing Properties(1) | October 31, 2016 | 43,900 | 37,397 | 6,503 | |||||||
426,652 sq ft 5 Edgewood Vista Senior Housing Properties(2) | January 18, 2017 | 69,928 | 50,393 | 19,535 | |||||||
286,854 sq ft 5 Wyoming Senior Housing Properties(3) | February 1, 2017 | 49,600 | 45,469 | 4,131 | |||||||
169,001 sq ft 9 Edgewood Vista Senior Housing Properties(4) | February 15, 2017 | 30,700 | 24,081 | 6,619 | |||||||
169,562 sq ft 4 Edgewood Vista Senior Housing Properties(5) | March 1, 2017 | 35,348 | 14,511 | 20,837 | |||||||
114,316 sq ft Healtheast St. John & Woodwinds - Maplewood & Woodbury MN | March 6, 2017 | 20,700 | 13,777 | 6,923 | |||||||
59,760 sq ft Sartell 2000 23rd Street South - Sartell, MN | March 31, 2017 | 5,600 | 5,923 | (323 | ) | ||||||
98,174 sq ft Legends at Heritage Place - Sartell, MN | April 20, 2017 | 9,960 | 11,439 | (1,479 | ) | ||||||
265,736 | 202,990 | 62,746 | |||||||||
Other | |||||||||||
195,075 sq ft Stone Container - Fargo, ND | July 25, 2016 | 13,400 | 4,418 | 8,982 | |||||||
28,528 sq ft Grand Forks Carmike - Grand Forks, ND | December 29, 2016 | 4,000 | 1,563 | 2,437 | |||||||
17,400 | 5,981 | 11,419 | |||||||||
Unimproved Land | |||||||||||
Georgetown Square Unimproved Land - Grand Chute, WI | May 6, 2016 | 250 | 274 | (24 | ) | ||||||
Total Property Dispositions | $ | 286,926 | $ | 211,977 | $ | 74,949 | |||||
(1) | The properties included in this portfolio disposition are: Spring Creek American Falls, Spring Creek Boise, Spring Creek Eagle, Spring Creek Fruitland, Spring Creek Fruitland Unimproved, Spring Creek Meridian, Spring Creek Overland, Spring Creek Soda Springs and Spring Creek Ustick. |
(2) | The properties included in this portfolio disposition are: Edgewood Vista Bismarck, Edgewood Vista Brainerd, Edgewood Vista East Grand Forks, Edgewood Vista Fargo, and Edgewood Vista Spearfish. |
(3) | The properties included in this portfolio disposition are: Casper 1930 E 12th Street (Park Place), Casper 3955 E 12th Street (Meadow Wind), Cheyenne 4010 N College Drive (Aspen Wind), Cheyenne 4606 N College Drive (Sierra Hills) and Laramie 1072 N 22nd Street (Spring Wind). |
(4) | The properties included in this portfolio disposition are: Edgewood Vista Belgrade, Edgewood Vista Billings, Edgewood Vista Columbus, Edgewood Vista Fremont, Edgewood Vista Grand Island, Edgewood Vista Minot, Edgewood Vista Missoula, Edgewood Vista Norfolk and Edgewood Vista Sioux Falls. |
(5) | The properties included in this portfolio are: Edgewood Vista Hastings, Edgewood Vista Kalispell, Edgewood Vista Omaha and Edgewood Vista Virginia. |
F-23
NOTE 9 • OPERATING SEGMENT
We operate in a single reportable segment which includes the ownership, management, development, redevelopment, and acquisition of apartment communities. Each of our operating properties is considered a separate operating segment because each property earns revenues, incurs expenses, and has discrete financial information. Our chief operating decision-makers evaluate each property's operating results to make decisions about resources to be allocated and to assess performance. We do not group our operations based on geography, size, or type. Our apartment communities have similar long-term economic characteristics and provide similar products and services to our tenants. No apartment community comprises more than 10% of consolidated revenues, profits, or assets. Accordingly, our apartment communities are aggregated into a single reportable segment.
Prior to the third quarter of fiscal year 2018, we reported our results in two reportable segments: multifamily and healthcare. We sold substantially all of our healthcare portfolio during the third quarter of fiscal year 2018 and classified it as discontinued operations (see Note 10 for additional information). Healthcare no longer meets the quantitative thresholds for reporting as a separate reportable segment and is included in "all other" with other non-multifamily properties.
Our executive management team comprises our chief operating decision-makers. This team measures the performance of our reportable segment based on net operating income (“NOI”), which we define as total real estate revenues less property operating expenses and real estate tax expense combined (referred to as "real estate expenses"). We believe that NOI is an important supplemental measure of operating performance for a REIT’s operating real estate because it provides a measure of operations that is unaffected by depreciation, amortization, financing, and general and administrative expense. NOI does not represent cash generated by operating activities in accordance with GAAP and should not be considered an alternative to net income, net income available for common shareholders, or cash flow from operating activities as a measure of financial performance. The following tables present real estate revenues, real estate expenses, and net operating income for the fiscal years ended April 30, 2018, 2017, and 2016 from our reportable segment and reconcile net operating income to net income as reported in the consolidated financial statements. Segment assets are also reconciled to total assets as reported in the consolidated financial statements.
(in thousands) | ||||||||||
Year ended April 30, 2018 | Multifamily | All Other | Total | |||||||
Real estate revenue | $ | 159,983 | $ | 9,762 | $ | 169,745 | ||||
Real estate expenses | 70,460 | 2,574 | 73,034 | |||||||
Net operating income | $ | 89,523 | $ | 7,188 | $ | 96,711 | ||||
Property management expenses | (5,526 | ) | ||||||||
Casualty loss | (500 | ) | ||||||||
Depreciation and amortization | (82,070 | ) | ||||||||
Impairment of real estate investments | (18,065 | ) | ||||||||
General and administrative expenses | (14,203 | ) | ||||||||
Acquisition and investment related costs | (51 | ) | ||||||||
Interest expense | (34,178 | ) | ||||||||
Loss on debt extinguishment | (940 | ) | ||||||||
Interest and other income | 1,508 | |||||||||
Loss before gain on sale of real estate and other investments and income from discontinued operations | (57,314 | ) | ||||||||
Gain on sale of real estate and other investments | 20,120 | |||||||||
Loss from continuing operations | (37,194 | ) | ||||||||
Income from discontinued operations | 164,823 | |||||||||
Net income | $ | 127,629 | ||||||||
F-24
(in thousands) | ||||||||||
Year ended April 30, 2017 | Multifamily | All Other | Total | |||||||
Real estate revenue | $ | 142,214 | $ | 17,890 | $ | 160,104 | ||||
Real estate expenses | 60,895 | 3,431 | 64,326 | |||||||
Net operating income | $ | 81,319 | $ | 14,459 | $ | 95,778 | ||||
Property management expenses | (5,046 | ) | ||||||||
Casualty loss | (414 | ) | ||||||||
Depreciation and amortization | (44,253 | ) | ||||||||
Impairment of real estate investments | (57,028 | ) | ||||||||
General and administrative expenses | (15,871 | ) | ||||||||
Acquisition and investment related costs | (3,276 | ) | ||||||||
Interest expense | (34,314 | ) | ||||||||
Loss on debt extinguishment | (1,651 | ) | ||||||||
Interest and other income | 1,146 | |||||||||
Loss before gain on sale of real estate and other investments | (64,929 | ) | ||||||||
Gain on sale of real estate and other investments | 18,701 | |||||||||
Loss from continuing operations | (46,228 | ) | ||||||||
Income from discontinued operations | 76,753 | |||||||||
Net income | $ | 30,525 | ||||||||
(in thousands) | ||||||||||
Year ended April 30, 2016 | Multifamily | All Other | Total | |||||||
Real estate revenue | $ | 129,049 | $ | 16,451 | $ | 145,500 | ||||
Real estate expenses | 54,762 | 3,386 | 58,148 | |||||||
Net operating income | $ | 74,287 | $ | 13,065 | $ | 87,352 | ||||
Property management expenses | (3,714 | ) | ||||||||
Casualty loss | (238 | ) | ||||||||
Depreciation and amortization | (39,273 | ) | ||||||||
Impairment of real estate investments | (5,543 | ) | ||||||||
General and administrative expenses | (13,498 | ) | ||||||||
Acquisition and investment related costs | (830 | ) | ||||||||
Interest expense | (28,417 | ) | ||||||||
Loss on debt extinguishment | (106 | ) | ||||||||
Interest and other income | 385 | |||||||||
Loss before loss on sale of real estate and other investments and loss from discontinued operations | (3,882 | ) | ||||||||
Gain on sale of real estate and other investments | 9,640 | |||||||||
Gain on bargain purchase | 3,424 | |||||||||
Income from continuing operations | 9,182 | |||||||||
Income from discontinued operations | 67,420 | |||||||||
Net income | $ | 76,602 | ||||||||
F-25
Segment Assets and Accumulated Depreciation
(in thousands) | ||||||||||
As at April 30, 2018 | Multifamily | All Other | Total | |||||||
Segment assets | ||||||||||
Property owned | $ | 1,606,421 | $ | 63,343 | $ | 1,669,764 | ||||
Less accumulated depreciation | (294,477 | ) | (16,847 | ) | (311,324 | ) | ||||
Total property owned | $ | 1,311,944 | $ | 46,496 | $ | 1,358,440 | ||||
Cash and cash equivalents | 11,891 | |||||||||
Restricted cash | 4,225 | |||||||||
Other assets | 30,297 | |||||||||
Unimproved land | 11,476 | |||||||||
Mortgage loans receivable | 10,329 | |||||||||
Total Assets | $ | 1,426,658 | ||||||||
(in thousands) | ||||||||||
As at April 30, 2017 | Multifamily | All Other | Total | |||||||
Segment assets | ||||||||||
Property owned | $ | 1,260,541 | $ | 97,988 | $ | 1,358,529 | ||||
Less accumulated depreciation | (232,592 | ) | (23,007 | ) | (255,599 | ) | ||||
Total property owned | $ | 1,027,949 | $ | 74,981 | $ | 1,102,930 | ||||
Assets held for sale and assets from discontinued operations | 283,023 | |||||||||
Cash and cash equivalents | 28,819 | |||||||||
Restricted cash | 27,981 | |||||||||
Other assets | 13,306 | |||||||||
Unimproved land | $ | 18,455 | ||||||||
Total Assets | $ | 1,474,514 | ||||||||
NOTE 10 • DISCONTINUED OPERATIONS
We report in discontinued operations the results of operations and the related gains or losses on the sales of properties that have either been disposed of or classified as held for sale and meet the classification of a discontinued operation as described in ASC 205 - Presentation of Financial Statements and ASC 360 - Property, Plant, and Equipment: Reporting Discontinued Operations and Disclosures of Disposals of Components of an Entity. Under this standard, a disposal (or classification as held for sale) of a component of an entity or a group of components of an entity is required to be reported in discontinued operations if the disposal represents a strategic shift that has (or will have) a major effect on an entity’s operations and financial results.
We determined that our strategic decision to exit our healthcare segment met the criteria for discontinued operations, and we consequently classified 27 property dispositions as discontinued operations during the fiscal year ended April 30, 2018. We classified no dispositions as discontinued operations during the fiscal year ended April 30, 2017. During the fiscal year ended April 30, 2016, we determined that our strategic plan to exit the office and retail segments met the criteria for discontinued operations. Accordingly, 48 office properties, 17 retail properties and 1 healthcare property were classified as discontinued operations and subsequently sold during the fiscal year ended April 30, 2016. In fiscal year 2016, we determined that our strategic decision to exit senior housing, which was a subset of our healthcare segment, met the criteria for discontinued operations and we classified 34 senior housing properties as held for sale and discontinued operations at April 30, 2016. Thirty-two of these senior housing properties were subsequently sold during the fiscal year ended April 30, 2017. The following information shows the effect on net income and the gains or losses from the sale of properties classified as discontinued operations for the fiscal years ended April 30, 2018, 2017, and 2016.
F-26
(in thousands) | ||||||||||
Year Ended April 30, | ||||||||||
2018 | 2017 | 2016 | ||||||||
REVENUE | ||||||||||
Real estate rentals | $ | 19,744 | $ | 43,984 | $ | 69,623 | ||||
Tenant reimbursement | 11,650 | 16,110 | 23,434 | |||||||
TRS senior housing revenue | — | 3,218 | 3,955 | |||||||
TOTAL REVENUE | 31,394 | 63,312 | 97,012 | |||||||
EXPENSES | ||||||||||
Property operating expenses, excluding real estate taxes | 6,350 | 9,051 | 17,470 | |||||||
Real estate taxes | 5,191 | 6,848 | 11,611 | |||||||
Property management expense | 206 | 574 | 1,957 | |||||||
Depreciation and amortization | 8,445 | 10,772 | 24,725 | |||||||
Impairment of real estate investments | — | — | 440 | |||||||
TRS senior housing expenses | — | 3,113 | 3,366 | |||||||
TOTAL EXPENSES | 20,192 | 30,358 | 59,569 | |||||||
Operating income | 11,202 | 32,954 | 37,443 | |||||||
Interest expense(1) | (4,172 | ) | (11,628 | ) | (25,757 | ) | ||||
Gain (loss) on extinguishment of debt(1) | (6,508 | ) | (3,238 | ) | 29,336 | |||||
Interest income | 661 | 2,179 | 2,179 | |||||||
Other income | 73 | 340 | 437 | |||||||
Income from discontinued operations before gain on sale | 1,256 | 20,607 | 43,638 | |||||||
Gain on sale of discontinued operations | 163,567 | 56,146 | 23,782 | |||||||
INCOME FROM DISCONTINUED OPERATIONS | $ | 164,823 | $ | 76,753 | $ | 67,420 | ||||
Segment Data | ||||||||||
All other | $ | 164,823 | $ | 76,753 | $ | 67,420 | ||||
Total | $ | 164,823 | $ | 76,753 | $ | 67,420 | ||||
(1) | Interest expense includes $4.7 million for the fiscal year ended April 30, 2016, of default interest related to a $122.6 million non-recourse loan. Gain on extinguishment of debt in the fiscal year ended April 30, 2016 includes $36.5 million of gain on extinguishment of debt recognized in connection with our transfer of ownership to the mortgage lender of the nine properties serving as collateral for the $122.6 million non-recourse loan and the removal of the debt obligation and accrued interest from our balance sheet. |
(in thousands) | ||||||||||
2018 | 2017 | 2016 | ||||||||
Property Sale Data | ||||||||||
Sales price | $ | 437,652 | $ | 239,436 | $ | 373,460 | ||||
Net book value and sales costs | (274,085 | ) | (183,290 | ) | (349,678 | ) | ||||
Gain on sale of discontinued operations | $ | 163,567 | $ | 56,146 | $ | 23,782 | ||||
As of April 30, 2018, we had no assets or liabilities classified as held for sale. The following information reconciles the carrying amounts of major classes of assets and liabilities of the discontinued operations to assets and liabilities held for sale that are presented separately on the Consolidated Balance Sheets:
F-27
April 30, 2017 | ||||
Carrying amounts of major classes of assets included as part of discontinued operations | ||||
Property owned and intangible assets, net of accumulated depreciation and amortization | $ | 255,466 | ||
Restricted cash | 728 | |||
Other Assets | 12,750 | |||
Total major classes of assets of the discontinued operations | 268,944 | |||
Other assets included in the disposal group classified as held for sale | 14,079 | |||
Total assets of the disposal group classified as held for sale on the balance sheet | $ | 283,023 | ||
Carrying amounts of major classes of liabilities included as part of discontinued operations | ||||
Accounts payable and accrued expenses | $ | 4,835 | ||
Mortgages payable | 112,208 | |||
Other | 7,977 | |||
Total major classes of liabilities of the discontinued operations | 125,020 | |||
Other liabilities included in the disposal group classified as held for sale | 5,884 | |||
Total liabilities of the disposal group classified as held for sale on the balance sheet | $ | 130,904 | ||
NOTE 11 • EARNINGS PER SHARE
Basic earnings per share is computed by dividing net income available to common shareholders by the weighted average number of common shares outstanding during the period. We have no outstanding options, warrants, convertible stock or other contractual obligations requiring issuance of additional common shares that would result in a dilution of earnings. Pursuant to the exercise of Exchange Rights, Units may be tendered for redemption for cash or, at our option, for common shares on a one-for-one-basis. The following table presents a reconciliation of the numerator and denominator used to calculate basic and diluted earnings per share reported in the consolidated financial statements for the fiscal years ended April 30, 2018, 2017 and 2016:
For Year Ended April 30, | ||||||||||
(in thousands, except per share data) | ||||||||||
2018 | 2017 | 2016 | ||||||||
NUMERATOR | ||||||||||
Income (loss) from continuing operations – Investors Real Estate Trust | $ | (30,266 | ) | $ | (24,473 | ) | $ | 11,553 | ||
Income from discontinued operations – Investors Real Estate Trust | 147,054 | 67,820 | 60,453 | |||||||
Net income attributable to Investors Real Estate Trust | 116,788 | 43,347 | 72,006 | |||||||
Dividends to preferred shareholders | (8,569 | ) | (10,546 | ) | (11,514 | ) | ||||
Redemption of preferred shares | (3,657 | ) | (1,435 | ) | — | |||||
Numerator for basic earnings per share – net income available to common shareholders | 104,562 | 31,366 | 60,492 | |||||||
Noncontrolling interests – Operating Partnership | 12,702 | 4,059 | 7,032 | |||||||
Numerator for diluted earnings per share | $ | 117,264 | $ | 35,425 | $ | 67,524 | ||||
DENOMINATOR | ||||||||||
Denominator for basic earnings per share weighted average shares | 119,977 | 121,169 | 123,094 | |||||||
Effect of redeemable operating partnership units | 14,617 | 16,130 | 14,278 | |||||||
Denominator for diluted earnings per share | 134,594 | 137,299 | 137,372 | |||||||
Earnings (loss) per common share from continuing operations – Investors Real Estate Trust – basic and diluted | $ | (0.36 | ) | $ | (0.30 | ) | $ | — | ||
Earnings per common share from discontinued operations – Investors Real Estate Trust – basic and diluted | 1.23 | 0.56 | 0.49 | |||||||
NET INCOME PER COMMON SHARE – BASIC & DILUTED | $ | 0.87 | $ | 0.26 | $ | 0.49 | ||||
F-28
NOTE 12 • RETIREMENT PLANS
We sponsor a defined contribution 401(k) plan to provide retirement benefits for employees that meet minimum employment criteria. We currently match, dollar for dollar, employee contributions to the 401(k) plan in an amount equal to up to 5.0% of the eligible wages of each participating employee. 401(k) matching contributions are fully vested when made. We recognized expense of approximately $838,000, $565,000 and $836,000 in fiscal years 2018, 2017, and 2016, respectively. The expense increased from fiscal year 2017 to fiscal year 2018 primarily due to an increase of 1% in the employer match contribution. The expense decreased from fiscal year 2016 to fiscal year 2017 because fiscal year 2016 included a 3.5% discretionary employer contribution.
NOTE 13 • COMMITMENTS AND CONTINGENCIES
Legal Proceedings. We are involved in various lawsuits arising in the normal course of business. We believe that such matters will not have a material adverse effect on our consolidated financial statements.
Environmental Matters. It is generally our policy to obtain a Phase I environmental assessment of each property that we seek to acquire. Such assessments have not revealed, nor are we aware of, any environmental liabilities that we believe would have a material adverse effect on our financial position or results of operations. We own properties that contain or potentially contain (based on the age of the property) asbestos or lead, or have underground fuel storage tanks. For certain of these properties, we estimated the fair value of the conditional asset retirement obligation and chose not to book a liability because the amounts involved were immaterial. With respect to certain other properties, we have not recorded any related asset retirement obligation as the fair value of the liability cannot be reasonably estimated due to insufficient information. We believe we do not have sufficient information to estimate the fair value of the asset retirement obligations for these properties because a settlement date or range of potential settlement dates has not been specified by others and, additionally, there are currently no plans or expectation of plans to demolish these properties or to undertake major renovations that would require removal of the asbestos, lead and/or underground storage tanks. These properties are expected to be maintained by repairs and maintenance activities that would not involve the removal of the asbestos, lead and/or underground storage tanks. Also, a need for renovations caused by tenant changes, technology changes or other factors has not been identified.
Insurance. We carry insurance coverage on our properties in amounts and types that we believe are customarily obtained by owners of similar properties and are sufficient to achieve our risk management objectives.
Restrictions on Taxable Dispositions. Approximately 26 of our properties, consisting of approximately 4,266 apartment homes, are subject to restrictions on taxable dispositions under agreements entered into with some of the sellers or contributors of the properties. The real estate investment amount of these properties, net of accumulated depreciation, was approximately $558.6 million at April 30, 2018. The restrictions on taxable dispositions are effective for varying periods. We do not believe that the agreements materially affect the conduct of our business or our decisions whether to dispose of restricted properties during the restriction period because we generally hold these and our other properties for investment purposes rather than for sale. In addition, where we deem it to be in our shareholders’ best interests to dispose of such properties, we generally seek to structure sales of such properties as tax deferred transactions under Section 1031 of the Internal Revenue Code. Otherwise, we may be required to provide tax indemnification payments to the parties to these agreements.
Distribution Requirements for Taxable Gains. In order to avoid income tax liability on capital gains, we are required to distribute 100% of net taxable gains to our shareholders. We executed a tax deferred Section 1031 transaction on December 29, 2017. The window to complete the exchange expires on June 27, 2018, which will leave approximately $30 million of taxable capital gains undeferred in fiscal year 2019. We are evaluating strategies to reduce or eliminate any adverse effects of triggering this taxable gain.
Redemption Value of Units. Pursuant to a Unitholder’s exercise of its Exchange Rights, we have the right, in our sole discretion, to acquire such Units by either making a cash payment or acquiring the Units for our common shares, on a one-for-one basis. All Units receive the same per Unit cash distributions as the per share dividends paid on common shares. Units are redeemable for an amount of cash per Unit equal to the average of the daily market price of our common shares for the ten consecutive trading days immediately preceding the date of valuation of the Unit. As of April 30, 2018 and 2017, the aggregate redemption value of the then-outstanding Units owned by limited partners, as determined by the ten-day average market price for our common shares, was approximately $74.7 million and $95.1 million, respectively.
F-29
Joint Venture Buy/Sell Options. Several of our joint venture agreements contain buy/sell options in which each party under certain circumstances has the option to acquire the interest of the other party, but do not generally require that we buy our partners’ interests. However, from time to time, we have entered into joint venture agreements which contain options compelling us to acquire the interest of the other parties. We currently have one such joint venture, which owns Commons and Landing at Southgate in Minot, North Dakota, in which our joint venture partner can, for the four-year period from February 6, 2016 through February 5, 2020, compel us to acquire the partner’s interest for a price to be determined in accordance with the provisions of the joint venture agreement. The joint venture partner’s interest is reflected as a redeemable noncontrolling interest on the Consolidated Balance Sheets.
NOTE 14 • FAIR VALUE MEASUREMENTS
Cash and cash equivalents, restricted cash, accounts payable, accrued expenses, and other liabilities are carried at amounts that reasonably approximate their fair value due to their short-term nature. For variable rate debt that re-prices frequently, fair values are based on carrying values. The fair values of our financial instruments approximate their carrying amount in the consolidated financial statements except for fixed rate debt.
In determining the fair value of other financial instruments, we apply Financial Accounting Standard Board ASC 820, Fair Value Measurement and Disclosures, or ASC 820. ASC 820 defines fair value, establishes a framework for measuring fair value, and expands disclosures about fair value measurements. Fair value hierarchy under ASC 820 distinguishes between market participant assumptions based on market data obtained from sources independent of the reporting entity (Levels 1 and 2) and the reporting entity’s own assumptions about market participant assumptions (Level 3). Fair value estimates may differ from the amounts that may ultimately be realized upon sale or disposition of the assets and liabilities.
Fair Value Measurements on a Recurring Basis
During the fiscal year ended April 30, 2018, we entered into an interest rate swap to manage our interest rate risk. The fair value of our interest rate swap is determined using the market standard methodology of netting discounted expected variable cash payments and receipts. The variable cash payments and receipts are based on an expectation of future interest rates (a forward curve) derived from observable market interest rate curves. We consider both our own nonperformance risk and the counterparty's nonperformance risk in the fair value measurement. The fair value of the derivative by its level in the fair value hierarchy is as follows:
(in thousands) | ||||||||||||||
Balance Sheet Location | Total | Level 1 | Level 2 | Level 3 | ||||||||||
April 30, 2018 | ||||||||||||||
Derivative instrument - interest rate swap | Other Assets | $ | 1,779 | $ | — | $ | 1,779 | $ | — | |||||
Fair Value Measurements on a Nonrecurring Basis
Non-financial assets measured at fair value on a nonrecurring basis at April 30, 2018, consisted of real estate investments and at April 30, 2017, consisted of real estate investments and real estate held for sale that were written-down to estimated fair value during fiscal year 2018 and 2017, respectively. The aggregate fair value of these assets by their levels in the fair value hierarchy are as follows:
(in thousands) | |||||||||||||
Total | Level 1 | Level 2 | Level 3 | ||||||||||
April 30, 2018 | |||||||||||||
Real estate investments valued at fair value | $ | 52,145 | $ | — | $ | — | $ | 52,145 | |||||
April 30, 2017 | |||||||||||||
Real estate investments valued at fair value | $ | 506 | $ | — | $ | — | $ | 506 | |||||
Real estate held for sale (1) | 10,891 | — | — | 10,891 | |||||||||
(1) | Represents only the portion of real estate held for sale at April 30, 2017 that was written down to estimated fair value. |
As of April 30, 2018, we estimated the fair value of our real estate investments using appraisals, a market offer to purchase, market comparisons, and other market data. As of April 30, 2017, we estimated fair value on a group of our properties using projected net operating income and an estimated capitalization rate to estimate fair value. Significant unobservable quantitative
F-30
inputs used in determining the fair value of each investment includes capitalization rates based on the location, type, and nature of each property and current and anticipated market conditions. Significant unobservable quantitative inputs used in determining the fair value of these real estate investments at April 30, 2017, was a capitalization rate of 7.0%.
Financial Assets and Liabilities Not Measured at Fair Value
The fair value of fixed rate loans is estimated based on the discounted cash flows of the loans using relevant treasury interest rates plus credit spreads (Level 2). For mortgages payable, the fair value of fixed rate loans is estimated based on the discounted cash flows of the loans using market research and management estimates of comparable interest rates (Level 3).
The estimated fair values of our financial instruments as of April 30, 2018 and 2017 are as follows:
(in thousands) | |||||||||||||
2018 | 2017 | ||||||||||||
Amount | Fair Value | Amount | Fair Value | ||||||||||
FINANCIAL ASSETS | |||||||||||||
Cash and cash equivalents | $ | 11,891 | $ | 11,891 | $ | 28,819 | $ | 28,819 | |||||
FINANCIAL LIABILITIES | |||||||||||||
Other debt, including other debt related to assets held for sale | — | — | 49,637 | 49,637 | |||||||||
Revolving line of credit | 124,000 | 124,000 | 57,050 | 57,050 | |||||||||
Term loan (1) | 70,000 | — | — | ||||||||||
Mortgages payable (2) | 509,919 | 510,803 | 665,440 | 680,941 | |||||||||
Mortgages payable related to assets held for sale | — | — | 21,803 | 21,861 | |||||||||
(1) | Excluding the effect of the interest rate swap agreement. |
(2) | Includes mortgages payable related to assets held for sale and assets of discontinued operations at April 30, 2017. |
NOTE 15 • SHAREHOLDERS’ EQUITY
Operating Partnership Units. Outstanding Units in the Operating Partnership were 14.1 million Units at April 30, 2018 and 15.6 million Units at April 30, 2017.
Exchange Rights. Pursuant to the exercise of Exchange Rights, during fiscal year 2018, we redeemed approximately 1.5 million Units for an aggregate cost of $8.8 million at an average price per Unit of $5.89. In fiscal year 2017, we redeemed approximately 165,000 Units for an aggregate cost of $966,000 at an average price per Unit of $5.84. During fiscal year 2017, 503,000 Units were redeemed in exchange for common shares in connection with Unitholders exercising their Exchange Rights, with a total book value of $875,000 included in equity.
Common Shares and Equity Awards. Common Shares outstanding on April 30, 2018 and 2017, totaled 119.5 million and 121.2 million, respectively. During fiscal years 2018 and 2017, we issued approximately 93,000 and 604,000 Common Shares, respectively, with a total grant-date value of $536,000 and $2.6 million, respectively, under our 2015 Incentive Award Plan, for executive officer and trustee share-based compensation for future performance. During fiscal year 2017, we also issued approximately 59,000 Common Shares, with a total grant-date value of approximately $352,000, under our 2008 Incentive Award Plan, for trustee share based compensation for fiscal year 2016 performance. During fiscal year 2018 and 2017, approximately 32,000 and 274,000 common shares were forfeited under the 2015 Incentive Award Plan, respectively.
Share Repurchase Program. On December 7, 2016, our Board of Trustees authorized a share repurchase program to repurchase up to 50 million of our Common Shares over a one year period. On December 5, 2017, our Board of Trustees reauthorized this share repurchase program for an additional one year period. Under this program, we may repurchase Common Shares in open-market purchases, including pursuant to Rule 10b5-1 and Rule 10b-18 plans, as determined by management and in accordance with the requirements of the SEC. The extent to which we repurchase our shares, and the timing of such repurchases, will depend upon a variety of factors, including market conditions, regulatory requirements and other corporate considerations, as determined by the executive management team. The program may be suspended or discontinued at any time. During fiscal year 2018, we repurchased and retired approximately 1.8 million common shares for an aggregate cost of $9.9 million, including commissions, at an average price per share of $5.56, excluding commissions. During fiscal year 2017, we repurchased and retired approximately 778,000 common shares for an aggregate cost of $4.5 million, including commissions, at an average price per share of $5.77.
F-31
Issuance of Preferred Shares and Redemption of Series B Preferred Shares. In the year ended April 30, 2018, we issued 4,118,460 shares of our 6.625% Series C Cumulative Redeemable Preferred Shares and redeemed all 4,600,000 shares of our 7.95% Series B Cumulative Redeemable Preferred Shares. In the year ended April 30, 2017, we completed the redemption of all of the outstanding 8.25% Series A Cumulative Redeemable Preferred Shares (“Preferred A Shares”) for an aggregate redemption price of $29.2 million, and such shares are no longer outstanding as of such date.
NOTE 16 • QUARTERLY RESULTS OF CONSOLIDATED OPERATIONS (unaudited)
(in thousands, except per share data) | |||||||||||||
QUARTER ENDED | July 31, 2017 | October 31, 2017 | January 31, 2018 | April 30, 2018 | |||||||||
Revenues | $ | 40,978 | $ | 41,866 | $ | 42,716 | $ | 44,185 | |||||
Net income (loss) attributable to Investors Real Estate Trust | $ | (11,264 | ) | $ | 12,821 | $ | 136,105 | $ | (20,874 | ) | |||
Net income (loss) available to common shareholders | $ | (13,550 | ) | $ | 6,360 | $ | 134,331 | $ | (22,579 | ) | |||
Net income (loss) per common share - basic & diluted | $ | (0.11 | ) | $ | 0.05 | $ | 1.12 | $ | (0.19 | ) | |||
(in thousands, except per share data) | |||||||||||||
QUARTER ENDED | July 31, 2016 | October 31, 2016 | January 31, 2017 | April 30, 2017 | |||||||||
Revenues | $ | 38,301 | $ | 39,195 | $ | 39,797 | $ | 42,811 | |||||
Net income (loss) attributable to Investors Real Estate Trust | $ | (21,643 | ) | $ | 11,600 | $ | 23,110 | $ | 30,280 | ||||
Net income (loss) available to common shareholders | $ | (24,522 | ) | $ | 8,722 | $ | 19,172 | $ | 27,994 | ||||
Net income (loss) per common share - basic & diluted | $ | (0.20 | ) | $ | 0.07 | $ | 0.16 | $ | 0.23 | ||||
The above financial information is unaudited. In the opinion of management, all adjustments (which are of a normal recurring nature) have been included for a fair presentation.
NOTE 17 • SHARE BASED COMPENSATION
Share based awards are provided to officers, non-officer employees, and trustees under our 2015 Incentive Plan approved by shareholders on September 15, 2015, which allows for awards in the form of cash, unrestricted, and restricted Common Shares, and RSUs up to an aggregate of 4,250,000 shares over the ten-year period in which the plan will be in effect. Under our 2015 Incentive Plan, officers and non-officer employees may earn share awards under a long-term incentive plan, which is a forward-looking program that measures long-term performance over the stated performance period. These awards are payable to the extent deemed earned in shares. The terms of the long-term incentive awards granted under the program may vary from year to year. Through April 30, 2018, awards under the 2015 Incentive Plan consisted of restricted and unrestricted Common Shares and RSUs.
Fiscal Year 2018 LTIP Awards
Awards granted on May 1, 2017, consist of 16,447 time-based restricted shares that vest as to one-third of the shares on each of May 1, 2018, May 1, 2019, and May 1, 2020. We recognize compensation expense associated with the time-based awards ratably over the requisite service periods.
Awards granted on June 21, 2017 consist of time-based awards, performance awards based on total shareholder return ("TSR"), and performance awards based on leverage ratio, each for 57,693 RSUs. All of these awards are classified as equity awards. The time-based RSUs vest as to one-third of the shares on each June 21, 2018, May 1, 2019, and May 1, 2020. The maximum number of leverage ratio RSUs eligible to be earned is 115,386 RSUs.
The TSR performance RSU awards are earned based on our TSR as compared to the MSCI US REIT Index over a forward looking three-year period. The maximum number of RSUs eligible to be earned is 115,386 RSUs. Earned awards (if any) will fully vest as of the last day of the measurement period. These awards have market conditions in addition to service conditions that must be met for the awards to vest. We recognize compensation expense ratably based on the grant date fair value, as determined using the Monte Carlo valuation model, regardless whether the market conditions are achieved and the awards ultimately vest. Therefore, previously recorded compensation expense is not adjusted in the event that the market conditions are not achieved. We based the expected volatility on the historical volatility of our daily closing share price, the risk-free interest rate on the interest rates on U.S. treasury bonds with a maturity equal to the remaining performance period of the award, and the expected term on the performance period of the award. The assumptions used to value the TSR performance RSU awards were an expected volatility of 27.3%, a risk-free interest rate of 1.48% and an expected life of 2.86 years. The share price at the grant date, June 21, 2017, was $6.15 per share.
F-32
The leverage ratio based performance RSU awards are earned based on achievement of a stated leverage ratio at the end of the measurement period. Earned awards (if any) will fully vest as of the last day of the measurement period.
Total Compensation Expense
Total share based compensation expense recognized in the consolidated financial statements for the three years ended April 30, 2018, for all share-based awards was as follows (in thousands):
Year Ended April 30, | ||||||||||
2018 | 2017 | 2016 | ||||||||
Share based compensation expense | $ | 1,587 | $ | 6 | $ | 2,256 | ||||
Share based compensation expense varied due to forfeitures during the fiscal year ended April 30, 2017, and fewer outstanding awards during the fiscal year ended April 30, 2018.
Restricted Share Awards with Service Conditions
The activity for the three years ended April 30, 2018, related to our time-based restricted share awards was as follows.
Wtd Avg Grant- | ||||||
Shares | Date Fair Value | |||||
Unvested at April 30, 2015 | 107,536 | $ | 7.17 | |||
Vested | (107,536 | ) | 7.17 | |||
Unvested at April 30, 2016 | — | |||||
Granted | 253,263 | 6.16 | ||||
Vested | (21,308 | ) | 5.95 | |||
Forfeited | (36,817 | ) | 6.24 | |||
Unvested at April 30, 2017 | 195,138 | |||||
Granted | 91,364 | 5.75 | ||||
Vested | (185,431 | ) | 5.99 | |||
Forfeited | (2,019 | ) | 6.24 | |||
Unvested at April 30, 2018 | 99,052 | 6.12 | ||||
The total fair value of time-based share grants vested during the fiscal years ended April 30, 2018, 2017 and 2016 was $1.1 million, $127,000 and $647,000. As of April 30, 2018, the total compensation cost related to non-vested time-based share awards not yet recognized was $252,000, which we expect to recognize over a weighted average period of 1.1 years.
During the fiscal year ended April 30, 2018, we issued 69,941 time-based RSUs, including those issued on June 21, 2017. These RSUs generally vest over a three year period. The fair value of the time-based RSUs during the year ended April 30, 2018 was $423,000. The total compensation cost related to non-vested time-based RSUs not yet recognized is $206,000, which we expect to recognize over a weighted average period of 0.5 years.
Restricted Share Awards with Market Conditions
Share-based awards and RSUs with market conditions were granted under the LTIP during fiscal year 2018 with a fair market value, as determined using a Monte Carlo simulation, of $818,000. The unamortized value of awards and RSUs with market conditions as of April 30, 2018 and 2017, was approximately $577,000 and $300,000, respectively.
Trustee Awards
Awards granted on May 1, 2017 and on March 13, 2018 consist of restricted shares that vested April 30, 2018 and unrestricted shares which vested immediately. The fair value of share awards at grant date for non-management trustees was approximately $389,000, $365,000, and $352,000 for each of the fiscal years ending April 30, 2018, 2017, and 2016, respectively.
F-33
INVESTORS REAL ESTATE TRUST AND SUBSIDIARIES
April 30, 2018
Schedule III - REAL ESTATE AND ACCUMULATED DEPRECIATION (in thousands)
Gross amount at which carried at | Life on which | ||||||||||||||||||||||||||
Initial Cost to Company | close of period | depreciation in | |||||||||||||||||||||||||
Costs capitalized | Date of | latest income | |||||||||||||||||||||||||
Buildings & | subsequent to | Buildings & | Accumulated | Construction | statement is | ||||||||||||||||||||||
Description | Encumbrances(1) | Land | Improvements | acquisition | Land | Improvements | Total | Depreciation | or Acquisition | computed | |||||||||||||||||
Multifamily | |||||||||||||||||||||||||||
71 France - Edina, MN | $ | 56,000 | $ | 4,721 | $ | 61,762 | $ | 62 | $ | 4,721 | $ | 61,824 | $ | 66,545 | $ | (5,731 | ) | 2016 | 30-37 | years | |||||||
Alps Park - Rapid City, SD | 3,618 | 287 | 5,551 | 356 | 333 | 5,861 | 6,194 | (898 | ) | 2013 | 30-37 | years | |||||||||||||||
Arbors - S Sioux City, NE | 3,562 | 350 | 6,625 | 2,375 | 1,048 | 8,302 | 9,350 | (2,966 | ) | 2006 | 30-37 | years | |||||||||||||||
Arcata - Golden Valley, MN | — | 2,088 | 31,036 | 98 | 2,089 | 31,133 | 33,222 | (4,177 | ) | 2015 | 30-37 | years | |||||||||||||||
Ashland - Grand Forks, ND | 5,193 | 741 | 7,569 | 268 | 795 | 7,783 | 8,578 | (1,492 | ) | 2012 | 30-37 | years | |||||||||||||||
Avalon Cove - Rochester, MN | — | 1,616 | 34,074 | 275 | 1,629 | 34,336 | 35,965 | (2,354 | ) | 2016 | 30-37 | years | |||||||||||||||
Boulder Court - Eagan, MN | — | 1,067 | 5,498 | 3,003 | 1,503 | 8,065 | 9,568 | (3,290 | ) | 2003 | 30-37 | years | |||||||||||||||
Brookfield Village - Topeka, KS | 4,920 | 509 | 6,698 | 1,885 | 874 | 8,218 | 9,092 | (3,144 | ) | 2003 | 30-37 | years | |||||||||||||||
Canyon Lake - Rapid City, SD | 2,677 | 305 | 3,958 | 2,130 | 397 | 5,996 | 6,393 | (2,555 | ) | 2001 | 30-37 | years | |||||||||||||||
Cardinal Point - Grand Forks, ND | — | 1,600 | 33,400 | — | 1,600 | 33,400 | 35,000 | — | 2013 | 30-37 | years | ||||||||||||||||
Cascade Shores - Rochester, MN | 11,400 | 1,585 | 16,710 | 66 | 1,586 | 16,775 | 18,361 | (1,196 | ) | 2016 | 30-37 | years | |||||||||||||||
Castlerock - Billings, MT | 6,222 | 736 | 4,864 | 2,359 | 1,022 | 6,937 | 7,959 | (3,587 | ) | 1998 | 30-37 | years | |||||||||||||||
Chateau I & II - Minot, ND | — | 301 | 20,058 | 880 | 322 | 20,917 | 21,239 | (3,216 | ) | 2013 | 30-37 | years | |||||||||||||||
Cimarron Hills - Omaha, NE | 4,470 | 706 | 9,588 | 4,700 | 1,494 | 13,500 | 14,994 | (6,287 | ) | 2001 | 30-37 | years | |||||||||||||||
Colonial Villa - Burnsville, MN | — | 2,401 | 11,515 | 9,090 | 2,906 | 20,100 | 23,006 | (8,380 | ) | 2003 | 30-37 | years | |||||||||||||||
Colony - Lincoln, NE | 12,453 | 1,515 | 15,730 | 1,428 | 1,708 | 16,965 | 18,673 | (3,197 | ) | 2012 | 30-37 | years | |||||||||||||||
Commons and Landing at Southgate - Minot, ND | 26,094 | 5,945 | 47,512 | 1,136 | 6,268 | 48,325 | 54,593 | (7,026 | ) | 2015 | 30-37 | years | |||||||||||||||
Cottage West Twin Homes - Sioux Falls, SD | 3,387 | 968 | 3,762 | 597 | 1,072 | 4,255 | 5,327 | (813 | ) | 2011 | 30-37 | years | |||||||||||||||
Cottonwood - Bismarck, ND | 14,848 | 1,056 | 17,372 | 5,411 | 1,597 | 22,242 | 23,839 | (9,318 | ) | 1997 | 30-37 | years | |||||||||||||||
Country Meadows - Billings, MT | 6,161 | 491 | 7,809 | 1,736 | 569 | 9,467 | 10,036 | (4,834 | ) | 1995 | 30-37 | years | |||||||||||||||
Crestview - Bismarck, ND | 3,576 | 235 | 4,290 | 2,206 | 600 | 6,131 | 6,731 | (3,737 | ) | 1994 | 30-37 | years | |||||||||||||||
Crown Colony - Topeka, KS | 7,614 | 620 | 9,956 | 3,742 | 1,148 | 13,170 | 14,318 | (6,016 | ) | 1999 | 30-37 | years | |||||||||||||||
Crystal Bay - Rochester, MN | — | 433 | 11,425 | 224 | 436 | 11,646 | 12,082 | (780 | ) | 2016 | 30-37 | years | |||||||||||||||
Cypress Court - St. Cloud, MN | 12,400 | 1,583 | 18,879 | 222 | 1,607 | 19,077 | 20,684 | (2,857 | ) | 2012 | 30-37 | years | |||||||||||||||
Dakota Commons - Williston, ND | — | 823 | 3,210 | 24 | 823 | 3,234 | 4,057 | (169 | ) | 2015 | 30-37 | years | |||||||||||||||
Deer Ridge - Jamestown, ND | 11,201 | 711 | 24,129 | 175 | 733 | 24,282 | 25,015 | (2,642 | ) | 2013 | 30-37 | years | |||||||||||||||
Dylan - Denver, CO | — | 12,155 | 77,216 | 158 | 12,155 | 77,374 | 89,529 | (1,184 | ) | 2017 | 30-37 | years | |||||||||||||||
Evergreen - Isanti, MN | 1,874 | 1,129 | 5,524 | 364 | 1,141 | 5,876 | 7,017 | (1,361 | ) | 2008 | 30-37 | years | |||||||||||||||
Forest Park - Grand Forks, ND | 7,119 | 810 | 5,579 | 8,203 | 1,459 | 13,133 | 14,592 | (7,370 | ) | 1993 | 24-37 | years | |||||||||||||||
French Creek - Rochester, MN | — | 201 | 4,735 | 146 | 207 | 4,875 | 5,082 | (313 | ) | 2016 | 30-37 | years | |||||||||||||||
Gables Townhomes - Sioux Falls, SD | 1,371 | 349 | 1,921 | 237 | 397 | 2,110 | 2,507 | (396 | ) | 2011 | 30-37 | years | |||||||||||||||
Gardens - Grand Forks, ND | — | 518 | 8,702 | 109 | 528 | 8,801 | 9,329 | (770 | ) | 2015 | 30-37 | years | |||||||||||||||
Grand Gateway - St. Cloud, MN | — | 814 | 7,086 | 1,860 | 941 | 8,819 | 9,760 | (2,003 | ) | 2012 | 30-37 | years | |||||||||||||||
GrandeVille at Cascade Lake - Rochester, MN | 36,000 | 5,003 | 50,363 | 1,551 | 5,065 | 51,852 | 56,917 | (4,343 | ) | 2015 | 30-37 | years | |||||||||||||||
Greenfield - Omaha, NE | — | 578 | 4,122 | 1,314 | 868 | 5,146 | 6,014 | (1,604 | ) | 2007 | 30-37 | years | |||||||||||||||
Heritage Manor - Rochester, MN | 3,375 | 403 | 6,968 | 3,227 | 666 | 9,932 | 10,598 | (4,886 | ) | 1998 | 30-37 | years | |||||||||||||||
Homestead Garden - Rapid City, SD | 2,957 | 655 | 14,139 | 514 | 713 | 14,595 | 15,308 | (1,772 | ) | 2015 | 30-37 | years | |||||||||||||||
Indian Hills - Sioux City, IA | — | 294 | 2,921 | 4,362 | 461 | 7,116 | 7,577 | (2,103 | ) | 2007 | 30-37 | years | |||||||||||||||
Kirkwood Manor - Bismarck, ND | 3,083 | 449 | 2,725 | 1,832 | 610 | 4,396 | 5,006 | (2,299 | ) | 1997 | 12-37 | years | |||||||||||||||
Lakeside Village - Lincoln, NE | 12,307 | 1,215 | 15,837 | 1,011 | 1,315 | 16,748 | 18,063 | (3,075 | ) | 2012 | 30-37 | years | |||||||||||||||
F-34
INVESTORS REAL ESTATE TRUST AND SUBSIDIARIES
April 30, 2018
Schedule III - REAL ESTATE AND ACCUMULATED DEPRECIATION (in thousands)
Gross amount at which carried at | Life on which | ||||||||||||||||||
Initial Cost to Company | close of period | depreciation in | |||||||||||||||||
Costs capitalized | Date of | latest income | |||||||||||||||||
Buildings & | subsequent to | Buildings & | Accumulated | Construction | statement is | ||||||||||||||
Description | Encumbrances(1) | Land | Improvements | acquisition | Land | Improvements | Total | Depreciation | or Acquisition | computed | |||||||||
Landmark - Grand Forks, ND | — | 184 | 1,514 | 1,175 | 356 | 2,517 | 2,873 | (1,379 | ) | 1997 | 30-37 | years | |||||||
Legacy - Grand Forks, ND | 14,327 | 1,362 | 21,727 | 10,396 | 2,257 | 31,228 | 33,485 | (13,904 | ) | 1995-2005 | 24-37 | years | |||||||
Legacy Heights - Bismarck, ND | — | 1,207 | 13,742 | 384 | 1,288 | 14,045 | 15,333 | (1,237 | ) | 2015 | 30-37 | years | |||||||
Mariposa - Topeka, KS | 2,756 | 399 | 5,110 | 934 | 453 | 5,990 | 6,443 | (2,038 | ) | 2004 | 30-37 | years | |||||||
Meadows - Jamestown, ND | — | 590 | 4,519 | 1,922 | 707 | 6,324 | 7,031 | (2,842 | ) | 1998 | 30-37 | years | |||||||
Monticello Crossings - Monticello, MN | — | 1,734 | 30,131 | 32 | 1,734 | 30,163 | 31,897 | (1,742 | ) | 2017 | 30-37 | years | |||||||
Monticello Village - Monticello, MN | — | 490 | 3,756 | 1,053 | 637 | 4,662 | 5,299 | (1,743 | ) | 2004 | 30-37 | years | |||||||
North Pointe - Bismarck, ND | 3,216 | 303 | 3,957 | 1,290 | 376 | 5,174 | 5,550 | (2,083 | ) | 1995-2011 | 24-37 | years | |||||||
Northridge - Bismarck, ND | — | 884 | 7,515 | 183 | 970 | 7,612 | 8,582 | (841 | ) | 2015 | 30-37 | years | |||||||
Oakmont Estates - Sioux Falls, SD | — | 422 | 4,838 | 1,361 | 705 | 5,916 | 6,621 | (2,438 | ) | 2002 | 30-37 | years | |||||||
Oakwood Estates - Sioux Falls, SD | — | 543 | 2,784 | 4,741 | 868 | 7,200 | 8,068 | (5,004 | ) | 1993 | 30-37 | years | |||||||
Olympic Village - Billings, MT | 9,933 | 1,164 | 10,441 | 3,818 | 1,824 | 13,599 | 15,423 | (6,454 | ) | 2000 | 30-37 | years | |||||||
Olympik Village - Rochester, MN | 3,991 | 1,034 | 6,109 | 2,597 | 1,271 | 8,469 | 9,740 | (2,992 | ) | 2005 | 30-37 | years | |||||||
Oxbo - St Paul, MN | — | 5,809 | 51,586 | 66 | 5,809 | 51,652 | 57,461 | (1,759 | ) | 2017 | 30-37 | years | |||||||
Oxbow Park - Sioux Falls, SD | — | 404 | 3,152 | 3,707 | 990 | 6,273 | 7,263 | (4,227 | ) | 1994 | 24-37 | years | |||||||
Park Meadows - Waite Park, MN | 8,041 | 1,143 | 9,099 | 9,686 | 2,025 | 17,903 | 19,928 | (8,722 | ) | 1997 | 30-37 | years | |||||||
Park Place - Plymouth, MN | — | 10,609 | 80,781 | 1,967 | 10,609 | 82,748 | 93,357 | (1,819 | ) | 2017 | 30-37 | years | |||||||
Pebble Springs - Bismarck, ND | — | 7 | 748 | 228 | 63 | 920 | 983 | (459 | ) | 1999 | 30-37 | years | |||||||
Pinehurst - Billings, MT | — | 72 | 687 | 458 | 168 | 1,049 | 1,217 | (434 | ) | 2002 | 30-37 | years | |||||||
Plaza - Minot, ND | 4,915 | 867 | 12,784 | 2,864 | 998 | 15,517 | 16,515 | (3,958 | ) | 2009 | 30-37 | years | |||||||
Pointe West - Rapid City, SD | 2,438 | 240 | 3,538 | 2,022 | 410 | 5,390 | 5,800 | (3,032 | ) | 1994 | 24-37 | years | |||||||
Ponds at Heritage Place - Sartell, MN | — | 395 | 4,564 | 441 | 410 | 4,990 | 5,400 | (919 | ) | 2012 | 30-37 | years | |||||||
Prairie Winds - Sioux Falls, SD | 1,315 | 144 | 1,816 | 732 | 309 | 2,383 | 2,692 | (1,509 | ) | 1993 | 24-37 | years | |||||||
Quarry Ridge - Rochester, MN | 25,662 | 2,254 | 30,024 | 2,058 | 2,406 | 31,930 | 34,336 | (7,649 | ) | 2006 | 30-37 | years | |||||||
Red 20 - Minneapolis, MN | 22,518 | 1,900 | 24,116 | 41 | 1,908 | 24,149 | 26,057 | (3,361 | ) | 2015 | 30-37 | years | |||||||
Regency Park Estates - St. Cloud, MN | 7,976 | 702 | 10,198 | 2,356 | 1,019 | 12,237 | 13,256 | (2,637 | ) | 2011 | 30-37 | years | |||||||
Renaissance Heights - Williston, ND | 22,739 | 3,080 | 15,389 | 265 | 3,117 | 15,617 | 18,734 | (826 | ) | 2013 | 30-37 | years | |||||||
Ridge Oaks - Sioux City, IA | 3,175 | 178 | 4,073 | 2,921 | 307 | 6,865 | 7,172 | (2,999 | ) | 2001 | 30-37 | years | |||||||
Rimrock West - Billings, MT | 3,092 | 330 | 3,489 | 2,018 | 516 | 5,321 | 5,837 | (2,425 | ) | 1999 | 30-37 | years | |||||||
River Ridge - Bismarck, ND | — | 576 | 24,670 | 870 | 779 | 25,337 | 26,116 | (4,492 | ) | 2008 | 30-37 | years | |||||||
Rocky Meadows - Billings, MT | 4,795 | 656 | 5,726 | 1,531 | 802 | 7,111 | 7,913 | (3,849 | ) | 1995 | 30-37 | years | |||||||
Rum River - Isanti, MN | 3,294 | 843 | 4,823 | 391 | 864 | 5,193 | 6,057 | (1,543 | ) | 2007 | 30-37 | years | |||||||
Sherwood - Topeka, KS | 11,439 | 1,142 | 14,684 | 5,036 | 1,996 | 18,866 | 20,862 | (8,743 | ) | 1999 | 30-37 | years | |||||||
Sierra Vista - Sioux Falls, SD | — | 241 | 2,097 | 581 | 283 | 2,636 | 2,919 | (571 | ) | 2011 | 30-37 | years | |||||||
Silver Springs - Rapid City, SD | 2,116 | 215 | 3,007 | 639 | 256 | 3,605 | 3,861 | (448 | ) | 2015 | 30-37 | years | |||||||
South Pointe - Minot, ND | 8,018 | 550 | 9,548 | 5,208 | 1,372 | 13,934 | 15,306 | (7,460 | ) | 1995 | 24-37 | years | |||||||
Southpoint - Grand Forks, ND | — | 576 | 9,893 | 166 | 633 | 10,002 | 10,635 | (1,302 | ) | 2013 | 30-37 | years | |||||||
Southwind - Grand Forks, ND | 5,125 | 400 | 5,034 | 3,553 | 825 | 8,162 | 8,987 | (4,680 | ) | 1995 | 24-37 | years | |||||||
Sunset Trail - Rochester, MN | 7,581 | 336 | 12,814 | 3,239 | 720 | 15,669 | 16,389 | (7,108 | ) | 1999 | 30-37 | years | |||||||
Thomasbrook - Lincoln, NE | 5,574 | 600 | 10,306 | 5,139 | 1,642 | 14,403 | 16,045 | (6,178 | ) | 1999 | 30-37 | years | |||||||
Valley Park - Grand Forks, ND | 3,607 | 294 | 4,137 | 3,950 | 1,193 | 7,188 | 8,381 | (3,719 | ) | 1999 | 30-37 | years | |||||||
Villa West - Topeka, KS | 11,523 | 1,590 | 15,760 | 1,664 | 2,226 | 16,788 | 19,014 | (3,177 | ) | 2012 | 30-37 | years | |||||||
Village Green - Rochester, MN | — | 234 | 2,296 | 1,047 | 359 | 3,218 | 3,577 | (1,281 | ) | 2003 | 30-37 | years | |||||||
Westend - Denver, CO | — | 25,525 | 102,180 | — | 25,525 | 102,180 | 127,705 | (501 | ) | 2018 | 30-37 | years | |||||||
F-35
INVESTORS REAL ESTATE TRUST AND SUBSIDIARIES
April 30, 2018
Schedule III - REAL ESTATE AND ACCUMULATED DEPRECIATION (in thousands)
Gross amount at which carried at | Life on which | ||||||||||||||||||||||||||
Initial Cost to Company | close of period | depreciation in | |||||||||||||||||||||||||
Costs capitalized | Date of | latest income | |||||||||||||||||||||||||
Buildings & | subsequent to | Buildings & | Accumulated | Construction | statement is | ||||||||||||||||||||||
Description | Encumbrances(1) | Land | Improvements | acquisition | Land | Improvements | Total | Depreciation | or Acquisition | computed | |||||||||||||||||
West Stonehill - Waite Park, MN | $ | 7,865 | $ | 939 | $ | 10,167 | $ | 7,593 | $ | 1,810 | $ | 16,889 | $ | 18,699 | $ | (9,013 | ) | 1995 | 30-37 | years | |||||||
Westwood Park - Bismarck, ND | 1,841 | 116 | 1,909 | 2,043 | 292 | 3,776 | 4,068 | (1,987 | ) | 1998 | 30-37 | years | |||||||||||||||
Whispering Ridge - Omaha, NE | 20,844 | 2,139 | 25,424 | 1,542 | 2,418 | 26,687 | 29,105 | (4,407 | ) | 2012 | 30-37 | years | |||||||||||||||
Williston Garden - Williston, ND | 6,283 | 1,400 | 10,200 | 336 | 1,445 | 10,491 | 11,936 | (576 | ) | 2012 | 30-37 | years | |||||||||||||||
Winchester - Rochester, MN | — | 748 | 5,622 | 2,516 | 1,044 | 7,842 | 8,886 | (3,206 | ) | 2003 | 30-37 | years | |||||||||||||||
Woodridge - Rochester, MN | 5,737 | 370 | 6,028 | 3,089 | 750 | 8,737 | 9,487 | (4,663 | ) | 1997 | 30-37 | years | |||||||||||||||
Total Multifamily | $ | 505,618 | $ | 135,906 | $ | 1,289,330 | $ | 181,185 | $ | 157,150 | $ | 1,449,271 | $ | 1,606,421 | $ | (294,477 | ) | ||||||||||
Gross amount at which carried at | Life on which | |||||||||||||||||||||||||||
Initial Cost to Company | close of period | depreciation in | ||||||||||||||||||||||||||
Costs capitalized | Date of | latest income | ||||||||||||||||||||||||||
Buildings & | subsequent to | Buildings & | Accumulated | Construction | statement is | |||||||||||||||||||||||
Description | Encumbrances(1) | Land | Improvements | acquisition | Land | Improvements | Total | Depreciation | or Acquisition | computed | ||||||||||||||||||
Other - Mixed Use | ||||||||||||||||||||||||||||
71 France - Edina, MN | $ | — | $ | — | $ | 5,879 | $ | 774 | $ | — | $ | 6,653 | $ | 6,653 | $ | (397 | ) | 2016 | 30-37 | years | ||||||||
Oxbo - St Paul, MN | — | — | 3,471 | 54 | — | 3,525 | 3,525 | (113 | ) | 2017 | 30-37 | years | ||||||||||||||||
Plaza - Minot, ND | 6,522 | 389 | 5,444 | 3,764 | 598 | 8,999 | 9,597 | (3,226 | ) | 2009 | 30-37 | years | ||||||||||||||||
Red 20 - Minneapolis, MN | — | — | 2,525 | 355 | — | 2,880 | 2,880 | (310 | ) | 2015 | 30-37 | years | ||||||||||||||||
Total Other - Mixed Use | $ | 6,522 | $ | 389 | $ | 17,319 | $ | 4,947 | $ | 598 | $ | 22,057 | $ | 22,655 | $ | (4,046 | ) | |||||||||||
Other - Commercial | ||||||||||||||||||||||||||||
Bloomington 2000 W 94th Street - Bloomington, MN | $ | — | $ | 2,133 | $ | 1,864 | $ | — | $ | 2,133 | $ | 1,864 | $ | 3,997 | $ | — | 2006 | 30-37 | years | |||||||||
Dakota West Plaza - Minot , ND | — | 92 | 493 | 30 | 106 | 509 | 615 | (173 | ) | 2006 | 30-37 | years | ||||||||||||||||
Fresenius - Duluth, MN | — | 50 | 1,520 | 2 | 50 | 1,522 | 1,572 | (547 | ) | 2004 | 30-37 | years | ||||||||||||||||
Minot 1400 31st Ave - Minot, ND | — | 1,026 | 6,143 | 4,422 | 1,038 | 10,553 | 11,591 | (5,334 | ) | 2010 | 30-37 | years | ||||||||||||||||
Minot 2505 16th Street SW - Minot, ND | — | 298 | 1,724 | 296 | 298 | 2,020 | 2,318 | (544 | ) | 2009 | 30-37 | years | ||||||||||||||||
Minot Arrowhead - Minot, ND | — | 100 | 3,216 | 5,586 | 176 | 8,726 | 8,902 | (3,191 | ) | 1973 | 30-37 | years | ||||||||||||||||
Minot IPS - Minot, ND | — | 416 | 5,952 | — | 416 | 5,952 | 6,368 | (3,012 | ) | 2012 | 30-37 | years | ||||||||||||||||
Minot Southgate Retail - Minot, ND | — | 889 | 1,036 | — | 889 | 1,036 | 1,925 | — | 2015 | 30-37 | years | |||||||||||||||||
Woodbury 1865 Woodlane - Woodbury, MN | — | 1,108 | 2,292 | — | 1,108 | 2,292 | 3,400 | — | 2007 | 30-37 | years | |||||||||||||||||
Total Other - Commercial | $ | — | $ | 6,112 | $ | 24,240 | $ | 10,336 | $ | 6,214 | $ | 34,474 | $ | 40,688 | $ | (12,801 | ) | |||||||||||
Subtotal | $ | 512,140 | $ | 142,407 | $ | 1,330,889 | $ | 196,468 | $ | 163,962 | $ | 1,505,802 | $ | 1,669,764 | $ | (311,324 | ) | |||||||||||
F-36
INVESTORS REAL ESTATE TRUST AND SUBSIDIARIES
April 30, 2018
Schedule III - REAL ESTATE AND ACCUMULATED DEPRECIATION (in thousands)
Gross amount at which carried at | ||||||||||||||||||||||||||
Initial Cost to Company | close of period | |||||||||||||||||||||||||
Costs capitalized | Date of | |||||||||||||||||||||||||
Buildings & | subsequent to | Buildings & | Accumulated | Construction | ||||||||||||||||||||||
Description | Encumbrances (1) | Land | Improvements | acquisition | Land | Improvements | Total | Depreciation | or Acquisition | |||||||||||||||||
Unimproved Land | ||||||||||||||||||||||||||
Badger Hills - Rochester, MN | $ | — | $ | 1,050 | $ | — | $ | 354 | $ | 1,404 | $ | — | $ | 1,404 | $ | — | 2012 | |||||||||
Creekside Crossing - Bismarck, ND | — | 3,577 | — | 693 | 4,270 | — | 4,270 | — | 2015 | |||||||||||||||||
Grand Forks - Grand Forks, ND | — | 2,798 | — | 2 | 2,800 | — | 2,800 | — | 2012 | |||||||||||||||||
Minot 1525 24th Ave SW - Minot, ND | — | 506 | — | — | 506 | — | 506 | — | 2015 | |||||||||||||||||
Rapid City Unimproved- Rapid City, SD | — | 1,376 | — | — | 1,376 | — | 1,376 | — | 2014 | |||||||||||||||||
Renaissance Heights - Williston, ND | — | 750 | — | — | 750 | — | 750 | — | 2012 | |||||||||||||||||
Weston - Weston, WI | — | 370 | — | — | 370 | — | 370 | — | 2006 | |||||||||||||||||
Total Unimproved Land | — | $ | 10,427 | $ | — | $ | 1,049 | $ | 11,476 | — | $ | 11,476 | $ | — | ||||||||||||
Total | $ | 512,140 | $ | 152,834 | $ | 1,330,889 | $ | 197,517 | $ | 175,438 | $ | 1,505,802 | $ | 1,681,240 | $ | (311,324 | ) | |||||||||
(1) | Amounts in this column are the mortgages payable balance as of April 30, 2018. These amounts do not include amounts owing under the Company's multi-bank line of credit or term loan. |
Reconciliations of the carrying value of total property owned for the three years ended April 30, 2018, 2017, and 2016 are as follows:
(in thousands) | ||||||||||
2018 | 2017 | 2016 | ||||||||
Balance at beginning of year | $ | 1,358,529 | $ | 1,369,893 | $ | 1,090,362 | ||||
Additions during year | ||||||||||
Multifamily and Other | 369,332 | 61,565 | 285,080 | |||||||
Improvements and Other | 15,065 | 34,761 | 31,007 | |||||||
1,742,926 | 1,466,219 | 1,406,449 | ||||||||
Deductions during year | ||||||||||
Cost of real estate sold | (46,001 | ) | (21,601 | ) | (1,305 | ) | ||||
Impairment charge | (15,192 | ) | (51,401 | ) | — | |||||
Write down of asset and accumulated depreciation on impaired assets | (8,597 | ) | (7,144 | ) | — | |||||
Properties classified as held for sale during the year | — | (24,156 | ) | (26,373 | ) | |||||
Other (1) | (3,372 | ) | (3,388 | ) | (8,878 | ) | ||||
Balance at close of year | $ | 1,669,764 | $ | 1,358,529 | $ | 1,369,893 | ||||
F-37
INVESTORS REAL ESTATE TRUST AND SUBSIDIARIES
April 30, 2018
Schedule III - REAL ESTATE AND ACCUMULATED DEPRECIATION (in thousands)
Reconciliations of accumulated depreciation/amortization for the three years ended April 30, 2018, 2017, and 2016, are as follows:
(in thousands) | ||||||||||
2018 | 2017 | 2016 | ||||||||
Balance at beginning of year | $ | 255,599 | $ | 237,859 | $ | 212,826 | ||||
Additions during year | ||||||||||
Provisions for depreciation | 78,785 | 42,960 | 37,846 | |||||||
Deductions during year | ||||||||||
Accumulated depreciation on real estate sold or classified as held for sale | (11,033 | ) | (14,687 | ) | (9,957 | ) | ||||
Write down of asset and accumulated depreciation on impaired assets | (8,597 | ) | (7,144 | ) | — | |||||
Other (1) | (3,430 | ) | (3,389 | ) | (2,856 | ) | ||||
Balance at close of year | $ | 311,324 | $ | 255,599 | $ | 237,859 | ||||
Reconciliations of development in progress for the three years ended April 30, 2018, 2017, and 2016, are as follows:
(in thousands) | ||||||||||
2018 | 2017 | 2016 | ||||||||
Balance at beginning of year | $ | — | $ | 51,681 | $ | 153,994 | ||||
Additions during year | ||||||||||
Unimproved land moved to development in progress | — | — | 1,734 | |||||||
Improvements and other | — | 7,762 | 48,109 | |||||||
Deductions during year | ||||||||||
Development placed in service (2) | — | (59,443 | ) | (152,156 | ) | |||||
Balance at close of year | $ | — | $ | — | $ | 51,681 | ||||
F-38
INVESTORS REAL ESTATE TRUST AND SUBSIDIARIES
April 30, 2018
Schedule III - REAL ESTATE AND ACCUMULATED DEPRECIATION (in thousands)
Reconciliations of unimproved land for the three years ended April 30, 2018, 2017, and 2016 are as follows:
(in thousands) | ||||||||||
2018 | 2017 | 2016 | ||||||||
Balance at beginning of year | $ | 18,455 | $ | 20,939 | $ | 25,827 | ||||
Additions during year | ||||||||||
Improvements and other | — | 1,024 | 205 | |||||||
Deductions during year | ||||||||||
Cost of real estate sold | (1,000 | ) | — | (442 | ) | |||||
Impairment charge | (2,617 | ) | (3,508 | ) | (1,285 | ) | ||||
Properties classified as held for sale during the year | (3,288 | ) | — | (1,632 | ) | |||||
Unimproved land moved to development in progress | — | — | (1,734 | ) | ||||||
Other (1) | (74 | ) | — | — | ||||||
Balance at close of year | 11,476 | 18,455 | 20,939 | |||||||
Total real estate investments, excluding mortgage notes receivable (3) | $ | 1,369,916 | $ | 1,121,385 | $ | 1,204,654 | ||||
(1) | Consists of miscellaneous disposed assets. |
(2) | Includes development projects that are placed in service in phases. |
(3) | The net basis, including held for sale properties, for Federal Income Tax purposes was $1.5 billion, $1.4 billion and $1.6 billion at April 30, 2018, 2017 and 2016, respectively. |
F-39