Attached files
| file | filename |
|---|---|
| EX-32.2 - EX-32.2 - MCDERMOTT INTERNATIONAL INC | mdr-ex322_6.htm |
| EX-32.1 - EX-32.1 - MCDERMOTT INTERNATIONAL INC | mdr-ex321_7.htm |
| EX-31.2 - EX-31.2 - MCDERMOTT INTERNATIONAL INC | mdr-ex312_9.htm |
| EX-31.1 - EX-31.1 - MCDERMOTT INTERNATIONAL INC | mdr-ex311_8.htm |
| EX-12.1 - EX-12.1 - MCDERMOTT INTERNATIONAL INC | mdr-ex121_30.htm |
UNITED STATES
SECURITIES AND EXCHANGE COMMISSION
Washington, D.C. 20549
FORM 10-Q
(Mark One)
|
☑ |
QUARTERLY REPORT PURSUANT TO SECTION 13 OR 15(d) OF THE SECURITIES EXCHANGE ACT OF 1934 |
For the quarterly period ended September 30, 2018
OR
|
☐ |
TRANSITION REPORT PURSUANT TO SECTION 13 OR 15(d) OF THE SECURITIES EXCHANGE ACT OF 1934 |
For the transition period from to
Commission File No. 001-08430
McDERMOTT INTERNATIONAL, INC.
(Exact name of registrant as specified in its charter)
|
REPUBLIC OF PANAMA |
|
|
72-0593134 |
|
(State or Other Jurisdiction of Incorporation or Organization) |
|
|
(I.R.S. Employer Identification No.) |
|
|
|
|
|
|
757 N. Eldridge Parkway HOUSTON, TEXAS |
|
|
77079 |
|
(Address of Principal Executive Offices) |
|
|
(Zip Code) |

Registrant’s Telephone Number, Including Area Code: (281) 870-5000
Indicate by check mark whether the registrant (1) has filed all reports required to be filed by Section 13 or 15(d) of the Securities Exchange Act of 1934 during the preceding 12 months (or for such shorter period that the registrant was required to file such reports), and (2) has been subject to such filing requirements for the past 90 days. Yes ☑ No ☐
Indicate by check mark whether the registrant has submitted electronically every Interactive Data File required to be submitted pursuant to Rule 405 of Regulation S-T (§ 232.405 of this chapter) during the preceding 12 months (or for such shorter period that the registrant was required to submit such files). Yes ☑ No ☐
Indicate by check mark whether the registrant is a large accelerated filer, an accelerated filer, a non-accelerated filer, a smaller reporting company, or an emerging growth company. See the definitions of “large accelerated filer,” “accelerated filer,” “smaller reporting company” and “emerging growth company” in Rule 12b-2 of the Exchange Act.
|
Large accelerated filer |
☑ |
Accelerated filer |
☐ |
|
|
|
|
|
|
Non-accelerated filer |
☐ |
Smaller reporting company |
☐ |
|
|
|
|
|
|
|
|
Emerging growth company |
☐ |
If an emerging growth company, indicate by check mark if the registrant has elected not to use the extended transition period for complying with any new or revised financial accounting standards provided pursuant to Section 13(a) of the Exchange Act. ☐
Indicate by check mark whether the registrant is a shell company (as defined in Rule 12b-2 of the Exchange Act). Yes ☐ No ☑
The number of shares of the registrant’s common stock outstanding at October 26, 2018 was 180,584,114.
TABLE OF CONTENTS
INDEX—FORM 10-Q
|
|
|
PAGE |
|
|
1 |
|
|
Item 1—Condensed Consolidated Financial Statements |
|
|
|
|
1 |
|
|
|
2 |
|
|
|
3 |
|
|
|
4 |
|
|
|
5 |
|
|
|
7 |
|
|
Item 2—Management’s Discussion and Analysis of Financial Condition and Results of Operations |
|
47 |
|
Item 3—Quantitative and Qualitative Disclosures about Market Risk |
|
75 |
|
|
76 |
|
|
|
77 |
|
|
|
77 |
|
|
|
77 |
|
|
|
78 |
|
|
|
82 |
|
|
|
83 |
CONDENSED CONSOLIDATED FINANCIAL STATEMENTS
PART I: Item 1—FINANCIAL INFORMATION
McDERMOTT INTERNATIONAL, INC.
CONDENSED CONSOLIDATED STATEMENTS OF OPERATIONS
(Unaudited)
|
|
|
Three Months Ended September 30, |
|
|
Nine Months Ended September 30, |
|
||||||||||
|
|
|
2018 |
|
|
2017 |
|
|
2018 |
|
|
2017 |
|
||||
|
|
|
(In millions, except per share amounts) |
|
|||||||||||||
|
Revenues |
|
$ |
2,289 |
|
|
$ |
959 |
|
|
$ |
4,632 |
|
|
$ |
2,267 |
|
|
|
|
|
|
|
|
|
|
|
|
|
|
|
|
|
|
|
|
Costs and Expenses: |
|
|
|
|
|
|
|
|
|
|
|
|
|
|
|
|
|
Cost of operations |
|
|
1,986 |
|
|
|
774 |
|
|
|
3,948 |
|
|
|
1,853 |
|
|
Project related intangibles amortization |
|
|
30 |
|
|
|
- |
|
|
|
42 |
|
|
|
- |
|
|
Total cost of operations |
|
|
2,016 |
|
|
|
774 |
|
|
|
3,990 |
|
|
|
1,853 |
|
|
Research and development expenses |
|
|
8 |
|
|
|
2 |
|
|
|
13 |
|
|
|
3 |
|
|
Selling, general and administrative expenses |
|
|
64 |
|
|
|
55 |
|
|
|
188 |
|
|
|
142 |
|
|
Other intangibles amortization |
|
|
25 |
|
|
|
- |
|
|
|
35 |
|
|
|
- |
|
|
Transaction costs |
|
|
5 |
|
|
|
- |
|
|
|
45 |
|
|
|
- |
|
|
Restructuring and integration costs |
|
|
31 |
|
|
|
- |
|
|
|
106 |
|
|
|
- |
|
|
Other operating expenses (income), net |
|
|
1 |
|
|
|
- |
|
|
|
2 |
|
|
|
(2 |
) |
|
Total expenses |
|
|
2,150 |
|
|
|
831 |
|
|
|
4,379 |
|
|
|
1,996 |
|
|
|
|
|
|
|
|
|
|
|
|
|
|
|
|
|
|
|
|
Income (loss) from investments in unconsolidated affiliates |
|
|
3 |
|
|
|
(3 |
) |
|
|
2 |
|
|
|
(9 |
) |
|
Investment in unconsolidated affiliates-related amortization |
|
|
(13 |
) |
|
|
- |
|
|
|
(13 |
) |
|
|
- |
|
|
Operating income |
|
|
129 |
|
|
|
125 |
|
|
|
242 |
|
|
|
262 |
|
|
|
|
|
|
|
|
|
|
|
|
|
|
|
|
|
|
|
|
Other expense: |
|
|
|
|
|
|
|
|
|
|
|
|
|
|
|
|
|
Interest expense, net |
|
|
(86 |
) |
|
|
(12 |
) |
|
|
(169 |
) |
|
|
(51 |
) |
|
Other non-operating income (expense), net |
|
|
1 |
|
|
|
- |
|
|
|
(13 |
) |
|
|
(2 |
) |
|
Total other expense, net |
|
|
(85 |
) |
|
|
(12 |
) |
|
|
(182 |
) |
|
|
(53 |
) |
|
|
|
|
|
|
|
|
|
|
|
|
|
|
|
|
|
|
|
Income before provision for income taxes |
|
|
44 |
|
|
|
113 |
|
|
|
60 |
|
|
|
209 |
|
|
|
|
|
|
|
|
|
- |
|
|
|
|
|
|
|
|
|
|
Income tax expense (benefit) |
|
|
44 |
|
|
|
19 |
|
|
|
(19 |
) |
|
|
53 |
|
|
|
|
|
|
|
|
|
|
|
|
|
|
|
|
|
|
|
|
Non-operating loss from investments in unconsolidated affiliates |
|
|
- |
|
|
|
- |
|
|
|
- |
|
|
|
(2 |
) |
|
|
|
|
|
|
|
|
|
|
|
|
|
|
|
|
|
|
|
Net income |
|
|
- |
|
|
|
94 |
|
|
|
79 |
|
|
|
154 |
|
|
|
|
|
|
|
|
|
|
|
|
|
|
|
|
|
|
|
|
Less: Net (loss) income attributable to noncontrolling interests |
|
|
(2 |
) |
|
|
(1 |
) |
|
|
(5 |
) |
|
|
1 |
|
|
|
|
|
|
|
|
|
|
|
|
|
|
|
|
|
|
|
|
Net income attributable to McDermott |
|
$ |
2 |
|
|
$ |
95 |
|
|
$ |
84 |
|
|
$ |
153 |
|
|
|
|
|
|
|
|
|
|
|
|
|
|
|
|
|
|
|
|
Net income per share attributable to McDermott |
|
|
|
|
|
|
|
|
|
|
|
|
|
|
|
|
|
Basic |
|
$ |
0.01 |
|
|
$ |
1.00 |
|
|
$ |
0.60 |
|
|
$ |
1.70 |
|
|
Diluted |
|
$ |
0.01 |
|
|
$ |
1.00 |
|
|
$ |
0.60 |
|
|
$ |
1.61 |
|
|
|
|
|
|
|
|
|
|
|
|
|
|
|
|
|
|
|
|
Shares used in the computation of net income per share: |
|
|
|
|
|
|
|
|
|
|
|
|
|
|
|
|
|
Basic |
|
|
180 |
|
|
|
95 |
|
|
|
140 |
|
|
|
90 |
|
|
Diluted |
|
|
181 |
|
|
|
95 |
|
|
|
141 |
|
|
|
95 |
|
See accompanying Notes to these Condensed Consolidated Financial Statements.
|
|
1 |
|

CONDENSED CONSOLIDATED FINANCIAL STATEMENTS
McDERMOTT INTERNATIONAL, INC.
CONDENSED CONSOLIDATED STATEMENTS OF COMPREHENSIVE INCOME
(Unaudited)
|
|
|
Three Months Ended September 30, |
|
|
Nine Months Ended September 30, |
|
||||||||||
|
|
|
2018 |
|
|
2017 |
|
|
2018 |
|
|
2017 |
|
||||
|
|
|
(In millions) |
|
|||||||||||||
|
Net income |
|
$ |
- |
|
|
$ |
94 |
|
|
$ |
79 |
|
|
$ |
154 |
|
|
Other comprehensive (loss) income, net of tax: |
|
|
|
|
|
|
|
|
|
|
|
|
|
|
|
|
|
(Loss) gain on derivatives |
|
|
(1 |
) |
|
|
9 |
|
|
|
(13 |
) |
|
|
20 |
|
|
Foreign currency translation |
|
|
(8 |
) |
|
|
(7 |
) |
|
|
(20 |
) |
|
|
(7 |
) |
|
Total comprehensive income |
|
|
(9 |
) |
|
|
96 |
|
|
|
46 |
|
|
|
167 |
|
|
Less: Comprehensive (loss) income attributable to noncontrolling interests |
|
|
(2 |
) |
|
|
(1 |
) |
|
|
(5 |
) |
|
|
1 |
|
|
Comprehensive (loss) income attributable to McDermott |
|
$ |
(7 |
) |
|
$ |
97 |
|
|
$ |
51 |
|
|
$ |
166 |
|
See accompanying Notes to these Condensed Consolidated Financial Statements.
|
|
2 |
|
CONDENSED CONSOLIDATED FINANCIAL STATEMENTS
McDERMOTT INTERNATIONAL, INC.
CONDENSED CONSOLIDATED BALANCE SHEETS
|
|
|
September 30, 2018 |
|
|
December 31, 2017 |
|
||
|
|
|
(In millions, except per share amounts) |
|
|||||
|
Assets |
|
(Unaudited) |
|
|
|
|
|
|
|
Current assets: |
|
|
|
|
|
|
|
|
|
Cash and cash equivalents ($158 and $0 related to variable interest entities ("VIEs")) |
|
$ |
580 |
|
|
$ |
390 |
|
|
Restricted cash and cash equivalents |
|
|
325 |
|
|
|
18 |
|
|
Accounts receivable—trade, net ($28 and $0 related to VIEs) |
|
|
1,093 |
|
|
|
328 |
|
|
Accounts receivable—other ($59 and $0 related to VIEs) |
|
|
252 |
|
|
|
42 |
|
|
Contracts in progress ($63 and $0 related to VIEs) |
|
|
723 |
|
|
|
621 |
|
|
Project related intangible assets, net |
|
|
176 |
|
|
|
- |
|
|
Inventory |
|
|
58 |
|
|
|
- |
|
|
Other current assets ($26 and $0 related to VIEs) |
|
|
145 |
|
|
|
36 |
|
|
Total current assets |
|
|
3,352 |
|
|
|
1,435 |
|
|
Property, plant and equipment, net |
|
|
2,106 |
|
|
|
1,666 |
|
|
Accounts receivable—long-term retainages |
|
|
71 |
|
|
|
39 |
|
|
Investments in unconsolidated affiliates |
|
|
444 |
|
|
|
8 |
|
|
Goodwill |
|
|
4,708 |
|
|
|
- |
|
|
Other intangibles, net |
|
|
1,006 |
|
|
|
- |
|
|
Deferred income taxes |
|
|
181 |
|
|
|
18 |
|
|
Other non-current assets |
|
|
188 |
|
|
|
57 |
|
|
Total assets |
|
$ |
12,056 |
|
|
$ |
3,223 |
|
|
|
|
|
|
|
|
|
|
|
|
Liabilities and Equity |
|
|
|
|
|
|
|
|
|
Current liabilities: |
|
|
|
|
|
|
|
|
|
Current maturities of long-term debt |
|
$ |
35 |
|
|
$ |
24 |
|
|
Current portion of long-term lease obligations |
|
|
7 |
|
|
|
- |
|
|
Accounts payable ($328 and $0 related to VIEs) |
|
|
874 |
|
|
|
279 |
|
|
Advance billings on contracts ($476 and $0 related to VIEs) |
|
|
1,733 |
|
|
|
32 |
|
|
Project related intangible liabilities, net |
|
|
76 |
|
|
|
- |
|
|
Accrued liabilities ($110 and $0 related to VIEs) |
|
|
1,579 |
|
|
|
372 |
|
|
Total current liabilities |
|
|
4,304 |
|
|
|
707 |
|
|
Long-term debt |
|
|
3,397 |
|
|
|
512 |
|
|
Long-term lease obligations |
|
|
68 |
|
|
|
1 |
|
|
Deferred income taxes |
|
|
77 |
|
|
|
28 |
|
|
Other non-current liabilities |
|
|
614 |
|
|
|
186 |
|
|
Total liabilities |
|
|
8,460 |
|
|
|
1,434 |
|
|
Commitments and contingencies |
|
|
|
|
|
|
|
|
|
Stockholders' equity: |
|
|
|
|
|
|
|
|
|
Common stock, par value $1.00 per share, authorized 255 shares; |
|
|
|
|
|
|
|
|
|
issued 183 and 98 shares, respectively |
|
|
183 |
|
|
|
98 |
|
|
Capital in excess of par value |
|
3,488 |
|
|
|
1,858 |
|
|
|
Retained earnings/ (accumulated deficit) |
|
|
56 |
|
|
|
(48 |
) |
|
Accumulated other comprehensive loss |
|
|
(84 |
) |
|
|
(51 |
) |
|
Treasury stock, at cost: 3 and 3 shares, respectively |
|
|
(96 |
) |
|
|
(96 |
) |
|
Total McDermott Stockholders' Equity |
|
|
3,547 |
|
|
|
1,761 |
|
|
Noncontrolling interest |
|
|
49 |
|
|
|
28 |
|
|
Total stockholders' equity |
|
|
3,596 |
|
|
|
1,789 |
|
|
Total liabilities and stockholders' equity |
|
$ |
12,056 |
|
|
$ |
3,223 |
|
See accompanying Notes to these Condensed Consolidated Financial Statements.
|
|
3 |
|
CONDENSED CONSOLIDATED FINANCIAL STATEMENTS
McDERMOTT INTERNATIONAL, INC.
CONDENSED CONSOLIDATED STATEMENTS OF CASH FLOWS
(Unaudited)
|
|
|
Nine Months Ended September 30, |
|
|||||
|
|
|
2018 |
|
|
2017 |
|
||
|
|
|
(In millions) |
|
|||||
|
Cash flows from operating activities: |
|
|
|
|
|
|
|
|
|
Net income |
|
$ |
79 |
|
|
$ |
154 |
|
|
Non-cash items included in net income: |
|
|
|
|
|
|
|
|
|
Depreciation and amortization |
|
|
187 |
|
|
|
78 |
|
|
Debt issuance cost amortization |
|
|
27 |
|
|
|
- |
|
|
Stock-based compensation charges |
|
|
36 |
|
|
|
20 |
|
|
Deferred taxes |
|
|
(86 |
) |
|
|
10 |
|
|
Other non-cash items |
|
|
2 |
|
|
|
8 |
|
|
Changes in operating assets and liabilities, net of effects of businesses acquired: |
|
|
|
|
|
|
|
|
|
Accounts receivable |
|
|
130 |
|
|
|
120 |
|
|
Contracts in progress, net of Advance billings on contracts |
|
|
(318 |
) |
|
|
(673 |
) |
|
Inventory |
|
|
4 |
|
|
|
- |
|
|
Accounts payable |
|
|
123 |
|
|
|
339 |
|
|
Other current and non-current assets |
|
|
(52 |
) |
|
|
(29 |
) |
|
Investments in unconsolidated affiliates |
|
|
(2 |
) |
|
|
11 |
|
|
Other current and non-current liabilities |
|
|
84 |
|
|
|
98 |
|
|
Total cash provided by operating activities |
|
|
214 |
|
|
|
136 |
|
|
|
|
|
|
|
|
|
|
|
|
Cash flows from investing activities: |
|
|
|
|
|
|
|
|
|
CB&I combination consideration, net of cash acquired of $498 |
|
|
(2,374 |
) |
|
|
- |
|
|
Purchases of property, plant and equipment |
|
|
(62 |
) |
|
|
(97 |
) |
|
Advances related to proportionately consolidated consortiums |
|
|
(155 |
) |
|
|
- |
|
|
Proceeds from asset dispositions |
|
|
55 |
|
|
|
55 |
|
|
Investments in unconsolidated affiliates |
|
|
(14 |
) |
|
|
(3 |
) |
|
Total cash used in investing activities |
|
|
(2,550 |
) |
|
|
(45 |
) |
|
|
|
|
|
|
|
|
|
|
|
Cash flows from financing activities: |
|
|
|
|
|
|
|
|
|
Proceeds from issuance of long-term debt |
|
|
3,560 |
|
|
|
- |
|
|
Repayment of debt and capital lease obligations |
|
|
(531 |
) |
|
|
(231 |
) |
|
Advances related to equity method joint ventures and proportionately consolidated consortiums |
|
|
67 |
|
|
|
- |
|
|
Debt and letter of credit issuance costs |
|
|
(209 |
) |
|
|
(20 |
) |
|
Debt extinguishment costs |
|
|
(10 |
) |
|
|
- |
|
|
Acquisition of NCI |
|
|
- |
|
|
|
(11 |
) |
|
Repurchase of common stock |
|
|
(14 |
) |
|
|
(7 |
) |
|
Total cash provided by (used in) financing activities |
|
|
2,863 |
|
|
|
(269 |
) |
|
|
|
|
|
|
|
|
|
|
|
Effects of exchange rate changes on cash, cash equivalents and restricted cash |
|
|
(30 |
) |
|
|
- |
|
|
Net increase (decrease) in cash, cash equivalents and restricted cash |
|
|
497 |
|
|
|
(178 |
) |
|
Cash, cash equivalents and restricted cash at beginning of period |
|
|
408 |
|
|
|
612 |
|
|
Cash, cash equivalents and restricted cash at end of period |
|
$ |
905 |
|
|
$ |
434 |
|
See accompanying Notes to these Condensed Consolidated Financial Statements.
|
|
4 |
|
CONDENSED CONSOLIDATED FINANCIAL STATEMENTS
McDERMOTT INTERNATIONAL, INC.
CONDENSED CONSOLIDATED STATEMENTS OF EQUITY
(Unaudited)
|
|
|
Common Stock Par Value |
|
|
Capital in Excess of Par Value |
|
|
Retained Earnings/ (Accumulated Deficit) |
|
|
Accumulated Other Comprehensive Loss ("AOCI") |
|
|
Treasury Stock |
|
|
Stockholders' Equity |
|
|
Noncontrolling Interest ("NCI") |
|
|
Total Equity |
|
||||||||
|
|
(In millions) |
|
||||||||||||||||||||||||||||||
|
Balance at December 31, 2017 |
|
$ |
98 |
|
|
$ |
1,858 |
|
|
$ |
(48 |
) |
|
$ |
(51 |
) |
|
$ |
(96 |
) |
|
$ |
1,761 |
|
|
$ |
28 |
|
$ |
|
1,789 |
|
|
Adoption of ASC 606 |
|
|
- |
|
|
|
- |
|
|
|
20 |
|
|
|
- |
|
|
|
- |
|
|
|
20 |
|
|
|
- |
|
|
|
20 |
|
|
Balance at January 1, 2018 |
|
|
98 |
|
|
|
1,858 |
|
|
|
(28 |
) |
|
|
(51 |
) |
|
|
(96 |
) |
|
|
1,781 |
|
|
|
28 |
|
|
|
1,809 |
|
|
Net income |
|
|
- |
|
|
|
- |
|
|
|
84 |
|
|
|
- |
|
|
|
- |
|
|
|
84 |
|
|
|
(5 |
) |
|
|
79 |
|
|
CB&I Combination |
|
|
85 |
|
|
|
1,608 |
|
|
|
- |
|
|
|
- |
|
|
|
- |
|
|
|
1,693 |
|
|
|
26 |
|
|
|
1,719 |
|
|
Other comprehensive loss, net of tax |
|
|
- |
|
|
|
|
|
|
|
- |
|
|
|
(33 |
) |
|
|
- |
|
|
|
(33 |
) |
|
|
- |
|
|
|
(33 |
) |
|
Common stock issued |
|
|
1 |
|
|
|
(1 |
) |
|
|
- |
|
|
|
- |
|
|
|
- |
|
|
|
- |
|
|
|
- |
|
|
|
- |
|
|
Stock-based compensation charges |
|
|
- |
|
|
|
36 |
|
|
|
- |
|
|
|
- |
|
|
|
- |
|
|
|
36 |
|
|
|
- |
|
|
|
36 |
|
|
Purchase of treasury shares |
|
|
- |
|
|
|
- |
|
|
|
- |
|
|
|
- |
|
|
|
(14 |
) |
|
|
(14 |
) |
|
|
- |
|
|
|
(14 |
) |
|
Retirement of common stock |
|
|
(1 |
) |
|
|
(13 |
) |
|
|
- |
|
|
|
- |
|
|
|
14 |
|
|
|
- |
|
|
|
- |
|
|
|
- |
|
|
Balance at September 30, 2018 |
|
$ |
183 |
|
|
$ |
3,488 |
|
|
$ |
56 |
|
|
$ |
(84 |
) |
|
$ |
(96 |
) |
|
$ |
3,547 |
|
|
$ |
49 |
|
$ |
|
3,596 |
|
|
|
5 |
|
NOTES TO THE CONDENSED CONSOLIDATED FINANCIAL STATEMENTS (UNAUDITED)
|
|
|
|
|
|
|
PAGE |
|
|
7 |
|
|
Note 2—Basis of Presentation and Significant Accounting Policies |
|
7 |
|
|
15 |
|
|
|
20 |
|
|
|
23 |
|
|
|
23 |
|
|
|
24 |
|
|
Note 8—Contracts in Progress and Advance Billings on Contracts |
|
24 |
|
|
25 |
|
|
|
25 |
|
|
|
28 |
|
|
|
28 |
|
|
|
33 |
|
|
|
34 |
|
|
|
35 |
|
|
|
35 |
|
|
|
36 |
|
|
|
38 |
|
|
Note 19—Stockholders’ Equity and Equity-based Incentive Plans |
|
39 |
|
|
40 |
|
|
|
41 |
|
|
|
44 |
|
|
|
46 |
|
|
6 |
|
NOTES TO THE CONDENSED CONSOLIDATED FINANCIAL STATEMENTS (UNAUDITED)
NOTE 1—NATURE OF OPERATIONS AND ORGANIZATION
Nature of Operations
McDermott International, Inc. (“McDermott,” “MDR,” “we,” “our” or “us”), a corporation incorporated under the laws of the Republic of Panama in 1959, is a fully-integrated provider of engineering, procurement, construction and installation (“EPCI”) and technology solutions to the energy industry. On May 10, 2018, we completed our combination with Chicago Bridge & Iron Company N.V. (“CB&I”) through a series of transactions (the “Combination”) (see Note 3, Business Combination, for further discussion). We design and build end-to-end infrastructure and technology solutions to transport and transform oil and gas into a variety of products. Our proprietary technologies, integrated expertise and comprehensive solutions are utilized for offshore, subsea, power, liquefied natural gas (“LNG”) and downstream energy projects around the world. Our customers include national, major integrated and other oil and gas companies as well as producers of petrochemicals and electric power, and we operate in most major energy producing regions throughout the world. We execute our contracts through a variety of methods, principally fixed-price, but also including cost reimbursable, cost-plus, day-rate and unit-rate basis or some combination of those methods.
Organization
Our business is organized into five operating groups, which represent our reportable segments consisting of: North, Central and South America (“NCSA”); Europe, Africa, Russia and Caspian (“EARC”); the Middle East and North Africa (“MENA”); Asia Pacific (“APAC”); and Technology. See Note 22, Segment Reporting for further discussion.
NOTE 2—BASIS OF PRESENTATION AND SIGNIFICANT ACCOUNTING POLICIES
Basis of Accounting and Consolidation
The accompanying Condensed Consolidated Financial Statements (the “Financial Statements”) are unaudited and have been prepared from our books and records in accordance with Rule 10-1 of Regulation S-X for interim financial information. Accordingly, they do not include all of the information and notes required by accounting principles generally accepted in the United States (“U.S. GAAP”) for complete financial statements and are not necessarily indicative of results of operations for a full year. Therefore, they should be read in conjunction with the Financial Statements and Notes thereto included in our Current Report on Form 8-K filed with the SEC on July 31, 2018 (the “July 31 Form 8-K”).
These Financial Statements reflect all wholly owned subsidiaries and those entities we are required to consolidate. See the “Joint Venture and Consortium Arrangements” section of this footnote for further discussion of our consolidation policy for those entities that are not wholly owned. In the opinion of our management, all adjustments, consisting only of normal recurring adjustments, considered necessary for a fair presentation have been included. Intercompany balances and transactions are eliminated in consolidation. Values presented within tables (excluding per share data) are in millions and may not sum due to rounding.
Reclassifications
Beginning in the second quarter of 2018, we made certain classification changes, as well as reclassifications to our historical financial statements to align with our current presentation as follows:
|
|
• |
Bidding and Proposal Costs—In conjunction with the Combination, we realigned our commercial personnel within the operating groups for the combined company. As a result of the realignment, beginning in the second quarter of 2018, we included our bid and proposal costs in Cost of operations in our Condensed Consolidated Statements of Operations (the “Statements of Operations”) to better represent how those costs are managed and controlled. For periods reported prior to the second quarter of 2018, bid and proposal costs are included in Selling, general and administrative (“SG&A”) expenses. Our Cost of operations for the three and nine months ended September 30, 2018 includes $20 million and $37 million of bid and proposal costs, respectively. Our SG&A expense for the nine months ended September 30, 2018 includes bid and proposal costs of $10 million incurred in the first quarter of 2018, and the three and nine months ended September 30, 2017 includes bid and proposal costs of $10 million and $26 million, respectively. |
|
|
7 |
|
NOTES TO THE CONDENSED CONSOLIDATED FINANCIAL STATEMENTS (UNAUDITED)
|
|
• |
Reverse Common Stock Split—We amended our Amended and Restated Articles of Incorporation during the second quarter of 2018 to effect a three-to-one reverse stock split of McDermott common stock, effective May 9, 2018. Common stock, capital in excess of par, share and per share (except par value per share, which was not affected) information for all periods presented has been recast in the Financial Statements and the accompanying Notes to reflect the reverse stock split. |
|
|
• |
Pension and Postretirement Benefit Costs—In conjunction with our adoption of Accounting Standards Update (“ASU”) 2017-07, we reclassified non-service costs relating to our pension and postretirement plans from SG&A to Other non-operating income (expense) for all historical periods presented. The reclassification did not result in a material impact. |
|
|
• |
Deferred Income Tax and Other Tax Liabilities—We reclassified Deferred income taxes, Income taxes payable and other tax balances in our December 31, 2017 Balance Sheet to conform to our current presentation. The reclassifications did not result in a material impact. |
|
|
• |
Lease Obligations—Long-term capital lease obligations were reclassified from Long-term debt in our December 31, 2017 Balance Sheet to conform to our current presentation. The reclassification did not result in a material impact. |
Use of Estimates and Judgments
The preparation of financial statements in conformity with U.S. GAAP requires us to make estimates and judgments that affect the reported amounts of assets, liabilities, revenue and expenses and related disclosures of contingent assets and liabilities. We believe the most significant estimates and judgments are associated with:
|
|
• |
revenue recognition for our contracts, including estimating costs to complete each contract and the recognition of incentive fees and unapproved change orders and claims; |
|
|
• |
determination of fair value with respect to acquired assets and liabilities; |
|
|
• |
fair value and recoverability assessments that must be periodically performed with respect to long-lived tangible assets, goodwill and other intangible assets; |
|
|
• |
valuation of deferred tax assets and financial instruments; |
|
|
• |
the determination of liabilities related to self-insurance programs and income taxes; and |
|
|
• |
consolidation determinations with respect to our joint venture and consortium arrangements. If the underlying estimates and assumptions upon which the Financial Statements are based change in the future, actual amounts may differ from those included in the Financial Statements. |
Significant Accounting Policies
Revenue Recognition—Our revenue is primarily derived from long-term contracts with customers, and we determine the appropriate accounting treatment for each contract at inception in accordance with ASU 2014-09 (Accounting Standards Codification (“ASC”) Topic 606), Revenue from Contracts with Customers. Our contracts primarily relate to: EPCI services; engineering services; construction services; pipe and steel fabrication services; engineered and manufactured products; technology licensing; and catalyst supply. An EPCI contract may also include technology licensing, and our services may be provided between or among our reportable segments.
|
|
8 |
|
NOTES TO THE CONDENSED CONSOLIDATED FINANCIAL STATEMENTS (UNAUDITED)
|
|
• |
Performance Obligations—A performance obligation is a promise in a contract to transfer a distinct good or service to a customer and is the unit of account in ASC Topic 606. The transaction price of a contract is allocated to each distinct performance obligation and recognized as revenue when, or as, the performance obligation is satisfied. Our contract costs and related revenues are generally recognized over time as work progresses due to continuous transfer to the customer. To the extent a contract is deemed to have multiple performance obligations, we allocate the transaction price of the contract to each performance obligation using our best estimate of the standalone selling price of each distinct good or service in the contract. In addition, certain contracts may be combined and deemed to be a single performance obligation. Our EPCI contracts are generally deemed to be single performance obligations and our contracts with multiple performance obligations were not material as of September 30, 2018. |
|
|
• |
Performance Obligations Satisfied Over Time—Revenues for our contracts that satisfy the criteria for over time recognition are recognized as the work progresses. Revenues for contracts recognized over time include revenues for contracts to provide: EPCI services; engineering services; construction services; pipe and steel fabrication services; engineered and manufactured products; technology licensing; and “non-generic” catalyst supply. We measure transfer of control utilizing an input method to measure progress of the performance obligation based upon the cost-to-cost measure of progress, with Cost of operations including direct costs, such as materials and labor, and indirect costs that are attributable to contract activity. Under the cost-to-cost approach, the use of estimated costs to complete each performance obligation is a significant variable in the process of determining recognized revenues and is a significant factor in the accounting for such performance obligations. Significant estimates impacting the cost to complete each performance obligation are: costs of engineering, materials, components, equipment, labor and subcontracts; vessel costs; labor productivity; schedule durations, including subcontractor or supplier progress; contract disputes, including claims; achievement of contractual performance requirements; and contingency, among others. The cumulative impact of revisions in total cost estimates during the progress of work is reflected in the period in which these changes become known, including, to the extent required, the reversal of profit recognized in prior periods and the recognition of losses expected to be incurred on contracts in progress. Additionally, external factors such as weather, customer requirements and other factors outside of our control, may affect the progress and estimated cost of a project’s completion and, therefore, the timing and amount of recognition of revenues and income. Due to the various estimates inherent in our contract accounting, actual results could differ from those estimates, which could result in material changes to our financial statements and related disclosures. See Note 4, Revenue Recognition, for further discussion. |
|
|
• |
Performance Obligation Satisfied at a Point-in-Time Method—Contracts with performance obligations that do not meet the criteria to be recognized over time are required to be recognized at a point-in-time, whereby revenues and gross profit are recognized only when a performance obligation is complete and a customer has obtained control of a promised asset. Revenues for contracts recognized at a point in time include our “generic” catalyst supply and certain manufactured products (which are recognized upon shipment) and certain non-engineering and non-construction oriented services (which are recognized when the services are performed). In determining when a performance obligation is complete for contracts with revenues recognized at a point-in-time, we measure transfer of control considering physical possession of the asset, legal transfer of title, significant risks and rewards of ownership, customer acceptance and our rights to payment. See Note 4, Revenue Recognition, for further discussion. |
|
|
9 |
|
NOTES TO THE CONDENSED CONSOLIDATED FINANCIAL STATEMENTS (UNAUDITED)
|
|
• |
Variable Consideration―Transaction prices for our contracts may include variable consideration, which includes increases to transaction prices for approved and unapproved change orders, claims, incentives and bonuses, and reductions to transaction price for liquidated damages or penalties. Change orders, claims and incentives are generally not distinct from the existing contracts due to the significant integration service provided in the context of the contract and are accounted for as a modification of the existing contract and performance obligation. We estimate variable consideration for a performance obligation at the most likely amount to which we expect to be entitled (or the most likely amount we expect to incur in the case of liquidated damages), utilizing estimation methods that best predict the amount of consideration to which we will be entitled (or will be incurred in the case of liquidated damages). We include variable consideration in the estimated transaction price to the extent it is probable that a significant reversal of cumulative revenues recognized will not occur or when the uncertainty associated with the variable consideration is resolved. Our estimates of variable consideration and determinations of whether to include estimated amounts in transaction prices are based largely on assessments of our anticipated performance and all information (historical, current and forecasted) reasonably available to us. The effect of variable consideration on the transaction price of a performance obligation is recognized as an adjustment to revenues on a cumulative catch-up basis. To the extent unapproved change orders and claims reflected in transaction price (or excluded from transaction price in the case of liquidated damages) are not resolved in our favor, or to the extent incentives reflected in transaction price are not earned, there could be reductions in, or reversals of, previously recognized revenue. See Note 4, Revenue Recognition, for further discussion. |
|
|
• |
Loss Recognition―A risk associated with our contracts is that revenues from customers may not cover increases in our costs. It is possible that current estimates could materially change for various reasons. For all contracts, if a current estimate of total contract cost indicates a loss, the projected loss is recognized in full immediately and reflected in Cost of operations in the Statements of Operations. It is possible that these estimates could change due to unforeseen events, which could result in adjustments to overall contract revenues and costs. Variations from estimated contract performance could result in material adjustments to operating results for any fiscal quarter or year. In our Condensed Consolidated Balance Sheets (“Balance Sheets”), accruals of provisions for estimated losses on all active uncompleted projects are included in Advance billings on contracts. See Note 4, Revenue Recognition, for further discussion. |
|
|
• |
Accounts Receivable and Contract Balances―The timing of when we bill our customers is generally dependent upon advance billing terms, milestone billings based on the completion of certain phases of the work, or when the services are provided or products are shipped. |
|
|
• |
Accounts Receivable―Any uncollected billed amounts for our performance obligations recognized over time, including contract retainages to be collected within one year, are recorded within Accounts receivable-trade, net. Any uncollected billed amounts and unbilled receivables for our performance obligations recognized at a point in time are also recorded within Accounts receivable-trade, net. Contract retainages to be collected beyond one year are recorded within Accounts receivable-long-term retainages. We establish allowances for doubtful accounts based on our assessments of collectability. See Note 7, Accounts Receivable, for further discussion. |
|
|
• |
Contracts in Progress—Projects with performance obligations recognized over time that have revenues recognized to date in excess of cumulative billings are reported within Contracts in progress on our Balance Sheets. We expect to invoice customers for all unbilled revenues, and our payment terms are generally for less than 12 months upon billing. Our contracts typically do not include a significant financing component. See Note 8, Contracts in Progress and Advances Billings on Contracts, for further discussion. |
|
|
• |
Advance Billings on Contracts—Projects with performance obligations recognized over time that have cumulative billings in excess of revenues are reported within Advance billings on contracts on our Balance Sheets. Our Advance billings on contracts balance also includes our accruals of provisions for estimated losses on all active projects. See Note 8, Contracts in Progress and Advances Billings on Contracts, for further discussion. |
|
|
10 |
|
NOTES TO THE CONDENSED CONSOLIDATED FINANCIAL STATEMENTS (UNAUDITED)
Bidding and Proposal Costs―Bidding and proposal costs are generally charged to Cost of operations as incurred, but in certain cases their recognition may be deferred if specific probability criteria are met. We had no significant deferred bidding and proposal costs at September 30, 2018.
Goodwill— Goodwill represents the excess of the purchase price over the fair value of net assets acquired in connection with the Combination. Goodwill is not amortized, but instead is reviewed for impairment at least annually at a reporting unit level, absent any interim indicators of impairment. Interim testing for impairment is performed if indicators of potential impairment exist. There were no indicators of goodwill impairment identified during the three months ended September 30, 2018. However, recent declines in our market capitalization subsequent to September 30, 2018, if sustained, could indicate a risk of impairment to our goodwill, and such impairments could be material to our financial results. We will perform our annual impairment assessment during the fourth quarter of each year. We identify a potential impairment by comparing the fair value of the applicable reporting unit to its net book value, including goodwill. If the net book value exceeds the fair value of the reporting unit, we measure the impairment by comparing the carrying value of the reporting unit to its fair value.
To determine the fair value of our reporting units and test for impairment, we utilize an income approach (discounted cash flow method) as we believe this is the most direct approach to incorporate the specific economic attributes and risk profiles of our reporting units into our valuation model. We generally do not utilize a market approach, given the lack of relevant information generated by market transactions involving comparable businesses. However, to the extent market indicators of fair value become available, we consider such market indicators in our discounted cash flow analysis and determination of fair value. See Note 3, Business Combination, for further discussion.
Intangible and Other Long-Lived Assets—Our finite-lived intangible assets resulted from the Combination and are amortized over their estimated remaining useful economic lives. Our project-related intangible assets are amortized as the applicable projects progress, customer relationships are amortized utilizing an accelerated method based on the pattern of cash flows expected to be realized, taking into consideration expected revenues and customer attrition, and our other intangibles are amortized utilizing a straight-line method. We review tangible assets and finite-lived intangible assets for impairment whenever events or changes in circumstances indicate the carrying value of the asset may not be recoverable. If a recoverability assessment is required, the estimated future cash flow associated with the asset or asset group will be compared to their respective carrying amounts to determine if an impairment exists. See Note 3, Business Combination, and Note 9, Intangible Assets, for further discussion.
Income Taxes—Deferred tax assets and liabilities are recognized for the future tax consequences attributable to differences between the financial statement carrying amounts of existing assets and liabilities and their respective tax bases using currently enacted income tax rates for the years in which the differences are expected to reverse. We provide for income taxes based on the tax laws and rates in the countries in which we conduct our operations. McDermott International, Inc. is a Panamanian corporation that earns all of its income outside of Panama. As a result, we are not subject to income tax in Panama. We operate in numerous taxing jurisdictions around the world. Each of these jurisdictions has a regime of taxation that varies, not only with respect to statutory rates, but also with respect to the basis on which these rates are applied. These variations, along with changes in our mix of income or loss from these jurisdictions, may contribute to shifts, sometimes significant, in our effective tax rate.
A valuation allowance (“VA”) is provided to offset any net deferred tax assets (“DTAs”) if, based on the available evidence, it is more likely than not that some or all of the DTAs will not be realized. The realization of our net DTAs depends upon our ability to generate sufficient future taxable income of the appropriate character and in the appropriate jurisdictions.
On a periodic and ongoing basis, we evaluate our DTAs (including our net operating loss (“NOL”) DTAs) and assess the appropriateness of our VAs. In assessing the need for a VA, we consider both positive and negative evidence related to the likelihood of realization of the DTAs. If, based on the weight of available evidence, our assessment indicates it is more likely than not a DTA will not be realized, we record a VA. Our assessments include, among other things, the amount of taxable temporary differences which will result in future taxable income, the value and quality of our RPOs, evaluations of existing and anticipated market conditions, analysis of recent and historical operating results (including cumulative losses over multiple periods) and projections of future results, strategic plans and alternatives for associated operations, as well as asset expiration dates, where applicable. At September 30, 2018 and December 31, 2017, we had VAs against certain U.S. and non-U.S. DTAs, as we do not believe it is more likely than not that we will utilize those DTAs. See the July 31 Form 8-K for further discussion of our VA assessments.
|
|
11 |
|
NOTES TO THE CONDENSED CONSOLIDATED FINANCIAL STATEMENTS (UNAUDITED)
If the factors upon which we based our assessment of realizability of our DTAs differ materially from our expectations, including future operating results being lower than our current estimates, our future assessments could be impacted and result in an increase in VAs and increase in tax expense.
Income tax and associated interest and penalty reserves, where applicable, are recorded in those instances where we consider it more likely than not that additional tax will be due in excess of amounts reflected in income tax returns filed worldwide, irrespective of whether we have received tax assessments. We continually review our exposure to additional income tax obligations and, as further information becomes known or events occur, changes in our tax, interest and penalty reserves may be recorded within income tax expense. See Note 18, Income Taxes, for further discussion.
Foreign Currency—The nature of our business activities involves the management of various financial and market risks, including those related to changes in foreign currency exchange rates. The effects of translating financial statements of foreign operations into our reporting currency are recognized as a cumulative translation adjustment in accumulated other comprehensive income (loss) (“AOCI”), which is net of tax, where applicable.
Derivative Financial Instruments—We utilize derivative financial instruments in certain circumstances to mitigate the effects of changes in foreign currency exchange rates and interest rates, as described below.
|
|
• |
Foreign Currency Rate Derivatives—We do not engage in currency speculation; however, we utilize foreign currency exchange rate derivatives on an ongoing basis to hedge against certain foreign currency related operating exposures. We generally seek hedge accounting treatment for contracts used to hedge operating exposures and designate them as cash flow hedges. Therefore, gains and losses, exclusive of credit risk and forward points (which represent the time value component of the fair value of our derivative positions), are included in AOCI until the associated underlying operating exposure impacts our earnings. Changes in the fair value of (i) credit risk and forward points, (ii) instruments deemed ineffective during the period, and (iii) instruments that we do not designate as cash flow hedges, are recognized within Other non-operating income (expense). |
|
|
• |
Interest Rate Derivatives—Our interest rate derivatives are limited to a swap arrangement entered into on May 8, 2018, to hedge against interest rate variability associated with $1.94 billion of our $2.26 billion “Term Facility” described in Note 12, Debt. The swap arrangement has been designated as a cash flow hedge as its critical terms matched those of the Term Facility at inception and through September 30, 2018. Accordingly, changes in the fair value of the swap arrangement are included in AOCI until the associated underlying exposure impacts our interest expense. |
See Note 16, Fair Value Measurements, and Note 17, Derivative Financial Instruments, for further discussion.
Joint Venture and Consortium Arrangements—In the ordinary course of business, we execute specific projects and conduct certain operations through joint venture, consortium and other collaborative arrangements (referred to as “joint ventures” and “consortiums”). We have various ownership interests in these joint ventures and consortiums, with such ownership typically proportionate to our decision making and distribution rights. The joint ventures and consortiums generally contract directly with their third-party customers; however, services may be performed directly by the joint ventures and consortium, us, our co-venturers, or a combination thereof.
Joint ventures and consortium net assets consist primarily of working capital and property and equipment, and assets may be restricted from use for obligations outside of the joint venture or consortiums. These joint ventures and consortiums typically have limited third-party debt or have debt that is non-recourse in nature. They may provide for capital calls to fund operations or require participants in the joint venture or consortiums to provide additional financial support, including advance payment or retention letters of credit.
Each joint venture or consortium is assessed at inception and on an ongoing basis as to whether it qualifies as a Variable Interest Entity (“VIE”) under the consolidations guidance in ASC Topic 810, Consolidations. A venture generally qualifies as a VIE when it (i) meets the definition of a legal entity, (ii) absorbs the operational risk of the projects being executed, creating a variable interest, and (iii) lacks sufficient capital investment from the co-venturers, potentially resulting in the joint venture or consortium requiring additional subordinated financial support to finance its future activities.
If at any time a joint venture or consortium qualifies as a VIE, we perform a qualitative assessment to determine whether we are the primary beneficiary of the VIE and therefore need to consolidate the VIE. We are the primary beneficiary if we have (i) the power to direct the economically significant activities of the VIE and (ii) the right to receive benefits from and obligation to absorb losses of the
|
|
12 |
|
NOTES TO THE CONDENSED CONSOLIDATED FINANCIAL STATEMENTS (UNAUDITED)
VIE. If the joint venture or consortium is a VIE and we are the primary beneficiary, or we otherwise have the ability to control the joint venture or consortium, it is consolidated. If we determine we are not the primary beneficiary of the VIE or only have the ability to significantly influence, rather than control the joint venture or consortium, it is not consolidated.
We account for unconsolidated joint ventures and consortium arrangements using either (i) proportionate consolidation for both the Balance Sheet and Statement of Operations when we meet the applicable accounting criteria to do so, or (ii) utilize the equity method. For incorporated unconsolidated joint ventures and consortiums where we utilize the equity method of accounting, we record our share of the profit or loss of the investments, net of income taxes, in the Statements of Operations. We evaluate our equity method investments for impairment when events or changes in circumstances indicate the carrying value of such investments may have experienced an other-than-temporary decline in value. When evidence of loss in value has occurred, we compare the estimated fair value of our investment to the carrying value of our investment to determine whether an impairment has occurred. If the estimated fair value is less than the carrying value and we consider the decline in value to be other-than-temporary, the excess of the carrying value over the estimated fair value is recognized in the Financial Statements as an impairment. See Note 10, Joint Venture and Consortium Arrangements, for further discussion.
Transaction Costs—Transaction costs primarily related to professional service fees (including audit, legal and advisory services) associated with the Combination. See Note 3, Business Combination, for further discussion.
Restructuring and Integration Costs—Restructuring and integration costs primarily relate to costs to achieve our combination profitability initiative (“CPI”). See Note 11, Restructuring and Integration Costs, for further discussion.
See Note 2, Basis of Presentation and Significant Accounting Policies, included in the July 31 Form 8-K, for additional information relating to our accounting policies.
Recently Adopted Accounting Guidance
Revenue from Contracts with Customers (ASC Topic 606)—In May 2014, the Financial Accounting Standards Board (the “FASB”) issued a new standard related to revenue recognition which supersedes most of the existing revenue recognition requirements in U.S. GAAP and requires entities to recognize revenue at an amount that reflects the consideration to which an entity expects to be entitled in exchange for transferring goods or services to a customer. It also requires significantly expanded disclosures regarding the qualitative and quantitative information of an entity’s nature, amount, timing and uncertainty of revenue and cash flows arising from contracts with customers.
The FASB has issued several amendments to the standard, including clarification on accounting for licenses of intellectual property, identifying performance obligations, reporting gross versus net revenue and narrow-scope revisions and practical expedients.
We adopted the new standard on January 1, 2018 (the “initial application” date):
|
|
• |
using the modified retrospective application, with no restatement of the comparative periods presented and a cumulative effect adjustment to retained earnings as of the date of adoption; |
|
|
• |
applying the new standard only to those contracts that are not substantially complete at the date of initial application; and |
|
|
• |
disclosing the impact of the new standard in our 2018 Financial Statements. |
Significant changes to our accounting policies as a result of adopting of the new standard are discussed below:
|
|
• |
We measure transfer of control utilizing an input method to measure progress for individual contracts or combinations of contracts based on the total costs incurred as applicable to each contract. Previously, under ASC Topic 605-35, Construction-Type and Production-Type Contracts, we generally excluded certain costs from the cost-to-cost method of measuring progress toward completion, such as significant costs for procured materials and third-party subcontractors. |
|
|
• |
Our Balance Sheets will no longer reflect assets related to cost incurred in excess of cost recognized due to the inclusion of all costs incurred in our results and associated measurement of progress toward completion under our current policy. |
|
|
• |
Variable consideration, including change orders, claims, bonus, incentive fees and liquidated damages or penalties are now included in the estimated contract revenue at the most likely amount to which we expect to be entitled. We include variable consideration in the estimated transaction price to the extent we conclude that it is probable a significant revenue reversal will not occur or when the uncertainty associated with the variable consideration is resolved. |
|
|
13 |
|
NOTES TO THE CONDENSED CONSOLIDATED FINANCIAL STATEMENTS (UNAUDITED)
For accounting policies and disclosures related to our adoption of ASC 606, see our significant accounting policies within this note, Note 4, Revenue Recognition, and Note 8, Contracts in Progress and Advance Billing on Contracts.
Pension and Postretirement Benefits—In March 2017, the FASB issued ASU 2017-07, Compensation—Retirement Benefits (Topic 715): Improving the Presentation of Net Periodic Pension Cost and Net Periodic Postretirement Benefit. This ASU requires bifurcation of certain components of net pension and postretirement benefit cost in the Statements of Operations. We adopted this ASU effective as of January 1, 2018. As a result, benefit costs, excluding any service cost component, previously included in SG&A, are now included in other non-operating income (expense), net in our Statements of Operations. All comparable periods presented have been retrospectively revised to reflect this change. See Note 14, Pension and Postretirement for further discussion.
Income Taxes—In October 2016, the FASB issued ASU 2016-16, Income Taxes (Topic 740): Intra-Entity Transfers of Assets Other Than Inventory. This ASU requires entities to recognize the income tax consequences of an intra-entity transfer of an asset other than inventory when the transfer occurs. This ASU is effective for interim and annual periods beginning after December 15, 2017. We adopted ASU 2016-16 during the first quarter of 2018. Our results for the nine months ended September 30, 2018, were impacted by an income tax benefit of $117 million recorded during the second quarter resulting from an intra-entity transfer of assets. See Note 18, Income Taxes, for further discussion.
In December 2017, the SEC issued Staff Accounting Bulletin (“SAB”) 118 to address the application of U.S. GAAP in situations in which a registrant does not have the necessary information available, prepared or analyzed (including computations) in reasonable detail to complete the accounting for certain income tax effects of the U.S. Tax Cuts and Jobs Act (the “Tax Reform Act”), signed into law on December 22, 2017. In March 2018, the FASB issued ASU 2018-05, which amended ASC 740 to incorporate the requirements of SAB 118. We recognized the provisional tax impacts of the Tax Reform Act in the fourth quarter of 2017. During the three and nine months ended September 30, 2018, there were no material adjustments to these provisional calculations.
Goodwill—In January 2017, the FASB issued ASU 2017-04, Intangibles-Goodwill and Other (Topic 350): Simplifying the Test for Goodwill Impairment. This ASU eliminates the second step of the goodwill impairment test that required a hypothetical purchase price allocation. The ASU requires that, if a reporting unit’s carrying value exceeds its fair value, an impairment charge would be recognized for the excess amount, not to exceed the carrying amount of goodwill. We early adopted this ASU during the second quarter 2018. Our adoption of the standard did not have a material impact on the Financial Statements.
Accounting Guidance Issued But Not Adopted as of September 30, 2018
Financial Instruments—In June 2016, the FASB issued ASU 2016-13, Financial Instruments—Credit Losses (Topic 326): Measurement of Credit Losses on Financial Instruments. This ASU will require a financial asset measured at amortized cost basis to be presented at the net amount expected to be collected. A valuation account, allowance for credit losses, will be deducted from the amortized cost basis of the financial asset to present the net carrying value at the amount expected to be collected on the financial asset. This ASU is effective for interim and annual periods beginning after December 15, 2019. We are currently assessing the impact of this ASU on our future consolidated financial statements and related disclosures.
Leases—In February 2016, the FASB issued ASU 2016-02, Leases (Topic 842). This ASU will require entities that lease assets—referred to as “lessees”—to recognize on the balance sheet the assets and liabilities for the rights and obligations created by leases with lease terms of more than 12 months. Consistent with current U.S. GAAP, the recognition, measurement and presentation of expenses and cash flows arising from a lease by a lessee primarily will depend on its classification as a finance or operating lease. However, unlike current U.S. GAAP—which requires only capital leases to be recognized on the balance sheet—the new ASU will require both types of leases to be recognized on the balance sheet. This ASU is effective for interim and annual periods beginning after December 15, 2018. We will adopt the new standard on January 1, 2019:
|
|
• |
using the modified retrospective application, with no restatement of the comparative periods presented and a cumulative effect adjustment to retained earnings as of the date of adoption; and |
|
|
• |
applying the new standard to leases in place as of the adoption date. |
We are continuing to assess the impact our adoption will have on our future consolidated financial statements and related disclosures, which could be material.
|
|
14 |
|
NOTES TO THE CONDENSED CONSOLIDATED FINANCIAL STATEMENTS (UNAUDITED)
Income Taxes—In January 2018, the FASB issued ASU 2018-02, Reporting Comprehensive Income (Topic 220). This ASU gives entities the option to reclassify to retained earnings the tax effects resulting from the Tax Reform Act related to items in AOCI that the FASB refers to as having been stranded in AOCI. This ASU may be applied retrospectively to each period in the year of adoption. This ASU will also require new disclosures regarding our accounting policy for releasing the tax effects in AOCI. This ASU is effective for us in the first quarter of 2019, although early adoption is permitted. We are assessing the timing of adoption of this ASU and its potential impact on our future consolidated financial statements and related disclosures.
Derivatives—In August 2017, the FASB issued ASU No. 2017-12, Derivatives and Hedging (Topic 815). This ASU includes financial reporting improvements related to hedging relationships to better report the economic results of an entity’s risk management activities in its financial statements. Additionally, this ASU makes certain improvements to simplify the application of the hedge accounting guidance. This ASU becomes effective for fiscal years beginning after December 15, 2018, with early adoption permitted. We are currently evaluating the impact of this ASU on our future consolidated financial statements and related disclosures.
Defined Benefit Pension Plans—In August 2018, the FASB issued ASU No. 2018-14, Compensation—Retirement Benefits—Defined Benefit Plans—General (Subtopic 715-20). This ASU eliminates, modifies and adds disclosure requirements for employers that sponsor defined benefit pension or other postretirement plans. This ASU is effective for fiscal years ending after December 15, 2020, with early adoption permitted. We are evaluating the impact of the new guidance on our future disclosures.
Cloud Computing Arrangements—In August 2018, the FASB issued ASU No. 2018-15, Intangibles—Goodwill and Other—Internal-Use Software (Subtopic 350-40). The ASU provides for the recognition of an intangible asset for the costs of internal-use software licenses included in a cloud computing arrangement. Costs of arrangements that do not include a software license should be accounted for as a service contract and expensed as incurred. This ASU is effective for fiscal years beginning after December 15, 2019, with early adoption permitted. The ASU permits two methods of adoption: prospectively to all implementation costs incurred after the date of adoption, or retrospectively to each prior reporting period presented. We are assessing the timing of adoption of this ASU and its potential impact on our future consolidated financial statements and related disclosures.
General―On December 18, 2017, we entered into an agreement (as amended, the “Business Combination Agreement”) to combine our business with CB&I, an established downstream provider of industry-leading petrochemical, refining, power, gasification and gas processing technologies and solutions. On May 10, 2018 (the “Combination Date”) we completed the Combination.
Transaction Overview―On the Combination Date, we acquired the equity of certain U.S. and non-U.S. CB&I subsidiaries that owned CB&I’s technology business, as well as certain intellectual property rights, for $2.87 billion in cash consideration that was funded using debt financing, as discussed further in Note 12, Debt, and existing cash. Also on the Combination Date, CB&I shareholders received 0.82407 shares of McDermott common stock for each share of CB&I common stock tendered in the exchange offer. Each remaining share of CB&I common stock held by CB&I shareholders not acquired by McDermott in the exchange offer was effectively converted into the right to receive the same 0.82407 shares of McDermott common stock that was paid in the exchange offer, together with cash in lieu of any fractional shares of McDermott common stock, less any applicable withholding taxes. Stock-settled equity based awards relating to shares of CB&I’s common stock were either canceled and converted into the right to receive cash or were converted into comparable McDermott awards on generally the same terms and conditions as prior to the Combination Date. We issued 84.5 million shares of McDermott common stock to the former CB&I shareholders and converted CB&I stock-settled equity awards into McDermott stock-settled equity-based awards to be settled in approximately 2.2 million shares of McDermott common stock.
Transaction Accounting―The Combination is accounted for using the acquisition method of accounting in accordance with ASC Topic 805, Business Combinations. McDermott is considered the acquirer for accounting purposes based on the following facts at the Combination Date: (i) McDermott’s stockholders owned approximately 53 percent of the combined business on a fully diluted basis; (ii) a group of McDermott’s directors, including the Chairman of the Board, constituted a majority of the Board of Directors; and (iii) McDermott’s President and Chief Executive Officer and Executive Vice President and Chief Financial Officer continue in those roles. The series of transactions resulting in McDermott’s acquisition of CB&I’s entire business is being accounted for as a single accounting transaction, as such transactions were entered into at the same time in contemplation of one another and were collectively designed to achieve an overall commercial effect.
|
|
15 |
|
NOTES TO THE CONDENSED CONSOLIDATED FINANCIAL STATEMENTS (UNAUDITED)
Purchase Consideration―We completed the Combination for a gross purchase price of approximately $4.6 billion ($4.1 billion net of cash acquired), detailed as follows (in millions, except per share amounts):
|
|
|
|
(In millions, except per share amounts) |
|
CB&I shares for Combination consideration |
|
|
103 |
|
Conversion Ratio: 1 CB&I share = 0.82407 McDermott shares |
|
|
85 |
|
McDermott stock price on May 10, 2018 |
|
|
19.92 |
|
Equity Combination consideration transferred |
|
$ |
1,684 |
|
Fair value of converted awards earned prior to the Combination |
|
|
9 |
|
Total equity Combination consideration transferred |
|
|
1,693 |
|
Cash consideration transferred |
|
|
2,872 |
|
Total Combination consideration transferred |
|
|
4,565 |
|
Less: Cash acquired |
|
|
(498) |
|
Total Combination consideration transferred, net of cash acquired |
|
$ |
4,067 |
Preliminary Purchase Price Allocation—The aggregate purchase price noted above was allocated to the major categories of assets and liabilities acquired based upon their estimated fair values at the Combination Date, which were based, in part, upon outside preliminary appraisal and valuation of certain assets, including specifically identified intangible assets and property and equipment. The excess of the purchase price over the preliminary estimated fair value of the net tangible and identifiable intangible assets acquired totaling $4.7 billion, was recorded as goodwill.
|
|
16 |
|
NOTES TO THE CONDENSED CONSOLIDATED FINANCIAL STATEMENTS (UNAUDITED)
The following summarizes our preliminary purchase price allocation at the Combination Date (in millions):
|
|
|
May 10, 2018 |
|
|
|
Net tangible assets: |
|
|
|
|
|
Cash |
|
$ |
498 |
|
|
Accounts receivable |
|
|
879 |
|
|
Inventory |
|
|
62 |
|
|
Contracts in progress |
|
|
341 |
|
|
Assets held for sale (1) |
|
|
71 |
|
|
Other current assets |
|
|
240 |
|
|
Deferred tax assets |
|
|
45 |
|
|
Investments in unconsolidated affiliates (2) |
|
|
433 |
|
|
Property, plant and equipment |
|
|
405 |
|
|
Other non-current assets |
|
|
145 |
|
|
Accounts payable |
|
|
(472 |
) |
|
Advance billings on contracts (3) |
|
|
(2,278 |
) |
|
Deferred tax liabilities |
|
|
(17 |
) |
|
Other current liabilities |
|
|
(1,200 |
) |
|
Other non-current liabilities |
|
|
(452 |
) |
|
Noncontrolling interest |
|
|
(26 |
) |
|
Total net tangible assets |
|
|
(1,326 |
) |
|
Project related intangible assets/liabilities, net (4) |
|
|
142 |
|
|
Other intangible assets (5) |
|
|
1,041 |
|
|
Net identifiable assets |
|
|
(143 |
) |
|
Goodwill (6) |
|
|
4,708 |
|
|
Total Combination consideration transferred |
|
|
4,565 |
|
|
Less: Cash acquired |
|
|
(498 |
) |
|
Total Combination consideration transferred, net of cash acquired |
|
$ |
4,067 |
|
|
(1) |
Assets held for sale includes CB&I’s former administrative headquarters within Corporate and various fabrication facilities within NCSA. During the third quarter of 2018, we completed the sale of CB&I’s former administrative headquarters for proceeds of $52 million. |
|
(2) |
Investments in unconsolidated affiliates includes a fair value adjustment of $221 million associated with the Combination. Approximately $118 million of the fair value adjustment is attributable to the basis difference between McDermott’s investment and the underlying equity in identifiable assets of unconsolidated affiliates, and will be amortized to Investment in unconsolidated affiliate related amortization over a range of two to 30 years based on the life of assets to which the basis difference is attributed. |
|
(3) |
Advance billings on contracts includes accrued provisions for estimated losses on projects of $349 million. See the discussions below and in Note 4, Revenue Recognition, for information concerning our acquired significant loss projects, including changes since our initial preliminary estimates reported for the second quarter of 2018. |
|
(4) |
Project related intangible assets/liabilities, net includes intangible asset and liabilities of $239 million and $97 million, respectively. The balances represent the fair value of acquired RPOs and normalized profit margin fair value associated with acquired long-term contracts that were deemed to be lower than fair value (excluding amounts recorded in Advance billings on contracts and Contracts in progress) as of the Combination Date. The project related intangible assets and liabilities will be amortized as the applicable projects progress over a range of two to six years within Project intangibles amortization in our Statements of Operations. |
|
|
17 |
|
NOTES TO THE CONDENSED CONSOLIDATED FINANCIAL STATEMENTS (UNAUDITED)
|
|
|
May 10, 2018 |
|
|
|
|
|
|
|
|
|
|
|
Fair value |
|
|
Useful Life Range |
|
Weighted Average Life |
|
||
|
|
|
(In millions) |
|
|
|
|
|
|
|
|
|
Process technologies |
|
$ |
498 |
|
|
10-30 |
|
|
27 |
|
|
Trade names |
|
|
401 |
|
|
10-20 |
|
|
12 |
|
|
Customer relationships |
|
|
115 |
|
|
4-11 |
|
|
10 |
|
|
Trademarks |
|
|
27 |
|
|
10 |
|
|
10 |
|
|
Total |
|
$ |
1,041 |
|
|
|
|
|
|
|
|
(6) |
Goodwill resulted from the acquired established workforce, which does not qualify for separate recognition, as well as expected future cost savings and revenue synergies associated with the combined operations. Of the $4.7 billion of estimated goodwill recorded in conjunction with the Combination, $1.7 billion is deductible for tax purposes. Given the proximity of the Combination Date to the reporting date of September 30, 2018, the allocation of goodwill for each of our operating groups is in process, and therefore has not been presented. |
Significant changes in our preliminary purchase price allocation since our initial estimates reported in the second quarter of 2018 primarily related to fair value adjustments to three of our acquired loss contracts. Adjustments to the Cameron LNG, Freeport LNG and Calpine projects were approximately $744 million combined and primarily impacted Advance billings on contracts as discussed further in Note 4, Revenue Recognition. As a result of these and other adjustments to the initial purchase price allocation, goodwill increased by approximately $782 million since the second quarter of 2018. Adjustments recorded to the purchase price allocation are recognized in the period in which the adjustments are determined and calculated as if the accounting had been completed as of the Combination Date.
The purchase price allocation described above is subject to further change when additional information is obtained. We have not finalized our assessment of the fair values of purchased receivables, intangible assets and liabilities, inventory, property and equipment, joint venture and consortium arrangements, tax balances, contingent liabilities, long-term leases or acquired contracts. Our final purchase price allocation may result in additional adjustments to various other assets and liabilities, including the residual amount allocated to goodwill during the measurement period.
Impact on RPOs—CB&I RPOs totaled approximately $8.3 billion at the Combination Date. We reviewed the RPOs acquired through the Combination to ensure consistency in the application of our policies regarding revenues dependent upon one or more future events, and we made adjustments related to our purchase accounting estimates. As a result, the RPO balance on the Combination Date included the net reduction of approximately $224 million for the acquired RPOs. This adjustment to the opening RPOs was not the result of contract cancellations. Our RPO balance on the Combination Date is also reflective of the project adjustments described above.
Impact of Combination on Statements of Operations—From the Combination Date through September 30, 2018, revenues and operating income associated with CB&I totaled $2.8 billion and $168 million (excluding $61 million of Restructuring and integration costs within operating income), respectively. Additionally, in connection with the Combination, during the three and nine months ended September 30, 2018, we incurred transaction costs of $5 million and $45 million, respectively, which primarily related to professional service fees (including audit, legal and advisory services).
Supplemental Pro Forma Information (Unaudited)—The following unaudited pro forma financial information reflects the Combination and the related events as if they occurred on January 1, 2017 and gives effect to pro forma events that are directly attributable to the Combination, factually supportable, and expected to have a continuing impact on our combined results, following the Combination. The pro forma financial information includes adjustments to: (i) include additional intangibles amortization, investment in unconsolidated affiliates-related amortization and net interest expense associated with the Combination and (ii) exclude restructuring, integration and transaction costs and debt extinguishment costs that were included in McDermott and CB&I’s historical results and are expected to be non-recurring. This pro forma financial information is presented for illustrative purposes only and is not
|
|
18 |
|
NOTES TO THE CONDENSED CONSOLIDATED FINANCIAL STATEMENTS (UNAUDITED)
necessarily indicative of the operating results that would have been achieved had the pro forma events taken place on the dates indicated. Further, the pro forma financial information does not purport to project the future operating results of the combined business operations following the Combination.
|
|
|
Three Months Ended September 30, |
|
Nine Months Ended September 30, |
||||
|
|
|
2018 (1) |
|
2017 |
|
2018 (1) |
|
2017 |
|
|
|
(In millions) |
||||||
|
Pro forma revenue |
|
$2,289 |
|
$2,866 |
|
$7,135 |
|
$7,390 |
|
Pro forma net income (loss) attributable to McDermott |
|
33 |
|
67 |
|
128 |
|
(270) |
|
Pro forma net income (loss) per share attributable to McDermott: |
|
|
|
|
|
|
|
|
|
Basic |
|
0.18 |
|
0.37 |
|
0.71 |
|
(1.50) |
|
Diluted |
|
0.18 |
|
0.37 |
|
0.71 |
|
(1.50) |
|
|
|
|
|
|
|
|
|
|
|
Basic (2) |
|
180 |
|
180 |
|
180 |
|
180 |
|
Diluted |
|
181 |
|
181 |
|
181 |
|
180 |
|
(1) |
Adjustments, net of tax, included in the pro forma net income above that were of a non-recurring nature totaled $28 million and $136 million for the three and nine months ended September 30, 2018, respectively. The adjustments reflect the elimination of restructuring and integration costs ($24 million and $90 million) and transaction costs ($4 million and $35 million) for the three and nine months ended September 30, 2018, respectively, and debt extinguishment costs of $11 million incurred in the first half of 2018, that were included in McDermott and CB&I’s historical results for the three and nine months ended September 30, 2018, respectively. For the comparative three and nine months ended September 30, 2017, adjustments, net of tax, included in the pro forma net income (loss) above that were of a non-recurring nature totaled $17 million and $20 million, respectively, and reflect the elimination of restructuring costs that were included in CB&I’s historical results. These pro forma results exclude the effect of adjustments to the opening balance sheet associated with fair value purchase accounting estimates. |
|
(2) |
Pro forma net income (loss) per share was calculated using weighted average basic and diluted shares outstanding during the three months ended September 30, 2018. The effects of dilutive securities were not included in the calculation of diluted EPS for the nine months ended September 30, 2017 due to the net loss for that period. |
|
|
19 |
|
NOTES TO THE CONDENSED CONSOLIDATED FINANCIAL STATEMENTS (UNAUDITED)
Effect of ASC Topic 606 Adoption
The cumulative effect of adopting ASC 606 due to our change in method of measuring project progress toward completion, as discussed in Note 2, Basis of Presentation and Significant Accounting Policies, is as follows:
|
|
|
Impact of ASC 606 adoption |
|
|||||||||
|
|
|
Recognition under previous guidance |
|
|
Adjustment |
|
|
Recognition under ASC 606 |
|
|||
|
|
|
(In millions) |
|
|||||||||
|
Consolidated Statement of Operations for nine months ended September 30, 2018 |
|
|
|
|
|
|
|
|
|
|
|
|
|
Revenues |
|
$ |
4,873 |
|
|
$ |
(241 |
) |
|
$ |
4,632 |
|
|
Cost of operations |
|
|
4,148 |
|
|
|
(200 |
) |
|
|
3,948 |
|
|
Income tax benefit |
|
|
(18 |
) |
|
|
(1 |
) |
|
|
(19 |
) |
|
Net income |
|
|
124 |
|
|
|
(40 |
) |
|
|
84 |
|
|
|
|
|
|
|
|
|
|
|
|
|
|
|
|
Consolidated Balance Sheet as of September 30, 2018 |
|
|
|
|
|
|
|
|
|
|
|
|
|
Assets |
|
|
|
|
|
|
|
|
|
|
|
|
|
Current assets: |
|
|
|
|
|
|
|
|
|
|
|
|
|
Contracts in progress |
|
|
737 |
|
|
|
(14 |
) |
|
|
723 |
|
|
|
|
|
|
|
|
|
|
|
|
|
|
|
|
Liabilities and equity |
|
|
|
|
|
|
|
|
|
|
|
|
|
Current liabilities: |
|
|
|
|
|
|
|
|
|
|
|
|
|
Advance billings on contracts |
|
|
1,733 |
|
|
|
- |
|
|
|
1,733 |
|
|
Income taxes payable |
|
|
144 |
|
|
|
(1 |
) |
|
|
143 |
|
|
|
|
|
|
|
|
|
|
|
|
|
|
|
|
Stockholders' equity (1) |
|
|
|
|
|
|
|
|
|
|
|
|
|
Retained earnings |
|
|
69 |
|
|
|
(13 |
) |
|
|
56 |
|
|
(1) |
Includes $20 million of cumulative catch-up adjustment to Retained earnings (Accumulated deficit) on January 1, 2018, upon adoption of ASC 606. |
Remaining Performance Obligations (“RPOs”)
Our RPOs by segment were as follows:
|
|
September 30, 2018 |
|
|
December 31, 2017 |
|
||||||||||
|
|
(In approximate millions) |
|
|||||||||||||
|
NCSA |
$ |
6,519 |
|
|
|
57 |
% |
|
$ |
437 |
|
|
|
11 |
% |
|
EARC |
|
1,502 |
|
|
|
13 |
% |
|
|
732 |
|
|
|
19 |
% |
|
MENA |
|
2,164 |
|
|
|
19 |
% |
|
|
2,249 |
|
|
|
58 |
% |
|
APAC |
|
713 |
|
|
|
6 |
% |
|
|
483 |
|
|
|
12 |
% |
|
Technology |
|
614 |
|
|
|
5 |
% |
|
|
- |
|
|
|
- |
|
|
Total |
$ |
11,512 |
|
|
|
100 |
% |
|
$ |
3,901 |
|
|
|
100 |
% |
Of the September 30, 2018 RPOs, we expect to recognize revenues as follows:
|
|
2018 |
|
|
2019 |
|
|
Thereafter |
|
|||
|
|
(In approximate millions) |
|
|||||||||
|
Total RPOs |
$ |
2,288 |
|
|
$ |
6,158 |
|
|
$ |
3,066 |
|
|
|
20 |
|
NOTES TO THE CONDENSED CONSOLIDATED FINANCIAL STATEMENTS (UNAUDITED)
Our revenue by product offering, contract types and revenue recognition methodology was as follows:
|
|
|
Three months ended September 30, (2) |
|
|
Nine months ended September 30, (2) |
|
||||||||||
|
|
|
2018 |
|
|
2017 |
|
|
2018 |
|
|
2017 |
|
||||
|
|
|
(In millions) |
|
|||||||||||||
|
Revenue by product offerings: |
|
|
|
|
|
|
|
|
|
|
|
|
|
|
|
|
|
Offshore and subsea |
|
$ |
548 |
|
|
$ |
959 |
|
|
$ |
1,809 |
|
|
$ |
2,267 |
|
|
LNG |
|
|
553 |
|
|
|
- |
|
|
|
935 |
|
|
|
- |
|
|
Downstream (1) |
|
|
860 |
|
|
|
- |
|
|
|
1,356 |
|
|
|
- |
|
|
Power |
|
|
328 |
|
|
|
- |
|
|
|
532 |
|
|
|
- |
|
|
|
|
$ |
2,289 |
|
|
$ |
959 |
|
|
$ |
4,632 |
|
|
$ |
2,267 |
|
|
|
|
|
|
|
|
|
|
|
|
|
|
|
|
|
|
|
|
Contract types: |
|
|
|
|
|
|
|
|
|
|
|
|
|
|
|
|
|
Fixed priced |
|
$ |
1,797 |
|
|
$ |
947 |
|
|
$ |
3,693 |
|
|
|
2,209 |
|
|
Reimbursable |
|
|
411 |
|
|
|
- |
|
|
|
680 |
|
|
|
- |
|
|
Hybrid |
|
|
10 |
|
|
|
- |
|
|
|
134 |
|
|
|
- |
|
|
Unit-basis and other |
|
|
71 |
|
|
|
12 |
|
|
|
125 |
|
|
|
58 |
|
|
|
|
$ |
2,289 |
|
|
$ |
959 |
|
|
$ |
4,632 |
|
|
$ |
2,267 |
|
|
|
|
|
|
|
|
|
|
|
|
|
|
|
|
|
|
|
|
Revenue recognition methodology |
|
|
|
|
|
|
|
|
|
|
|
|
|
|
|
|
|
Over time |
|
$ |
2,249 |
|
|
$ |
959 |
|
|
$ |
4,564 |
|
|
$ |
2,267 |
|
|
At a point in time |
|
|
40 |
|
|
|
- |
|
|
|
68 |
|
|
|
- |
|
|
|
|
$ |
2,289 |
|
|
$ |
959 |
|
|
$ |
4,632 |
|
|
$ |
2,267 |
|
|
(1) |
Includes the results of our Technology operating group. |
|
(2) |
Intercompany amounts have been eliminated in consolidation. |
Unapproved Change Orders, Claims and Incentives
Unapproved Change Orders, Claims and Incentives—At September 30, 2018 we had unapproved change orders and claims included in transaction prices aggregating to approximately $563 million, of which approximately $153 million were included in our RPO balance. At December 31, 2017, we had unapproved change orders and claims included in transaction prices aggregating to approximately $117 million, of which approximately $8 million were included in our RPO balance.
At September 30, 2018 and December 31, 2017, we did not have any material incentives included in transaction prices for our projects.
The amounts described above recorded in contract prices and recognized as revenues reflect our best estimates of recovery; however, the ultimate resolution and amounts received could differ from these estimates and could have a material adverse effect on our results of operations, financial position and cash flow.
|
|
21 |
|
NOTES TO THE CONDENSED CONSOLIDATED FINANCIAL STATEMENTS (UNAUDITED)
Based on our assessment at September 30, 2018, included in the preliminary purchase price allocation for the Combination (see Note 3, Business Combination) were four projects determined to be in substantial loss positions, which included the Cameron LNG, Freeport LNG Trains 1 & 2, Calpine and the now-completed IPL gas power projects. Based on our assessment at June 30, 2018, our Freeport LNG Trains 1 & 2 project was not estimated to be in a loss position; however, as a result of changes in estimates during the third quarter of 2018, the project is now estimated to be in a loss position at completion. Our Freeport LNG Train 3 project is not anticipated to be in a loss position. Changes since our initial preliminary assessments during the second quarter of 2018 reflect unfavorable changes in estimates of $482 million on the Cameron LNG project, $194 million on the Freeport LNG Trains 1 & 2 and Train 3 projects and $68 million on the Calpine project. These changes in estimates did not have a significant direct impact on our net income for the three or nine months ended September 30, 2018, as the impact of the changes in estimates were included as adjustments to the fair values reflected in the acquired balance sheet.
Our accrual of provisions for estimated losses on active uncompleted contracts at September 30, 2018 was $215 million and primarily related to the Cameron LNG, Freeport LNG Trains 1 & 2 and Calpine loss projects. Our accrual of provisions for estimated losses on active uncompleted contracts at December 31, 2017 was not material.
Summary information for our significant ongoing loss projects as of September 30, 2018 is as follows:
Cameron LNG―At September 30, 2018, our U.S. LNG export facility project in Hackberry, Louisiana for Cameron LNG (within our NCSA operating group) was in a loss position. As of September 30, 2018, the project was approximately 37% complete on a post-Combination basis (approximately 83% on a pre-Combination basis) and had an accrued provision for estimated losses of approximately $127 million.
The increase in our cost estimates recorded as adjustments to the fair value of the acquired balance sheet during the third quarter of 2018 were primarily due to changes in estimates resulting from a detailed reassessment of schedule and underlying cost base. The schedule analysis included a reassessment of the work to go, including re-work for which we may not be fully compensated, and took into account revisions to the estimation of productivity based on historical efforts and the quality and availability of labor resources throughout the revised project schedule. The revised schedule also results in loss of incentive revenue (approximately $40 million) and the application of contractual liquidated damages (approximately $17 million). These changes in estimates were reflected as adjustments to the fair values of various assets and liabilities reflected in the acquired balance sheet, as they resulted from refinements of estimates of conditions that existed as of the Combination Date, and primarily impacted Advance billings on contracts.
Freeport LNG―At September 30, 2018, Trains 1 & 2 of our U.S. LNG export facility project in Freeport, Texas for Freeport LNG (within our NCSA operating group) was in a loss position. As of September 30, 2018, the project was approximately 43% complete on a post-Combination basis (approximately 86% on a pre-Combination basis) and had an accrued provision for estimated losses of approximately $28 million.
The increase in the cost estimates recorded as adjustments to the fair value of the acquired balance sheet during the third quarter of 2018 were primarily due to changes in estimates resulting from a detailed reassessment of schedule and underlying cost base. The schedule analysis included a reassessment of the work to go, including re-work for which we may not be fully compensated, and took into account revisions to the estimation of productivity based on historical efforts and the quality and availability of labor resources throughout the revised project schedule. Our changes in estimates for the project also reflect our decision, reached in conjunction with ongoing customer discussions, to include liquidated damages (approximately $53 million) associated with the pre-Hurricane Harvey schedule. These changes in estimates were reflected as adjustments to the fair values of various assets and liabilities reflected in the acquired balance sheet, as they resulted from refinements of estimates of conditions that existed as of the Combination Date, and primarily impacted Advance billings on contracts.
Calpine Power Project―At September 30, 2018, our U.S. gas turbine power project in the Northeast for Calpine (within our NCSA operating group) was in a loss position. As of September 30, 2018, the project was approximately 53% complete on a post-Combination basis (approximately 91% on a pre-Combination basis) and had an accrued provision for estimated losses of approximately $43 million. The increase in the cost estimates recorded as adjustments to the fair value of the acquired balance sheet during the third quarter of 2018 were primarily associated with revisions to the estimation of productivity based on historical performance. These changes in estimates were reflected as adjustments to the fair values of various assets and liabilities reflected in the acquired balance sheet, as they resulted from refinements of estimates of conditions that existed as of the Combination Date, and primarily impacted Advance billings on contracts.
|
|
22 |
|
NOTES TO THE CONDENSED CONSOLIDATED FINANCIAL STATEMENTS (UNAUDITED)
NOTE 5—PROJECT CHANGES IN ESTIMATES
Our RPOs for each of our operating groups generally consist of several hundred contracts and our results may be impacted by changes in estimated margins. The following is a discussion of our most significant changes in cost estimates that impacted segment operating income for the three and nine months ended September 30, 2018 and 2017. For discussion of significant changes in estimates on loss projects impacting the fair value of our acquired balance sheet in the Combination, see Note 4, Revenue Recognition.
Three and nine months ended September 30, 2018
Segment operating income for the three and nine months ended September 30, 2018 was positively impacted by net favorable changes in estimates totaling approximately $79 million and $200 million, respectively, primarily in our NCSA, MENA and APAC segments.
NCSA—Our segment results for the three and nine months ended September 30, 2018 were positively impacted by net favorable changes in estimates aggregating approximately $18 million, primarily due to cost savings on our ethane projects in Texas and Louisiana.
MENA—Our segment results for the three months and nine months ended September 30, 2018 were positively impacted by net favorable changes in estimates aggregating approximately $49 million and $118 million, respectively, primarily due to productivity improvements and cost savings on marine, fabrication and other activities, primarily on three of our projects in the Middle East.
APAC—Our segment results for the three months ended September 30, 2018 were positively impacted by net favorable changes in estimates aggregating approximately $9 million. The net favorable changes were due to savings upon substantial completion of the post lay campaign on the Greater Western Flank Phase 2 project in Australia.
Our segment results for the nine months ended September 30, 2018 were positively impacted by net favorable changes in estimates aggregating approximately $64 million. The net favorable changes were due to reductions in costs to complete on offshore campaigns and several other active projects, primarily on two of our Australian projects, partially offset by additional costs associated with weather downtime on the two projects.
Three and nine months ended September 30, 2017
Segment operating income for the three and nine months ended September 30, 2017 was positively impacted by net favorable changes in estimates totaling approximately $36 million and $115 million, respectively, primarily in our MENA (approximately $36 million and $72 million, respectively) and APAC (approximately $4 million and $44 million, respectively) segments.
NOTE 6—CASH, CASH EQUIVALENTS AND RESTRICTED CASH
The following is a reconciliation of cash, cash equivalents and restricted cash reported within the Balance Sheets that sum to the totals of such amounts shown in the Statements of Cash Flows at September 30, 2018 and December 31, 2017:
|
|
|
September, 2018 |
|
|
December 31, 2017 |
|
||
|
|
|
(In millions) |
|
|||||
|
Cash and cash equivalents |
|
$ |
580 |
|
|
$ |
390 |
|
|
Restricted cash and cash equivalents (1) |
|
|
325 |
|
|
|
18 |
|
|
Total cash, cash equivalents and restricted cash shown in the Consolidated Statements of Cash Flows |
|
$ |
905 |
|
|
$ |
408 |
|
|
(1) |
Our restricted cash balances primarily served as cash collateral deposits for our letter of credit facilities. See Note 12, Debt, for further discussion. |
|
|
23 |
|
NOTES TO THE CONDENSED CONSOLIDATED FINANCIAL STATEMENTS (UNAUDITED)
Accounts Receivable—Trade, Net―Our trade accounts receivable balances at September 30, 2018 and December 31, 2017 included the following:
|
|
|
September 30, 2018 |
|
|
December 31, 2017 |
|
||
|
|
|
(In millions) |
|
|||||
|
Contract receivables (1) |
|
$ |
965 |
|
|
$ |
225 |
|
|
Retainages (2) |
|
|
145 |
|
|
|
120 |
|
|
Less allowances |
|
|
(17 |
) |
|
|
(17 |
) |
|
Accounts receivable—trade, net |
|
$ |
1,093 |
|
|
$ |
328 |
|
|
(1) |
Unbilled receivables for our performance obligations recognized at a point in time are recorded within accounts receivable and were approximately $32 million at September 30, 2018 (all resulted from the acquired CB&I operations). |
|
(2) |
Retainages classified within Accounts receivable-trade, net are anticipated to be collected within one year. Retainages anticipated to be collected beyond one year are classified as Accounts receivable long-term retainages on our Balance Sheet. |
NOTE 8—CONTRACTS IN PROGRESS AND ADVANCE BILLINGS ON CONTRACTS
Our contract assets and liabilities at September 30, 2018 and December 31, 2017 were as follows:
|
|
|
September 30, 2018 (1) |
|
|
December 31, 2017 |
|
||
|
|
|
(In millions) |
|
|||||
|
Costs incurred less costs of revenues recognized (1) |
|
$ |
8 |
|
|
$ |
98 |
|
|
Revenues recognized less billings to customers (2) |
|
|
715 |
|
|
|
523 |
|
|
Contracts in progress |
|
$ |
723 |
|
|
$ |
621 |
|
|
|
|
|
|
|
|
|
|
|
|
Costs incurred less costs of revenues recognized (1) |
|
$ |
35 |
|
|
$ |
(14 |
) |
|
Billings to customers less revenues recognized (2) |
|
|
1,698 |
|
|
|
46 |
|
|
Advance billings on contracts |
|
$ |
1,733 |
|
|
$ |
32 |
|
|
(1) |
Costs incurred in excess of costs recognized (assets) and costs recognized in excess of costs incurred (liabilities) resulted from the exclusion of certain costs when measuring progress toward completion under the cost-to-cost method, prior to our adoption of ASC Topic 606. These remaining amounts will be recognized in Cost of operations as the underlying projects progress. |
|
(2) |
During the nine months ended September 30, 2018, the change in the asset and liability balances includes $341 million and $2.3 billion, respectively, resulting from acquired balances in the Combination. Revenues recognized for the nine-months periods ended September 30, 2018 with respect to amounts included in our contract liability balance as of December 31, 2017 were $45 million, realized during the first half of 2018. |
For the three months ended September 30, 2018, revenues recognized from changes in transaction prices associated with performance obligations satisfied in prior periods were not material. For the nine months ended September 30, 2018, we recognized $81 million of revenues primarily resulting from changes in transaction prices during the first half of 2018 associated with performance obligations satisfied in prior periods, primarily in our APAC and MENA segments. The change in transaction prices primarily related to reimbursement of costs incurred in prior periods.
|
|
24 |
|
NOTES TO THE CONDENSED CONSOLIDATED FINANCIAL STATEMENTS (UNAUDITED)
Project Related Intangibles—Our project related intangibles at September 30, 2018 were as follows:
|
|
|
September 30, 2018 |
|
|
|
|
|
|||||||||
|
|
|
Gross Carrying Amount |
|
|
Accumulated Amortization |
|
|
Net Carrying Amount |
|
|
Weighted Average Life |
|
||||
|
|
|
(In millions) |
|
|
|
|
|
|
(In years) |
|
||||||
|
Project-related intangible assets |
|
$ |
239 |
|
|
$ |
(63 |
) |
|
$ |
176 |
|
|
|
3 |
|
|
Project-related intangible liabilities |
|
|
(97 |
) |
|
|
21 |
|
|
|
(76 |
) |
|
|
2 |
|
|
Total (1) |
|
$ |
142 |
|
|
$ |
(42 |
) |
|
$ |
100 |
|
|
|
|
|
|
(1) |
All project related intangible assets at September 30, 2018 resulted from the Combination. Amortization expense was $30 million and $42 million for the three and nine months ended September 30, 2018, respectively, and is anticipated to be $31 million, $33 million, $22 million, $5 million and $7 million for the remainder of 2018, 2019, 2020, 2021 and 2022, respectively. |
Other Intangible Assets—Our other intangible assets at September 30, 2018 were as follows:
|
|
|
September 30, 2018 |
|
|
|
|
|
|||||||||
|
|
|
Gross Carrying Amount |
|
|
Accumulated Amortization |
|
|
Net Carrying Amount |
|
|
Weighted Average Life |
|
||||
|
|
|
(In millions) |
|
|
|
|
|
|
(In years) |
|
||||||
|
Process technologies |
|
$ |
498 |
|
|
$ |
(9 |
) |
|
$ |
489 |
|
|
|
27 |
|
|
Trade names |
|
|
401 |
|
|
|
(14 |
) |
|
|
387 |
|
|
|
12 |
|
|
Customer relationships |
|
|
115 |
|
|
|
(11 |
) |
|
|
104 |
|
|
|
10 |
|
|
Trademarks |
|
|
27 |
|
|
|
(1 |
) |
|
|
26 |
|
|
|
10 |
|
|
Total (1) |
|
$ |
1,041 |
|
|
$ |
(35 |
) |
|
$ |
1,006 |
|
|
|
|
|
|
(1) |
All other intangible assets at September 30, 2018 resulted from the Combination. Amortization expense was $25 million and $35 million for the three and nine months ended September 30, 2018, respectively, and is anticipated to be $24 million, $84 million, $83 million, $78 million and $72 million for the remainder of 2018, 2019, 2020, 2021 and 2022, respectively. |
NOTE 10—JOINT VENTURE AND CONSORTIUM ARRANGEMENTS
As discussed in Note 2, Basis of Presentation and Significant Accounting Policies we account for our unconsolidated joint ventures or consortiums using either proportionate consolidation, when we meet the applicable accounting criteria to do so, or the equity method. Further, we consolidate any joint venture or consortium that is determined to be a VIE for which we are the primary beneficiary, or which we otherwise effectively control.
Proportionately Consolidated Consortiums—The following is a summary description of our significant consortiums that have been deemed to be VIEs and accounted for using proportionate consolidation:
|
|
• |
McDermott/Zachry Construction Corporation (“Zachary”)—We have a 50%/50% consortium with Zachry to perform engineering, procurement and construction (“EPC”) work for two LNG liquefaction trains in Freeport, Texas. In addition, we have subcontract and risk sharing arrangements with a unit of Chiyoda Corporation (“Chiyoda”) to support our responsibilities to the venture. The costs of these arrangements are recorded in Cost of operations. |
|
|
• |
McDermott/Zachry/Chiyoda—We have a consortium with Zachry and Chiyoda (MDR—33.3% / Zachry—33.3% / Chiyoda—33.3%) to perform EPC work for an additional LNG liquefaction train at the project site in Freeport, Texas. |
|
|
• |
McDermott/Chiyoda—We have a 50%/50% consortium with Chiyoda to perform EPC work for three LNG liquefaction trains in Hackberry, Louisiana. |
|
|
• |
McDermott/CTCI—We have 42.5%/57.5% consortium with a unit of CTCI Corporation (“CTCI”) to perform EPC work for a mono-ethylene glycol facility in Gregory, Texas. |
|
|
25 |
|
NOTES TO THE CONDENSED CONSOLIDATED FINANCIAL STATEMENTS (UNAUDITED)
The following table presents summarized balance sheet information for our share of our proportionately consolidated consortiums:
|
|
|
September 30, 2018 (1) |
|
|
|
|
|
(In millions) |
|
|
|
Current assets (2) |
|
$ |
259 |
|
|
Non-current assets |
|
|
10 |
|
|
Total assets |
|
$ |
269 |
|
|
|
|
|
|
|
|
Current liabilities |
|
$ |
842 |
|
|
(1) |
All balances at September 30, 2018 resulted from the Combination and are subject to change when additional information is obtained during the measurement period. |
|
(2) |
Our consortium arrangements allow for excess working capital of the consortium to be advanced to the consortium participants. Such advances are returned to the ventures for working capital needs as necessary. Accordingly, at a reporting period end a consortium may have advances to its participants which are reflected as an advance receivable within current assets of the consortium. At September 30, 2018, Accounts receivable-other included $48 million related to our proportionate share of advances from the consortiums to the consortium participants. |
At September 30, 2018, Accrued liabilities on the Balance Sheets included $52 million related to advances from these consortiums.
Equity Method Joint Ventures—The following is a summary description of our significant joint ventures accounted for using the equity method:
|
|
• |
Chevron-Lummus Global (“CLG”)—We have a 50%/50% joint venture with a unit of Chevron Corporation which provides proprietary process technology licenses and associated engineering services and catalyst, primarily for the refining industry. As sufficient capital investments in CLG have been made by the joint venture participants, it does not qualify as a VIE. |
|
|
• |
NET Power—We have a joint venture with a unit of Exelon Corporation and 8 Rivers Capital (McDermott—33.3% / Exelon—33.3% / 8 Rivers Capital—33.3%) to commercialize a new natural gas power generation system that recovers the carbon dioxide produced during combustion. NET Power is building a first-of-its-kind demonstration plant which is being funded by contributions and services from the joint venture participants and other parties. We have determined the joint venture to be a VIE; however, we are not the primary beneficiary, and therefore do not consolidate it. During the three months ended September 30, 2018, we made a final payment of $10 million toward our total cash commitment for NET Power of $57 million ($47 million was paid prior to the Combination). |
|
|
• |
McDermott/CTCI—We have a 50%/50% joint venture with CTCI to perform EPC work for a liquids ethylene cracker and associated units at Sohar, Oman. We have determined the joint venture to be a VIE; however, we are not the primary beneficiary, and therefore do not consolidate it. Our joint venture arrangement allows for excess working capital of the joint venture to be advanced to the joint venture participants. Such advances are returned to the joint venture for working capital needs as necessary. At September 30, 2018, Accrued liabilities on our Balance Sheet included $95 million related to advances from this joint venture. |
|
|
• |
io Oil and Gas—We co-own several 50%/50% joint venture entities with Baker Hughes, a GE company. These joint venture entities focus on the pre-FEED phases of projects in offshore markets, bring comprehensive field development expertise and provide technically advanced solutions in new full field development concept selection and evaluation. |
|
|
• |
Qingdao McDermott Wuchuan Offshore Engineering Company Ltd.—We have a 50%/50% joint venture with Wuhan Wuchuan Investment Holding Co., Ltd., a leading shipbuilder in China. This joint venture provides project management, procurement, engineering, fabrication, construction and pre-commissioning of onshore and offshore oil and gas structures, including onshore modules, topsides, floating production storage, off-loading modules, subsea structures, and manifolds. |
|
|
26 |
|
NOTES TO THE CONDENSED CONSOLIDATED FINANCIAL STATEMENTS (UNAUDITED)
As discussed in Note 2, Basis of Presentation and Significant Accounting Policies in the second quarter of 2018 we implemented certain changes to our financial reporting structure, including presentation of income and losses from investments (listed above) in unconsolidated affiliates, as a component of operating income in the Statements of Operations. Income and loss from investments in unconsolidated affiliates were previously presented below provision for income taxes. We believe this presentation better represents the integrated operating nature of these joint ventures which are considered essential to our core operations.
Our income and losses from investments in unconsolidated affiliates that were dissolved or not considered integral to our core operations as of December 31, 2017 are presented below provision for income taxes in the consolidated statements of operations for the comparative three and nine-month periods ended September 30, 2017.
Amortization expense associated with fair value adjustments recorded to Investments in unconsolidated affiliates in conjunction with the Combination was $13 million for both the three and nine months ended September 30, 2018.
Aggregate summarized financial information for CLG and McDermott/CTCI is as follows:
|
|
|
Three months ended |
|
|
Nine months ended |
|
||
|
|
|
September 30, 2018 |
|
|||||
|
|
|
(In millions) |
|
|||||
|
Revenues |
|
$ |
237 |
|
|
$ |
400 |
|
|
Cost of operations |
|
|
221 |
|
|
|
363 |
|
|
Gross profit |
|
|
16 |
|
|
|
37 |
|
|
Operating income |
|
|
9 |
|
|
|
23 |
|
|
Net income (1) |
|
$ |
11 |
|
|
$ |
24 |
|
|
|
(1) |
Results for CLG and McDermott/CTCI are from the Combination Date. |
Consolidated Joint Ventures—The following is a summary description of our significant joint venture we consolidate due to its designation as a VIE for which we are the primary beneficiary:
|
|
• |
McDermott/Orano—We have a joint venture with Orano (McDermott—52% / Orano—48%) relating to a mixed oxide fuel fabrication facility in Aiken, South Carolina. |
The following table presents summarized balance sheet information for our consolidated joint ventures:
|
|
|
September 30, 2018 (1) |
|
|
|
|
|
(In millions) |
|
|
|
Current assets |
|
$ |
75 |
|
|
Non-current assets |
|
|
15 |
|
|
Total assets |
|
$ |
90 |
|
|
|
|
|
|
|
|
Current liabilities |
|
$ |
72 |
|
|
(1) |
All balances at September 30, 2018 resulted from the Combination and are subject to change when additional information is obtained during the measurement period. |
Other—The use of these joint ventures and consortiums exposes us to a number of risks, including the risk that the third-party joint venture or consortium participants may be unable or unwilling to provide their share of capital investment to fund the operations of the joint venture or consortium or complete their obligations to us, the joint venture or consortium, or ultimately, our customer. Differences in opinions or views among joint venture or consortium participants could also result in delayed decision-making or failure to agree on material issues, which could adversely affect the business and operations of a joint venture or consortium. In addition, agreement terms may subject us to joint and several liability for the third-party participants in our joint ventures or consortiums, and the failure of any of those third parties to perform their obligations could impose additional performance and financial obligations on us. These factors could result in unanticipated costs to complete the projects, liquidated damages or contract disputes.
|
|
27 |
|
NOTES TO THE CONDENSED CONSOLIDATED FINANCIAL STATEMENTS (UNAUDITED)
NOTE 11—RESTRUCTURING AND INTEGRATION COSTS
Restructuring and integration costs primarily relate to costs to achieve our CPI program. We launched the CPI program in the second quarter of 2018, with the goal of realizing transformative cost savings across our business. The program incorporates the activities of our Fit 2 Grow program previously announced in the fourth quarter of 2017 and targets a significant improvement in cost controls across five main opportunity areas: (i) procurement and supply chain; (ii) systems, applications and support; (iii) assets and facilities; (iv) perquisites, travel and other; and (v) workforce efficiency. The program also includes other costs associated with the Combination, including change-in-control, severance, incremental incentive plan costs and professional fees. These costs are recorded within our Corporate operating results and were $31 million and $106 million for the three and nine-months ended September 30, 2018, respectively. Our accrued liability for this program was $27 million at September 30, 2018, which is primarily anticipated to be paid in the fourth quarter of 2018. We anticipate incurring an additional $84 million, prior to the completion of the CPI program, which is anticipated in the fourth quarter of 2019.
The carrying values of our long-term debt obligations are as follows:
|
|
|
September 30, 2018 |
|
|
December 31, 2017 |
|
||
|
|
|
(In millions) |
|
|||||
|
Current |
|
|
|
|
|
|
|
|
|
Current maturities of long-term debt |
|
$ |
36 |
|
|
$ |
24 |
|
|
Less: unamortized debt issuance costs |
|
|
(1 |
) |
|
|
- |
|
|
Current maturities of long-term debt, net of unamortized debt issuance costs |
|
$ |
35 |
|
|
$ |
24 |
|
|
|
|
|
|
|
|
|
|
|
|
Long-term |
|
|
|
|
|
|
|
|
|
Term Facility |
|
$ |
2,249 |
|
|
$ |
- |
|
|
10.625% senior notes |
|
|
1,300 |
|
|
|
- |
|
|
8.000% second-lien notes |
|
|
- |
|
|
|
500 |
|
|
North Ocean 105 construction financing |
|
|
20 |
|
|
|
25 |
|
|
Vendor equipment financing |
|
|
5 |
|
|
|
16 |
|
|
Less: current maturities of long-term debt |
|
|
(36 |
) |
|
|
(24 |
) |
|
Less: unamortized debt issuance costs |
|
|
(141 |
) |
|
|
(5 |
) |
|
Long-term debt, net of unamortized debt issuance costs |
|
$ |
3,397 |
|
|
$ |
512 |
|
Credit Agreement
On May 10, 2018, we entered into a Credit Agreement (the “Credit Agreement”) with a syndicate of lenders and letter of credit issuers, Barclays Bank PLC, as administrative agent for a term facility under the Credit Agreement, and Crédit Agricole Corporate and Investment Bank, as administrative agent for the other facilities under the Credit Agreement. The Credit Agreement provides for borrowings and letters of credit in the aggregate principal amount of $4.65 billion, consisting of the following:
|
|
• |
a $2.26 billion senior secured term loan facility (the “Term Facility”), the full amount of which was borrowed, and $319.3 million of which has been deposited into a restricted cash collateral account (the “LC Account”) to secure reimbursement obligations in respect of up to $310.0 million of letters of credit (the “Term Facility Letters of Credit”); |
|
|
• |
a $1.0 billion senior secured revolving credit facility (the “Revolving Credit Facility”); and |
|
|
• |
a $1.39 billion senior secured letter of credit facility (the “LC Facility”). |
The Credit Agreement provides that:
|
|
• |
Term Facility Letters of Credit can be issued in an amount up to the amount on deposit in the LC Account ($319.8 million at September 30, 2018), less an amount equal to approximately 3% of such amount on deposit (to be held as a reserve for related letter of credit fees), not to exceed $310.0 million; |
|
|
• |
subject to compliance with the financial covenants in the Credit Agreement, the full amount of the Revolving Credit Facility is available for revolving loans; |
|
|
28 |
|
NOTES TO THE CONDENSED CONSOLIDATED FINANCIAL STATEMENTS (UNAUDITED)
|
|
• |
the full amount of the LC Facility is available for the issuance of performance letters of credit. |
Borrowings are available under the Revolving Credit Facility for working capital and other general corporate purposes. Certain existing letters of credit outstanding under our previously existing Amended and Restated Credit Agreement, dated as of June 30, 2017 (the “Prior Credit Agreement”) and certain existing letters of credit outstanding under CB&I’s previously existing credit facilities have been deemed issued under the Credit Agreement, and letters of credit were issued under the Credit Agreement to backstop certain other existing letters of credit issued for the account of McDermott, CB&I and their respective subsidiaries and affiliates.
The Credit Agreement includes mandatory commitment reductions and prepayments in connection with, among other things, certain asset sales and casualty events (subject to reinvestment rights with respect to asset sales of less than $500 million). In addition, we are required to make annual prepayments of term loans under the Term Facility and cash collateralize letters of credit issued under the Revolving Credit Facility and the LC Facility with 75% of excess cash flow (as defined in the Credit Agreement), reducing to 50% of excess cash flow and 25% of excess cash flow depending on our secured leverage ratio.
Term Facility—As of September 30, 2018, we had $2.25 billion of borrowings outstanding under our seven-year Term Facility. Proceeds of our borrowing under the Term Facility were used, together with proceeds from the senior notes described below and cash on hand, (i) to consummate the Business Combination Agreement, including the repayment of certain existing indebtedness of CB&I and its subsidiaries, (ii) to redeem $500 million aggregate principal amount of our 8.000% second-lien notes, (iii) to prepay existing indebtedness under, and to terminate in full, our Prior Credit Agreement, and (iv) to pay fees and expenses in connection with the Combination, the Credit Agreement and the issuance of the Senior Notes.
Principal under the Term Facility is payable quarterly and interest is assessed at either (i) the Eurodollar rate plus a margin of 5.00% per year or (ii) the base rate (the highest of the Federal Funds rate plus 0.50%, the Eurodollar rate plus 1.0%, or the administrative agent’s prime rate) plus a margin of 4.00%, subject to a 1.0% floor with respect to the Eurodollar rate and is payable periodically dependent upon the interest rate in effect during the period. However, on May 8, 2018, we entered into a U.S. dollar interest rate swap arrangement to mitigate exposure associated with cash flow variability on $1.94 billion of the $2.26 billion Term Facility. This resulted in a weighted average interest rate of 7.27%, inclusive of the applicable margin during the period ended September 30, 2018. The Credit Agreement requires us to prepay a portion of the term loans made under the Term Facility on the last day of each fiscal quarter in an amount equal to $5.65 million.
The future scheduled maturities of the Term Facility are:
|
|
|
(In millions) |
|
|
|
2018 |
|
$ |
6 |
|
|
2019 |
|
|
23 |
|
|
2020 |
|
|
23 |
|
|
2021 |
|
|
23 |
|
|
2022 |
|
|
23 |
|
|
Thereafter |
|
|
2,151 |
|
|
|
|
$ |
2,249 |
|
Additionally, as of September 30, 2018, there were approximately $278 million of Term Facility Letters of Credit issued (or deemed issued) under the Credit Agreement, leaving approximately $32 million of available capacity under the Term Facility.
Revolving Credit Facility and LC Facility—We have a $1.0 billion Revolving Credit Facility which is scheduled to expire in May 2023. Through September 30, 2018, we had not made any borrowings under the Revolving Credit Facility. As of September 30, 2018, we had approximately $142 million of letters of credit outstanding (including $48.4 million of financial letters of credit), leaving $858 million of available capacity under the Revolving Credit Facility. We also have a $1.39 billion LC Facility that is scheduled to expire in May 2023. As of September 30, 2018, we had approximately $1.376 billion of letters of credit outstanding, leaving $14 million of available capacity under the LC Facility. If we borrow funds under the Revolving Credit Facility, interest will be assessed at either the
|
|
29 |
|
NOTES TO THE CONDENSED CONSOLIDATED FINANCIAL STATEMENTS (UNAUDITED)
base rate plus a floating margin ranging from 2.75% to 3.25% (3.25% at September 30, 2018) or the Eurodollar rate plus a floating margin ranging from 3.75% to 4.25% (4.25% at September 30, 2018), in each case depending on our leverage ratio (calculated quarterly). We are charged a commitment fee of 0.50% per year on the daily amount of the unused portions of the commitments under the Revolving Credit Facility and the LC Facility. Additionally, with respect to all letters of credit outstanding under the Credit Agreement, we are charged a fronting fee of 0.25% per year and, with respect to all letters of credit outstanding under the Revolving Credit Facility and the LC Facility, we are charged a participation fee of (i) between 3.75% to 4.25% (4.25% at September 30, 2018) per year in respect of financial letters of credit and (ii) between 1.875% to 2.125% (2.125% at September 30, 2018) per year in respect of performance letters of credit, in each case depending on our leverage ratio (calculated quarterly). We are also required to pay customary issuance fees and other fees and expenses in connection with the issuance of letters of credit under the Credit Agreement.
Credit Agreement Covenants—The Credit Agreement includes the following financial covenants that are tested on a quarterly basis:
|
|
• |
the minimum permitted fixed charge coverage ratio (as defined in the Credit Agreement) is 1.50 to 1.00; |
|
|
• |
the maximum permitted leverage ratio is (i) 4.25 to 1.00 for each fiscal quarter ending on or before September 30, 2019, (ii) 4.00 to 1.00 for the fiscal quarter ending December 31, 2019, (iii) 3.75 to 1.00 for each fiscal quarter ending after December 31, 2019 and on or before December 31, 2020, (iv) 3.50 to 1.00 for each fiscal quarter ending after December 31, 2020 and on or before December 31, 2021 and (v) 3.25 to 1.00 for each fiscal quarter ending after December 31, 2021; and |
|
|
• |
the minimum liquidity (as defined in the Credit Agreement, but generally meaning the sum of McDermott’s unrestricted cash and cash equivalents plus unused commitments under the Credit Agreement available for revolving borrowings) is $200 million. |
In addition, the Credit Agreement contains various covenants that, among other restrictions, limit our ability to:
|
|
• |
incur or assume indebtedness; |
|
|
• |
grant or assume liens; |
|
|
• |
make acquisitions or engage in mergers; |
|
|
• |
sell, transfer, assign or convey assets; |
|
|
• |
make investments; |
|
|
• |
repurchase equity and make dividends and certain other restricted payments; |
|
|
• |
change the nature of its business; |
|
|
• |
engage in transactions with affiliates; |
|
|
• |
enter into burdensome agreements; |
|
|
• |
modify its organizational documents; |
|
|
• |
enter into sale and leaseback transactions; |
|
|
• |
make capital expenditures; |
|
|
• |
enter into speculative hedging contracts; and |
|
|
• |
make prepayments on certain junior debt. |
The Credit Agreement contains events of default that we believe are customary for a secured credit facility. If an event of default relating to bankruptcy or other insolvency events occurs, all obligations under the Credit Agreement will immediately become due and payable. If any other event of default exists under the Credit Agreement, the lenders may accelerate the maturity of the obligations outstanding under the Credit Agreement and exercise other rights and remedies. In addition, if any event of default exists under the Credit Agreement, the lenders may commence foreclosure or other actions against the collateral.
|
|
30 |
|
NOTES TO THE CONDENSED CONSOLIDATED FINANCIAL STATEMENTS (UNAUDITED)
If any default exists under the Credit Agreement, or if the Borrowers are unable to make any of the representations and warranties in the Credit Agreement at the applicable time, the Borrowers will be unable to borrow funds or have letters of credit issued under the Credit Agreement.
Credit Agreement Covenants Compliance—As of September 30, 2018, we were in compliance with all our restrictive and financial covenants under the Credit Agreement. The financial covenants at September 30, 2018 are summarized below:
|
Ratios |
|
Requirement |
|
Actual |
|
Minimum fixed charge coverage ratio |
|
1.50x |
|
2.40x |
|
Maximum total leverage ratio |
|
4.25x |
|
2.46x |
|
Minimum liquidity |
$ |
200 million |
$ |
1,472 million |
Senior Notes
On April 18, 2018, we issued $1.3 billion in aggregate principal of 10.625% senior notes due 2024 (the “Senior Notes”), pursuant to an indenture we entered into with Wells Fargo Bank, National Association, as trustee (the “Senior Notes Indenture”). Interest on the Senior Notes is payable semi-annually in arrears, and the Senior Notes are scheduled to mature in May 2024. However, at any time or from time to time on or after May 1, 2021, we may redeem the Senior Notes, in whole or in part, at the redemption prices (expressed as percentages of principal amount of the Senior Notes to be redeemed) set forth below, together with accrued and unpaid interest to (but excluding) the redemption date (subject to the right of holders of record on the relevant record date to receive interest due on the relevant interest payment date), if redeemed during the 12-month period beginning on May 1 of the years indicated:
|
Year |
|
Optional redemption price |
|
|
|
2021 |
|
|
105.313 |
% |
|
2022 |
|
|
102.656 |
% |
|
2023 and thereafter |
|
|
100.000 |
% |
In addition, prior to May 1, 2021, we may redeem up to 35.0% of the aggregate principal amount of the outstanding Senior Notes, in an amount not greater than the net cash proceeds of one or more qualified equity offerings (as defined in the Senior Notes Indenture) at a redemption price equal to 110.625% of the principal amount of the notes to be redeemed, plus accrued and unpaid interest to (but excluding) the date of redemption (subject to the right of holders of record on the relevant record date to receive interest due on the relevant interest payment date), subject to certain limitations and other requirements. The Senior Notes may also be redeemed, in whole or in part, at any time prior to May 1, 2021 at our option, at a redemption price equal to 100% of the principal amount of the Senior Notes redeemed, plus the applicable premium (as defined in the Senior Notes Indenture) as of, and accrued and unpaid interest to (but excluding) the applicable redemption date (subject to the right of the holders of record on the relevant record date to receive interest due on the relevant interest payment date).
Senior Notes Covenants—The Senior Notes Indenture contains covenants that, among other things, limit our ability to: (i) incur or guarantee additional indebtedness or issue preferred stock; (ii) make investments or certain other restricted payments; (iii) pay dividends or distributions on our capital stock or purchase or redeem our subordinated indebtedness; (iv) sell assets; (v) create restrictions on the ability of our restricted subsidiaries to pay dividends or make other payments to us; (vi) create certain liens; (vii) sell all or substantially all of our assets or merge or consolidate with or into other companies; (viii) enter into transactions with affiliates; and (ix) create unrestricted subsidiaries. Those covenants are subject to various exceptions and limitations.
Senior Notes Covenants Compliance—At September 30, 2018, we were in compliance with all our restrictive covenants under the Senior Notes Indenture.
Other Financing Arrangements
North Ocean Financing―On September 30, 2010, McDermott International, Inc., as guarantor, and North Ocean 105 AS, in which we then had a 75% ownership interest, as borrower, entered into a financing agreement to pay a portion of the construction costs of the NO 105. Borrowings under the agreement are secured by, among other things, a pledge of all of the equity of North Ocean 105 AS, a mortgage on the NO 105, and a lien on substantially all of the other assets of North Ocean 105 AS. The financing agreement requires principal repayment in 17 consecutive semiannual installments of approximately $4 million, which commenced on October 1, 2012.
|
|
31 |
|
NOTES TO THE CONDENSED CONSOLIDATED FINANCIAL STATEMENTS (UNAUDITED)
In the second quarter of 2017 we exercised our option under the North Ocean 105 AS joint venture agreement and purchased the 25% ownership interest of Oceanteam ASA (“Oceanteam”) in the vessel-owning company for approximately $11 million in cash. As part of that transaction, we also assumed the right to a $5 million note payable from North Ocean 105 AS to Oceanteam (which had been issued in connection with a dividend declared by North Ocean 105 AS in 2016). As of September 30, 2018, the outstanding borrowing under this facility was approximately $20 million. Future maturities are approximately $4 million, $8 million and $8 million for the remainder of 2018 and the years 2019 and 2020, respectively.
Receivable Factoring Facility―During the nine months ended September 30, 2018, we sold, without recourse, approximately $179 million of receivables under an uncommitted receivables purchase agreement in Mexico at a discount rate of applicable LIBOR plus a margin of 1.90%-2.00% and Interbank Equilibrium Interest Rate in Mexico plus a margin of 1.50% - 1.70%. We recorded approximately $1 million and $3 million of factoring costs in Other operating income (expense) during the three and nine months ended September 30, 2018, respectively. Ten percent of the receivables sold are withheld and received on the due date of the original invoice. We have received cash, net of fees and amounts withheld, of approximately $159 million under these arrangements during the nine months ended September 30, 2018.
Vendor Equipment Financing―In February 2017, JRM Mexico entered into a 21-month loan agreement for equipment financing in the amount of $47 million. Borrowings under the loan agreement bear interest at a fixed rate of 5.75%. JRM Mexico’s obligations in connection with this equipment financing are guaranteed by McDermott International Management, S. de RL., one of our indirect, wholly owned subsidiaries. The equipment financing agreement contains various customary affirmative covenants, as well as specific affirmative covenants, including the pledge of specified equipment. The equipment financing agreement also requires compliance with various negative covenants, including restricted use of the proceeds. As of September 30, 2018, the outstanding borrowings under this facility were approximately $5 million and will mature during the remainder of 2018.
Uncommitted Bilateral Credit Facilities—We are party to a number of short-term uncommitted bilateral credit facilities and surety bond arrangements (the “Uncommitted Facilities”) across several geographic regions, as follows:
|
|
|
September 30, 2018 |
|
|
December 31, 2017 |
|
||||||||||
|
|
|
Uncommitted Line Capacity |
|
|
Utilized |
|
|
Uncommitted Line Capacity |
|
|
Utilized |
|
||||
|
|
|
(In millions) |
|
|||||||||||||
|
Bank Guarantee and Bilateral Letter of Credit (1) |
|
$ |
1,609 |
|
|
$ |
928 |
|
|
$ |
725 |
|
|
$ |
572 |
|
|
Surety Bonds (2) |
|
828 |
|
|
419 |
|
|
|
300 |
|
|
|
49 |
|
||
|
Bilateral arrangements to issue cash collateralized letters of credit |
|
|
- |
|
|
|
- |
|
|
|
175 |
|
|
|
18 |
|
|
(1) |
Approximately $175 million of this capacity is available only upon provision of an equivalent amount of cash collateral. |
|
(2) |
Excludes approximately $403 million of surety bonds maintained on behalf of CB&I’s former Capital Services Operations, which were sold to CSVC Acquisition Corp (“CSVC”) in June 2017. We also continue to maintain guarantees on behalf of CB&I’s former Capital Services Operations business in support of approximately $82 million of RPOs. We are entitled to an indemnity from CSVC for both the surety bonds and guarantees. |
Debt Issuance Costs—We incurred approximately $150 million of fees relating to the establishment of our Credit Agreement (including $93 million associated with the Term Facility and $57 million associated with the Revolving Credit Facility and LC Facility) and approximately $59 million relating to the issuance of the Senior Notes. On the Balance Sheets, the costs associated with the Term Facility and Senior Notes are reflected as a direct reduction from the related debt liability and amortized over the terms of the respective facilities. The costs associated with the Revolving Credit Facility and LC Facility are reflected within Other current and noncurrent assets and amortized within Interest expense, net, over the terms of the respective facilities.
Debt Extinguishment Costs—During the second quarter of 2018, we incurred approximately $10 million of make-whole fees in connection with the redemption of $500 million principal amount of our 8.000% second-lien notes, as well as charges of approximately $4 million relating to the write-off of deferred debt issuance costs resulting from the extinguishment of our previous debt arrangements. These costs were recorded within Other non-operating expense, net, in our Statement of Operations.
|
|
32 |
|
NOTES TO THE CONDENSED CONSOLIDATED FINANCIAL STATEMENTS (UNAUDITED)
See Note 23, Subsequent Events for a discussion of additional financing arrangements we entered into subsequent to September 30, 2018.
Future minimum lease payments for our capital lease obligations are as follows:
|
|
|
(In millions) |
|
|
|
2018 |
|
$ |
1 |
|
|
2019 |
|
|
15 |
|
|
2020 |
|
|
12 |
|
|
2021 |
|
|
11 |
|
|
2022 |
|
|
11 |
|
|
Thereafter |
|
|
53 |
|
|
|
|
$ |
103 |
|
|
Imputed interest |
|
|
(28 |
) |
|
Present value of future minimum lease payments |
|
$ |
75 |
|
Significant capital leases at September 30, 2018 include the following:
The Amazon, a pipelay and construction vessel, was purchased by us in February 2017, sold to an unrelated third party (the “Amazon Owner”) and leased back under a long-term bareboat charter that gave us the right to use the vessel and was recorded as an operating lease. On July 27, 2018, we entered into agreements (the “Amazon Modification Agreements”) providing for certain modifications to the Amazon vessel and related financing and amended bareboat charter arrangements. The total cost of the modifications, including project management and other fees and expenses, is expected to be in the range of approximately $260 million to $290 million. The Amazon Owner is expected to fund the cost of the modifications primarily through an export credit-backed senior loan provided by a group of lenders, supplemented by expected direct capital expenditure by us of approximately $58 million over the course of the modifications. The amended bareboat charter arrangement is accounted for as a capital lease, recognizing Property, plant and equipment and Lease obligation for the present value of future minimum lease payments. The cost of modifications will be recorded in Property, plant and equipment with a corresponding liability for direct capital expenditures not incurred by us. The capital lease obligation will increase upon completion of the modifications and funding by the Amazon Owner. At September 30, 2018, Property, plant and equipment, net included a $54 million asset (net of accumulated amortization of $1 million) and a capital lease liability of approximately $53 million.
In May 2018, we entered into a capital lease arrangement for a jack-up barge and, as of September 30, 2018, Property, plant and equipment, net included a $17 million asset (net of accumulated amortization of $0.3 million) relating to that arrangement, along with a corresponding capital lease liability.
|
|
33 |
|
NOTES TO THE CONDENSED CONSOLIDATED FINANCIAL STATEMENTS (UNAUDITED)
NOTE 14—PENSION AND POST-RETIREMENT BENEFITS
We sponsor various defined benefit pension plans covering eligible U.S and non-U.S. employees and provide specific post-retirement benefits for eligible retired U.S. employees and their dependents through health care and life insurance benefit programs. These plans may be changed or terminated by us at any time. Contributions and net periodic benefit cost for our post-retirement benefit plans are not material.
The following table provides contribution information for our plans at September 30, 2018:
|
|
|
Non-U.S. Pension Plans |
|
|
|
|
|
(In millions) |
|
|
|
Contributions made through September 30, 2018 |
|
$ |
2 |
|
|
Contributions expected for the remainder of 2018 |
|
|
7 |
|
|
Total contributions expected for 2018 (1) |
|
$ |
9 |
|
|
(1) |
All contributions expected for 2018 are associated with pension plans acquired in the Combination. Total contributions for our U.S. pension plans are not anticipated to be material. |
The following table provides a breakout of the components of the net periodic benefit cost (income) associated with our defined benefit pension plans for the three and nine months ended September 30, 2018 and 2017:
|
|
|
Three Months Ended September 30, |
|
|
Nine Months Ended September 30, |
|
||||||||||
|
|
|
2018 |
|
|
2017 |
|
|
2018 |
|
|
2017 |
|
||||
|
|
|
(In millions) |
|
|||||||||||||
|
U.S. pension plans: |
|
|
|
|
|
|
|
|
|
|
|
|
|
|
|
|
|
Service cost |
|
$ |
- |
|
|
$ |
- |
|
|
$ |
- |
|
|
$ |
- |
|
|
Interest cost |
|
|
5 |
|
|
|
5 |
|
|
|
14 |
|
|
|
15 |
|
|
Expected return on plan assets |
|
|
(5 |
) |
|
|
(5 |
) |
|
|
(14 |
) |
|
|
(15 |
) |
|
Net periodic benefit cost (income) (1) (2) |
|
$ |
- |
|
|
$ |
- |
|
|
$ |
- |
|
|
$ |
- |
|
|
|
|
|
|
|
|
|
|
|
|
|
|
|
|
|
|
|
|
Non-U.S. pension plans: |
|
|
|
|
|
|
|
|
|
|
|
|
|
|
|
|
|
Service cost |
|
$ |
3 |
|
|
$ |
- |
|
|
$ |
5 |
|
|
$ |
- |
|
|
Interest cost |
|
|
4 |
|
|
|
- |
|
|
|
7 |
|
|
|
1 |
|
|
Expected return on plan assets |
|
|
(6 |
) |
|
|
- |
|
|
|
(10 |
) |
|
|
(1 |
) |
|
Net periodic benefit cost (income) (1) (2) |
|
$ |
1 |
|
|
$ |
- |
|
|
$ |
2 |
|
|
$ |
- |
|
|
(1) |
Net pension costs associated with plans acquired in the Combination were not material for the three and nine months ended September 30, 2018. |
|
(2) |
The components of net periodic benefit cost (income) other than the service cost component are included in Other non-operating (income) expense, net in our Statements of Operations. The service cost component is included in Cost of operations and selling, general and administration expenses, in our Statements of Operations, along with other compensation costs rendered by the participating employees. |
In August 2017, one of our non-U.S. defined benefit plans was amended to issue lump-sum distributions of certain accrued benefits or allow transfer of such benefits into a defined contribution plan. As of December 31, 2017, all investments in the trust for the defined benefit plan were converted to cash and cash equivalents to facilitate settlements, which are expected to be completed by the end of 2018. As of September 30, 2018, total benefits remaining under the defined plan were approximately $9 million.
We recognize mark-to-market fair value adjustments on defined benefit pension and other postretirement plans in Other non-operating (income) expense, net in our Statements of Operations in the fourth quarter of each year.
|
|
34 |
|
NOTES TO THE CONDENSED CONSOLIDATED FINANCIAL STATEMENTS (UNAUDITED)
|
|
|
September 30, 2018 |
|
|
December 31, 2017 |
|
||
|
|
|
(In millions) |
|
|||||
|
Accrued contract costs |
|
$ |
716 |
|
|
$ |
141 |
|
|
Advances from equity method and proportionally consolidated joint ventures and consortiums (1) |
|
|
147 |
|
|
|
- |
|
|
Income taxes payable |
|
|
143 |
|
|
|
35 |
|
|
Other accrued liabilities (2) |
|
|
573 |
|
|
|
196 |
|
|
Accrued liabilities |
|
$ |
1,579 |
|
|
$ |
372 |
|
|
(1) |
Represents advances from the joint ventures and consortiums in which we participate. See Note 10, Joint Venture and Consortium Arrangements for further discussion. |
|
(2) |
Represents various accruals that are each individually less than 5% of total current liabilities. |
NOTE 16—FAIR VALUE MEASUREMENTS
Fair Value of Financial Instruments—Financial instruments are required to be categorized within a valuation hierarchy based upon the lowest level of input that is available and significant to the fair value measurement. The three levels of the valuation hierarchy are as follows:
|
|
• |
Level 1—inputs are based on quoted prices for identical instruments traded in active markets. |
|
|
• |
Level 2—inputs are based on quoted prices for similar instruments in active markets, quoted prices for similar or identical instruments in inactive markets and model-based valuation techniques for which all significant assumptions are observable in the market or can be corroborated by observable market data for substantially the full term of the assets and liabilities. |
|
|
• |
Level 3—inputs are generally unobservable and typically reflect management’s estimates of assumptions that market participants would use in pricing the asset or liability. The fair values are therefore determined using model-based techniques that include option pricing models, discounted cash flow models and similar valuation techniques. |
|
|
35 |
|
NOTES TO THE CONDENSED CONSOLIDATED FINANCIAL STATEMENTS (UNAUDITED)
The following table presents the fair value of our financial instruments at September 30, 2018 and December 31, 2017 that are (i) measured and reported at fair value in the Financial Statements on a recurring basis and (ii) not measured at fair value on a recurring basis in the Financial Statements:
|
|
|
September 30, 2018 |
|
|||||||||||||||||
|
|
|
Carrying Amount |
|
|
Fair Value |
|
|
Level 1 |
|
|
Level 2 |
|
|
Level 3 |
|
|||||
|
|
|
(In millions) |
|
|||||||||||||||||
|
Measured at fair value on recurring basis |
|
|
|
|
|
|
|
|
|
|
|
|
|
|
|
|
|
|
|
|
|
Forward contracts (1) |
|
$ |
(14 |
) |
|
$ |
(14 |
) |
|
$ |
- |
|
|
$ |
(14 |
) |
|
$ |
- |
|
|
Not measured at fair value on recurring basis |
|
|
|
|
|
|
|
|
|
|
|
|
|
|
|
|
|
|
|
|
|
Debt and capital lease obligations (2) |
|
|
(3,649 |
) |
|
|
(3,775 |
) |
|
|
- |
|
|
|
(3,674 |
) |
|
|
(101 |
) |
|
|
|
|
|
|
|
|
|
|
|
|
|
|
|
|
|
|
|
|
|
|
|
|
|
December 31, 2017 |
|
|||||||||||||||||
|
|
|
Carrying Amount |
|
|
Fair Value |
|
|
Level 1 |
|
|
Level 2 |
|
|
Level 3 |
|
|||||
|
|
|
(In millions) |
|
|||||||||||||||||
|
Measured at fair value on recurring basis |
|
|
|
|
|
|
|
|
|
|
|
|
|
|
|
|
|
|
|
|
|
Forward contracts (1) |
|
$ |
2 |
|
|
$ |
2 |
|
|
$ |
- |
|
|
$ |
2 |
|
|
$ |
- |
|
|
Not measured at fair value on recurring basis |
|
|
|
|
|
|
|
|
|
|
|
|
|
|
|
|
|
|
|
|
|
Debt and capital lease obligations (2) |
|
|
(542 |
) |
|
|
(558 |
) |
|
|
- |
|
|
|
(516 |
) |
|
|
(42 |
) |
|
(1) |
The fair value of forward contracts is classified as Level 2 within the fair value hierarchy and is valued using observable market parameters for similar instruments traded in active markets. Where quoted prices are not available, the income approach is used to value forward contracts. This approach discounts future cash flows based on current market expectations and credit risk. |
|
(2) |
Our debt instruments are generally valued using a market approach based on quoted prices for similar instruments traded in active markets and are classified as Level 2 within the fair value hierarchy. Quoted prices were not available for the NO 105 construction financing, vendor equipment financing or capital leases. Therefore, these instruments were valued based on the present value of future cash flows discounted at estimated borrowing rates for similar debt instruments or on estimated prices based on current yields for debt issues of similar quality and terms and are classified as Level 3 within the fair value hierarchy. |
The carrying amounts that we have reported for our other financial instruments, including cash and cash equivalents, restricted cash and cash equivalents, accounts receivables and accounts payable approximate their fair values due to the short maturity of those instruments. The fair value of financial instruments included in purchase accounting estimates as a result of the Combination are subject to change when additional information is obtained.
NOTE 17—DERIVATIVE FINANCIAL INSTRUMENTS
Foreign Currency Exchange Rate Derivatives—The notional value of our outstanding foreign exchange rate derivative contracts totaled $930 million at September 30, 2018, with maturities extending through August 2022. These instruments consist of contracts to purchase or sell foreign-denominated currencies. As of September 30, 2018, the fair value of these contracts was in a net liability position totaling approximately $14 million. The fair value of outstanding derivative instruments is determined using observable financial market inputs, such as quoted market prices, and is classified as Level 2 in nature.
As of September 30, 2018, for, we deferred approximately $13 million of net losses in AOCI in connection with foreign exchange rate derivatives designated as cash flow hedges, and we expect to reclassify approximately $7 million of deferred losses out of AOCI by September 30, 2019, as hedged items are recognized in earnings.
|
|
36 |
|
NOTES TO THE CONDENSED CONSOLIDATED FINANCIAL STATEMENTS (UNAUDITED)
Interest Rate Derivatives—On May 8, 2018, we entered into a U.S. dollar interest rate swap arrangement to mitigate exposure associated with cash flow variability on the Term Facility in an aggregate notional value of $1.94 billion. The swap arrangement has been designated as a cash flow hedge as its critical terms matched those of the Term Facility at inception and through September 30, 2018. Accordingly, changes in the fair value of the swap arrangement are included in AOCI until the associated underlying exposure impacts our interest expense. As of September 30, 2018, the fair value of the swap arrangement was in a net liability position totaling approximately $0.4 million. The fair value of outstanding derivative instruments is determined using observable financial market inputs, such as quoted market prices, and is classified as Level 2 in nature.
As of September 30, 2018, in connection with the interest rate swap arrangement, we deferred approximately $0.4 million of net losses in AOCI, and we expect to reclassify approximately $0.3 million of deferred gains out of AOCI by September 30, 2019, as the hedged items are recognized in earnings.
The following table presents the total fair value of the derivatives by underlying risk and balance sheet classification:
|
|
|
September 30, 2018 |
|
|
December 31, 2017 |
|
||||||||||||
|
|
|
Derivatives designated as cash flow hedges |
|
|
Derivatives not designated as cash flow hedges |
|
|
Derivatives designated as cash flow hedges |
|
|
Derivatives not designated as cash flow hedges |
|
||||||
|
|
|
(In millions) |
|
|||||||||||||||
|
Other current assets |
|
$ |
2 |
|
|
$ |
3 |
|
|
$ |
2 |
|
|
$ |
- |
|
||
|
Other non-current assets |
|
|
2 |
|
|
|
- |
|
|
|
- |
|
|
|
- |
|
||
|
Total derivatives asset |
|
$ |
4 |
|
|
$ |
3 |
|
|
$ |
2 |
|
|
$ |
- |
|
||
|
|
|
|
|
|
|
|
|
|
|
|
|
|
|
|
|
|
||
|
Accrued liabilities |
|
$ |
11 |
|
|
$ |
3 |
|
|
$ |
1 |
|
|
$ |
- |
|
||
|
Other non-current liabilities |
|
|
7 |
|
|
|
- |
|
|
|
- |
|
|
|
- |
|
||
|
Total derivatives liability |
|
$ |
18 |
|
|
$ |
3 |
|
|
$ |
1 |
|
|
$ |
- |
|
||
The following table presents the total value, by underlying risk, recognized in other comprehensive income and reclassified from AOCI to Cost of operations (foreign currency derivatives) and Interest expense, net (interest rate derivatives) in the Statements of Operations for the three and nine months ended September 30, 2018 and 2017, in connection with derivatives designated as cash flow hedges:
|
|
|
Three Months Ended September 30, |
|
|
Nine Months Ended September 30, |
|
||||||||||
|
|
|
2018 |
|
|
2017 |
|
|
2018 |
|
|
2017 |
|
||||
|
|
|
(In millions) |
|
|||||||||||||
|
Foreign currency hedges |
|
|
|
|
|
|
|
|
|
|
|
|
|
|
|
|
|
Amount of gain (loss) recognized in other comprehensive income (loss) |
|
$ |
(11 |
) |
|
$ |
5 |
|
|
$ |
(16 |
) |
|
$ |
15 |
|
|
Loss (gain) reclassified from AOCI to Cost of operations |
|
|
(2 |
) |
|
|
4 |
|
|
|
(2 |
) |
|
|
1 |
|
|
Ineffective portion and amount excluded from effectiveness testing: gain (loss) recognized in Other non-operating income (expense) |
|
|
(1 |
) |
|
|
- |
|
|
|
(3 |
) |
|
|
(1 |
) |
|
Interest rate hedges |
|
|
|
|
|
|
|
|
|
|
|
|
|
|
|
|
|
Amount of gain (loss) recognized in other comprehensive income (loss) |
|
$ |
10 |
|
|
|
- |
|
|
|
- |
|
|
|
- |
|
|
Loss (gain) reclassified from AOCI to interest expense, net |
|
|
(1 |
) |
|
|
- |
|
|
|
(1 |
) |
|
|
- |
|
|
|
37 |
|
NOTES TO THE CONDENSED CONSOLIDATED FINANCIAL STATEMENTS (UNAUDITED)
The following table presents the total value of gain (loss) recognized in Other non-operating income (expense), net, in our Statements of Operations for the three and nine months ended September 30, 2018 and 2017, in connection with derivatives not designated as cash flow hedges:
|
|
|
Three Months Ended September 30, |
|
|
Nine Months Ended September 30, |
|
||||||||||
|
|
|
2018 |
|
|
2017 |
|
|
2018 |
|
|
2017 |
|
||||
|
|
|
(In millions) |
|
|||||||||||||
|
Foreign currency hedges |
|
$ |
(2 |
) |
|
$ |
- |
|
|
$ |
(12 |
) |
|
$ |
- |
|
During the three months ended September 30, 2018, we recognized income tax expense of $44 million (effective tax rate of 99.5%), compared to tax expense of $19 million (effective tax rate of 16.8%) for the third quarter of 2017. During the nine months ended September 30, 2018, we recognized an income tax benefit of $19 million (effective tax rate of 30.7%), compared to tax expense of $53 million (effective tax rate of 25.4%) for the nine months ended September 30, 2017.
Tax expense for the third quarter of 2018 was negatively impacted by losses in jurisdictions with no tax benefit ($41 million), partially offset by tax benefits related to research and development credits and other incentives ($7 million). Our provision for the nine months ended September 30, 2018 benefited from the tax effect ($117 million) of the taxable sale of low tax basis, pre-Combination McDermott assets to our new Technology entity which files its U.S. income taxes separately from pre-Combination McDermott, partially offset by non-deductible transaction costs ($16 million), losses in jurisdictions with no tax benefit ($60 million) and other items ($8 million).
The pre-Combination McDermott operations utilized the discrete-period method to compute its interim tax provision, and continued to do so through June 30, 2018, due to significant variations in the relationship between income tax expense and pre-tax accounting income or loss. Consequently, the actual effective rate was reported for these operations through June 30, 2018. The discrete-period method is applied when the application of the estimated annual effective tax rate is impractical, because it is not possible to reliably estimate the annual effective tax rate. The pre-Combination CB&I operations used the estimated annual effective tax rate approach to calculate its interim tax provision related to ordinary income and continued to use this method through June 30, 2018. Beginning for the third quarter of 2018, we utilized an estimated annual effective tax rate approach on a combined company basis.
Due to the impact of ongoing tax losses in the U.S. and the corresponding valuation allowance on our U.S. net deferred tax asset position, the new provisions from the Tax Reform Act taking effect in 2018 are not expected to have a material impact on our 2018 tax position. See Note 2, Basis of Presentation and Significant Accounting Policies, for further discussion.
As a result of the closing of the Combination in the second quarter of 2018, our unrecognized tax benefits increased $17 million. We do not anticipate significant changes to this balance in the next 12 months.
|
|
38 |
|
NOTES TO THE CONDENSED CONSOLIDATED FINANCIAL STATEMENTS (UNAUDITED)
NOTE 19—STOCKHOLDERS’ EQUITY AND EQUITY-BASED INCENTIVE PLANS
Stockholders’ Equity
On May 2, 2018, stockholders of McDermott approved an amendment to McDermott’s Amended and Restated Articles of Incorporation to effect a three-to-one reverse stock split of McDermott shares of common stock with par value of $1.00 per share, which became effective May 9, 2018. All comparable periods presented have been retrospectively revised to reflect this change.
Shares Outstanding and Treasury Shares―The changes in the number of shares outstanding and treasury shares held by us for the nine months ended September 30, 2018 and 2017 are as follows (in millions):
|
|
|
Nine Months Ended September 30, |
|
|||||
|
|
|
2018 |
|
|
2017 |
|
||
|
Shares outstanding |
|
|
|
|
|
|
|
|
|
Beginning balance |
|
|
95 |
|
|
|
80 |
|
|
Common stock issued |
|
|
2 |
|
|
|
15 |
|
|
Shares issued in the Combination (Note 3, Business Combination) |
|
|
85 |
|
|
|
- |
|
|
Purchase of common stock |
|
|
(1 |
) |
|
|
- |
|
|
Ending balance |
|
|
181 |
|
|
|
95 |
|
|
|
|
|
|
|
|
|
|
|
|
Shares held as Treasury shares |
|
|
|
|
|
|
|
|
|
Beginning balance |
|
|
3 |
|
|
|
3 |
|
|
Purchase of common stock |
|
|
1 |
|
|
|
- |
|
|
Retirement of common stock |
|
|
(1 |
) |
|
|
- |
|
|
Ending balance |
|
|
3 |
|
|
|
3 |
|
|
Ordinary shares issued at the end of the period |
|
|
183 |
|
|
|
98 |
|
Combination—As discussed in Note 3, Business Combination, we issued 84.5 million shares of McDermott common stock to the former CB&I shareholders. Additionally, effective as of the Combination Date, unvested and unexercised stock-settled equity-based awards (which included 2.1 million restricted stock units and 0.1 million stock options) relating to shares of CB&I’s common stock were canceled and converted into comparable McDermott stock-settled awards with generally the same terms and conditions as those prior to the Combination Date. The restricted stock units generally vest over a period ranging from three to four years from the original grant date.
Stock-Based Compensation Expense―During the three months ended September 30, 2018 and 2017, we recognized $9 million and $8 million, respectively, of stock-based compensation expense, and during the nine months ended September 30, 2018 and 2017, we recognized $24 million and $20 million, respectively, primarily within SG&A in our Statements of Operations. In addition, we recognized $26 million of expense in the second quarter of 2018 as a result of accelerated vesting for employees terminated in connection with the Combination, which was recorded within Restructuring and integration costs in our Statements of Operations.
AOCI
The components of AOCI included in stockholders’ equity are as follows:
|
|
|
September 30, 2018 |
|
|
December 31, 2017 |
|
||
|
|
|
(In millions) |
|
|||||
|
Foreign currency translation adjustments ("CTA") |
|
$ |
(69 |
) |
|
$ |
(49 |
) |
|
Net unrealized loss on derivative financial instruments |
|
|
(15 |
) |
|
|
(2 |
) |
|
Accumulated other comprehensive loss |
|
$ |
(84 |
) |
|
$ |
(51 |
) |
|
|
39 |
|
NOTES TO THE CONDENSED CONSOLIDATED FINANCIAL STATEMENTS (UNAUDITED)
The following table presents the components of AOCI and the amounts that were reclassified during the periods indicated:
|
|
|
Foreign currency translation adjustments |
|
|
Gain (loss) on derivative (1) |
|
|
TOTAL |
|
|||
|
|
|
(In millions) |
|
|||||||||
|
For the Nine Months Ended September 30, 2018 |
|
|
|
|
|
|
|
|
|
|
|
|
|
Balance at January 1, 2018 |
|
$ |
(49 |
) |
|
$ |
(2 |
) |
|
|
(51 |
) |
|
Other comprehensive income before reclassification |
|
|
(20 |
) |
|
|
(16 |
) |
|
|
(36 |
) |
|
Amounts reclassified from AOCI (2) |
|
|
- |
|
|
|
3 |
|
|
|
3 |
|
|
Net current period other comprehensive income |
|
|
(20 |
) |
|
|
(13 |
) |
|
|
(33 |
) |
|
Balance at September 30, 2018 |
|
$ |
(69 |
) |
|
$ |
(15 |
) |
|
$ |
(84 |
) |
|
|
|
|
|
|
|
|
|
|
|
|
|
|
|
For the Nine Months Ended September 30, 2017 |
|
|
|
|
|
|
|
|
|
|
|
|
|
Balance at January 1, 2017 |
|
$ |
(42 |
) |
|
$ |
(25 |
) |
|
$ |
(67 |
) |
|
Other comprehensive income before reclassification |
|
|
(1 |
) |
|
|
15 |
|
|
|
14 |
|
|
Acquisition of NCI |
|
|
- |
|
|
|
2 |
|
|
|
2 |
|
|
Amounts reclassified from AOCI (2) |
|
|
(6 |
) |
|
|
3 |
|
|
|
(3 |
) |
|
Net current period other comprehensive income |
|
|
(7 |
) |
|
|
20 |
|
|
|
13 |
|
|
Balance at September 30, 2017 |
|
$ |
(49 |
) |
|
$ |
(5 |
) |
|
$ |
(54 |
) |
|
(1) |
Refer to Note 17, Derivative Financial Instruments for additional details. |
|
(2) |
Amounts are net of tax, which was not material for the three- and nine-month periods ended September 30, 2018 and 2017. |
On May 2, 2018, stockholders of McDermott approved an amendment to McDermott’s Amended and Restated Articles of Incorporation to effect a three-to-one reverse stock split of McDermott shares of common stock (par value of $1.00 per share), which became effective May 9, 2018. All comparable periods presented have been retrospectively revised to reflect this change.
The following table sets forth the computation of basic and diluted earnings per common share.
|
|
Three Months Ended September 30, |
|
|
Nine Months Ended September 30, |
|
||||||||||
|
|
2018 |
|
|
2017 |
|
|
2018 |
|
|
2017 |
|
||||
|
|
(In millions, except per share amounts) |
|
|||||||||||||
|
Net income attributable to McDermott |
$ |
2 |
|
|
$ |
95 |
|
|
$ |
84 |
|
|
$ |
153 |
|
|
|
|
|
|
|
|
|
|
|
|
|
|
|
|
|
|
|
Weighted average common stock (basic) |
|
180 |
|
|
|
95 |
|
|
|
140 |
|
|
|
90 |
|
|
Effect of dilutive securities: |
|
|
|
|
|
|
|
|
|
|
|
|
|
|
|
|
Tangible equity units |
|
- |
|
|
|
- |
|
|
|
- |
|
|
|
4 |
|
|
Stock options, restricted stock and restricted stock units |
|
1 |
|
|
|
- |
|
|
|
1 |
|
|
|
1 |
|
|
Potential dilutive common stock |
|
181 |
|
|
|
95 |
|
|
|
141 |
|
|
|
95 |
|
|
|
|
|
|
|
|
|
|
|
|
|
|
|
|
|
|
|
Net income per share attributable to McDermott |
|
|
|
|
|
|
|
|
|
|
|
|
|
|
|
|
Basic: |
$ |
0.01 |
|
|
$ |
1.00 |
|
|
$ |
0.60 |
|
|
$ |
1.70 |
|
|
Diluted: |
$ |
0.01 |
|
|
$ |
1.00 |
|
|
$ |
0.60 |
|
|
$ |
1.61 |
|
|
|
40 |
|
NOTES TO THE CONDENSED CONSOLIDATED FINANCIAL STATEMENTS (UNAUDITED)
Approximately 0.5 million shares underlying outstanding stock-based awards for the three and nine months ended September 30, 2018, and approximately 0.5 million shares underlying outstanding stock-based awards for the three and nine months ended September 30, 2017, were excluded from the computation of diluted earnings per share during those periods because the exercise price of those awards was greater than the average market price of our common stock, and the inclusion of such shares would have been antidilutive.
NOTE 21—COMMITMENTS AND CONTINGENCIES
Investigations and Litigation
General—Due to the nature of our business, we and our affiliates are, from time to time, involved in litigation or subject to disputes, governmental investigations or claims related to our business activities, including, among other things:
|
|
• |
performance or warranty-related matters under our customer and supplier contracts and other business arrangements; and |
|
|
• |
workers’ compensation claims, Jones Act claims, occupational hazard claims, premises liability claims and other claims. |
Based upon our prior experience, we do not expect that any of these other litigation proceedings, disputes, investigations and claims will have a material adverse effect on our consolidated financial condition, results of operations or cash flows; however, because of the inherent uncertainty of litigation and other dispute resolution proceedings and, in some cases, the availability and amount of potentially applicable insurance, we can provide no assurance the resolution of any particular claim or proceeding to which we are a party will not have a material effect on our consolidated financial condition, results of operations or cash flows for the fiscal period in which that resolution occurs.
Combination Related Lawsuits—In January, February and March 2018, five shareholders of CB&I filed separate lawsuits under the federal securities laws in the United States District Court for the Southern District of Texas challenging the accuracy of the disclosures made in the registration statement we and a subsidiary of CB&I filed in connection with the Combination (the “Registration Statement”). The cases are captioned (1) McIntyre v. Chicago Bridge & Iron Company N.V., et al., Case No. 4:18-cv-00273 (S.D. Tex.) (the “McIntyre Action”); (2) The George Leon Family Trust v. Chicago Bridge & Iron Company N.V., et al., Case No. 4:18-cv-00314 (S.D. Tex.) (the “Leon Action”); (3) Maresh v. Chicago Bridge & Iron Company N.V., et al., Case No. 4:18-cv-00498 (S.D. Tex.) (the “Maresh Action”); (4) Patel v. Chicago Bridge & Iron Co. N.V., et al., Case No. 4:18-cv-00550 (S.D. Tex.) (the “Patel Action”); and (5) Judd v. Chicago Bridge& Iron Co. N.V., et. al., Case No. 4:18-cv-00799 (S.D. Tex.) (the “Judd Action”). The McIntyre Action, Leon Action, Maresh Action and Judd Action are asserted on behalf of putative classes of CB&I’s public shareholders, while the Patel Action is brought only on behalf of the named plaintiff. All five actions allege violations of Section 14(a) and 20(a) of the Securities Exchange Act of 1934, as amended (the “Exchange Act”), and Rule 14a-9 promulgated thereunder based on various alleged omissions of material information from the Registration Statement. All five actions have been dismissed, and we have agreed to pay a small amount of attorneys’ fees relating to these actions.
Project Arbitration Matters—We are in arbitration (governed by the arbitration rules of the International Chamber of Commerce) entitled Refineria de Cartagena S.A. v. Chicago Bridge & Iron Company N.V., et al which was commenced on March 8, 2016 in connection with a large, cost reimbursable refinery construction project in Colombia completed by CB&I in 2015. Refineria de Cartagena, the customer on the project, is alleging cost overruns and consequential damages on the project. The customer is claiming total damages in excess of $4.5 billion. We have asserted a counterclaim against the customer for approximately $250 million. The parties are currently preparing witness statements, expert reports and other filings that are scheduled to be submitted to the tribunal in December 2018. The arbitration is venued in New York, New York and the hearings are currently scheduled to take place in April and May 2019. We do not believe a risk of material loss is probable related to this matter, and accordingly, our reserves were not significant at September 30, 2018. While it is possible that a loss may be incurred, we are unable to estimate the range of potential loss, if any.
In addition, we are in arbitration (governed by the arbitration rules of the United Nations Commission on International Trade Law) entitled CBI Constructors Pty & Kentz Pty Ltd and Chevron Australia Pty Ltd., which was commenced on or about May 17, 2017, with the customer for one of CB&I’s previously completed consolidated joint venture projects, regarding differing interpretations of the contract related to reimbursable billings. We and our joint venture counterparty have asserted claims against the customer of approximately $90 million and the customer has asserted that it has overpaid the joint venture by $297 million, less the amounts owed to the joint venture. The matter has been bifurcated, with hearings on entitlement scheduled in November 2018 and hearings on the
|
|
41 |
|
NOTES TO THE CONDENSED CONSOLIDATED FINANCIAL STATEMENTS (UNAUDITED)
amount of damages, if necessary, are scheduled for September 2019. We do not believe a risk of material loss is probable related to this matter, and accordingly, no amounts have been accrued at September 30, 2018. While it is possible that a loss may be incurred, we are unable to estimate the range of potential loss, if any.
Dispute Related to Sale of Nuclear Operations—On December 31, 2015, we sold our Nuclear Operations to Westinghouse Electric Company LLC (“WEC”). In connection with the transaction, a post-closing purchase price adjustment mechanism was negotiated between CB&I and WEC to account for any difference between target working capital and actual working capital as finally determined pursuant to the terms of the purchase agreement. On April 28, 2016, WEC delivered to us a purported closing statement that estimated closing working capital was negative $976.5 million, which was $2.1 billion less than the target working capital amount. In contrast, we calculated closing working capital to be $1.6 billion, which was $427.8 million greater than the target working capital amount. On July 21, 2016, we filed a complaint against WEC in the Court of Chancery in the State of Delaware seeking a declaration that WEC has no remedy for the vast majority of its claims, and we requested an injunction barring WEC from bringing such claims. On December 2, 2016, the Court of Chancery granted WEC’s motion for judgment on the pleadings and dismissed our complaint, stating that the dispute should follow the dispute resolution process set forth in the purchase agreement, which includes the use of an independent auditor to resolve the working capital dispute. We appealed that ruling to the Delaware Supreme Court. Due to WEC’s bankruptcy filing on March 29, 2017, all claim resolution proceedings were automatically stayed pursuant to the Bankruptcy Code. At the parties’ request, the Bankruptcy Court lifted the automatic stay to permit the appeal and dispute resolution process to continue. Oral argument before the Delaware Supreme Court was held on May 3, 2017, and on June 27, 2017, the Delaware Supreme Court overturned the decision of the Court of Chancery and instructed the Court of Chancery to issue an order enjoining WEC from submitting certain claims to the independent auditor. The parties have discussed those matters still subject to the dispute resolution process and the selection of a new independent auditor to replace the previous auditor, who had resigned. We do not believe a risk of material loss is probable related to this matter, and, accordingly, no amounts have been accrued at September 30, 2018. While it is possible that a loss may be incurred, we are unable to estimate the range of potential loss, if any. We believe the Delaware Supreme Court ruling significantly improved our position on this matter and intend to continue pursuing our rights under the purchase agreement.
Asbestos Litigation—We are a defendant in numerous lawsuits wherein plaintiffs allege exposure to asbestos at various locations. We review and defend each case on its own merits and make accruals based on the probability of loss and best estimates of potential loss. We do not believe any unresolved asserted claim will have a material adverse effect on our future results of operations, financial position or cash flow. With respect to unasserted asbestos claims, we cannot identify a population of potential claimants with sufficient certainty to determine the probability of loss or estimate of future loss. We do not believe a risk of material loss is probable related to this matter, and, accordingly, our reserves were not significant at September 30, 2018. While we continue to pursue recovery for recognized and unrecognized contingent losses through insurance, indemnification arrangements and other sources, we are unable to quantify the amount that we may recover because of the variability in coverage amounts, limitations and deductibles or the viability of carriers, with respect to our insurance policies for the years in question.
Mercury Litigation—Certain of our subsidiaries are co-defendants in a group of consolidated “toxic exposure” claims, involving 54 plaintiffs who allege that they were exposed to mercury while working in a chlorine manufacturing facility located in Muscle Shoals, Alabama. The matter was commenced on December 14, 2011 and is captioned Aretha Abernathy, et al. v. Occidental Chemical Corp., et al., CV 11-900266, Circuit Court of Colbert County, Alabama. The plaintiffs consist of former employees of subsidiaries of CB&I, as well as other defendants. No trial date has been set. We do not believe a risk of material loss is probable related to this matter, and accordingly, our reserves were not significant at September 30, 2018. While it is possible that a loss may be incurred (absent insurance coverage), we are unable at this time, to estimate the range of potential loss, if any. Further, we believe we are entitled to coverage under various insurance policies, though certain carriers have issued letters reserving their rights to contest their obligations to indemnify us. Discussions between us and the carriers continue over coverage for these matters.
Labor Litigation—A former employee of one of our subsidiaries commenced a class action lawsuit under the Fair Labor Standards ACT (“FLSA”) entitled Cantrell v. Lutech Resources, Inc., (S.D. Texas 2017) Case No. 4:17-CV-2679 on or about September 5, 2017, alleging that he and his fellow class members were not paid one and one half times their normal hourly wage rates for hours worked that exceeded 40 hours in a work week. Our subsidiary has yet to answer the allegations in the complaint, as agreed by the parties, in order to allow mediation to take place. The first mediation session commenced in October 2018 and is ongoing. We do not believe a risk of material loss is probable related to this matter, and, accordingly, our reserves were not significant at September 30, 2018. While it is possible that a loss may be incurred, we are unable at this time, to estimate the range of potential loss, if any.
|
|
42 |
|
NOTES TO THE CONDENSED CONSOLIDATED FINANCIAL STATEMENTS (UNAUDITED)
Pre-Combination CB&I Securities Litigations—On March 2, 2017, a complaint was filed in the United States District Court for the Southern District of New York seeking class action status on behalf of purchasers of CB&I common stock and alleging damages on their behalf arising from alleged false and misleading statements made during the class period from October 30, 2013 to June 23, 2015. The case is captioned: In re Chicago Bridge & Iron Company N.V. Securities Litigation, No. 1:17-cv-01580-LGS (the “Securities Litigation”). The defendants in the case are: CB&I; Philip K. Asherman, CB&I’s former chief executive officer; Westley S. Stockton, CB&I’s former controller and chief accounting officer; and Ronald Ballschmiede, CB&I’s former chief financial officer. On June 14, 2017, the court named ALSAR Partnership Ltd. as lead plaintiff. On August 14, 2017, a consolidated amended complaint was filed alleging violations of Sections 10(b) and 20(a) of the Exchange Act and Rule 10b-5 thereunder, arising out of alleged misrepresentations about CB&I’s accounting for the acquisition of The Shaw Group, CB&I’s accounting with respect to the two nuclear projects being constructed by The Shaw Group, and CB&I’s financial reporting and public statements with respect to those two projects. On May 24, 2018, the court denied defendants’ motion to dismiss and the parties are currently engaged in the discovery process. We are not able at this time to determine the likelihood of loss, if any, arising from this matter and, accordingly, no amounts have been accrued at September 30, 2018. We believe the claims are without merit and intend to defend against them vigorously.
On October 26, 2018, two actions were filed by individual plaintiffs based on allegations similar to those alleged in the Securities Litigation. Both actions were filed in the United States District Court for the Southern District of New York and are captioned Gotham Diversified Neutral Master Fund, LP, et al. v. Chicago Bridge & Iron Company N.V. et al., Case No. 1:18-cv-09927 and Appaloosa Investment L.P., et al., v. Chicago Bridge & Iron Company N.V., et al., Case No. 1:18-cv-09928. Besides CB&I, additional defendants are: Philip K. Asherman, CB&I’s former chief executive officer; Westley S. Stockton, CB&I’s former controller and chief accounting officer; and Ronald Ballschmiede, CB&I’s former chief financial officer. Plaintiffs assert causes of action based on alleged violations of Sections 10(b), 18 and 20(a) of the Exchange Act and Rule 10b-5 thereunder, along with common law causes of action. The time for the defendants to respond to the allegations contained in the complaints has not yet expired. We are not able at this time to determine the likelihood of loss, if any, arising from these matters. We believe the claims are without merit and intend to defend against them vigorously.
On or about November 2, 2017, a complaint was filed in the District Court of Montgomery County, Texas by Daniel Cohen and associated individuals and corporations, alleging causes of action under both common and state law for alleged false and misleading statements related to CB&I’s acquisition of The Shaw Group in 2013, particularly with regard to two nuclear projects being constructed by Shaw in South Carolina and Georgia. The case is captioned Daniel Cohen, et al. v. Chicago Bridge & Iron Company, N.V., et al., No. 17-10-12820. The additional defendants are: Philip K. Asherman, CB&I’s former chief executive officer; Westley S. Stockton, CB&I’s former controller and chief accounting officer; and Ronald Ballschmiede, CB&I’s former chief financial officer. The plaintiffs alleged that the individual defendants made, or had authority over the content and method of communicating information to the public, including the alleged misstatements and omissions detailed in the complaint, resulting in a financial loss on shares of stock purchased by the plaintiffs. Discovery in this matter is proceeding. We are not able at this time to determine the likelihood of loss, if any, arising from this matter and, accordingly, no amounts have been accrued at September 30, 2018. We believe the claims are without merit and intend to defend against them vigorously.
Environmental Matters
We have been identified as a potentially responsible party at various cleanup sites under the Comprehensive Environmental Response, Compensation, and Liability Act of 1980, as amended (“CERCLA”). CERCLA and other environmental laws can impose liability for the entire cost of cleanup on any of the potentially responsible parties, regardless of fault or the lawfulness of the original conduct.
In connection with the historical operation of our facilities, including those associated with acquired operations, substances which currently are or might be considered hazardous were used or disposed of at some sites that will or may require us to make expenditures for remediation. In addition, we have agreed to indemnify parties from whom we have purchased or to whom we have sold facilities for certain environmental liabilities arising from acts occurring before the dates those facilities were transferred. Generally, however, where there are multiple responsible parties, a final allocation of costs is made based on the amount and type of wastes disposed of by each party and the number of financially viable parties, although this may not be the case with respect to any particular site. We have not been determined to be a major contributor of waste to any of these sites. On the basis of our relative contribution of waste to each site, we expect our share of the ultimate liability for the various sites will not have a material adverse effect on our consolidated financial condition, results of operations or cash flows in any given year.
We believe we are in compliance, in all material respects, with applicable environmental laws and regulations and maintain insurance coverage to mitigate our exposure to environmental liabilities. We do not anticipate we will incur material capital expenditures for
|
|
43 |
|
NOTES TO THE CONDENSED CONSOLIDATED FINANCIAL STATEMENTS (UNAUDITED)
environmental controls or for the investigation or remediation of environmental conditions during the remainder of 2018 or 2019. As of September 30, 2018, we had no environmental reserve recorded.
Asset Retirement Obligations
At some sites, we are contractually obligated to decommission our fabrication facilities upon site exit. Currently, we are unable to estimate any asset retirement obligations (“AROs”) due to the indeterminate life of our fabrication facilities. We regularly review the optimal future alternatives for our facilities. Any decision to retire one or more facilities will result in recording the present value of such obligations.
AROs would be recorded at the present value of the estimated costs to retire the asset at the time the obligation is incurred. As of September 30, 2018, we had no AROs recorded.
Contracts Containing Liquidated Damages Provisions
Some of our contracts contain provisions that require us to pay liquidated damages if we are responsible for the failure to meet specified contractual milestone dates and the applicable customer asserts a claim under those provisions. Those contracts define the conditions under which our customers may make claims against us for liquidated damages. In many cases in which we have historically had potential exposure for liquidated damages, such damages ultimately were not asserted by our customers. As of September 30, 2018, we determined that we had approximately $255 million of potential liquidated damages exposure, based on performance under contracts to date, and included $82 million as a reduction in transaction prices related to such exposure. We believe we will be successful in obtaining schedule extensions or other customer-agreed changes that should resolve the potential for the liquidated damages where we have not made a reduction in transaction prices. However, we may not achieve relief on some or all of the issues involved and, as a result, could be subject to liquidated damages being imposed on us in the future.
We disclose the results of each of our reportable segments in accordance with ASC 280, Segment Reporting. Each of the reportable segments is separately managed by a senior executive who is a member of our Executive Committee (“EXCOM”). Our EXCOM is led by our Chief Executive Officer, who is the chief operating decision maker (“CODM”). Discrete financial information is available for each of the segments, and the EXCOM uses the operating results of each of the reportable segments for performance evaluation and resource allocation.
Upon completion of the Combination, during the second quarter of 2018, we reorganized our operations around five operating segments. This reorganization is intended to better serve our global clients, leverage our workforce, help streamline operations, and provide enhanced growth opportunities. Our five operating groups are: NCSA; EARC; MENA; APAC; and Technology. The segment information for the prior periods presented has been recast to conform to the current presentation. We also report certain corporate and other non-operating activities under the heading “Corporate and Other.” Corporate and Other primarily reflects corporate expenses, certain centrally managed initiatives (such as restructuring charges), impairments, year-end mark-to-market pension actuarial gains and losses, costs not attributable to a particular reportable segment and unallocated direct operating expenses associated with the underutilization of vessels, fabrication facilities and engineering resources.
|
|
44 |
|
NOTES TO THE CONDENSED CONSOLIDATED FINANCIAL STATEMENTS (UNAUDITED)
Summarized financial information for the three and nine months ended September 30, 2018 and 2017 is as follows:
|
|
|
Three months ended September 30, |
|
|
Nine months ended September 30, |
|
||||||||||
|
|
|
2018 |
|
|
2017 |
|
|
2018 |
|
|
2017 |
|
||||
|
|
|
(In millions) |
|
|||||||||||||
|
Revenues (1): |
|
|
|
|
|
|
|
|
|
|
|
|
|
|
|
|
|
NCSA |
|
$ |
1,516 |
|
|
$ |
61 |
|
|
$ |
2,609 |
|
|
$ |
131 |
|
|
EARC |
|
|
77 |
|
|
|
- |
|
|
|
151 |
|
|
|
18 |
|
|
MENA |
|
|
473 |
|
|
|
736 |
|
|
|
1,287 |
|
|
|
1,603 |
|
|
APAC |
|
|
75 |
|
|
|
162 |
|
|
|
332 |
|
|
|
515 |
|
|
Technology |
|
|
148 |
|
|
|
- |
|
|
|
253 |
|
|
|
- |
|
|
Total revenues |
|
$ |
2,289 |
|
|
$ |
959 |
|
|
$ |
4,632 |
|
|
$ |
2,267 |
|
|
|
|
|
|
|
|
|
|
|
|
|
|
|
|
|
|
|
|
Operating income: |
|
|
|
|
|
|
|
|
|
|
|
|
|
|
|
|
|
Segment operating income: |
|
|
|
|
|
|
|
|
|
|
|
|
|
|
|
|
|
NCSA |
|
$ |
97 |
|
|
$ |
(3 |
) |
|
$ |
148 |
|
|
$ |
(8 |
) |
|
EARC |
|
|
(13 |
) |
|
|
(5 |
) |
|
|
(24 |
) |
|
|
(8 |
) |
|
MENA |
|
|
89 |
|
|
|
164 |
|
|
|
256 |
|
|
|
346 |
|
|
APAC |
|
|
9 |
|
|
|
21 |
|
|
|
125 |
|
|
|
74 |
|
|
Technology |
|
|
20 |
|
|
|
- |
|
|
|
45 |
|
|
|
- |
|
|
Total segment operating income |
|
|
202 |
|
|
|
177 |
|
|
|
550 |
|
|
|
404 |
|
|
Corporate (2) |
|
|
(73 |
) |
|
|
(52 |
) |
|
|
(308 |
) |
|
|
(142 |
) |
|
Total operating income |
|
$ |
129 |
|
|
$ |
125 |
|
|
$ |
242 |
|
|
$ |
262 |
|
|
|
|
|
|
|
|
|
|
|
|
|
|
|
|
|
|
|
|
Depreciation and amortization: |
|
|
|
|
|
|
|
|
|
|
|
|
|
|
|
|
|
NCSA |
|
$ |
21 |
|
|
$ |
5 |
|
|
$ |
37 |
|
|
$ |
16 |
|
|
EARC |
|
|
5 |
|
|
|
- |
|
|
|
8 |
|
|
|
- |
|
|
MENA |
|
|
19 |
|
|
|
13 |
|
|
|
35 |
|
|
|
35 |
|
|
APAC |
|
|
3 |
|
|
|
8 |
|
|
|
12 |
|
|
|
21 |
|
|
Technology |
|
|
45 |
|
|
|
- |
|
|
|
59 |
|
|
|
- |
|
|
Corporate |
|
|
14 |
|
|
|
2 |
|
|
|
36 |
|
|
|
6 |
|
|
Depreciation and amortization |
|
$ |
107 |
|
|
$ |
28 |
|
|
$ |
187 |
|
|
$ |
78 |
|
|
|
|
|
|
|
|
|
|
|
|
|
|
|
|
|
|
|
|
Capital expenditures: |
|
|
|
|
|
|
|
|
|
|
|
|
|
|
|
|
|
NCSA |
|
$ |
2 |
|
|
$ |
6 |
|
|
$ |
4 |
|
|
$ |
21 |
|
|
EARC |
|
|
- |
|
|
|
- |
|
|
|
- |
|
|
|
- |
|
|
MENA |
|
|
2 |
|
|
|
7 |
|
|
|
9 |
|
|
|
18 |
|
|
APAC |
|
|
4 |
|
|
|
2 |
|
|
|
9 |
|
|
|
8 |
|
|
Technology |
|
|
- |
|
|
|
- |
|
|
|
- |
|
|
|
- |
|
|
Corporate (3) |
|
|
11 |
|
|
|
1 |
|
|
|
40 |
|
|
|
50 |
|
|
Total Capital expenditures |
|
$ |
19 |
|
|
$ |
16 |
|
|
$ |
62 |
|
|
$ |
97 |
|
|
(1) |
Intercompany transactions were not significant for the three and nine months ended September 30, 2018 and 2017, respectively. |
|
(2) |
Corporate operating results for the three and nine months ended September 30, 2018 include $31 million and $106 million of restructuring and integration costs, respectively. See Note 11, Restructuring and Integration Costs, for further discussion. Corporate operating results for the three and nine months ended September 30, 2018 also include $5 million and $45 million of transaction costs, respectively. See Note 3, Business Combination, for further discussion. Corporate operating results for the three and nine months ended September 30, 2017 includes approximately $3 million of gain on sale of assets. |
|
(3) |
Corporate and other capital expenditures in the first nine months of 2017 include the purchase of the Amazon, a pipelay and construction vessel described further in Note 13, Lease Obligations. |
|
|
45 |
|
NOTES TO THE CONDENSED CONSOLIDATED FINANCIAL STATEMENTS (UNAUDITED)
Our assets by segment at September 30, 2018 and December 31, 2017 were as follows:
|
|
|
September 30, 2018 |
|
|
December 31, 2017 |
|
||
|
|
|
(In millions) |
|
|||||
|
Segment assets: |
|
|
|
|
|
|
|
|
|
NCSA |
|
$ |
2,548 |
|
|
$ |
917 |
|
|
EARC |
|
|
601 |
|
|
|
3 |
|
|
MENA |
|
|
1,595 |
|
|
|
1,022 |
|
|
APAC |
|
|
649 |
|
|
|
887 |
|
|
Technology |
|
|
979 |
|
|
|
- |
|
|
Corporate (1) |
|
|
(30 |
) |
|
|
394 |
|
|
Total tangible assets |
|
|
6,342 |
|
|
|
3,223 |
|
|
Goodwill |
|
|
4,708 |
|
|
|
- |
|
|
Other intangibles, net |
|
|
1,006 |
|
|
|
- |
|
|
Total assets (2) |
|
$ |
12,056 |
|
|
$ |
3,223 |
|
|
(1) |
Corporate assets at September 30, 2018 include negative cash balances associated with our international cash pooling program. |
|
(2) |
Our marine vessels are included in the area in which they were located as of the reporting date. |
On October 30, 2018, we entered into a Securities Purchase Agreement (the “Purchase Agreement”) with certain investment funds managed by the Merchant Banking Division of The Goldman Sachs Group Inc. (collectively, the “Purchasers”) to issue and sell in a private placement (the “Private Placement”) (1) 300,000 shares of 12% Redeemable Preferred Stock and (2) warrants to purchase a number of shares of our common stock equal to the product of 3.75% times the total number of shares of our common stock outstanding as of the closing of the Private Placement, with an initial exercise price per share of $0.01, for an aggregate purchase price of $289.5 million. We intend to use the net proceeds from the Private Placement for general corporate purposes, including the funding of working capital requirements. The closing of the Private Placement is expected to occur on or about November 29, 2018, subject to certain closing conditions. The Redeemable Preferred Stock will rank senior to our common stock with respect to the payment of dividends and distribution of assets upon liquidation, dissolution and winding up.
Also on October 30, 2018, we, as a guarantor, entered into a Letter of Credit Agreement (the “Letter of Credit Agreement”) with McDermott Technology (Americas), Inc., McDermott Technology (US), Inc. and McDermott Technology, B.V., each a wholly owned subsidiary of ours, as co-applicants, and Barclays Bank PLC, as administrative agent. The Letter of Credit Agreement provides for a facility for extensions of credit in the form of performance letters of credit in the aggregate face amount of up to $230 million (the “LC Facility”). Before any letters of credit can be issued under the LC Facility, we must have received the proceeds from the Private Placement and we must have satisfied other closing conditions that we believe are customary. The LC Facility is scheduled to mature three years after the initial utilization date thereunder. The obligations under the Letter of Credit Agreement will be unconditionally guaranteed on a senior secured basis by us and substantially all of our wholly owned subsidiaries, other than the co-applicants (which are directly obligated thereunder) and several captive insurance subsidiaries and certain other designated or immaterial subsidiaries. The liens securing the LC Facility will rank equal in priority with the liens securing obligations under the Credit Agreement. The Letter of Credit Agreement includes financial and other covenants and provisions relating to events of default that are substantially the same as those in the Credit Agreement.
|
|
46 |
|
MANAGEMENT’S DISCUSSION AND ANALYSIS OF FINANCIAL CONDITION AND RESULTS OF OPERATIONS
ITEM 2. MANAGEMENT’S DISCUSSION AND ANALYSIS OF FINANCIAL CONDITION AND RESULTS OF OPERATIONS
In this quarterly report on Form 10-Q, unless the context otherwise indicates, “McDermott”, “MDR”, “we,” “our”, “us” or the “Company” mean McDermott International, Inc. and its consolidated subsidiaries.
CAUTIONARY STATEMENT CONCERNING FORWARD-LOOKING STATEMENTS
We are including the following discussion to inform our existing and potential security holders generally of some of the risks and uncertainties that can affect our company and to take advantage of the “safe harbor” protection for forward-looking statements that applicable federal securities law affords. This information should be read in conjunction with the unaudited Consolidated Financial Statements and the Notes thereto included in Item 1 of this report and the audited Consolidated Financial Statements and the related Notes and Item 7 “Management’s Discussion and Analysis of Financial Condition and Results of Operations” included in our Current Report on Form 8-K filed with the U.S. Securities and Exchange Commission (the “SEC”) on July 31, 2018 (the “July 31 Form 8-K”).
From time to time, our management or persons acting on our behalf make “forward-looking statements,” within the meaning of the Private Securities Litigation Reform Act of 1995, to inform existing and potential security holders about our company. These statements may include projections and estimates concerning the scope, execution, timing and success of specific projects and our future RPOs, revenues, income and capital spending. Forward-looking statements are generally accompanied by words such as “achieve,” “anticipate,” “believe,” “continue,” “could,” “estimate,” “expect,” “forecast,” “goal,” “intend,” “may,” “might,” “plan,” “potential,” “predict,” “project,” “seek,” “should,” “strategy” or other words that convey the uncertainty of future events or outcomes. Sometimes we will specifically describe a statement as being a forward-looking statement and refer to this cautionary statement.
In addition, various statements in this report, including those that express a belief, expectation or intention, as well as those that are not statements of historical fact, are forward-looking statements. Those forward-looking statements appear in the Notes to our Condensed Consolidated Financial Statements (the “Financial Statements”) in Item 1 of this report, in this Management’s Discussion and Analysis of Financial Condition and Results of Operations, Legal Proceedings in Item 1 of Part II of this report and elsewhere in this report.
These forward-looking statements include, but are not limited to, statements that relate to, or statements that are subject to risks, contingencies or uncertainties that relate to:
|
|
• |
expectations regarding our recently completed business combination with Chicago Bridge & Iron Company N.V. (“CB&I”) described in Note 3, Business Combination, to the Financial Statements included in this report and the anticipated benefits of combining CB&I’s business with McDermott’s business; |
|
|
• |
future levels of revenues, operating margins, operating income, cash flows, net income or earnings per share; |
|
|
• |
the outcome of project awards and scope, execution and timing of specific projects, including timing to complete and cost to complete these projects; |
|
|
• |
future project activities, including the commencement and subsequent timing of, and the success of, operational activities on specific projects, and the ability of projects to generate sufficient revenues to cover our fixed costs; |
|
|
• |
estimates of revenue over time and contract profits or losses; |
|
|
• |
expectations regarding the sales of our storage tanks and U.S. pipe fabrication businesses and the timing of, and use of proceeds from, those transactions. |
|
|
• |
anticipated levels of demand for our products and services; |
|
|
• |
global demand for oil and gas and fundamentals of the oil and gas industry; |
|
|
• |
expectations regarding offshore development of oil and gas; |
|
|
• |
market outlook for the engineering, procurement, construction and installation (“EPCI”) market; |
|
|
• |
expectations regarding cash flows from operating activities; |
|
|
• |
expectations regarding remaining performance obligations; |
|
|
47 |
|
MANAGEMENT’S DISCUSSION AND ANALYSIS OF FINANCIAL CONDITION AND RESULTS OF OPERATIONS
|
|
• |
the success or timing of completion of ongoing or anticipated capital or maintenance projects; |
|
|
• |
the adequacy of our sources of liquidity and capital resources; |
|
|
• |
interest expense; |
|
|
• |
the effectiveness of our derivative contracts in mitigating foreign currency and interest rate risks; |
|
|
• |
results of our capital investment program; |
|
|
• |
expectations regarding the acquisition or divestiture of assets; |
|
|
• |
the impact of U.S. tax reform on our tax position; |
|
|
• |
the potential effects of judicial or other proceedings on our business, financial condition, results of operations and cash flows; and |
|
|
• |
the anticipated effects of actions of third parties such as competitors, or federal, foreign, state or local regulatory authorities, or plaintiffs in litigation. |
These forward-looking statements speak only as of the date of report; we disclaim any obligation to update these statements unless required by securities law, and we caution you not to rely on them unduly. We have based these forward-looking statements on our current expectations and assumptions about future events. While our management considers these expectations and assumptions to be reasonable, they are inherently subject to significant business, economic, competitive, regulatory and other risks, contingencies and uncertainties, most of which are difficult to predict and many of which are beyond our control. These risks, contingencies and uncertainties relate to, among other matters, the following:
|
|
• |
general economic and business conditions and industry trends; |
|
|
• |
general developments in the industries in which we are involved; |
|
|
• |
the volatility of oil and gas prices; |
|
|
• |
decisions about capital investment to be made by oil and gas companies and other participants in the energy and natural resource industries, demand from which is the largest component of our revenues; |
|
|
• |
other factors affecting future levels of demand, including investments across the natural gas value chain, including liquefied natural gas (“LNG”) and petrochemicals, investments in power and petrochemical facilities and investments in various types of facilities that require storage structures and pre-fabricated pipe; |
|
|
• |
the highly competitive nature of the businesses in which we are engaged; |
|
|
• |
uncertainties as to timing and funding of new contract awards; |
|
|
• |
our ability to appropriately bid, estimate and effectively perform projects on time, in accordance with the schedules established by the applicable contracts with customers; |
|
|
• |
changes in project design or schedule; |
|
|
• |
changes in scope or timing of work to be completed under contracts; |
|
|
• |
cost overruns on fixed-price or similar contracts or failure to receive timely or proper payments on cost-reimbursable contracts, whether as a result of improper estimates, performance, disputes or otherwise; |
|
|
• |
changes in the costs or availability of, or delivery schedule for, equipment, components, materials, labor or subcontractors; |
|
|
• |
risks associated with labor productivity; |
|
|
• |
cancellations of contracts, change orders and other modifications and related adjustments to RPOs and the resulting impact from using RPOs as an indicator of future revenues or earnings; |
|
|
• |
the collectability of amounts reflected in change orders and claims relating to work previously performed on contracts; |
|
|
• |
our ability to settle or negotiate unapproved change orders and claims and estimates regarding liquidated damages; |
|
|
48 |
|
MANAGEMENT’S DISCUSSION AND ANALYSIS OF FINANCIAL CONDITION AND RESULTS OF OPERATIONS
|
|
• |
the capital investment required to construct new-build vessels and maintain and/or upgrade our existing fleet of vessels; |
|
|
• |
the ability of our suppliers and subcontractors to deliver raw materials in sufficient quantities and/or perform in a timely manner; |
|
|
• |
volatility and uncertainty of the credit markets; |
|
|
• |
our ability to comply with covenants in our credit agreements and other debt instruments and the availability, terms and deployment of capital; |
|
|
• |
the unfunded liabilities of our pension and other post-retirement plans, which may negatively impact our liquidity and, depending upon future operations, may impact our ability to fund our pension obligations; |
|
|
• |
the continued availability of qualified personnel; |
|
|
• |
the operating risks normally incident to our lines of business, which could lead to increased costs and affect the quality, costs or availability of, or delivery schedule for, equipment, components, materials, labor or subcontractors and give rise to contractually imposed liquidated damages; |
|
|
• |
natural or man-caused disruptive events that could damage our facilities, equipment or our work-in-progress and cause us to incur losses and/or liabilities; |
|
|
• |
equipment failure; |
|
|
• |
changes in, or our failure or inability to comply with, government regulations; |
|
|
• |
adverse outcomes from legal and regulatory proceedings; |
|
|
• |
impact of potential regional, national and/or global requirements to significantly limit or reduce greenhouse gas and other emissions in the future; |
|
|
• |
changes in, and liabilities relating to, existing or future environmental regulatory matters; |
|
|
• |
changes in tax laws; |
|
|
• |
the continued competitiveness and availability of, and continued demand and legal protection for, our intellectual property assets or rights, including the ability of our patents or licensed technologies to perform as expected and to remain competitive, current, in demand, profitable and enforceable; |
|
|
• |
our ability to keep pace with rapid technological changes or innovations; |
|
|
• |
the risk that we may not be successful in updating and replacing current information technology and the risks associated with information technology systems interruptions and cybersecurity threats; |
|
|
• |
the consequences of significant changes in interest rates and currency exchange rates; |
|
|
• |
difficulties we may encounter in obtaining regulatory or other necessary approvals of any strategic transactions; |
|
|
• |
the risks associated with integrating acquired businesses and forming and operating joint ventures; |
|
|
• |
social, political and economic situations in countries where we do business; |
|
|
• |
the risks associated with our international operations, including risks relating to local content or similar requirements; |
|
|
• |
foreign currency and interest rate risks and our ability to properly manage or hedge such or similar risks; |
|
|
• |
interference from adverse weather or sea conditions; |
|
|
• |
the possibilities of war, other armed conflicts or terrorist attacks; |
|
|
• |
the effects of asserted and unasserted claims and the extent of available insurance coverages; |
|
|
• |
our ability to obtain surety bonds, letters of credit and new financing arrangements; |
|
|
49 |
|
MANAGEMENT’S DISCUSSION AND ANALYSIS OF FINANCIAL CONDITION AND RESULTS OF OPERATIONS
|
|
• |
our ability to maintain builder’s risk, liability, property and other insurance in amounts and on terms we consider adequate and at rates that we consider economical; |
|
|
• |
the aggregated risks retained in our captive insurance subsidiaries; and |
|
|
• |
the impact of the loss of insurance rights as part of the Chapter 11 Bankruptcy settlement concluded in 2006 involving several of our former subsidiaries. |
We believe the items we have outlined above are important factors that could cause estimates in our financial statements to differ materially from actual results and those expressed in a forward-looking statement made in this quarterly report or elsewhere by us or on our behalf. We have discussed many of these factors in more detail elsewhere in this report, including those mentioned under the caption “Risk Factors” in this report and in our annual report on Form 10-K for the year ended December 31, 2017 (the “2017 Form 10-K”) and subsequent filings on Form 10-Q. These factors are not necessarily all the factors that could affect us. Unpredictable or unanticipated factors we have not discussed in this report or those other reports could also have material adverse effects on actual results of matters that are the subject of our forward-looking statements. We do not intend to update our description of important factors each time a potential important factor arises, except as required by applicable securities laws and regulations. We advise our security holders that they should (1) be aware that factors not referred to above could affect the accuracy of our forward-looking statements and (2) use caution and common sense when considering our forward-looking statements.
Company Overview
Overview
On May 10, 2018 (the “Combination Date”), we completed our combination with CB&I (the “Combination”) (see Note 3, Business Combination to the accompanying condensed consolidated financial statements (the “Financial Statements”) for further discussion). We are now a fully integrated provider of EPCI and technology solutions to the energy industry and design and build end-to-end infrastructure and technology solutions to transport and transform oil and gas into a variety of products. Our customers include national, major integrated and other oil and gas companies as well as producers of petrochemicals and electric power. Our proprietary technologies, integrated expertise and comprehensive solutions are utilized for LNG, power, offshore and subsea, and downstream (includes downstream oil and gas processing facilities and licensed technologies and catalysts) energy projects around the world. We execute our contracts through a variety of methods, principally fixed-price, but also including cost reimbursable, cost-plus, day-rate and unit-rate basis or some combination of those methods. Contracts are awarded usually awarded through a competitive bid process.
Business Segments
Following completion of the Combination, during the second quarter of 2018, we reorganized our operations into five business segments. This reorganization is intended to better serve our global clients, leverage our workforce, help streamline operations and provide enhanced growth opportunities. Our five business segments, which represent our reportable segments are: North, Central & South America (“NCSA”); Europe, Africa, Russia & the Caspian (“EARC”); Middle East & North Africa (“MENA”); Asia Pacific (“APAC”); and Technology. The segment information presented for the prior periods has been recast to conform to the 2018 presentation. We also report certain corporate and other non-operating activities under the heading “Corporate and Other.” Corporate and Other primarily reflects costs that are not allocated to our segments.
|
|
• |
NCSA—Our NCSA segment designs, engineers and constructs upstream offshore oil & gas facilities, downstream oil & gas facilities, gas-fired power plants, LNG import and export terminals, atmospheric and refrigerated storage vessels and terminals, water storage and treatment facilities and pipe and module fabrication. Our September 30, 2018 RPO composition by product offering was 47% Downstream, 24% LNG, 25% Power and 4% Offshore & Subsea. We anticipate the majority of future opportunities over the intermediate term are likely to be in the U.S. LNG and petrochemical markets. Our September 30, 2018 RPO distribution for this segment by contracting type was approximately 92% fixed-price and hybrid and 8% cost-reimbursable. |
|
|
• |
EARC―Our EARC segment designs, engineers and constructs upstream offshore oil & gas facilities, downstream oil & gas facilities, LNG import and export terminals, and atmospheric and refrigerated storage vessels and terminals. Our September 30, 2018 RPO composition by product offering was 45% Offshore & Subsea and 55% Downstream and was primarily comprised of fixed-price contracts. We anticipate the majority of future opportunities over the intermediate term are likely to be in the downstream oil & gas markets in Russia and upstream and LNG projects in Africa. |
|
|
50 |
|
MANAGEMENT’S DISCUSSION AND ANALYSIS OF FINANCIAL CONDITION AND RESULTS OF OPERATIONS
|
|
• |
APAC—Our APAC segment designs, engineers and constructs upstream offshore oil & gas facilities and pipelines, refining and petrochemical facilities, hydrocarbon processing technology, LNG import and export terminals and atmospheric and refrigerated storage vessels and terminals. Our September 30, 2018 RPO composition by product offering was 88% Offshore & Subsea and 12% Downstream, which was primarily comprised of fixed-price contracts. We anticipate the majority of future opportunities over the intermediate term are likely to be in the Indian offshore market. |
|
|
• |
Technology―Our Technology segment is a leading technology licensor of proprietary gas processing, refining, petrochemical and coal gasification technologies as well as a supplier of proprietary catalysts, equipment and related engineering services. These technologies are critical in the refining of crude oil into gasoline, diesel, jet fuel and lubes, the manufacturing of petrochemicals and polymers, as well as the gasification of coal into syngas. Technology also has a 50% owned unconsolidated joint venture that provides proprietary process technology licenses and associated engineering services and catalysts, primarily for the refining industry. Our September 30, 2018 RPO distribution for this segment was 100% Downstream and primarily comprised of fixed-price contracts. |
Loss Projects
Based on our assessment at September 30, 2018, included in the preliminary purchase price allocation for the Combination (see Note 3, Business Combination, to the Financial Statements) were four projects determined to be in substantial loss positions, which included the Cameron LNG, Freeport LNG Trains 1 & 2, Calpine and the now-completed IPL gas power projects. Based on our assessment at June 30, 2018, our Freeport LNG Trains 1 & 2 project was not estimated to be in a loss position; however, as a result of changes in estimates during the third quarter of 2018, the project is now estimated to be in a loss position at completion. Our Freeport LNG Train 3 project is not anticipated to be in a loss position. Changes since our initial preliminary assessments during the second quarter of 2018 reflect unfavorable changes in estimates of $482 million on the Cameron LNG project, $194 million on the Freeport LNG Trains 1 & 2 and Train 3 projects and $68 million on the Calpine project. These changes in estimates did not have a significant direct impact on our net income for the three or nine months ended September 30, 2018, as the impact of the changes in estimates were included as adjustments to the fair values reflected in the acquired balance sheet.
Summary information for our significant ongoing loss projects as of September 30, 2018 is as follows:
Cameron LNG―At September 30, 2018, our U.S. LNG export facility project in Hackberry, Louisiana for Cameron LNG (within our NCSA operating group) was in a loss position. As of September 30, 2018, the project was approximately 37% complete on a post-Combination basis (approximately 83% on a pre-Combination basis) and had an accrued provision for estimated losses of approximately $127 million.
The increase in our cost estimates recorded as adjustments to the fair value of the acquired balance sheet during the third quarter of 2018 were primarily due to changes in estimates resulting from a detailed reassessment of schedule and underlying cost base. The schedule analysis included a reassessment of the work to go, including re-work for which we may not be fully compensated, and took into account revisions to the estimation of productivity based on historical efforts and the quality and availability of labor resources throughout the revised project schedule. The revised schedule also results in loss of incentive revenue (approximately $40 million) and the application of contractual liquidated damages (approximately $17 million). These changes in estimates were reflected as adjustments to the fair values of various assets and liabilities reflected in the acquired balance sheet, as they resulted from refinements of estimates of conditions that existed as of the Combination Date, and primarily impacted Advance billings on contracts.
Freeport LNG―At September 30, 2018, Trains 1 & 2 of our U.S. LNG export facility project in Freeport, Texas for Freeport LNG (within our NCSA operating group) was in a loss position. As of September 30, 2018, the project was approximately 43% complete on a post-Combination basis (approximately 86% on a pre-Combination basis) and had an accrued provision for estimated losses of approximately $28 million.
|
|
51 |
|
MANAGEMENT’S DISCUSSION AND ANALYSIS OF FINANCIAL CONDITION AND RESULTS OF OPERATIONS
The increase in the cost estimates recorded as adjustments to the fair value of the acquired balance sheet during the third quarter of 2018 were primarily due to changes in estimates resulting from a detailed reassessment of schedule and underlying cost base. The schedule analysis included a reassessment of the work to go, including re-work for which we may not be fully compensated, and took into account revisions to the estimation of productivity based on historical efforts and the quality and availability of labor resources throughout the revised project schedule. Our changes in estimates for the project also reflect our decision, reached in conjunction with ongoing customer discussions, to include liquidated damages (approximately $53 million) associated with the pre-Hurricane Harvey schedule. These changes in estimates were reflected as adjustments to the fair values of various assets and liabilities reflected in the acquired balance sheet, as they resulted from refinements of estimates of conditions that existed as of the Combination Date, and primarily impacted Advance billings on contracts.
Calpine Power Project―At September 30, 2018, our U.S. gas turbine power project in the Northeast for Calpine (within our NCSA operating group) was in a loss position. As of September 30, 2018, the project was approximately 53% complete on a post-Combination basis (approximately 91% on a pre-Combination basis) and had an accrued provision for estimated losses of approximately $43 million. The increase in the cost estimates recorded as adjustments to the fair value of the acquired balance sheet during the third quarter of 2018 were primarily associated with revisions to the estimation of productivity based on historical performance. These changes in estimates were reflected as adjustments to the fair values of various assets and liabilities reflected in the acquired balance sheet, as they resulted from refinements of estimates of conditions that existed as of the Combination Date, and primarily impacted Advance billings on contracts.
As discussed in “–Liquidity and Capital Resources” below, in order to maintain our ability to pursue the business opportunities from the strong order flow we are projecting, notwithstanding the usage of our working capital and capital resources to fund the payment of the increased costs on the three legacy loss projects described above, we have entered into new financing arrangements involving, among other things, the issuance of redeemable preferred stock and new letter of credit capacity. See “–Liquidity and Capital Resources” for more discussion of those arrangements.
Strategic Review of Business Portfolio
We have performed a strategic review of our business portfolio, which included businesses acquired in the Combination. Our review included a focus on the Technology business pull-through and differentiated vertical combination capabilities to determine if any portions of our business are non-core for purposes of our vertically integrated offering model. As a result of our review, we identified our storage tank and U.S. pipe fabrication businesses as non-core for purposes of our vertically integrated offering model. As a result and in view of the considerations discussed below under “Liquidity and Capital Resources,” we are developing plans to seek buyers for each of the two businesses, which are subject to approval by our Board of Directors. We expect proceeds resulting from sales of these businesses would be utilized to reduce our outstanding debt.
Results of Operations
Remaining Performance Obligations (“RPOs”)
RPOs represent the amount of revenues we expect to recognize in the future from our contract commitments on projects. RPOs include the entire expected revenue values for joint ventures we consolidate and our proportionate values for consortiums we proportionately consolidate. We do not include expected revenues of contracts related to unconsolidated joint ventures in our RPOs, except to the extent of any subcontract awards we receive from those joint ventures.
RPOs for each of our segments can consist of up to several hundred contracts. These contracts vary in size from less than one hundred thousand dollars in contract value to several billion dollars, with varying durations that can exceed five years. The timing of awards and differing types, sizes and durations of our contracts, combined with the geographic diversity and stages of completion of the associated projects, often results in fluctuations in our quarterly segment results as a percentage of total revenue. RPOs may not be indicative of future operating results, and projects in our RPOs may be cancelled, modified or otherwise altered by customers. We can provide no assurance as to the profitability of our contracts reflected in RPOs. It is possible that our estimates of profit could increase or decrease based on, among other things, changes in productivity, actual downtime and the resolution of change orders and claims with the customers.
The timing of our revenue recognition may be impacted by the contracting structure of our contracts. Under fixed-price contracts, we perform our services and execute our projects at an established price. Fixed-price contracts, and hybrid contracts with a more significant fixed-price component, tend to provide us with greater control over project schedule and the timing of when work is performed and costs are incurred, and, accordingly, when revenue is recognized. Under cost-reimbursable contracts, we generally
|
|
52 |
|
MANAGEMENT’S DISCUSSION AND ANALYSIS OF FINANCIAL CONDITION AND RESULTS OF OPERATIONS
perform our services in exchange for a price that consists of reimbursement of all customer-approved costs and a profit component, which is typically a fixed rate per hour, an overall fixed fee or a percentage of total reimbursable costs. Cost-reimbursable contracts, and hybrid contracts with a more significant cost-reimbursable component, generally provide our customers with greater influence over the timing of when we perform our work, and, accordingly, such contracts often result in less predictability with respect to the timing of revenue recognition. Our shorter-term contracts and services are generally provided on a cost-reimbursable, fixed-price or unit price basis.
Our RPOs by business segment as of September 30, 2018 and December 31, 2017 were as follows:
|
|
September 30, 2018 |
|
|
December 31, 2017 |
|
|
|
|
Change (2) |
|
|||||||||||||||
|
|
(In approximate millions) |
|
|
|
|
|
|
|
|
|
|
|
|||||||||||||
|
NCSA (1) |
$ |
6,519 |
|
|
|
57 |
% |
|
$ |
437 |
|
|
|
11 |
% |
|
|
|
$ |
6,082 |
|
|
|
1392 |
|
|
EARC |
|
1,502 |
|
|
|
13 |
% |
|
|
732 |
|
|
|
19 |
% |
|
|
|
|
770 |
|
|
|
105 |
|
|
MENA |
|
2,164 |
|
|
|
19 |
% |
|
|
2,249 |
|
|
|
58 |
% |
|
|
|
|
(85 |
) |
|
|
-4 |
|
|
APAC |
|
713 |
|
|
|
6 |
% |
|
|
483 |
|
|
|
12 |
% |
|
|
|
|
230 |
|
|
|
48 |
|
|
Technology |
|
614 |
|
|
|
5 |
% |
|
|
- |
|
|
|
- |
|
|
|
|
|
614 |
|
|
|
NA |
|
|
Total |
$ |
11,512 |
|
|
|
100 |
% |
|
$ |
3,901 |
|
|
|
100 |
% |
|
|
|
$ |
7,611 |
|
|
|
195 |
% |
|
(1) |
Certain contracts within our NCSA segment are dependent upon funding from the U.S. government, where funds are appropriated on a year-by-year basis, while contract performance may take more than one year. RPOs at September 30, 2018 for contractual commitments that are subject to future funding approval requirements were not material. |
|
(2) |
Our RPOs increased by $7.6 billion from December 31, 2017 primarily due to the Combination, offset by revenues of $4.6 billion exceeding awards of $4.2 billion. We reviewed the RPOs acquired through the Combination to ensure consistency in the application of our policies regarding revenues dependent upon one or more future events; and made adjustments related to our purchase accounting estimates. As a result, the RPO balance on the Combination Date included a net reduction of approximately $224 million with respect to the acquired RPOs. This adjustment to the opening RPOs was not the result of contract cancellations. |
Of the September 30, 2018 RPOs, we expect to recognize revenues as follows:
|
|
2018 |
|
|
2019 |
|
|
Thereafter |
|
|||
|
|
(In approximate millions) |
|
|||||||||
|
Total RPOs |
$ |
2,288 |
|
|
$ |
6,158 |
|
|
$ |
3,066 |
|
See Note 4, Revenue Recognition, to the Financial Statements for further discussion of our RPOs.
Three Months Ended September 30, 2018 vs Three Months Ended September 30, 2017
Revenues
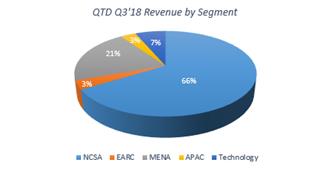
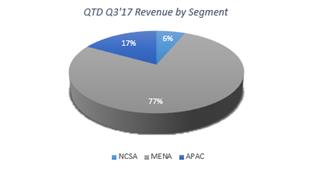
|
|
53 |
|
MANAGEMENT’S DISCUSSION AND ANALYSIS OF FINANCIAL CONDITION AND RESULTS OF OPERATIONS
Revenues increased by 139%, or $1.3 billion, in the third quarter of 2018 compared to the third quarter of 2017. Our third quarter 2018 revenues benefited by $1.7 billion from the impact of the Combination.
|
|
Three Months Ended September 30, |
|
|
|
|
|
|
|
|
|
|
|||||
|
|
|
2018 |
|
|
|
2017 |
|
|
|
Change |
|
|
||||
|
|
|
(In millions) |
|
|
|
Percentage |
|
|
||||||||
|
Revenues: |
|
|
|
|
|
|
|
|
|
|
|
|
|
|
|
|
|
NCSA |
$ |
1,516 |
|
|
$ |
61 |
|
|
$ |
1,455 |
|
|
|
2,385 |
|
% |
|
EARC |
|
77 |
|
|
|
- |
|
|
|
77 |
|
|
|
NA |
|
|
|
MENA |
|
473 |
|
|
|
736 |
|
|
|
(263 |
) |
|
|
(36 |
) |
|
|
APAC |
|
75 |
|
|
|
162 |
|
|
|
(87 |
) |
|
|
(54 |
) |
|
|
Technology |
|
148 |
|
|
|
- |
|
|
|
148 |
|
|
NA |
|
|
|
|
Total |
$ |
2,289 |
|
|
$ |
959 |
|
|
$ |
1,330 |
|
|
|
139 |
|
% |
NCSA—Revenues increased by 2,385%, or $1.5 billion, in the third quarter of 2018 (including $1.4 billion from the impact of the Combination) compared to the third quarter of 2017.
In the third quarter of 2018, a variety of projects and activities contributed to revenues, including:
|
|
• |
construction progress on our two U.S. LNG export facility projects (approximately $540 million combined); |
|
|
• |
construction progress on our ethane projects in Texas and Louisiana (approximately $400 million combined); |
|
|
• |
our power projects in the U.S.; |
|
|
• |
fabrication and marine activity progress on the Abkatun-A2 platform, a turnkey EPCI project in the Gulf of Mexico; and |
|
|
• |
various other projects in the U.S. |
In the third quarter of 2017, a variety of projects and activities contributed to revenues, including:
|
|
• |
fabrication activity progress on the Abkatun-A2 platform, a Pemex EPCI turnkey project in the Gulf of Mexico, which was awarded in the second quarter of 2016; |
|
|
• |
commencement of fabrication activity on BP Angelin, an EPCI gas field project off the east coast of Trinidad and Tobago, which was awarded in June 2017; and |
|
|
• |
progress on the Hess Corporation Penn State Deep (“PSD”) subsea-tieback project in the Gulf of Mexico, which was awarded in the first quarter of 2017. |
EARC—Revenues were $77 million in the third quarter of 2018 (including $52 million from the impact of the Combination). In the third quarter of 2018, a variety of projects and activities contributed to revenues, including:
|
|
• |
commencement in 2018 of the Maersk Olie og Gas A/S Tyra Redevelopment EPCI project, awarded in the fourth quarter of 2017; |
|
|
• |
mobilization activities for an oil refinery expansion project in Russia; |
|
|
• |
engineering, procurement and supply of process equipment for a deep conversion complex built at a refinery in central Russia; and |
|
|
• |
various other projects. |
MENA—Revenues decreased by 36%, or $263 million, in the third quarter of 2018 compared to the third quarter of 2017. Revenues in the third quarter of 2018 included $101 million as a result of the impact of the Combination.
In the third quarter of 2018, a variety of projects and activities contributed to revenues, including:
|
|
• |
ongoing structural demolition / installation works by our DB 32 and DB 30 vessels on the Saudi Aramco Safaniya phase 5 project; |
|
|
• |
engineering, fabrication and procurement progress on the Saudi Aramco Safaniya phase 6 project, awarded in the fourth quarter of 2017; |
|
|
54 |
|
MANAGEMENT’S DISCUSSION AND ANALYSIS OF FINANCIAL CONDITION AND RESULTS OF OPERATIONS
|
|
• |
fabrication, procurement progress and offshore installation of four of the 13 jackets by our DB27 and DB 30 vessels on our Saudi Aramco 13 Jackets project, awarded in the first quarter of 2018; |
|
|
• |
engineering and procurement progress on the Abu Dhabi National Oil Company crude flexibility project in Ruwais, UAE, awarded in the first quarter of 2018; |
|
|
• |
engineering, fabrication and procurement progress on the Bul Hanine EPCI project for Qatar Petroleum, awarded in the fourth quarter of 2017; |
|
|
• |
pipeline and valve skids installations, tie-ins by our Thebaud sea vessel and completion of hookup and pre-commissioning activities on the Saudi Aramco Header 9 Facilities project; |
|
|
• |
engineering, procurement and construction progress on the LIWA EPC project for Oman Oil Refineries and Petroleum Industries Company (“ORPIC “); and |
|
|
• |
various other projects. |
In the third quarter of 2017, a variety of projects and activities contributed to revenues, including:
|
|
• |
higher fabrication and marine activities on the lump-sum EPCI project under the second Saudi Aramco Long-Term Agreement (“LTA II”); |
|
|
• |
marine campaign undertaken for jacket installation by our DB 27 vessel and deck installation by dual lift with our DB 27 and DB 30 vessels, as well as hook-up work on our Saudi Aramco Marjan power system replacement project; |
|
|
• |
marine campaign for hookup activities on two Saudi Aramco EPCI projects; |
|
|
• |
increase in marine campaign activities on the Saudi Aramco nine jackets project; |
|
|
• |
engineering and fabrication progress on the Saudi Aramco four jackets and three observation platforms project, which was awarded in the fourth quarter of 2016; |
|
|
• |
engineering and fabrication progress on the Saudi Aramco Safaniya phase 5 project, which was awarded in the fourth quarter of 2016; and |
|
|
• |
marine campaign for valve skid installation on pipeline, spool and risers for a flow assurance project in the Middle East. |
APAC—Revenues decreased by 54%, or $87 million, in the third quarter of 2018 compared to the third quarter of 2017, primarily due to a reduction in the number of active projects. Revenues increased by $33 million as a result of the impact of the Combination.
In the third quarter of 2018, a variety of projects and activities contributed to revenues, including:
|
|
• |
completion of pipelay campaign and offshore construction on the Greater Western Flank Phase 2 project in Australia; |
|
|
• |
progress on the engineering, fabrication and construction contract with JG Summit Petrochemical Corporation (“JGSPC”) for the Stage 1 Expansion project in the Philippines; and |
|
|
• |
commencement of activities on a subsea installation project in India, awarded in the fourth quarter of 2017. |
In the third quarter of 2017, a variety of projects and activities contributed to revenues, including:
|
|
• |
completion of floater mooring campaign and umbilical lay by our LV 108 vessel on Ichthys, a multi-year EPCI project in Australia; and |
|
|
• |
marine installation activities undertaken on the Vashishta subsea field infrastructure development EPCI project in India. |
Technology—Revenues in the third quarter of 2018 were $148 million (all of which resulted from the Combination) and were primarily associated with licensing and proprietary equipment activities in the petrochemical and refining markets.
|
|
55 |
|
MANAGEMENT’S DISCUSSION AND ANALYSIS OF FINANCIAL CONDITION AND RESULTS OF OPERATIONS
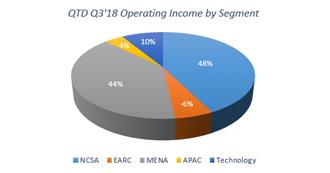

Segment operating income increased by 14%, or $25 million, in the third quarter of 2018 compared to the third quarter of 2017. Our third quarter 2018 operating income benefited by $121 million from the impact of the Combination (including $68 million of project related and other intangible assets and investment in unconsolidated affiliates related amortization), primarily within our Technology and NCSA segments.
|
|
|
Three Months Ended September 30, |
|
|
|
|
|
|
|
|
|
|
||||
|
|
|
2018 |
|
|
|
2017 |
|
|
|
Change |
|
|
||||
|
|
|
(In millions) |
|
|
|
Percentage |
|
|
||||||||
|
Segment operating income: |
|
|
|
|
|
|
|
|
|
|
|
|
|
|
|
|
|
NCSA |
$ |
97 |
|
|
$ |
(3 |
) |
|
$ |
100 |
|
|
|
3,333 |
|
% |
|
EARC |
|
(13 |
) |
|
|
(5 |
) |
|
|
(8 |
) |
|
|
(160 |
) |
|
|
MENA |
|
89 |
|
|
|
164 |
|
|
|
(75 |
) |
|
|
(46 |
) |
|
|
APAC |
|
9 |
|
|
|
21 |
|
|
|
(12 |
) |
|
|
(57 |
) |
|
|
Technology |
|
20 |
|
|
|
- |
|
|
|
20 |
|
|
NA |
|
|
|
|
Total |
$ |
202 |
|
|
$ |
177 |
|
|
$ |
25 |
|
|
|
14 |
|
% |
NCSA—Segment operating income (loss) in the third quarter of 2018 and 2017 was $97 million and ($3) million, respectively. The impact of the Combination generated approximately $103 million of operating income during the third quarter of 2018 (including $12 million of project related and other intangible assets amortization).
In the third quarter of 2018, a variety of projects and activities contributed to operating income, including:
|
|
• |
construction progress and cost savings on our ethane projects in Texas and Louisiana; |
|
|
• |
our power projects in the U.S.; and |
|
|
• |
various other projects in the U.S. |
During the third quarter of 2018, our two U.S. LNG export facility projects and our gas turbine power projects in the Midwest and Northeast did not materially contribute to our operating margin.
Our operating loss in the third quarter of 2017 was primarily due to a reduction in the number of active projects (as selling, general and administrative expenses were not reduced proportionally).
EARC—Segment operating losses in the third quarter of 2018 and 2017 were $13 million and $5 million, respectively. Our third quarter 2018 operating loss included $6 million from the impact of the Combination (including $5 million of project related and other intangible assets amortization).
In the third quarter of 2018, our operating loss was primarily attributable to our project results being offset by project related and other intangible assets amortization, selling, general and administrative expenses and losses from the investment in the io Oil and Gas unconsolidated joint venture.
|
|
56 |
|
MANAGEMENT’S DISCUSSION AND ANALYSIS OF FINANCIAL CONDITION AND RESULTS OF OPERATIONS
In the third quarter of 2017, our operating loss was primarily attributable to a reduction in the number of active projects (as selling, general and administrative expenses were not reduced proportionally) and losses from the investment in the io Oil and Gas unconsolidated joint venture.
MENA—Segment operating income in the third quarter of 2018 and 2017 was $89 million and $164 million, respectively. Our third quarter 2018 operating income benefited by $5 million from the impact of the Combination (including $7 million of project related and other intangible assets and investment in unconsolidated affiliate related amortization).
In the third quarter of 2018, a variety of projects and activities contributed to operating income, including:
|
|
• |
ongoing structural demolition and installation works by our DB 32 and DB 30 vessels on the Saudi Aramco Safaniya phase 5 project, as well as productivity improvements and cost savings on the project; |
|
|
• |
engineering, fabrication and procurement progress on the Saudi Aramco Safaniya phase 6 project, awarded in the fourth quarter of 2017; |
|
|
• |
pipeline and valve skids installations and tie-in activities by our Thebaud sea vessel and completion of hook up and pre-commissioning activities on the Saudi Aramco Header 9 Facilities project, as well as productivity improvements and cost savings on the project; |
|
|
• |
engineering and procurement progress on Abu Dhabi National Oil Company crude flexibility project in Ruwais, UAE, awarded in the first quarter of 2018; |
|
|
• |
engineering, procurement and construction progress on the LIWA EPC project for ORPIC, as well as cost savings on the project; |
|
|
• |
various other projects; and |
|
|
• |
income from our unconsolidated joint venture with CTCI, partly offset by investment in unconsolidated affiliate related amortization. |
In the third quarter of 2017, a variety of projects and activities contributed to the increase in operating income, including:
|
|
• |
higher fabrication and marine activities on a Saudi Aramco lump-sum EPCI project under the LTA II; |
|
|
• |
the marine campaign undertaken for jacket installation by our DB 27 vessel and deck installation by dual lift with our DB 27 and DB 30 vessels, as well as hook-up work on our Saudi Aramco Marjan power system replacement project; |
|
|
• |
the marine campaign for hookup activities on two Saudi Aramco EPCI projects; |
|
|
• |
an increase in the marine campaign activities on the Saudi Aramco nine jackets project; and |
|
|
• |
the marine campaign for valve skid installation on pipeline, spool and risers for a flow assurance project in the Middle East. |
APAC—Segment operating income in the third quarter of 2018 and 2017 was $9 million and $21 million, respectively. APAC operating project results did not materially benefit from the impact of the Combination.
In the third quarter of 2018, a variety of projects and activities contributed to operating income, including:
|
|
• |
close-out improvements on the completion of the pipelay and offshore construction campaign on the Greater Western Flank Phase 2 project in Australia and various other projects. |
Segment operating income in the third quarter of 2017 was primarily driven by marine transportation and installation activities, as well as recognition of approved change orders on active projects and fabrication activity at our Batam yard. During the quarter ended September 30, 2017, the Vashishta project was adversely impacted by vessel and marine equipment downtime, which, in turn, impacted the segment’s operating margin.
|
|
57 |
|
MANAGEMENT’S DISCUSSION AND ANALYSIS OF FINANCIAL CONDITION AND RESULTS OF OPERATIONS
Technology—Segment operating income in the third quarter of 2018 was $20 million (including $43 million of project related and other intangible assets and investment in unconsolidated affiliate related amortization). The results were primarily associated with licensing and proprietary equipment activity in the petrochemicals market and included $4 million of income from our Chevron-Lummus Global (“CLG”) unconsolidated joint venture.
Corporate and Other
|
|
|
Three Months Ended September 30, |
|
|
|
|
|
|
|
|
|
|
||||
|
|
|
2018 |
|
|
|
2017 |
|
|
|
Change |
|
|
||||
|
|
|
(In thousands) |
|
|
|
Percentage |
|
|
||||||||
|
Corporate and Other |
$ |
(73 |
) |
|
$ |
(52 |
) |
|
$ |
(21 |
) |
|
|
(40 |
) |
% |
In the third quarter of 2018 and 2017, Corporate and Other expenses were $73 million and $52 million, respectively. The increase in Corporate and Other expenses was primarily due to the following 2018 charges resulting from the impact of the Combination:
|
|
• |
Restructuring and integration costs ($31 million) primarily related to costs to achieve our combination profitability initiative (“CPI”); and |
|
|
• |
Transaction costs ($5 million) primarily related to incremental employee related costs and professional fees associated with the Combination. |
See Note 3, Business Combination, and Note 11, Restructuring and Integration Costs, to the Financial Statements for further discussion of these costs.
Other Non-operating Items
Interest expense, net—Interest expense, net was $86 million and $12 million in the third quarter of 2018 and 2017, respectively. Interest expense, net in the third quarter of 2018 was primarily comprised of:
|
|
• |
$35 million of interest expense and $2 million of deferred debt issuance costs (“DIC”) amortization associated with the issuance of $1.3 billion principal amount of our 10.625% senior notes due 2024 (the “Senior Notes”); |
|
|
• |
$41 million of interest expense and $3 million of deferred DIC amortization associated with our $2.26 billion senior secured term loan facility (the “Term Facility”); and |
|
|
• |
$4 million of amortization of deferred DIC associated with our Revolving Credit Facility and LC Facility. |
Interest expense, net in the third quarter of 2017 was primarily associated with our 8.000% second-lien notes, which were redeemed in May 2018.
See Note 12, Debt, to the Financial Statements for further discussion.
Income tax expense—During the three months ended September 30, 2018, we recognized income tax expense of $44 million (effective tax rate of 99.5%), compared to tax expense of $19 million (effective tax rate of 16.8%) for the third quarter of 2017. Tax expense for the third quarter of 2018 was negatively impacted by losses in jurisdictions with no tax benefit ($41 million), partially offset by tax benefits related to research and development credits and other incentives ($7 million).
|
|
58 |
|
MANAGEMENT’S DISCUSSION AND ANALYSIS OF FINANCIAL CONDITION AND RESULTS OF OPERATIONS
Nine Months Ended September 30, 2018 vs Nine Months Ended September 30, 2017
Revenues

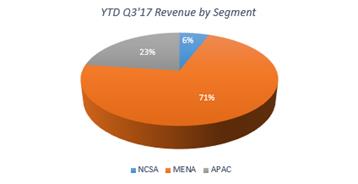
Revenues increased by 104%, or $2.4 billion, in the nine months ended September 30, 2018 compared to the nine months ended September 30, 2017. Our revenues for the 2018 period benefited by $2.8 billion from the impact of the Combination, primarily within our NCSA, EARC, MENA and Technology segments.
|
|
|
Nine Months Ended September 30, |
|
|
|
|
|
|
|
|
|
|
||||
|
|
|
2018 |
|
|
|
2017 |
|
|
|
Change |
|
|
||||
|
|
|
(In millions) |
|
|
|
Percentage |
|
|
||||||||
|
Revenues: |
|
|
|
|
|
|
|
|
|
|
|
|
|
|
|
|
|
NCSA |
$ |
2,609 |
|
|
$ |
131 |
|
|
$ |
2,478 |
|
|
|
1,892 |
|
% |
|
EARC |
|
151 |
|
|
|
18 |
|
|
|
133 |
|
|
|
739 |
|
|
|
MENA |
|
1,287 |
|
|
|
1,603 |
|
|
|
(316 |
) |
|
|
(20 |
) |
|
|
APAC |
|
332 |
|
|
|
515 |
|
|
|
(183 |
) |
|
|
(36 |
) |
|
|
Technology |
|
253 |
|
|
|
- |
|
|
|
253 |
|
|
NA |
|
|
|
|
Total revenues |
$ |
4,632 |
|
|
$ |
2,267 |
|
|
$ |
2,365 |
|
|
|
104 |
|
% |
NCSA—Revenues increased by 1,892%, or $2.5 billion, in the nine months ended September 30, 2018 (including $2.3 billion from the impact of the Combination) compared to the nine months ended September 30, 2017.
In the first nine months of 2018, a variety of projects and activities contributed to revenues, including:
|
|
• |
construction progress on our two U.S. LNG export facility projects (approximately $910 million combined); |
|
|
• |
construction progress on our ethane projects in Texas and Louisiana (approximately $660 million combined); |
|
|
• |
fabrication and marine activity progress on the Abkatun-A2 platform, a turnkey EPCI project in the Gulf of Mexico; |
|
|
• |
our power projects in the U.S.; and |
|
|
• |
various other projects in the U.S. |
In the first nine months of 2017, a variety of projects and activities contributed to revenues, including:
|
|
59 |
|
MANAGEMENT’S DISCUSSION AND ANALYSIS OF FINANCIAL CONDITION AND RESULTS OF OPERATIONS
|
|
• |
commencement of fabrication activity on the BP Angelin EPCI gas field project; and |
|
|
• |
progress on the Hess Corporation PSD subsea-tie back project in the Gulf of Mexico. |
EARC—Revenues increased by 739%, or $133 million, in the nine months ended September 30, 2018 (including $80 million from the impact of the Combination) compared to the nine months ended September 30, 2017.
In the nine months ended September 30, 2018, a variety of projects and activities contributed to revenues, including:
|
|
• |
the commencement in 2018 of the Maersk Olie og Gas A/S Tyra Redevelopment EPCI project, awarded in the fourth quarter of 2017; |
|
|
• |
engineering, procurement, and supply of process equipment for a deep conversion complex built at the refinery in central Russia; |
|
|
• |
mobilization activities for the oil refinery expansion project in Russia; |
|
|
• |
commencement and completion of the diving scope project for a refinery off the coast of Durban, South Africa; and |
|
|
• |
various other projects. |
In the nine months ended September 30, 2017, revenue was primarily associated with completion of activities on the Yamal project in the beginning of the second quarter of 2017.
MENA—Revenues decreased by 20%, or $316 million, in the nine months ended September 30, 2018 (including $151 million from the impact of the Combination) compared to the nine months ended September 30, 2017.
In the nine months ended September 30, 2018, a variety of projects and activities contributed to revenues, including:
|
|
• |
engineering, fabrication and procurement progress and ongoing structural demolition and installation works by our DB 32 and DB 30 vessels on the Saudi Aramco Safaniya phase 5 project; |
|
|
• |
marine hook-up activities utilizing a jack-up barge on the lump-sum EPCI project under the LTA II; |
|
|
• |
engineering, fabrication and procurement progress on the Saudi Aramco Safaniya phase 6 project, awarded in the fourth quarter of 2017; |
|
|
• |
engineering, fabrication, procurement progress and offshore installation of four of the 13 jackets by our DB27 and DB 30 vessels on the Saudi Aramco 13 Jackets project, awarded in the first quarter of 2018; |
|
|
• |
pipelay, deck installation, tie-ins, fabrication and hook up activities on the Saudi Aramco Header 9 Facilities project; |
|
|
• |
engineering, fabrication and procurement progress on the Bul Hanine EPCI project for Qatar Petroleum, awarded in the fourth quarter of 2017; |
|
|
• |
engineering and procurement progress on Abu Dhabi National Oil Company crude flexibility project in Ruwais, UAE, awarded in the first quarter of 2018; |
|
|
• |
engineering, procurement and construction progress on the LIWA EPC project for ORPIC; and |
|
|
• |
various other projects. |
In the first nine months of 2017, a variety of projects and activities contributed to revenues, including:
|
|
• |
higher fabrication and marine activities on the lump-sum EPCI project under the LTA II; |
|
|
• |
a marine campaign undertaken for jackets and deck installation, as well as hook-up work, on the Marjan power system replacement project; |
|
|
• |
a marine campaign undertaken for jacket and pipeline installation as well as hookup activities, on two Saudi Aramco EPCI projects; |
|
|
60 |
|
MANAGEMENT’S DISCUSSION AND ANALYSIS OF FINANCIAL CONDITION AND RESULTS OF OPERATIONS
|
|
• |
the Saudi Aramco nine jackets project, which progressed from the fabrication phase to the marine installation phase; |
|
|
• |
a marine campaign carried out for umbilical and valve skid installation and hookup work on pipeline, spool and risers for the flow assurance project in the Middle East; |
|
|
• |
pipelay installation and hookup activities executed by our DB 27 vessel on the KJO Hout project in the Divided Zone; |
|
|
• |
marine hookup activities carried out during the shutdown of the TP-1 platform on the Saudi Aramco Karan-45 project; |
|
|
• |
completion of the next phase of a large pipeline repair-related project in the Middle East; |
|
|
• |
progress on the Saudi Aramco four jackets and three observation platform project; and |
|
|
• |
engineering and fabrication progress on the Safaniya phase 5 project for Saudi Aramco. |
APAC—Revenues decreased 36%, or $183 million, in the nine months ended September 30, 2018 (including $45 million from the impact of the Combination) compared to the nine months ended September 30, 2017.
In the nine months ended September 30, 2018, a variety of projects and activities contributed to revenues, as follows:
|
|
• |
completion of pipelay campaign and offshore construction on the Greater Western Flank Phase 2 project in Australia; |
|
|
• |
the Inpex Ichthys project in Australia and Vashishta subsea field infrastructure development project in India, both of which are substantially complete; |
|
|
• |
commencement of activities on the subsea installation project in India, awarded in the fourth quarter of 2017; |
|
|
• |
progress on engineering, fabrication and construction contract with JGSPC for the Stage 1 Expansion project in the Philippines; and |
|
|
• |
various other projects. |
In the nine months ended September 30, 2017, a variety of projects and activities contributed to revenues, as follows:
|
|
• |
progress on marine installation activities on the Vashishta subsea field infrastructure development EPCI project in India; |
|
|
• |
commencement and substantial completion in 2017 of a marine campaign for transportation and installation of pipelines under the multi-year offshore Brunei Shell Petroleum (“BSP”) installation contract; and |
|
|
• |
activity on our Ichthys EPCI project in Australia, as the project continued to progress through the installation phase. |
Technology—Revenues during the nine months ended September 30, 2018 were $253 million (all of which resulted from the impact of the Combination) and were primarily associated with licensing and proprietary equipment activities in the petrochemical and refining markets and the sale of catalyst.
Operating Income
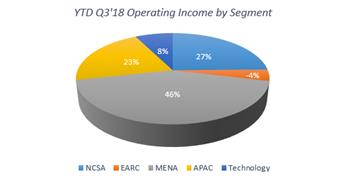
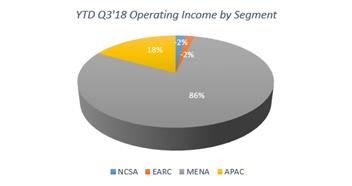
|
|
61 |
|
MANAGEMENT’S DISCUSSION AND ANALYSIS OF FINANCIAL CONDITION AND RESULTS OF OPERATIONS
Segment operating income increased by 36%, or $146 million, in the nine months of 2018 compared to the nine months of 2017. The first nine of months of 2018 operating income benefited by $194 million (including $90 million of project related and other intangible assets and investment in unconsolidated affiliates related amortization) from the impact of the Combination, primarily within our NCSA, MENA and Technology segments.
|
|
|
Nine Months Ended September 30, |
|
|
|
|
|
|
||||||||
|
|
|
2018 |
|
|
|
2017 |
|
|
|
Change |
|
|
||||
|
|
|
(In millions) |
|
|
|
Percentage |
|
|
||||||||
|
Segment operating income: |
|
|
|
|
|
|
|
|
|
|
|
|
|
|
|
|
|
NCSA |
$ |
148 |
|
|
$ |
(8 |
) |
|
$ |
156 |
|
|
|
1,950 |
|
% |
|
EARC |
|
(24 |
) |
|
|
(8 |
) |
|
|
(16 |
) |
|
|
(200 |
) |
|
|
MENA |
|
256 |
|
|
|
346 |
|
|
|
(90 |
) |
|
|
(26 |
) |
|
|
APAC |
|
125 |
|
|
|
74 |
|
|
|
51 |
|
|
|
69 |
|
|
|
Technology |
|
45 |
|
|
|
- |
|
|
|
45 |
|
|
NA |
|
|
|
|
Total |
$ |
550 |
|
|
$ |
404 |
|
|
$ |
146 |
|
|
|
36 |
|
% |
NCSA—Segment operating income (loss) was $148 million and ($8) million during the nine months ended September 30, 2018 and 2017, respectively. Our first nine months of 2018 operating income benefited by $149 million from the impact of the Combination (including $19 million of project related and other intangible assets amortization).
In the first nine months of 2018, a variety of projects and activities contributed to operating income, as follows:
|
|
• |
construction progress and cost savings on our ethane projects in Texas and Louisiana; |
|
|
• |
power projects in the U.S.; and |
|
|
• |
various other projects in the U.S. |
During the first nine months of 2018, our two U.S. LNG export facility projects and our gas turbine power projects in the Midwest and Northeast did not materially contribute to our operating margin.
In the first nine months of 2017, operating income was primarily associated with the commencement of fabrication activity on the BP Angelin EPCI gas field project, fabrication activity progress on the Abkatun-A2 platform and close-out improvements and recognition of approved change orders on certain completed projects.
EARC—Segment operating losses were $24 million and $8 million during the nine months ended September 30, 2018 and 2017, respectively. Our first nine months of 2018 operating loss included $10 million from the Combination (including $7 million of project related and other intangible assets amortization).
In both periods our project results were offset by the selling, general and administrative expenses and losses from our investment in the io Oil and Gas unconsolidated joint venture. The first nine months of 2018 were also impacted by project related and other intangible assets amortization.
MENA—Segment operating income was $256 million and $346 million during the nine months ended September 30, 2018 and 2017, respectively. Our first nine months of 2018 operating income benefited by $11 million from the impact of the Combination (including $7 million of project related and other intangible assets and investment in unconsolidated affiliate related amortization).
In the first nine months of 2018, a variety of projects and activities contributed to operating income, including:
|
|
• |
engineering, fabrication and procurement progress and ongoing structural demolition and installation works by our DB 32 and DB 30 vessels on the Saudi Aramco Safaniya phase 5 project, as well as productivity improvements and cost savings on the project; |
|
|
• |
marine hook-up activities utilizing a jack-up barge on the lump-sum EPCI project under the LTA II; |
|
|
• |
pipelay, deck installation, tie-ins, fabrication and hook up activities on the Saudi Aramco Header 9 Facilities project, as well as productivity improvements and cost savings on the project; |
|
|
62 |
|
MANAGEMENT’S DISCUSSION AND ANALYSIS OF FINANCIAL CONDITION AND RESULTS OF OPERATIONS
|
|
• |
the favorable settlement on the Saudi Aramco Safaniya phase 1 project, completed in 2016; |
|
|
• |
engineering, fabrication and procurement progress on the Saudi Aramco Safaniya phase 6 project, awarded in the fourth quarter of 2017; |
|
|
• |
engineering, procurement and construction progress on the LIWA EPC project for ORPIC, as well as cost savings on the project; |
|
|
• |
various other projects; and |
|
|
• |
income from our unconsolidated joint venture with CTCI, partly offset by investment in unconsolidated affiliate related amortization. |
In the first nine months of 2017, a variety of projects and activities contributed to operating income, as follows:
|
|
• |
higher fabrication and marine activities on the lump-sum EPCI project under the LTA II; |
|
|
• |
a marine campaign undertaken for jackets and deck installation, as well as hook-up work, on the Marjan power system replacement project; |
|
|
• |
a marine campaign carried out for umbilical and valve skid installation as well as hook-up activities on pipeline, spool and risers for the flow assurance project in the Middle East; |
|
|
• |
marine hookup activities carried out during the shutdown of the TP-1 platform on the Saudi Aramco Karan-45 project; |
|
|
• |
a marine campaign undertaken for jacket and pipeline installation as well as hookup activities on two Saudi Aramco EPCI projects; |
|
|
• |
completion of the next phase of a large pipeline repair-related project in the Middle East; and |
|
|
• |
the Saudi Aramco nine jackets project, which progressed from the fabrication phase to marine installation phase. |
APAC—Segment operating income was $125 million and $74 million during the nine months ended September 30, 2018 and 2017, respectively. APAC operating results did not materially benefit from the impact of the Combination.
In the nine months ended September 30, 2018, a variety of projects and activities contributed to operating income, as follows:
|
|
• |
cost savings and the close-out of outstanding change orders on active and completed projects; and |
|
|
• |
cost savings upon the commencement and substantial completion of pipelay campaign and offshore construction on the Greater Western Flank Phase 2 project in Australia. |
In the nine months ended September 30, 2017, a variety of projects and activities contributed to operating income, as follows:
|
|
• |
a marine campaign for transportation and installation of pipelines under the multi-year offshore installation contract with BSP in the 2017 period; and |
|
|
• |
close-out improvements from several previously completed projects. |
|
|
63 |
|
MANAGEMENT’S DISCUSSION AND ANALYSIS OF FINANCIAL CONDITION AND RESULTS OF OPERATIONS
During the nine months ended September 30, 2017, the Vashishta project did not contribute to our operating margin due to the impact of vessel and marine equipment downtime.
Technology—Segment operating income during the nine months ended September 30, 2018 was $45 million (including $56 million of project related and other intangible assets and investment in unconsolidated affiliate related amortization). The results were primarily associated with licensing and proprietary equipment activity, as well as the supply of catalyst, and included $7 million of income from our CLG unconsolidated affiliate.
Corporate and Other
|
|
|
Nine Months Ended September 30, |
|
|
|
|
|
|
|
|
|
|
||||
|
|
|
2018 |
|
|
|
2017 |
|
|
|
Change |
|
|
||||
|
|
|
(In millions) |
|
|
|
Percentage |
|
|
||||||||
|
Corporate and Other |
$ |
(308 |
) |
|
$ |
(142 |
) |
|
$ |
(166 |
) |
|
|
(117 |
) |
% |
For the nine months ended September 30, 2018 and 2017, Corporate and Other expenses were $308 million and $142 million, respectively. The increase in Corporate and Other expenses was primarily due to the following charges resulting from the impact of the Combination in the 2018 period:
|
|
• |
Restructuring and integration costs ($106 million) primarily related to costs to achieve our CPI; and |
|
|
• |
Transaction costs ($45 million) primarily related to incremental employee related costs and professional fees associated with the Combination. |
See Note 3, Business Combination, and Note 11, Restructuring and Integration Costs, to the Financial Statements for further discussion.
Other Non-operating Items
Interest expense, net—Interest expense, net was $169 million and $51 million during the nine months ended September 30, 2018 and 2017, respectively.
Interest expense in the nine months ended September 30, 2018 was primarily comprised of:
|
|
• |
$63 million of interest expense and $3 million of deferred DIC amortization associated with the Senior Notes, discussed in Note 12, Debt, to the Financial Statements; |
|
|
• |
$70 million of interest expense and $5 million of deferred DIC amortization, associated with the Term Facility, discussed in Note 12, Debt, to the Financial Statements; |
|
|
• |
$13 million of amortization of deferred DIC associated with our revolving credit facility and LC facility; and |
|
|
• |
$14 million of interest expense associated with our 8.000% second-lien notes, which were redeemed in May 2018. |
See Note 12, Debt, to the Financial Statements for further discussion.
Interest expense, net in the nine months ended September 30, 2017 was primarily associated with our 8.000% second-lien notes, which were redeemed in May 2018, and our prior term loan, which was repaid in June 2017.
Other non-operating expense, net—Other non-operating expense, net was $13 million during the nine months ended September 30, 2018 and primarily related to a $10 million make-whole fee and $4 million of charges relating to the write-off of deferred DIC, associated with our redemption of our 8.000% second-lien notes in May 2018. See Note 12, Debt, to the Financial Statements for further discussion.
Income tax (benefit) expense—During the nine months ended September 30, 2018, we recognized an income tax benefit of $19 million (effective tax rate of 30.7%), compared to tax expense of $53 million (effective tax rate of 25.4%) for the nine months ended September 30, 2017. Our provision for the nine months ended September 30, 2018 benefited from the tax effect ($117
|
|
64 |
|
MANAGEMENT’S DISCUSSION AND ANALYSIS OF FINANCIAL CONDITION AND RESULTS OF OPERATIONS
million) of the taxable sale of low tax basis, pre-Combination McDermott assets to our new Technology entity which files its U.S. income taxes separately from pre-Combination McDermott, partially offset by non-deductible transaction costs ($16 million), losses in jurisdictions with no tax benefit ($60 million) and other items ($8 million).
Liquidity and Capital Resources
Our primary sources of liquidity are cash and cash equivalents on hand, cash flows generated from operations, and capacity under our revolving credit and other facilities. Our revolving credit and other facilities are also available to provide letters of credit, which are generally issued to customers in the ordinary course of business to support advance payments and performance guarantees in lieu of retention on our contracts, or in certain cases, are issued in support of our insurance programs. We regularly review our sources and uses of funds and may seek to access capital markets or increase our revolving credit and letter of credit capacity to increase our liquidity position and support our ability to take on larger project awards. We also perform periodic strategic reviews of our business portfolio and may adjust our portfolio to dispose of those portions of our business deemed to be non-core to our vertically integrated offering model.
In order to maintain our ability to pursue the business opportunities from the strong order flow we are projecting, notwithstanding the usage of our working capital and capital resources to fund the payment of the increased costs on the three legacy loss projects described above, we have entered into new financing arrangements involving, among other things, the issuance of redeemable preferred stock and new letter of credit capacity.
On October 30, 2018, we entered into a Securities Purchase Agreement (the “Purchase Agreement”) with certain investment funds managed by the Merchant Banking Division of The Goldman Sachs Group Inc. (collectively, the “Purchasers”) to issue and sell in a private placement (the “Private Placement”) (1) 300,000 shares of 12% Redeemable Preferred Stock and (2) warrants to purchase a number of shares of our common stock equal to the product of 3.75% times the total number of shares of our common stock outstanding as of the closing of the Private Placement, with an initial exercise price per share of $0.01, for an aggregate purchase price of $289.5 million. We intend to use the net proceeds from the Private Placement for general corporate purposes, including the funding of working capital requirements. The closing of the Private Placement is expected to occur on or about November 29, 2018, subject to certain closing conditions. The Redeemable Preferred Stock will rank senior to our common stock with respect to the payment of dividends and distribution of assets upon liquidation, dissolution and winding up.
Also on October 30, 2018, we, as a guarantor, entered into a Letter of Credit Agreement (the “Letter of Credit Agreement”) with McDermott Technology (Americas), Inc., McDermott Technology (US), Inc. and McDermott Technology, B.V., each a wholly owned subsidiary of ours, as co-applicants, and Barclays Bank PLC, as administrative agent. The Letter of Credit Agreement provides for a facility for extensions of credit in the form of performance letters of credit in the aggregate face amount of up to $230 million (the “LC Facility”). Before any letters of credit can be issued under the LC Facility, we must have received the proceeds from the Private Placement and we must have satisfied other closing conditions that we believe are customary. The LC Facility is scheduled to mature three years after the initial utilization date thereunder. The obligations under the Letter of Credit Agreement will be unconditionally guaranteed on a senior secured basis by us and substantially all of our wholly owned subsidiaries, other than the co-applicants (which are directly obligated thereunder) and several captive insurance subsidiaries and certain other designated or immaterial subsidiaries. The liens securing the LC Facility will rank equal in priority with the liens securing obligations under the Credit Agreement. The Letter of Credit Agreement includes financial and other covenants and provisions relating to events of default that are substantially the same as those in the Credit Agreement.
We believe our cash and cash equivalents on hand, cash flows generated from operations, amounts available under our credit facilities and uncommitted bilateral lines of credit, together with the expected proceeds for the Private Placement, will be sufficient to finance our capital expenditures, including expected capital expenditures for the Amazon vessel (as more fully described in Note 13, Lease Obligations), settle our commitments and contingencies (as more fully described in Note 21, Commitments and Contingencies) and address our normal, anticipated working capital needs for the foreseeable future.
As discussed above under “Company Overview – Strategic Review of Business Portfolio,” we are developing plans to seek buyers for the sales of our storage tank and U.S. pipe fabrication businesses, which are subject to approval by our Board of Directors. We expect proceeds resulting from sales of these businesses would be utilized to reduce our outstanding debt.
There can be no assurance that funding sources will continue to be available, as our ability to generate cash flows from operations and our ability to access our credit facilities and uncommitted bilateral lines of credit and our ability to access capital markets, at
|
|
65 |
|
MANAGEMENT’S DISCUSSION AND ANALYSIS OF FINANCIAL CONDITION AND RESULTS OF OPERATIONS
reasonable terms or at all, may be impacted by a variety of business, economic, legislative, financial and other factors, which may be outside of our control. Additionally, while we currently have significant uncommitted bonding facilities, primarily to support various commercial provisions in our contracts, a termination or reduction of these bonding facilities could result in the utilization of letters of credit in lieu of performance bonds, thereby reducing the available capacity under our credit facilities and uncommitted bilateral lines of credit. Although we do not anticipate a reduction or termination of the bonding facilities, there can be no assurance that such facilities will continue to be available at reasonable terms to service our ordinary course obligations.
Cash, Cash Equivalents and Restricted Cash
As of September 30, 2018, we had $905 million of cash, cash equivalents and restricted cash, as compared to $408 million as of December 31, 2017. Approximately $158 million of our cash and cash equivalents at September 30, 2018 was within our variable interest entities (“VIEs”) associated with our joint venture and consortium arrangements, which is generally only available for use in our operating activities when distributed to the joint venture and consortium participants. At September 30, 2018, we had approximately $280 million of cash in jurisdictions outside the U.S., principally in the United Arab Emirates, Ireland, India, Malaysia and Australia. Approximately 5% of our outstanding cash balance is held in countries that have established government imposed currency restrictions that could impede the ability of our subsidiaries to transfer funds to us.
Cash Flow Activities
Operating activities―Net cash provided by operating activities was $214 million in the nine months ended September 30, 2018, as compared to $136 million provided in the nine months ended September 30, 2017.
The cash provided by operating activities primarily reflected our net income, adjusted for non-cash items and changes in components of our working capital. The changes in our working capital during the nine months ended September 30, 2018 were primarily driven by accounts receivable, contracts in progress net of advance billings on contracts and accounts payable (“Project Working Capital”). Fluctuations in working capital are normal in our business. Working capital is impacted by the size of our projects and the achievement of billing milestones on RPOs as we complete certain phases of the projects. The legacy CB&I operations included approximately $2.4 billion of negative working capital at the Combination Date, including approximately $1.2 billion of negative Project Working Capital associated with our Calpine power project and our proportionate shares of the Cameron LNG and Freeport LNG consortium projects (our “Focus Projects”). Negative Project Working Capital for the Focus Projects was approximately negative $760 million at September 30, 2018.
The components of working capital that provided cash were:
|
|
• |
Accounts receivable—a decrease of $130 million driven by collections primarily within our NCSA segment (including approximately $174 million from our Focus Projects), partially offset by timing of billings and receipt of payments for our other segments; and |
|
|
• |
Accounts payable—an increase of $123 million driven by project progress primarily within our MENA and NSCA segments, partially offset by payments for our APAC segment. |
Those were partially offset by:
|
|
• |
Contracts in progress/Advance billings on contracts—a net increase of $318 million, primarily due to the impact of progress on projects within our NCSA segment (including approximately $585 million from our Focus Projects), partially offset by projects within our MENA and APAC segments. |
We anticipate future quarterly variability in our operating cash flows due to ongoing fluctuations in our working capital balances and the prospective cash impact from the projects charges on the Focus Projects described above under “Company Overview – Loss Projects,”
In the nine months ended September 30, 2017, net cash used by working capital was approximately $214 million.
|
|
66 |
|
MANAGEMENT’S DISCUSSION AND ANALYSIS OF FINANCIAL CONDITION AND RESULTS OF OPERATIONS
The components of working capital that used or provided cash were:
|
|
• |
Contracts in progress, net of Advance billings on contracts increased by $673 million primarily due to progress on: |
|
|
• |
the Abkatun A-2 project in our NCSA segment; |
|
|
• |
Saudi Aramco projects including the lump-sum EPCI project under the LTA II, the Marjan power system replacement project, the Header 9 Facilities and the Berri platform in our MENA segment; and |
|
|
• |
the Ichthys and Vashishta projects in our APAC segment. |
Those increases were partially offset by:
|
|
• |
Accounts receivable—collections across all segments reduced our accounts receivable by $120 million; and |
|
|
• |
Accounts payable—an increase of $339 million was driven by project progress across all segments. |
Investing activities―Net cash used in investing activities was $2.6 billion in the nine months ended September 30, 2018, as compared to $45 million used in the nine months ended September 30, 2017.
The outflows for the nine months ended September 30, 2018 were primarily associated with:
|
|
• |
the cash portion of the Combination consideration ($2.4 billion, net of cash acquired of $498 million – see Note 3, Business Combination, to the Financial Statements for further discussion); |
|
|
• |
net outflows from advances of $155 million with our third-party consortium participants of proportionately consolidated consortiums (see Note 10, Joint Venture and Consortium Arrangements, to the Financial Statements for further discussion); and |
|
|
• |
capital expenditures of $62 million. |
Those outflows were partially offset by proceeds from asset dispositions of $55 million, approximately $52 million of which were associated with the sale of CB&I’s former administrative headquarters.
Net cash used in investing activities for the nine months ended September 30, 2017 primarily related to capital expenditures, partly offset by the sale lease back of the Amazon vessel discussed below.
Financing activities―Net cash provided by financing activities was $2.9 billion in the nine months ended September 30, 2018, as compared to $269 million used in the nine months ended September 30, 2017.
Net cash provided for the nine months ended September 30, 2018 was primarily attributable to:
|
|
• |
borrowings of $2.26 billion under our Term Facility (see Note 12, Debt, to the Financial Statements for further discussion); |
|
|
• |
the issuance of $1.3 billion in aggregate principal amount of Senior Notes (see Note 12, Debt, to the Financial Statements for further discussion); and |
|
|
• |
net inflows from advances of $67 million with our equity method and proportionately consolidated joint ventures and consortiums. |
The inflows were partly offset by:
|
|
• |
redemption of the entire $500 million aggregated principal amount of our 8.000% second-lien notes and a $10 million make-whole associated with the early repayment; |
|
|
• |
$209 million of DIC associated with our Credit Agreement and Senior Notes; |
|
|
• |
$11 million of Term Facility payments, $10 million of vendor equipment financing payments and $10 million of other debt and capital lease payments; and |
|
|
• |
repurchases of common stock of $14 million tendered by participants in our long-term incentive plans for payment of applicable withholding taxes upon vesting of awards under those plans. |
|
|
67 |
|
MANAGEMENT’S DISCUSSION AND ANALYSIS OF FINANCIAL CONDITION AND RESULTS OF OPERATIONS
Net cash used for the nine months ended September 30, 2017 was primarily attributable to:
|
|
• |
$218 million and $13 million of term loan and other debt repayments, respectively; |
|
|
• |
$20 million of DIC associated with our previous credit agreement; |
|
|
• |
$11 million for the acquisition of the North Ocean AS 105 noncontrolling interest; and |
|
|
• |
$7 million for repurchases of common stock tendered by participants in our long-term incentive plans for payment of applicable withholding taxes upon vesting of awards under those plans. |
Effects of Exchange Rate Changes on Cash, Cash Equivalents and Restricted Cash—During the first nine months of 2018, our cash and cash equivalents balance decreased by $30 million due to the impact of changes in functional currency exchange rates against the U.S. Dollar for non-U.S. Dollar cash balances, primarily for net changes in the Australian Dollar, British Pound and Euro exchange rates. The net unrealized loss on our cash and cash equivalents resulting from these exchange rate movements is reflected in the cumulative translation adjustment component of OCI. Our cash and cash equivalents held in non-U.S. Dollar currencies are used primarily for project-related and other operating expenditures in those currencies, and, therefore, our exposure to realized exchange gains and losses is not anticipated to be material.
Capital Expenditures
As part of our strategic growth program, our management regularly evaluates our marine vessel fleet and our fabrication yard construction capacity to ensure our fleet and construction capabilities are adequately aligned with our overall growth strategy. These assessments may result in capital expenditures to construct, upgrade, acquire or operate vessels or acquire or upgrade fabrication yards that would enhance or grow our technical capabilities, or may involve engaging in discussions to dispose of certain marine vessels or fabrication yards.
Capital expenditures for the nine months ended September 30, 2018 and 2017 were $62 million and $97 million, respectively, as discussed below:
|
|
|
|
|
|
• |
Capital expenditures for the 2017 period were primarily attributable to the purchase of the pipelay and construction vessel, the Amazon. Following the purchase, we sold the Amazon to an unrelated third party and simultaneously entered into an 11-year bareboat charter agreement with the purchaser. |
During the remainder of 2018, we expect to spend approximately $40 million on capital expenditures for vessel maintenance, vessel upgrades and information technology updates.
Credit Agreement
On May 10, 2018, we entered into a Credit Agreement (the “Credit Agreement”) with a syndicate of lenders and letter of credit issuers, Barclays Bank PLC, as administrative agent for a term facility under the Credit Agreement, and Crédit Agricole Corporate and Investment Bank, as administrative agent for the other facilities under the Credit Agreement. The Credit Agreement provides for borrowings and letters of credit in the aggregate principal amount of $4.65 billion, consisting of the following:
|
|
• |
a $2.26 billion senior secured term loan facility (the “Term Facility”), the full amount of which was borrowed, and $319.3 million of which has been deposited into a restricted cash collateral account (the “LC Account”) to secure reimbursement obligations in respect of up to $310.0 million of letters of credit (the “Term Facility Letters of Credit”); |
|
|
• |
a $1.0 billion senior secured revolving credit facility (the “Revolving Credit Facility”); and |
|
|
• |
a $1.39 billion senior secured letter of credit facility (the “LC Facility”). |
The Credit Agreement provides that:
|
|
68 |
|
MANAGEMENT’S DISCUSSION AND ANALYSIS OF FINANCIAL CONDITION AND RESULTS OF OPERATIONS
|
|
• |
subject to compliance with the financial covenants in the Credit Agreement, the full amount of the Revolving Credit Facility is available for revolving loans; |
|
|
• |
subject to our utilization in full of our capacity to issue Term Facility Letters of Credit, the full amount of the Revolving Credit Facility is available for the issuance of performance letters of credit and up to $200 million of the Revolving Credit Facility is available for the issuance of financial letters of credit; and |
|
|
• |
the full amount of the LC Facility is available for the issuance of performance letters of credit. |
Borrowings are available under the Revolving Credit Facility for working capital and other general corporate purposes. Certain existing letters of credit outstanding under our previously existing Amended and Restated Credit Agreement, dated as of June 30, 2017 (the “Prior Credit Agreement”) and certain existing letters of credit outstanding under CB&I’s previously existing credit facilities have been deemed issued under the Credit Agreement, and letters of credit were issued under the Credit Agreement to backstop certain other existing letters of credit issued for the account of McDermott, CB&I and their respective subsidiaries and affiliates.
The Credit Agreement includes mandatory commitment reductions and prepayments in connection with, among other things, certain asset sales and casualty events (subject to reinvestment rights with respect to asset sales of less than $500 million). In addition, we are required to make annual prepayments of term loans under the Term Facility and cash collateralize letters of credit issued under the Revolving Credit Facility and the LC Facility with 75% of excess cash flow (as defined in the Credit Agreement), reducing to 50% of excess cash flow and 25% of excess cash flow depending on our secured leverage ratio.
Term Facility—As of September 30, 2018, we had $2.25 billion of borrowings outstanding under our seven-year Term Facility. Proceeds of our borrowing under the Term Facility were used, together with proceeds from the senior notes described below and cash on hand, (i) to consummate the Business Combination Agreement, including the repayment of certain existing indebtedness of CB&I and its subsidiaries, (ii) to redeem $500 million aggregate principal amount of our 8.000% second-lien notes, (iii) to prepay existing indebtedness under, and to terminate in full, our Prior Credit Agreement, and (iv) to pay fees and expenses in connection with the Combination, the Credit Agreement and the issuance of the Senior Notes.
Principal under the Term Facility is payable quarterly and interest is assessed at either (i) the Eurodollar rate plus a margin of 5.00% per year or (ii) the base rate (the highest of the Federal Funds rate plus 0.50%, the Eurodollar rate plus 1.0%, or the administrative agent’s prime rate) plus a margin of 4.00%, subject to a 1.0% floor with respect to the Eurodollar rate and is payable periodically dependent upon the interest rate in effect during the period. However, on May 8, 2018, we entered into a U.S. dollar interest rate swap arrangement to mitigate exposure associated with cash flow variability on $1.94 billion of the $2.26 billion Term Facility. This resulted in a weighted average interest rate of 7.27%, inclusive of the applicable margin during the period ended September 30, 2018. The Credit Agreement requires us to prepay a portion of the term loans made under the Term Facility on the last day of each fiscal quarter in an amount equal to $5.65 million.
The future scheduled maturities of the Term Facility are:
|
|
|
(In millions) |
|
|
|
2018 |
|
$ |
6 |
|
|
2019 |
|
|
23 |
|
|
2020 |
|
|
23 |
|
|
2021 |
|
|
23 |
|
|
2022 |
|
|
23 |
|
|
Thereafter |
|
|
2,151 |
|
|
|
|
$ |
2,249 |
|
Additionally, as of September 30, 2018, there were approximately $278 million of Term Facility Letters of Credit issued (or deemed issued) under the Credit Agreement, leaving approximately $32 million of available capacity under the Term Facility.
|
|
69 |
|
MANAGEMENT’S DISCUSSION AND ANALYSIS OF FINANCIAL CONDITION AND RESULTS OF OPERATIONS
Revolving Credit Facility and LC Facility—We have a $1.0 billion Revolving Credit Facility which is scheduled to expire in May 2023. Through September 30, 2018, we had not made any borrowings under the Revolving Credit Facility. As of September 30, 2018, we had approximately $142 million of letters of credit outstanding (including $48.4 million of financial letters of credit), leaving $858 million of available capacity under the Revolving Credit Facility. We also have a $1.39 billion LC Facility that is scheduled to expire in May 2023. As of September 30, 2018, we had approximately $1.376 billion of letters of credit outstanding, leaving $14 million of available capacity under the LC Facility. If we borrow funds under the Revolving Credit Facility, interest will be assessed at either the base rate plus a floating margin ranging from 2.75% to 3.25% (3.25% at September 30, 2018) or the Eurodollar rate plus a floating margin ranging from 3.75% to 4.25% (4.25% at September 30, 2018), in each case depending on our leverage ratio (calculated quarterly). We are charged a commitment fee of 0.50% per year on the daily amount of the unused portions of the commitments under the Revolving Credit Facility and the LC Facility. Additionally, with respect to all letters of credit outstanding under the Credit Agreement, we are charged a fronting fee of 0.25% per year and, with respect to all letters of credit outstanding under the Revolving Credit Facility and the LC Facility, we are charged a participation fee of (i) between 3.75% to 4.25% (4.25% at September 30, 2018) per year in respect of financial letters of credit and (ii) between 1.875% to 2.125% (2.125% at September 30, 2018) per year in respect of performance letters of credit, in each case depending on our leverage ratio (calculated quarterly). We are also required to pay customary issuance fees and other fees and expenses in connection with the issuance of letters of credit under the Credit Agreement.
Credit Agreement Covenants—The Credit Agreement includes the following financial covenants that are tested on a quarterly basis:
|
|
• |
the minimum permitted fixed charge coverage ratio (as defined in the Credit Agreement) is 1.50 to 1.00; |
|
|
• |
the maximum permitted leverage ratio is (i) 4.25 to 1.00 for each fiscal quarter ending on or before September 30, 2019, (ii) 4.00 to 1.00 for the fiscal quarter ending December 31, 2019, (iii) 3.75 to 1.00 for each fiscal quarter ending after December 31, 2019 and on or before December 31, 2020, (iv) 3.50 to 1.00 for each fiscal quarter ending after December 31, 2020 and on or before December 31, 2021 and (v) 3.25 to 1.00 for each fiscal quarter ending after December 31, 2021; and |
|
|
• |
the minimum liquidity (as defined in the Credit Agreement, but generally meaning the sum of McDermott’s unrestricted cash and cash equivalents plus unused commitments under the Credit Agreement available for revolving borrowings) is $200 million. |
In addition, the Credit Agreement contains various covenants that, among other restrictions, limit our ability to:
|
|
• |
incur or assume indebtedness; |
|
|
• |
grant or assume liens; |
|
|
• |
make acquisitions or engage in mergers; |
|
|
• |
sell, transfer, assign or convey assets; |
|
|
• |
make investments; |
|
|
• |
repurchase equity and make dividends and certain other restricted payments; |
|
|
• |
change the nature of its business; |
|
|
• |
engage in transactions with affiliates; |
|
|
• |
enter into burdensome agreements; |
|
|
• |
modify its organizational documents; |
|
|
• |
enter into sale and leaseback transactions; |
|
|
• |
make capital expenditures; |
|
|
• |
enter into speculative hedging contracts; and |
|
|
• |
make prepayments on certain junior debt. |
The Credit Agreement contains events of default that we believe are customary for a secured credit facility. If an event of default relating to bankruptcy or other insolvency events occurs, all obligations under the Credit Agreement will immediately become due and payable. If any other event of default exists under the Credit Agreement, the lenders may accelerate the maturity of the obligations outstanding under the Credit Agreement and exercise other rights and remedies. In addition, if any event of default exists under the Credit Agreement, the lenders may commence foreclosure or other actions against the collateral.
|
|
70 |
|
MANAGEMENT’S DISCUSSION AND ANALYSIS OF FINANCIAL CONDITION AND RESULTS OF OPERATIONS
If any default exists under the Credit Agreement, or if the Borrowers are unable to make any of the representations and warranties in the Credit Agreement at the applicable time, the Borrowers will be unable to borrow funds or have letters of credit issued under the Credit Agreement.
Credit Agreement Covenants Compliance—As of September 30, 2018, we were in compliance with all our restrictive and financial covenants under the Credit Agreement. The financial covenants at September 30, 2018 are summarized below:
|
Ratios |
|
Requirement |
|
Actual |
|
Minimum fixed charge coverage ratio |
|
1.50x |
|
2.40x |
|
Maximum total leverage ratio |
|
4.25x |
|
2.46x |
|
Minimum liquidity |
$ |
200 million |
$ |
1,472 million |
Future compliance with our financial and restrictive covenants under the Credit Agreement could be impacted by circumstances or conditions beyond our control, including, but not limited to, the delay or cancellation of projects, decreased letter of credit capacity, decreased profitability on our projects, changes in currency exchange or interest rates, performance of pension plan assets, or changes in actuarial assumptions. Further, we could be impacted if our customers experience a material change in their ability to pay us or if the banks associated with our Credit Agreement were to cease operations, or if there is a full or partial break-up of the European Union (“EU”) or is currency, the Euro.
Senior Notes
On April 18, 2018, we issued $1.3 billion in aggregate principal of 10.625% senior notes due 2024 (the “Senior Notes”), pursuant to an indenture we entered into with Wells Fargo Bank, National Association, as trustee (the “Senior Notes Indenture”). Interest on the Senior Notes is payable semi-annually in arrears, and the Senior Notes are scheduled to mature in May 2024. However, at any time or from time to time on or after May 1, 2021, we may redeem the Senior Notes, in whole or in part, at the redemption prices (expressed as percentages of principal amount of the Senior Notes to be redeemed) set forth below, together with accrued and unpaid interest to (but excluding) the redemption date (subject to the right of holders of record on the relevant record date to receive interest due on the relevant interest payment date), if redeemed during the 12-month period beginning on May 1 of the years indicated:
|
Year |
|
Optional redemption price |
|
|
|
2021 |
|
|
105.313 |
% |
|
2022 |
|
|
102.656 |
% |
|
2023 and thereafter |
|
|
100.000 |
% |
In addition, prior to May 1, 2021, we may redeem up to 35.0% of the aggregate principal amount of the outstanding Senior Notes, in an amount not greater than the net cash proceeds of one or more qualified equity offerings (as defined in the Senior Notes Indenture) at a redemption price equal to 110.625% of the principal amount of the notes to be redeemed, plus accrued and unpaid interest to (but excluding) the date of redemption (subject to the right of holders of record on the relevant record date to receive interest due on the relevant interest payment date), subject to certain limitations and other requirements. The Senior Notes may also be redeemed, in whole or in part, at any time prior to May 1, 2021 at our option, at a redemption price equal to 100% of the principal amount of the Senior Notes redeemed, plus the applicable premium (as defined in the Senior Notes Indenture) as of, and accrued and unpaid interest to (but excluding) the applicable redemption date (subject to the right of the holders of record on the relevant record date to receive interest due on the relevant interest payment date).
Senior Notes Covenants—The Senior Notes Indenture contains covenants that, among other things, limit our ability to: (i) incur or guarantee additional indebtedness or issue preferred stock; (ii) make investments or certain other restricted payments; (iii) pay dividends or distributions on our capital stock or purchase or redeem our subordinated indebtedness; (iv) sell assets; (v) create restrictions on the ability of our restricted subsidiaries to pay dividends or make other payments to us; (vi) create certain liens; (vii) sell all or substantially all of our assets or merge or consolidate with or into other companies; (viii) enter into transactions with affiliates; and (ix) create unrestricted subsidiaries. Those covenants are subject to various exceptions and limitations.
Senior Notes Covenants Compliance—At September 30, 2018, we were in compliance with all our restrictive covenants under the Senior Notes Indenture. Future compliance with our restrictive covenants under the Senior Notes Indenture could be impacted by circumstances or conditions beyond our control, including, but not limited to, the delay or cancellation of projects, decreased letter of credit capacity, decreased profitability on our projects, changes in currency exchange or interest rates, performance of pension plan
|
|
71 |
|
MANAGEMENT’S DISCUSSION AND ANALYSIS OF FINANCIAL CONDITION AND RESULTS OF OPERATIONS
assets, or changes in actuarial assumptions. Further, we could be impacted if our customers experience a material change in their ability to pay us or if the banks associated with our Credit Agreement were to cease operations, or if there is a full or partial break-up of the European Union (“EU”) or is currency, the Euro.
Other Financing Arrangements
North Ocean Financing―On September 30, 2010, McDermott International, Inc., as guarantor, and North Ocean 105 AS, in which we then had a 75% ownership interest, as borrower, entered into a financing agreement to pay a portion of the construction costs of the NO 105. Borrowings under the agreement are secured by, among other things, a pledge of all of the equity of North Ocean 105 AS, a mortgage on the NO 105, and a lien on substantially all of the other assets of North Ocean 105 AS. The financing agreement requires principal repayment in 17 consecutive semiannual installments of approximately $4 million, which commenced on October 1, 2012.
In the second quarter of 2017 we exercised our option under the North Ocean 105 AS joint venture agreement and purchased the 25% ownership interest of Oceanteam ASA (“Oceanteam”) in the vessel-owning company for approximately $11 million in cash. As part of that transaction, we also assumed the right to a $5 million note payable from North Ocean 105 AS to Oceanteam (which had been issued in connection with a dividend declared by North Ocean 105 AS in 2016). As of September 30, 2018, the outstanding borrowing under this facility was approximately $20 million. Future maturities are approximately $4 million, $8 million and $8 million for the remainder of 2018 and the years 2019 and 2020, respectively.
Receivable Factoring Facility―During the nine months ended September 30, 2018, we sold, without recourse, approximately $179 million of receivables under an uncommitted receivables purchase agreement in Mexico at a discount rate of applicable LIBOR plus a margin of 1.90%-2.00% and Interbank Equilibrium Interest Rate in Mexico plus a margin of 1.50% - 1.70%. We recorded approximately $1 million and $3 million of factoring costs in Other operating income (expense) during the three and nine months ended September 30, 2018, respectively. Ten percent of the receivables sold are withheld and received on the due date of the original invoice. We have received cash, net of fees and amounts withheld, of approximately $159 million under these arrangements during the nine months ended September 30, 2018.
Vendor Equipment Financing―In February 2017, JRM Mexico entered into a 21-month loan agreement for equipment financing in the amount of $47 million. Borrowings under the loan agreement bear interest at a fixed rate of 5.75%. JRM Mexico’s obligations in connection with this equipment financing are guaranteed by McDermott International Management, S. de RL., one of our indirect, wholly owned subsidiaries. The equipment financing agreement contains various customary affirmative covenants, as well as specific affirmative covenants, including the pledge of specified equipment. The equipment financing agreement also requires compliance with various negative covenants, including restricted use of the proceeds. As of September 30, 2018, the outstanding borrowings under this facility were approximately $5 million and will mature during the remainder of 2018.
Uncommitted Bilateral Credit Facilities—We are party to a number of short-term uncommitted bilateral credit facilities and surety bond arrangements (the “Uncommitted Facilities”) across several geographic regions, as follows:
|
|
|
September 30, 2018 |
|
|
December 31, 2017 |
|
||||||||||
|
|
|
Uncommitted Line Capacity |
|
|
Utilized |
|
|
Uncommitted Line Capacity |
|
|
Utilized |
|
||||
|
|
|
(In millions) |
|
|||||||||||||
|
Bank Guarantee and Bilateral Letter of Credit (1) |
|
$ |
1,609 |
|
|
$ |
928 |
|
|
$ |
725 |
|
|
$ |
572 |
|
|
Surety Bonds (2) |
|
828 |
|
|
419 |
|
|
|
300 |
|
|
|
49 |
|
||
|
Bilateral arrangements to issue cash collateralized letters of credit |
|
|
- |
|
|
|
- |
|
|
|
175 |
|
|
|
18 |
|
|
(3) |
Approximately $175 million of this capacity is available only upon provision of an equivalent amount of cash collateral. |
|
(4) |
Excludes approximately $403 million of surety bonds maintained on behalf of CB&I’s former Capital Services Operations, which were sold to CSVC Acquisition Corp (“CSVC”) in June 2017. We also continue to maintain guarantees on behalf of CB&I’s former Capital Services Operations business in support of approximately $82 million of RPOs. We are entitled to an indemnity from CSVC for both the surety bonds and guarantees. |
|
|
72 |
|
MANAGEMENT’S DISCUSSION AND ANALYSIS OF FINANCIAL CONDITION AND RESULTS OF OPERATIONS
Debt Issuance Costs—We incurred approximately $150 million of fees relating to the establishment of our Credit Agreement (including $93 million associated with the Term Facility and $57 million associated with the Revolving Credit Facility and LC Facility) and approximately $59 million relating to the issuance of the Senior Notes. On the Balance Sheets, the costs associated with the Term Facility and Senior Notes are reflected as a direct reduction from the related debt liability and amortized over the terms of the respective facilities. The costs associated with the Revolving Credit Facility and LC Facility are reflected within Other current and noncurrent assets and amortized within Interest expense, net, over the terms of the respective facilities.
Debt Extinguishment Costs—During the second quarter of 2018, we incurred approximately $10 million of make-whole fees in connection with the redemption of $500 million principal amount of our 8.000% second-lien notes, as well as charges of approximately $4 million relating to the write-off of deferred debt issuance costs resulting from the extinguishment of our previous debt arrangements. These costs were recorded within Other non-operating expense, net, in our Statement of Operations.
Capital Lease Obligations―The Amazon, a pipelay and construction vessel, was purchased by us in February 2017, sold to an unrelated third party (the “Amazon Owner”) and leased back under a long-term bareboat charter that gave us the right to use the vessel and was recorded as an operating lease. On July 27, 2018, we entered into agreements (the “Amazon Modification Agreements”) providing for certain modifications to the Amazon vessel and related financing and amended bareboat charter arrangements. The total cost of the modifications, including project management and other fees and expenses, is expected to be in the range of approximately $260 million to $290 million. The Amazon Owner is expected to fund the cost of the modifications primarily through an export credit-backed senior loan provided by a group of lenders, supplemented by expected direct capital expenditure by us of approximately $58 million over the course of the modifications. The amended bareboat charter arrangement is accounted for as a capital lease, recognizing Property, Plant and Equipment and Lease obligation for the present value of future minimum lease payments. The cost of modifications will be recorded in Property, Plant and Equipment with a corresponding liability for direct capital expenditures not incurred by us. The capital lease obligation will increase upon completion of the modifications and funding by the Amazon Owner. At September 30, 2018, Property, plant and equipment, net included a $54 million asset (net of accumulated amortization of $1 million) and a capital lease liability of approximately $53 million.
In May 2018, we entered into a capital lease arrangement for a jack-up barge and, as of September 30, 2018, Property, plant and equipment, net included a $17 million asset (net of accumulated amortization of $0.3 million) relating to that arrangement, along with a corresponding capital lease liability.
Other
Contractual Obligations―The following represents an update as of September 30, 2018 to contractual obligations previously disclosed in our 2017 Form 10-K, primarily resulting from the Combination:
|
|
|
|
|
|
|
Less than |
|
|
1-3 |
|
|
3-5 |
|
|
More than |
|
||||
|
|
|
Total |
|
|
1 Year |
|
|
Years |
|
|
Years |
|
|
5 Years |
|
|||||
|
|
|
(In millions) |
|
|||||||||||||||||
|
Debt and capital lease obligations (1) |
|
$ |
3,649 |
|
|
$ |
43 |
|
|
$ |
71 |
|
|
$ |
59 |
|
|
$ |
3,476 |
|
|
Estimated interest payments (2) |
|
|
1,986 |
|
|
|
316 |
|
|
|
632 |
|
|
|
624 |
|
|
|
414 |
|
|
Operating leases (3) |
|
|
441 |
|
|
|
71 |
|
|
|
110 |
|
|
|
78 |
|
|
|
182 |
|
|
(1) |
Amounts represent the expected cash payments for the principal amounts related to our debt, including capital lease obligations. Amounts exclude debt issuance costs and interest. |
|
(2) |
Amounts represent the expected cash payments for interest on our long-term debt and capital lease obligations. |
|
(3) |
Amounts represent future minimum payments under non-cancelable operating leases with initial or remaining terms of one year or more. |
Shelf Registration Statement―We filed a shelf registration statement with the SEC, which became effective automatically and is scheduled to expire in September 2021. The shelf registration statement enables us to offer and sell shares of our common or preferred stock and issue debt or other securities from time to time subsequent to the filing of a prospectus supplement which, among other things, would identify the underwriters, specify the number and value of securities that may be sold, and provide the time frame over which securities may be offered.
|
|
73 |
|
MANAGEMENT’S DISCUSSION AND ANALYSIS OF FINANCIAL CONDITION AND RESULTS OF OPERATIONS
Other―A portion of our pension plans’ assets are invested in EU government securities, which could be impacted by economic turmoil in Europe or a full or partial break-up of the EU or its currency, the Euro. However, given the long-term nature of pension funding requirements, in the event any of our pension plans (including those with investments in EU government securities) become materially underfunded from a decline in value of our plan assets, we believe our cash on hand and amounts available under our existing Revolving Credit Facility would be sufficient to fund any increases in future contribution requirements.
We are a defendant in a number of lawsuits arising in the normal course of business and we have in place appropriate insurance coverage for the type of work that we perform. As a matter of standard policy, we review our litigation accrual quarterly and as further information is known on pending cases, increases or decreases, as appropriate, may be recorded. See Note 21, Commitments and Contingencies, to the Financial Statements for a discussion of pending litigation.
Critical Accounting Policies and Estimates
For a discussion of the impact of critical accounting policies and estimates on our Consolidated Financial Statements, refer to Item 7 “Management’s Discussion and Analysis of Financial Condition and Results of Operations” included in the July 31 Form 8-K. Additionally, see Note 2, Basis of Presentation and Significant Accounting Policies, to the Financial Statements for discussion of the impact of critical accounting policies and estimates identified as part of the Combination.
New Accounting Standards
See Note 2, Basis of Presentation and Significant Accounting Policies, to the Financial Statements for a discussion of the potential impact of new accounting standards on our Financial Statements.
|
|
74 |
|
QUANTITATIVE AND QUALITATIVE DISCLOSURES ABOUT MARKET RISK
Item 3. Quantitative and Qualitative Disclosures about Market Risk
Foreign Currency Exchange Risk
In the normal course of business, our results of operations are exposed to certain market risks, primarily associated with fluctuations in currency exchange rates.
We have operations in many locations around the world and are involved in transactions in currencies other than those of our entity’s functional currencies, which could adversely affect our results of operations due to changes in currency exchange rates or weak economic conditions in foreign markets. We manage these risks associated with currency exchange rate fluctuations by hedging those risks with foreign currency derivative instruments. Historically, we have hedged those risks with foreign currency forward contracts. In certain cases, contracts with our customers may contain provisions under which payments from our customers are denominated in U.S. dollars and in a foreign currency. The payments denominated in a foreign currency are designed to compensate us for costs that we expect to incur in such foreign currency. In these cases, we may use derivative instruments to reduce the risks associated with currency exchange rate fluctuations arising from differences in timing of our foreign currency cash inflows and outflows. The related gains and losses on these contracts are either: (i) deferred as a component of Accumulated Other Comprehensive Income (“AOCI”) until the hedged item is recognized in earnings; (ii) offset against the change in fair value of the hedged firm commitment through earnings; or (iii) recognized immediately in earnings.
At September 30, 2018, the notional value of our outstanding forward contracts to hedge certain foreign currency exchange-related operating exposures was $930 million. The total fair value of these contracts was a net liability of approximately $14 million at September 30, 2018. The potential change in fair value for our outstanding contracts resulting from a hypothetical ten percent change in quoted foreign currency exchange rates would have been approximately $10 million at September 30, 2018. This potential change in fair value of our outstanding contracts would be offset by the change in fair value of the associated underlying operating exposures.
We are exposed to fluctuating exchange rates relates to the effects of translating financial statements of entities with functional currencies other than the U.S. Dollar into our reporting currency. With respect to the translation of our balance sheet, net movements in the Australian Dollar, British Pound, and Euro exchange rates against the U.S. Dollar unfavorably impacted the cumulative translation adjustment component of AOCI by approximately $20 million, net of tax, and our cash balance as unfavorably impacted by approximately $30 million as of September 30, 2018. We generally do not hedge our exposure to potential foreign currency translation adjustments.
Interest Rate Risk
On May 8, 2018, we entered into U.S. dollar floating-to-fixed interest rate swap arrangement to mitigate exposure associated with cash flow variability on our $2.26 billion Term Facility in an aggregate notional value of $1.94 billion. The swap arrangement has been designated as a cash flow hedge as its critical terms matched those of the Term Facility at inception and through September 30, 2018. Accordingly, changes in the fair value of the swap arrangement are initially recorded in AOCI and then reclassified into earnings in the period in which corresponding interest payments are made. As of September 30, 2018, the fair value of the swap arrangement was in a net liability position totaling approximately $0.4 million. The potential change in fair value for our interest rate swap resulting from a hypothetical one percent change in the Eurodollar rate would have been approximately $64 million at September 30, 2018.
At September 30, 2018, the fair value of our Term Facility, based on current market rates for debt with similar credit risk and maturities, approximated their carrying values as interest is based upon the Eurodollar rate plus an applicable floating margin. Our Senior Notes had an approximate fair value of $1.4 billion at September 30, 2018, based on current market rates for debt with similar credit risk and maturities and was categorized within level 2 on the valuation hierarchy. See Note 16, Fair Value Measurements, to the Financial Statements for further discussion of our financial instruments.
|
|
75 |
|
CONTROLS AND PROCEDURES
Item 4. Controls and Procedures
Disclosure Controls and Procedures—As of the end of the period covered by this quarterly report, we carried out an evaluation, under the supervision and with the participation of our management, including our Chief Executive Officer and Chief Financial Officer, of the effectiveness of the design and operation of our disclosure controls and procedures (as that term is defined in Rules 13a-15(e) and 15d-15(e) adopted by the SEC under the Securities Exchange Act of 1934, as amended (the “Exchange Act”)). Our disclosure controls and procedures were developed through a process in which our management applied its judgment in assessing the costs and benefits of such controls and procedures, which, by their nature, can provide only reasonable assurance regarding the control objectives. You should note that the design of any system of disclosure controls and procedures is based in part upon various assumptions about the likelihood of future events, and we cannot assure you that any design will succeed in achieving its stated goals under all potential future conditions, regardless of how remote. Based on the evaluation referred to above, our Chief Executive Officer and Chief Financial Officer concluded that the design and operation of our disclosure controls and procedures are effective as of September 30, 2018 to provide reasonable assurance that information required to be disclosed by us in the reports that we file or submit under the Exchange Act is recorded, processed, summarized and reported within the time periods specified in the rules and forms of the Securities and Exchange Commission, and such information is accumulated and communicated to management, including our principal executive and principal financial officers or persons performing similar functions, as appropriate to allow timely decisions regarding disclosure.
As previously disclosed, we completed the Combination on May 10, 2018. As of September 30, 2018, we are in the process of reviewing and evaluating CB&I’s internal control over financial reporting as part of the process of aligning and integrating the business and operations. As permitted by SEC guidance for newly acquired businesses, management’s assessment of our disclosure controls and procedures did not include an assessment of those controls and procedures specific to the operations of CB&I that are part of the acquired operation’s internal controls over financial reporting. CB&I accounted for approximately 65% of total assets as of September 30, 2018 and approximately 76% and 61% of total revenues of the combined company for the three and nine months ended September 30, 2018, respectively.
Changes in Internal Control Over Financial Reporting—With exception of the Combination, there has been no change in our internal control over financial reporting, which was identified in connection with the evaluation required by paragraph (d) of Rules 13a-15 and 15d-15 under the Exchange Act, during the quarter ended September 30, 2018 that has materially affected, or is reasonably likely to materially affect, our internal control over financial reporting.
|
|
76 |
|
OTHER INFORMATION
For information regarding ongoing investigations and litigation, see Note 21, Commitments and Contingencies to our unaudited Financial Statements in Part I of this report, which we incorporate by reference into this Item.
See discussions in “Item 1A. Risk Factors” in our Annual Report on Form 10-K for the year ended December 31, 2017 and “Item 1A. Risk Factors” in our Quarterly Report on Form 10-Q for the quarterly period ended June 30, 2018 for discussions of various risk factors relating to our business and operations and investments in our securities.
|
|
77 |
|
OTHER INFORMATION
Series D Participating Preferred Stock—On October 29, 2018, our Board of Directors took action to eliminate a series of preferred stock previously designated as Series D Participating Preferred Stock, which was established in 2001. No shares of such preferred stock were ever issued.
Pro Forma Information—The following pro forma information is provided for purposes of our Shelf Registration Statement described in Item 2 “Management’s Discussion and Analysis of Financial Condition and Results of Operations” in Part I of this report.
|
|
78 |
|
OTHER INFORMATION
|
COMBINED McDERMOTT INTERNATIONAL, INC. |
|
|||||||||||||||||
|
UNAUDITED PRO FORMA COMBINED STATEMENTS OF OPERATIONS |
|
|||||||||||||||||
|
FOR THE NINE MONTHS ENDED SEPTEMBER 30, 2018 |
|
|||||||||||||||||
|
(in millions, except per share amounts) |
|
|||||||||||||||||
|
|
|
|
|
|
|
|
|
|
|
|
|
|
|
|
|
|
|
|
|
|
|
McDermott |
|
|
CB&I (1/1/2018-5/10/2018) |
|
|
Pro Forma Adjustments |
|
|
Footnotes |
|
Pro Forma Combined |
|
||||
|
Revenues |
|
$ |
4,632 |
|
|
$ |
2,503 |
|
|
$ |
- |
|
|
|
|
$ |
7,135 |
|
|
|
|
|
|
|
|
|
|
|
|
|
|
|
|
|
|
|
- |
|
|
Costs and Expenses: |
|
|
|
|
|
|
|
|
|
|
|
|
|
|
|
|
|
|
|
Cost of operations |
|
|
3,948 |
|
|
|
2,328 |
|
|
|
(3 |
) |
|
(a) |
|
|
6,273 |
|
|
Project related intangibles amortization |
|
|
42 |
|
|
|
- |
|
|
|
33 |
|
|
(b) |
|
|
75 |
|
|
Total cost of operations |
|
|
3,990 |
|
|
|
2,328 |
|
|
|
30 |
|
|
|
|
|
6,348 |
|
|
Research and development expenses |
|
|
13 |
|
|
|
- |
|
|
|
11 |
|
|
(a) |
|
|
24 |
|
|
Selling, general and administrative expenses |
|
|
188 |
|
|
|
90 |
|
|
|
- |
|
|
|
|
|
278 |
|
|
Other intangibles amortization |
|
|
35 |
|
|
|
9 |
|
|
|
13 |
|
|
(c) |
|
|
57 |
|
|
Transaction costs |
|
|
45 |
|
|
|
- |
|
|
|
(45 |
) |
|
(d) |
|
|
- |
|
|
Restructuring and integration costs |
|
|
106 |
|
|
|
12 |
|
|
|
(118 |
) |
|
(d) |
|
|
- |
|
|
Other operating expenses (income), net |
|
|
2 |
|
|
|
(2 |
) |
|
|
- |
|
|
|
|
|
- |
|
|
Total expenses |
|
|
4,379 |
|
|
|
2,437 |
|
|
|
(109 |
) |
|
|
|
|
6,707 |
|
|
|
|
|
|
|
|
|
|
|
|
|
|
|
|
|
|
|
|
|
|
Income (loss) from investments in unconsolidated affiliates |
|
|
2 |
|
|
|
12 |
|
|
|
- |
|
|
|
|
|
14 |
|
|
Investment in unconsolidated affiliates-related amortization |
|
|
(13 |
) |
|
|
- |
|
|
|
(18 |
) |
|
(e) |
|
|
(31 |
) |
|
Operating income |
|
|
242 |
|
|
|
78 |
|
|
|
91 |
|
|
|
|
|
411 |
|
|
|
|
|
|
|
|
|
|
|
|
|
|
|
|
|
|
|
|
|
|
Other expense: |
|
|
|
|
|
|
|
|
|
|
|
|
|
|
|
|
|
|
|
Interest expense, net |
|
|
(169 |
) |
|
|
(74 |
) |
|
|
(16 |
) |
|
(f) |
|
|
(259 |
) |
|
Other non-operating (expense) income, net |
|
|
(13 |
) |
|
|
- |
|
|
|
14 |
|
|
(g) |
|
|
1 |
|
|
Total other expense, net |
|
|
(182 |
) |
|
|
(74 |
) |
|
|
(2 |
) |
|
|
|
|
(258 |
) |
|
|
|
|
|
|
|
|
|
|
|
|
|
|
|
|
|
|
|
|
|
Income before provision for income taxes |
|
|
60 |
|
|
|
4 |
|
|
|
89 |
|
|
|
|
|
153 |
|
|
|
|
|
|
|
|
|
|
|
|
|
|
|
|
|
|
|
|
|
|
Income tax expense (benefit) |
|
|
(19 |
) |
|
|
30 |
|
|
|
20 |
|
|
(h) |
|
|
31 |
|
|
|
|
|
|
|
|
|
|
|
|
|
|
|
|
|
|
|
|
|
|
Net income (loss) |
|
|
79 |
|
|
|
(26 |
) |
|
|
69 |
|
|
|
|
|
122 |
|
|
|
|
|
|
|
|
|
|
|
|
|
|
|
|
|
|
|
|
|
|
Less: Loss attributable to noncontrolling interests |
|
|
(5 |
) |
|
|
(1 |
) |
|
|
- |
|
|
|
|
|
(6 |
) |
|
|
|
|
|
|
|
|
|
|
|
|
|
|
|
|
|
|
|
|
|
Net income (loss) attributable to McDermott |
|
$ |
84 |
|
|
$ |
(25 |
) |
|
$ |
69 |
|
|
|
|
$ |
128 |
|
|
|
|
|
|
|
|
|
|
|
|
|
|
|
|
|
|
|
|
|
|
Net income per share attributable to McDermott |
|
|
|
|
|
|
|
|
|
|
|
|
|
|
|
|
|
|
|
Basic |
|
|
|
|
|
|
|
|
|
|
|
|
|
|
|
0.71 |
|
|
|
Diluted |
|
|
|
|
|
|
|
|
|
|
|
|
|
|
|
0.71 |
|
|
|
|
|
|
|
|
|
|
|
|
|
|
|
|
|
|
|
|
|
|
|
Shares used in the computation of net income per share: |
|
|
|
|
|
|
|
|
|
|
|
|
|
|
|
|
|
|
|
Basic |
|
|
|
|
|
|
|
|
|
|
|
|
|
(i) |
|
180 |
|
|
|
Diluted |
|
|
|
|
|
|
|
|
|
|
|
|
|
(i) |
|
181 |
|
|
|
|
79 |
|
OTHER INFORMATION
|
COMBINED McDERMOTT INTERNATIONAL, INC. |
|
|||||||||||||||||||||||
|
|
||||||||||||||||||||||||
|
FOR THE YEAR ENDED DECEMBER 31, 2017 |
|
|||||||||||||||||||||||
|
(in millions, except per share amounts) |
|
|||||||||||||||||||||||
|
|
|
|
|
|
|
|
|
|
|
|
|
|
|
|
|
|
|
|
||||||
|
|
|
McDermott |
|
|
CB&I |
|
|
Pro Forma Adjustments |
|
|
Footnotes |
|
Pro Forma Combined |
|
||||||||||
|
Revenues |
|
$ |
2,985 |
|
|
$ |
6,673 |
|
|
$ |
- |
|
|
|
|
$ |
9,658 |
|
||||||
|
|
|
|
|
|
|
|
|
|
|
|
|
|
|
|
|
|
- |
|
||||||
|
Costs and Expenses: |
|
|
|
|
|
|
|
|
|
|
|
|
|
|
|
|
|
|
||||||
|
Cost of operations |
|
|
2,449 |
|
|
|
6,666 |
|
|
|
(31 |
) |
|
(a) |
|
|
9,084 |
|
||||||
|
Project related intangibles amortization |
|
|
- |
|
|
|
- |
|
|
|
101 |
|
|
(b) |
|
|
101 |
|
||||||
|
Total cost of operations |
|
|
2,449 |
|
|
|
6,666 |
|
|
|
70 |
|
|
|
|
|
9,185 |
|
||||||
|
Research and development expenses |
|
|
5 |
|
|
|
- |
|
|
|
27 |
|
|
(a) |
|
|
32 |
|
||||||
|
Selling, general and administrative expenses |
|
|
204 |
|
|
|
275 |
|
|
|
- |
|
|
|
|
|
479 |
|
||||||
|
Other intangibles amortization |
|
|
- |
|
|
|
26 |
|
|
|
57 |
|
|
(c) |
|
|
83 |
|
||||||
|
Transaction costs |
|
|
9 |
|
|
|
- |
|
|
|
(9 |
) |
|
(d) |
|
|
- |
|
||||||
|
Restructuring and integration costs |
|
|
- |
|
|
|
114 |
|
|
|
(114 |
) |
|
(d) |
|
|
- |
|
||||||
|
Other operating income, net |
|
|
(1 |
) |
|
|
(65 |
) |
|
|
- |
|
|
|
|
|
(66 |
) |
||||||
|
Total expenses |
|
|
2,666 |
|
|
|
7,016 |
|
|
|
31 |
|
|
|
|
|
9,713 |
|
||||||
|
|
|
|
|
|
|
|
|
|
|
|
|
|
|
|
|
|
|
|
||||||
|
Income (loss) from investments in unconsolidated affiliates |
|
|
(12 |
) |
|
|
48 |
|
|
|
- |
|
|
|
|
|
36 |
|
||||||
|
Investment in unconsolidated affiliates-related amortization |
|
|
- |
|
|
|
- |
|
|
|
(35 |
) |
|
(e) |
|
|
(35 |
) |
||||||
|
Operating income (expense) |
|
|
307 |
|
|
|
(295 |
) |
|
|
(66 |
) |
|
|
|
|
(54 |
) |
||||||
|
|
|
|
|
|
|
|
|
|
|
|
|
|
|
|
|
|
|
|
||||||
|
Other expense: |
|
|
|
|
|
|
|
|
|
|
|
|
|
|
|
|
|
|
||||||
|
Interest expense, net |
|
|
(63 |
) |
|
|
(226 |
) |
|
|
(57 |
) |
|
(f) |
|
|
(346 |
) |
||||||
|
Other non-operating income, net |
|
|
5 |
|
|
|
- |
|
|
|
|
|
|
(g) |
|
|
5 |
|
||||||
|
Total other expense, net |
|
|
(58 |
) |
|
|
(226 |
) |
|
|
(57 |
) |
|
|
|
|
(341 |
) |
||||||
|
|
|
|
|
|
|
|
|
|
|
|
|
|
|
|
|
|
|
|
||||||
|
Income before provision for income taxes |
|
|
249 |
|
|
|
(521 |
) |
|
|
(123 |
) |
|
|
|
|
(395 |
) |
||||||
|
|
|
|
|
|
|
|
|
|
|
|
|
|
|
|
|
|
|
|
||||||
|
Income tax expense (benefit) |
|
|
69 |
|
|
|
799 |
|
|
|
(44 |
) |
|
(h) |
|
|
824 |
|
||||||
|
|
|
|
|
|
|
|
|
|
|
|
|
|
|
|
|
|
|
|
||||||
|
Non-operating loss from investments in unconsolidated affiliates |
|
|
(2 |
) |
|
|
- |
|
|
|
- |
|
|
|
|
|
(2 |
) |
||||||
|
|
|
|
|
|
|
|
|
|
|
|
|
|
|
|
|
|
|
|
||||||
|
Net income (loss) |
|
|
178 |
|
|
|
(1,320 |
) |
|
|
(79 |
) |
|
|
|
|
(1,221 |
) |
||||||
|
|
|
|
|
|
|
|
|
|
|
|
|
|
|
|
|
|
|
|
||||||
|
Less: Net (loss) income attributable to noncontrolling interests |
|
|
(1 |
) |
|
|
33 |
|
|
|
- |
|
|
|
|
|
32 |
|
||||||
|
|
|
|
|
|
|
|
|
|
|
|
|
|
|
|
|
|
|
|
||||||
|
Net income (loss) attributable to McDermott |
|
$ |
179 |
|
|
$ |
(1,353 |
) |
|
$ |
(79 |
) |
|
|
|
$ |
(1,253 |
) |
||||||
|
|
|
|
|
|
|
|
|
|
|
|
|
|
|
|
|
|
|
|
||||||
|
Net loss per share attributable to McDermott |
|
|
|
|
|
|
|
|
|
|
|
|
|
|
|
|
|
|
||||||
|
Basic |
|
|
|
|
|
|
|
|
|
|
|
|
|
|
|
|
(6.96 |
) |
||||||
|
Diluted |
|
|
|
|
|
|
|
|
|
|
|
|
|
|
|
|
(6.96 |
) |
||||||
|
|
|
|
|
|
|
|
|
|
|
|
|
|
|
|
|
|
|
|
||||||
|
Shares used in the computation of net loss per share: |
|
|
|
|
|
|
|
|
|
|
|
|
|
|
|
|
|
|
||||||
|
Basic |
|
|
|
|
|
|
|
|
|
|
|
|
|
(i) |
|
180 |
|
|||||||
|
Diluted |
|
|
|
|
|
|
|
|
|
|
|
|
|
(i) |
|
180 |
|
|||||||
|
|
80 |
|
OTHER INFORMATION
The pro forma adjustments are based on our preliminary estimates and assumptions that are subject to change. The following adjustments have been reflected in the Unaudited Pro Forma Combined Financial Statements:
|
|
(a) |
Cost of operations—Adjustment represents: (1) the reclassification of research and development costs of $11 million and $27 million from cost of operations to conform to our financial statement presentation for the nine months ended September 30, 2018 and the year ended December 31, 2017, respectively; (2) adjustment to record additional estimated depreciation expense for the acquired tangible assets of $8 million and $10 million for the nine months ended September 30, 2018 and the year ended December 31, 2017, respectively; and (3) adjustment to cost of operations of $14 million for CB&I’s pension actuarial gain to conform to McDermott’s mark-to-market pension accounting policy for the year ended December 31, 2017. |
|
|
(b) |
Project related intangibles amortization—Represents an adjustment to record estimated amortization expense for project related intangibles acquired as a result of Combination. |
|
|
(c) |
Other intangibles amortization—Represents an adjustment to record estimated amortization expense for other identifiable intangible assets acquired as a result of Combination and elimination of CBI’s historical amortization of intangible assets. |
|
|
(d) |
Transaction, restructuring and integration cost—Represents an adjustment to eliminate costs incurred in connection with Combination and costs incurred to achieve our combination profitability initiative. |
|
|
(e) |
Investment in unconsolidated affiliates-related amortization—Represents an adjustment to record amortization expense associated with fair value adjustment of our investment in unconsolidated affiliates in connection with the Combination. |
|
|
(f) |
Interest expense, net—Represents a net increase in interest expense as a result of the refinancing of the pre-existing debt obligations of McDermott and CB&I. |
|
|
(g) |
Non-operating income (expense)—Represents an adjustment to eliminate debt extinguishment costs of $14 million incurred in the second quarter of 2018 relating to the write-off of: (1) make-whole fees paid in connection with the redemption of our $500 million 8.000% second-lien notes; and (2) deferred debt issuance costs resulting from the extinguishment of our previous debt arrangements. |
|
|
(h) |
Income tax expense (benefit)—Represents adjustments to reflect the tax effects of the pro forma adjustments at an estimated combined business effective tax rate of 23% and 35% based on the jurisdictions where the combined business operates, for the nine months ended September 30, 2018 and year ended December 31, 2017, respectively. The effective tax rate of the combined business could be significantly different from the rate indicated in these Unaudited Pro Forma Combined Financial Statements for a variety of reasons, including post-Combination activities. |
|
|
(i) |
Shares used in the computation of net income (loss) per share— a net income (loss) per share was calculated using weighted average basic and diluted shares outstanding during three months ended September 30, 2018. The effects of dilutive securities were not included in the calculation of diluted EPS for the year ended December 31, 2017 due to the net loss for that period. |
|
|
81 |
|
EXHIBITS
EXHIBIT INDEX
|
Exhibit Number |
|
Description |
|
|
|
|
|
3.1* |
|
|
|
|
|
|
|
3.2* |
|
|
|
|
|
|
|
12.1 |
|
|
|
|
|
|
|
31.1 |
|
Rule 13a-14(a)/15d-14(a) certification of Chief Executive Officer. |
|
|
|
|
|
31.2 |
|
Rule 13a-14(a)/15d-14(a) certification of Chief Financial Officer. |
|
|
|
|
|
32.1 |
|
|
|
|
|
|
|
32.2 |
|
|
|
|
|
|
|
101.INS XBRL |
|
Instance Document. |
|
|
|
|
|
101.SCH XBRL |
|
Taxonomy Extension Schema Document. |
|
|
|
|
|
101.CAL XBRL |
|
Taxonomy Extension Calculation Linkbase Document. |
|
|
|
|
|
101.LAB XBRL |
|
Taxonomy Extension Label Linkbase Document. |
|
|
|
|
|
101.PRE XBRL |
|
Taxonomy Extension Presentation Linkbase Document. |
|
|
|
|
|
101.DEF XBRL |
|
Taxonomy Extension Definition Linkbase Document. |
|
* |
Incorporated by reference to the filing indicated. |
|
|
82 |
|
SIGNATURES
Pursuant to the requirements of the Securities Exchange Act of 1934, the registrant has duly caused this report to be signed on its behalf by the undersigned thereunto duly authorized.
|
October 30, 2018 |
|
|
||
|
|
|
|
||
|
|
|
McDERMOTT INTERNATIONAL, INC. |
||
|
|
|
|
||
|
|
|
By: |
|
/s/ CHRISTOPHER A. KRUMMEL |
|
|
|
|
|
Christopher A. Krummel Global Vice President, Finance and Chief Accounting Officer |
|
|
83 |
|