Attached files
| file | filename |
|---|---|
| EX-32.2 - EX-32.2 - MCDERMOTT INTERNATIONAL INC | mdr-ex322_6.htm |
| EX-32.1 - EX-32.1 - MCDERMOTT INTERNATIONAL INC | mdr-ex321_9.htm |
| EX-31.2 - EX-31.2 - MCDERMOTT INTERNATIONAL INC | mdr-ex312_10.htm |
| EX-31.1 - EX-31.1 - MCDERMOTT INTERNATIONAL INC | mdr-ex311_8.htm |
| EX-12.1 - EX-12.1 - MCDERMOTT INTERNATIONAL INC | mdr-ex121_11.htm |
UNITED STATES
SECURITIES AND EXCHANGE COMMISSION
Washington, D.C. 20549
FORM 10-Q
(Mark One)
|
☑ |
QUARTERLY REPORT PURSUANT TO SECTION 13 OR 15(d) OF THE SECURITIES EXCHANGE ACT OF 1934 |
For the quarterly period ended March 31, 2018
OR
|
☐ |
TRANSITION REPORT PURSUANT TO SECTION 13 OR 15(d) OF THE SECURITIES EXCHANGE ACT OF 1934 |
For the transition period from to
Commission File No. 001-08430
McDERMOTT INTERNATIONAL, INC.
(Exact name of registrant as specified in its charter)
|
REPUBLIC OF PANAMA |
|
72-0593134 |
|
(State or Other Jurisdiction of Incorporation or Organization) |
|
(I.R.S. Employer Identification No.) |
|
|
|
|
|
4424 West Sam Houston Parkway North HOUSTON, TEXAS |
|
77041 |
|
(Address of Principal Executive Offices) |
|
(Zip Code) |

Registrant’s Telephone Number, Including Area Code: (281) 870-5000
Indicate by check mark whether the registrant (1) has filed all reports required to be filed by Section 13 or 15(d) of the Securities Exchange Act of 1934 during the preceding 12 months (or for such shorter period that the registrant was required to file such reports), and (2) has been subject to such filing requirements for the past 90 days. Yes ☑ No ☐
Indicate by check mark whether the registrant has submitted electronically and posted on its corporate Web site, if any, every Interactive Data File required to be submitted and posted pursuant to Rule 405 of Regulation S-T (§ 232.405 of this chapter) during the preceding 12 months (or for such shorter period that the registrant was required to submit and post such files). Yes ☑ No ☐
Indicate by check mark whether the registrant is a large accelerated filer, an accelerated filer, a non-accelerated filer, a smaller reporting company, or an emerging growth company. See the definitions of “large accelerated filer,” “accelerated filer”, “smaller reporting company” and “emerging growth company” in Rule 12b-2 of the Exchange Act.
|
Large accelerated filer |
☑ |
Accelerated filer |
☐ |
|
|
|
|
|
|
Non-accelerated filer |
☐ (Do not check if a smaller reporting company) |
Smaller reporting company |
☐ |
|
|
|
|
|
|
|
|
Emerging growth company |
☐ |
If an emerging growth company, indicate by check mark if the registrant has elected not to use the extended transition period for complying with any new or revised financial accounting standards provided pursuant to Section 13(a) of the Exchange Act. ☐
Indicate by check mark whether the registrant is a shell company (as defined in Rule 12b-2 of the Exchange Act). Yes ☐ No ☑
The number of shares of the registrant’s common stock outstanding at April 20, 2018 was 285,899,713.
TABLE OF CONTENTS
McDERMOTT INTERNATIONAL, INC.
INDEX—FORM 10-Q
|
|
|
PAGE |
|
|
1 |
|
|
|
1 |
|
|
|
1 |
|
|
|
2 |
|
|
|
3 |
|
|
|
4 |
|
|
|
5 |
|
|
|
6 |
|
|
Item 2—Management’s Discussion and Analysis of Financial Condition and Results of Operations |
|
28 |
|
Item 3—Quantitative and Qualitative Disclosures about Market Risk |
|
41 |
|
|
42 |
|
|
|
43 |
|
|
|
43 |
|
|
|
44 |
|
|
|
46 |
CONSOLIDATED FINANCIAL STATEMENTS
PART I: Item 1—FINANCIAL INFORMATION
See accompanying Notes to the Consolidated Financial Statements.
|
|
1 |
|

CONSOLIDATED FINANCIAL STATEMENTS
See accompanying Notes to the Consolidated Financial Statements.
|
|
2 |
|
CONSOLIDATED FINANCIAL STATEMENTS
|
McDERMOTT INTERNATIONAL, INC. |
|
|||||||
|
|
||||||||
|
|
|
|
|
|||||
|
|
|
March 31, 2018 |
|
|
December 31, 2017 |
|
||
|
|
|
(In thousands, except share and per share amounts) |
|
|||||
|
Assets |
|
(Unaudited) |
|
|
|
|
|
|
|
Current assets: |
|
|
|
|
|
|
|
|
|
Cash and cash equivalents |
|
$ |
412,725 |
|
|
$ |
390,263 |
|
|
Restricted cash and cash equivalents |
|
|
6,074 |
|
|
|
17,929 |
|
|
Accounts receivable—trade, net |
|
|
395,073 |
|
|
|
328,302 |
|
|
Accounts receivable—other |
|
|
52,818 |
|
|
|
40,730 |
|
|
Contracts in progress |
|
|
506,420 |
|
|
|
621,411 |
|
|
Other current assets |
|
|
43,519 |
|
|
|
35,615 |
|
|
Total current assets |
|
|
1,416,629 |
|
|
|
1,434,250 |
|
|
Property, plant and equipment |
|
|
2,659,414 |
|
|
|
2,651,087 |
|
|
Less accumulated depreciation |
|
|
(994,237 |
) |
|
|
(985,273 |
) |
|
Property, plant and equipment, net |
|
|
1,665,177 |
|
|
|
1,665,814 |
|
|
Accounts receivable—long-term retainages |
|
|
40,154 |
|
|
|
39,253 |
|
|
Investments in Unconsolidated Affiliates |
|
|
5,318 |
|
|
|
7,501 |
|
|
Deferred income taxes |
|
|
17,400 |
|
|
|
17,616 |
|
|
Other assets |
|
|
55,970 |
|
|
|
58,386 |
|
|
Total assets |
|
$ |
3,200,648 |
|
|
$ |
3,222,820 |
|
|
|
|
|
|
|
|
|
|
|
|
Liabilities and Equity |
|
|
|
|
|
|
|
|
|
Current liabilities: |
|
|
|
|
|
|
|
|
|
Notes payable and current maturities of long-term debt |
|
$ |
24,264 |
|
|
$ |
24,264 |
|
|
Accounts payable |
|
|
191,561 |
|
|
|
279,109 |
|
|
Accrued liabilities |
|
|
341,637 |
|
|
|
336,747 |
|
|
Advance billings on contracts |
|
|
40,207 |
|
|
|
32,252 |
|
|
Income taxes payable |
|
|
40,670 |
|
|
|
34,562 |
|
|
Total current liabilities |
|
|
638,339 |
|
|
|
706,934 |
|
|
Long-term debt |
|
|
512,994 |
|
|
|
512,713 |
|
|
Self-insurance |
|
|
16,550 |
|
|
|
16,097 |
|
|
Pension liabilities |
|
|
14,535 |
|
|
|
14,400 |
|
|
Non-current income taxes |
|
|
63,798 |
|
|
|
62,881 |
|
|
Other liabilities |
|
|
115,479 |
|
|
|
121,018 |
|
|
Total liabilities |
|
|
1,361,695 |
|
|
|
1,434,043 |
|
|
Commitments and contingencies |
|
|
|
|
|
|
|
|
|
Stockholders' equity: |
|
|
|
|
|
|
|
|
|
Common stock, par value $1.00 per share, authorized 400,000,000 shares; |
|
|
|
|
|
|
|
|
|
issued 294,407,255 and 292,525,841 shares, respectively |
|
|
294,407 |
|
|
|
292,526 |
|
|
Capital in excess of par value |
|
1,657,744 |
|
|
|
1,663,091 |
|
|
|
Retained earnings/ (Accumulated deficit) |
|
|
6,912 |
|
|
|
(48,221 |
) |
|
Accumulated other comprehensive loss |
|
|
(50,807 |
) |
|
|
(50,448 |
) |
|
Treasury stock, at cost: 8,507,542 and 8,499,021 shares, respectively |
|
|
(96,347 |
) |
|
|
(96,282 |
) |
|
Stockholders' Equity—McDermott |
|
|
1,811,909 |
|
|
|
1,760,666 |
|
|
Noncontrolling interest |
|
|
27,044 |
|
|
|
28,111 |
|
|
Total equity |
|
|
1,838,953 |
|
|
|
1,788,777 |
|
|
Total liabilities and equity |
|
$ |
3,200,648 |
|
|
$ |
3,222,820 |
|
See accompanying Notes to the Consolidated Financial Statements.
|
|
3 |
|
CONSOLIDATED FINANCIAL STATEMENTS
See accompanying Notes to the Consolidated Financial Statements.
|
|
4 |
|
CONSOLIDATED FINANCIAL STATEMENTS
See accompanying Notes to the Consolidated Financial Statements.
|
|
5 |
|
NOTES TO THE CONSOLIDATED FINANCIAL STATEMENTS (UNAUDITED)
|
|
|
PAGE |
|
Note 1—Basis of Presentation and Significant Accounting Policies |
|
7 |
|
Note 2— Business Combination Agreement with Chicago Bridge & Iron Company N.V. (“CB&I”) |
|
10 |
|
|
13 |
|
|
|
15 |
|
|
|
16 |
|
|
|
16 |
|
|
Note 7—Contracts in Progress and Advance Billings on Contracts |
|
16 |
|
|
17 |
|
|
|
18 |
|
|
|
19 |
|
|
|
20 |
|
|
|
21 |
|
|
|
21 |
|
|
|
22 |
|
|
|
23 |
|
|
|
25 |
|
|
6 |
|
NOTES TO THE CONSOLIDATED FINANCIAL STATEMENTS (UNAUDITED)
NOTE 1—BASIS OF PRESENTATION AND SIGNIFICANT ACCOUNTING POLICIES
Nature of Operations
McDermott International, Inc., a corporation incorporated under the laws of the Republic of Panama in 1959, is a leading provider of integrated engineering, procurement, construction and installation (“EPCI”), front-end engineering and design (“FEED”) and module fabrication services for upstream field developments worldwide. We deliver fixed and floating production facilities, pipeline installations and subsea systems from concept to commissioning for complex offshore and subsea oil and gas projects. Operating in approximately 20 countries across the Americas, Europe, Africa, Asia and Australia, our integrated resources include a diversified fleet of marine vessels, fabrication facilities and engineering offices. We support our activities with comprehensive project management and procurement services, while utilizing our fully integrated capabilities in both shallow water and deepwater construction. Our customers include national, major integrated and other oil and gas companies, and we operate in most major offshore oil and gas producing regions throughout the world. We execute our contracts through a variety of methods, principally fixed-price, but also including cost reimbursable, cost-plus, day-rate and unit-rate basis or some combination of those methods. In these Notes to our Consolidated Financial Statements, unless the context otherwise indicates, “we,” “us” and “our” mean McDermott International, Inc. and its consolidated subsidiaries.
Basis of Presentation
The accompanying Consolidated Financial Statements are unaudited and have been prepared from our books and records in accordance with Rule 10-1 of Regulation S-X for interim financial information. Accordingly, they do not include all of the information and notes required by accounting principles generally accepted in the United States (“U.S. GAAP”) for complete financial statements. In the opinion of our management, all adjustments, consisting only of normal recurring adjustments, considered necessary for a fair presentation have been included. The results of operations for interim periods are not necessarily indicative of results of operations for a full year. These Consolidated Financial Statements should be read in conjunction with our Consolidated Financial Statements and Notes thereto included in our Annual Report on Form 10-K for the year ended December 31, 2017 filed with the U.S. Securities and Exchange Commission (the “SEC”) on February 21, 2018 (the “2017 Form 10-K”).
Classification
Certain prior year amounts have been reclassified for consistency with the current year presentation. Previously reported Consolidated Financial Statements have been adjusted to reflect those changes.
Recently Issued and Adopted Accounting Guidance
Revenue from Contracts with Customers (ASC Topic 606)—In May 2014, the Financial Accounting Standards Board (the “FASB”) issued a new standard related to revenue recognition which supersedes most of the existing revenue recognition requirements in U.S. GAAP and requires entities to recognize revenue at an amount that reflects the consideration to which an entity expects to be entitled in exchange for transferring goods or services to a customer. It also requires significantly expanded disclosures regarding the qualitative and quantitative information of an entity’s nature, amount, timing and uncertainty of revenue and cash flows arising from contracts with customers.
The FASB has issued several amendments to the standard, including clarification on accounting for licenses of intellectual property, identifying performance obligations, reporting gross versus net revenue and narrow-scope revisions and practical expedients.
Adoption—We adopted the new standard on January 1, 2018 (the “initial application” date):
|
|
• |
using the modified retrospective application, with no restatement of the comparative periods presented and a cumulative effect adjustment to retained earnings as of the date of adoption; |
|
|
• |
applying the new standard only to those contracts that are not substantially complete at the date of initial application; and |
|
|
• |
disclosing the impact of the new standard in our 2018 Consolidated Financial Statements. |
|
|
7 |
|
NOTES TO THE CONSOLIDATED FINANCIAL STATEMENTS (UNAUDITED)
Significant changes to our accounting policies as a result of adopting of the new standard are discussed below:
|
|
• |
We measure transfer of control utilizing an input method to measure progress for individual contracts or combinations of contracts based on the total cost of materials, labor, equipment and vessel operating costs and other costs incurred as applicable to each contract. Previously, under ASC Topic 605-35, Construction-Type and Production-Type Contracts (the “legacy GAAP”), we generally excluded certain costs from the cost-to-cost method of measuring project progress, such as significant costs for procured materials and third-party subcontractors; |
|
|
• |
Our Consolidated Balance Sheet no longer reflect assets related to cost incurred in excess of cost recognized. Under legacy GAAP, we generally excluded certain costs from our cost-to-cost method of measuring progress towards completion, such as significant costs for procured materials and third-party subcontractors, which resulted in the recognition of cost incurred in excess of cost recognized as an asset on our Consolidated Financial Statements. |
|
|
• |
Variable consideration, including change orders, claims, bonus, incentive fees and liquidated damages or penalties will be included in the estimated contract revenue at the most likely amount to which we expect to be entitled. We will include variable consideration in the estimated transaction price to the extent we concluded that it is probable a significant revenue reversal will not occur or when the uncertainty associated with the variable consideration is resolved. |
Revenue Recognition
Contracts―Our revenue is typically derived from long-term contracts that can span several years. We determine the appropriate accounting treatment for each of our contracts with customers before work on the project begins. We generally recognize contract revenues and related costs over-time.
Performance Obligation Satisfied Over Time―A performance obligation is a promise in a contract to transfer a distinct good or service to the customer, and is the unit of account in ASC Topic 606. A contract’s transaction price is allocated to each distinct performance obligation and recognized as revenue when, or as, the performance obligation is satisfied. Our performance obligations are generally satisfied over time as work progresses because of continuous transfer of control to the customer. For contracts with multiple performance obligations, we allocate the contract’s transaction price to each performance obligation using our best estimate of the stand-alone selling price of each distinct good or service in the contract.
Method to Measure Progress—We measure transfer of control utilizing an input method to measure progress for individual contracts or combinations of contracts based on the cost incurred to total cost of materials, labor, equipment and vessel operating costs and other costs as applicable to each contract. These costs, once incurred, are considered a measure of progress and are expensed in the period in which they are incurred. Costs incurred prior to a project award, are generally expensed during the period in which they are incurred.
Total estimated project costs and resulting contract income are affected by changes in the expected cost of materials and labor, productivity, vessel costs, scheduling and other factors. Additionally, external factors such as weather, customer requirements and other factors outside of our control may affect the progress and estimated cost of a project’s completion and, therefore, the timing and amount of revenue and income recognition. Changes in total estimated contract cost and losses, if any, are recognized in the period they are determined.
Performance Obligation Satisfied at a Point-in-Time Method—Contracts with performance obligations that do not meet the criteria to be recognized over time are required to be recognized “at a point-in-time”, whereby revenue and gross profit is recognized only when a performance obligation is complete and a customer has obtained control of a promised asset. For contracts with revenues recognized at a point-in-time, we consider physical possession of the asset, legal transfer of title, significant risk rewards of ownership, customer acceptance and our rights to payment in determining when a performance obligation is complete.
Remaining Performance Obligations (“RPOs”)―RPOs represent the dollar amount of revenues we expect to recognize in the future from contracts that are in progress. These amounts are presented in U.S. dollars. Currency risks associated with RPOs that are not mitigated within the contracts are generally mitigated with the use of foreign currency derivative (hedging) instruments, when deemed significant. However, these actions may not eliminate all currency risk exposure included within our long-term contracts. We do not include expected revenues of contracts related to unconsolidated joint ventures in our RPOs, except to the extent of any contract awards we receive from those joint ventures.
|
|
8 |
|
NOTES TO THE CONSOLIDATED FINANCIAL STATEMENTS (UNAUDITED)
RPOs may not be indicative of future operating results, and projects included in RPOs may be cancelled, modified or otherwise altered by customers.
Variable Consideration―The nature of our contracts gives rise to several types of variable consideration, including unpriced change orders, claims, bonuses, incentive fees and liquidated damages or penalties. We estimate variable consideration based on the most likely amount to which we expect to be entitled. We include variable consideration in the estimated transaction price to the extent it is probable that a significant reversal of cumulative revenue recognized will not occur or when we conclude that any significant uncertainty associated with the variable consideration is resolved. Our estimates of variable consideration and determination of whether to include estimated amounts in the transaction price are based largely on an assessment of our anticipated performance and all information (historical, current and forecasted) that is reasonably available to us. The effect of changes in our estimates of variable consideration on the transaction price is recognized as an adjustment to revenues (either as an increase in or a reduction of revenues) on a cumulative catch-up basis.
|
|
• |
Change Orders―Change orders, which are a normal and recurring part of our business, can increase the future scope and cost of a project. Most of our change orders are not distinct from the existing contract and are accounted for as part of that existing contract. The effect of a change order on the transaction price and our measure of progress for the performance obligation to which it relates, is recognized as an adjustment to revenues (either as an increase in or a reduction of revenues) on a cumulative catch-up basis. |
Change orders that may not be approved by the customer until the later stages of a contract or subsequent to the date a project is completed could significantly affect gross profit on a contract. Revenues from unapproved change orders are generally recognized to the extent of the amounts we expect to recover, consistent with our Variable Consideration policy discussed above. If it is probable that a reversal of revenues will occur, the costs attributable to change orders are treated as contract costs without incremental revenues. To the extent change orders included in the price are not resolved in our favor, there could be reductions in, or reversals of previously reported amounts of, revenues and profits, and charges against current earnings, which could be material.
|
|
• |
Claims Revenue—Claims revenue may relate to various factors, including the procurement of materials, equipment performance failures, change order disputes or schedule disruptions and other delays, including factors outside of our control, therefore we believe we are entitled to additional compensation. Claims revenue, when recorded, is only recorded to the extent of the amounts we expect to recover. We include certain unapproved claims in the transaction price when the claims are legally enforceable, we consider collection to be probable and believe we can reliably estimate the ultimate value. Amounts attributable to unpriced change orders are not included in claims. We continue to engage in negotiations with our customers on our outstanding claims. However, these claims may be resolved at amounts that differ from our current estimates, which could result in increases or decreases in future estimated contract profits or losses. Claims are generally negotiated over the course of the respective projects, many of which are long-term in nature. |
Warranties―Our contracts include assurance-type warranties that our performance is free from material defect and consistent with the specifications of our contracts, which do not give rise to a separate performance obligation.
Adoption of the new revenue standard resulted in changes to the timing of revenue recognition and in the reclassification between financial statement line items. See Note 3, Revenue Recognition, for further discussion.
Pension and Postretirement Benefits—In March 2017, the FASB issued Accounting Standards Update (“ASU”) 2017-07, Compensation—Retirement Benefits (Topic 715): Improving the Presentation of Net Periodic Pension Cost and Net Periodic Postretirement Benefit. This ASU requires bifurcation of certain components of net pension and postretirement benefit cost in the Consolidated Statements of Operations. We adopted this ASU effective as of January 1, 2018. As a result, benefit costs, excluding service costs component, previously included in Selling, general and administrate expenses, are now included in Other non-operating income (expense), net in our Consolidated Statements of Operations. All comparable periods presented have been retrospectively revised to reflect this change.
|
|
9 |
|
NOTES TO THE CONSOLIDATED FINANCIAL STATEMENTS (UNAUDITED)
Accounting Guidance Issued But Not Adopted as of March 31, 2018
Financial Instruments—In June 2016, the FASB issued ASU 2016-13, Financial Instruments—Credit Losses (Topic 326): Measurement of Credit Losses on Financial Instruments. This ASU will require a financial asset measured at amortized cost basis to be presented at the net amount expected to be collected. A valuation account, allowance for credit losses, will be deducted from the amortized cost basis of the financial asset to present the net carrying value at the amount expected to be collected on the financial asset. This ASU is effective for interim and annual periods beginning after December 15, 2019. We are currently assessing the impact of this guidance on our future Consolidated Financial Statements and related disclosures.
Leases—In February 2016, the FASB issued ASU 2016-02, Leases (Topic 842). The ASU will require entities that lease assets—referred to as “lessees”—to recognize on the balance sheet the assets and liabilities for the rights and obligations created by leases with lease terms of more than 12 months. Consistent with current U.S. GAAP, the recognition, measurement and presentation of expenses and cash flows arising from a lease by a lessee primarily will depend on its classification as a finance or operating lease. However, unlike current U.S. GAAP—which requires only capital leases to be recognized on the balance sheet—the new ASU will require both types of leases to be recognized on the balance sheet. This ASU is effective for interim and annual periods beginning after December 15, 2018. Early adoption is permitted. We are currently assessing the impact of this ASU on our future Consolidated Financial Statements and related disclosures.
NOTE 2—BUSINESS COMBINATION AGREEMENT WITH CHICAGO BRIDGE & IRON COMPANY N.V. (“CB&I”)
On December 18, 2017, McDermott International, Inc. (“McDermott”), Chicago Bridge & Iron Company N.V. (“CB&I”) and certain of their respective subsidiaries entered into a Business Combination Agreement (as amended, the “Business Combination Agreement”) pursuant to which CB&I and McDermott have agreed to combine their businesses through a series of transactions (the “Combination”). The Business Combination Agreement has been approved by the McDermott Board, the Management Board of CB&I and the Supervisory Board of CB&I.
Upon completion of the Combination, McDermott stockholders will own approximately 53 percent of the combined business on a fully diluted basis and CB&I shareholders will own approximately 47 percent. Under the terms of the Business Combination Agreement, we will exchange all issued and outstanding shares of CB&I common stock for shares of McDermott common stock at the exchange ratio described below. As a result CB&I shareholders will be entitled to receive 2.47221 shares of McDermott Common Stock for each share of CB&I Common Stock owned (or 0.82407 shares if McDermott effects a proposed three-to-one reverse stock split prior to the closing of the Combination), together with cash in lieu of fractional shares.
The Combination would be accounted for using the acquisition method of accounting in accordance with Accounting Standards Codifications (“ASC”) Topic 805, Business Combinations. McDermott would be considered the accounting acquirer based on the following facts: (1) upon completion of the Combination, McDermott’s stockholders will own approximately 53 percent of the combined business on a fully diluted basis; (2) a group of McDermott’s current directors, including Chairman of the Board, will constitute a majority of the Board of Directors; and (3) McDermott’s current President and Chief Executive Officer and current Executive Vice President and Chief Financial Officer will continue in those roles following the closing of the Combination. CB&I’s President and Chief Executive Officer will remain with the combined business for a transition period.
In connection with the Business Combination Agreement, we entered into or received commitment letters (including the exhibits and other attachments thereto, and together with any amendments, modifications or supplements thereto, the “Commitment Letters”) from certain financial institutions to provide debt financing for the Combination. Pursuant to the Commitment Letters, as amended and restated through the date of this report, we expect the following financing arrangements to be reflected in a new credit agreement to be entered into by certain of our subsidiaries (the “Borrowers”) on or before the closing of the Combination (the “New Credit Agreement”):
|
|
• |
a senior secured revolving credit facility providing for revolving credit borrowings and letters of credit in an aggregate principal or face amount of $1.0 billion outstanding at any one time (the “Revolving Facility”); |
|
|
• |
a senior secured letter of credit facility providing for letters of credit in the aggregate face amount of $1.39 billion outstanding at any one time (the “LC Facility”); and |
|
|
10 |
|
NOTES TO THE CONSOLIDATED FINANCIAL STATEMENTS (UNAUDITED)
In addition, on April 18, 2018, McDermott Escrow 1, Inc. and McDermott Escrow 2, Inc. (together, the “Escrow Issuers”) completed the previously announced offering of $1.3 billion in aggregate principal amount of 10.625% senior unsecured notes due 2024 (the “2024 Notes”). The Escrow Issuers represent variable interest entities which will be consolidated by McDermott International, Inc. beginning in the second quarter of 2018. The 2024 Notes were offered to qualified institutional buyers in reliance on Rule 144A under the Securities Act of 1933, as amended (the “Securities Act”), and to certain non-U.S. persons in transactions outside the United States in reliance on Regulation S under the Securities Act. The 2024 Notes were issued pursuant to an Indenture, dated April 18, 2018 (the “Indenture”), by and among the Escrow Issuers and Wells Fargo Bank, National Association, as trustee. The 2024 Notes are scheduled to mature on May 1, 2024.
Pursuant to an escrow agreement (the “Escrow Agreement”), by and among the Escrow Issuers and Wells Fargo Bank, National Association, as escrow agent (the “Escrow Agent”), the proceeds of the offering of the 2024 Notes, together with approximately $28 million, to provide funds sufficient to pay interest on the 2024 Notes through June 29, 2018, were deposited into a segregated escrow account with the Escrow Agent. The funds will remain in escrow until the date on which certain escrow conditions are satisfied and the escrow proceeds are released (the “Escrow Conditions”). Concurrent with the satisfaction of the Escrow Conditions, the Escrow Issuers will merge with and into McDermott Technology (Americas), Inc. (“McDermott Technology (Americas)”) and McDermott Technology (US), Inc. (together with McDermott Technology (Americas), the “Post-Merger Co-Issuers”), with each Post-Merger Co-Issuer being a surviving entity that will assume, by operation of law, the obligations of the applicable Escrow Issuer under the 2024 Notes. Each of the Post-Merger Co-Issuers is a wholly owned subsidiary of McDermott International, Inc.
The 2024 Notes will be subject to a special mandatory redemption at a redemption price equal to 100% of the initial issue price of the 2024 Notes plus accrued interest to, but not including, the redemption date if the Escrow Conditions are not satisfied or the Escrow Issuers determine in their discretion that the Escrow Conditions are incapable of being satisfied on or prior to June 29, 2018.
The proceeds of the offering of the 2024 Notes and loans under the New Credit Agreement are intended to be used: (a) on the closing date for the Combination (the “Effective Date”) to (1) consummate the Combination, including the repayment of certain existing indebtedness of CBI and its subsidiaries, (2) redeem Outstanding Senior Secured Notes, (3) prepay existing indebtedness under, and to terminate in full, the Current Credit Agreement (as defined in Note 8, Debt), and (4) pay fees and expenses in connection with the Combination, the New Credit Agreement and the issuance of the 2024 Notes; and (b) for working capital and other general corporate purposes. On the Effective Date, certain existing letters of credit outstanding under the Current Credit Agreement and certain existing letters of credit outstanding under CBI’s existing credit facilities will be deemed issued under the New Credit Agreement, and letters of credit will be issued under the New Credit Agreement to backstop certain other existing letters of credit issued for the account of McDermott International, Inc., CBI and their respective subsidiaries and affiliates.
The Revolving Facility and the LC Facility are expected to mature on the fifth annual anniversary of the Effective Date. The Term Facility is expected to mature on the seventh annual anniversary of the Effective Date, unless on the date that is six months prior to the scheduled maturity date of the 2024 Notes, more than $350 million of the 2024 Notes are outstanding and our secured leverage ratio (as defined in the New Credit Agreement) is greater than or equal to 1.00 to 1.00, in which case the Term Facility will mature on such date.
From and after the Effective Date the indebtedness and other obligations under the New Credit Agreement, the 2024 Notes and the Indenture will be unconditionally guaranteed on a senior secured basis by McDermott International, Inc. and substantially all of its wholly owned subsidiaries, including wholly owned subsidiaries resulting from the consummation of the Combination (collectively, the “Guarantors”), other than its captive insurance subsidiary and certain other designated or immaterial subsidiaries. From and after the Effective Date, the obligations under the New Credit Agreement will be secured by first-priority liens on substantially all of the Borrowers’ and the Guarantors’ assets.
The New Credit Agreement is expected to include provisions for mandatory commitment reductions and prepayments in connection with, among other events and circumstances, certain asset sales and casualty events. In addition, we will be required to make an annual prepayment of term loans under the Term Facility and thereafter cash collateralize letters of credit issued under the Revolving Facility and the LC Facility with 75% of excess cash flow (as defined in the New Credit Agreement), reducing to 50% of excess cash flow and 25% of excess cash flow depending on our secured leverage ratio. The New Credit Agreement is expected to require the Borrowers to prepay the term loans made under the Term Facility on the last day of each fiscal quarter in an amount equal to approximately $6 million. The New Credit Agreement is expected to otherwise only require periodic interest payments until maturity.
|
|
11 |
|
NOTES TO THE CONSOLIDATED FINANCIAL STATEMENTS (UNAUDITED)
Revolving loans under the Revolving Facility are expected to bear interest at the Borrowers’ option at either the Eurodollar rate (as defined in the New Credit Agreement) plus a margin ranging from 3.75% to 4.25% per year or the base rate (the highest of the Federal Funds rate plus 0.50%, the 30-day Eurodollar rate plus 1.0%, or the administrative agent’s prime rate) plus a margin ranging from 2.75% to 3.25% per year. The applicable margin will vary depending on our leverage ratio (as defined in the New Credit Agreement). Term loans under the Term Facility are expected to bear interest at the Borrowers’ option at either the Eurodollar rate plus a margin of 5.00% per year or the base rate plus a margin of 4.00%, subject to a 1.0% floor with respect to the Eurodollar rate. The Borrowers are expected to be charged a commitment fee of 0.50% per year on the daily amount of the unused portions of the commitments under the Revolving Facility and the LC Facility. Additionally, with respect to all letters of credit outstanding under the New Credit Agreement, the Borrowers are expected to be charged a fronting fee of 0.25% per year and, with respect to all letters of credit outstanding under the New Credit Agreement, a participation fee of (1) between 3.75% to 4.25% per year in respect of financial letters of credit and (2) between 1.875% to 2.125% per year in respect of performance letters of credit, in each case depending on our leverage ratio. The Borrowers are also expected to be required to pay customary issuance fees and other fees and expenses in connection with the issuance of letters of credit under the New Credit Agreement. On the Effective Date, we will be required to pay upfront fees, ticking fees, commitment fees, arrangement fees and other fees to certain lenders, arrangers and agents of the New Credit Agreement.
The New Credit Agreement is expected to include the following financial covenants that will be tested on a quarterly basis, commencing September 30, 2018:
|
|
• |
a minimum permitted fixed charge coverage ratio (as defined in the New Credit Agreement) of 1.50 to 1.00; |
|
|
• |
a maximum permitted leverage ratio of (1) 4.25 to 1.00 for each fiscal quarter ending on or before September 30, 2019, (2) 4.00 to 1.00 for the fiscal quarter ending December 31, 2019, (3) 3.75 to 1.00 for each fiscal quarter ending after December 31, 2019 and on or before December 31, 2020, (4) 3.50 to 1.00 for each fiscal quarter ending after December 31, 2020 and on or before December 31, 2021 and (5) 3.25 to 1.00 for each fiscal quarter ending after December 31, 2021; and |
|
|
• |
a minimum liquidity (as defined in the New Credit Agreement, but generally meaning the sum of our cash and cash equivalents plus unused commitments under the New Credit Agreement available for revolving borrowings) requirement of $200 million. |
In addition, the New Credit Agreement and the Indenture contain various covenants that, among other restrictions, will limit the ability of McDermott International, Inc. and each of its restricted subsidiaries to:
|
|
• |
incur or assume indebtedness; |
|
|
• |
grant or assume liens; |
|
|
• |
make acquisitions or engage in mergers; |
|
|
• |
sell, transfer, assign or convey assets; |
|
|
• |
make investments; |
|
|
• |
repurchase equity and make dividends and certain other restricted payments; |
|
|
• |
change the nature of its business; |
|
|
• |
engage in transactions with affiliates; |
|
|
• |
enter into burdensome agreements; |
|
|
• |
modify its organizational documents; |
|
|
• |
enter into sale and leaseback transactions; |
|
|
• |
make capital expenditures; |
|
|
• |
enter into speculative hedging contracts; and |
|
|
• |
make prepayments on certain junior debt. |
|
|
12 |
|
NOTES TO THE CONSOLIDATED FINANCIAL STATEMENTS (UNAUDITED)
The Indenture contains, and the New Credit Agreement is expected to contain, provisions relating to events of default that we believe are customary for similar financing arrangements.
During the first quarter of 2018, $11 million of costs associated with the Combination were expensed as incurred and were reported in Other operating (income) (expense) in our Consolidated Statements of Operations. Those costs included advisors’ professional fees and integration costs related to the Combination.
Effect of ASC Topic 606 Adoption―The cumulative effect of adopting ASC 606 due to change in method to measure project progress, as discussed in Note 1, Basis Of Presentation and Significant Accounting Policies, is as follows:
|
|
|
Impact of ASC 606 adoption |
|
|||||||||
|
|
|
Legacy GAAP |
|
|
Adjustment |
|
|
As reported |
|
|||
|
|
|
(In thousands) |
|
|||||||||
|
Consolidated Statements of Operations for the quarter ended March 31, 2018 |
|
|
|
|
|
|
|
|
|
|
|
|
|
Revenues |
|
$ |
590,307 |
|
|
$ |
17,511 |
|
|
$ |
607,818 |
|
|
Cost of operations |
|
|
459,991 |
|
|
|
15,720 |
|
|
|
475,711 |
|
|
|
|
|
|
|
|
|
|
|
|
|
|
|
|
Operating Income |
|
|
66,648 |
|
|
|
1,791 |
|
|
|
68,439 |
|
|
|
|
|
|
|
|
|
|
|
|
|
|
|
|
Provision for income taxes |
|
|
19,979 |
|
|
|
736 |
|
|
|
20,715 |
|
|
|
|
|
|
|
|
|
|
|
|
|
|
|
|
Net income |
|
|
34,134 |
|
|
|
1,055 |
|
|
|
35,189 |
|
|
|
|
|
|
|
|
|
|
|
|
|
|
|
|
Consolidated Balance Sheets as of March 31, 2018 |
|
|
|
|
|
|
|
|
|
|
|
|
|
Assets |
|
|
|
|
|
|
|
|
|
|
|
|
|
Current assets: |
|
|
|
|
|
|
|
|
|
|
|
|
|
Contracts in progress |
|
|
493,750 |
|
|
|
12,670 |
|
|
|
506,420 |
|
|
|
|
|
|
|
|
|
|
|
|
|
|
|
|
Liabilities and equity |
|
|
|
|||||||||
|
Current liabilities: |
|
|
|
|
|
|
|
|
|
|
|
|
|
Advance billings on contracts |
|
|
49,310 |
|
|
|
(9,103 |
) |
|
|
40,207 |
|
|
Income taxes payable |
|
|
39,934 |
|
|
|
736 |
|
|
|
40,670 |
|
|
|
|
|
|
|
|
|
|
|
|
|
|
|
|
Stockholders' equity: |
|
|
|
|
|
|
|
|
|
|
|
|
|
Retained earnings (Accumulated deficit) |
|
|
(14,125 |
) |
|
|
21,037 |
|
|
|
6,912 |
|
(1) Includes $20 million of cumulative catch-up adjustment to opening Retained earnings (Accumulated deficit) on January 1, 2018, upon adoption of ASC 606.
Remaining performance obligations (“RPOs”)―Our RPOs are generally satisfied over time as work progresses under our contracts with customers. As of March 31, 2018, we had $3.4 billion of RPOs. The following table summarizes changes to our RPOs (in thousands):
|
RPOs at December 31, 2017 |
$ |
3,901,443 |
|
|
ASC 606 cumulative effect adjustment at January 1, 2018 |
|
(228,126 |
) |
|
RPOs at January 1, 2018 |
|
3,673,317 |
|
|
Bookings from new contracts |
|
193,170 |
|
|
Additions on existing contracts, net |
|
128,004 |
|
|
Less: Amounts recognized in revenues |
|
607,818 |
|
|
RPOs at March 31, 2018 (1) |
$ |
3,386,673 |
|
|
(1) |
At March 31, 2018, approximately 48% of our RPOs were attributable to Saudi Aramco |
|
|
13 |
|
NOTES TO THE CONSOLIDATED FINANCIAL STATEMENTS (UNAUDITED)
Our RPOs by segment were as follows:
|
|
March 31, 2018 |
|
|||||
|
|
(in approximate millions) |
|
|||||
|
AEA |
$ |
969 |
|
|
|
28 |
% |
|
MEA |
|
2,021 |
|
|
|
60 |
% |
|
ASA |
|
397 |
|
|
|
12 |
% |
|
Total |
$ |
3,387 |
|
|
|
100 |
% |
Of the March 31, 2018 RPOs, we expect to recognize revenues as follows:
|
|
2018 |
|
|
2019 |
|
|
Thereafter |
|
|||
|
|
(in approximate millions) |
|
|||||||||
|
Total RPOs |
$ |
1,826 |
|
|
$ |
1,252 |
|
|
$ |
309 |
|
Contract types―We execute our contracts using a variety of pricing models, including fixed-price, unit-basis, cost-plus, or some combination of those methods, with fixed-price being the most prevalent. Additional detail regarding our revenues by contract types is disclosed in Note 16, Segment Reporting.
Change orders—As of March 31, 2018 and 2017, variable consideration associated with unapproved change orders that have been included in transaction prices aggregated to approximately $110 million and $118 million, of which approximately $8 million and $12 million were included in RPOs, respectively.
Claims Revenue―As of March 31, 2018, there were no material claims revenues included in operating results. The amount of revenues included in our transaction prices associated with claims as of March 31, 2018 and 2017 was $10 million, all in our Middle East segment. Claim amounts are determined based on various factors, including our analysis of the underlying contractual language and our experience in making and resolving claims. Our unconsolidated joint ventures did not include any material claims revenues or associated costs in their financial results for the three months ended March 31, 2018 and 2017.
None of the claims as of March 31, 2018, whether material or immaterial, were the subject of any litigation proceedings. We continue to actively engage in negotiations with our customers on our outstanding claims. These claims may be resolved at amounts that differ from our current estimates, which could result in increases or decreases in future estimated contract profits or losses. However, we currently do not expect any significant reversals of revenues.
Loss Recognition―A risk associated with fixed-priced contracts is that revenue from customers may not cover increases in our costs. It is possible that current estimates could materially change for various reasons, including, but not limited to, fluctuations in forecasted labor and vessel productivity, vessel repair requirements, weather downtime, subcontractor or supplier performance, pipeline lay rates or steel and other raw material prices and penalties associated with missed completion deadlines. For all contracts, if a current estimate of total contract cost indicates a loss, the projected loss is recognized in full immediately and reflected in cost of operations in the Consolidated Statements of Operations. It is possible that these estimates could change due to unforeseen events such as changes in productivity, actual downtime and the resolution of change orders and claims with the customers, which could result in adjustments to overall contract costs. Variations from estimated contract performance could result in material adjustments to operating results for any fiscal quarter or year.
In our Consolidated Balance Sheets, the provision for estimated losses on all active uncompleted projects is included in “Advance billings on contracts.”
There were no material active projects as of March 31, 2018 which we determined to be in a substantial loss position.
The provision for estimated losses on all active uncompleted projects in our Consolidated Balance Sheets as of March 31, 2018 and December 31, 2017 were not material.
|
|
14 |
|
NOTES TO THE CONSOLIDATED FINANCIAL STATEMENTS (UNAUDITED)
The following is a discussion of our most significant changes in cost estimates that impacted segment operating income for the three months ended March 31, 2018 and 2017.
Three months ended March 31, 2018
Segment operating income was positively impacted by favorable changes in estimates totaling approximately $37 million in our Middle East (“MEA”) and Asia (“ASA”) segments, which were partially offset by $2 million of net unfavorable changes in estimates in our Americas, Europe and Africa (“AEA”) segment.
MEA—This segment was positively impacted by favorable changes in estimates aggregating approximately $30 million, primarily due to:
|
|
• |
cost savings associated with fabrication, procurement and marine campaigns on two Saudi Aramco lump-sum EPCI projects under the second Saudi Aramco Long Term Agreement (“LTA II”); |
|
|
• |
savings associated with marine campaigns, reimbursement for costs incurred and reduction in estimated costs to complete on multiple projects in the Middle East, none of which were individually material. |
Those favorable changes in estimates were partially offset by higher estimated costs associated with:
|
|
• |
hook-up and marine campaigns on two Saudi Aramco projects; and |
|
|
• |
standby equipment and mechanical equipment downtime on Middle East projects. |
ASA—This segment was positively impacted by favorable changes in estimates aggregating approximately $9 million, primarily due to reduction in estimates of costs to complete several active projects. Those favorable changes in estimates were partially offset by additional costs associated with weather downtime on two active projects.
Three months ended March 31, 2017
Segment operating income for the three months ended March 31, 2017 was positively impacted by net favorable changes in estimates totaling approximately $47 million across all segments.
AEA—This segment was positively impacted by net favorable changes in estimates aggregating approximately $5 million on multiple projects, none of which individually were material.
MEA—This segment was positively impacted by net favorable changes in estimates aggregating approximately $16 million, primarily due to productivity improvements and associated cost savings on Saudi Aramco projects.
ASA—This segment was positively impacted by net favorable changes in estimates aggregating approximately $26 million, primarily as a result of improved cost estimates associated with efficient project execution, including productivity improvements on our marine vessels and associated cost savings achieved, on our active projects.
At December 31, 2016, on the Ichthys project in Australia, we reported a $34 million increase in our estimated costs at completion due to a failure identified in a supplier-provided subsea-pipe connector component that we had previously installed, and we identified possible additional increases of up to $10 million, due to potential need for alternative installation methods. We investigated the cause of the failure and developed a remediation plan in conjunction with the customer. We commenced offshore replacement in June 2017 through a diving intervention method and completed the replacement in 2017. The costs to replace the supplier-provided subsea-pipe connector component were less than our December 31, 2016 estimate. The project remains in an overall profitable position.
|
|
15 |
|
NOTES TO THE CONSOLIDATED FINANCIAL STATEMENTS (UNAUDITED)
NOTE 5—CASH, CASH EQUIVALENTS AND RESTRICTED CASH
The following table provides a reconciliation of cash, cash equivalents and restricted cash reported within the Consolidated Balance Sheets that sum to the totals of such amounts shown in the Consolidated Statements of Cash Flows.
|
|
|
March 31, 2018 |
|
|
December 31, 2017 |
|
||
|
|
|
(in thousands) |
|
|||||
|
Cash and cash equivalents |
|
$ |
412,725 |
|
|
$ |
390,263 |
|
|
Restricted cash and cash equivalents |
|
|
6,074 |
|
|
|
17,929 |
|
|
Total cash, cash equivalents and restricted cash shown in the Consolidated Statements of Cash Flows |
|
$ |
418,799 |
|
|
$ |
408,192 |
|
A majority of our restricted cash balances serve as collateral for letters of credit, discussed in Note 8, Debt.
Accounts Receivable—Trade, Net―A summary of contract receivables is as follows:
|
|
|
March 31, 2018 |
|
|
December 31, 2017 |
|
||
|
|
|
(In thousands) |
|
|||||
|
Contract receivables |
|
$ |
313,758 |
|
|
$ |
225,974 |
|
|
Retainages |
|
|
98,551 |
|
|
|
119,550 |
|
|
Less allowances |
|
|
(17,236 |
) |
|
|
(17,222 |
) |
|
Accounts receivable—trade, net |
|
$ |
395,073 |
|
|
$ |
328,302 |
|
Retainages—Contract retainages generally represent amounts withheld by our customers until project completion, in accordance with the terms of the applicable contracts. The following is a summary of retainages on our contracts:
|
|
|
|
|
|||||
|
|
|
March 31, 2018 |
|
|
December 31, 2017 |
|
||
|
|
|
(In thousands) |
|
|||||
|
Retainages expected to be collected within one year |
|
$ |
98,551 |
|
|
$ |
119,550 |
|
|
Retainages expected to be collected after one year |
|
|
40,154 |
|
|
|
39,253 |
|
|
Total retainages |
|
$ |
138,705 |
|
|
$ |
158,803 |
|
NOTE 7—CONTRACTS IN PROGRESS AND ADVANCE BILLINGS ON CONTRACTS
Contracts in progress, assets—include unbilled amounts typically resulting from revenue recognized exceeding the amount billed to the customer. We bill our customers as work progresses in accordance with agreed-upon contractual terms, mostly upon achievement of contractual milestones. Billing occurring subsequent to revenue recognition results in contract assets. Contract assets may not exceed their net realizable value and are classified as current. We expect to invoice customers for all unbilled revenues. Our payment terms are generally for less than 12 months and our contracts typically do not include a significant financing component.
Advance billings on contracts—include billings to customers that exceed revenues recognized. Most long-term contracts contain provisions for progress payments. Billing occurring prior to revenue recognition results in contract liabilities.
As of March 31, 2018, Contracts in progress, assets and Advance billings on contracts include balances associated with excess of costs recognized over cost incurred on those contracts that are substantially complete at the date of initial application of ASC Topic 606.
|
|
16 |
|
NOTES TO THE CONSOLIDATED FINANCIAL STATEMENTS (UNAUDITED)
Prior to the adoption of ASC Topic 606, certain costs, such as significant costs for materials and third-party subcontractors, were excluded from our cost-to-cost method of measuring progress for revenue recognition, which resulted in the recognition of an asset related to cost incurred in excess of cost recognized. As a result of our adoption of ASC Topic 606 effective January 1, 2018, we now measure transfer of control utilizing an input method to measure progress for individual contracts or combinations of contracts based on the total cost of materials, labor, equipment and vessel operating costs and other costs incurred as applicable to each contract.
Our contract assets and liabilities as of March 31, 2018 and December 31, 2017 were as follows and are reflective of the accounting treatment in effect as of each reporting date:
|
|
|
March 31, 2018 |
|
|
December 31, 2017 |
|
||
|
|
|
(In thousands) |
|
|||||
|
Costs incurred less costs of revenues recognized |
|
$ |
(3,228 |
) |
|
$ |
98,127 |
|
|
Revenues recognized less billings to customers |
|
|
509,648 |
|
|
|
523,284 |
|
|
Contracts in Progress, assets |
|
|
506,420 |
|
|
|
621,411 |
|
|
|
|
|
|
|
|
|
|
|
|
Billings to customers less revenues recognized |
|
|
28,279 |
|
|
|
45,661 |
|
|
Costs incurred less costs of revenues recognized |
|
|
11,928 |
|
|
|
(13,409 |
) |
|
Advance billings on contracts |
|
|
40,207 |
|
|
|
32,252 |
|
|
|
|
|
|
|
|
|
|
|
For the three-months ended March 31, 2018, we recognized $66 million of revenues due to changes in transaction price associated with performance obligations satisfied in prior periods, primarily in our ASA segment. The change in transaction price primarily relates to reimbursement of costs incurred in prior periods.
Revenues recognized for the three-month period ended March 31, 2018 with respect to amounts included in our Advance billings on contracts balance as of December 31, 2017 was $38 million.
The carrying values of our long-term debt obligations, net of unamortized debt issuance costs of $5 million as of March 31, 2018 and December 31, 2017, are as follows:
|
|
|
|
|
|||||
|
|
|
March 31, 2018 |
|
|
December 31, 2017 |
|
||
|
|
|
(In thousands) |
|
|||||
|
Senior Notes |
|
$ |
495,383 |
|
|
$ |
495,000 |
|
|
North Ocean 105 construction financing |
|
|
24,511 |
|
|
|
24,511 |
|
|
Vendor equipment financing |
|
|
15,686 |
|
|
|
15,686 |
|
|
Other, including capital lease obligations |
|
|
1,678 |
|
|
|
1,780 |
|
|
|
|
|
537,258 |
|
|
|
536,977 |
|
|
Less: Amounts due within one year |
|
|
24,264 |
|
|
|
24,264 |
|
|
Total long-term debt |
|
$ |
512,994 |
|
|
$ |
512,713 |
|
|
|
17 |
|
NOTES TO THE CONSOLIDATED FINANCIAL STATEMENTS (UNAUDITED)
On June 30, 2017, we amended and restated our credit agreement dated April 16, 2014, by entering into an Amended and Restated Credit Agreement (the “Current Credit Agreement”) with a syndicate of lenders and letter of credit issuers, and Crédit Agricole Corporate and Investment Bank, as administrative agent and collateral agent. Available capacity under the Current Credit Agreement is as follows:
|
|
|
Capacity |
|
|
Utilized |
|
||||||
|
|
|
|
|
|
|
March 31, 2018 |
|
|
December 31, 2017 |
|
||
|
|
|
(In millions) |
|
|||||||||
|
Letters of Credit(1) |
|
$ |
510 |
|
|
$ |
390 |
|
|
$ |
407 |
|
|
Revolving Credit Facility/ Letters of Credit |
|
|
300 |
|
|
|
- |
|
|
|
- |
|
|
|
(1) |
Includes $19 million of financial letters of credit as of March 31, 2018 and as of December 31, 2017. |
During the first quarter of 2018, the maximum amount of cash collateral used to support bilateral letters of credit was $122 million.
Senior Secured Notes—On April 9, 2018, in connection with the financings referred to in Note 2, Business Combination Agreement with Chicago Bridge & Iron Company N.V. (“CB&I”), we gave a conditional notice for full optional redemption of all our outstanding senior secured notes due 2021 (the “Outstanding Senior Secured Notes”) on May 10, 2018, which date is subject to extension through June 8, 2018. The redemption price will be equal to 102% of the aggregate principal amount of the Outstanding Senior Secured Notes, plus accrued and unpaid interest. The redemption is subject to our depositing, with the trustee for the Outstanding Senior Secured Notes, funds sufficient to pay the redemption price for all of the Outstanding Senior Secured Notes, plus accrued and unpaid interest.
Uncommitted Bilateral Credit Facilities—We are party to a number of short-term uncommitted bilateral credit facilities (the “Uncommitted Facilities”) across several geographic regions, as follows:
|
|
|
March 31, 2018 |
|
|
December 31, 2017 |
|
||||||||||
|
|
|
Uncommitted Line Capacity |
|
|
Utilized |
|
|
Uncommitted Line Capacity |
|
|
Utilized |
|
||||
|
|
|
(In millions) |
|
|||||||||||||
|
Bank Guarantee and Bilateral Letter of Credit |
|
$ |
875 |
|
|
$ |
545 |
|
|
$ |
725 |
|
|
$ |
572 |
|
|
Surety Bonds |
|
300 |
|
|
48 |
|
|
300 |
|
|
49 |
|
||||
|
Bilateral arrangements to issue cash collateralized letters of credit |
|
|
175 |
|
|
|
6 |
|
|
|
175 |
|
|
|
18 |
|
As of March 31, 2018, we were in compliance with all of the financial covenants set forth in the Current Credit Agreement.
See Note 12, Debt, included in our Annual Report on Form 10-K for the year ended December 31, 2017, for additional information relating to our outstanding debt.
NOTE 9—PENSION AND POSTRETIREMENT BENEFITS
Net periodic benefit cost or gain recognized during each period presented relates to expected return on plan assets, net of interest costs, for our qualified defined benefit pension plan and several of our non-qualified supplemental defined benefit pension plans (the “Domestic Plans”) and our J. Ray McDermott, S.A. Third Country National Employees Pension Plan (the “TCN Plan”).
|
|
Domestic Plans |
|
|
TCN Plan |
|
||||||||||
|
|
Three Months Ended March 31, |
|
|||||||||||||
|
|
2018 |
|
|
2017 |
|
|
2018 |
|
|
2017 |
|
||||
|
|
(In thousands) |
|
|||||||||||||
|
Interest cost |
$ |
4,433 |
|
|
$ |
4,991 |
|
|
$ |
- |
|
|
$ |
290 |
|
|
Expected return on plan assets |
|
(4,672 |
) |
|
|
(4,907 |
) |
|
|
(11 |
) |
|
|
(345 |
) |
|
Net periodic benefit cost (gain) |
$ |
(239 |
) |
|
$ |
84 |
|
|
$ |
(11 |
) |
|
$ |
(55 |
) |
|
|
18 |
|
NOTES TO THE CONSOLIDATED FINANCIAL STATEMENTS (UNAUDITED)
In August 2017 the TCN plan was amended to issue lump-sum distributions of certain accrued benefits or allow transfer of such benefits into the defined contribution plan. As of December 31, 2017 all investments in the TCN plan trust were converted to cash and cash equivalents to facilitate settlements. Settlements are expected to be completed by the end of 2018. As of March 31, 2018, total benefits remaining under the plan were approximately $20 million.
We recognize mark-to-market fair value adjustments on defined benefit plans in our Consolidated Statements of Operations in the fourth quarter of each year.
NOTE 10—DERIVATIVE FINANCIAL INSTRUMENTS
We enter into derivative financial instruments primarily to hedge certain firm purchase commitments and forecasted transactions denominated in foreign currencies. We record these contracts at fair value on our Consolidated Balance Sheets. Depending on the hedge designation at the inception of the contract, the related gains and losses on these contracts are either: (1) deferred as a component of Accumulated Other Comprehensive Income (“AOCI”) until the hedged item is recognized in earnings; (2) offset against the change in fair value of the hedged firm commitment through earnings; or (3) recognized immediately in earnings. At inception and on an ongoing basis, we assess the hedging relationship to determine its effectiveness in offsetting changes in cash flows or fair value attributable to the hedged risk. We exclude from our assessment of effectiveness the portion of the fair value of the forward contracts attributable to the difference between spot exchange rates and forward exchange rates. The ineffective portion of a derivative’s change in fair value and any portion excluded from the assessment of effectiveness are immediately recognized in earnings. Gains and losses on derivative financial instruments which are immediately recognized in earnings are included as a component of Other non-operating income (expense), net, in our Consolidated Statements of Operations.
As of March 31, 2018, the majority of our foreign currency forward contracts were designated as cash flow hedging instruments. In addition, we deferred approximately $2 million of net losses on those derivative financial instruments in AOCI, and we expect to reclassify approximately $0.2 million of deferred losses out of AOCI by March 31, 2019, as hedged items are recognized in earnings. The notional value of our outstanding derivative contracts totaled $199 million at March 31, 2018, with maturities extending through June 2020. These instruments consist of contracts to purchase or sell foreign-denominated currencies. As of March 31, 2018, the fair value of these contracts was in a net asset position totaling approximately $1 million. The fair value of outstanding derivative instruments is determined using observable financial market inputs, such as quoted market prices, and is classified as Level 2 in nature.
The following tables summarize our derivative financial instruments:
Asset and Liability Derivatives
|
|
|
|
|
|
|
|
|
|
|
|
|
March 31, 2018 |
|
|
December 31, 2017 |
|
||
|
|
|
(in thousands) |
|
|||||
|
Derivatives Designated as Hedges: |
|
|
|
|
|
|
|
|
|
Location: |
|
|
|
|
|
|
|
|
|
Accounts receivable-other |
|
$ |
1,788 |
|
|
$ |
2,232 |
|
|
Other assets |
|
|
56 |
|
|
|
66 |
|
|
Total derivatives asset |
|
$ |
1,844 |
|
|
$ |
2,298 |
|
|
|
|
|
|
|
|
|
|
|
|
Accounts payable |
|
$ |
925 |
|
|
$ |
618 |
|
|
Other liabilities |
|
|
8 |
|
|
|
- |
|
|
Total derivatives liability |
|
$ |
933 |
|
|
$ |
618 |
|
|
|
19 |
|
NOTES TO THE CONSOLIDATED FINANCIAL STATEMENTS (UNAUDITED)
The Effects of Derivative Instruments on our Financial Statements
|
|
|
March 31, |
|
|||||
|
|
|
2018 |
|
|
2017 |
|
||
|
|
|
(in thousands) |
|
|||||
|
Derivatives Designated as Hedges: |
|
|
|
|
|
|
|
|
|
Amount of gain (loss) recognized in other comprehensive income (loss) |
|
$ |
481 |
|
|
$ |
5,602 |
|
|
Gain reclassified from AOCI to Cost of operations |
|
|
(238 |
) |
|
|
(3,515 |
) |
|
Ineffective portion and amount excluded from effectiveness testing: gain (loss) recognized in Other non-operating income (expense) |
|
|
310 |
|
|
|
305 |
|
NOTE 11—FAIR VALUE MEASUREMENTS
The following table presents the financial instruments outstanding as of March 31, 2018 and December 31, 2017 that are measured at fair value on a recurring basis and financial instruments that are not measured at fair value on a recurring basis.
|
|
|
March 31, 2018 |
|
|
|
|
|
|
|
|
|
|
|
|
|
|||||
|
|
|
Carrying Amount |
|
|
Fair Value |
|
|
Level 1 |
|
|
Level 2 |
|
|
Level 3 |
|
|||||
|
|
|
(in thousands) |
|
|||||||||||||||||
|
Recurring |
|
|
|
|
|
|
|
|
|
|
|
|
|
|
|
|
|
|
|
|
|
Forward contracts |
|
$ |
911 |
|
|
$ |
911 |
|
|
$ |
- |
|
|
$ |
911 |
|
|
$ |
- |
|
|
Financial instruments not measured at fair value |
|
|
|
|
|
|
|
|
|
|
|
|
|
|
|
|
|
|
|
|
|
Debt |
|
|
(537,258 |
) |
|
|
(552,651 |
) |
|
|
- |
|
|
|
(510,460 |
) |
|
|
(42,191 |
) |
|
|
|
|
|
|
|
|
|
|
|
|
|
|
|
|
|
|
|
|
|
|
|
|
|
December 31, 2017 |
|
|
|
|
|
|
|
|
|
|
|
|
|
|||||
|
|
|
Carrying Amount |
|
|
Fair Value |
|
|
Level 1 |
|
|
Level 2 |
|
|
Level 3 |
|
|||||
|
|
|
(in thousands) |
|
|||||||||||||||||
|
Recurring |
|
|
|
|
|
|
|
|
|
|
|
|
|
|
|
|
|
|
|
|
|
Forward contracts |
|
$ |
1,680 |
|
|
$ |
1,680 |
|
|
$ |
- |
|
|
$ |
1,680 |
|
|
$ |
- |
|
|
Financial instruments not measured at fair value |
|
|
|
|
|
|
|
|
|
|
|
|
|
|
|
|
|
|
|
|
|
Debt |
|
|
(536,977 |
) |
|
|
(558,077 |
) |
|
|
- |
|
|
|
(515,735 |
) |
|
|
(42,342 |
) |
The carrying value of all non-derivative financial instruments included in current assets (including cash, cash equivalents and restricted cash and accounts receivable) and current liabilities (including accounts payable but excluding short-term debt) approximates the applicable fair value due to the short maturity of those instruments.
We used the following methods and assumptions in estimating our fair value disclosures for our other financial instruments:
Short-term and long-term debt—The fair value of debt instruments valued using a market approach based on quoted prices for similar instruments traded in active markets is classified as Level 2 within the fair value hierarchy.
Quoted prices were not available for the NO 105 construction financing, vendor equipment financing or capital leases. The income approach was used to value these instruments based on the present value of future cash flows discounted at estimated borrowing rates for similar debt instruments or on estimated prices based on current yields for debt issues of similar quality and terms and are classified as Level 3 within the fair value hierarchy.
|
|
20 |
|
NOTES TO THE CONSOLIDATED FINANCIAL STATEMENTS (UNAUDITED)
Forward contracts—The fair value of forward contracts is classified as Level 2 within the fair value hierarchy and is valued using observable market parameters for similar instruments traded in active markets. Where quoted prices are not available, the income approach is used to value forward contracts, which discounts future cash flows based on current market expectations and credit risk.
Our effective income tax rate for the first quarter of 2018 was 35.4% compared with 27.7% for the first quarter 2017. The increase in the provision for income taxes was primarily driven by increased income in the quarter coupled with losses in certain jurisdictions where we did not recognize a tax benefit. The increase was partially offset by income in favorable tax jurisdictions.
For the three-month period ended March 31, 2018, the Company is utilizing the discrete-period method to compute its interim tax provision due to significant variations in the relationship between income tax expense and pre-tax accounting income or loss; consequently, the actual effective rate for the interim period is being reported. The discrete-period method is applied when the application of the estimated annual effective tax rate is impractical because it is not possible to reliably estimate the annual effective tax rate.
Due to the impact of ongoing tax losses in the U.S. and the corresponding valuation allowance on our U.S. net deferred tax asset position, the new provisions from U.S. tax reform enacted in December 2017 and taking effect in 2018 are not expected to have a material impact on our 2018 tax position.
The changes in the number of shares outstanding and treasury shares held by the Company are as follows:
|
|
|
Three Months Ended March 31, |
|
|||||
|
|
|
2018 |
|
|
2017 |
|
||
|
Shares outstanding |
|
|
|
|
|
|
|
|
|
Beginning balance |
|
|
284,026,820 |
|
|
|
241,388,277 |
|
|
Common stock issued |
|
|
2,740,096 |
|
|
|
2,586,578 |
|
|
Purchase of common stock |
|
|
(867,203 |
) |
|
|
(933,060 |
) |
|
Ending balance |
|
|
285,899,713 |
|
|
|
243,041,795 |
|
|
|
|
|
|
|
|
|
|
|
|
Shares held as Treasury shares |
|
|
|
|
|
|
|
|
|
Beginning balance |
|
|
8,499,021 |
|
|
|
8,302,004 |
|
|
Purchase of common stock |
|
|
867,203 |
|
|
|
933,060 |
|
|
Retirement of common stock |
|
|
(858,682 |
) |
|
|
(787,267 |
) |
|
Ending balance |
|
|
8,507,542 |
|
|
|
8,447,797 |
|
|
|
|
|
|
|
|
|
|
|
|
Ordinary shares issued at the end of the period |
|
|
294,407,255 |
|
|
|
251,489,592 |
|
Accumulated Other Comprehensive Income (Loss)—the components of AOCI included in stockholders’ equity are as follows:
|
|
|
|
|
|||||
|
|
|
March 31, 2018 |
|
|
December 31, 2017 |
|
||
|
|
|
(in thousands) |
|
|||||
|
Foreign currency translation adjustments ("CTA") |
|
$ |
(49,621 |
) |
|
$ |
(49,025 |
) |
|
Net unrealized gain on investments |
|
|
400 |
|
|
|
393 |
|
|
Net unrealized loss on derivative financial instruments |
|
|
(1,586 |
) |
|
|
(1,816 |
) |
|
Accumulated other comprehensive loss |
|
$ |
(50,807 |
) |
|
$ |
(50,448 |
) |
|
|
21 |
|
NOTES TO THE CONSOLIDATED FINANCIAL STATEMENTS (UNAUDITED)
The following table presents the components of AOCI and the amounts that were reclassified during the periods indicated:
|
|
|
Foreign currency translation adjustments |
|
|
Unrealized holding gain (loss) on investments |
|
|
Gain (loss) on derivative (1) |
|
|
TOTAL |
|
||||
|
|
|
(In thousands) |
|
|||||||||||||
|
Balance, January 1, 2017 |
|
$ |
(42,082 |
) |
|
$ |
269 |
|
|
$ |
(25,082 |
) |
|
$ |
(66,895 |
) |
|
Other comprehensive income before reclassification |
|
|
239 |
|
|
|
19 |
|
|
|
5,602 |
|
|
|
5,860 |
|
|
Amounts reclassified from AOCI |
|
|
- |
|
|
|
- |
|
|
|
(3,449 |
) |
(2) |
|
(3,449 |
) |
|
Net current period other comprehensive income |
|
|
239 |
|
|
|
19 |
|
|
|
2,153 |
|
|
|
2,411 |
|
|
Balance, March 31, 2017 |
|
$ |
(41,843 |
) |
|
$ |
288 |
|
|
$ |
(22,929 |
) |
|
$ |
(64,484 |
) |
|
|
|
|
|
|
|
|
|
|
|
|
|
|
|
|
|
|
|
Balance, January 1, 2018 |
|
$ |
(49,025 |
) |
|
$ |
393 |
|
|
$ |
(1,816 |
) |
|
$ |
(50,448 |
) |
|
Other comprehensive income before reclassification |
|
|
(596 |
) |
|
|
7 |
|
|
|
481 |
|
|
|
(108 |
) |
|
Amounts reclassified from AOCI |
|
|
- |
|
|
|
- |
|
|
|
(251 |
) |
(2) |
|
(251 |
) |
|
Net current period other comprehensive income |
|
|
(596 |
) |
|
|
7 |
|
|
|
230 |
|
|
|
(359 |
) |
|
Balance, March 31, 2018 |
|
$ |
(49,621 |
) |
|
$ |
400 |
|
|
$ |
(1,586 |
) |
|
$ |
(50,807 |
) |
|
(1) |
Refer to Note 10, Derivative Financial Instruments, for additional details |
|
(2) |
Reclassified to Cost of operations and Other non-operating income (expense), net |
The following table sets forth the computation of basic and diluted earnings per common share:
|
|
|
Three Months Ended March 31, |
|
|||||
|
|
|
2018 |
|
|
2017 |
|
||
|
|
|
(in thousands, except share and per share amounts) |
|
|||||
|
Net income attributable to McDermott |
|
$ |
35,189 |
|
|
$ |
21,916 |
|
|
|
|
|
|
|
|
|
|
|
|
Weighted average common stock (basic) |
|
|
284,658,938 |
|
|
|
241,829,988 |
|
|
Effect of dilutive securities: |
|
|
|
|
|
|
|
|
|
Tangible equity units |
|
|
- |
|
|
|
38,000,936 |
|
|
Stock options, restricted stock and restricted stock units |
|
|
391,586 |
|
|
|
2,454,671 |
|
|
Potential dilutive common stock |
|
|
285,050,524 |
|
|
|
282,285,595 |
|
|
|
|
|
|
|
|
|
|
|
|
Net income per share attributable to McDermott |
|
|
|
|
|
|
|
|
|
Basic: |
|
$ |
0.12 |
|
|
$ |
0.09 |
|
|
Diluted: |
|
$ |
0.12 |
|
|
$ |
0.08 |
|
Approximately 1 million and 2 million shares underlying outstanding stock-based awards for the three months ended March 31, 2018 and 2017, respectively, were excluded from the computation of diluted earnings per share during those periods because the exercise price of those awards was greater than the average market price of our common stock, and the inclusion of such shares would have been antidilutive.
|
|
22 |
|
NOTES TO THE CONSOLIDATED FINANCIAL STATEMENTS (UNAUDITED)
NOTE 15—COMMITMENTS AND CONTINGENCIES
Investigations and Litigation
Combination Related Lawsuits—In January, February and March 2018, five shareholders of CB&I filed separate lawsuits under the federal securities laws in the United States District Court for the Southern District of Texas challenging the accuracy of the disclosures made in the registration statement we and a subsidiary of CB&I filed in connection with the Combination (the “Registration Statement”). The cases are captioned (1) McIntyre v. Chicago Bridge & Iron Company N.V., et al., Case No. 4:18-cv-00273 (S.D. Tex.) (the “McIntyre Action”); (2) The George Leon Family Trust v. Chicago Bridge & Iron Company N.V., et al., Case No. 4:18-cv-00314 (S.D. Tex.) (the “Leon Action”); (3) Maresh v. Chicago Bridge & Iron Company N.V., et al., Case No. 4:18-cv-00498 (S.D. Tex.) (the “Maresh Action”); (4) Patel v. Chicago Bridge & Iron Co. N.V., et al., Case No. 4:18-cv-00550 (S.D. Tex.) (the “Patel Action”); and (5) Judd v. Chicago Bridge& Iron Co. N.V., et. al., Case No. 4:18-cv-00799 (S.D. Tex.) (the “Judd Action”). The McIntyre Action, Leon Action, Maresh Action and Judd Action are asserted on behalf of putative classes of CB&I’s public shareholders, while the Patel Action is brought only on behalf of the named plaintiff.
All five actions allege violations of Section 14(a) and 20(a) of the Securities Exchange Act of 1934 and Rule 14a-9 promulgated thereunder based on various alleged omissions of material information from the Registration Statement. The McIntyre Action names as defendants CB&I, each of CB&I’s directors, individually, and certain current and former CB&I officers and employees individually. It seeks to enjoin the Combination, an award of costs and attorneys’ and expert fees, and damages. On February 7, 2018, the plaintiff in the McIntyre Action filed a motion for preliminary injunction seeking to enjoin CB&I from consummating the Combination. The Leon Action names as defendants CB&I, certain subsidiaries of CB&I and McDermott that are parties to the Business Combination Agreement, each of CB&I’s directors, individually, and McDermott as an alleged control person of CB&I. The Leon Action seeks to enjoin the Combination (or, in the alternative, rescission or an award for rescissory damages in the event the Combination is completed), to compel CB&I to issue revised disclosure, and an award of costs and attorneys’ and expert fees. The Maresh Action, which was originally filed in Delaware and voluntarily dismissed without prejudice on February 13, 2018, was re-filed in Texas and names as defendants CB&I and each of CB&I’s directors, individually. Although originally filed as an individual action, the Maresh Action was refiled as a putative class action in an amended complaint filed on February 26, 2018. The Maresh Action seeks to enjoin the Combination (or, in the alternative, an award for rescissory damages in the event the Combination is completed) and an award of costs and attorneys’ and expert fees. The Patel Action names as defendants CB&I and each of CB&I’s directors, individually. The Patel Action seeks to enjoin the Combination (or, in the alternative, an award for rescissory damages in the event the Combination is completed) and an award of costs and attorneys’ and expert fees. The Judd Action names as defendants CB&I and each of CB&I’s directors individually. The Judd Action seeks to enjoin the Combination (or, in the alternative, an award for rescissory damages in the event the Combination is completed) and an award of costs and attorneys’ and expert fees.
On February 23, 2018, CB&I moved for consolidation of the four then-pending shareholder actions, an order requiring plaintiffs and their counsel to coordinate their efforts, and for appointment of a preliminary lead plaintiff and lead counsel in the putative class actions. On February 26, 2018, the plaintiff in the Maresh Action moved for consolidation of the four then-pending shareholder actions and for appointment of Maresh as interim lead plaintiff and the law firm of Levi & Korsinsky LLP as lead counsel. On March 1, 2018, that motion was withdrawn. On February 28, 2018, the plaintiff in the Leon Action also moved for consolidation of the four then-pending shareholder actions and for appointment of Leon as interim lead plaintiff and the law firm of Rigrodsky & Long, P.A. as lead counsel. On March 2, 2018, the Court consolidated the four then-pending actions (all but the Judd Action) and granted the Leon Action plaintiff’s motion as to interim lead plaintiff and lead counsel. On March 9, 2018, the lead plaintiff filed a consolidated amended complaint.
On March 15, 2018, after the Judd Action was filed, the defendants moved for that case to be consolidated with the other cases. On March 16, 2018, that motion was granted.
On March 16, 2018, the defendants moved to dismiss the consolidated amended complaint and the interim lead plaintiff filed a motion for a preliminary injunction. On March 29, 2018, the interim lead plaintiff withdrew its motion for a preliminary injunction. Motions for permanent lead plaintiff status were due on April 2, 2018, and only the interim lead plaintiff filed such a motion. On April 5, 2018, the interim lead plaintiff sought an extension of time to respond to defendants’ motion to dismiss until after such time as a permanent lead plaintiff is appointed. That motion was granted. We believe the substantive allegations contained in the complaints are without merit, and we intend to defend against the claims made against us vigorously.
|
|
23 |
|
NOTES TO THE CONSOLIDATED FINANCIAL STATEMENTS (UNAUDITED)
FloaTEC Investigation—We co-own interests in several entities (collectively “FloaTEC”) with subsidiaries of Keppel Corporation (including its subsidiaries, “Keppel”). We have conducted an internal investigation in connection with allegations by a former Petrobras employee that Keppel’s agent made improper payments to secure project awards from Petrobras on a number of Keppel affiliated projects in Brazil, including a FloaTEC project on which we were also a subcontractor. Keppel’s agent subsequently entered into a plea arrangement with the Brazilian authorities and admitted to having made improper payments on behalf of Keppel to former Petrobras employees on projects unrelated to FloaTEC. In August 2016, we voluntarily contacted the U.S. Department of Justice (“DOJ”) to advise it of the preliminary results of our internal investigation, which identified no evidence to indicate any improper payments were made by us or FloaTEC or that any of our or FloaTEC’s employees authorized, had knowledge of, or direction or control over, any such payments. During the period from August 2016 through January 2017, we responded to requests for additional information from the DOJ. In December 2017, Keppel entered into a deferred prosecution agreement with the DOJ and the U.S. Attorney’s Office for the U.S. District Court for the Eastern District of New York in connection with charges that Keppel had conspired to violate the anti-bribery provisions of the Foreign Corrupt Practices Act. The DOJ has not been in contact with us since January 2017 regarding this matter. If in the future, the DOJ determines that violations of applicable law have occurred involving us, we could be subject to civil or criminal sanctions, including monetary penalties, which could be material. However, based on the results of our investigation, we do not expect this matter to have a material adverse effect on us or our operations.
Additionally, due to the nature of our business, we and our affiliates are, from time to time, involved in litigation or subject to disputes or claims related to our business activities, including, among other things:
|
|
• |
performance or warranty-related matters under our customer and supplier contracts and other business arrangements; and |
|
|
• |
workers’ compensation claims, Jones Act claims, occupational hazard claims, including asbestos-exposure claims, premises liability claims and other claims. |
Based upon our prior experience, we do not expect that any of these other litigation proceedings, disputes and claims will have a material adverse effect on our consolidated financial condition, results of operations or cash flows; however, because of the inherent uncertainty of litigation and other dispute resolution proceedings and, in some cases, the availability and amount of potentially applicable insurance, we can provide no assurance the resolution of any particular claim or proceeding to which we are a party will not have a material effect on our consolidated financial condition, results of operations or cash flows for the fiscal period in which that resolution occurs.
Environmental Matters
We have been identified as a potentially responsible party at various cleanup sites under the Comprehensive Environmental Response, Compensation, and Liability Act of 1980, as amended (“CERCLA”). CERCLA and other environmental laws can impose liability for the entire cost of cleanup on any of the potentially responsible parties, regardless of fault or the lawfulness of the original conduct. Generally, however, where there are multiple responsible parties, a final allocation of costs is made based on the amount and type of wastes disposed of by each party and the number of financially viable parties, although this may not be the case with respect to any particular site. We have not been determined to be a major contributor of waste to any of these sites. On the basis of our relative contribution of waste to each site, we expect our share of the ultimate liability for the various sites will not have a material adverse effect on our consolidated financial condition, results of operations or cash flows in any given year.
As of March 31, 2018, we had no environmental reserve recorded.
Asset Retirement Obligations
At some sites, we are contractually obligated to decommission our fabrication facilities upon site exit. Currently, we are unable to estimate any asset retirement obligations (“AROs”) due to the indeterminate life of our fabrication facilities. We regularly review the optimal future alternatives for our facilities. Any decision to retire one or more facilities will result in recording the present value of such obligations.
AROs would be recorded at the present value of the estimated costs to retire the asset at the time the obligation is incurred. As of March 31, 2018, we had no AROs recorded.
|
|
24 |
|
NOTES TO THE CONSOLIDATED FINANCIAL STATEMENTS (UNAUDITED)
Contracts Containing Liquidated Damages Provisions
Some of our contracts contain provisions that require us to pay liquidated damages if we are responsible for the failure to meet specified contractual milestone dates and the applicable customer asserts a claim under those provisions. Those contracts define the conditions under which our customers may make claims against us for liquidated damages. In many cases in which we have historically had potential exposure for liquidated damages, such damages ultimately were not asserted by our customers. As of March 31, 2018, we determined that we had under $1 million of potential liquidated damages exposure, based on performance under contracts to date, and no liability is recorded in our Consolidated Financial Statements related to such exposure. We believe we will be successful in obtaining schedule extensions or other customer-agreed changes that should resolve the potential for these liquidated damages. However, we may not achieve relief on some or all of the issues involved and, as a result, could be subject to liquidated damages being imposed on us in the future.
We disclose the results of each of our reportable segments in accordance with ASC 280, Segment Reporting. Each of the reportable segments is separately managed by a senior executive who is a member of our Executive Committee (“EXCOM”). EXCOM is led by our Chief Executive Officer, who is the chief operating decision maker. Discrete financial information is available for each of the segments, and the EXCOM uses the operating results of each of the reportable segments for performance evaluation and resource allocation.
We manage reportable segments along geographic lines consisting of (1) AEA, (2) MEA and (3) ASA. We also report certain corporate and other non-operating activities under the heading “Corporate and Other.”
Corporate and Other primarily reflects corporate expenses, certain centrally managed initiatives (such as restructuring charges), impairments, year-end mark-to-market (“MTM”) pension actuarial gains and losses, costs not attributable to a particular reportable segment and unallocated direct operating expenses associated with the underutilization of vessels, fabrication facilities and engineering resources.
|
|
25 |
|
NOTES TO THE CONSOLIDATED FINANCIAL STATEMENTS (UNAUDITED)
Summarized financial information is shown in the following tables:
|
|
|
Three Months Ended March 31, |
|
|||||
|
|
|
2018 |
|
|
2017 |
|
||
|
|
|
(in thousands) |
|
|||||
|
Revenues: |
|
|
|
|
|
|
|
|
|
AEA |
|
$ |
113,304 |
|
|
$ |
28,131 |
|
|
MEA |
|
|
345,123 |
|
|
|
310,052 |
|
|
ASA |
|
|
149,391 |
|
|
|
181,248 |
|
|
Total revenues: |
|
$ |
607,818 |
|
|
$ |
519,431 |
|
|
|
|
|
|
|
|
|
|
|
|
Income before provision for income taxes: |
|
|
|
|
|
|
|
|
|
Operating income: |
|
|
|
|
|
|
|
|
|
AEA |
|
$ |
53 |
|
|
$ |
183 |
|
|
MEA |
|
|
69,183 |
|
|
|
64,377 |
|
|
ASA |
|
|
75,349 |
|
|
|
29,775 |
|
|
Segment operating income |
|
|
144,585 |
|
|
|
94,335 |
|
|
Corporate and Other(1) |
|
|
(76,146 |
) |
|
|
(38,296 |
) |
|
Total operating income |
|
|
68,439 |
|
|
|
56,039 |
|
|
Interest expense, net |
|
|
(11,608 |
) |
|
|
(17,706 |
) |
|
Other non-operating income, net |
|
|
1,719 |
|
|
|
560 |
|
|
Income before provision for income taxes |
|
$ |
58,550 |
|
|
$ |
38,893 |
|
|
|
|
|
|
|
|
|
|
|
|
Capital expenditures:(2) |
|
|
|
|
|
|
|
|
|
AEA |
|
$ |
2,524 |
|
|
$ |
5,251 |
|
|
MEA |
|
|
3,295 |
|
|
|
5,852 |
|
|
ASA |
|
|
3,039 |
|
|
|
3,512 |
|
|
Corporate and Other(3) |
|
|
9,528 |
|
|
|
48,234 |
|
|
Total capital expenditures: |
|
$ |
18,386 |
|
|
$ |
62,849 |
|
|
|
|
|
|
|
|
|
|
|
|
Depreciation and amortization:(4) |
|
|
|
|
|
|
|
|
|
AEA |
|
$ |
7,302 |
|
|
$ |
4,013 |
|
|
MEA |
|
|
6,248 |
|
|
|
7,903 |
|
|
ASA |
|
|
7,426 |
|
|
|
7,575 |
|
|
Corporate and Other |
|
|
1,800 |
|
|
|
1,890 |
|
|
Total depreciation and amortization: |
|
$ |
22,776 |
|
|
$ |
21,381 |
|
(1) Corporate and Other operating results for the first quarter of 2018 and 2017 include approximately $14 million in restructuring costs and transaction costs related to the Combination and a $3 million gain on sale of assets, respectively.
|
|
26 |
|
NOTES TO THE CONSOLIDATED FINANCIAL STATEMENTS (UNAUDITED)
(2) Liabilities associated with assets acquired during the first quarter of 2018 and 2017 were $10 million and $9 million, respectively.
(3) Corporate and other capital expenditures in the first quarter of 2017 include the purchase of the Amazon, a pipelay and construction vessel. Following the purchase, we sold this vessel to an unrelated party and simultaneously entered into an 11-year bareboat charter agreement.
(4) Depreciation and amortization expense associated with our marine vessels is included in the respective segments in which the vessels were located as of the reporting date.
|
|
|
March 31, 2018 |
|
|
December 31, 2017 |
|
||
|
|
|
(in thousands) |
|
|||||
|
Segment assets: |
|
|
|
|
|
|
|
|
|
AEA |
|
$ |
960,102 |
|
|
$ |
921,171 |
|
|
MEA |
|
|
955,054 |
|
|
|
1,020,599 |
|
|
ASA |
|
|
923,226 |
|
|
|
887,209 |
|
|
Corporate and Other |
|
|
362,266 |
|
|
|
393,841 |
|
|
Total assets |
|
$ |
3,200,648 |
|
|
$ |
3,222,820 |
|
(1) Our marine vessels are included in the area in which they were located as of the reporting date.
Our revenue by service lines and contract types was as follows:
|
|
|
Three Months Ended March 31, |
|
|||||
|
|
|
2018 |
|
|
2017 |
|
||
|
|
|
(in thousands) |
|
|||||
|
Service line revenues: |
|
|
|
|
|
|
|
|
|
Offshore |
|
$ |
394,724 |
|
|
$ |
354,064 |
|
|
Subsea and other |
|
|
213,094 |
|
|
|
165,367 |
|
|
|
|
$ |
607,818 |
|
|
$ |
519,431 |
|
|
|
|
|
|
|
|
|
|
|
|
Contract types |
|
|
|
|
|
|
|
|
|
Fixed-price |
|
$ |
582,592 |
|
|
$ |
475,921 |
|
|
Unit-basis and other |
|
|
25,226 |
|
|
|
43,510 |
|
|
|
|
$ |
607,818 |
|
|
$ |
519,431 |
|
|
|
27 |
|
MANAGEMENT’S DISCUSSION AND ANALYSIS OF FINANCIAL CONDITION AND RESULTS OF OPERATIONS
ITEM 2. MANAGEMENT’S DISCUSSION AND ANALYSIS OF FINANCIAL CONDITION AND RESULTS OF OPERATIONS
In this quarterly report on Form 10-Q, unless the context otherwise indicates, “we,” “us” and “our” mean McDermott International, Inc. and its consolidated subsidiaries.
CAUTIONARY STATEMENT CONCERNING FORWARD-LOOKING STATEMENTS
We are including the following discussion to inform our existing and potential security holders generally of some of the risks and uncertainties that can affect our company and to take advantage of the “safe harbor” protection for forward-looking statements that applicable federal securities law affords. This information should be read in conjunction with the unaudited Consolidated Financial Statements and the Notes thereto included in Item 1 of this report and the audited Consolidated Financial Statements and the related Notes and Item 7 “Management’s Discussion and Analysis of Financial Condition and Results of Operations” included in our Annual Report on Form 10-K for the year ended December 31, 2017 filed with the U.S. Securities and Exchange Commission (the “SEC”) on February 21, 2018 (the “2017 Form 10-K”).
From time to time, our management or persons acting on our behalf make forward-looking statements to inform existing and potential security holders about our company. These statements may include projections and estimates concerning the scope, execution, timing and success of specific projects and our future backlog, revenues, income and capital spending. Forward-looking statements are generally accompanied by words such as “estimate,” “project,” “predict,” “forecast,” “believe,” “expect,” “anticipate,” “plan,” “seek,” “goal,” “could,” “may,” or “should” or other words that convey the uncertainty of future events or outcomes. Sometimes we will specifically describe a statement as being a forward-looking statement and refer to this cautionary statement.
In addition, various statements in this report, including those that express a belief, expectation or intention, as well as those that are not statements of historical fact, are forward-looking statements. Those forward-looking statements appear in the Notes to our Consolidated Financial Statements in Item 1 of this report, in this Management’s Discussion and Analysis of Financial Condition and Results of Operations, Legal Proceedings in Item 1 of Part II of this report and elsewhere in this report.
These forward-looking statements include, but are not limited to, statements that relate to, or statements that are subject to risks, contingencies or uncertainties that relate to:
|
|
• |
expectations regarding the pending business combination with Chicago Bridge & Iron Company N.V. (“CB&I”) described in Note 2 to the Consolidated Financial Statements included in this report (the “Combination”) and the anticipated benefits of combining CB&I’s business with our business; |
|
|
• |
future levels of revenues, operating margins, income from operations, cash flows, net income or earnings per share; |
|
|
• |
the outcome of project awards and scope, execution and timing of specific projects, including timing to complete and cost to complete these projects; |
|
|
• |
future project activities, including the commencement and subsequent timing of marine or installation campaigns on specific projects, and the ability of projects to generate sufficient revenues to cover our fixed costs; |
|
|
• |
estimates of percentage of completion and contract profits or losses; |
|
|
• |
anticipated levels of demand for our products and services; |
|
|
• |
global demand for oil and gas and fundamentals of the oil and gas industry; |
|
|
• |
expectations regarding offshore development of oil and gas; |
|
|
• |
market outlook for the engineering, procurement, construction and installation (“EPCI”) market; |
|
|
• |
expectations regarding cash flows from operating activities; |
|
|
• |
expectations regarding backlog; |
|
|
• |
future levels of capital, environmental or maintenance expenditures; |
|
|
28 |
|
MANAGEMENT’S DISCUSSION AND ANALYSIS OF FINANCIAL CONDITION AND RESULTS OF OPERATIONS
|
|
• |
the adequacy of our sources of liquidity and capital resources, including for the financing arrangements contemplated by the Commitment Letters (as defined herein) to enable us to complete the Combination; |
|
|
• |
interest expense; |
|
|
• |
the effectiveness of our derivative contracts in mitigating foreign currency risk; |
|
|
• |
results of our capital investment program; |
|
|
• |
expectations regarding the acquisition or divestiture of assets; |
|
|
• |
the impact of U.S. tax reform on our tax position; |
|
|
• |
the possibility of establishing our parent company’s tax residence in the United Kingdom; |
|
|
• |
the potential effects of judicial or other proceedings on our business, financial condition, results of operations and cash flows; and |
|
|
• |
the anticipated effects of actions of third parties such as competitors, or regulatory authorities, or plaintiffs in litigation. |
These forward-looking statements speak only as of the date of this report; we disclaim any obligation to update these statements unless required by securities law, and we caution you not to rely on them unduly. We have based these forward-looking statements on our current expectations and assumptions about future events. While our management considers these expectations and assumptions to be reasonable, they are inherently subject to significant business, economic, competitive, regulatory and other risks, contingencies and uncertainties, most of which are difficult to predict and many of which are beyond our control. These risks, contingencies and uncertainties relate to, among other matters, the following:
|
|
• |
general economic and business conditions and industry trends; |
|
|
• |
general developments in the industries in which we are involved; |
|
|
• |
volatility of oil and gas prices; |
|
|
• |
decisions about offshore developments to be made by oil and gas companies; |
|
|
• |
the highly competitive nature of our industry; |
|
|
• |
our ability to appropriately bid, estimate and effectively perform projects on time, in accordance with the schedules established by the applicable contracts with customers; |
|
|
• |
changes in project design or schedule; |
|
|
• |
changes in scope or timing of work to be completed under contracts; |
|
|
• |
cancellations of contracts, change orders and other modifications and related adjustments to backlog and the resulting impact from using backlog as an indicator of future revenues or earnings; |
|
|
• |
the collectability of amounts reflected in change orders and claims relating to work previously performed on contracts; |
|
|
• |
the capital investment required to construct new-build vessels and maintain and/or upgrade our existing fleet of vessels; |
|
|
• |
the ability of our suppliers and subcontractors to deliver raw materials in sufficient quantities and/or perform in a timely manner; |
|
|
• |
volatility and uncertainty of the credit markets; |
|
|
• |
our ability to comply with covenants in our credit agreement, indentures and other debt instruments and availability, terms and deployment of capital; |
|
|
• |
the unfunded liabilities of our pension plans, which may negatively impact our liquidity and, depending upon future operations, may impact our ability to fund our pension obligations; |
|
|
29 |
|
MANAGEMENT’S DISCUSSION AND ANALYSIS OF FINANCIAL CONDITION AND RESULTS OF OPERATIONS
|
|
• |
the operating risks normally incident to our lines of business, including the potential impact of liquidated damages; |
|
|
• |
natural or man-caused disruptive events that could damage our facilities, equipment or our work-in-progress and cause us to incur losses and/or liabilities; |
|
|
• |
equipment failure; |
|
|
• |
changes in, or our failure or inability to comply with, government regulations; |
|
|
• |
adverse outcomes from legal and regulatory proceedings; |
|
|
• |
impact of potential requirements to significantly limit or reduce greenhouse gas and other emissions in the future; |
|
|
• |
changes in, and liabilities relating to, existing or future environmental regulatory matters; |
|
|
• |
changes in tax laws; |
|
|
• |
rapid technological changes; |
|
|
• |
the consequences of significant changes in interest rates and currency exchange rates; |
|
|
• |
difficulties we may encounter in obtaining regulatory or other necessary approvals of any strategic transactions; |
|
|
• |
the risks associated with integrating acquired businesses and forming and operating joint ventures; |
|
|
• |
the risk we may not be successful in updating and replacing current information technology and the risks associated with information technology systems interruptions and cybersecurity threats; |
|
|
• |
social, political and economic situations in countries where we do business; |
|
|
• |
the risks associated with our international operations, including local content or similar requirements; |
|
|
• |
interference from adverse weather or sea conditions; |
|
|
• |
the possibilities of war, other armed conflicts or terrorist attacks; |
|
|
• |
the effects of asserted and unasserted claims and the extent of available insurance coverages; |
|
|
• |
our ability to obtain surety bonds, letters of credit and financing; |
|
|
• |
our ability to maintain builder’s risk, liability, property and other insurance in amounts and on terms we consider adequate and at rates that we consider economical; |
|
|
• |
the aggregated risks retained in our captive insurance subsidiary; and |
|
|
• |
the impact of the loss of insurance rights as part of the Chapter 11 Bankruptcy settlement concluded in 2006 involving several of our former subsidiaries. |
We believe the items we have outlined above are important factors that could cause estimates in our financial statements to differ materially from actual results and those expressed in a forward-looking statement made in this quarterly report or elsewhere by us or on our behalf. We have discussed many of these factors in more detail elsewhere in this report and in the 2017 Form 10-K. These factors are not necessarily all the factors that could affect us. Unpredictable or unanticipated factors we have not discussed in this report and in the 2017 Form 10-K could also have material adverse effects on actual results of matters that are the subject of our forward-looking statements. We do not intend to update our description of important factors each time a potential important factor arises, except as required by applicable securities laws and regulations. We advise our security holders that they should (1) be aware that factors not referred to above could affect the accuracy of our forward-looking statements and (2) use caution and common sense when considering our forward-looking statements.
|
|
30 |
|
MANAGEMENT’S DISCUSSION AND ANALYSIS OF FINANCIAL CONDITION AND RESULTS OF OPERATIONS
Business Segments and Results of Operations
Business Segments
We manage reportable segments along geographic lines consisting of (1) Americas, Europe and Africa (“AEA”), (2) the Middle East (“MEA”) and (3) Asia (“ASA”). We also report certain corporate and other non-operating activities under the heading “Corporate and Other.”
Segment operations
We use Operating income (loss) as our measure of profitability for segment reporting purposes. For additional financial information related to our reporting segments, as well as a reconciliation of segment operating income to income before provision for income taxes, as defined by generally accepted accounting principles in the United States (“GAAP”), see Note 16, Segment Reporting, to the accompanying Consolidated Financial Statements.
Our segment operating results are frequently influenced by the resolution of change orders, project close-outs and settlements, which generally can cause operating margins to improve during the period in which these items are approved or finalized. While we expect change orders, close-outs and settlements to continue as part of our normal business activities, the period in which they are recognized is largely driven by the finalization of agreements with customers and suppliers and, as a result, is difficult to predict. Additionally, the future margin increases or decreases associated with these items are difficult to predict, due to, among other items, the difficulty of predicting the timing of recognition of change orders, close-outs and settlements and the timing of new project awards.
Three months ended March 31, 2018 vs three months ended March 31, 2017
Revenues
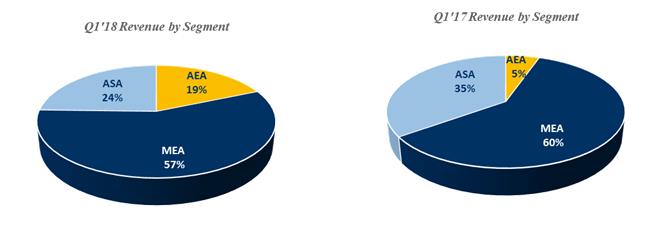
|
|
Three Months Ended March 31, |
|
|
|
|
|
|
|
|
|
|
||||||||||||||
|
|
2018 |
|
|
2017 |
|
|
Change |
||||||||||||||||||
|
|
(In thousands) |
|
|
Percentage |
|||||||||||||||||||||
|
Revenues: |
|
|
|
|
|
|
|
|
|
|
|
|
|
|
|
|
|||||||||
|
AEA |
$ |
113,304 |
|
|
$ |
28,131 |
|
|
$ |
85,173 |
|
|
|
303 |
|
% |
|||||||||
|
MEA |
|
345,123 |
|
|
|
310,052 |
|
|
|
35,071 |
|
|
|
11 |
|
|
|||||||||
|
ASA |
|
149,391 |
|
|
|
181,248 |
|
|
|
(31,857 |
) |
|
|
(18 |
) |
|
|||||||||
|
Total revenues |
$ |
607,818 |
|
|
$ |
519,431 |
|
|
$ |
88,387 |
|
|
|
17 |
|
% |
|||||||||
|
|
31 |
|
MANAGEMENT’S DISCUSSION AND ANALYSIS OF FINANCIAL CONDITION AND RESULTS OF OPERATIONS
Revenues increased by 17%, or $88 million, in the first quarter of 2018 compared to the first quarter of 2017, primarily due to increases in our AEA and MEA segments, partially offset by a decrease in our ASA segment.
AEA—Revenues increased by 303%, or $85 million, in the first quarter of 2018 compared to the first quarter of 2017.
In the first quarter of 2018, a variety of projects and activities contributed to revenues, as follows:
|
|
• |
fabrication activity progress on the Abkatun-A2 platform, a turnkey EPCI project in the Gulf of Mexico; |
|
|
• |
substantial completion of onshore activity on the Atlanta SURF project, in Brazil; |
|
|
• |
commencement in 2018 of the Maersk Olie og Gas A/S (“Maersk Oil”) Tyra Redevelopment EPCI project, awarded in the fourth quarter of 2017; and |
|
|
• |
fabrication activity progress on BP Angelin EPCI, a gas field project. |
In the first quarter of 2017, a variety of projects and activities contributed to revenues, including:
|
|
• |
commencement of fabrication activity on the Abkatun-A2 platform; and |
|
|
• |
a front-end engineering and design project. |
MEA—Revenues increased by 11%, or $35 million, in the first quarter of 2018 compared to the first quarter of 2017.
In the first quarter of 2018, a variety of projects and activities contributed to revenues, as follows:
|
|
• |
engineering and fabrication progress and pipelay activity by our DB 32 vessel on the Saudi Aramco Safaniya phase 5 project; |
|
|
• |
marine hook-up activities utilizing a jack-up barge on the lump-sum EPCI project under the Saudi Aramco Long-Term Agreement (“LTA II”); |
|
|
• |
a marine campaign for hookup activities and fabrication on two Saudi Aramco EPCI projects; |
|
|
• |
commencement of two Saudi Aramco projects, the Safaniya phase 6 project, awarded in the fourth quarter of 2017, and the 13 Jackets project, awarded in the first quarter of 2018; and |
|
|
• |
marine offshore campaign progress on the Saudi Aramco four jackets and three observation platform project, which was awarded in the fourth quarter of 2016. |
In the first quarter of 2017, a variety of projects and activities contributed to revenues, as follows:
|
|
• |
fabrication and marine activities on the lump-sum EPCI project under the LTA II; |
|
|
|
|
|
|
• |
marine hookup activities carried out during the shutdown of the TP-1 platform on our Saudi Aramco Karan-45 project; |
|
|
• |
increased fabrication activities undertaken on the Marjan power system cable replacement project for Saudi Aramco; |
|
|
• |
completion of the next phase of a large pipeline repair-related project in the Middle East; |
|
|
• |
a marine campaign executed by our Emerald Sea vessel and other vessels for tran-spooling, umbilical installation and hook-up activities on a pipeline, spool and risers for a flow assurance project in Qatar; and |
|
|
• |
engineering and fabrication activities on a Saudi Aramco project to supply nine jackets, which was awarded in the second quarter of 2016. |
ASA—Revenues decreased by 18%, or $32 million, primarily due to a reduction in active projects in the first quarter of 2018 compared to the first quarter of 2017.
|
|
32 |
|
MANAGEMENT’S DISCUSSION AND ANALYSIS OF FINANCIAL CONDITION AND RESULTS OF OPERATIONS
In the first quarter of 2018, a variety of projects and activities contributed to revenues, as follows:
|
|
• |
the Inpex Ichthys project, which is substantially complete; |
|
|
• |
commencement of the off-shore campaign on the Greater Western Flank Phase 2 project in Australia, as the project progressed from the fabrication phase to prelay campaign; and |
|
|
• |
progress on marine installation activities on the Vashishta subsea field infrastructure development EPCI project in India, which is substantially complete. |
In the first quarter of 2017, a variety of projects and activities contributed to revenues, as follows:
|
|
• |
the Vashishta subsea field infrastructure development EPCI project work in India; |
|
|
• |
the Ichthys EPCI project in Australia; and |
|
|
• |
the Yamal project. |
Segment Operating Income
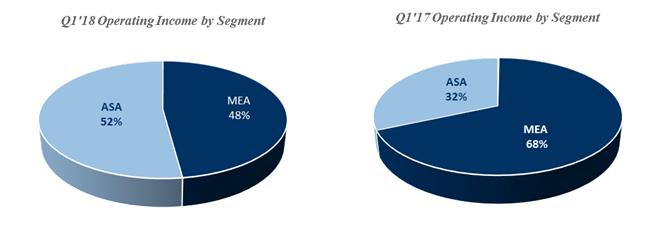
|
|
Three Months Ended March 31, |
|
|
|
|
|
|
|
|
|
|
|||||
|
|
2018 |
|
|
2017 |
|
|
Change |
|||||||||
|
|
(In thousands) |
|
|
Percentage |
||||||||||||
|
Segment operating income: |
|
|
|
|
|
|
|
|
|
|
|
|
|
|
|
|
|
AEA |
$ |
53 |
|
|
$ |
183 |
|
|
$ |
(130 |
) |
|
|
(71 |
) |
% |
|
MEA |
|
69,183 |
|
|
|
64,377 |
|
|
|
4,806 |
|
|
|
7 |
|
|
|
ASA |
|
75,349 |
|
|
|
29,775 |
|
|
|
45,574 |
|
|
|
153 |
|
|
|
Total |
$ |
144,585 |
|
|
$ |
94,335 |
|
|
$ |
50,250 |
|
|
|
53 |
|
% |
Segment operating income increased by 53%, or $50 million, in the first quarter of 2018 compared to the first quarter of 2017.
AEA—Segment operating income was less than $0.2 million in the first quarters of 2018 and 2017.
In the first quarter of 2018, a variety of projects and activities contributed to operating income, including:
|
|
• |
higher activity on the Atlanta SURF project in Brazil, which was substantially complete in the first quarter of 2018; and |
|
|
• |
commencement of the Maersk Oil Tyra Redevelopment EPCI project in 2018. |
|
|
33 |
|
MANAGEMENT’S DISCUSSION AND ANALYSIS OF FINANCIAL CONDITION AND RESULTS OF OPERATIONS
The first quarter of 2018 operating income was unfavorably impacted by fabrication and procurement related cost changes on certain active projects, none of which individually was material.
In the first quarter of 2017, a variety of projects and activities contributed to the operating income:
|
|
• |
an increase in fabrication activity on the Abkatun-A2 platform; |
|
|
• |
a front-end engineering and design project; and |
|
|
• |
close-out improvements and recognition of approved change orders on certain completed projects. |
MEA—Segment operating income in the first quarters of 2018 and 2017 was $69 million and $64 million, respectively.
In the first quarter of 2018, a variety of projects and activities contributed to operating income:
|
|
• |
marine hook-up activities utilizing jack-up barge on the lump-sum EPCI project under the LTA II; |
|
|
• |
engineering and fabrication progress and pipelay activity by our DB 32 vessel on the Saudi Aramco Safaniya phase 5 project; |
|
|
• |
marine offshore campaign progress on the Saudi Aramco four jackets and three observation platform project, which was awarded in the fourth quarter of 2016; |
|
|
• |
the marine campaign for hookup activities and fabrication on two Saudi Aramco EPCI projects; |
|
|
• |
commencement of two Saudi Aramco projects, the Safaniya phase 6 project, awarded in the fourth quarter of 2017, and the 13 Jackets project, awarded in the first quarter of 2018; and |
|
|
• |
commencement of the third phase of a large Middle East pipeline repair-related project, awarded in the fourth quarter of 2017. |
In the first quarter of 2017, a variety of projects and activities contributed to the operating income, including:
|
|
• |
fabrication and marine activities progress on the lump-sum EPCI project under the LTA II; |
|
|
• |
marine hookup activities carried out during the shutdown of the TP-1 platform on the Karan-45 project; |
|
|
• |
progress on the Marjan power systems cable replacement project; and |
|
|
• |
completion of the next phase on the large pipeline repair-related project in the Middle East. |
ASA—Segment operating income in the first quarters of 2018 and 2017 was $75 million and $30 million, respectively.
In the first quarter of 2018, segment operating income was impacted by:
|
|
• |
close-out of outstanding change orders on active and completed projects; |
|
|
• |
commencement of the off-shore campaign on the Greater Western Flank Phase 2 project, in Australia, as the project progressed from the fabrication phase to prelay campaign; and |
|
|
• |
reimbursement for vessel standby and downtime costs incurred on active and completed projects. |
In the first quarter of 2017, a variety of projects and activities contributed to operating income, including:
|
|
• |
the Ichthys project in Australia, as the project progressed through the marine installation phase; and |
|
|
• |
higher fabrication activity in 2017 on the Yamal project, which was substantially completed in the first quarter of 2017. |
Our Vashishta project in India, which is substantially complete, did not contribute positively to our overall operating margin. Our estimated revenues at completion of the project also include unapproved change orders.
Other items in Operating Income
|
|
34 |
|
MANAGEMENT’S DISCUSSION AND ANALYSIS OF FINANCIAL CONDITION AND RESULTS OF OPERATIONS
|
|
Three Months Ended March 31, |
|
|
|
|
|
|
|
|
|
|
|||||
|
|
2018 |
|
|
2017 |
|
|
Change |
|||||||||
|
|
(In thousands) |
|
|
Percentage |
||||||||||||
|
Corporate and other |
$ |
(76,146 |
) |
|
$ |
(38,296 |
) |
|
$ |
(37,850 |
) |
|
|
(99 |
) |
% |
Corporate and other expenses increased by $38 million in the first quarter of 2018 compared to the first quarter of 2017.
|
|
35 |
|
MANAGEMENT’S DISCUSSION AND ANALYSIS OF FINANCIAL CONDITION AND RESULTS OF OPERATIONS
The increase was due primarily to the:
|
|
• |
$14 million associated with (1) our Fit 2 Grow (“F2G”), a value improvement program to further reduce our costs; and (2) transaction costs related to our business combination with CB&I; and |
|
|
• |
lower cost recovery associated with certain vessels, engineering and fabrication facilities. |
Other Non-operating Items
Interest expense, net—Interest expense was $12 million and $18 million in the first quarter of 2018 and 2017, respectively. The decrease was primarily due to the repayment of our term loan in the second quarter of 2017.
Provision for income taxes—For the three months ended March 31, 2018, we recognized income before provision for income taxes of $59 million, compared to $39 million in the three months ended March 31, 2017. In the aggregate, the provision for income taxes was $21 million and $11 million for the three months ended March 31, 2018 and 2017, respectively. The increase in the provision for income taxes was primarily driven by increased income in the 2018 period coupled with losses in certain jurisdictions where we did not recognize a tax benefit. The increase was partially offset by income in favorable tax jurisdictions.
Due to the impact of ongoing tax losses in the U.S. and the corresponding valuation allowance on our U.S. net deferred tax asset position, the new provisions from U.S. tax reform enacted in December 2017 and taking effect in 2018 are not expected to have a material impact on our 2018 tax position.
Backlog
Backlog represents the dollar amount of revenues we expect to recognize in the future from contracts awarded, including those that are in progress. These amounts are presented in U.S. dollars. Our methodology for determining backlog may not be comparable to methodologies used by other companies in determining their backlog amounts. The backlog values we disclose include anticipated revenues associated with: (1) the original contract amounts; (2) change orders for which we have received written confirmations from the applicable customers; (3) change orders for which we expect to receive confirmations in the ordinary course of business; and (4) claims that we have made against our customers, when certain conditions are met. We do not include expected revenues of contracts related to unconsolidated joint ventures in our backlog, except to the extent of any contract awards we may receive from those joint ventures.
Backlog may not be indicative of future operating results, and projects in our backlog may be cancelled, modified or otherwise altered by customers. We can provide no assurance as to the profitability of our contracts reflected in backlog. It is possible that our estimates of profit could increase or decrease based on, among other things, changes in productivity, actual downtime and the resolution of change orders and claims with the customers. Backlog is a measure not defined by generally accepted accounting principles and is not a measure of contract profitability.
As of March 31, 2018, our $3.4 billion of backlog equals our remaining performance obligations under the applicable contracts. See Note 3, Revenue Recognition, to the accompanying Consolidated Financial Statements for further discussion.
Liquidity and Capital Resources
General—Our primary ongoing sources of liquidity are cash flows generated from operations and cash and cash equivalents on hand. We regularly review our sources and uses of funds and may access capital markets to increase our liquidity position or to refinance our existing debt. We plan to fund our ongoing working capital, capital expenditures, debt service and other funding requirements with cash on hand, cash from operating activities, proceeds from the issuance of debt, or a combination thereof.
We believe our anticipated future operating cash flow, capacity under our credit facilities and uncommitted bilateral lines of credit, along with access to surety bonds, will be sufficient to finance our capital expenditures, settle our commitments and contingencies and address our normal, anticipated working capital needs for the foreseeable future.
|
|
36 |
|
MANAGEMENT’S DISCUSSION AND ANALYSIS OF FINANCIAL CONDITION AND RESULTS OF OPERATIONS
Cash, Cash Equivalents and Restricted Cash
As of March 31, 2018, we had $419 million of cash, cash equivalents and restricted cash compared to $408 million as of December 31, 2017. At March 31, 2018, we had $117 million of cash in jurisdictions outside the U.S., principally in the United Arab Emirates, UK, Singapore, Brazil and Malaysia. Approximately 2% of our outstanding cash balance is held in countries that have established government imposed currency restrictions that could impede the ability of our subsidiaries to transfer funds to us.
As of March 31, 2018, we had restricted cash and cash equivalents totaling $6 million, compared to $18 million as of December 31, 2017, collateralized to support letters of credits. During the first quarter of 2018, the maximum amount of cash collateral used to support letters of credit was $122 million.
Cash Flow Activities
Operating activities―Net cash provided by operating activities in the first quarters of 2018 and 2017 was $37 million and $48 million, respectively.
The cash provided by operating activities primarily reflected our net income, adjusted for non-cash items and changes in components of our working capital—accounts receivable, contracts in progress net of advance billings on contracts, and accounts payable. Fluctuations in working capital are normal in our business. Working capital is impacted by the size of our projects and the achievement of billing milestones on backlog as we complete certain phases of the projects.
The components of working capital that used cash are:
|
|
• |
Accounts receivables—a $68 million increase primarily due to timing of billings and receipt of payments under project contractual terms; and |
|
|
• |
Accounts payable—a decrease of $90 million driven by progress across all segments, and due to timing of billings and vendor payments. |
The decrease was partially offset by a decrease in Contracts in progress, net of Advance billings on contracts, primarily due to progress on various Saudi Aramco projects, including the lump-sum EPCI project under the LTA II and the Vashishta project, all of which are substantially complete.
In the first quarter of 2017, net cash provided by working capital was $15 million.
The components of working capital that provided cash are:
|
|
• |
Accounts receivables—collections across all segments reduced our accounts receivable by $161 million; and |
|
|
• |
Accounts payable—increases of $95 million in accounts payable were driven by projects progress across all segments. |
Those increases were partially offset by a $241 million increase in Contracts in progress, net of Advance billings on contracts. This increase was primarily due to:
|
|
• |
progress on the Abkatun A-2 project in the AEA segment, the Saudi Aramco LTA II project in the MEA segment and the Vashishta project in the ASA segment; and |
|
|
• |
cash utilized by our Ichthys project as the project progressed through the marine installation phase. |
|
|
37 |
|
MANAGEMENT’S DISCUSSION AND ANALYSIS OF FINANCIAL CONDITION AND RESULTS OF OPERATIONS
Investing activities―Net cash used in investing activities in the first quarters of 2018 and 2017 was $20 million and $7 million, respectively. The uses in both periods primarily related to capital expenditures. Net cash used in investing activities in the first quarter of 2017 also included the sale lease back of the Amazon vessel discussed below.
Financing activities―Net cash used in financing activities in the first quarters of 2018 and 2017 was $7 million and $12 million, respectively. Net cash used in the first quarters of 2018 and 2017 was primarily attributable to repayment of debt and the repurchase of common stock from participants in our long-term incentive plans for payment of applicable withholding taxes upon vesting of awards under those plans.
Capital Expenditures
As part of our strategic growth program, our management regularly evaluates our marine vessel fleet and our fabrication yard construction capacity to ensure our fleet and construction capabilities are adequately aligned with our overall growth strategy. These assessments may result in capital expenditures to construct, upgrade, acquire or operate vessels or acquire or upgrade fabrication yards that would enhance or grow our technical capabilities, or may involve engaging in discussions to dispose of certain marine vessels or fabrication yards.
Capital expenditures for the first quarters of 2018 and 2017 were $18 million and $63 million, respectively, as discussed below:
|
|
• |
Capital expenditures for the three months ended March 31, 2018 were primarily attributable to our vessel upgrades and information technology update costs. |
|
|
• |
Capital expenditures for the three months ended March 31, 2017 were primarily attributable to the purchase of the pipelay and construction vessel, the Amazon. Following the purchase, we sold the Amazon to an unrelated third party and simultaneously entered into an 11-year bareboat charter agreement with the purchaser. |
During the remainder of 2018, we expect to spend approximately $100 million for capital projects.
Credit Agreements
As of March 31, 2018, we had $390 million of outstanding letters of credit issued under the letter of credit facility provided under our principal credit agreement (the “Current Credit Agreement”), and we had $537 million of total debt, including current maturities, net of debt issuance costs of $5 million. In addition, as of March 31, 2018 we had $545 million of outstanding bank guarantees issued under uncommitted lines of credit and $48 million of surety bonds issued under general agreements of indemnity.
As of March 31, 2018, we were in compliance with the financial and other covenants under the Current Credit Agreement, including those as shown below:
|
Ratios |
|
Requirement |
|
|
|
Actual |
|
|
Minimum fixed charge coverage ratio |
|
1.15x |
|
|
|
3.42x |
|
|
Maximum total leverage ratio |
|
3.50x |
|
|
|
1.20x |
|
|
Minimum collateral coverage ratio |
|
1.20x |
|
|
|
1.98x |
|
Senior Secured Notes—On April 9, 2018, we gave a conditional notice for full optional redemption of all our outstanding senior secured notes due 2021 (the “Outstanding Senior Secured Notes”) on May 10, 2018, which date is subject to extension through June 8, 2018. The redemption price will be equal to 102% of the principal amount of the Outstanding Senior Secured Notes, plus accrued and unpaid interest. The redemption is subject to our depositing, with the trustee for the Outstanding Senior Secured Notes, funds sufficient to pay the redemption price for all of the Outstanding Senior Secured Notes, plus accrued and unpaid interest.
For additional information, see Note 8, Debt, to the accompanying Consolidated Financial Statements.
Financing of the Combination
|
|
38 |
|
MANAGEMENT’S DISCUSSION AND ANALYSIS OF FINANCIAL CONDITION AND RESULTS OF OPERATIONS
On December 18, 2017, in connection with the Business Combination Agreement that we entered into with CB&I, we entered into or received commitment letters (including the exhibits and other attachments thereto, and together with any amendments, modifications or supplements thereto, the “Commitment Letters”) from certain financial institutions to provide debt financing for the Combination. Pursuant to the Commitment Letters, as amended and restated through the date of this report, we expect the following financing arrangements to be reflected in a new credit agreement to be entered into by certain of our subsidiaries (the “Borrowers”) on or before the closing of the Combination (the “New Credit Agreement”):
|
|
• |
a senior secured revolving credit facility providing for revolving credit borrowings and letters of credit in an aggregate principal or face amount of $1.0 billion outstanding at any one time (the “Revolving Facility”); |
|
|
• |
a senior secured letter of credit facility providing for letters of credit in the aggregate face amount of $1.39 billion outstanding at any one time (the “LC Facility”); and |
|
|
• |
a senior secured term loan facility providing for borrowings in the aggregate principal amount of $2.26 billion (the “Term Facility”), $319 million of which will be deposited into a cash collateral account to secure reimbursement obligations in respect of up to $310 million of letters of credit issuable under the Term Facility. |
In addition, on April 18, 2018, McDermott Escrow 1, Inc. and McDermott Escrow 2, Inc. (together, the “Escrow Issuers”) completed the previously announced offering of $1.3 billion in aggregate principal amount of 10.625% senior unsecured notes due 2024 (the “2024 Notes”). The Escrow Issuers represent variable interest entities which will consolidated by McDermott International, Inc. beginning in the second quarter of 2018. The 2024 Notes were offered to qualified institutional buyers in reliance on Rule 144A under the Securities Act of 1933, as amended (the “Securities Act”), and to certain non-U.S. persons in transactions outside the United States in reliance on Regulation S under the Securities Act. The 2024 Notes were issued pursuant to an Indenture, dated April 18, 2018 (the “Indenture”), by and among the Escrow Issuers and Wells Fargo Bank, National Association, as trustee. The 2024 Notes are scheduled to mature on May 1, 2024.
Pursuant to an escrow agreement (the “Escrow Agreement”), by and among the Escrow Issuers and Wells Fargo Bank, National Association, as escrow agent (the “Escrow Agent”), the proceeds of the offering of the 2024 Notes, together with approximately $28 million, to provide funds sufficient to pay interest on the 2024 Notes through June 29, 2018, were deposited into a segregated escrow account with the Escrow Agent. The funds will remain in escrow until the date on which certain escrow conditions are satisfied and the escrow proceeds are released (the “Escrow Conditions”). Concurrent with the satisfaction of the Escrow Conditions, the Escrow Issuers will merge with and into McDermott Technology (Americas), Inc. (“McDermott Technology (Americas)”) and McDermott Technology (US), Inc. (together with McDermott Technology (Americas), the “Post-Merger Co-Issuers”), with each Post-Merger Co-Issuer being a surviving entity that will assume, by operation of law, the obligations of the applicable Escrow Issuer under the 2024 Notes. Each of the Post-Merger Co-Issuers is a wholly owned subsidiary of McDermott International, Inc.
The 2024 Notes will be subject to a special mandatory redemption at a redemption price equal to 100% of the initial issue price of the 2024 Notes plus accrued interest to, but not including, the redemption date if the Escrow Conditions are not satisfied or the Escrow Issuers determine in their discretion that the Escrow Conditions are incapable of being satisfied on or prior to June 29, 2018.
The proceeds of the offering of the 2024 Notes and loans under the New Credit Agreement are intended to be used: (a) on the closing date for the Combination (the “Effective Date”) to (1) consummate the Combination, including the repayment of certain existing indebtedness of CBI and its subsidiaries, (2) redeem Outstanding Senior Secured Notes, (3) prepay existing indebtedness under, and to terminate in full, the Current Credit Agreement (as defined in Note 8, Debt, to the accompanying Consolidated Financial Statements), and (4) pay fees and expenses in connection with the Combination, the New Credit Agreement and the issuance of the 2024 Notes; and (b) for working capital and other general corporate purposes. On the Effective Date, certain existing letters of credit outstanding under the Current Credit Agreement and certain existing letters of credit outstanding under CBI’s existing credit facilities will be deemed issued under the New Credit Agreement, and letters of credit will be issued under the New Credit Agreement to backstop certain other existing letters of credit issued for the account of McDermott International, Inc., CBI and their respective subsidiaries and affiliates.
For additional information regarding the Revolving Facility, the LC Facility, the Term Facility and the 2024 Notes, see Note 2, Business Combination Agreement with Chicago Bridge and Iron Company N.V. (“CB&I”), to the accompanying Consolidated Financial Statements.
|
|
39 |
|
MANAGEMENT’S DISCUSSION AND ANALYSIS OF FINANCIAL CONDITION AND RESULTS OF OPERATIONS
Critical Accounting Policies and Estimates
For a discussion of the impact of critical accounting policies and estimates on our Consolidated Financial Statements, refer to Item 7 “Management’s Discussion and Analysis of Financial Condition and Results of Operations” included in the 2017 Form 10-K.
See Note 1, Basis of Presentation and Significant Accounting Policies, to the accompanying Consolidated Financial Statements for a discussion of the potential impact of new accounting standards on our unaudited Consolidated Financial Statements.
|
|
40 |
|
QUANTITATIVE AND QUALITATIVE DISCLOSURES ABOUT MARKET RISK
Item 3. Quantitative and Qualitative Disclosures about Market Risk
In the normal course of business, our results of operations are exposed to certain market risks, primarily associated with fluctuations in currency exchange rates.
We have operations in many locations around the world, and, as a result, our financial results could be significantly affected by factors such as changes in currency exchange rates or weak economic conditions in foreign markets. In order to manage the risks associated with currency exchange rate fluctuations, we attempt to hedge those risks with foreign currency derivative instruments. Historically, we have hedged those risks with foreign currency forward contracts. In certain cases, contracts with our customers may contain provisions under which payments from our customers are denominated in U.S. dollars and in a foreign currency. The payments denominated in a foreign currency are designed to compensate us for costs that we expect to incur in such foreign currency. In these cases, we may use derivative instruments to reduce the risks associated with currency exchange rate fluctuations arising from differences in timing of our foreign currency cash inflows and outflows. Our operational cash flows and cash balances, though predominately held in U.S. dollars, may consist of different currencies at various points in time in order to execute our project contracts globally. Non-U.S. denominated asset and liability balances are subject to currency fluctuations when measured period to period for financial reporting purposes in U.S. dollars.
As of March 31, 2018, we had no material future earnings or cash flow exposures from changes in interest rates on our outstanding debt obligations, as substantially all of those obligations had fixed interest rates.
For additional quantitative and qualitative disclosures about market risk, see Item 7A, Quantitative and Qualitative Disclosures about Market Risk, included in the 2017 Form 10-K.
|
|
41 |
|
CONTROLS AND PROCEDURES
Item 4. Controls and Procedures
As of the end of the period covered by this quarterly report, we carried out an evaluation, under the supervision and with the participation of our management, including our Chief Executive Officer and Chief Financial Officer, of the effectiveness of the design and operation of our disclosure controls and procedures (as that term is defined in Rules 13a-15(e) and 15d-15(e) adopted by the SEC under the Securities Exchange Act of 1934, as amended (the “Exchange Act”)). Our disclosure controls and procedures were developed through a process in which our management applied its judgment in assessing the costs and benefits of such controls and procedures, which, by their nature, can provide only reasonable assurance regarding the control objectives. You should note that the design of any system of disclosure controls and procedures is based in part upon various assumptions about the likelihood of future events, and we cannot assure you that any design will succeed in achieving its stated goals under all potential future conditions, regardless of how remote. Based on the evaluation referred to above, our Chief Executive Officer and Chief Financial Officer concluded that the design and operation of our disclosure controls and procedures are effective as of March 31, 2018 to provide reasonable assurance that information required to be disclosed by us in the reports that we file or submit under the Exchange Act is recorded, processed, summarized and reported within the time periods specified in the rules and forms of the Securities and Exchange Commission, and such information is accumulated and communicated to management, including our principal executive and principal financial officers or persons performing similar functions, as appropriate to allow timely decisions regarding disclosure. There has been no change in our internal control over financial reporting during the quarter ended March 31, 2018 that has materially affected, or is reasonably likely to materially affect, our internal control over financial reporting.
|
|
42 |
|
LEGAL PROCEEDINGS
OTHER INFORMATION
For information regarding ongoing investigations and litigation, see Note 15 to our unaudited Consolidated Financial Statements in Part I of this report, which we incorporate by reference into this Item.
|
|
43 |
|
EXHIBITS
EXHIBIT INDEX
|
Exhibit Number |
|
Description |
|
|
|
|
|
2.1* |
|
|
|
|
|
|
|
3.1* |
|
|
|
|
|
|
|
3.2* |
|
|
|
|
|
|
|
3.3* |
|
|
|
|
|
|
|
4.1* |
|
|
|
|
|
|
|
4.2* |
|
|
|
|
|
|
|
10.1* |
|
|
|
|
|
|
|
10.2* |
|
|
|
10.3* |
|
|
|
|
|
|
|
10.4* |
|
|
|
|
|
|
|
10.5* |
|
|
|
|
|
|
|
|
44 |
|
EXHIBITS
|
Exhibit Number |
|
Description |
|
|
|
|
|
|
||
|
|
|
|
|
31.1 |
|
Rule 13a-14(a)/15d-14(a) certification of Chief Executive Officer. |
|
|
|
|
|
31.2 |
|
Rule 13a-14(a)/15d-14(a) certification of Chief Financial Officer. |
|
|
|
|
|
32.1 |
|
|
|
|
|
|
|
32.2 |
|
|
|
|
|
|
|
101.INS XBRL |
|
Instance Document. |
|
|
|
|
|
101.SCH XBRL |
|
Taxonomy Extension Schema Document. |
|
|
|
|
|
101.CAL XBRL |
|
Taxonomy Extension Calculation Linkbase Document. |
|
|
|
|
|
101.LAB XBRL |
|
Taxonomy Extension Label Linkbase Document. |
|
|
|
|
|
101.PRE XBRL |
|
Taxonomy Extension Presentation Linkbase Document. |
|
|
|
|
|
101.DEF XBRL |
|
Taxonomy Extension Definition Linkbase Document. |
|
* |
Incorporated by reference to the filing indicated. |
|
|
45 |
|
SIGNATURES
Pursuant to the requirements of the Securities Exchange Act of 1934, the registrant has duly caused this report to be signed on its behalf by the undersigned thereunto duly authorized.
|
April 24, 2018 |
|
|
||
|
|
|
|
||
|
|
|
McDERMOTT INTERNATIONAL, INC. |
||
|
|
|
|
||
|
|
|
By: |
|
/s/ CHRISTOPHER A. KRUMMEL |
|
|
|
|
|
Christopher A. Krummel Vice President, Finance and Chief Accounting Officer |
|
|
46 |
|