Attached files
| file | filename |
|---|---|
| EX-99.1 - EXHIBIT 99.1 - Elevate Credit, Inc. | exhibit991pressreleaseq320.htm |
| 8-K - 8-K - Elevate Credit, Inc. | a10-18pressrelease.htm |

Q3 2018 Earnings Call October 2018
Forward-Looking Statements This presentation and responses to various questions contain forward-looking statements within the meaning of Section 27A of the Securities Act of 1933, as amended, and Section 21E of the Securities Exchange Act of 1934, as amended. The forward-looking statements present our current expectations and projections relating to our business, financial condition and results of operations, and do not refer to historical or current facts. These statements may include words such as “anticipate,” “estimate,” “expect,” “project,” “plan,” “intend,” “believe,” “may,” “will,” “should,” “likely” and other words and terms of similar meaning. The forward-looking statements include statements regarding: our future financial performance including our outlook for full fiscal year 2018 and the fourth quarter 2018; our belief that we will realize the full benefits of our new technology and credit models by the second quarter of 2019; our expectation of a significant reduction in our cost of funding in the first quarter of 2019; our expectations regarding Today Card, our new credit card product, including a planned ramp in 2019; our partnership with FinWise Bank more than doubling our Rise product state coverage from 17 to 35 states in 2018 and 2019 and supporting significant growth of Rise in 2019 and beyond including revenue growth in the first quarter of 2019; our perspectives on full-year 2018 and 2019, including our expectations regarding revenue, growth rate of revenue, net charge-offs, gross margin, operating expenses, operating margins, Adjusted EBITDA, net income, loan loss provision, direct marketing and other cost of sales and Adjusted EBITDA margin; our expectations regarding regulatory trends; our expectations regarding the cumulative loss rate as a percentage of originations for the 2017 and 2018 vintage; our growth strategies and our ability to effectively manage that growth; anticipated key marketing and underwriting initiatives; new and expanded products like a US credit card and lower-priced installment product in the UK; our expectations regarding the future expansion of the states in which our products are offered; the cost of customer acquisition, new customer originations, the efficacy and cost of our marketing efforts, including in the fourth quarter of 2018; the cost of capital remaining high through the end of 2018; our expectation that heightened UK complaints will continue at least through mid-2019; expanded marketing channels and new and growing marketing partnerships; continued growth and investment in data science and analytics; and additional bank partnerships. Forward‐looking statements involve certain risks and uncertainties, and actual results may differ materially from those discussed in any such statement. These risks and uncertainties include, but are not limited to: the Company’s limited operating history in an evolving industry; new laws and regulations in the consumer lending industry in many jurisdictions that could restrict the consumer lending products and services the Company offers, impose additional compliance costs on the Company, render the Company’s current operations unprofitable or even prohibit the Company’s current operations; scrutiny by regulators and payment processors of certain online lenders’ access to the Automated Clearing House system to disburse and collect loan proceeds and repayments; a lack of sufficient debt financing at acceptable prices or disruptions in the credit markets; the impact of competition in our industry and innovation by our competitors; our ability to prevent security breaches, disruption in service and comparable events that could compromise the personal and confidential information held in our data systems, reduce the attractiveness of our platform or adversely impact our ability to service loans; customer complaints or negative public perception could harm our business and other risks related to litigation, compliance and regulation. Additional factors that could cause actual results to differ are discussed under the heading "Risk Factors" and in other sections of the most recent Quarterly Report on Form 10-Q and in the Company's other current and periodic reports filed from time to time with the SEC. All written and oral forward-looking statements attributable to us, or persons acting on our behalf, are expressly qualified in their entirety by the cautionary statements regarding risks and uncertainties that are included in our public communications. You should evaluate all forward-looking statements made in this presentation in the context of these risks and uncertainties. Neither we nor any of our respective agents, employees or advisors intend or have any duty or obligation to supplement, amend, update or revise any of the forward-looking statements contained in this presentation. This presentation also contains estimates and other statistical data made by independent parties and by us relating to market size and growth and other data about our industry. This data involves a number of assumptions and limitations, and you are cautioned not to give undue weight to such estimates. Neither we nor any other person makes any representation as to the accuracy or completeness of such data or undertakes any obligation to update such data after the date of this presentation. In addition, projections, assumptions and estimates of our future performance and the future performance of the markets in which we operate are necessarily subject to a high degree of uncertainty and risk. The information and opinions contained in this presentation are provided as of the date of this presentation and are subject to change without notice. This presentation has not been approved by any regulatory or supervisory agency. See Appendix for additional information and definitions. 2
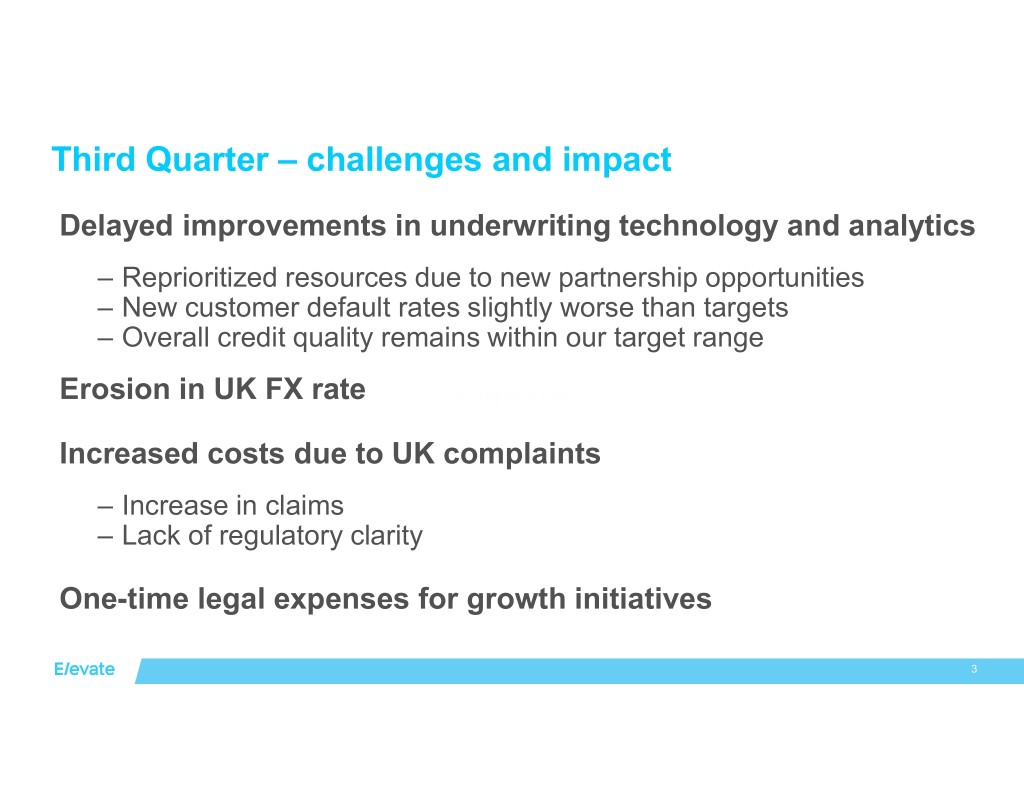
Third Quarter – challenges and impact Delayed improvements in underwriting technology and analytics – Reprioritized resources due to new partnership opportunities – New customer default rates slightly worse than targets – Overall credit quality remains within our target range Erosion in UK FX rate Increased costs due to UK complaints – Increase in claims – Lack of regulatory clarity One-time legal expenses for growth initiatives 3
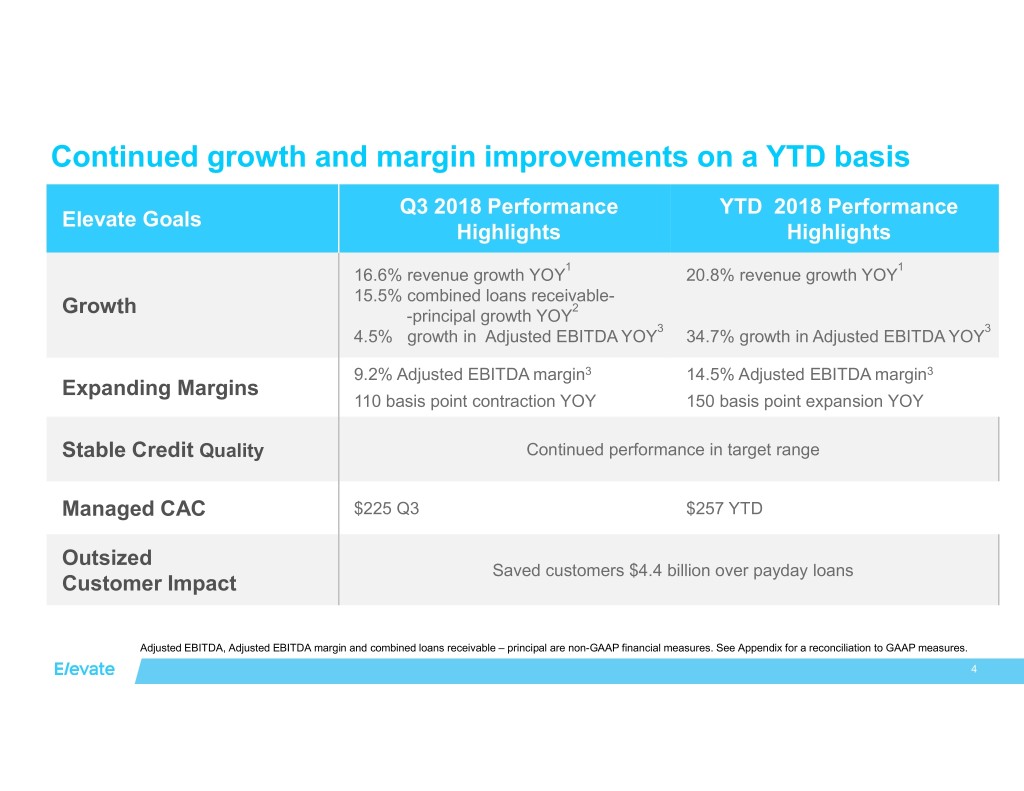
Continued growth and margin improvements on a YTD basis Q3 2018 Performance YTD 2018 Performance Elevate Goals Highlights Highlights 1 1 16.6% revenue growth YOY 20.8% revenue growth YOY 15.5% combined loans receivable- 2 Growth -principal growth YOY 3 3 4.5% growth in Adjusted EBITDA YOY 34.7% growth in Adjusted EBITDA YOY 9.2% Adjusted EBITDA margin3 14.5% Adjusted EBITDA margin3 Expanding Margins 110 basis point contraction YOY 150 basis point expansion YOY Stable Credit Quality Continued performance in target range Managed CAC $225 Q3 $257 YTD Outsized Saved customers $4.4 billion over payday loans Customer Impact Adjusted EBITDA, Adjusted EBITDA margin and combined loans receivable – principal are non-GAAP financial measures. See Appendix for a reconciliation to GAAP measures. 4
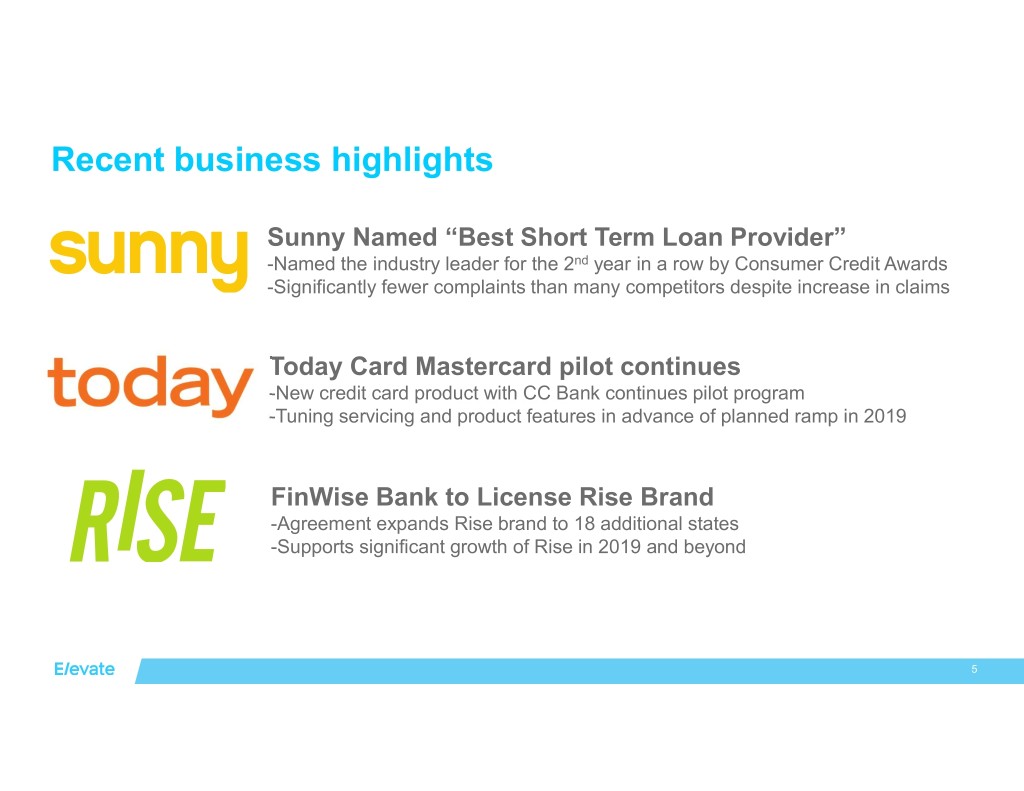
Recent business highlights Sunny Named “Best Short Term Loan Provider” -Named the industry leader for the 2nd year in a row by Consumer Credit Awards -Significantly fewer complaints than many competitors despite increase in claims Today Card Mastercard pilot continues -New credit card product with CC Bank continues pilot program -Tuning servicing and product features in advance of planned ramp in 2019 FinWise Bank to License Rise Brand -Agreement expands Rise brand to 18 additional states -Supports significant growth of Rise in 2019 and beyond 5
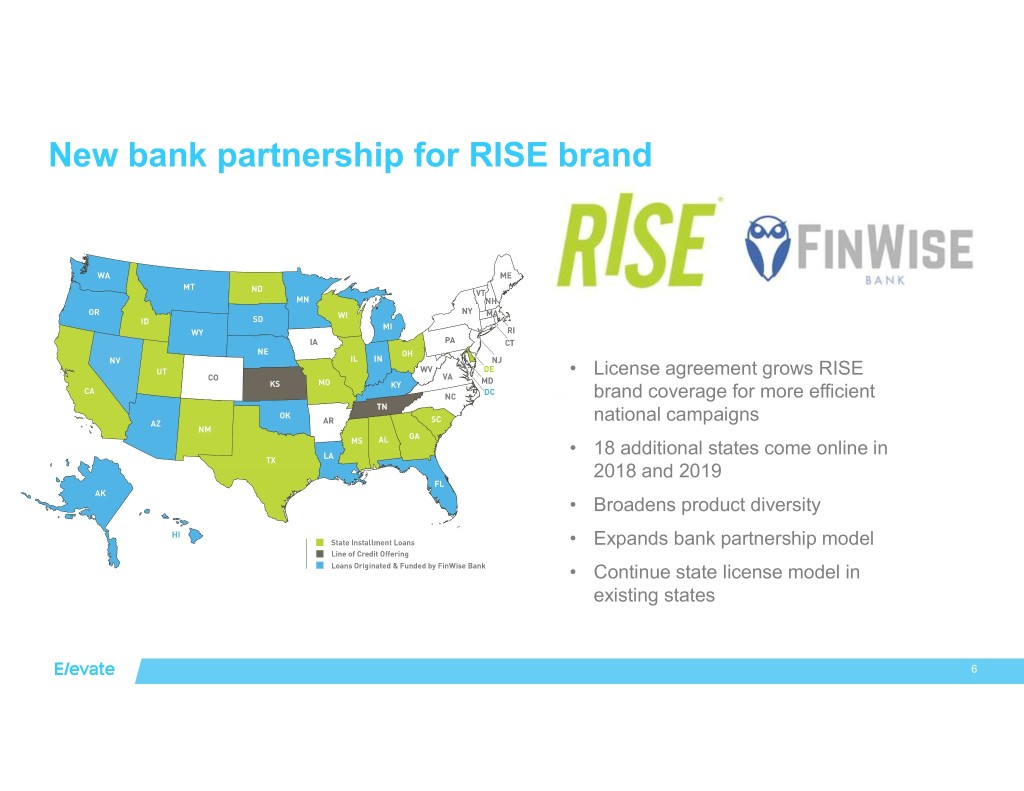
New bank partnership for RISE brand • License agreement grows RISE brand coverage for more efficient national campaigns • 18 additional states come online in 2018 and 2019 • Broadens product diversity • Expands bank partnership model • Continue state license model in existing states 6
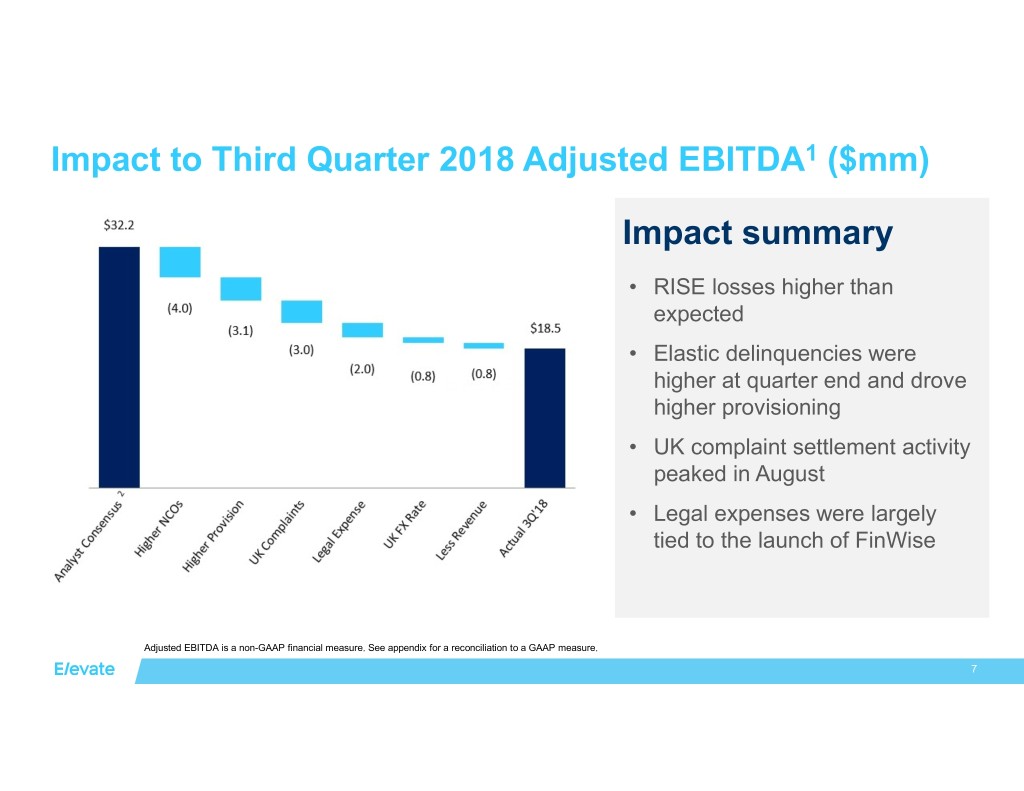
Impact to Third Quarter 2018 Adjusted EBITDA1 ($mm) Impact summary • RISE losses higher than expected • Elastic delinquencies were higher at quarter end and drove higher provisioning • UK complaint settlement activity peaked in August • Legal expenses were largely tied to the launch of FinWise Adjusted EBITDA is a non-GAAP financial measure. See appendix for a reconciliation to a GAAP measure. 7
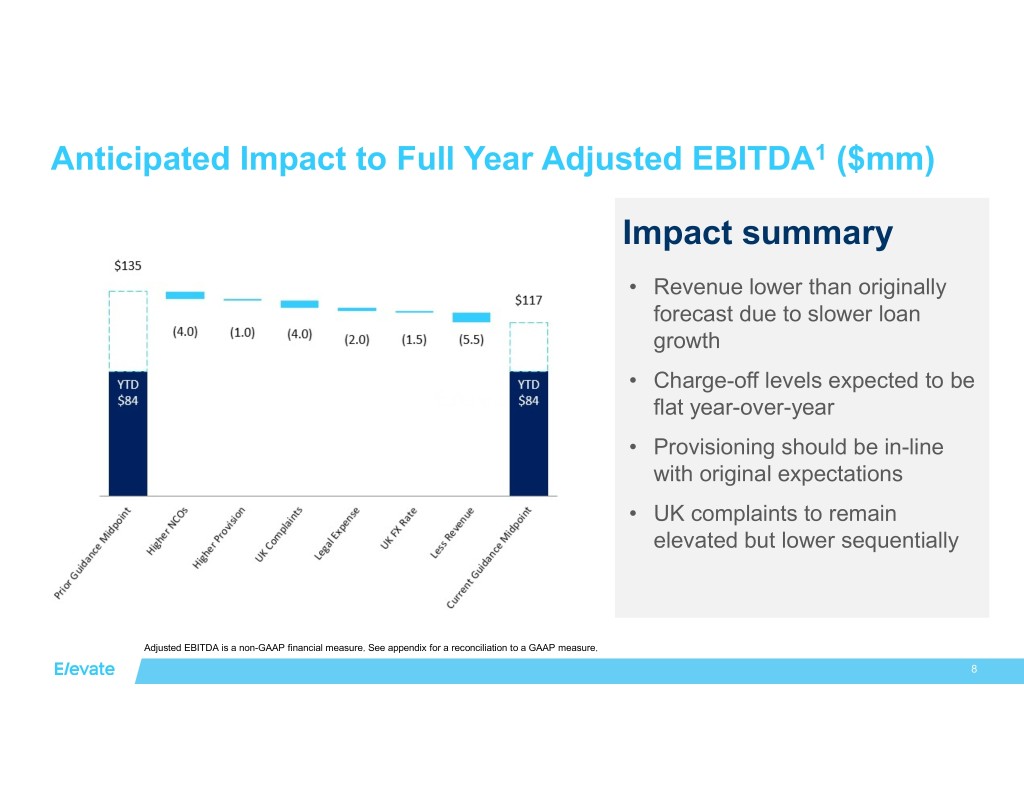
Anticipated Impact to Full Year Adjusted EBITDA1 ($mm) Impact summary • Revenue lower than originally forecast due to slower loan growth • Charge-off levels expected to be flat year-over-year • Provisioning should be in-line with original expectations • UK complaints to remain elevated but lower sequentially Adjusted EBITDA is a non-GAAP financial measure. See appendix for a reconciliation to a GAAP measure. 8
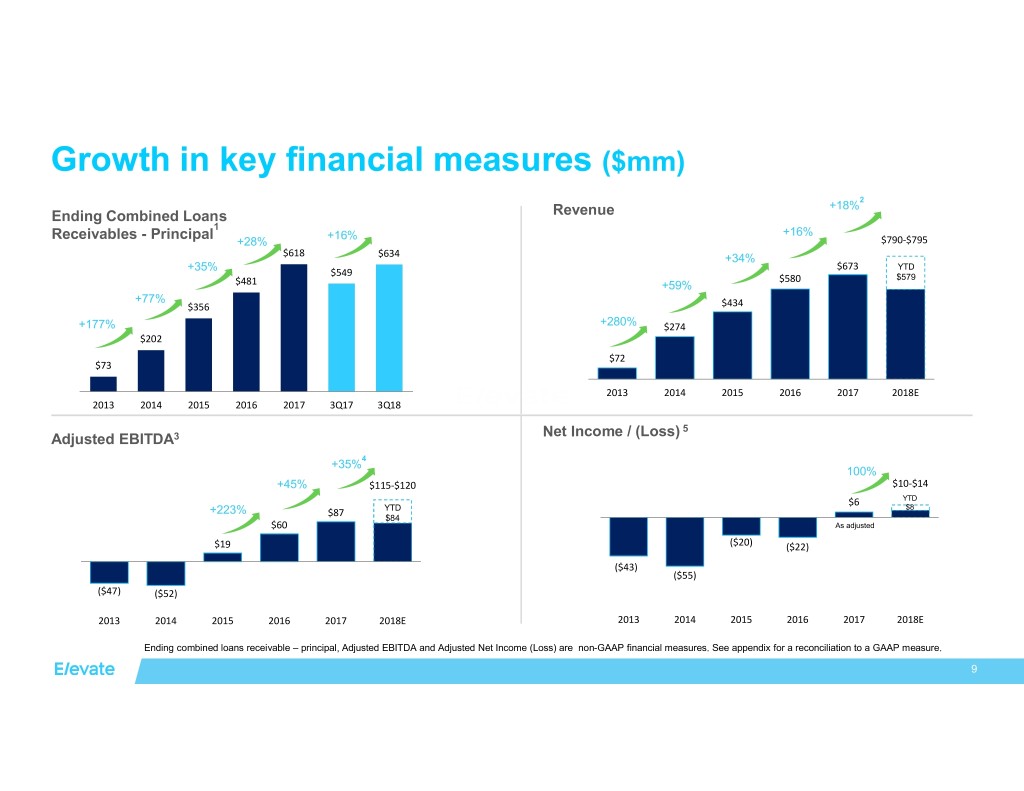
Growth in key financial measures ($mm) +18%2 Ending Combined Loans Revenue 1 Receivables - Principal +16% +16% +28% $790-$795 $618 $634 +34% +35% $673 YTD $549 $580 $579 $481 +59% +77% $356 $434 +177% +280% $274 $202 $72 $73 2013 2014 2015 2016 2017 2018E 2013 2014 2015 2016 2017 3Q17 3Q18 Net Income / (Loss) 5 Adjusted EBITDA3 +35%4 100% +45% $115-$120 $10-$14 $6 YTD +223% YTD $8 $87 $84 $60 As adjusted $19 ($20) ($22) ($43) ($55) ($47) ($52) 2013 2014 2015 2016 2017 2018E 2013 2014 2015 2016 2017 2018E Ending combined loans receivable – principal, Adjusted EBITDA and Adjusted Net Income (Loss) are non-GAAP financial measures. See appendix for a reconciliation to a GAAP measure. 9
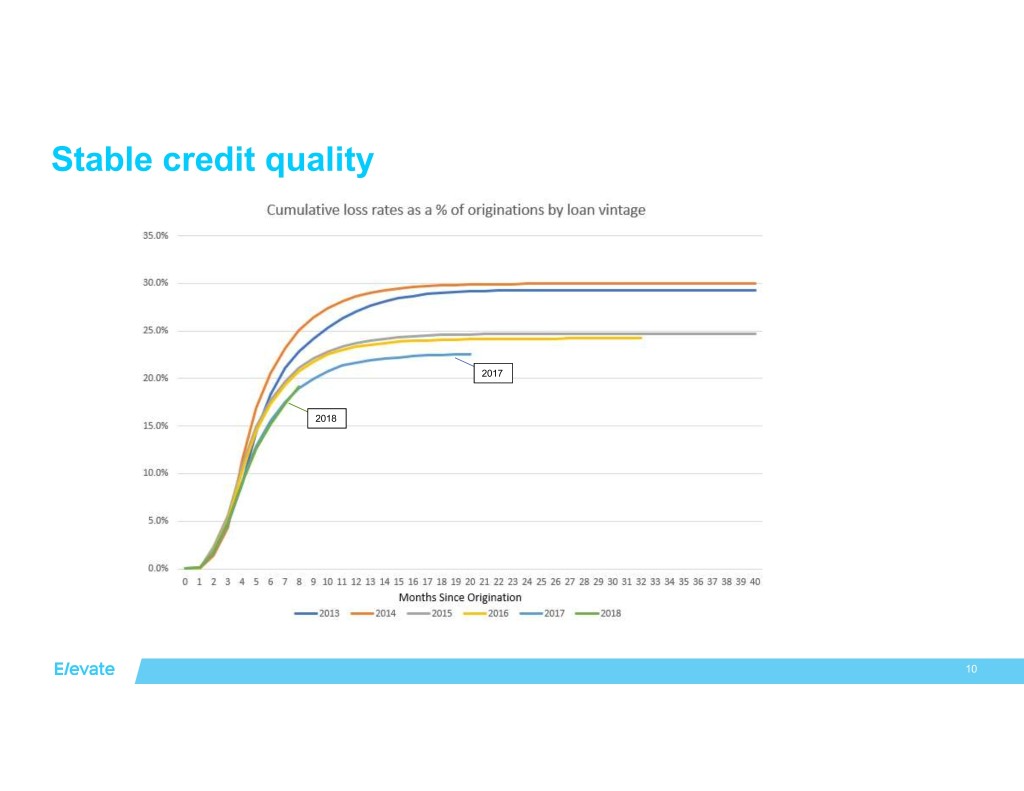
Stable credit quality 2017 2018 10
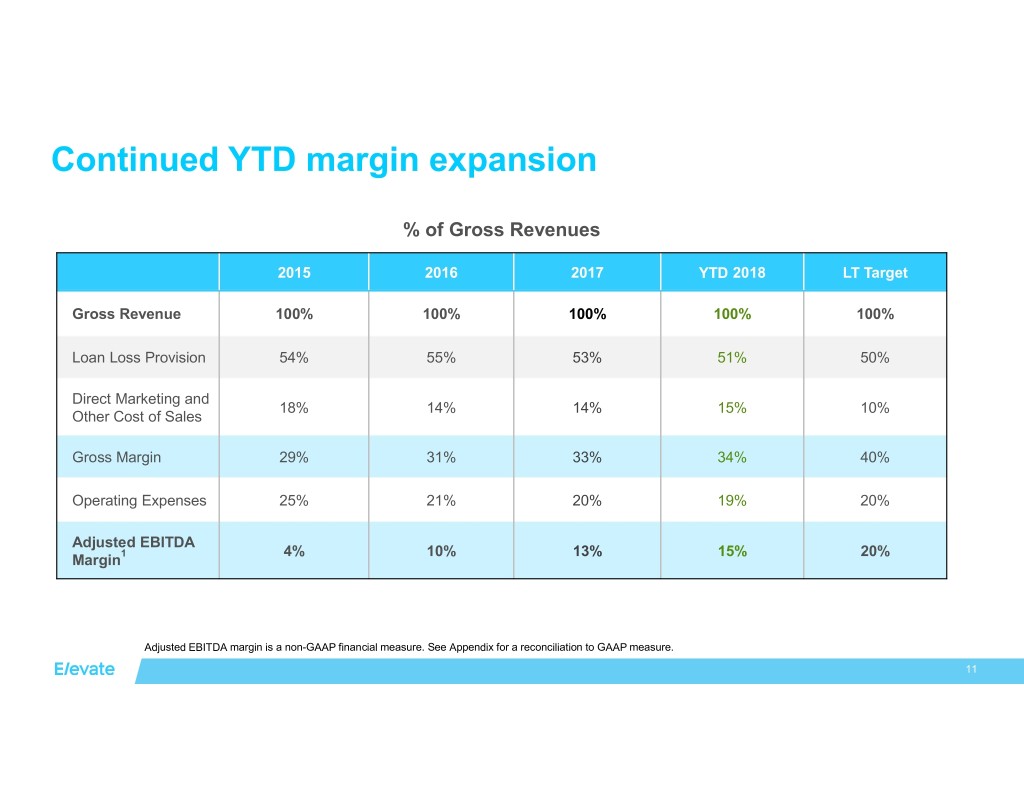
Continued YTD margin expansion % of Gross Revenues 2015 2016 2017 YTD 2018 LT Target Gross Revenue 100% 100% 100% 100% 100% Loan Loss Provision 54% 55% 53% 51% 50% Direct Marketing and 18% 14% 14% 15% 10% Other Cost of Sales Gross Margin 29% 31% 33% 34% 40% Operating Expenses 25% 21% 20% 19% 20% Adjusted EBITDA 1 4% 10% 13% 15% 20% Margin Adjusted EBITDA margin is a non-GAAP financial measure. See Appendix for a reconciliation to GAAP measure. 11
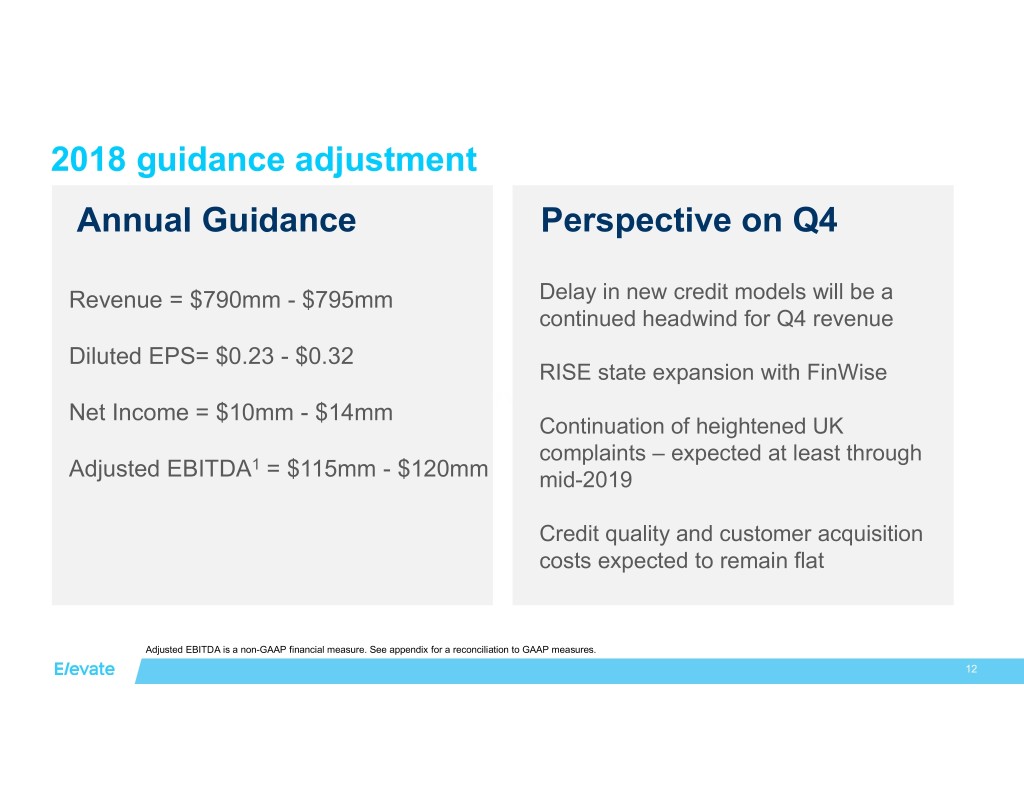
2018 guidance adjustment Annual Guidance Perspective on Q4 Revenue = $790mm - $795mm Delay in new credit models will be a continued headwind for Q4 revenue Diluted EPS= $0.23 - $0.32 RISE state expansion with FinWise Net Income = $10mm - $14mm Continuation of heightened UK 1 complaints – expected at least through Adjusted EBITDA = $115mm - $120mm mid-2019 Credit quality and customer acquisition costs expected to remain flat Adjusted EBITDA is a non-GAAP financial measure. See appendix for a reconciliation to GAAP measures. 12
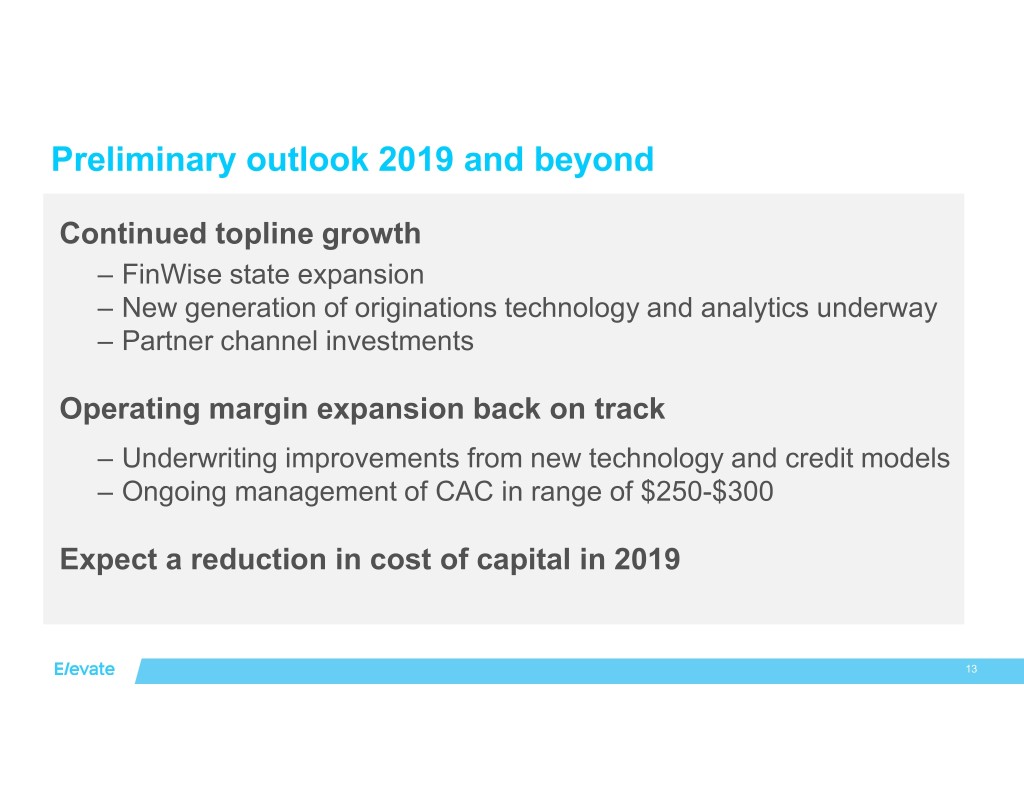
Preliminary outlook 2019 and beyond Continued topline growth – FinWise state expansion – New generation of originations technology and analytics underway – Partner channel investments Operating margin expansion back on track – Underwriting improvements from new technology and credit models – Ongoing management of CAC in range of $250-$300 Expect a reduction in cost of capital in 2019 13
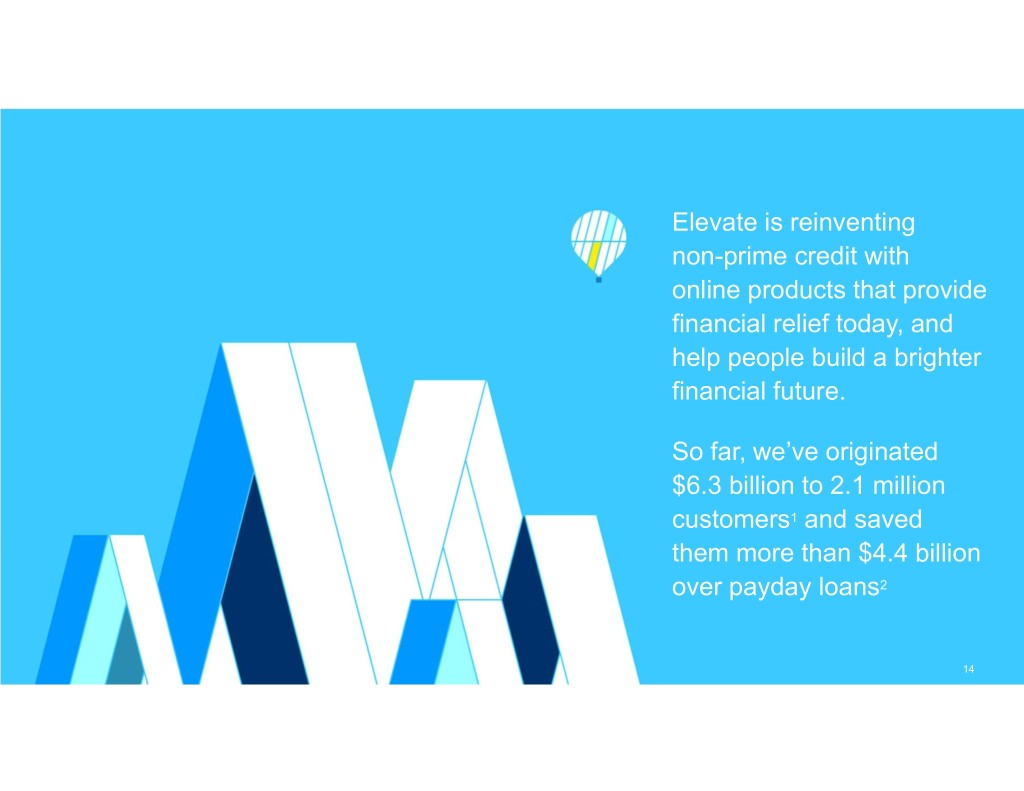
Elevate is reinventing non-prime credit with online products that provide financial relief today, and help people build a brighter financial future. So far, we’ve originated $6.3 billion to 2.1 million customers1 and saved them more than $4.4 billion over payday loans2 1414

We believe everyone deserves a lift. 1515

Appendix 16
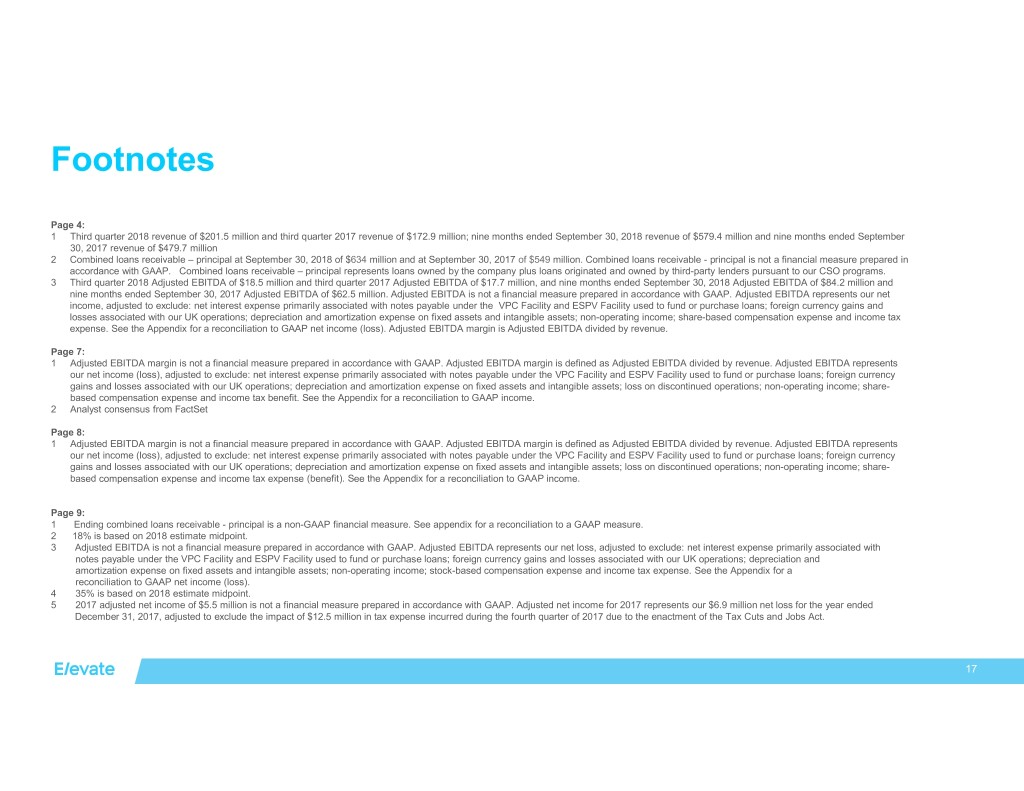
Footnotes Page 4: 1 Third quarter 2018 revenue of $201.5 million and third quarter 2017 revenue of $172.9 million; nine months ended September 30, 2018 revenue of $579.4 million and nine months ended September 30, 2017 revenue of $479.7 million 2 Combined loans receivable – principal at September 30, 2018 of $634 million and at September 30, 2017 of $549 million. Combined loans receivable - principal is not a financial measure prepared in accordance with GAAP. Combined loans receivable – principal represents loans owned by the company plus loans originated and owned by third-party lenders pursuant to our CSO programs. 3 Third quarter 2018 Adjusted EBITDA of $18.5 million and third quarter 2017 Adjusted EBITDA of $17.7 million, and nine months ended September 30, 2018 Adjusted EBITDA of $84.2 million and nine months ended September 30, 2017 Adjusted EBITDA of $62.5 million. Adjusted EBITDA is not a financial measure prepared in accordance with GAAP. Adjusted EBITDA represents our net income, adjusted to exclude: net interest expense primarily associated with notes payable under the VPC Facility and ESPV Facility used to fund or purchase loans; foreign currency gains and losses associated with our UK operations; depreciation and amortization expense on fixed assets and intangible assets; non-operating income; share-based compensation expense and income tax expense. See the Appendix for a reconciliation to GAAP net income (loss). Adjusted EBITDA margin is Adjusted EBITDA divided by revenue. Page 7: 1 Adjusted EBITDA margin is not a financial measure prepared in accordance with GAAP. Adjusted EBITDA margin is defined as Adjusted EBITDA divided by revenue. Adjusted EBITDA represents our net income (loss), adjusted to exclude: net interest expense primarily associated with notes payable under the VPC Facility and ESPV Facility used to fund or purchase loans; foreign currency gains and losses associated with our UK operations; depreciation and amortization expense on fixed assets and intangible assets; loss on discontinued operations; non-operating income; share- based compensation expense and income tax benefit. See the Appendix for a reconciliation to GAAP income. 2 Analyst consensus from FactSet Page 8: 1 Adjusted EBITDA margin is not a financial measure prepared in accordance with GAAP. Adjusted EBITDA margin is defined as Adjusted EBITDA divided by revenue. Adjusted EBITDA represents our net income (loss), adjusted to exclude: net interest expense primarily associated with notes payable under the VPC Facility and ESPV Facility used to fund or purchase loans; foreign currency gains and losses associated with our UK operations; depreciation and amortization expense on fixed assets and intangible assets; loss on discontinued operations; non-operating income; share- based compensation expense and income tax expense (benefit). See the Appendix for a reconciliation to GAAP income. Page 9: 1 Ending combined loans receivable - principal is a non-GAAP financial measure. See appendix for a reconciliation to a GAAP measure. 2 18% is based on 2018 estimate midpoint. 3 Adjusted EBITDA is not a financial measure prepared in accordance with GAAP. Adjusted EBITDA represents our net loss, adjusted to exclude: net interest expense primarily associated with notes payable under the VPC Facility and ESPV Facility used to fund or purchase loans; foreign currency gains and losses associated with our UK operations; depreciation and amortization expense on fixed assets and intangible assets; non-operating income; stock-based compensation expense and income tax expense. See the Appendix for a reconciliation to GAAP net income (loss). 4 35% is based on 2018 estimate midpoint. 5 2017 adjusted net income of $5.5 million is not a financial measure prepared in accordance with GAAP. Adjusted net income for 2017 represents our $6.9 million net loss for the year ended December 31, 2017, adjusted to exclude the impact of $12.5 million in tax expense incurred during the fourth quarter of 2017 due to the enactment of the Tax Cuts and Jobs Act. 17
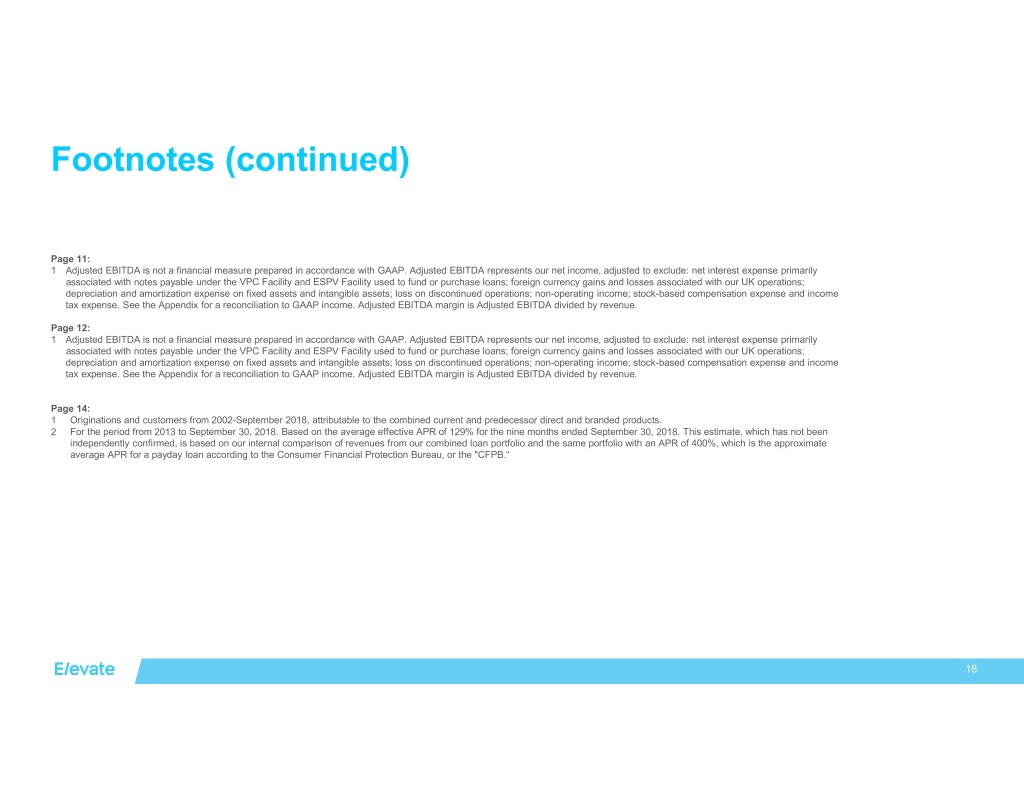
Footnotes (continued) Page 11: 1 Adjusted EBITDA is not a financial measure prepared in accordance with GAAP. Adjusted EBITDA represents our net income, adjusted to exclude: net interest expense primarily associated with notes payable under the VPC Facility and ESPV Facility used to fund or purchase loans; foreign currency gains and losses associated with our UK operations; depreciation and amortization expense on fixed assets and intangible assets; loss on discontinued operations; non-operating income; stock-based compensation expense and income tax expense. See the Appendix for a reconciliation to GAAP income. Adjusted EBITDA margin is Adjusted EBITDA divided by revenue. Page 12: 1 Adjusted EBITDA is not a financial measure prepared in accordance with GAAP. Adjusted EBITDA represents our net income, adjusted to exclude: net interest expense primarily associated with notes payable under the VPC Facility and ESPV Facility used to fund or purchase loans; foreign currency gains and losses associated with our UK operations; depreciation and amortization expense on fixed assets and intangible assets; loss on discontinued operations; non-operating income; stock-based compensation expense and income tax expense. See the Appendix for a reconciliation to GAAP income. Adjusted EBITDA margin is Adjusted EBITDA divided by revenue. Page 14: 1 Originations and customers from 2002-September 2018, attributable to the combined current and predecessor direct and branded products. 2 For the period from 2013 to September 30, 2018. Based on the average effective APR of 129% for the nine months ended September 30, 2018. This estimate, which has not been independently confirmed, is based on our internal comparison of revenues from our combined loan portfolio and the same portfolio with an APR of 400%, which is the approximate average APR for a payday loan according to the Consumer Financial Protection Bureau, or the "CFPB.“ 18
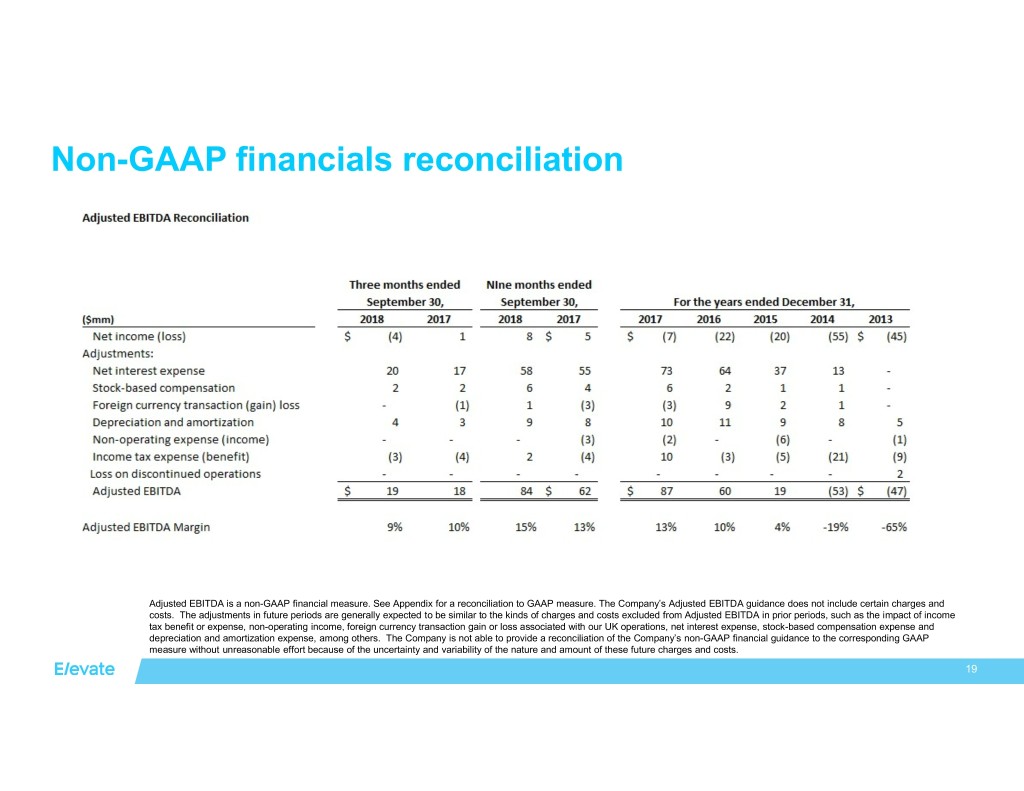
Non-GAAP financials reconciliation Adjusted EBITDA is a non-GAAP financial measure. See Appendix for a reconciliation to GAAP measure. The Company’s Adjusted EBITDA guidance does not include certain charges and costs. The adjustments in future periods are generally expected to be similar to the kinds of charges and costs excluded from Adjusted EBITDA in prior periods, such as the impact of income tax benefit or expense, non-operating income, foreign currency transaction gain or loss associated with our UK operations, net interest expense, stock-based compensation expense and depreciation and amortization expense, among others. The Company is not able to provide a reconciliation of the Company’s non-GAAP financial guidance to the corresponding GAAP measure without unreasonable effort because of the uncertainty and variability of the nature and amount of these future charges and costs. 19
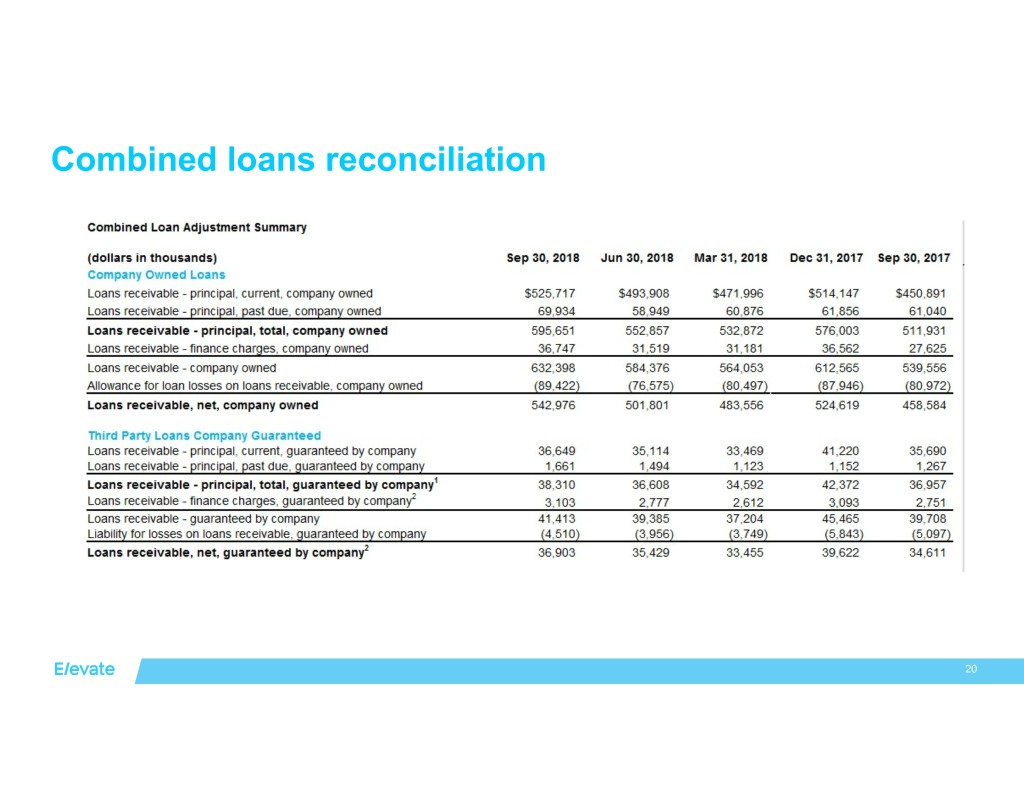
Combined loans reconciliation 20
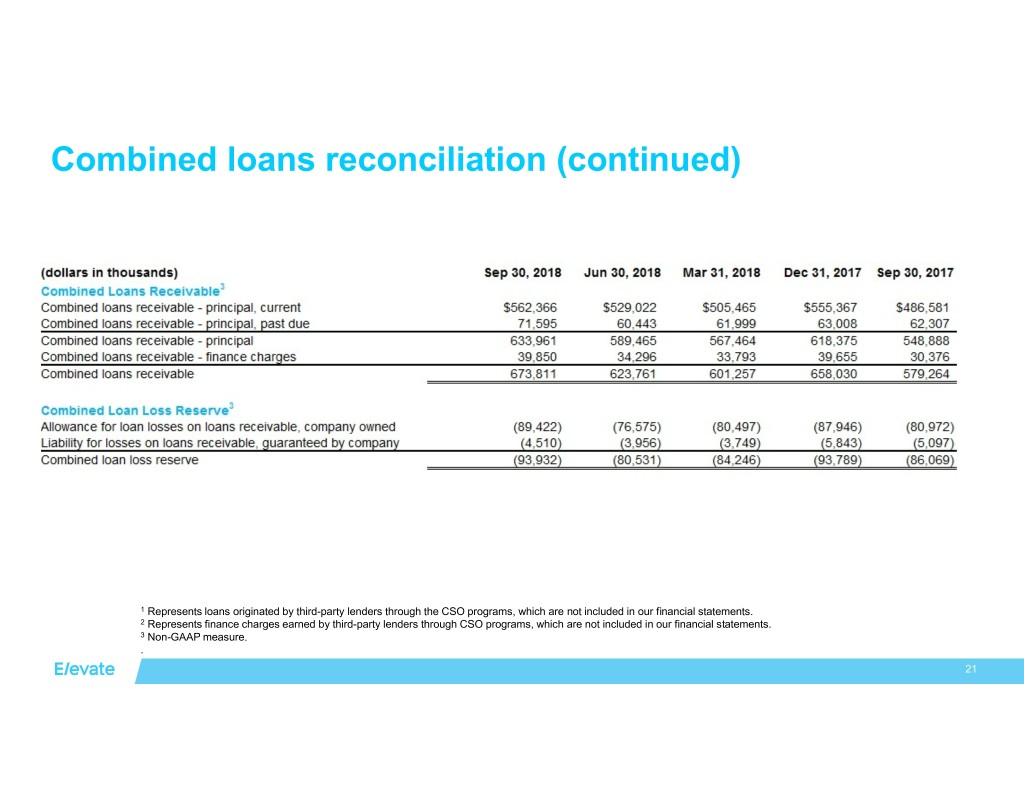
Combined loans reconciliation (continued) 1 Represents loans originated by third-party lenders through the CSO programs, which are not included in our financial statements. 2 Represents finance charges earned by third-party lenders through CSO programs, which are not included in our financial statements. 3 Non-GAAP measure. . 21

© 2017 Elevate. All Rights Reserved.
