Attached files
| file | filename |
|---|---|
| EX-10.50 - EXHIBIT 10.50 - Elevate Credit, Inc. | exhibit1050spectrumlease.htm |
| EX-32.2 - EXHIBIT 32.2 - Elevate Credit, Inc. | exhibit322-12x31x2017.htm |
| EX-32.1 - EXHIBIT 32.1 - Elevate Credit, Inc. | exhibit321-12x31x2017.htm |
| EX-31.2 - EXHIBIT 31.2 - Elevate Credit, Inc. | exhibit312-12x31x2017.htm |
| EX-31.1 - EXHIBIT 31.1 - Elevate Credit, Inc. | exhibit31112-31x2017.htm |
| EX-23.1 - EXHIBIT 23.1 - Elevate Credit, Inc. | exhibit231consent.htm |
| EX-21.1 - EXHIBIT 21.1 - Elevate Credit, Inc. | exhibit211-subsidiaries.htm |
| EX-10.42 - EXHIBIT 10.42 - Elevate Credit, Inc. | tfisubleaseamended12012014.htm |
| EX-10.41 - EXHIBIT 10.41 - Elevate Credit, Inc. | overtonsublease05012014.htm |
UNITED STATES
SECURITIES AND EXCHANGE COMMISSION
Washington, D.C. 20549
FORM 10-K
(Mark One)
x ANNUAL REPORT PURSUANT TO SECTION 13 OR 15(d) OF THE SECURITIES EXCHANGE ACT OF 1934
For the fiscal year ended December 31, 2017
or
o TRANSITION REPORT PURSUANT TO SECTION 13 OR 15(d) OF THE SECURITIES EXCHANGE ACT OF 1934
For the transition period from __________ to __________
Commission file number 001-37680

ELEVATE CREDIT, INC.
(Exact name of registrant as specified in its charter)
Delaware | 46-4714474 | |||
State or Other Jurisdiction of Incorporation or Organization | I.R.S. Employer Identification Number | |||
4150 International Plaza, Suite 300 Fort Worth, Texas 76109 | 76109 | |||
Address of Principal Executive Offices | Zip Code | |||
(817) 928-1500 | ||||
Registrant’s Telephone Number, Including Area Code | ||||
Securities registered pursuant to Section 12(b) of the Act: | ||||
Common stock, par value $0.0004 per share | The New York Stock Exchange | |||
Title of each class | Name of each exchange on which registered | |||
Securities registered pursuant to Section 12(g) of the Act:
None
Indicate by check mark if the Registrant is a well-known seasoned issuer, as defined in Rule 405 of the Securities Act. Yes o No x
Indicate by check mark if the Registrant is not required to file reports pursuant to Section 13 or 15(d) of the Act. Yes o No x
Indicate by check mark whether the Registrant (1) has filed all reports required to be filed by Section 13 or 15(d) of the Securities Exchange Act of 1934 during the preceding 12 months (or for such shorter period that the Registrant was required to file such reports) and (2) has been subject to such filing requirements for the past 90 days.
Yes | x | No | o |
Indicate by check mark whether the Registrant has submitted electronically and posted on its corporate Web site, if any, every Interactive Data File required to be submitted and posted pursuant to Rule 405 of Regulation S-T (§ 232.405 of this chapter) during the preceding 12 months (or for such shorter period that the Registrant was required to submit and post such files).
Yes | x | No | o |
1
Indicate by check mark if disclosure of delinquent filers pursuant to Item 405 of Regulation S-K (§ 229.405 of this chapter) is not contained
herein, and will not be contained, to the best of the registrant’s knowledge, in definitive proxy or information statements incorporated by
reference in Part III of the Form 10-K or any amendment to the Form 10-K. o
Indicate by check mark whether the Registrant is a large accelerated filer, an accelerated filer, a non-accelerated filer, a smaller reporting company or an emerging growth company. See the definitions of “large accelerated filer,” “accelerated filer,” “smaller reporting company” and “emerging growth company” in Rule 12b-2 of the Exchange Act.
Large accelerated filer | o | Non-accelerated filer | x |
Accelerated filer | o | Smaller reporting company | o |
Emerging growth company | x | ||
If an emerging growth company, indicate by check mark if the registrant has elected not to use the extended transition period for complying with any new or revised financial accounting standards provided pursuant to Section 13(a) of the Exchange Act. x
Indicate by check mark whether the registrant is a shell company (as defined in Rule 12b-2 of the Act). Yes o No x
The aggregate market value of the Registrant's common stock, par value $0.0004 per share, held by non-affiliates as of June 30, 2017 was approximately $71,215,460.
The number of shares outstanding of the Registrant's common stock, par value $0.0004 per share, as of March 7, 2018 was 42,230,116 shares.
DOCUMENTS INCORPORATED BY REFERENCE
Portions of the Registrant’s Proxy Statement for the 2018 Annual Meeting of Stockholders are incorporated herein by reference in Part III of
this Annual Report on Form 10-K to the extent stated herein. Such proxy statement will be filed with the Securities and Exchange
Commission within 120 days of the Registrant’s fiscal year ended December 31, 2017.
2
TABLE OF CONTENTS
YEAR ENDED DCEMBER 31, 2017
INDEX TO FORM 10-K
Part I | |||
Item 1. | |||
Item 1A. | |||
Item 1B. | |||
Item 2. | |||
Item 3. | |||
Item 4. | |||
Part II | |||
Item 5. | |||
Item 6. | |||
Item 7. | |||
Item 7A. | |||
Item 8. | |||
Item 9. | |||
Item 9A. | |||
Item 9B. | |||
Part III | |||
Item 10. | |||
Item 11. | |||
Item 12. | |||
Item 13. | |||
Item 14. | |||
Part IV | |||
Item 15. | |||
Item 16. | |||
3
NOTE ABOUT FORWARD-LOOKING STATEMENTS
This Annual Report on Form 10-K contains forward-looking statements within the meaning of Section 27A of the Securities Act of 1933, as amended (the "Securities Act"), and Section 21E of the Securities Exchange Act of 1934, as amended (the "Exchange Act") that are based on our management’s beliefs and assumptions and on information currently available to our management. The forward-looking statements are contained throughout this Annual Report on Form 10-K, including in “Management’s Discussion and Analysis of Financial Condition and Results of Operations” and “Risk Factors.” Forward-looking statements include information concerning our strategy, future operations, future financial position, future revenues, projected expenses, margins, prospects and plans and objectives of management. Forward-looking statements include all statements that are not historical facts and can be identified by terms such as “anticipate,” “believe,” “could,” “seek,” “estimate,” “expect,” “intend,” “may,” “plan,” “potential,” “predict,” “project,” “should,” “will,” “would” or similar expressions and the negatives of those terms. Forward-looking statements contained in this Annual Report on Form 10-K include, but are not limited to, statements about:
• | our future financial performance, including our expectations regarding our revenue, cost of revenue, growth rate of revenue, cost of borrowing, credit losses, marketing costs, net charge-offs, gross profit or gross margin, operating expenses, operating margins, ability to generate cash flow and ability to achieve and maintain future profitability; |
• | the availability of debt financing, funding sources and disruptions in credit markets; |
• | the intention to create an additional special purpose vehicle ("SPV") as another funding source for the Elastic line of credit product; |
• | the expectation that this additional SPV for Elastic would provide additional funding, diversified funding sources and further lower the cost of funds; |
• | our ability to meet anticipated cash operating expenses and capital expenditure requirements; |
• | anticipated trends, growth rates, seasonal fluctuations and challenges in our business and in the markets in which we operate; |
• | our ability to anticipate market needs and develop new and enhanced or differentiated products, services and mobile apps to meet those needs, and our ability to successfully monetize them; |
• | our expectations with respect to trends in our average portfolio effective annual percentage rate; |
• | our anticipated growth and growth strategies and our ability to effectively manage that growth; |
• | our anticipated expansion of relationships with strategic partners; |
• | customer demand for our product and our ability to rapidly scale our business in response to fluctuations in demand; |
• | our ability to attract potential customers and retain existing customers and our cost of customer acquisition; |
• | the ability of customers to repay loans; |
• | interest rates and origination fees on loans; |
• | the impact of competition in our industry and innovation by our competitors; |
• | our ability to attract and retain necessary qualified directors, officers and employees to expand our operations; |
• | our reliance on third-party service providers; |
• | our access to the automated clearinghouse system; |
• | the efficacy of our marketing efforts and relationships with marketing affiliates; |
• | our anticipated direct marketing costs and spending; |
• | the evolution of technology affecting our products, services and markets; |
• | continued innovation of our analytics platform; |
• | our ability to prevent security breaches, disruption in service and comparable events that could compromise the personal and confidential information held in our data systems, reduce the attractiveness of the platform or adversely impact our ability to service loans; |
• | our ability to detect and filter fraudulent or incorrect information provided to us by our customers or by third parties; |
• | our ability to adequately protect our intellectual property; |
4
• | our compliance with applicable local, state, federal and foreign laws; |
• | our compliance with current or future applicable regulatory developments and regulations, including developments or changes from the Consumer Financial Protection Bureau (the "CFPB"); |
• | regulatory developments or scrutiny by agencies regulating our business or the businesses of our third-party partners; |
• | public perception of our business and industry; |
• | the anticipated effect on our business of litigation or regulatory proceedings to which we or our officers are a party; |
• | the anticipated effect on our business of natural or man-made catastrophes; |
• | the increased expenses and administrative workload associated with being a public company; |
• | failure to maintain an effective system of internal controls necessary to accurately report our financial results and prevent fraud; |
• | our liquidity and working capital requirements; |
• | the estimates and estimate methodologies used in preparing our consolidated financial statements; |
• | the utility of non-GAAP financial measures; |
• | the future trading prices of our common stock and the impact of securities analysts’ reports on these prices; |
• | our anticipated development and release of certain products and applications and changes to certain products; |
• | our anticipated investing activity; |
• | trends anticipated to continue as our portfolio of loans matures; and |
• | expectations regarding our debt facilities, including: |
◦ | our expectation that the $49 million currently outstanding under the ESPV Facility which has an August 13, 2018 maturity date will be extended to a July 1, 2021 maturity date; and |
◦ | our expectation that the $75 million currently outstanding under the US Term Note which has an August 13, 2018 maturity date will be extended to a February 1, 2021 maturity date. |
We caution you that the foregoing list may not contain all of the forward-looking statements made in this Annual Report on Form 10-K.
Forward-looking statements involve known and unknown risks, uncertainties and other factors that may cause our actual results, performance or achievements to be materially different from any future results, performance or achievements expressed or implied by the forward-looking statements. We discuss these risks in greater detail in “Risk Factors” and elsewhere in this Annual Report on Form 10-K. Given these uncertainties, you should not place undue reliance on these forward-looking statements. Also, forward-looking statements represent our management’s beliefs and assumptions only as of the date of this Annual Report on Form 10-K. Except as required by law, we assume no obligation to update these forward-looking statements publicly, or to update the reasons actual results could differ materially from those anticipated in these forward-looking statements, even if new information becomes available in the future.
5
PART I
Item 1. Business
Unless expressly indicated or the context requires otherwise, the terms “Elevate,” “company,” “we,” “us” and “our” used below refer to Elevate Credit, Inc. and, where appropriate, our wholly owned subsidiaries, as well as the direct lending and branded product business of our predecessor, Think Finance, Inc. ("TFI"), for periods prior to our 2014 spin-off from TFI. We generally refer to loans, customers and other information and data associated with each of Rise, Elastic and Sunny as Elevate’s loans, customers, information and data, irrespective of whether Elevate originates the credit to the customer or whether such credit is originated by a third party.
OUR COMPANY
We provide online credit solutions to consumers in the United States (the "US") and the United Kingdom (the "UK") who are not well-served by traditional bank products and who are looking for better options than payday loans, title loans, pawn and storefront installment loans. Non-prime consumers—approximately 170 million people in the US and UK, typically defined as those with credit scores of less than 700—now represent a larger market than prime consumers but are difficult to underwrite and serve with traditional approaches. We’re succeeding at it—and doing it responsibly—with best-in-class advanced technology and proprietary risk analytics honed by serving more than 1.9 million customers with $5.2 billion in credit. Our current online credit products, Rise, Elastic and Sunny, reflect our mission to provide customers with access to competitively priced credit and services while helping them build a brighter financial future with credit building and financial wellness features. We call this mission "Good Today, Better Tomorrow."
We have experienced rapid growth since launching our current generation of products in 2013. As of December 31, 2017, Rise, Elastic and Sunny, together, have provided approximately $3.8 billion in credit to approximately 1.1 million customers and generated strong revenue growth. Our revenues for the year ended December 31, 2017 grew 16% to $673.1 million from $580.4 million for the year ended December 31, 2016. Our operating income for the years ended December 31, 2017 and 2016 was $70.9 million and $47.8 million, respectively, and our total assets for the years ended December 31, 2017 and 2016 were $687 million and $570 million, respectively. We have committed, diversified funding sources to support our growth. Rise, Elastic and Sunny are funded by six different sources through five lending facilities (including three facilities related to our Rise CSO relationships in Texas and Ohio). See "Management’s discussion and analysis of financial condition and results of operations—Liquidity and Capital Resources."
Along with increased revenue growth and improving operating margins, we have also reduced the effective APR of our products for our customers. For the year ended December 31, 2017, our effective APR was 131%, a drop of approximately 48% compared to the year ended December 31, 2013 when the effective APR was 251%. We estimate that, since 2013, our products have saved our customers more than $3 billion over what they would have paid for payday loans, based on a comparison of revenues from our combined loan portfolio and the same portfolio with an APR of 400%, which is the approximate average APR for a payday loan according to the Consumer Financial Protection Bureau ("CFPB"). As of December 31, 2017, more than 35,000 Rise customers in good standing were eligible to receive at least a 50% reduction in their APR, and more than 13,000 customers were eligible to receive near-prime interest rates of 36% based on their on-time repayment history. Furthermore, with help from our reporting their successful payment history to a major credit bureau, 140,000 of our customers have seen their credit scores improve appreciably, according to data from that credit bureau. We believe that these rate reductions and other benefits help differentiate our products in the market and reflect improvements in our underwriting and the maturing of our loan portfolios. Moreover, we believe doing business this way is the right thing to do.
6
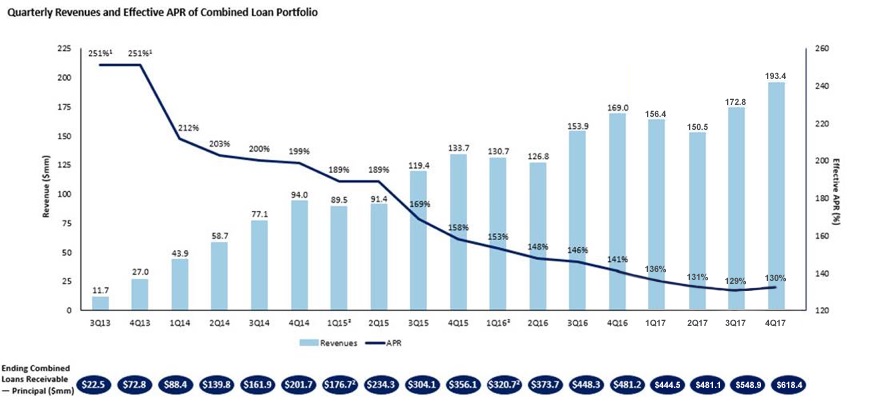
1. Represents effective APR for calendar year 2013.
2. Our business is subject to seasonality, which is particularly evident in the first quarter of every year. See “Management’s discussion and analysis of financial condition and results of operations—Key Financial and Operating Metrics—Revenue growth.”
We believe our growth demonstrates our ability to rapidly scale our business by utilizing our advanced technology platform, proprietary risk analytics and sophisticated multi-channel marketing capabilities. The chart above details our total combined loans receivable and revenues and effective APR of the customer loan portfolio by quarter since the third quarter of 2013.
Our products in the US and the UK are:
Ø | Rise. A product available as an installment loan in 15 US states and, in two additional US states, as a line of credit; |
Ø | Elastic. A line of credit product originated by a third-party bank and offered in 40 states in the US; and |
Ø | Sunny. An installment loan product available in the UK. |
We differentiate ourselves in the following ways:
Ø | Online and mobile products that are “Good Today, Better Tomorrow.” Our products are “Good Today” because they help solve our customers’ immediate financial needs with competitively priced credit and a simple online application process that provides credit decisions in seconds and funds as soon as the next business day (in the US) or in minutes (in the UK). We are committed to transparent pricing with no prepayment penalties or punitive fees as well as amortizing loan balances and flexible repayment schedules that let customers design the loan repayment terms that they can afford. Our five-day risk-free guarantee provides confidence to customers that if they can find a better financial solution within that time they simply repay the principal with no other fees. In addition, our products are “Better Tomorrow” because they reward successful payment history with rates on subsequent loans (installment loan products) that can decrease over time and can help customers improve their long-term financial well-being with features like credit bureau reporting, free credit monitoring (for US customers), and online financial literacy videos and tools. |
7
Ø | Industry-leading technology and proprietary risk analytics optimized for the non-prime credit market. We have made substantial investments in our IQ and DORA technology and analytics platforms to support rapid scaling and innovation, robust regulatory compliance, and ongoing improvements in underwriting. Our proven IQ technology platform provides for nimble testing and optimization of our user interface and underwriting strategies, highly automated loan originations, cost-effective servicing, and robust compliance oversight. Our DORA risk analytics infrastructure utilizes a massive (approximately 80 terabyte) Hadoop database composed of more than ten thousand potential data variables related to each of the 1.9 million customers we have served and the over 6.5 million applications that we have processed. Our team of over 35 data scientists uses DORA to build and test scores and strategies across the entire underwriting process, including segmented credit scores, fraud scores, affordability scores and former customer scores. We use a variety of analytical techniques from traditional multivariate regression to machine learning and artificial intelligence to continue to enhance our underwriting accuracy while complying with applicable US and UK lending laws and regulations. As a result of our proprietary technology and risk analytics, approximately 95% of loan applications are automatically decisioned in seconds with no manual review required. |
Ø | Integrated multi-channel marketing strategy. We use an integrated multi-channel marketing strategy to directly reach potential customers. Our marketing strategy includes coordinated direct mail programs, TV campaigns, search engine marketing and digital campaigns as well as strategic partnerships. We believe our direct-to-consumer approach allows us to focus on higher quality, lower cost customer acquisitions while maximizing reach and enhancing awareness of our products as trusted brands. We have maintained steady customer acquisition costs over the past four years within the range of $230 to $300. Approximately 85% of our customers during 2017 were sourced from direct marketing channels. We continue to invest in new marketing channels, including social media and geo-fencing campaigns, which we believe will provide us with further competitive advantages and support our ongoing growth. We expect to continue to expand growth in each of our channels based on improved customer targeting analytics and increasingly sophisticated response models that allow us to expand our marketing reach while maintaining target customer acquisition costs (“CAC”). |
Our seasoned management team has, on average, more than 15 years of online technology and financial services experience and has worked together for an average of over eight years in the non-prime consumer credit industry. Our management team has overseen the origination of $5.2 billion in credit to 1.9 million customers for the combined current and predecessor direct lending and branded products business that was contributed to Elevate in our spin-off from TFI. In addition, our management team achieved stable credit performance for our predecessor products through the last decade's financial crisis, maintaining total principal losses as a percentage of loan originations of between 17% and 20% each year from 2006 through 2011. See “—Advanced Analytics and Risk Management—History of stable credit quality through the economic downturn.”
INDUSTRY OVERVIEW
Non-prime consumers represent the largest segment of the credit market
We provide credit to non-prime consumers, many of whom face reduced credit options and increased financial pressure due to macro-economic changes over the past few decades. We believe that this segment of the population represents a massive and underserved market of approximately 170 million consumers in the US and UK—a larger population than the market for prime credit and over half of the US adult population:
Ø | According to an analysis of TransUnion data through the third quarter of 2014 by the Corporation for Enterprise Development, approximately 56% of the US adult population with a TransRisk Score (TransUnion’s credit score) had a non-prime credit score of less than 700, representing approximately 109 million Americans adults. |
Ø | Approximately 22% of Americans over the age of 18, or approximately 53 million Americans, do not have a credit score at all or had credit records that were treated as “unscorable” by traditional credit scoring models used by nationwide credit reporting agencies, according to a 2015 report by Fair Isaac Corporation. |
Ø | According to a House of Commons report covering the years 2013 and 2014, it is estimated that the UK “non-standard” credit market consisted of approximately 10 million people. |
8
Our typical customers in both the US and UK are middle-income and have a mainstream demographic profile as illustrated below, according to a 2017 Elevate analyses of income and homeownership of customers, including self-reported customer information. This is in line with the average of the populations of the US and UK, respectively, in terms of income, educational background and rate of homeownership. We refer to them as the “New Middle Class.”
Rise and Elastic Customer Profile | Sunny Customer Profile | |||
Average income | $58,710 for Rise $41,400 for Elastic | £17,020 | ||
% Attended college | 82% | 54% | ||
% Own their homes | 29% | 19% | ||
Typical range of FICO scores(1) | 513-630 | N/A | ||
(1) Range of middle quintile of Elevate US customers - 2017 Elevate data.
Our customers have varying credit profiles, and are more likely to be turned down for credit by many traditional bank lenders. They are risky and can be difficult to underwrite—often due to factors outside of their control. To provide insight into the different types of credit histories and financial needs facing our non-prime customers and the challenges of serving them, the following categories are illustrative:
Ø | “Prime-ish.” Consumers with significant credit history and access to traditional credit sources who are now looking for non-bank credit. They may be over-extended on their existing credit sources and their creditworthiness may be eroding. |
Ø | “Challenged.” Consumers who have had traditional credit in the past but experienced defaults or had a history of late payments and as a result may now use alternative non-prime products such as payday, pawn and title loans. |
Ø | “Invisibles.” Consumers with no credit history or such minimal credit experience that they cannot be sufficiently scored by traditional means and as a result are often kept outside the traditional credit markets. These consumers often have limited or no credit profile and may have a high chance of potential fraud. |
These categories do not correspond to specific credit score bands or precise scores or definitions for the customers included in such categories. We continue to identify additional customer categories and evolve our customer category definitions over time.
The New Middle Class has an unmet need for credit
Due to wage stagnation over the past several decades and the continued impact of the last decade's financial crisis, the New Middle Class is characterized by a lack of savings and significant income volatility. According to a Federal Reserve survey in 2015, 46% of American adults said they could not cover an emergency expense of $400, or would cover it by selling an asset or borrowing money. In the UK, according to a report by Friends Provident Foundation surveying over 1,500 adult consumers in the lowest 50% of household incomes in the UK in 2010, 68% of low-income households had no savings and seven in ten low-income households would find it difficult or impossible to raise from £200 to £300 in an emergency. Further, the JPMorgan Chase Institute reported in a 2015 study of 100,000 US customers that 41% saw their incomes vary by more than 30% from month-to-month, and noted that the bottom 80% of households by income lacked sufficient savings to cover the volatility observed in income and spending. Compounding these financial realities is the fact that average household income has remained flat for over a decade. In fact, according to the US Census Bureau, the average US household income dropped 2.4% between 1999 and 2015. As a result, our customer base often must rely on credit to fund unexpected expenses, like car and home repairs or medical emergencies.
Non-prime credit can be less vulnerable to recessionary factors
Based on our own experiences during the last decade’s financial crisis, as well as research conducted by the credit bureau TransUnion, we believe that patterns of credit charge-offs for non-prime consumers can be acyclical or counter-cyclical when compared to prime consumers in credit downturns. In a recession, banks and traditional prime credit providers often experience increases in credit charge-off rates and tighten standards which reduces access to traditional credit and pushes certain consumers out of the market for bank credit. Conversely, with advanced underwriting, lenders serving non-prime consumers are able to maintain comparatively flat charge-off rates in part because of these new customers who are unable to avail themselves of the traditional credit market. See “—Advanced Analytics and Risk Management—History of stable credit quality through the economic downturn.”
9
Non-prime consumers have different needs for credit
Non-prime consumers generally have unique and immediate credit needs, which differ greatly from the typical prime consumer. Where prime consumers consider price most in selecting their credit products, we believe that non-prime consumers will often consider a variety of features, including the simplicity of the application process, speed of decisioning and funding, how they will be treated if they cannot pay their loan back on time, and flexible repayment terms.
Banks do not adequately serve the New Middle Class
Following the last decade's financial crisis, most banks tightened their underwriting standards and increased their minimum FICO score requirements for borrowers, leaving non-prime borrowers with severely reduced access to traditional credit. Despite the improving economy, banks continue to underserve the New Middle Class. According to our analysis of master pool trust data of securitizations for the five major credit card issuers, we estimate that from 2008 to 2016 revolving credit available to US borrowers with a FICO score of less than a 660 was reduced by approximately $142 billion. This reduction has had a profound impact on non-prime consumers in the US and UK who typically have little to no savings. Often, the only credit-like product offered by banks that is available to non-prime borrowers is overdraft protection, which in essence provides credit at extremely high rates. According to a 2008 study by the FDIC, bank overdraft fees can have an effective APR of greater than 3,500%, depending upon the amount of the overdraft transaction and the length of time to bring the account positive.
Legacy non-prime lenders are not innovative
As a result of limited access to credit products offered by banks, the New Middle Class has historically had to rely on a variety of legacy non-prime lenders, such as storefront installment lenders, payday lenders, title lenders, pawn and rent-to-own providers that typically do not offer customers the convenience of online and mobile access. While legacy non-prime credit products may fulfill a borrower’s immediate funding needs, many of these products have significant drawbacks for consumers, including a potential cycle of debt, higher interest rates, punitive fees and aggressive collection tactics. Additionally, legacy non-prime lenders do not typically report to major credit bureaus, so non-prime consumers often remain in a cycle of non-prime and rarely improve their financial options.
Fintech startups have largely ignored the non-prime credit market
Despite the growing and unmet need for non-prime credit, few innovative solutions tailored for non-prime consumers have come to market and achieved any meaningful scale. Where new online marketplace lenders and small business lenders have emerged to serve prime consumers, we believe that non-prime consumers still have relatively few responsible online credit options. We believe this is because underwriting non-prime consumers presents significantly greater analytical challenges than underwriting prime consumers. Unlike prime consumers, the credit profiles of non-prime consumers vary greatly and may contain significant derogatory information, yet non-prime consumers expect instant decisions with a minimum of paperwork and inconvenience. While new data and techniques can assist in improving underwriting capabilities, we believe lenders still require deep insight and extensive experience to successfully serve non-prime consumers while maintaining target loss rates. Additionally, we believe the compliance and other systems necessary to serve non-prime consumers in a manner consistent with regulatory requirements can be a barrier to entry. Having originated $5.2 billion in credit to more than 1.9 million customers, we believe we have a significant lead over new entrants.
Consumers are embracing the internet for their personal finances
Consumers are increasingly turning to online and mobile solutions to fulfill their personal finance needs. A 2015 study published by the CFI Group found that 88% of bank customers surveyed in the US conduct about half to all of their banking online. In the UK, 61% of people choose to do their banking or pay their bills online, according to a 2015 report by the Financial Inclusion Commission. Additionally, according to a 2015 report by the Center for Economics and Business Research, 53% of UK adults used the internet for their banking needs and this proportion is projected to grow to 66% of UK adults by 2020. We believe this growth is an indication of borrower preferences for online and mobile financial products that are more convenient and easier to access than products provided by legacy brick-and-mortar lenders.
OUR SOLUTIONS
Our innovative online credit solutions provide immediate relief to customers today and can help them build a brighter financial future. We call this mission “Good Today, Better Tomorrow” and it drives our product design. Elevate’s current generation of credit products includes Rise, Elastic and Sunny. See “—Our Products.”
10
We provide more convenient, competitively priced financial solutions to our customers, who are not well-served by either banks or legacy non-prime lenders, by using our advanced technology platform and proprietary risk analytics. We also offer a number of financial wellness and consumer-friendly features such as rates that can go down over time, no punitive fees, a five-day risk-free guarantee, free online financial literacy videos and tools, credit bureau reporting and free credit monitoring (in the US) that we believe are unmatched in the non-prime lending market.
We have made substantial investments in our IQ and DORA technology and analytics platforms to support rapid scaling and innovation, robust regulatory compliance, and ongoing improvements in underwriting. We have also established a research organization focused on non-prime consumers called the “Center for the New Middle Class” to raise the awareness of their unique needs and to guide our product development. As a result, we believe we are leading a new breed of more responsible online credit providers for the New Middle Class.
Our products provide the following key benefits:
Ø | Competitive pricing with no hidden or punitive fees. Our US products offer rates that we believe are typically more than 50% lower than many generally available alternatives from legacy non-prime lenders, and since 2013 have saved our customers more than $3 billion over what they would have paid for payday loans. Our products offer rates on subsequent loans (installment loan products) that can decrease over time based on successful loan payment history. For instance, as of December 31, 2017, approximately one-third of Rise customers in good standing had received a rate reduction, typically after a refinance or on a subsequent loan. In addition, in order to help our customers facing financial hardships, we have eliminated punitive fees, including returned payment fees and late charges, among others. |
Ø | Access and convenience. We provide convenient, easy-to-use products via online and mobile platforms. Consumers are able to apply using a mobile-optimized online application, which takes only minutes to complete from a mobile or desktop device. Credit determinations are made in seconds and approximately 95% of loan applications are fully automated with no manual review required. Funds are typically available next-day in the US and within minutes in the UK. Consumers can elect to make payments via preapproved automated clearinghouse (“ACH”) authorization or other methods such as check or debit card transfer. |
Ø | Flexible payment terms and responsible lending features. Our customers can select a payment schedule that fits their needs with no prepayment penalties. We do not offer any “single-payment” or “balloon-payment” credit products that can lead to a cycle of debt and are criticized by many consumer groups as well as the CFPB. To ensure that consumers fully understand the product and their alternatives, we provide extensive “Know Before You Borrow” disclosures as well as an industry-leading five-day “Risk-Free Guarantee” during which customers can rescind their loan at no cost. Consistent with our goal of being sensitive to the unique needs of non-prime consumers, we also offer flexible solutions to help customers facing issues impacting their ability to make scheduled payments. Our solutions include notifications before payment processing, extended due dates, grace periods, payment plans, special payment programs and settlement offers. |
Ø | Financial wellness features. Our products include credit building and financial wellness programs, such as credit reporting, free credit monitoring (in the US) and online financial literacy videos and tools. Our goal is to help our customers improve their financial options and behaviors at no additional charge. We are very proud of the fact that, with help from our reporting their successful payment history to a major credit bureau, more than 140,000 of our customers have seen an appreciable increase in their credit scores, according to data from that credit bureau. |
This combination of features has resulted in extremely high customer satisfaction for our products. Internal customer satisfaction ratings are generally over 85% for all of our products during 2017.
11
OUR COMPETITIVE ADVANTAGES
Using our IQ technology platform and DORA risk analytics infrastructure, we are able to offer our customers innovative credit solutions that place us as a leader among a new breed of more responsible, online non-prime lenders. We believe the following are our key competitive advantages:
Ø | Differentiated online and mobile products for non-prime consumers. Our product development is driven by a deep commitment to solving customers’ immediate financial need for credit and helping them improve their long-term financial future. We call this mission “Good Today, Better Tomorrow.” Our products are “good today” due to their convenience, cost, transparency and flexibility. Our average customer receives an interest rate that we believe is more than 50% less than that offered by many legacy non-prime lenders. In fact, since 2013 our customers have saved more than $3 billion over what they would have paid for payday loans based on a comparison of revenues from our combined loan portfolio and the same portfolio with an APR of 400%, which is the approximate average APR for a payday loan according to the CFPB. Furthermore, the convenience of online and mobile access and flexible repayment options distinguish our products from many legacy non-prime credit options. However, we go even further in creating credit products that can help enable customers to have a “better tomorrow.” Based on successful payment history, rates on subsequent loans (installment loan products) can decrease over time, and we provide a path to prime credit for struggling consumers by reporting to credit bureaus, providing free credit monitoring (for US products), and offering online financial literacy videos and tools to help build better financial management skills. With help from our reporting their successful payment history to a major credit bureau, more than 140,000 of our customers have seen their credit scores improve appreciably, according to data from that credit bureau. |
Ø | Industry-leading DORA risk analytics infrastructure and underwriting scores. Traditional approaches for underwriting credit such as FICO scores are not adequate for non-prime consumers who may have significant derogatory credit history or no credit history at all. Because continued leadership in non-prime underwriting is essential to drive growth, support continued rate reductions to customers, and manage losses, we built our DORA risk analytics infrastructure to support the development and enhancement of our underwriting scores and strategies. The DORA risk analytics infrastructure utilizes a massive (approximately 80 terabyte) Hadoop database composed of more than ten thousand potential data variables related to each of the 1.9 million customers we have served and the over 6.5 million applications that we have processed. This data is composed of variables from consumer applications and website behavior, credit bureaus, numerous other alternative third party data providers as well as performance history for funded customers. Our team of over 35 data scientists uses DORA to build and test scores and strategies across the entire underwriting process including segmented credit scores, fraud scores, affordability scores and former customer scores. They use a variety of analytical techniques from traditional multivariate regression to machine learning and artificial intelligence to continue to enhance our underwriting accuracy while complying with applicable US and UK lending laws and regulations. See “—Advanced Analytics and Risk Management—Segmentation strategies across the entire underwriting process.” Across the portfolio of products we currently offer, we have maintained stable credit quality as evidenced by charge-off rates that are generally between 25% and 30% of the original principal loan balances. While we experience month-to-month variability in our loan losses for any variety of reasons, including due to seasonality, on an annual basis, our annual principal charge-off rates have remained consistent since the launch of our current generation of products in 2013. See “Management’s discussion and analysis of financial condition and results of operations—Key Financial and Operating Metrics—Credit quality.” Furthermore, our proprietary credit and fraud scoring models allow not only for the scoring of a broad range of non-prime consumers, but also across a variety of products, channels, geographies and regulatory requirements. |
Ø | Innovative and flexible IQ technology platform. Investment in our flexible and scalable IQ technology platform has enabled us to rapidly grow and innovate new products - notably supporting the launch of our current generation of products in 2013. Our IQ technology platform provides for nimble testing and optimization of our user interface and underwriting strategies, highly automated loan originations, cost-effective servicing, and robust compliance oversight. In addition, our platform is adaptable to allow us to enhance current products or launch future online products to meet evolving consumer preferences and respond to a dynamic regulatory environment. Further, our open architecture allows us to easily integrate with best-in-class third-party providers, including strategic partners, data sources and outsourced vendors. |
12
Ø | Integrated multi-channel marketing approach. Unlike other online non-prime lenders, who typically rely on lead generators to identify potential customers, we use an integrated multi-channel marketing strategy to market directly to potential customers, which includes coordinated direct mail programs, TV campaigns, search engine marketing and digital campaigns, and strategic partnerships. We have created unique capabilities to effectively identify and attract qualified customers, which supports our long-term growth objectives at target customer acquisition costs. We have maintained steady customer acquisition costs over the past four years within the range of $230 to $300. Approximately 85% of our customers for the year ended December 31, 2017 were sourced from direct marketing channels. We believe this approach allows us to focus on higher quality, lower cost customer acquisition while maximizing reach and enhancing awareness of our products as trusted brands. We continue to invest in new marketing channels, including social media and geo-fencing campaigns, which we believe will provide us with further competitive advantages and support our ongoing growth. In 2017, this included the launch of blogs at both Rise and Sunny. |
Ø | Seasoned management team with strong industry track record. We have a seasoned team of senior executives with an average of more than 15 years of experience in online technology and financial services at companies such as Citibank, Bank of America, MasterCard, PayPal, GE Capital, BlackRock and Silicon Valley Bank, led by Ken Rees, a financial services industry veteran with more than 20 years of experience, who is regarded as one of the leading advocates of responsible credit in the non-prime lending space. Mr. Rees was named to Bank Innovation's "2017 Innovators to Watch" list, and in 2012 he was named Regional Entrepreneur of the Year by Ernst & Young in recognition of his achievements in the online lending sector. The team has overseen the origination of $5.2 billion in credit to more than 1.9 million customers for the combined current and predecessor products that were contributed to Elevate in our spin-off from TFI. Additionally, the team has a proven track record of managing defaults through the last decade's financial crisis. From 2006 to 2011, the principal charge-offs of Elevate's legacy and predecessor credit products remained comparatively flat compared to credit card charge-off rates which nearly tripled during the same period. Elevate was certified as a “Great Place To Work” in 2017 and as one of the “Best Workplaces in Texas” by consulting firm Great Place to Work and Fortune. We believe this reflects our commitment to build a strong and lasting company and a customer-focused corporate culture. |
OUR GROWTH STRATEGY
To achieve our goal of being the preeminent online lender to the New Middle Class, we intend to execute the following strategies:
Ø | Continue to grow our current products into dominant brands. Our current generation of products, Rise, Elastic and Sunny, were launched in 2013. Given strong consumer demand and organic growth potential, we believe that significant opportunities exist to expand these three products within their current markets via existing marketing channels. As non-prime consumers become increasingly familiar and comfortable with online and mobile financial services, we also plan to capture the new business generated as they migrate away from less convenient legacy brick-and-mortar lenders. |
Ø | Widen the credit spectrum of borrowers served with new products. We continue to evaluate new product and market opportunities that fit into our overall strategic objective of delivering next-generation online and mobile credit products that span the non-prime credit spectrum. For example, we are evaluating products with lower rates that would be more focused on the needs of near-prime consumers. In addition, we are continually focused on improving our analytics to effectively underwrite and serve consumers within those segments of the non-prime credit spectrum that we do not currently reach. |
Ø | Pursue additional strategic partnerships. Our progressive non-prime credit solutions have attracted top-tier affiliate partners including Credit Karma and Lending Tree as a way to serve customers they have acquired. We intend to continue growing our existing affiliate partnerships and will evaluate opportunities to enter into new partnerships with affiliates and retailers and potentially enable non-prime customers to purchase their goods and services on credit. We expect these partnerships to provide us with access to a broad range of potential new customers with low customer acquisition costs. In addition, we will pursue further strategic partnerships with banks. |
Ø | Expand our relationship with existing customers. Customer acquisition costs represent one of the most significant expenses for online lenders. We will seek to expand our strong relationships with existing customers by providing qualified customers with new loans on improved terms or offering other products and services. We believe we can better serve our customers with improved products and services while, at the same time, achieving better operating leverage. |
Ø | Enter new markets. We will explore pursuing strategic opportunities to expand into additional international and domestic markets. However, we plan to take a disciplined approach to international expansion, utilizing customized products and in-market expertise. As reflected in our approach to entering the UK market, we believe that local teams with products developed for each unique local market will ultimately be the most successful. We currently do not expect to undertake any international expansion in the near term. |
13
OUR PRODUCTS
Rise, Elastic and Sunny are exclusively available through online and mobile devices. These products reflect the deep experience of our management team in the online non-prime lending industry and utilize leading technology and proprietary risk analytics to effectively manage profitability and optimize the customer experience.
Each of these products reflects our “Good Today, Better Tomorrow” mission and offers competitive rates and responsible lending features along with credit building and financial wellness tools. Our products have rates on subsequent loans that can decrease over time (installment loan products), no punitive fees, a five day "Risk Free Guarantee," credit bureau reporting, free credit monitoring (in the US), and online financial literacy videos and tools.
Rise, Elastic and Sunny each follow distinct regulatory models, providing diversification across different regulatory frameworks. Rise operates under licenses from each state it serves and is additionally regulated by the CFPB; Elastic is a bank-originated credit product that is offered in 40 states across the US and is regulated by the FDIC; and Sunny is a UK credit product regulated by the Financial Conduct Authority (the “FCA”). For more information regarding the Company's revenues and total assets in the US and the UK, see Note 14—Operating Segment Information of the consolidated financial statements.

Year launched | 2013 | 2013 | 2013 | |||
Product type | Installment and line of credit | Line of credit | Installment | |||
Geographies served(1) | 17 states | 40 states | UK | |||
Loan size | $500 to $7,000(5) | $500 to $3,500 | £100 to £2,500 | |||
Loan term(2) | 4-26 months | Up to 10 months | 6-14 months | |||
Repayment schedule | Bi-weekly, semi-monthly, or monthly | Bi-weekly, semi-monthly, or monthly | Bi-weekly, semi-monthly, or monthly | |||
Prepayment penalties | None | None | None | |||
Pricing(3) | 36% to 299%(6) annualized. Rates drop by 50% after 24 months of payments, and to 36% after 36 months of payments(7) | Initially $5 per $100 borrowed plus up to 5.0% of outstanding principal per billing period | 10.5% to 24% monthly | |||
Other fees | None | None | None | |||
Combined loans receivable principal(1) | $320.4 million | $251.0 million | $47.0 million | |||
% of Combined loans receivable principal(1) | 51.8% | 40.6% | 7.6% | |||
Top three states as a percentage of combined loans receivable – principal(1) | CA (24%), GA (17%), | FL (16%), TX (9%) | N/A | |||
OH (15%) | CA (8%) | |||||
Weighted average effective APR(1)(4) | 141% | 97% | 237% | |||
(1) | As of or for the year ended December 31, 2017. Includes 15 states offering installment loans, two states originated through CSO programs, and two states offering lines of credit. |
(2) | Elastic term is based on minimum principal payments of 10% of last draw amount per month. |
(3) | In Texas and Ohio, Rise charges a CSO fee instead of interest. See “Management’s discussion and analysis of financial condition and results of operations—Key Financial and Operating Metrics—Revenue growth—Revenues.” Rise interest rates may differ significantly by state. See “—Regulatory Environment—APR by geography” for a breakdown of the APR for each of our products. Rise interest rates of 36% are available to qualified repeat customers based on on-time repayment history. |
(4) | Elastic is a fee-based product. The number shown is based on a calculation of an effective APR. |
(5) | Maximum loan size of $7,000 available in Georgia. Maximum credit limit of $5,000 in the two states where Rise offers a line of credit. |
(6) | As of December 31, 2017. Some legacy customers will have rates as high as 365%, the previous maximum rate. |
(7) | Excluding customers with starting rates of less than 75% and line of credit customers. |
14
Rise—US installment loans and lines of credit
Rise is an installment loan and line of credit product currently available in 17 states in the US. We utilize risk-based pricing across the portfolio to optimally serve a large percentage of non-prime customers with starting rates ranging from 36% to 299%. There are no origination fees, monthly fees, late fees, over-limit fees, or fees for returned payments on the product. After 24 months of on-time installment loan payments, eligible customers can receive a 50% rate reduction on their next loan, limited to a resulting rate of 36%. The installment loan product is available in 15 states. After an additional 12 months of installment loan on-time payments on a subsequent loan, rates on new loans drop to 36% for qualifying customers. As of December 31, 2017, approximately 33% of Rise installment customers in good standing had received a rate reduction mid-loan or after a refinance or on a subsequent loan. We no longer provide rate reductions mid-loan as our current policy is to award qualified customers with rate reductions once they refinance or take out a new loan. Approximately 56% of Rise installment customers in good standing had refinanced or taken out a subsequent loan as of December 31, 2017, with 48% of the outstanding Rise installment loan balances on that date consisting of new customer loans and 52% related to returning customer loans. The Rise installment effective APR was 140% for the year ended December 31, 2017, which we believe is more than 50% lower than the average effective rate of a typical payday loan, based on the CFPB’s findings that the average APR for a payday loan is approximately 400%.
The Rise line of credit product, which was launched in 2017, is available in two states given current applicable state law, and is designed to be a financial safety net for non-prime consumers. Rise line of credit offers a maximum credit limit of $5,000 and charges interest based on the APR of the loan and the average balance for the period. The Rise line of credit effective APR was 186% for the year ended December 31, 2017.
As a result of differing state laws, the structure of Rise varies: Rise is currently offered as an installment loan ("Rise installment"), a line of credit loan product ("Rise line of credit") and, in Texas and Ohio, Rise is available through a CSO program that provides consumers access to installment loans offered by a third-party lender ("Rise CSO").
Elastic—US bank-originated lines of credit
Elastic, currently available in 40 US states, is a line of credit designed to be a financial safety net for non-prime consumers. It is originated by a third-party lender, Republic Bank. See “Management’s discussion and analysis of financial condition and results of operations—Components of our Results of Operations—Revenues.” Elastic offers a maximum credit limit of $3,500 and charges an initial advance fee of $5 for each $100 advanced against the credit line, as well as a fixed charge of approximately 5% of open balances each payment period. Elastic’s effective APR based on this was approximately 97% for the year ended December 31, 2017, more than 75% lower than the average effective rate of a typical payday loan, based on the above-mentioned findings by the CFPB. There are no origination fees, monthly fees, late fees, over-limit fees or fees for returned payments on the product. Additionally, consumers must make a 10% mandatory principal reduction each month designed to encourage the full repayment of the original loan amount in approximately ten months or less.
Under the terms of our agreement with Republic Bank, we provide them with marketing services related to the Elastic program and license them our website, technology platform and proprietary credit and fraud scoring models to originate and service Elastic customers. However, as the originator of the Elastic lines of credit, Republic Bank reviews and approves all marketing materials and campaigns and determines the underwriting strategies and score cutoffs used in processing applications. In addition, Republic Bank defines all program parameters and provides full compliance oversight over all aspects of the program. Our platform supports Republic Bank’s operational and compliance activities related to the Elastic program. See “Management’s discussion and analysis of financial condition and results of operations—Overview” regarding the structure of Elastic and how we recognize revenue associated with Elastic loans.
Sunny—UK installment loans
Sunny is our online UK installment loan product, currently offering loans of up to £2,500. Rates range from 10.5% per month to 24% per month.
After almost five years, we believe Sunny has become one of the top online, high-cost short-term loan products in the UK according to data provided by a credit reporting agency. Sunny is a differentiated offering based on a wider range of loan amounts, a no-fee guarantee, price promotions and more flexible repayment options than most other providers in the UK short-term lending market.
15
In 2017, Sunny helped over 79,000 new customers gain access to credit which we believe accounts for more than 20% of market share in the UK based on an analysis from a major UK credit bureau. This year was the first in which the Sunny business generated net income, with over $100 million in revenue. Sunny launched an integrated PR, Social and Content team that has delivered significant value. Facebook is the flagship social media channel for Sunny and has seen 135% Sunny community growth in 2017. We also launched two new channels (Pinterest and LinkedIn) and a digital magazine called “Good Vibes” which now accounts for 3% of all traffic to the Sunny website. Our increase in investment in and outputs from these channels has helped improve SEO, or "search engine optimization," visibility by four times between May 2017 and December 2017.
ADVANCED ANALYTICS AND RISK MANAGEMENT
The non-prime lending challenge
Traditional underwriting requires manual review of physical documents and human credit decisions. This is inconvenient for customers and for lenders it is resource-intensive, time-consuming and can lead to inconsistent results. "Fintech" lenders have recently used Big Data techniques to revolutionize the offering of credit. Instant credit decisions and automated processes are increasingly the norm for innovative online lenders.
In non-prime consumer lending, however, the analytical challenges are significantly greater. Traditional credit scores like FICO are poorly correlated with risk for non-prime consumers. Whereas prime consumers have established positive credit histories with traditional credit products and very little derogatory information, non-prime consumers are more varied and difficult to underwrite since they may have significant derogatory credit history or no credit history at all. Because of the wider variety of credit backgrounds and higher credit risk, automated analytical techniques for underwriting non-prime consumers must be much more sophisticated.
We use our deep insights into non-prime consumers and extensive experience serving over 1.9 million customers with $5.2 billion in credit to develop differentiated analytical techniques and scores to better underwrite and price credit for the New Middle Class. This approach provides for extremely high levels of automation in the underwriting process and has been proven to be effective, resulting in stable credit performance for our predecessor products through the last decade's financial crisis and continued improvements since launching the current generation of products. See “—History of stable credit quality through the economic downturn.” Furthermore, we invest significant resources into the research and development of new data sources and new analytical techniques to continue to improve our capabilities.
DORA risk analytics infrastructure
Unlike prime lenders who can use off-the-shelf credit scores such as FICO or build custom scores with limited data fields, we believe that successfully underwriting non-prime consumers in an online environment requires access to a much wider variety of data including not only traditional credit attributes and application information, but also website behavior, internal information, bank account information, social media information, email and phone number information, among others. Because continued leadership in non-prime underwriting is essential to drive growth, support further rate reductions to customers, and manage losses, we have made substantial investments in our DORA risk analytics infrastructure and in the development of the latest generation of our underwriting scores and strategies. The DORA risk analytics infrastructure utilizes a massive (approximately 80 terabyte) Hadoop database composed of more than 10,000 potential data variables related to each of the more than 1.9 million customers we have served and the over 6.5 million applications that we have processed including performance data from our funded customers. Our team of more than 35 data scientists uses DORA to build and test scores and strategies across the entire underwriting process described below (see “—Segmentation strategies across the entire underwriting process”). DORA supports a variety of analytical techniques and model outputs from traditional multivariate regression to machine learning and artificial intelligence. We believe this Big Data approach and investment is foundational to our ongoing initiatives to improve underwriting and lower rates to our customers.
16
Segmentation strategies across the entire underwriting process
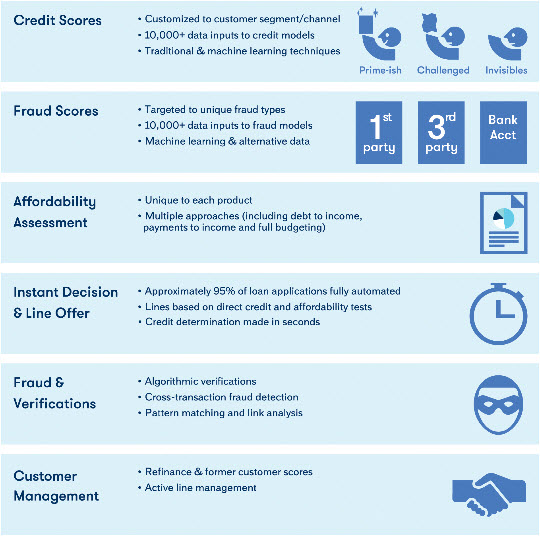
Based on our extensive experience and track record in the industry, we have found that FICO and other monolithic credit scores are inadequate for the non-prime market. Instead, we have used our DORA risk analytics infrastructure to develop an array of proprietary scores and strategies using highly predictive data sources and advanced analytical techniques targeting unique customer segments and marketing channels as well as different fraud types. This analytical approach, while more complex than most prime underwriting approaches, allows us to serve an expanding set of non-prime consumer segments and marketing channels while maintaining stable credit quality and acceptable customer acquisition costs. We use this approach across the entire underwriting process for both new and former customers, as described in the following chart:
17
Segment specific credit scores
We use our proprietary DORA risk analytics infrastructure to build targeted credit scores for key customer segments and channels. Based on our segmentation model, we utilize highly predictive data (including nationwide credit reporting agencies (“NCRA”), non-prime bureau data, and wide-ranging alternative data sources, as well as internally collected proprietary customer credit performance history) and analytical techniques (including multivariate regression, machine learning and artificial intelligence techniques) to achieve a high level of accuracy for our scores. For instance, for “prime-ish” consumers who have access to traditional credit sources but supplement them with non-prime credit, we use NCRA data extensively in our proprietary credit and fraud scoring models. For “challenged” consumers who have derogatory NCRA credit information and, as a result, non-prime credit data is more relevant, our proprietary credit and fraud scoring models leverage data provided by non-prime credit bureau sources like Clarity and Teletrack. For “credit invisibles” with limited or no credit history, we may utilize a host of alternative data sources, such as detailed bank account data as well as the duration for which an applicant has used the same mobile phone number or used an email address. Our definitions of our customer segments and the ways they affect our credit scoring models evolve over time.
We assess over 10,000 data inputs while developing our segmented credit models. We are focused on increasing the pace of our remodeling efforts using our DORA risk analytics infrastructure and plan to release updated proprietary credit scores on an approximately quarterly basis.
Targeted fraud scores
In addition to our segment-specific credit scores, we have developed targeted fraud scores for different types of fraud. For instance, we have found that first-party fraud (when the loan applicant provides correct identity information but has no intent of repaying the loan), third-party fraud (when the applicant has stolen someone else’s identity information) and bank account fraud (when the borrower intends to shut down his or her account shortly after receiving the proceeds from the loan) are fundamentally different and require unique analysis and risk management tools.
Our proprietary fraud scores are built from over 10,000 available data inputs from our DORA risk analytics infrastructure and make extensive use of non-linear (e.g., machine learning) analytical tools and techniques. Examples of data sources that we have found to be predictive in our fraud scores include IP address information, how applicants use our website (including pages viewed), and email and bank account information as well as identity information provided by third parties.
Affordability analysis and line offers
Although not currently required by US federal law, we proactively assess the affordability of our products for our customers. We use multiple approaches including debt to income, payment to income and full budgeting (required by UK regulations), based on third-party and self-reported information, and continue to evaluate the effectiveness of each approach. Where applicable, we integrate real-time bank account information into our affordability scores. Our affordability assessment impacts both the decision of whether to provide the loan, as well as the maximum amount to offer. We use an enhanced affordability analysis that integrates previous payment history to underwrite current customers seeking to refinance their loan and for former customers requesting additional credit.
Customer management
In addition to underwriting new customers, we have built scores and strategies for underwriting customers who have paid off their initial loan and are looking for a new loan, or for customers who may want to refinance their current loan, typically for a larger amount and a lower rate. These scores and strategies reassess the customer’s creditworthiness integrating their payment history on previous loans. Based on this information and revised affordability analysis, the customer is either offered a new maximum loan amount and APR or declined for additional credit.
18
Fully automated, near-instant credit decisions
Credit and fraud determinations are made in seconds and approximately 95% of loan applications for all products are fully automated with no manual review required, based on our proprietary credit and fraud scoring models and affordability assessments. Once approved, the customer is provided the loan amount and relevant terms of the credit being offered. Of the approximately 5% of loan applications requiring manual review, in the US, the majority require further documentation, which can be provided via scanning, fax, email or mail, others may have failed a fraud rule in the applicable underwriting methodology, and are managed based on the rule failed, and others are reviewed to address “know your customer” and/or OFAC requirements. In the UK, of the loan applications requiring manual review, the vast majority require further verifications or other forms of identification, while the remaining portion requires further review based on fraud alerts by an industry database of fraudulent consumer activity, known as CIFAS. We provide declined customers with the reasons for the decision as per regulatory requirements.
Elevate fraud detection agents manually review a limited number of applicants based on the results of the fraud scores and any discrepancies in the application data they provide (such as identity information prior to the funding of the loan). Fraud detection specialists generate and review intraday reports to identify cross-application fraud risk and use such reports to flag additional loan applications requiring review. Elevate fraud detection agents use sophisticated link analysis of application information to identify potentially fraudulent activity and pursue additional investigation if they suspect fraud.
History of stable credit quality through the economic downturn
We bring extensive experience in managing defaults through the most recent financial crisis. Including products that preceded our current generation of credit products, we have provided $5.2 billion in credit to 1.9 million non-prime consumers since 2002. As the following chart indicates, our management team delivered stable credit quality for our predecessor products through the last decade's financial crisis. The chart below also presents the levels of volatility experienced by the US credit card industry over the same period.
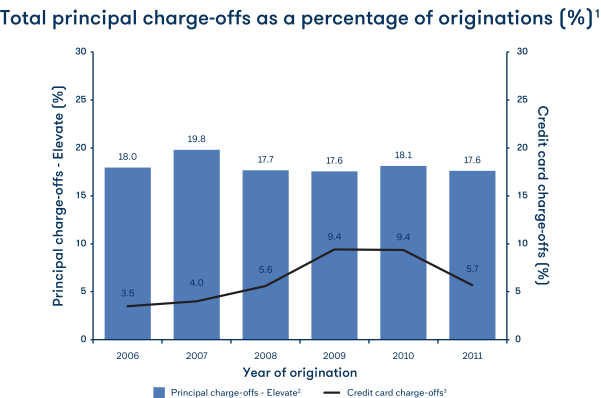
(1) | Elevate legacy predecessor credit product from 2006-2011. Includes losses related to credit and fraud. |
(2) | Years presented pre-date the spin-off. For recent cumulative loss rates by vintage, see “Management’s discussion and analysis of financial condition and results of operations—Key Financial and Operating Metrics—Credit quality.” |
(3) | Credit card information based on Federal Reserve data. |
19
Additionally, research conducted by the credit bureau TransUnion indicates that non-prime personal loan portfolios show significantly less volatility due to recessionary factors than portfolios with higher credit quality customers. As shown in the following chart, according to TransUnion data, non-prime portfolios demonstrated approximately half of the charge-off rate volatility of Prime, Prime-Plus and Super Prime portfolios during the Great Recession between 2006 and 2011. We believe this indicates that patterns of credit charge-offs for non-prime consumers can be acyclical or counter-cyclical when compared to prime consumers in credit downturns. In a recession, banks and traditional prime credit providers often experience increases in credit charge-off rates and tighten standards, which reduces access to traditional credit and pushes certain consumers out of the market for bank credit. Conversely, with advanced underwriting, lenders serving non-prime consumers are able to maintain comparatively flat charge-off rates, in part, because of these new customers who are unable to avail themselves of the traditional credit market.
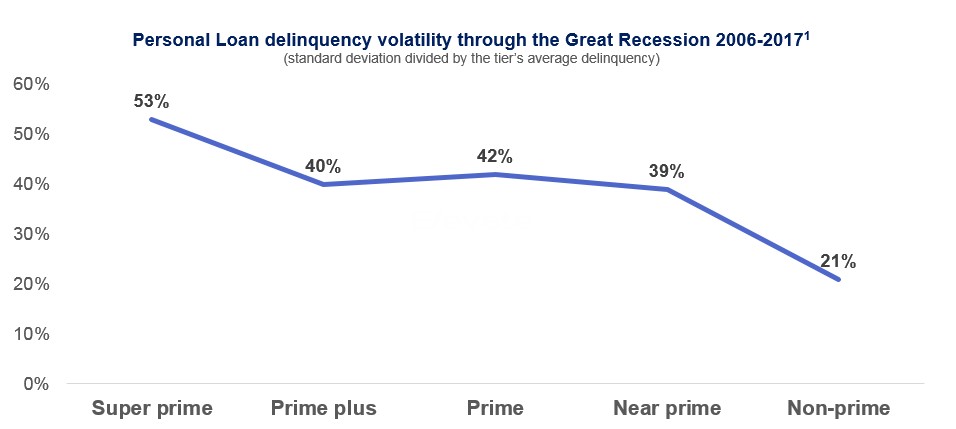
(1) | TransUnion data on 90 day delinquency rates of balances for different Vantage Score bands from the first quarter of 2005 through the first quarter of 2017. Volatility is calculated by dividing the standard deviation of Vantage Score bands from the first quarter of 2006 to the first quarter of 2017 by the average during the same period. Super prime includes those with credit scores ranging from 781 to 850, Prime plus from 721 to 780, Prime from 661 to 720, Near prime from 601 to 660 and Non-prime from 300 to 600. |
Commitment to research and development
We have built a team of over 100 employees in our Risk Management department, 48 of which have advanced degrees including eight with PhDs. Our Advanced Analytics team is primarily focused on analysis of new (typically non-traditional) data sources and analytical techniques. We believe our commitment to research and development in risk analytics results in consistently improving capabilities, which give us an on-going competitive advantage in the market by allowing us to scale our business while providing savings back to our customers in the form of lower rates.
20
OUR SALES AND MARKETING CAPABILITIES
Multi-channel approach to customer acquisition
Online providers of non-prime credit generally rely on third-party lead generators for customer acquisition, which we believe limits growth and provides challenges to achieving cost and quality targets. In contrast, we rely primarily on direct marketing channels, which support improved CAC, faster growth and heightened brand awareness. The following chart shows the percentage of total customers attributable to each marketing channel for the year ended December 31, 2017.
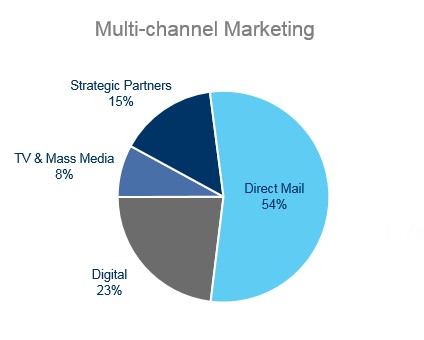
Our multi-channel approach is demonstrated by the following:
Ø | Direct mail: More than 100 million pre-selected credit offers mailed during the year ended December 31, 2017; |
Ø | TV and mass media: Both brand and direct response-oriented campaigns launched for Rise and Sunny; |
Ø | Strategic partnerships: Multiple partnerships with large customer aggregators to drive traffic; and |
Ø | Other digital campaigns: Social media platforms, including blogs and banner ads, among others. |
Analytically-driven channel optimization
Each new marketing channel we introduce requires extensive testing and optimization before it can be scaled cost-effectively and requires significant on-going analytical support. For instance, we spent three years developing, testing, and optimizing our response and credit models for preapproved direct mail campaigns to achieve an acceptable CAC for this channel. As a result, direct mail is now our largest and most profitable marketing capability, and we continue to identify new analytical approaches that help expand the addressable market through the direct mail channel.
21
Similarly, we have been piloting and refining TV campaigns for the past two years in both the US and UK markets in order to achieve target CAC levels. Rigorous testing of different creative messages, spot durations, “day-parting” and “pulsing” marketing strategies, and network targeting strategies have achieved significant improvements in performance. Based on these improvements, we are now aggressively expanding TV advertising. We believe TV and other mass media channels are essential to achieve brand awareness and market leadership for our products.
We are currently conducting large-scale tests of new digital and social channels that are showing strong initial results. Digital pilots in programmatic display and Facebook audience targeting, including campaigns focusing on re-targeting strategies, have proven to generate meaningful lift in customer conversions and are expected to be integrated and scaled following the initial tests and refinements. Furthermore, digital campaigns based on geo-fencing technology that allow us to target ads and offers to consumers entering a brick-and-mortar payday loan or title loan location have shown early potential.
We expect to continue to expand growth in all of the above channels based on improved customer targeting analytics and increasingly sophisticated response models that allow us to enhance our marketing reach while maintaining our target CAC. Our dedicated channel management teams continually monitor and manage campaign effectiveness. We believe our investment in developing multiple customer acquisition channels provides a significant competitive advantage over other online non-prime lenders who rely primarily on lead generators.
Integrated channel management
In addition to optimizing the performance of each channel, we are increasingly using integrated channel management strategies to improve marketing impact and enhance brand-building. We have found that coordinating the timing of individual channel campaigns and leveraging creative across channels can accelerate growth at lower costs.
TV has become a key accelerator for integrated channel management. Because of the ability of TV advertising to help build trusted brands and expand customer awareness, we have invested extensively in TV campaigns in both the US (for Rise) and the UK (for Sunny). For the Rise campaign, we licensed the song Eye of the Tiger from Survivor (commonly recognized as the soundtrack for Rocky III). In the UK, we licensed the 1960’s song Sunny by Bobby Hebb. By using elements from the TV creative across other channels, we have increased the response from these other channels. In addition, we have learned to “pulse” our TV placements to coincide with large direct mail campaigns, which significantly improves customer acquisition results across both channels.
Strategic partner development
Rather than utilizing lead generators who are often accused of deceptive practices, we have focused on developing relationships through large strategic partnerships. A customer is referred to us through a strategic partner by clicking on a banner ad that takes them to the advertised product’s website. Large strategic partnerships with companies allow us to better control customer application quality and CAC. We have contractual relationships with such partners whereby we pay a fee per loan funded per application approved or per banner clicked through. Because the customer completes the loan application on our website, rather than on a lead generator’s site, we control the messaging received by the customer about our products. LendingTree and Quint are our two largest strategic partners in each of the US and UK, respectively. Fees paid to strategic partners do not comprise a material portion of our total expenses.
We expect our relationships with strategic partners to expand over time, and we will evaluate opportunities to enter into new partnerships with affiliates and retailers to potentially enable non-prime customers to purchase goods and services on credit. We also have the ability to make targeted offers with discounted rates to strategic partners who we believe have higher quality applicants.
Customer relationship optimization
Our sales and marketing efforts are not only focused on acquiring new customers. We also market to current and former customers for additional or improved offers of credit.
22
Based on rigorous creditworthiness and affordability analysis, we typically offer increased credit lines to former customers—often at lower rates. Also, subject to our usage caps, we may offer current customers the ability to refinance loans to receive additional funds (in the US). We use both email and text messaging campaigns to reach customers with additional credit offers.
We have witnessed strong repeat customer use of our products. Historically, more than 50% of Rise installment customers who repay their loan have taken out an additional loan, often at a lower rate. Because there is no additional CAC for originating those additional loans, these transactions are highly profitable and can support offering a lower APR for consumers.
History of strong growth in new customer acquisition volumes at or below target CAC
As a result of our unique marketing capabilities discussed above, we have shown significant growth in annual new customer acquisition volumes while managing our customer acquisition costs at or below our target level of $250-$300. As indicated by the chart below, we generated record new customer volumes in 2017 while maintaining CAC below our target.
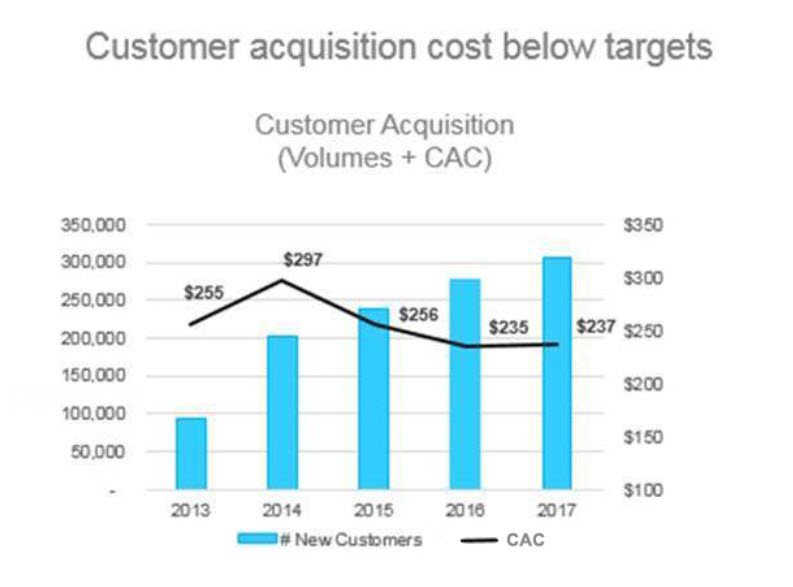
OUR TECHNOLOGY PLATFORM AND INFORMATION SECURITY
Underlying our innovative product features and scalable loan processing and servicing is our flexible IQ technology platform. In addition to a proven ability to scale, our IQ technology platform supports compliant application and loan processing and business controls. We have optimized the platform for mobile device access, utilize a cloud-based architecture for consumer-facing components of the website, and have created an industry-leading decision engine that enables our sophisticated scores and underwriting strategies and supports ongoing testing and optimization of them. Also, because we collect and store extensive amounts of consumer information, we have invested in best practice levels of information security.
23
Flexible and scalable IQ technology platform
We call our end-to-end loan origination, decisioning, loan management and servicing system the IQ technology platform. We believe it integrates the best available third party loan modules under our proprietary architecture. This has allowed us to rapidly launch new products, modify product functionality and ensure regulatory compliance. In fact, all three of our current generation of credit products were released in 2013, highlighting the flexibility and scalability of our technology.
Our IQ technology platform includes proprietary architecture and messaging that facilitates high-availability, scalability and flexibility for changing product features. It supports both open-end (lines of credit) products as well as closed-end (installment loans) and is easily configurable for new pricing and term structures, whether in response to regulatory changes or competitive opportunities. Currently, the IQ technology platform supports our US products, Rise and Elastic. We plan to migrate Sunny from its legacy technology platform to the IQ technology platform in the future as business needs dictate. The core functionality of the IQ technology platform is illustrated below.
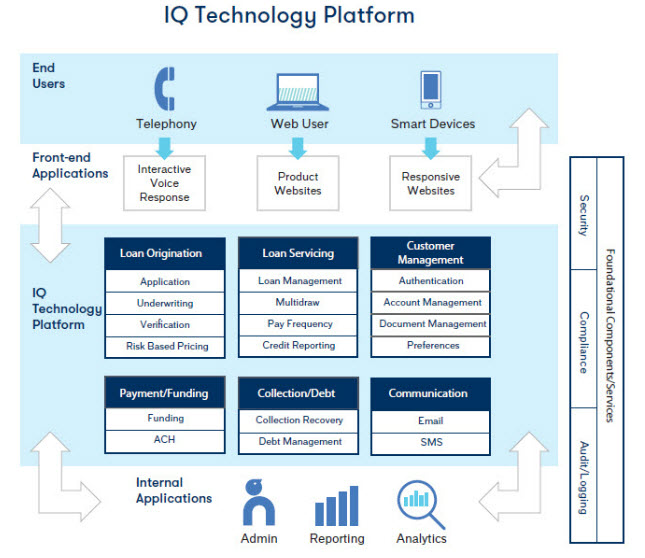
Mobile-first approach to user interface development
Currently, approximately two-thirds of our customer interactions come from mobile rather than desktop devices. The customer-facing portions of our products for both desktop and mobile interfaces are designed with a focus on user-friendly design and cross-platform mobility.
24
Cloud-based Web-IQ front-end
We host our customer-facing IQ technology platform web pages, or "Web-IQ," in the cloud to support personalized URLs, rapid prototyping, and testing and optimization of user interfaces. Our Web-IQ front-end supports different user application flows for different customers depending on what channel they came through and how risky we believe they are. Web-IQ allows our marketing and user experience teams to rapidly test new application flows on small percentages of inbound traffic to determine the impact of such changes on loan conversion, underwriting accuracy, and customer satisfaction prior to full deployment.
Sophisticated decision engine
Our sophisticated analytics approach requires us to manage numerous credit and fraud scores and strategies for each of our products, customer segments and marketing channels. In addition, because of our commitment to innovation and research and development, we are regularly conducting testing of new scores, data providers and analytical techniques. This requires an extremely flexible yet compliant decision engine. Our decision engine is a key component of the IQ technology platform and allows our Risk Management team to rapidly implement tests that control and measure the performance of new scores, data providers and analytical techniques against the existing best versions of each. In particular, the decision engine can rapidly integrate with new data providers and test a randomly selected percentage of application traffic with new scores and track their performance against existing scores.
All aspects of our underwriting process are controlled through components of the IQ technology platform, from the credit and fraud scores to the various product affordability assessments, to the instant decisioning and credit assignment process and even including the fraud and verifications activities performed by fraud agents. In this manner we have enhanced automation and have instituted tight controls over the entire decisioning process.
Best practice approach to information security and system reliability
Because we store extensive amounts of public and non-public customer personally identifiable information (“PII”) we take our obligations to protect that information and avoid data breaches very seriously. PII in the IQ technology platform is encrypted and we conduct regular audits of our security protocols via third party intrusion detection and vulnerability scans and penetration testing. These activities are supplemented with real-time monitoring and alerting for potential intrusions.
We have fully redundant data centers in place to support all critical business functions. Disaster recovery and business continuity plans and tests have been completed, which help to ensure our ability to recover in the event of a disaster or other unforeseen event.
COMPETITIVE OVERVIEW
The competition in our market is composed of both legacy brick-and-mortar and online credit providers. We compete with providers that offer products in the following categories:
Ø | Non-prime installment loans |
Ø | Non-prime credit cards |
Ø | Pawn loans |
Ø | Payday loans |
Ø | Title loans |
Ø | Rent to own |
In addition, bank overdrafts often function as an expensive form of emergency credit. According to a 2008 study by the FDIC, bank overdraft fees can have an effective APR greater than 3,500%, depending upon the amount of the overdraft transaction and length of time to bring the account positive.
Most legacy non-prime lenders still operate primarily out of legacy brick-and-mortar locations and require extensive documentation and face-to-face interactions. With online and mobile-only products, Elevate eliminates the potential need for our customers to drive across town and stand in line to apply for credit. In fact, with our products, the credit determination is made in seconds and approximately 95% of loan applications are fully automated with no manual review required.
25
There are few providers attempting to deliver lower-cost, online non-prime credit products similar to ours. Although there are a number of technology-enabled financial services companies that target prime and near-prime customers, including LendingClub, Prosper and Avant, there are only a limited number of comparable online competitors in the non-prime lending space, such as LendUp and NetCredit in the US and Pounds-to-Pocket in the UK. We expect more entrants in this space as this market continues to develop. We also believe that it would require significant time and expense for other companies to build technological and analytical platforms similar to ours, which is geared towards serving non-prime consumers. While other lenders may use proprietary or off-the-shelf lending platforms to support their online lending operations, these typically are focused on specific product types, and this makes such platforms inflexible for the kind of product innovation that we have pursued. We are not aware of any off-the-shelf products that support the variety of non-prime products such as those supported by our IQ technology platform and DORA risk analytics infrastructure. Although technology generally can be reverse-engineered over time, we believe our IQ and DORA technology and analytics platforms provide a competitive advantage due to our lead time based on our long history of serving non-prime consumers with multiple credit products. Although TFI holds an undivided co-ownership interest in the IQ technology platform as it existed as of January 1, 2015, without use restrictions on competition or otherwise, we have made significant modifications and improvements to it over the past three years.
The online non-prime credit market in the US is extremely fragmented and most lenders source customers from lead generation companies, resulting in low brand recognition. Unlike these competitors, we have made a significant investment in establishing a direct-to-consumer, integrated multi-channel marketing capability using direct mail, TV, search engine marketing, and digital campaigns, which we believe creates a unique opportunity for Rise and Elastic to become dominant and trusted brands in this space.
In the UK, high-cost short-term credit ("HCSTC") products are established, but are highly regulated and scrutinized by consumer affairs champions and advocacy groups. In 2015, the FCA undertook an industry review and introduced a set of regulations including a price cap to ensure borrowers will never have to pay back more than double what they originally borrowed. As a result, the number of HCSTC providers has shrunk as many exited the market. In July 2017, the FCA reviewed the price-cap and concluded that the regulations have delivered “substantial benefit to consumers.”
Facilitated by distinctive TV campaigns, Sunny has become one of the most well-known brands in the space and we believe that Sunny is currently the number one or number two lender in the HCSTC market based on our improved customer value proposition, analytics and outstanding customer service. The launch of an integrated PR, Social and Content team has also delivered significant value to our overall marketing impact. Facebook is the flagship Sunny social media channel and has seen 135% Sunny community growth in 2017.
REGULATORY ENVIRONMENT
The online consumer loan products we currently offer are subject to a range of laws, regulations and standards that address consumer lending, credit services, consumer protections and reporting, information sharing, marketing, debt collection, data protection, state licensing and interest rate and term limitations, among other things.
All products are subject to supervision, regulation and / or enforcement by numerous regulatory bodies—from state regulators and attorneys general, federal regulators, like the CFPB, the FTC and in some cases the FDIC, and the FCA in the UK. Consistent with regulatory expectations, we have an extensive compliance program and internal controls. As of the date of this Annual Report on Form 10-K, we have not been examined by the CFPB or the FCA, but we have had numerous state examinations.
For a discussion of the risks related to our regulatory environment, see “Risk factors—Other Risks Related to Compliance and Regulation.”
26
US regulation
State and local regulation and licensing
Rise is regulated under a variety of enabling state statutes. The scope of state regulation, including permissible interest rates, fees and terms, varies from state to state. Some states require specific disclosures, mandate or prohibit certain terms and limit the maximum interest rate and fees that may be charged. Where licensing or registration is required, we and our lending partners are subject to extensive state rules, licensing and examination. Failure to comply with these requirements may result in, among other things, refunds of excess charges, monetary penalties, revocation of required licenses, voiding of loans and other administrative enforcement actions. Rise is available in the following 17 states: Alabama, California, Delaware, Georgia, Idaho, Illinois, Kansas, Mississippi, Missouri, New Mexico, North Dakota, Ohio, South Carolina, Tennessee, Texas, Utah and Wisconsin. Rise may also be subject to additional municipal regulations and ordinances related to, for example, certain non-bank loan products and debt collection. The scope of municipal regulations and ordinances vary. Several state regulators have publicly expressed their intent to increase supervision and enforcement of consumer protection laws against supervised entities. For example, on January 25, 2018 in response to a perceived policy shift by the CFPB, the New York Department of Financial Services (“DFS”) issued a press release indicating that it will “continue to take the lead and take action to fill increasing number of regulatory voids created by the federal government.” Several states, including Maryland and Pennsylvania have formed consumer protection units to increase their focus on enforcement of consumer protection statutes. This could result in additional regulatory oversight and enforcement on our business.
US federal regulation
Truth in Lending Act. Both Rise, an installment loan and line of credit product, and Elastic, a bank-originated line of credit product, are subject to the federal Truth in Lending Act (“TILA”) and its underlying regulations known as Regulation Z. TILA and Regulation Z require creditors to deliver disclosures to borrowers during the life cycle of a loan—at application, at account opening or at consummation and for open-end credit products, such as Elastic and Rise, periodically.
The disclosure rules differ depending upon whether the product is an open-end credit or closed-end credit. Under the appropriate disclosure rules, the originating creditor is required to provide borrowers with key information about the loan, including, for open-end credit, the annual percentage rate (if applicable), applicable finance charges, transaction and penalty fees, and, for closed-end loans, the annual percentage rate, the finance charge, the amount financed, the total of payments, the number and amount of payments and payment due dates.
Regulation Z and TILA also provide consumers with substantive consumer protections. Specifically, pursuant to Regulation Z and TILA, loan products are subject to special rules for calculating annual percentage rates, advertising, and for open-end credit, rules for resolving billing errors.
Fair Credit Reporting Act. We are also subject to the Fair Credit Reporting Act (the “FCRA”) and similar state laws, as both a user of consumer reports and a furnisher of consumer credit information to credit reporting agencies. The FCRA and similar state laws regulate the use of consumer reports and reporting of information to credit reporting agencies. Specifically, the FCRA establishes requirements that apply to the use of “consumer reports” and similar data, including certain notifications to consumers, including when an adverse action, such as a loan declination, is based on information contained in a consumer report.
We only obtain and use consumer reports subject to the permissible purpose requirements under the FCRA. The FCRA permits us to share our experience information, information obtained from credit reporting agencies, and other customer information with affiliates. We comply with notice and opt out requirements for prescreen solicitations and for certain information sharing under the FCRA. We also have implemented an identity theft prevention program to fulfill the requirements of the Red Flags Regulations and Guidelines issued under the Fair and Accurate Credit Transactions Act (the “FACT Act”).
In meeting our duties to furnish consumer credit information to consumer reporting agencies, we:
Ø | furnish consumer credit information pursuant to the METRO 2 guidelines; |
Ø | establish and maintain procedures regarding the accuracy and integrity of the consumer credit information we report; and |
Ø | establish and maintain procedures to conduct timely investigations of customer disputes (received directly from customers or through credit reporting agencies) regarding the consumer credit information we report to the consumer reporting agencies. |
27
Equal Credit Opportunity Act. The federal Equal Credit Opportunity Act (the “ECOA”) generally prohibit creditors from discriminating against applicants on the basis of race, color, sex, age (provided the individual is of legal age to enter into a contract), religion, national origin, marital status, the fact that all or part of the applicant’s income derives from any public assistance program or the fact that the applicant has in good faith exercised any right under the federal Consumer Credit Protection Act. Regulation B, which implements ECOA, restricts creditors from requesting certain types of information from loan applicants and from using advertising or making statements that would discourage on a prohibited basis a reasonable person from making or pursuing an application.
In the underwriting of loans offered through our online platform, and with respect to all aspects of the credit transaction, we, our lending partners and marketing affiliates must comply with applicable provisions prohibiting discouragement and discrimination.
ECOA also requires creditors to provide consumers with timely notices of adverse action taken on credit applications or counteroffers. A prospective borrower applying for a loan but denied credit or offered a counteroffer is provided with an adverse action notice.
FTC Act and Dodd-Frank Wall Street Reform and Consumer Protection Act of 2010. Both the FTC and CFPB regulate the advertising and marketing of financial products and services. The FTC is charged with preventing unfair or deceptive acts or practices and false or misleading advertisements, and the CFPB is charged with preventing unfair, deceptive, or abusive acts and practices, all of which can erode consumer confidence. All marketing materials related to our products must also comply with the advertising requirements set forth in TILA.
Military Lending Act. The Military Lending Act (“MLA”) restricts, among other things, the interest rate and other terms that can be offered to active military personnel and their dependents. The MLA caps the interest rate that may be offered to a covered borrower to a 36% military annual percentage rate (“MAPR”), which includes certain fees such as application fees, participation fees and fees for add-on products. Prior to a recent amendment of the rules under the MLA, the MLA applied only to certain short term loans. The rules amendment extends the 36% rate cap to most types of consumer credit. The MLA also requires certain disclosures and prohibits certain terms, such as mandatory arbitration if a dispute arises concerning the consumer credit product. The amended MLA rules became effective on October 1, 2015 and applies to transactions consummated or established after October 3, 2016 for all credit products subject to the rules except credit cards, which have a later operative date.
The MLA, as amended, covers the Elastic and Rise products and restricts our ability to offer our products to military personnel and their dependents. Failure to comply with the MLA may limit our ability to collect principal, interest, and fees from borrowers and may result in civil and criminal liability that could harm our business.
The Servicemembers Civil Relief Act. The federal Servicemembers Civil Relief Act (“SCRA”) and similar state laws apply to certain loans made to certain members of the US military, reservists and members of the National Guard and certain dependents. The SCRA limits the interest rate a creditor may charge or certain collection actions a creditor may take on certain loans while a servicemember is on military duty. We maintain policies and procedures to comply with SCRA.
The Electronic Signatures in Global and National Commerce Act. The federal Electronic Signatures in Global and National Commerce Act (“E-SIGN”) and similar state laws, particularly the Uniform Electronic Transactions Act (“UETA”) authorize the creation of legally binding and enforceable agreements utilizing electronic records and signatures. E-SIGN and UETA require businesses that use electronic records or signatures in consumer transactions and provide required disclosures to consumers electronically, to obtain the consumer’s consent to receive information electronically. When a borrower is provided electronic disclosures, we obtain his or her consent to transact business electronically, to receive electronic disclosures and maintain electronic records in compliance with E-SIGN and UETA requirements. We also follow similar state e-signature rules mandating that certain disclosures be made and certain steps be followed in order to obtain and authenticate e-signatures.
Electronic Fund Transfer Act. The Electronic Fund Transfer Act of 1978 (“EFTA”) protects consumers engaging in electronic fund transfers. The EFTA is implemented through Regulation E, which includes an official staff commentary. The Dodd-Frank Act transferred rule-making authority under the EFTA from the Federal Reserve Board to the CFPB and, with respect to entities under its jurisdiction, granted authority to the CFPB to supervise and enforce compliance with EFTA and its implementing regulations. Borrowers of our products often choose to repay by electronic fund transfers and, accordingly, a written authorization, signed or similarly authenticated, may be required in connection with auto-pay features. Restrictions on how consumers choose to pay or how lenders comply with electronic fund transfers could impact our current business processes.
28
To the extent a borrower repays his or her payment obligation through electronic fund transfers, the EFTA and its implementing regulations apply. EFTA contains restrictions, requires disclosures and provides consumers certain rights relating to electronic fund transfers.
Fair Debt Collection Practices Act. The federal Fair Debt Collection Practices Act (the “FDCPA”) provides guidelines and limitations on the conduct of third-party debt collectors and debt buyers when collecting consumer debt. While the FDCPA generally does not apply to first-party creditors collecting their own debts or to servicers when collecting debts that were current when servicing began, we use the FDCPA as a guideline for all collections. We require all vendors and third parties that provide collection services on our behalf to comply with the FDCPA to the extent applicable. We also comply with state and local laws that apply to creditors and provide guidance and limitations similar to the FDCPA.
Unfair, Deceptive, Abusive Acts and Practices. The Dodd-Frank Act prohibits “unfair, deceptive or abusive” acts or practices (“UDAAPs”). The CFPB has found UDAAPs in most phases in the life cycle of a loan, including the marketing, collecting and reporting of loans. UDAAPs could involve omissions or misrepresentations of important information to consumers or practices that take advantages of vulnerable consumers, such as elderly or low-income consumers. All products and services provided by Elevate and its vendors in the US are subject to the prohibition on UDAAPs.
Gramm-Leach-Bliley Act. We are also subject to various federal and state laws and regulations relating to privacy and security of consumers’ nonpublic personal information. Under these laws, including the federal Gramm-Leach-Bliley Act (“GLBA”) and Regulation P promulgated thereunder, we must disclose our privacy policy and practices, including those policies relating to the sharing of nonpublic personal information with third parties. We may also be required to provide an opt-out to certain sharing. The GLBA and other laws also require us to safeguard personal information. The FTC regulates the safeguarding requirements of the GBLA for non-bank lenders through its Safeguard Rules.
Anti-money laundering and economic sanctions. We and the originating lenders that we work with are also subject to certain provisions of the USA PATRIOT Act and the Bank Secrecy Act under which we must maintain an anti-money laundering compliance program covering certain of our business activities. In addition, the Office of Foreign Assets Control prohibits us from engaging in financial transactions with specially designated nationals.
Anticorruption. We are also subject to the US Foreign Corrupt Practices Act (the “FCPA”) which generally prohibits companies and their agents or intermediaries from making improper payments to foreign officials for the purpose of obtaining or keeping business and/or other benefits.
Telephone Consumer Protection Act. We are also subject to the TCPA and the regulations of the FCC, which regulations include limitations on telemarketing calls, auto-dialed calls, prerecorded calls, text messages and unsolicited faxes.
Telemarketing Sales Rule. We are also subject to the Telemarketing and Consumer Fraud and Abuse Prevention Act, the FTC’s Telemarketing Sales Rule promulgated pursuant to such Act, and similar state laws. The Telemarketing Sales Rule prohibits deceptive and abusive telemarketing acts or practices, such as calling before 8 a.m. or after 9 p.m., and requires telemarketers and sellers to make certain disclosures to consumers in every outbound call. Telemarketers are also required to comply with a company specific do-not-call framework, as well as with state and federal do-not-call registries. We have implemented policies and procedures reasonably designed to comply with the Telemarketing Sales Rule.
CAN-SPAM Act. We are subject to the Controlling the Assault of Non-Solicited Pornography and Marketing Act of 2003 and the FTC’s rules promulgated pursuant to such Act (together, “CAN-SPAM Act”), which establish requirements for certain “commercial messages” and “transactional or relationship messages.” For example, the CAN-SPAM Act prohibits the sending of messages that contain false, deceptive or misleading information. It also gives recipients the right to stop receiving commercial messages. We have implemented policies and procedures reasonably designed to comply with the CAN-SPAM Act.
Telephone Consumer Protection Act. The Telephone Consumer Protection Act and its implementing regulations (together, the “TCPA”) regulate the delivery of live and prerecorded telemarketing calls, non-marketing calls to cell phones through the use of an automated telephone dialing system, fax advertisements, and text messages. For example, under the TCPA, it is unlawful to make many of these types of communications without the prior consent of the recipient. The TCPA also established a federal do-not-call registry, with the Telemarketing Sales Rule, as noted above. We maintain policies and procedures reasonably designed to comply with the TCPA.
29
Consumer Financial Protection Bureau
The CFPB, which regulates consumer financial products and services, including consumer loans that we offer, was created in July 2010 with the passage of Title X of the Dodd-Frank Act. The CFPB has regulatory, supervisory and enforcement powers over certain providers of consumer financial products and services.
The CFPB released its final “Payday, Vehicle Title, and Certain High-Cost Lending Rule” (“Rule”) on October 5, 2017 which would require us to provide customers notice at least three days before a payment withdrawal attempt, as well as obtain new ACH authorization from a customer following two failed ACH attempts, among other requirements. The Rule became effective on January 16, 2018; the compliance date for the Rule is August 19, 2019. However, on January 16, 2018, the CFPB announced that it intends to reconsider the Rule in its current form. This announcement follows the December 2017 introduction in the House of Representatives of a resolution to disapprove of the Rule under the CRA.
On July 28, 2016, the CFPB issued its outline of proposals under consideration for the regulation of debt collection by third-party debt collectors. At this time, the CFPB has not issued a proposed rule for the regulation of debt collection by third-party debt collectors. However, if a final rule is promulgated, Elevate will take the necessary steps to ensure that its management and oversight of third-party debt collectors is consistent with the rule.
We also expect the CFPB to continue with its rulemaking regarding the Supervision of Larger Participants in Installment Loan and Vehicle Title Loan Markets, which will enable the CFPB to examine and supervise those markets.
We do not currently know the full extent of the final rules the CFPB will ultimately adopt, and thus, its impact on our activities is uncertain, however the final rules will likely impose limitations on certain loans and services we offer. We believe that the new rules will ultimately reduce potential consumer harm and allow responsible lenders to continue to serve the large and growing need for non-prime credit. As noted above, Republic Bank is supervised and examined by the FDIC. Furthermore, it is not clear whether and to what extent the FDIC, the CFPB, or both will have supervisory authority over Elevate, as a service provider to Republic Bank.
The Trump Administration has issued numerous executive orders aimed at reducing regulations. It is unclear whether these apply to the CFPB. Further, the CFPB is currently overseen by Acting Director Mick Mulvaney who has made organizational changes to the CFPB, is reviewing all operations of the CFPB and has issued or anticipates issuing Requests for Information (RFIs) on the following topics: CIDs, Use of Administrative Adjudications, Enforcement, Supervision, External Engagement, Complaint Reporting, Rulemaking Processes, Bureau Rules Not Under §1022(d) Assessment, Inherited Rules, Guidance and Implementation Support, Consumer Education and Consumer Inquiries. It is unclear what impact, if any, the findings or outcomes of the RFIs will have on the oversight of Elevate’s business.
On January 31, 2018, the D.C. Circuit, sitting en banc, decided that the CFPB’s structure—featuring a single director whom the president may remove only for cause—was constitutional. It is not clear what impact this case will have on the oversight of Elevate’s business.
Federal Trade Commission
The Federal Trade Commission ("FTC") enforces the safeguarding requirements of the GLBA against non-banks pursuant its authority to enforce Section 5 of the Federal Trade Commission Act, which prohibits unfair or deceptive acts or practices. In addition, the FTC has a history of pursuing enforcement actions against non-bank lenders and online lead generators for alleged unfair or deceptive acts or practices in connection with the marketing or servicing of consumer credit products and services. Like the CFPB, the FTC may issue fines and corrective orders that could require us to make revisions to our existing business models. The FTC has jurisdiction over Elevate and its business practices.
Foreign regulation
United Kingdom
In the UK, we are subject to regulation by the FCA and must comply with the FCA’s rules and guidance set forth in the FCA Handbook, the Financial Services and Markets Act 2000 (the “FSMA”), the Consumer Credit Act 1974, as amended (the “CCA”) and Secondary legislation passed under the FSMA and the CCA, among other rules and regulations. We must also follow the responsible lending and arrears, default and recovery rules, which provide greater clarity for lenders as to business practices that the FCA believes constitute inappropriate lending.
30
UK regulation and authorization. Our Sunny product is covered by the extensive regulatory regime promulgated under the FSMA and CCA. The regulatory regime requires firms undertaking consumer credit regulatory activities to be FCA authorized. Regulated businesses must hold FCA authorizations, pay annual fees, follow prescriptive rules on advertising, include minimum and prescribed disclosures within pre-contract, loan and post-contract arrears documentation, regularly report customer complaints information, and maintain robust systems and controls in relation to the conduct of regulated business, including when engaging third-party suppliers.
The UK regime includes an obligation to self-report breaches of the applicable laws and regulations, and the FCA has the power to order regulated firms to pay fines, undertake changes to business models, implement customer remediation programs compensating customers for historic breaches and, among various other enforcement powers, limit or revoke regulatory authorizations. Failure to comply with the technical requirements of CCA and underlying regulations can, among other penalties, render loan agreements unenforceable without a court order or preclude the charging of interest for the period of non-compliance. The courts also have wide powers to determine that a relationship between a lender and customers is unfair and impose equitable remedies in such circumstances.
Equality Act. The Equality Act 2010 prohibits unlawful direct and indirect discrimination and harassment of applicants and customers when conducting lending services on the basis of nine protected characteristics: age; disability; gender reassignment; marriage and civil partnership; pregnancy and maternity; race; religion or belief; sex; and sexual orientation. These requirements apply to the advertising, underwriting and enforcing of Sunny loans and the handling of complaints regarding Sunny loans.
Marketing laws. Marketing in all mediums, including television, radio and online, is subject to the detailed advertising rules for the consumer credit industry contained in part 3 of the FCA’s CONC rulebook as well as the Financial Services and Markets Act 2000 (Financial Promotion) Order 2005. In particular, all advertisements must be clear, fair and not misleading and include representative cost information and illustrations where particular advertising jargon is included in the material. Certain marketing expressions are also prohibited.
The Advertising Standards Authority (the “ASA”) has also published specific codes for broadcast and non-broadcast advertising to which we must also adhere. Both the FCA and the ASA tightly monitor consumer credit advertising and regularly conduct industry audits of compliance standards. The ASA maintains a complaints framework and investigates legal, regulatory and code breaches raised by both consumers and competitors and publishes public adjudications, which can require firms to amend or completely remove advertisements. Misleading marketing can also constitute a criminal offense under the Consumer Protection from Unfair Trading Regulations 2008 and result in fines from the FCA.
Debt collection practices. The CCA sets out a formulaic procedure for customers in arrears, applicable when levying default fees and when taking any other steps in relation to default. Firms are required to issue statutory notices in a prescribed format within specific timeframes and include self-help information sheets. Failure to comply has severe consequences, including restricting lender rights to enforce relevant loan agreements, charge interest or any levy applicable default fees. The FCA also expects firms that have failed to comply with these requirements to proactively undertake extensive remediation activities, issuing refunds to customers where appropriate, including in cases where customers have not raised a complaint directly. A number of leading banking groups in the UK have undertaken such remediation activities.
Part 7 of the FCA’s CONC rulebook also sets out detailed rules and guidance for dealing with customers in arrears or default when pursuing recovery. The rules prohibit threatening, aggressive and harassing debt collection communications and practices, impose obligations to treat customers in arrears with forbearance and govern conduct when interacting with debt management firms engaged to resolve over-indebtedness. There are also specific rules on the use of continuous payment authorities as a repayment method that limit the number of repayment attempts that can be initiated by lenders.
Privacy laws. In the UK, we are currently subject to the requirements of the Data Protection Act 1998 (the “DPA”) and are required to be fully registered as a data-controller under the DPA and comply with industry guidance published by the regulator, the Information Commissioner. On May 25, 2018 the DPA will be replaced with the EU General Data Protection Regulation ("GDPR"). The GDPR is designed to harmonize data privacy laws across Europe, to protect and empower all EU citizens’ data privacy and to reshape the way organizations across the region approach data privacy. The GDPR is more prescriptive than the existing regime and includes new obligations on businesses, for example, the appointment of a data protection officer, self-reporting of breaches, and obtaining express consent for data processing and providing more rights to individuals whose data is processed, including the “right to be forgotten,” by having such individuals’ records erased. Penalties for non-compliance under the GDPR are up to 4% of annual global turnover (a.k.a. total revenues) for the preceding year or €20 Million (whichever is greater).
31
There are also strict rules on the instigation of electronic communications such as email, text message and telephone calls under the Privacy and Electronic Communications (EC Directive) Regulations 2003, which impose consent rules regarding unsolicited direct marketing, as well as the monitoring of devices.
We are subject to laws limiting the transfer of personal data from the European Economic Area to non-European Economic Area countries or territories.
Anti-money laundering. We are subject to the Proceeds of Crime Act 2002 and the Money Laundering Regulations 2007, which require the implementation of strict procedures for our business activities. The UK regime includes self-reporting suspicious activities, the appointment of a designated anti-money laundering officer with overall responsibility for the compliance of the business and employees. The legislation also includes several criminal offenses and can result in personal criminal liability.
Anti-bribery and corruption. UK firms are subject to the Bribery Act 2010, which introduces a number of individual offenses relating to giving and receiving bribes and dealings with foreign public officials. Commercial organizations can be prosecuted for failure to implement adequate procedures to record, report and prevent bribery.
APR by geography
The table below presents the maximum APR allowed by state for states in which Rise is offered. Sunny is subject to a 24% monthly APR limit, which is nationwide in the UK. Elastic is a fee-based product without a periodic rate that requires the disclosure of an APR.
State | Maximum APR allowed by state | Maximum APR Rise charges | ||||
Alabama | * | 295 | % | |||
California(1) | * | 225 | % | |||
Delaware(2) | * | 299 | % | |||
Georgia(3) | 60 | % | 59.8 | % | ||
Idaho(2) | * | 299 | % | |||
Illinois | 99 | % | 98.8 | % | ||
Kansas(4) | * | 299 | % | |||
Mississippi | * | 290 | % | |||
Missouri(2) | * | 299 | % | |||
New Mexico(2) | 175% | 175 | % | |||
North Dakota(2) | * | 299 | % | |||
Ohio(2) | * | 299 | % | |||
South Carolina(2) | * | 299 | % | |||
Tennessee(4) | See note (5) | 275 | % | |||
Texas(2) | * | 299 | % | |||
Utah(2) | * | 299 | % | |||
Wisconsin(2) | * | 299 | % | |||
* | As agreed upon between the parties. In California, as agreed upon between the parties for loans over $2,500. |
(1) | Minimum loan amount offered in California is $2,600. |
(2) | As of December 31, 2017. Some legacy customers will have rates as high as the previous maximum rate for their respective state. |
(3) | APR must be less than 60% under applicable state law. |
(4) | In Tennessee and Kansas, Rise is a line of credit and the maximum APR noted above is actually the periodic interest and fees allowable by statute. |
(5) | Tennessee has a statutory maximum APR allowed equal to periodic interest of 24% per year (this only applies to periodic interest and not fees) plus a daily fee of 0.7% of the average daily principal balance in any billing cycle. |
32
EMPLOYEES
We are committed to building and nurturing a distinctive corporate culture of innovation, excellence, collaboration and integrity. Our key company values based on how we expect ourselves to serve our customers, owners and each other are:
Ø | Think Big. We have always been an innovator in our industry. Ideas, both big and small, are our competitive advantage. We share a responsibility to think out of the box, challenge the status quo and embrace change. |
Ø | Raise the Bar. Excellence is not a skill. It is a habit—the gradual result of always striving to do better. As a company and as individuals we push ourselves to build on success, learn from failure and get better every day. |
Ø | Win Together. Our goals are too big to achieve as individuals. Collaboration is not a by-product of our work, it is the primary focus. It is also more fun. |
Ø | Do the Right Thing. Doing the right thing is not optional. We hold each other to the highest standards and earn our reputation every day. |
Our values are reinforced in all aspects of our employees’ relationship with our company, including during the recruiting process and the bi-annual reviews, and play a large role in the promotion process. In addition, each quarter, employees who best exemplify these values are nominated for “Smart Awards” and are selected and recognized at all-company Town Hall meetings.
Elevate was certified as a "Great Place to Work" in 2016 and again in 2017 based on a comparison of our employees' survey responses to responses of hundreds of other certified companies. We believe this reflects our commitment to build a strong and lasting company and corporate culture.
As of December 31, 2017, we had 615 full-time employees, including 170 in technology, 110 in risk management, 86 in loan operations and customer support, 16 in marketing and business development, 131 related to our UK operations and 102 in general and administrative functions. We also outsource certain functions, such as collections and customer service to increase efficiencies and scalability. We use an internal quality team to review and improve third-party performance.
OUR INTELLECTUAL PROPERTY
Protecting our rights to our intellectual property is critical, as it enhances our ability to offer distinctive services and products to our customers, which differentiates us from our competitors. We rely on a combination of trademark laws and trade secret protections in the US and other jurisdictions, as well as confidentiality procedures and contractual provisions, to protect the intellectual property rights related to our proprietary analytics, predictive underwriting models and software systems. We have either registered trademarks and/or pending applications in the US for the marks Elevate, Rise, Elastic and Sunny. We also own European Community trademark registrations for the Sunny and Elastic marks. Our trademarks are materially important to us and we anticipate maintaining them and renewing them.
OUR HISTORY
We were created through the spin-off of the direct lending and branded product businesses of TFI. TFI was founded in 2001. Prior to the spin-off transaction, TFI had two discrete lines of business: (1) a direct lender and branded product provider to non-prime consumers; and (2) a licensor of its technology platform to third-party lenders. In order to allow each of these separate lines of business to focus on its relative strategic and operational strengths and future business plans, the board of directors of TFI decided to spin off its direct lending and branded products business into a separate company.
We were incorporated in Delaware on January 31, 2014 as a subsidiary of TFI, and we had no material assets or activities as a separate corporate entity until the spin-off occurred. On May 1, 2014, TFI contributed the assets and liabilities associated with its direct lending and branded products business to us, and distributed its interest in our Company to its stockholders, but retained the assets and liabilities associated with its licensed technology platform line of business. TFI’s retained business line entails providing marketing services to third-party lenders and licensing TFI’s technology platform to these lenders for marketing and licensing fees. TFI previously conducted its direct lending business through various legal entity subsidiaries, which were contributed to us in the spin-off transaction.
On April 11, 2017, we closed an initial public offering (“IPO”) of 12,400,000 shares of our common stock at a price of $6.50
per share to the public. In connection with the closing, the underwriters exercised their option to purchase in full for an
additional 1,860,000 shares. On April 6, 2017, our stock began trading on the New York Stock Exchange (“NYSE”) under the symbol “ELVT.”
33
AVAILABLE INFORMATION
Our website address is www.elevate.com, and our investor relations website is located at http://investors.elevate.com/. Information on our website is not incorporated by reference herein. We file annual, quarterly and special reports, proxy statements and other information with the Securities and Exchange Commission (the “SEC”). These filings are also available on the SEC’s website at www.sec.gov. In addition, the public may read and copy any materials that we file with the SEC at the SEC’s Public Reference Room at 100 F Street, NE, Washington, D.C. 20549 and may obtain additional information and guidance by calling the SEC Investor Information Service at 1-800-SEC-0330. You also may read and copy reports and other information filed by us at the office of the NYSE at 20 Broad Street, New York, New York 10005.
We make our Annual Reports on Form 10-K, our Quarterly Reports on Form 10-Q, our Current Reports on Form 8-K, and all amendments to these reports, available free of charge on our corporate website as soon as reasonably practicable after such reports are filed with, or furnished to, the SEC. In addition, our Corporate Governance Guidelines, Code of Business Conduct and Ethics Policy, Related Party Transaction Policy, and charters of the Audit Committee, Compensation Committee, Nominating and Corporate Governance Committee and Risk Committee are available on our website. We will provide reasonable quantities of electronic or paper copies of filings free of charge upon request. In addition, we will provide a copy of the above referenced charters to stockholders upon request.
34
Item 1A. Risk Factors
Investing in our common stock involves a high degree of risk. You should carefully consider the following risks and all other information contained in this Annual Report on Form 10-K, including our consolidated financial statements and the related notes, before investing in our common stock. The risks and uncertainties described below supplement, or to the extent inconsistent, supersede those disclosed in our Registration Statement. The risks and uncertainties described below are not the only ones we face, but include the most significant factors currently known by us that make investing in our securities speculative or risky. Additional risks and uncertainties that we are unaware of, or that we currently believe are not material, also may become important factors that affect us. If any of the following risks materialize, our business, financial condition and results of operations could be materially harmed. In that case, the trading price of our common stock could decline, and you may lose some or all of your investment.
RISKS RELATED TO OUR BUSINESS AND INDUSTRY
We have a limited operating history in an evolving industry, which makes it difficult to accurately assess our future growth prospects.
We were incorporated as a wholly owned subsidiary of TFI in January 2014 and became a stand-alone company in May 2014 following the spin-off and, as such, have a three year history as a stand-alone company. Although our management team has many years of experience in the non-prime lending industry, we operate in an evolving industry that may not develop as expected. Assessing the future prospects of our business is challenging in light of both known and unknown risks and difficulties we may encounter. Growth prospects in non-prime lending can be affected by a wide variety of factors including:
• | Competition from other online and traditional lenders; |
• | Regulatory limitations that impact the non-prime lending products we can offer and the markets we can serve; |
• | An evolving regulatory and legislative landscape; |
• | Access to important marketing channels such as: |
◦ | Direct mail; |
◦ | TV and mass media; |
◦ | Search engine marketing; and |
◦ | Strategic partnerships with affiliates; |
• | Changes in consumer behavior; |
• | Access to adequate financing; |
• | Increasingly sophisticated fraudulent borrowing and online theft; |
• | Challenges with new products and new markets; |
• | Dependence on our proprietary technology infrastructure and security systems; |
• | Dependence on our personnel and certain third parties with whom we do business; |
• | Risk to our business if our systems are hacked or otherwise compromised; |
• | Evolving industry standards; |
• | Recruiting and retention of qualified personnel necessary to operate our business; and |
• | Fluctuations in the credit markets and demand for credit. |
We may not be able to successfully address these factors, which could negatively impact our growth, harm our business and cause our operating results to be worse than expected.
35
Our recent growth rate may not be indicative of our ability to continue to grow, if at all, in the future.
Our revenues grew to $673.1 million for the year ended December 31, 2017 from $580.4 million for the year ended December 31, 2016. However, our revenue growth rate has fluctuated over the past few years and it is possible that, in the future, even if our revenues continue to increase, our rate of revenue growth could decline, either because of external factors affecting the growth of our business or because we are not able to scale effectively as we grow. If we cannot manage our growth effectively, it could have a material adverse effect on our business, prospects, results of operations, financial condition or cash flows.
We have a history of losses and may not maintain or achieve consistent profitability in the future.
We incurred net losses of $6.9 million, $22.4 million and $19.9 million for the years ended December 31, 2017, 2016 and 2015, respectively. As of December 31, 2017, we had an accumulated deficit of $80.0 million. We will need to generate and sustain increased revenues in future periods in order to become and remain profitable, and, even if we do, we may not be able to maintain or increase our level of profitability.
As we grow, we expect to continue to expend substantial financial and other resources on:
• | personnel, including significant increases to the total compensation we pay our employees as we grow our employee headcount; |
• | marketing, including expenses relating to increased direct marketing efforts; |
• | product development, including the continued development of our proprietary scoring methodology; |
• | diversification of our funding sources; |
• | office space, as we increase the space we need for our growing employee base; and |
• | general administration, including legal, accounting and other compliance expenses related to being a public company. |
These expenditures are expected to increase and may adversely affect our ability to achieve and sustain profitability as we grow. In addition, we record our provision for loan losses as an expense to account for the possibility that some loans may not be repaid in full. We expect the aggregate amount of loan loss provision to grow as we increase the number and total amount of loans we make to new customers.
Our efforts to grow our business may be more costly than we expect, and we may not be able to increase our revenues enough to offset our higher operating expenses. We may incur losses in the future for a number of reasons, including the other risks described in this "Risk Factors" section, unforeseen expenses, difficulties, complications and delays and other unknown events. If we are unable to achieve and sustain profitability, the market price of our common stock may significantly decrease.
Our historical information does not necessarily represent the results we would have achieved as a stand-alone company and may not be a reliable indicator of our future results.
We have a limited operating history as a stand-alone company. See “—We have a limited operating history in an evolving industry, which makes it difficult to accurately assess our future growth prospects” above. As a result of the spin-off, TFI contributed the assets and liabilities associated with its direct lending and branded products business to us. The historical financial information prior to the spin-off may not reflect what our results of operations, financial position and cash flows would have been had we been a stand-alone company during such prior periods. This is primarily because:
• | our historical financial information reflects allocations for services historically provided to us by TFI, which allocations may not reflect the costs we will incur for similar services in the future as a stand-alone company; and |
• | our historical financial information does not reflect reduced economies of scale, including changes in the cost structure, personnel needs, financing and operations of our business. |
We are also responsible for the additional costs associated with being a public company, including costs related to corporate governance and having listed and registered securities. Therefore, our historical financial information may not be indicative of our future performance as a stand-alone public company.
36
The consumer lending industry continues to be subjected to new laws and regulations in many jurisdictions that could restrict the consumer lending products and services we offer, impose additional compliance costs on us, render our current operations unprofitable or even prohibit our current operations.
Both state and federal governments in the US and regulatory bodies in the UK may seek to impose new laws, regulatory restrictions or licensing requirements that affect the products or services we offer, the terms on which we may offer them, and the disclosure, compliance and reporting obligations we must fulfill in connection with our lending business. They may also interpret or enforce existing requirements in new ways that could restrict our ability to continue our current methods of operation or to expand operations, impose significant additional compliance costs and may have a negative effect on our business, prospects, results of operations, financial condition or cash flows. In some cases these measures could even directly prohibit some or all of our current business activities in certain jurisdictions, or render them unprofitable or impractical to continue.
In recent years, consumer loans, and in particular the category commonly referred to as “payday loans,” have come under increased regulatory scrutiny that has resulted in increasingly restrictive regulations and legislation that makes offering consumer loans in certain states in the US or the UK less profitable or unattractive. On October 5, 2017 the Consumer Financial Protection Bureau (the "CFPB") finalized its rule covering loans that require consumers to repay all or most of the debt at once, including payday loans, auto title loans, deposit advance products, longer-term loans with balloon payments and any loan with an annual percentage rate over 36 percent that includes authorization for the lender to access the borrower’s checking or prepaid account. The Rule became effective on January 16, 2018, but subsequently, on the same day, the CFPB announced that it "intends to engage in a rulemaking process so that the Bureau may reconsider" the final rule. See “—The CFPB issued final rules affecting the consumer lending industry, and these or subsequent new rules and regulations, if they are finalized, may impact our US consumer lending business” below for more information.
We also expect that further new laws and regulations will be promulgated in the UK that could impact our business operations. See “—The UK has imposed, and continues to impose, increased regulation of the high-cost short-term credit industry with the stated expectation that some firms will exit the market” below for additional information.
In order to serve our non-prime customers profitably we need to sufficiently price the risk of the transaction into the annual percentage rate (“APR”) of our loans. If individual states or the US federal government or regulators in the UK impose rate caps lower than those at which we can operate our current business profitably or otherwise impose stricter limits on non-prime lending, we would need to exit such states or dramatically reduce our rate of growth by limiting our products to customers with higher creditworthiness.
Furthermore, legislative or regulatory actions may be influenced by negative perceptions of us and our industry, even if such negative perceptions are inaccurate, attributable to conduct by third parties not affiliated with us (such as other industry members) or attributable to matters not specific to our industry.
Any of these or other legislative or regulatory actions that affect our consumer loan business at the national, state, international and local level could, if enacted or interpreted differently, have a material adverse effect on our business, prospects, results of operations, financial condition or cash flows and prohibit or directly or indirectly impair our ability to continue current operations.
Regulators and payment processors are scrutinizing certain online lenders’ access to the Automated Clearing House system to disburse and collect loan proceeds and repayments, and any interruption or limitation on our ability to access this critical system would materially adversely affect our business.
When making loans in the US, we typically use the Automated Clearing House (“ACH”) system to deposit loan proceeds into our customers’ bank accounts. This includes loans that we originate as well as Elastic loans originated by Republic Bank & Trust Company (“Republic Bank”) and Rise loans made through the credit services organization (“CSO”) programs. These products also depend on the ACH system to collect amounts due by withdrawing funds from customers’ bank accounts when the customer has provided authorization to do so. ACH transactions are processed by banks, and if these banks cease to provide ACH processing services or are not allowed to do so, we would have to materially alter, or possibly discontinue, some or all of our business if alternative ACH processors or other payment mechanisms are not available.
It has been reported that actions, referred to as Operation Choke Point, by the US Department of Justice (the “Justice Department”) the Federal Deposit Insurance Corporation (the “FDIC”) and certain state regulators appear to be intended to discourage banks and ACH payment processors from providing access to the ACH system for certain lenders that they believe are operating illegally, cutting off their access to the ACH system to either debit or credit customer accounts (or both).
37
In the past, this heightened regulatory scrutiny by the Justice Department, the FDIC and other regulators has caused some banks and ACH payment processors to cease doing business with consumer lenders who are operating legally, without regard to whether those lenders are complying with applicable laws, simply to avoid the risk of heightened scrutiny or even litigation. These actions have reduced the number of banks and payment processors who provide ACH payment processing services and could conceivably make it increasingly difficult to find banking partners and payment processors in the future and/or lead to significantly increased costs for these services. If we are unable to maintain access to needed services on favorable terms, we would have to materially alter, or possibly discontinue, some or all of our business if alternative processors are not available. In response to Operation Choke Point, H.R. 2706 was introduced in the House to halt future similar actions. The bill passed out of the House on December 11, 2017 and is now pending in the Senate. It is unknown if the legislation will progress further at this time. Further, in August 2017, the Justice Department sent a letter to House Judiciary Chairman Bob Goodlatte referring to Operation Chokepoint as "a misguided initiative."
If we lost access to the ACH system because our payment processor was unable or unwilling to access the ACH system on our behalf we would experience a significant reduction in customer loan payments. Although we would notify consumers that they would need to make their loan payments via physical check, debit card or other method of payment a large number of customers would likely go into default because they are expecting automated payment processing. Similarly, if regulatory changes limited our access to the ACH system or reduced the number of times ACH transactions could be re-presented, we would experience higher losses.
If the information provided by customers or other third parties to us is incomplete, incorrect or fraudulent, we may misjudge a customer’s qualification to receive a loan, and any inability to effectively identify, manage, monitor and mitigate fraud risk on a large scale could cause us to incur substantial losses, and our operating results, brand and reputation could be harmed.
For the loans we originate through Rise and Sunny, our growth is largely predicated on effective loan underwriting resulting in acceptable customer profitability. This is equally important for the Rise loans in Texas and Ohio and the Elastic lines of credit originated by unaffiliated third parties. See “Management’s discussion and analysis of financial condition and results of operations—Components of Our Results of Operations—Revenues.” Lending decisions by such originating lenders are made using our proprietary credit and fraud scoring models, which we license to them. Lending decisions are based partly on information provided by loan applicants and partly on information provided by consumer reporting agencies, such as TransUnion, Experian or Equifax and other third-party data providers. Data provided by third-party sources is a significant component of the decision methodology, and this data may contain inaccuracies. To the extent that applicants provide inaccurate or unverifiable information or data from third-party providers is incomplete or inaccurate, the credit score delivered by our proprietary scoring methodology may not accurately reflect the associated risk. Additionally, a credit score assigned to a borrower may not reflect that borrower's actual creditworthiness because the credit score may be based on outdated, incomplete or inaccurate consumer reporting data , and we do not verify the information obtained from the borrower's credit report. Additionally, there is a risk that, following the date of the credit report that we obtain and review, a borrower may have:
• | become past due in the payment of an outstanding obligation; |
• | defaulted on a pre-existing debt obligation; |
• | taken on additional debt; or |
• | sustained other adverse financial events. |
Our resources, technologies and fraud prevention tools, which are used to originate loans or lines of credit, as applicable, under Rise, Sunny and Elastic, may be insufficient to accurately detect and prevent fraud. Inaccurate analysis of credit data that could result from false loan application information could harm our reputation, business and operating results.
In addition, our proprietary credit and fraud scoring models use identity and fraud checks analyzing data provided by external databases to authenticate each customer’s identity. The level of our fraud charge-offs and results of operations could be materially adversely affected if fraudulent activity were to significantly increase. Online lenders are particularly subject to fraud because of the lack of face-to-face interactions and document review. If applicants assume false identities to defraud the Company or consumers simply have no intent to repay the money they have borrowed the related portfolio of loans will exhibit higher loan losses. We have in the past and may in the future incur substantial losses and our business operations could be disrupted if we or the originating lenders are unable to effectively identify, manage, monitor and mitigate fraud risk using our proprietary credit and fraud scoring models.
38
Since fraud is often perpetrated by increasingly sophisticated individuals and “rings” of criminals, it is important for us to continue to update and improve the fraud detection and prevention capabilities of our proprietary credit and fraud scoring models. If these efforts are unsuccessful then credit quality and customer profitability will erode. If credit and/or fraud losses increased significantly due to inadequacies in underwriting or new fraud trends, new customer originations may need to be reduced until credit and fraud losses returned to target levels, and business could contract.
It may be difficult or impossible to recoup funds underlying loans made in connection with inaccurate statements, omissions of fact or fraud. Loan losses are currently the largest cost as a percentage of revenues across each of Rise, Sunny and Elastic. If credit or fraud losses were to rise, this would significantly reduce our profitability. High profile fraudulent activity could also lead to regulatory intervention, negatively impact our operating results, brand and reputation and require us, and the originating lenders, to take steps to reduce fraud risk, which could increase our costs.
Any of the above risks could have a material adverse effect on our business, prospects, results of operations, financial condition or cash flows.
Because of the non-prime nature of our customers, we have historically experienced a high rate of net charge-offs as a percentage of revenues, and our ability to price appropriately in response to this and other factors is essential. We rely on our proprietary credit and fraud scoring models in the forecasting of loss rates. If we are unable to effectively forecast loss rates, it may negatively impact our operating results.
Our net charge-offs as a percentage of revenues for the years ended December 31, 2017 and 2016 were 52% for both years. Because of the non-prime nature of our customers, it is essential that our products are appropriately priced, taking this and all other relevant factors into account. In making a decision whether to extend credit to prospective customers, and the terms on which we or the originating lenders are willing to provide credit, including the price, we and the originating lenders rely heavily on our proprietary credit and fraud scoring models, which comprise an empirically derived suite of statistical models built using third-party data, data from customers and our credit experience gained through monitoring the performance of customers over time. Our proprietary credit and fraud scoring models are based on previous historical experience. Typically, however, our models will become less effective over time and need to be rebuilt regularly to perform optimally. This is particularly true in the context of our preapproved direct mail campaigns. If we are unable to rebuild our proprietary credit and fraud scoring models, or if they do not perform up to target standards the products will experience increasing defaults or higher customer acquisition costs.
If our proprietary credit and fraud scoring models fail to adequately predict the creditworthiness of customers, or if they fail to assess prospective customers’ financial ability to repay their loans, or any or all of the other components of the credit decision process described herein fails, higher than forecasted losses may result. Furthermore, if we are unable to access the third-party data used in our proprietary credit and fraud scoring models, or access to such data is limited, the ability to accurately evaluate potential customers using our proprietary credit and fraud scoring models will be compromised. As a result, we may be unable to effectively predict probable credit losses inherent in the resulting loan portfolio, and we, and the originating lender, may consequently experience higher defaults or customer acquisition costs, which could have a material adverse effect on our business, prospects, results of operations, financial condition or cash flows.
Additionally, if we make errors in the development and validation of any of the models or tools used to underwrite loans, such loans may result in higher delinquencies and losses. Moreover, if future performance of customer loans differs from past experience, which experience has informed the development of our proprietary credit and fraud scoring models, delinquency rates and losses could increase.
If our proprietary credit and fraud scoring models were unable to effectively price credit to the risk of the customer, lower margins would result. Either our losses would be higher than anticipated due to “underpricing” products or customers may refuse to accept the loan if products are perceived as “overpriced.” Additionally, an inability to effectively forecast loss rates could also inhibit our ability to borrow from our debt facilities, which could further hinder our growth and have a material adverse effect on our business, prospects, results of operations, financial condition or cash flows.
39
We depend in part on debt financing to finance most of the loans we originate. Our business could be adversely affected by a lack of sufficient debt financing at acceptable prices or disruptions in the credit markets, which could reduce our access to credit.
We depend in part on debt financing to support the growth of our originated portfolios, Rise and Sunny. However, we cannot guarantee that financing will continue to be available beyond the current maturity date of our debt facilities, on reasonable terms or at all. Presently our debt financing for Rise and Sunny primarily comes from a single source, Victory Park Management, LLC (“VPC”), an affiliate of Victory Park Capital. Although our reliance on debt financing has decreased due to an increase in the Company's cash flow and the addition of three new lenders to the VPC Facility, if VPC became unwilling or unable to provide debt financing to us at prices acceptable to us we would need to secure additional debt financing or potentially reduce loan originations. Furthermore, as the volume of loans that we make to customers increases, we may require the expansion of our borrowing capacity on our existing debt facilities or the addition of new sources of capital. The availability of these financing sources depends on many factors, some of which are outside of our control.
We may also experience the occurrence of events of default or breaches of financial or performance covenants under our debt agreements, which are currently secured by all our assets. Any such occurrence or breach could result in the reduction or termination of our access to institutional funding or increase our cost of funding. Certain of these covenants are tied to our customer default rates, which may be significantly affected by factors, such as economic downturns or general economic conditions beyond our control and beyond the control of individual customers. In particular, loss rates on customer loans may increase due to factors such as prevailing interest rates, the rate of unemployment, the level of consumer and business confidence, commercial real estate values, the value of the US dollar, energy prices, changes in consumer and business spending, the number of personal bankruptcies, disruptions in the credit markets and other factors. Increases in the cost of capital would reduce our net profit margins.
Similarly, the loan portfolio for Elastic, which is originated by a third-party lender, gets funding as a result of the purchase of a participation interest in the loans it originates from Elastic SPV, Ltd. (“Elastic SPV”), a Cayman Islands entity that purchases such participations. Elastic SPV has a loan facility with VPC for its funding, for which we provide credit support, and we have entered into a credit default protection agreement with Elastic SPV that provides protection for loan losses. Although we plan to diversify our funding sources, any voluntary or involuntary halt to this existing program could result in the originating lender halting further loan originations until an additional financing partner could be identified.
In the event of a sudden or unexpected shortage of funds in the banking system, we cannot be sure that we will be able to maintain necessary levels of funding without incurring high funding costs, a reduction in the term of funding instruments or the liquidation of certain assets. If our cost of borrowing goes up, our net interest expense could increase, and if we were to be unable to arrange new or alternative methods of financing on favorable terms, we may have to curtail our origination of loans or recommend that the originating lenders curtail their origination of credit, all of which could have a material adverse effect on our business, prospects, results of operations, financial condition or cash flows.
The interest rates we charge to our customers and pay to our lenders could each be affected by a variety of factors, including access to capital based on our business performance and the volume of loans we make to our customers. These interest rates may also be affected by a change over time in the mix of the types of products we sell to our customers and a shift among our channels of customer acquisition. Our VPC funding facilities are variable rate in nature and tied to the 3-month LIBOR rate. Thus, any increase in the 3-month LIBOR rate will result in an increase in our net interest expense. The Company has entered into interest rate cap transactions on January 11, 2018 to mitigate the floating rate interest risk on a portion of the currently outstanding debt. Interest rate changes may also adversely affect our business forecasts and expectations and are highly sensitive to many macroeconomic factors beyond our control, such as inflation, recession, the state of the credit markets, changes in market interest rates, global economic disruptions, unemployment and the fiscal and monetary policies of the federal government and its agencies. Regulatory or legislative changes may reduce our ability to charge our current rates in all states and products. Also, competitive threats may cause us to reduce our rates. This would reduce profit margins unless there was a commensurate reduction in losses. Any material reduction in our interest rate spread could have a material adverse effect on our business, prospects, results of operations, financial condition or cash flows. In the event that the spread between the rate at which we lend to our customers and the rate at which we borrow from our lenders decreases, our financial results and operating performance will be harmed.
In the future, we may seek to access the debt capital markets to obtain capital to finance growth. However, our future access to the debt capital markets could be restricted due to a variety of factors, including a deterioration of our earnings, cash flows, balance sheet quality, or overall business or industry prospects, adverse regulatory changes, a disruption to or deterioration in the state of the capital markets or a negative bias toward our industry by market participants. Disruptions and volatility in the capital markets could also cause banks and other credit providers to restrict availability of new credit. Due to the negative bias
40
toward our industry, commercial banks and other lenders have restricted access to available credit to participants in our industry, and we may have more limited access to commercial bank lending than other businesses. Our ability to obtain additional financing in the future will depend in part upon prevailing capital market conditions, and a potential disruption in the capital markets may adversely affect our efforts to arrange additional financing on terms that are satisfactory to us, if at all. If adequate funds are not available, or are not available on acceptable terms, we may not have sufficient liquidity to fund our operations, make future investments, take advantage of acquisitions or other opportunities, or respond to competitive challenges and this, in turn, could adversely affect our ability to advance our strategic plans. Additionally, if the capital and credit markets experience volatility, and the availability of funds is limited, third parties with whom we do business may incur increased costs or business disruption and this could adversely affect our business relationships with such third parties, which could have a material adverse effect on our business, prospects, results of operations, financial condition or cash flows.
Any decrease in our access to preapproved marketing lists from credit bureaus or other developments impacting our use of direct mail marketing could adversely affect our ability to grow our business.
We market Rise and Sunny and provide marketing services to the originating lender in connection with Elastic. Direct mailings of preapproved loan offers to potential loan customers comprise one of the most important marketing channels for both the loans we originate, as well as those originated by third-party lenders. We estimate that approximately 44% and 99% of new Rise and Elastic loan customers, respectively, in the year ended December 31, 2017 obtained loans as a result of receiving such preapproved loan offers. Our marketing techniques identify candidates for preapproved loan mailings in part through the use of preapproved marketing lists purchased from credit bureaus. If access to such preapproved marketing lists were lost or limited due to regulatory changes prohibiting credit bureaus from sharing such information or for other reasons, our growth could be significantly adversely affected. If the cost of obtaining such lists increases significantly, it could substantially increase customer acquisition costs and decrease profitability.
Similarly, federal or state regulators or legislators could limit access to these preapproved marketing lists with the same effect.
In addition, preapproved direct mailings may become a less effective marketing tool due to over-penetration of direct mailing-lists. Any of these developments could have a material adverse effect on our business, prospects, results of operations, financial condition or cash flows.
We rely in part on relationships with marketing affiliates to identify potential customers for our loans. These relationships are generally non-exclusive and subject to termination, and the growth of our customer base could be adversely affected if any of our marketing affiliate relationships are terminated or the number of referrals we receive from marketing affiliates is reduced.
We rely on strategic marketing affiliate relationships with certain companies for referrals of some of the customers to whom we issue loans, and our growth depends in part on the growth of these referrals. In the year ended December 31, 2017, loans issued to Rise customers referred to us by our strategic partners constituted 21% of total Rise new customer loans. Additionally, in the same period, loans issued to Sunny customers through strategic partners constituted 27% of total Sunny new customer loans. Many of our marketing affiliate relationships do not contain exclusivity provisions that would prevent such marketing affiliates from providing customer referrals to competing companies. In addition, the agreements governing these partnerships, generally, contain termination provisions, including provisions that in certain circumstances would allow our partners to terminate if convenient, that, if exercised, would terminate our relationship with these partners. These agreements also contain no requirement that a marketing affiliate refer us any minimum number of customers. There can be no assurance that these marketing affiliates will not terminate our relationship with them or continue referring business to us in the future, and a termination of any of these relationships or reduction in customer referrals to us could have a material adverse effect on our business, prospects, results of operations, financial condition or cash flows.
41
Our success and future growth depend significantly on our successful marketing efforts, and if such efforts are not successful, our business and financial results may be harmed.
We intend to continue to dedicate significant resources to marketing efforts, including for the Elastic product, particularly as we continue to grow, introduce new loan products and expand into new states. Our ability to attract qualified borrowers depends in large part on the success of these marketing efforts and the success of the marketing channels we use to promote our products. Our marketing channels include social media and the press, online affiliations, search engine optimization, search engine marketing, offline partnerships, preapproved direct mailings and television advertising. If any of our current marketing channels become less effective, if we are unable to continue to use any of these channels, if the cost of using these channels were to significantly increase or if we are not successful in generating new channels, we may not be able to attract new borrowers in a cost-effective manner or convert potential borrowers into active borrowers. If we are unable to recover our marketing costs through increases in website traffic and in the number of loans made by visitors to product websites, or if we discontinue our broad marketing campaigns, it could have a material adverse effect on our business, prospects, results of operations, financial condition or cash flows.
We are dependent on third parties to support several key aspects of our business, and the failure of such parties to continue to provide services to us in the current manner and at the current rates would adversely affect our revenues and results of operations.
The Elastic line of credit product, which is originated by a third-party lender and contributed approximately 29% of our revenues for the year ended December 31, 2017, and the portions of the Rise installment loan product that we offer through CSO programs, which contributed approximately 9% of our revenues for the year ended December 31, 2017, depend in part on the willingness and ability of unaffiliated third-party lenders to make loans to customers. Additionally, as described above, our business, including our Elastic loans and Rise loans made through the CSO programs, depends on the ACH system, and ACH transactions are processed by third-party banks. See “—Regulators and payment processors are scrutinizing certain online lenders’ access to the Automated Clearing House system to disburse and collect loan proceeds and repayments, and any interruption or limitation on our ability to access this critical system would materially adversely affect our business.” We also utilize many other third parties to provide services to facilitate lending, loan underwriting, payment processing, customer service, collections and recoveries, as well as to support and maintain certain of our communication systems and information systems, and we may need to expand our relationships with third parties, or develop relationships with new third parties, to support any new product offerings that we may pursue.
The loss of the relationship with any of these third-party lenders and service providers, an inability to replace them or develop new relationships, or the failure of any of these third parties to provide its products or services, to maintain its quality and consistency or to have the ability to provide its products and services, could disrupt our operations, cause us to terminate product offerings or delay or discontinue new product offerings, result in lost customers and substantially decrease the revenues and earnings of our business. Our revenues and earnings could also be adversely affected if any of those third-party providers make material changes to the products or services that we rely on or increase the price of their products or services.
Elevate uses third parties for the majority of its collections and recovery activities. If those parties were unable or unwilling to provide those services for Elevate products we would experience higher defaults until those functions could be outsourced to an alternative service provider or until we could bring those functions in-house and adequately staff and train internally.
Any of these events could result in a loss of revenues and could have a material adverse effect on our business, prospects, results of operations, financial condition or cash flows.
The profitability of the line of credit product, Elastic, could be adversely affected by policy or pricing decisions made by the originating lender.
We do not originate and do not ultimately control the pricing or functionality of Elastic, the line of credit product. Instead, Republic Bank, which originates the loans, has licensed our technology and underwriting services and makes all key decisions regarding Elastic marketing, underwriting, product features and pricing. We generate revenues from the Elastic product through marketing and technology licensing fees paid by Republic Bank, and through a credit default protection agreement we entered into with Elastic SPV, which purchases participations in Elastic loans from Republic Bank. If Republic Bank changes its pricing, underwriting or marketing of Elastic in a way that decreases revenues or increases losses, then the profitability of each loan could be reduced. Although this would not reduce the revenues that we receive for marketing and technology licensing services, it would reduce the revenues that we receive from our credit default protection agreement with Elastic SPV.
Any of the above changes could have a material adverse effect on our business, prospects, results of operations, financial condition or cash flows.
42
Our ability to continue to provide Elastic would be adversely affected by a degradation in our relationship with Republic Bank.
The structure of the Elastic product exposes us to risks associated with being reliant on Republic Bank as the originating lender. If our relationship with Republic Bank were to degrade, or if Republic Bank were to terminate the various agreements associated with the Elastic product, we may not be able to find another suitable originating lender and new arrangements, if any, may result in significantly increased costs to us. Because line of credit products are relatively more difficult to establish under state law, any inability to find another originating lender would adversely affect our ability to continue to provide Elastic, which in turn could have a material adverse effect on our business, prospects, results of operations, financial condition or cash flows.
Decreased demand for non-prime loans as a result of increased savings or income could result in a loss of revenues or decline in profitability if we are unable to successfully adapt to such changes.
The demand for non-prime loan products in the markets we serve could decline due to a variety of factors, such as regulatory restrictions that reduce customer access to particular products, the availability of competing or alternative products or changes in customers’ financial conditions, particularly increases in income or savings. For instance, an increase in state or federal minimum wage requirements, or a decrease in individual income tax rates, could decrease demand for non-prime loans. Additionally, a change in focus from borrowing to saving (such as has happened in some countries) would reduce demand. Should we fail to adapt to a significant change in our customers’ demand for, or access to, our products, our revenues could decrease significantly. Even if we make adaptations or introduce new products to fulfill customer demand, customers may resist or may reject products whose adaptations make them less attractive or less available. Such decreased demand could have a material adverse effect on our business, prospects, results of operations, financial condition or cash flows.
A decline in economic conditions could result in decreased demand for our loans or cause our customers’ default rates to increase, harming our operating results.
Uncertainty and negative trends in general economic conditions in the US and abroad, including significant tightening of credit markets and a general decline in the value of real property, historically have created a difficult environment for companies in the lending industry. Many factors, including factors that are beyond our control, may impact our consolidated results of operations or financial condition or affect our borrowers’ willingness or capacity to make payments on their loans. These factors include: unemployment levels, housing markets, rising living expenses, energy costs and interest rates, as well as major medical expenses, divorce or death that affect our borrowers. If the US or UK economies experience a downturn, or if we become affected by other events beyond our control, we may experience a significant reduction in revenues, earnings and cash flows, difficulties accessing capital and a deterioration in the value of our investments.
Credit quality is driven by the ability and willingness of customers to make their loan payments. If customers face rising unemployment or reduced wages, defaults may increase. Similarly, if customers experience rising living expenses (for instance due to rising gas, energy, or food costs) they may be unable to make loan payments. An economic slowdown could also result in a decreased number of loans being made to customers due to higher unemployment or an increase in loan defaults in our loan products. The underwriting standards used for our products may need to be tightened in response to such conditions, which could reduce loan balances, and collecting defaulted loans could become more difficult, which could lead to an increase in loan losses. If a customer defaults on a loan, the loan enters a collections process where, including as a result of contractual agreements with the originating lenders, our systems and collections teams initiate contact with the customer for payments owed. If a loan is subsequently charged off, the loan is generally sold to a third party collection agency and the resulting proceeds from such sales comprise only a small fraction of the remaining amount payable on the loan.
There can be no assurance that economic conditions will remain favorable for our business or that demand for loans or default rates by customers will remain at current levels. Reduced demand for loans would negatively impact our growth and revenues, while increased default rates by customers may inhibit our access to capital, hinder the growth of the loan portfolio attributable to our products and negatively impact our profitability. Either such result could have a material adverse effect on our business, prospects, results of operations, financial condition or cash flows.
43
We are operating in a highly competitive environment and face increasing competition from a variety of traditional and new lending institutions, including other online lending companies. This competition could adversely affect our business, prospects, results of operations, financial condition or cash flows.
We have many competitors. Our principal competitors are consumer loan companies, CSOs, online lenders, credit card companies, consumer finance companies, pawnshops and other financial institutions that offer similar financial services. Other financial institutions or other businesses that do not now offer products or services directed toward our traditional customer base could begin doing so. Significant increases in the number and size of competitors for our business could result in a decrease in the number of loans that we fund, resulting in lower levels of revenues and earnings in these categories. Many of these competitors are larger than us, have significantly more resources and greater brand recognition than we do, and may be able to attract customers more effectively than we do.
Competitors of our business may operate, or begin to operate, under business models less focused on legal and regulatory compliance, which could put us at a competitive disadvantage. Additionally, negative perceptions about these models could cause legislators or regulators to pursue additional industry restrictions that could affect the business model under which we operate. To the extent that these models gain acceptance among consumers, small businesses and investors or face less onerous regulatory restrictions than we do, we may be unable to replicate their business practices or otherwise compete with them effectively, which could cause demand for the products we currently offer to decline substantially.
When new competitors seek to enter one of our markets, or when existing market participants seek to increase their market share, they sometimes undercut the pricing and/or credit terms prevalent in that market, which could adversely affect our market share or ability to exploit new market opportunities. Elevate products compete at least partly based on rate comparison with other credit products used by non-prime consumers. However, non-prime consumers by definition have a higher propensity for default and as a result need to be charged higher rates of interest to generate adequate profit margins. If existing competitors significantly reduced their rates or lower-priced competitors enter the market and offer credit to customers at a lower rates, the pricing and credit terms we or the originating lenders offer could deteriorate if we or the originating lenders act to meet these competitive challenges. Any such action may result in lower customer acquisition volumes and higher costs per new customer.
We may be unable to compete successfully against any or all of our current or future competitors. As a result, our products could lose market share and our revenues could decline, thereby affecting our ability to generate sufficient cash flow to service our indebtedness and fund our operations. Any such changes in our competition could have a material adverse effect on our business, prospects, results of operations, financial condition or cash flows.
Customer complaints or negative public perception of our business could result in a decline in our customer growth and our business could suffer.
Our reputation is very important to attracting new customers to our platform as well as securing repeat lending to existing customers. While we believe that we have a good reputation and that we provide customers with a superior experience, there can be no assurance that we will continue to maintain a good relationship with customers or avoid negative publicity.
In recent years, consumer advocacy groups and some media reports have advocated governmental action to prohibit or place severe restrictions on non-bank consumer loans. Such consumer advocacy groups and media reports generally focus on the annual percentage rate for this type of consumer loan, which is compared unfavorably to the interest typically charged by banks to consumers with top-tier credit histories. The finance charges assessed by us, the originating lenders and others in the industry can attract media publicity about the industry and be perceived as controversial. If the negative characterization of the types of loans we offer, including those originated through third-party lenders, becomes increasingly accepted by consumers, demand for any or all of our consumer loan products could significantly decrease, which could materially affect our business, prospects, results of operations, financial condition or cash flows. Additionally, if the negative characterization of these types of loans is accepted by legislators and regulators, we could become subject to more restrictive laws and regulations applicable to consumer loan products that could have a material adverse effect on our business, prospects, results of operations, financial condition or cash flows.
In addition, our ability to attract and retain customers is highly dependent upon the external perceptions of our level of service, trustworthiness, business practices, financial condition and other subjective qualities. Negative perceptions or publicity regarding these matters—even if related to seemingly isolated incidents, or even if related to practices not specific to short-term loans, such as debt collection—could erode trust and confidence and damage our reputation among existing and potential customers, which would make it difficult to attract new customers and retain existing customers, significantly decrease the demand for our products, result in increased regulatory scrutiny, and have a material adverse effect on our business, prospects, results of operations, financial condition or cash flows.
44
Our business depends on the uninterrupted operation of our systems and business functions, including our information technology and other business systems, as well as the ability of such systems to support compliance with applicable legal and regulatory requirements.
Our business is highly dependent upon customers’ ability to access our website and the ability of our employees and those of the originating lenders, as well as third-party service providers, to perform, in an efficient and uninterrupted fashion, necessary business functions, such as internet support, call center activities and processing and servicing of loans. Problems with the IQ technology platform running our systems, or a shut-down of or inability to access the facilities in which our internet operations and other technology infrastructure are based, such as a power outage, a failure of one or more of our information technology, telecommunications or other systems, cyber-attacks on, or sustained or repeated disruptions of, such systems could significantly impair our ability to perform such functions on a timely basis and could result in a deterioration of our ability to underwrite, approve and process loans (or support such functions with regard to Elastic lines of credit), provide customer service, perform collections activities, or perform other necessary business functions. Any such interruption could reduce new customer acquisition and negatively impact growth, which would have a material adverse effect on our business, prospects, results of operations, financial condition or cash flows.
In addition, our systems and those of third parties on whom we rely must consistently be capable of compliance with applicable legal and regulatory requirements and timely modification to comply with new or amended requirements. Any systems problems going forward could have a material adverse effect on our business, prospects, results of operations, financial condition or cash flows.
We are subject to cybersecurity risks and security breaches and may incur increasing costs in an effort to minimize those risks and to respond to cyber incidents, and we may experience harm to our reputation and liability exposure from security breaches.
Our business involves the storage and transmission of consumers’ proprietary information, and security breaches could expose us to a risk of loss or misuse of this information, litigation and potential liability. We are entirely dependent on the secure operation of our websites and systems as well as the operation of the internet generally. While we have incurred no material cyber-attacks or security breaches to date, a number of other companies have disclosed cyber-attacks and security breaches, some of which have involved intentional attacks. Attacks may be targeted at us, our customers, or both. Although we devote significant resources to maintain and regularly upgrade our systems and processes that are designed to protect the security of our computer systems, software, networks and other technology assets and the confidentiality, integrity and availability of information belonging to us and our customers, our security measures may not provide absolute security. Despite our efforts to ensure the integrity of our systems, it is possible that we may not be able to anticipate or to implement effective preventive measures against all security breaches of these types, especially because the techniques used change frequently or are not recognized until launched, and because cyber-attacks can originate from a wide variety of sources, including third parties outside the Company such as persons who are involved with organized crime or associated with external service providers or who may be linked to terrorist organizations or hostile foreign governments. These risks may increase in the future as we continue to increase our mobile and other internet-based product offerings and expand our internal usage of web-based products and applications or expand into new countries. If an actual or perceived breach of security occurs, customer and/or supplier perception of the effectiveness of our security measures could be harmed and could result in the loss of customers, suppliers or both. Actual or anticipated attacks and risks may cause us to incur increasing costs, including costs to deploy additional personnel and protection technologies, train employees, and engage third-party experts and consultants.
A successful penetration or circumvention of the security of our systems could cause serious negative consequences, including significant disruption of our operations, misappropriation of our confidential information or that of our customers, or damage to our computers or systems or those of our customers and counterparties, and could result in violations of applicable privacy and other laws, financial loss to us or to our customers, loss of confidence in our security measures, customer dissatisfaction, significant litigation exposure, and harm to our reputation, all of which could have a material adverse effect on us. In addition, our applicants provide personal information, including bank account information when applying for loans. We rely on encryption and authentication technology licensed from third parties to provide the security and authentication to effectively secure transmission of confidential information, including customer bank account and other personal information. Advances in computer capabilities, new discoveries in the field of cryptography or other developments may result in the technology used by us to protect transaction data being breached or compromised. Data breaches can also occur as a result of non-technical issues.
45
Our servers are also vulnerable to computer viruses, physical or electronic break-ins, and similar disruptions, including “denial-of-service” type attacks. We may need to expend significant resources to protect against security breaches or to address problems caused by breaches. Security breaches, including any breach of our systems or by persons with whom we have commercial relationships that result in the unauthorized release of consumers’ personal information, could damage our reputation and expose us to a risk of loss or litigation and possible liability. In addition, many of the third parties who provide products, services or support to us could also experience any of the above cyber risks or security breaches, which could impact our customers and our business and could result in a loss of customers, suppliers or revenues.
In addition, federal and some state regulators are considering promulgating rules and standards to address cybersecurity risks and many US states and the UK have already enacted laws requiring companies to notify individuals of data security breaches involving their personal data. These mandatory disclosures regarding a security breach are costly to implement and may lead to widespread negative publicity, which may cause customers to lose confidence in the effectiveness of our data security measures.
Any of these events could have a material adverse effect on our business, prospects, results of operations, financial condition or cash flows.
Our ability to collect payment on loans and maintain accurate accounts may be adversely affected by computer viruses, physical or electronic break-ins, technical errors and similar disruptions.
The automated nature of our platform may make it an attractive target for hacking and potentially vulnerable to computer viruses, physical or electronic break-ins and similar disruptions. Despite efforts to ensure the integrity of our platform, it is possible that we may not be able to anticipate or to implement effective preventive measures against all security breaches of these types, in which case there would be an increased risk of fraud or identity theft, and we may experience losses on, or delays in the collection of amounts owed on, a fraudulently induced loan. In addition, the software that we have developed to use in our daily operations is highly complex and may contain undetected technical errors that could cause our computer systems to fail. Because each loan made involves our proprietary credit and fraud scoring models, and over 95% of loan applications are fully automated with no manual review required, any failure of our computer systems involving our proprietary credit and fraud scoring models and any technical or other errors contained in the software pertaining to our proprietary credit and fraud scoring models could compromise the ability to accurately evaluate potential customers, which would negatively impact our results of operations. Furthermore, any failure of our computer systems could cause an interruption in operations and result in disruptions in, or reductions in the amount of, collections from the loans we made to customers. If any of these risks were to materialize, it could have a material adverse effect on our business, prospects, results of operations, financial condition or cash flows.
Our platform and internal systems rely on software that is highly technical, and if it contains undetected errors, our business could be adversely affected.
Our platform and internal systems rely on software that is highly technical and complex. In addition, our platform and internal systems depend on the ability of such software to store, retrieve, process and manage immense amounts of data. The software on which we rely has contained, and may now or in the future contain, undetected errors or bugs. Some errors may only be discovered after the code has been released for external or internal use. Errors or other design defects within the software on which we rely may result in a negative experience for borrowers, delay introductions of new features or enhancements, result in errors or compromise our ability to protect borrower data or our intellectual property. Any errors, bugs or defects discovered in the software on which we rely could result in harm to our reputation, loss of borrowers, loss of revenues or liability for damages, any of which could have a material adverse effect on our business, prospects, results of operations, financial condition or cash flows.
46
To date, we have derived our revenues from a limited number of products and markets. Our efforts to expand our market reach and product portfolio may not succeed or may put pressure on our margins.
In the future, we may elect to pursue new products, channels, or markets. For example, among other potential new products, we are starting to assess a flexible line of credit concept to meet a customer's month-to-month credit needs. However, there is always risk that these new products, channels, or markets will be unprofitable, will increase costs, decrease margins, or take longer to generate target margins than anticipated. Additional costs could include those related to the need to hire more staff, invest in technology, develop and support new third-party partnerships or other costs which would increase operating expenses. In particular, growth may require additional technology staff, analysts in risk management, compliance personnel and customer support and collections staff. Although the Company outsources most of its customer support and collections staff, additional volumes would lead to increased costs in these areas.
When new customers are acquired, from an accounting point of view, we must recognize marketing costs and loan origination and data costs, and we incur a provision for loan losses, including with regard to Elastic loan participations that are purchased from the originating lender by a third party, which we protect from loan losses pursuant to a credit default protection arrangement. Because of this, new customer acquisition does not typically yield positive margins for at least six months. As a result, rapid growth tends to compress margins in the near-term until growth rates slow down.
Rise, a state-licensed product, offers different rates and terms based on state law. In states with lower maximum rates, we have more stringent credit criteria and generally lower initial customer profitability due to higher customer acquisition costs and higher losses as a percentage of revenues. While these states can have significant growth potential, they typically deliver lower profit margins.
We may elect to pursue aggressive growth over margin expansion in order to increase market share and long-term revenue opportunities.
There also can be no guarantee that we will be successful with respect to any new product initiatives or any further expansion beyond the US and the UK, if we decide to attempt such expansion, which may inhibit the growth of our business and have a material adverse effect on our business, prospects, results of operations, financial condition or cash flows.
Our allowance for loan losses is determined based upon both objective and subjective factors and may not be adequate to absorb loan losses. If we experience rising credit or fraud losses, our results of operations would be adversely affected.
We face the risk that customers will fail to repay their loans in full. We reserve for such losses by establishing an allowance for loan losses, the increase of which results in a charge to our earnings as a provision for loan losses. We have established a methodology designed to determine the adequacy of our allowance for loan losses. While this evaluation process uses historical and other objective information, the classification of loans and the forecasts and establishment of loan losses are also dependent on our subjective assessment based upon our experience and judgment. Actual losses are difficult to forecast, especially if such losses stem from factors beyond our historical experience. As a result, there can be no assurance that our allowance for loan losses will be sufficient to absorb losses or prevent a material adverse effect on our business, financial condition and results of operations. Losses are the largest cost as a percentage of revenues across all of our products. Fraud and customers not being able to repay their loans are both significant drivers of loss rates. If we experienced rising credit or fraud losses this would significantly reduce our earnings and profit margins and could have a material adverse effect on our business, prospects, results of operations, financial condition or cash flows.
Increased customer acquisition costs and/or data costs would reduce our margins.
Although losses are our largest cost, if customer acquisition costs or other servicing costs increased this would reduce our profit margins. Marketing costs would be negatively affected by increased competition or stricter credit standards that would reduce customer fund rates. We could also experience increased marketing costs due to higher fees from credit bureaus for preapproved direct mail lists, search engines for search engine marketing, or fees for affiliates, and these increased costs would reduce our profit margins.
We purchase significant amounts of data to facilitate our proprietary credit and fraud scoring models. If there was an increase in the cost of data or if the Company elected to purchase from new data providers there would be a reduction in our profit margins.
Any such reduction in our profit margins could result in a material adverse effect on our business, prospects, results of operations, financial condition or cash flows.
47
Our success is dependent, in part, upon our officers and key employees, and if we are not able to attract and retain qualified officers and key employees, or if one of our officers or key employees is temporarily unable to fully contribute to our operations, our business could be materially adversely affected.
Our success depends, in part, on our officers, which comprise a relatively small group of individuals. Many members of the senior management team have significant industry experience, and we believe that our senior management would be difficult to replace, if necessary. Because the market for qualified individuals is highly competitive, we may not be able to attract and retain qualified officers or candidates. In addition, increasing regulations on, and negative publicity about, the consumer financial services industry could affect our ability to attract and retain qualified officers. Kenneth E. Rees, our Chief Executive Officer, is a competitive cyclist. Although we maintain key-man life insurance, such insurance may not be sufficient to compensate us for losses if Mr. Rees were injured in a cycling accident, or otherwise, and unable to be fully active in the business while recuperating, and, additionally, in the event we lose Mr. Rees' services, we could face an event of default under the VPC Facility, any of which could have a material adverse effect on our business, prospects, results of operations, financial condition or cash flows.
Our future success also depends on our continuing ability to attract, develop, motivate and retain highly qualified and skilled employees. Qualified individuals are in high demand, and we may incur significant costs to attract and retain them. The loss of any of our senior management or key employees could materially adversely affect our ability to execute our business plan and strategy, and we may not be able to find adequate replacements on a timely basis, or at all. We cannot ensure that we will be able retain the services of any members of our senior management or other key employees. Our officers and key employees may terminate their employment relationship with us at any time, and their knowledge of our business and industry would be extremely difficult to replace. While all key employees have signed non-disclosure, non-solicitation and non-compete agreements, they may still elect to leave the Company or even retire any time. Loss of key employees could result in delays to critical initiatives and the loss of certain capabilities and poorly documented intellectual property.
If we do not succeed in attracting and retaining our officers and key employees, our business could be materially and adversely affected.
Our US loan business is seasonal in nature, which causes our revenues and earnings to fluctuate.
Our US loan business is affected by fluctuating demand for the products and services we offer and fluctuating collection rates throughout the year. Demand for our consumer loan products in the US has historically been highest in the third and fourth quarters of each year, corresponding to the holiday season, and lowest in the first quarter of each year, corresponding to our customers’ receipt of income tax refunds. This results in significant increases and decreases in portfolio size and profit margins from quarter to quarter. In particular, we typically experience a reduction in our credit portfolios and an increase in profit margins in the first quarter of the year. When we experience higher growth in the second quarter through fourth quarters, portfolio balances tend to grow and profit margins are compressed. Our cost of sales for the non-prime loan products we offer in the US, which represents our provision for loan losses, is lowest as a percentage of revenues in the first quarter of each year, corresponding to our customers’ receipt of income tax refunds, and increases as a percentage of revenues for the remainder of each year. This seasonality requires us to manage our cash flows over the course of the year. If our revenues or collections were to fall substantially below what we would normally expect during certain periods, our ability to service debt and meet our other liquidity requirements may be adversely affected, which could have a material adverse effect on our business, prospects, results of operations, financial condition or cash flows.
If internet search engine providers change their methodologies for organic rankings or paid search results, or our organic rankings or paid search results decline for other reasons, our new customer growth or volume from returning customers could decline.
Our new customer acquisition marketing and our returning customer relationship management is partly dependent on search engines such as Google, Bing and Yahoo! to direct a significant amount of traffic to our desktop and mobile websites via organic ranking and paid search advertising. We bid on certain keywords from search engines as well as use their algorithms to place our listings ahead of other lenders.
Our paid search activities may not continue to produce the desired results. Internet search engines often revise their methodologies. The volume of customers we receive through organic ranking and paid search could be adversely affected by any such changes in methodologies or policies by search engine providers, by:
• | decreasing our organic rankings or paid search results; |
• | creating difficulty for our customers in using our web and mobile sites; |
48
• | producing more successful organic rankings, paid search results or tactical execution efforts for our competitors than for us; and |
• | resulting in higher costs for acquiring new or returning customers. |
In addition, search engines could implement policies that restrict the ability of companies such as us to advertise their services and products, which could prevent us from appearing in a favorable location or any location in the organic rankings or paid search results when certain search terms are used by the consumer. Our online marketing efforts are also susceptible to actions by third parties that negatively impact our search results such as spam link attacks, which are often referred to as “black hat” tactics. Our sites have experienced meaningful fluctuations in organic rankings and paid search results in the past, and we anticipate similar fluctuations in the future. Any reduction in the number of consumers directed to our web and mobile sites could harm our business and operating results.
Finally, our competitors’ paid search, pay per click or search engine marketing activities may result in their sites receiving higher paid search results than ours and significantly increasing the cost of such advertising for us. We have little to no control over these potential changes in policy and methodologies relating to search engine results, and any of the changes described above could have a material adverse effect on our business, prospects, results of operations, financial condition or cash flows.
Failure to keep up with the rapid technological changes in financial services and e-commerce, or changes in the uses and regulation of the internet could harm our business.
The financial services industry is undergoing rapid technological changes, with frequent introductions of new technology-driven products and services. The effective use of technology increases efficiency and enables financial and lending institutions to better serve customers and reduce costs. Our future success will depend, in part, upon our ability to address the needs of our customers by using technology to provide products and services that will satisfy customer demands for convenience, as well as to create additional efficiencies in our operations. We may not be able to effectively implement new technology-driven products and services as quickly as some of our competitors or be successful in marketing these products and services to our customers. Failure to successfully keep pace with technological change affecting the financial services industry could harm our ability to compete with our competitors.
Additionally, the business of providing products and services such as ours over the internet is dynamic and relatively new. We must keep pace with rapid technological change, consumer use habits, internet security risks, risks of system failure or inadequacy, and governmental regulation and taxation, and each of these factors could adversely impact our business. In addition, concerns about fraud, computer security and privacy and/or other problems may discourage additional consumers from adopting or continuing to use the internet as a medium of commerce. Also, to expand our customer base, we may elect to appeal to and acquire consumers who prove to be less profitable than our previous customers, and as a result we may be unable to gain efficiencies in our operating costs, including our cost of acquiring new customers, and our business could be adversely impacted.
Any such failure to adapt to changes could have a material adverse effect on our business, prospects, results of operations, financial condition or cash flows.
Our ability to conduct our business and demand for our loans could be disrupted by natural or man-made catastrophes.
Catastrophes, such as fires, hurricanes and tornadoes, floods, earthquakes, or other natural disasters, terrorist attacks, computer viruses and telecommunications failures, could adversely affect our ability to market, originate or service loans. Natural disasters and acts of terrorism, war, civil unrest, violence or human error could also cause disruptions to our business or the economy as a whole, which could negatively affect customers’ demand for our loans. Despite any precautions we may take, system interruptions and delays could occur if there is a natural disaster that affects our offices or one of the data center facilities we lease. As we rely heavily on our servers, computer and communications systems and the internet to conduct our business and provide high-quality customer service, such disruptions could harm our ability to market our products, accept and underwrite applications, provide customer service and undertake collections activities and cause lengthy delays which could harm our business, results of operations and financial condition. We have implemented a disaster recovery program that allows us to move production to a backup data center in the event of a catastrophe. Although this program is functional, we do not currently serve network traffic equally from each backup data center, and are not able to switch instantly to our backup center in the event of failure of the main server site. If our primary data center shuts down, there will be a period of time that our loan products or services, or certain of such loan products or services, will remain inaccessible to our users or our users may experience severe issues accessing such loan products and services. Our business interruption insurance may not be sufficient to compensate us for losses that may result from interruptions in our service as a result of system failures.
49
Any of these events could also cause consumer confidence to decrease in one or more of the markets we serve, which could result in a decreased number of loans being made to customers. As a result of these issues, any of these occurrences could have a material adverse effect on our business, prospects, results of operations, financial condition or cash flows.
We may be unable to protect our proprietary technology and analytics or keep up with that of our competitors.
The success of our business depends to a significant degree upon the protection of our proprietary technology, including our proprietary credit and fraud scoring models, which we use for pricing loans. We seek to protect our intellectual property with non-disclosure agreements and through standard measures to protect trade secrets. However, we may be unable to deter misappropriation of our proprietary information, detect unauthorized use or take appropriate steps to enforce our intellectual property rights. If competitors learn our trade secrets (especially with regard to marketing and risk management capabilities) it could be difficult to successfully prosecute to recover damages. A third party may attempt to reverse engineer or otherwise obtain and use our proprietary technology without our consent. The pursuit of a claim against a third party for infringement of our intellectual property could be costly, and there can be no guarantee that any such efforts would be successful. Our failure to protect our software and other proprietary intellectual property rights or to develop technologies that are as good as our competitors’ could put us at a disadvantage relative to our competitors. Any such failures could have a material adverse effect on our business, prospects, results of operations, financial condition or cash flows.
We are subject to intellectual property disputes from time to time, and such disputes may be costly to defend and could harm our business and operating results.
We have faced and may continue to face allegations that we have infringed the trademarks, copyrights, patents or other intellectual property rights of third parties, including from our competitors or non-practicing entities. Patent and other intellectual property litigation may be protracted and expensive, and the results are difficult to predict and may require us to stop offering certain products or product features, acquire licenses, which may not be available at a commercially reasonable price or at all, or modify such products, product features, processes or websites while we develop non-infringing substitutes.
In addition, we use open source software in our technology platform and plan to use open source software in the future. From time to time, we may face claims from parties claiming ownership of, or demanding release of, the source code, potentially including our valuable proprietary code, or derivative works that were developed using such software, or otherwise seeking to enforce the terms of the applicable open source license. These claims could also result in litigation, require us to purchase a costly license or require us to devote additional research and development resources to change our platform, any of which could have a material adverse effect on our business, prospects, results of operations, financial condition or cash flows.
Current and future litigation or regulatory proceedings could cause management distraction, harm our reputation and have a material adverse effect on our business, prospects, results of operations, financial condition or cash flows.
We, our officers and certain of our subsidiaries have been and may become subject to lawsuits that could cause us to incur substantial expenditures, generate adverse publicity and could significantly impair our business, force us to cease doing business in one or more jurisdictions or cause us to cease offering or alter one or more products. Additionally, our Chief Executive Officer is party to civil suits in California, Florida, North Carolina, Pennsylvania, Vermont and Virginia alleging violations of several statutes, including the Consumer Financial Protection Act of 2010, Federal Trade Commission Act, Electronic Funds Transfer Act, Racketeer Influenced and Corrupt Organizations Act and others.
We may also be subject to litigation in the future and an adverse ruling in or a settlement of any such future litigation against us, our executive officers or another lender, or against our Chief Executive Officer in connection with current litigation matters, could result in significant legal fees that could become material, could harm our reputation, cause us to have to refund fees and/or interest collected, forego collection of the principal amount of loans, pay treble or other multiple damages, pay monetary penalties and/or modify or terminate our operations in particular jurisdictions.
Defense of any lawsuit, even if successful, could require substantial time and attention of our management and could require the expenditure of significant amounts for legal fees and other related costs. We and others are also subject to regulatory proceedings, and we could suffer losses as a result of interpretations of applicable laws, rules and regulations in those regulatory proceedings, even if we are not a party to those proceedings. Any of these events could have a material adverse effect on our business, prospects, results of operations, financial condition or cash flows.
50
We may be unable to use some or all of our net operating loss carryforwards, which could materially and adversely affect our reported financial condition and results of operations.
At December 31, 2017, we had US and UK net operating loss carryforwards (“NOLs”) of $42.9 million and $22.5 million, respectively, available to offset future taxable income, due to prior period losses. If not utilized, the US NOLs will begin to expire in 2034. The UK NOLs can be carried forward indefinitely. Realization of these NOLs depends on future income, and there is a risk that our existing US NOLs could expire unused and be unavailable to offset future income tax liabilities, which could materially and adversely affect our results of operations.
Under Section 382 of the Internal Revenue Code of 1986, as amended (the “Code”), our ability to utilize NOLs or other tax attributes, such as research tax credits, in any taxable year may be limited if we experience an “ownership change.” A Section 382 “ownership change” generally occurs if one or more stockholders or groups of stockholders, who own at least 5% of our stock, increase their ownership by more than 50 percentage points over their lowest ownership percentage within a rolling three-year period. Similar rules may apply under state tax laws. We have not completed a Section 382 analysis through December 31, 2017. If we have previously had, or have in the future, one or more Section 382 “ownership changes,” including in connection with our IPO, or if we do not generate sufficient taxable income, we may not be able to utilize a material portion of our NOLs, even if we achieve profitability. If we are limited in our ability to use our NOLs in future years in which we have taxable income, we will pay more taxes than if we were able to fully utilize our NOLs. This could materially and adversely affect our results of operations.
RISKS RELATED TO OUR ASSOCIATION WITH TFI
Third parties may seek to hold us responsible for liabilities of TFI that we did not assume in our agreements.
In connection with our separation from TFI, TFI has generally agreed to retain all liabilities that did not historically arise from our business. Third parties may seek to hold us responsible for TFI’s retained liabilities, including third-party claims arising from TFI’s business and retained assets. Under the separation and distribution agreement, we are responsible for the debts, liabilities and other obligations related to the business or businesses that we own and operate. Under our agreements with TFI, TFI has agreed to indemnify us for claims and losses relating to its retained liabilities. However, if any of those liabilities are significant and we are ultimately held liable for such liabilities, we cannot assure you that we will be able to recover the full amount of our losses from TFI.
Although we do not anticipate liability for any obligations not expressly assumed by us pursuant to the separation and distribution agreement, it is possible that we could be required to assume responsibility for certain obligations retained by TFI should TFI fail to pay or perform its retained obligations. For instance, the spin-off could be challenged under various state and federal fraudulent conveyance laws. An unpaid creditor or an entity vested with the power of such creditor (such as a trustee or debtor-in-possession in a bankruptcy) could claim that the distribution left TFI insolvent or with unreasonably small capital or that TFI intended or believed it would incur debts beyond its ability to pay such debts as they mature and that TFI did not receive fair consideration or reasonably equivalent value in the spin-off. The measure of insolvency for purposes of such fraudulent conveyance laws will vary depending on which jurisdiction’s law is applied. Generally, however, an entity would be considered insolvent if either the fair saleable value of its assets is less than the amount of its liabilities (including the probable amount of contingent liabilities), or it is unlikely to be able to pay its liabilities as they become due. We do not know what standard a court would apply to determine insolvency; however, if a court were to conclude that the spin-off constituted a fraudulent conveyance, then such court could void the distribution as a fraudulent transfer and could impose a number of different remedies, including without limitation, returning our assets or your shares in our Company to TFI, voiding our liens and claims (if any) against TFI, or providing TFI with a claim for money damages against us in an amount equal to the difference between the consideration received by TFI and the fair market value of our Company at the time of the distribution.
51
The CFPB has authority to investigate and issue Civil Investigative Demands to consumer lending businesses, and may issue fines or corrective orders.
The Consumer Financial Protection Bureau (the "CFPB") has authority to investigate and issue Civil Investigative Demands (“CIDs”) to consumer lending businesses, including us. In June 2012, prior to the spin-off, and after the spin-off, TFI received CIDs from the CFPB. The purpose of the CIDs purportedly was to determine whether TFI engaged in unlawful acts or practices relating to the advertising, marketing, provision, or collection of small-dollar loan products, in violation of parts of the Dodd-Frank Wall Street Reform and Consumer Protection Act (the “Dodd-Frank Act”), the Truth in Lending Act, the Electronic Funds Transfer Act, the Gramm-Leach-Bliley Act, or any other federal consumer financial law and to determine whether CFPB action to obtain legal or equitable relief would be in the public interest. On November 15, 2017, the CFPB sued TFI alleging it engaged in unfair, deceptive, or abusive acts or practices. While TFI’s business is distinct from our business, we cannot predict the final outcome of this litigation or to what extent any obligations arising out of such final outcome will be applicable to our Company, business or officers, if at all.
OTHER RISKS RELATED TO COMPLIANCE AND REGULATION
We, our marketing affiliates, our third-party service providers and Republic Bank, which originates Elastic, the line of credit product, are subject to complex federal, state and local lending and consumer protection laws, and if we fail to comply with applicable laws, regulations, rules and guidance, our business could be adversely affected.
We, our marketing affiliates, our third-party service providers and Republic Bank, which originates Elastic, the line of credit product, must comply with US federal, state and local regulatory regimes, including those applicable to consumer credit transactions. Certain US federal and state laws generally regulate interest rates and other charges and require certain disclosures. In particular, we may be subject to laws such as:
• | local regulations and ordinances that impose requirements or restrictions related to certain loan product offerings and collection practices; |
• | state laws and regulations that impose requirements related to loan or credit service disclosures and terms, credit discrimination, credit reporting, debt servicing and collection; |
• | the Truth in Lending Act and Regulation Z promulgated thereunder, and similar state laws, which require certain disclosures to borrowers regarding the terms and conditions of their loans and credit transactions; |
• | Section 5 of the Federal Trade Commission Act, which prohibits unfair and deceptive acts or practices in or affecting commerce, Section 1031 of the Dodd-Frank Act, which prohibits unfair, deceptive or abusive acts or practices in connection with any consumer financial product or service, and similar state laws that prohibit unfair and deceptive acts or practices; |
• | the Equal Credit Opportunity Act and Regulation B promulgated thereunder and state non-discrimination laws, which generally prohibit creditors from discriminating against credit applicants on the basis of race, color, sex, age, religion, national origin, marital status, the fact that all or part of the applicant’s income derives from any public assistance program or the fact that the applicant has in good faith exercised any right under the federal Consumer Credit Protection Act; |
• | the Fair Credit Reporting Act (the “FCRA”) as amended by the Fair and Accurate Credit Transactions Act, and similar state laws, which promote the accuracy, fairness and privacy of information in the files of consumer reporting agencies; |
• | the Fair Debt Collection Practices Act (the “FDCPA”) and similar state and local debt collection laws, which provide guidelines and limitations on the conduct of third-party debt collectors and creditors in connection with the collection of consumer debts; |
• | the Gramm-Leach-Bliley Act and Regulation P promulgated thereunder and similar state privacy laws, which include limitations on financial institutions’ disclosure of nonpublic personal information about a consumer to nonaffiliated third parties, in certain circumstances require financial institutions to limit the use and further disclosure of nonpublic personal information by nonaffiliated third parties to whom they disclose such information and require financial institutions to disclose certain privacy policies and practices with respect to information sharing with affiliated and nonaffiliated entities as well as to safeguard personal customer information, and other privacy laws and regulations; |
• | the Bankruptcy Code and similar state insolvency laws, which limit the extent to which creditors may seek to enforce debts against parties who have filed for bankruptcy protection; |
52
• | the Servicemembers Civil Relief Act and similar state laws, which allow military members and certain dependents to suspend or postpone certain civil obligations, as well as limit applicable rates, so that the military member can devote his or her full attention to military duties; |
• | the Military Lending Act and Department of Defense rules, which limit the interest rate and fees that may be charged to military members and their dependents, requires certain disclosures and prohibits certain mandatory clauses among other restrictions; |
• | the Electronic Fund Transfer Act and Regulation E promulgated thereunder, which provide disclosure requirements, guidelines and restrictions on the electronic transfer of funds from consumers’ asset accounts; |
• | the Electronic Signatures in Global and National Commerce Act and similar state laws, particularly the Uniform Electronic Transactions Act, which authorize the creation of legally binding and enforceable agreements utilizing electronic records and signatures and, with consumer consent, permits required disclosures to be provided electronically; |
• | the Bank Secrecy Act, which relates to compliance with anti-money laundering, customer due diligence and record-keeping policies and procedures; and |
• | the Telephone Consumer Protection Act (the "TCPA") and the regulations of the Federal Communications Commission (the "FCC"), which regulations include limitations on telemarketing calls, auto-dialed calls, prerecorded calls, text messages and unsolicited faxes. |
While it is our intention to always be in compliance with these laws, it is possible that we may currently be, or at some time have been, inadvertently out of compliance with some or any such laws. Further, all applicable laws are subject to evolving regulatory and judicial interpretations, which further complicate real-time compliance. Lastly, compliance with these laws is costly, time-consuming and limits our operational flexibility.
Failure to comply with these laws and regulatory requirements applicable to our business may, among other things, limit our or a collection agency’s ability to collect all or part of the principal of or interest on loans. As a result, we may not be able to collect on unpaid principal or interest. In addition, non-compliance could subject us to damages, revocation of required licenses, class action lawsuits, administrative enforcement actions, rescission rights held by investors in securities offerings and civil and criminal liability, which may harm our business and may result in borrowers rescinding their loans.
Where applicable, we seek to comply with state installment, CSO, servicing and similar statutes. In all US jurisdictions with licensing or other requirements that we believe may be applicable to us, we comply with the relevant requirements by acquiring the necessary licenses or authorization and submitting appropriate registrations in connection therewith. Nevertheless, if we are found to not have complied with applicable laws, we could lose one or more of our licenses or authorizations or face other sanctions or penalties or be required to obtain other licenses or authorizations in such jurisdiction, which may have an adverse effect on our ability to perform our servicing obligations or make products or services available to borrowers in particular states, which may harm our business.
Our products currently have usage caps and limitations on lending based on internally developed “responsible lending guidelines.” If those policies become more restrictive due to legislative or regulatory changes at either the local, state, US federal, or UK regulatory level these products would experience declining revenues per customer.
The CFPB may have examination authority over our US consumer lending business that could have a significant impact on our US business.
In July 2010, the US Congress passed the Dodd-Frank Act. Title X of the Dodd-Frank Act created the CFPB, which regulates US consumer financial products and services, and gave it regulatory, supervisory and enforcement powers over certain providers of consumer financial products and services, including authority to examine such providers.
The CFPB is currently considering rules to define larger participants in markets for consumer installment loans for purposes of supervision. Once this rule and corresponding examination rules are established, we anticipate the CFPB will examine us. The CFPB’s examination authority permits CFPB examiners to inspect the books and records of providers, and ask questions about their business practices. The examination procedures include specific modules for examining marketing activities, loan application and origination activities, payment processing activities and sustained use by consumers, collections, accounts in default, consumer reporting activities and third-party relationships. As a result of these examinations, we could be required to change our products, our services or our practices, whether as a result of another party being examined or as a result of an examination of us, or we could be subject to monetary penalties, which could reduce profit margins for the company or otherwise materially adversely affect us.
53
Furthermore, the CFPB’s practices and procedures regarding civil investigations, examination, enforcement and other matters relevant to us and other CFPB-regulated entities are subject to further development and change. Where the CFPB holds powers previously assigned to other regulators or may interpret laws previously interpreted by other regulators, the CFPB may not continue to apply such powers or interpret relevant concepts consistent with previous regulators’ practice. This may adversely affect our ability to anticipate the CFPB’s expectations or interpretations in our interaction with the CFPB.
The CFPB also has broad authority to prohibit unfair, deceptive and abusive acts and practices and to investigate and penalize financial institutions that violate this prohibition. In addition to having the authority to obtain monetary penalties for violations of applicable federal consumer financial laws (including the CFPB’s own rules), the CFPB can require remediation of practices, pursue administrative proceedings or litigation and obtain cease and desist orders (which can include orders for restitution or rescission of contracts, as well as other kinds of affirmative relief). Also, where a company is believed to have violated Title X of the Dodd-Frank Act or CFPB regulations implemented thereunder, the Dodd-Frank Act empowers state attorneys general and state regulators to bring civil actions to remedy such violations after consulting with the CFPB. If the CFPB or one or more state attorneys general or state regulators believe that we have violated any of the applicable laws or regulations, they could exercise their enforcement powers in ways that could have a material adverse effect on our business, prospects, results of operations, financial condition or cash flows.
Lastly, on June 8, 2017, the House Financial Services Committee passed the Financial CHOICE Act which would replace the Dodd-Frank Act. It calls for removal of authority to regulate small-dollar credit, repeals authority to restrict arbitration, and would eliminate CFPB’s authority to prohibit unfair, deceptive and abusive acts and practices. It is unknown what the outcome of this legislation will be or its impact to Elevate’s operations. The House version of the Financial CHOICE Act is still pending before the Senate.
The CFPB issued final rules affecting the consumer lending industry, and these or subsequent new rules and regulations, if they are finalized, may impact our US consumer lending business.
The CFPB released its final “Payday, Vehicle Title, and Certain High-Cost Lending Rule” ("Rule") on October 5, 2017. The final rule applies to: short-term loans with a term of 45 days or less, longer-term balloon payment loans, and longer-term loans that have an APR of 36% or higher and have a “leveraged payment mechanism” such as an ACH payment plan. Under the final rule, we are required to provide a written notice before we attempt to withdraw a payment and before subsequent attempts that deviate from the scheduled amounts or dates or involve a different payment mechanism. Additionally, when two consecutive withdrawal attempts have failed due to insufficient funds, we are required to obtain a new authorization to make further withdrawals before another withdrawal is attempted. There are also recordkeeping requirements that will be new for us under the rule. The Rule became effective on January 16, 2018 but the compliance date for the above provisions is August 19, 2019. Notably, on January16, 2018, the CFPB announced that it "intends to engage in a rulemaking process so that the Bureau may reconsider the Payday Rule." This announcement follows the December 2017 introduction in the House of Representatives of a bipartisan resolution to disapprove of the Rule under the Congressional Review Act. It is unknown what the outcome of this rulemaking process or Congressional Review Act resolution will be or its impact to Elevate's operations.
The CFPB’s Fall 2017 Agency Rule List, posted on the Office of Information and Regulatory Affairs of the Office of Management and Budget’s website, lists certain rules noted below that may impact Elevate’s operations along with the stage of development and estimated date for issuance of a Notice of Proposed Rule Making:
• | Debt Collection Rule - concerning FDCPA collectors’ communications practices and consumer disclosures; in the Proposed Rule Stage with a stated date of February 2018 for the issuance of the Notice of Proposed Rulemaking. |
• | Supervision of Larger Participants in Markets for Personal Loans - defining larger participants in the market for personal loans including consumer installment loans and vehicle title loans for purposes of supervision; in the Proposed Rule Stage with a stated date of May 2018 for the issuance of the Notice of Proposed Rulemaking. |
54
Since the CFPB’s Fall 2017 Agency Rule List was posted, Mick Mulvaney was appointed as the Acting Director of the CFPB. As a result, it is unknown whether these timelines are still accurate and also what the outcome of this rulemaking process would be on the oversight of Elevate’s operations. There is controversy surrounding the leadership of the CFPB. Leandra English was elevated as Acting Deputy Director by Richard Cordray before he resigned in November 2017. Subsequently, the Trump Administration appointed Mick Mulvaney as Acting Director. Ms. English sued President Trump and Mr. Mulvaney to prevent Mr. Mulvaney from running the CFPB. Currently, Ms. English is appealing an Order denying her motion for a preliminary injunction. On January 23, 2018, the D.C. Circuit Court of Appeals granted Ms. English’s motion for an expedited review of her appeal. Briefing is scheduled to be complete by March 6, 2018. We do not know when the court will issue its ruling on the appeal and it is not clear what impact this case will have on the power and structure of the CFPB and the oversight of Elevate’s business.
On January 31, 2018, the D.C. Circuit court, sitting en banc, decided that the CFPB’s structure—featuring a single director whom the President may remove only for cause—was constitutional. It is not clear what impact this case will have on the oversight of Elevate’s business.
On February 13, 2018, the CFPB issued its Strategic Plan for Fiscal Years 2018-2022 outlining its three strategic goals:
• | Ensure that all consumers have access to markets for consumer financial products and services; |
• | Implement and enforce the law consistently to ensure that markets for consumer financial products and services are fair, transparent, and competitive; and |
• | Foster operational excellence through efficient and effective processes, governance, and security of resources and information. |
It is unclear what impact this Strategic Plan will have on the oversight of Elevate’s business.
Lastly, the Bureau has issued or anticipates issuing Requests for Information ("RFIs") on the following topics: CIDs, Use of Administrative Adjudications, Enforcement, Supervision, External Engagement, Complaint Reporting, Rulemaking Processes, Bureau Rules Not Under §1022(d) Assessment, Inherited Rules, Guidance and Implementation Support, Consumer Education and Consumer Inquiries. It is unclear what impact, if any, the findings or outcomes of the RFIs will have on the oversight of Elevate’s business.
The FDIC has issued examination guidance affecting banks, such as Republic Bank, which originates the Elastic product, and these or subsequent new rules and regulations could have a significant impact on the Elastic product.
The Elastic line of credit product is offered by Republic Bank using technology, underwriting and marketing services provided by Elevate. Republic Bank is supervised and examined by the FDIC. If the FDIC considers any aspect of the Elastic product to be inconsistent with its guidance, Republic Bank may be required to alter the product.
On July 29, 2016, the board of directors of the FDIC released examination guidance relating to third-party lending as part of a package of materials designed to “improve the transparency and clarity of the FDIC’s supervisory policies and practices” and consumer compliance measures that FDIC-supervised institutions should follow when lending through a business relationship with a third party. The proposed guidance, if finalized, would apply to all FDIC-supervised institutions that engage in third-party lending programs, such as Elastic.
The proposed guidance elaborates on previously issued agency guidance on managing third-party risks and specifically addresses third-party lending arrangements where an FDIC-supervised institution relies on a third party to perform a significant aspect of the lending process. The types of relationships that would be covered by the guidance include (but are not limited to) relationships for originating loans on behalf of, through or jointly with third parties, or using platforms developed by third parties. If adopted as proposed, the guidance would result in increased supervisory attention of institutions that engage in significant lending activities through third parties, including at least one examination every 12 months, as well as supervisory expectations for a third-party lending risk management program and third-party lending policies that contain certain minimum requirements, such as self-imposed limits as a percentage of total capital for each third-party lending relationship and for the overall loan program, relative to origination volumes, credit exposures (including pipeline risk), growth, loan types, and acceptable credit quality. Comments on the guidance were due October 27, 2016.
55
The Trump Administration has nominated Jelena McWilliams to be Chair of the FDIC to replace Martin Gruenberg, whose term as Chair expired in November 2017. Mr. Gruenberg is eligible to remain on the FDIC board but has not yet said if he will retire once his successor as chair is confirmed. At this time, it is unclear what impact the incoming Chair will have on the FDIC's third-party lending policy.
The UK has imposed, and continues to impose, increased regulation of the high-cost short-term credit industry with the stated expectation that some firms will exit the market.
In the UK, we are subject to regulation by the Financial Conduct Authority (the "FCA") pursuant to the Financial Services and Markets Act 2000 (the “FSMA”), the Consumer Credit Act 1974, as amended (the “CCA”), and secondary legislation passed under such statutes, among other rules and regulations including the FCA Handbook, which collectively serve to transpose the obligations under the European Consumer Credit Directive into UK law.
The FSMA gives the FCA the power to authorize, supervise, examine, bring enforcement actions and impose fines and disciplinary sanctions against providers of consumer credit, as well as to make rules for the regulation of consumer credit. The Consumer Credit Sourcebook (the "CONC") incorporates prescriptive regulations for consumer loans such as those that we offer, including mandatory affordability checks on borrowers, limiting the number of refinances, or “rollovers,” to two, restricting how lenders can advertise, banning advertisements that the FCA deems misleading, and introducing a limit of two unsuccessful attempts on the use of continuous payment authority ("CPA") (which provides a creditor the ability to directly debit a customer’s account for payment using their bank card details when authorized by the customer to do so) to pay off a loan. The UK also has strict regulations regarding advertising (including websites) and the presentation, form and content of loan agreements, including statutory warnings, the layout of prescribed financial information, as well as in relation to defaulted loans and collections activities.
In the period since the FCA acquired responsibility for the regulation of consumer credit in the UK in place of the Office of Fair Trading (the "OFT") in April 2014, there have been a large number of new regulations affecting our UK product offerings. These include the introduction of a rate cap, a prohibition on certain types of line of credit products, the establishment of a price comparison website, and restrictions on payment processing activities, among other changes. The rate cap imposes a maximum interest rate of 0.8% per day and maximum late payment fee of £15; the total amount charged for the loan, including all default charges, must not exceed 100% of the capital sum originally borrowed. This rule translates to a maximum rate of £24 for every £100 borrowed for a 30 day period, or 0.8% per day. The maximum fees that can be earned on the loan (through interest, default fees, and late interest) ensure that a consumer cannot pay back more than twice the amount of principal borrowed. In July 2016, the FCA announced that it had reviewed the impact of the 0.8% per day price cap and concluded that the current price cap will be left in place. The FCA will review the price cap again in 2020. In the meantime, the FCA is monitoring whether there are any unintended consequences of the price cap emerging for firms or consumers, including the impact on people no longer able to access high-cost short-term credit.
During the years ended December 31, 2017 and 2016, our UK operations represented 15% and 17%, respectively, of our consolidated total revenues. The results for each of these periods may not be indicative of our future results of operations and cash flows from our operations in the UK.
The changes that we have implemented or any changes we may be required to implement in the future as a result of such legislative and regulatory activities could have a material adverse effect on our UK business.
Additionally, in June 2013, the OFT referred the payday lending industry in the UK to the Competition Commission, which is now the Competition & Markets Authority (the “CMA”) for a market investigation. The CMA gathered data from industry participants, including us, in connection with its review of the UK payday lending industry to determine whether certain features of the payday lending industry prevent, restrict or distort competition (which is also referred to as having an adverse effect on competition) and, if so, what remedial action should be taken. The CMA published its final report in February 2015; its recommendations were implemented under the Payday Lending Market Investigation Order 2015, under which:
• | online lenders must provide details of their products on at least one FCA authorized price comparison website ("PCW”) and include a hyperlink from their website to the relevant PCW; and |
•payday lenders must provide existing customers with a summary of their cost of borrowing.
These changes, which are reflected in FCA rules, came into effect on December 1, 2016.
56
On November 29, 2016, the FCA issued a Call for Input seeking information from lenders including a review of the loan price cap that was implemented on January 2, 2015. On July 31, 2017, the FCA published the outcome of its review and at this time will not change the price cap. The next price cap review will be in three years. Further, the FCA found that regulation of high-cost short-term credit, including the price cap, has led to substantial benefits to consumers. The FCA validated concerns about specific products and segments of the high-cost credit market, including unarranged overdrafts and long-term use of high-cost credit and the rent-to-own, home-collected credit and catalog credit markets. The FCA plans further investigation of those products and segments and the issuance of a Consultation Paper in early to mid-2018. We do not know what recommendations the FCA may make or how any changes may affect our business operations. If any new rules or guidance significantly restrict the conduct of our business, such implementation could have a material adverse effect on our business, prospects, results of operations, financial condition and cash flows.
On July 31, 2017, the FCA issued a Consultation Paper on proposed changes to its rules and guidance on assessing creditworthiness in consumer credit. The FCA requested responses to the consultation by October 31, 2017 and expects to publish its findings in the second quarter of 2018. We do not currently know whether or how the FCA may amend its rules and guidance on assessing creditworthiness in consumer credit or how it will affect our business operations. If the FCA adopts rules that significantly restrict the conduct of our business, any such rules could have a material adverse effect on our business, prospects, results of operations, financial condition or cash flows or could make the continuance of all or part of our UK business impractical or unprofitable. Any new rules adopted by the FCA could also result in significant compliance costs.
In February 2016, the FCA issued full authorization to Elevate for our UK business. Similar to US federal and state regulatory regimes, the FCA has the power to revoke, suspend or impose conditions upon our authorization to conduct a consumer credit business if it determines we are out of compliance with applicable UK laws, high-cost short-term rules or other legal requirements ensuring fair treatment of consumers.
Our advertising and marketing materials and disclosures have been and continue to be subject to regulatory scrutiny, particularly in the UK.
In the jurisdictions where we operate, our advertising and marketing activities and disclosures are subject to regulation under various industry standards, consumer protection laws, and other applicable laws and regulations. Consistent with the consumer lending industry as a whole (see “—The consumer lending industry continues to be subjected to new laws and regulations in many jurisdictions that could restrict the consumer lending products and services we offer, impose additional compliance costs on us, render our current operations unprofitable or even prohibit our current operations” above), our advertising and marketing materials have come under increased scrutiny. In the UK, for example, consumer credit firms are subject to the financial promotions regime set out in the FSMA (Financial Promotions) Order 2005 and specific rules in the CONC, part 3, such as the inclusion of a risk warning on all advertising materials. The FCA has also decided to adopt certain elements of industry codes as FCA rules on a case by case basis. Our advertising and marketing materials in the UK are subject to review and regulation both by the FCA and the Advertising Standards Authority. We have in some cases been required to withdraw, amend or add disclosures to such materials, or have done so voluntarily in response to inquiries or complaints. Going forward, there can be no guarantee that we will be able to advertise and market our business in the UK or elsewhere in a manner we consider effective. Any inability to do so could have a material adverse effect on our business, prospects, results of operations, financial condition or cash flows.
57
The regulatory landscape in which we operate is continually changing due to new CFPB rules, regulations and interpretations, as well as various legal actions that have been brought against others in marketplace lending, including several lawsuits that have sought to re-characterize certain loans made by federally insured banks as loans made by third parties. If litigation on similar theories were brought against us when we work with a federally insured bank that makes loans, rather than making loans ourselves and were such an action to be successful, we could be subject to state usury limits and/or state licensing requirements, in addition to the state consumer protection laws to which we are already subject, in a greater number of states, loans in such states could be deemed void and unenforceable, and we could be subject to substantial penalties in connection with such loans.
The case law involving whether an originating lender, on the one hand, or third-parties, on the other hand, are the “true lenders” of a loan is still developing and courts have come to different conclusions and applied different analyses. The determination of whether a third-party service provider is the “true lender” is significant because third-parties risk having the loans they service becoming subject to a consumer’s state usury limits. A number of federal courts that have opined on the “true lender” issue have looked to who is the lender identified on the borrower’s loan documents. A number of state courts and at least one federal district court have considered a number of other factors when analyzing whether the originating lender or a third party is the “true lender,” including looking at the economics of the transaction to determine, among other things, who has the predominant economic interest in the loan being made. If we were re-characterized as a “true lender” with respect to Elastic, or Rise in Ohio or Texas, loans could be deemed to be void and unenforceable in some states, the right to collect finance charges could be affected, and we could be subject to fines and penalties from state and federal regulatory agencies as well as claims by borrowers, including class actions by private plaintiffs. Even if we were not required to change our business practices to comply with applicable state laws and regulations or cease doing business in some states, we could be required to register or obtain lending licenses or other regulatory approvals that could impose a substantial cost on us. If Republic Bank or the CSO lenders in Ohio or Texas were subject to such a lawsuit, they may elect to terminate their relationship with us voluntarily or at the direction of their regulators, and if they lost the lawsuit, they could be forced to modify or terminate the programs.
On August 31, 2016, the United States District Court for the Central District of California ruled in CFPB v. CashCall, Inc. et. al. that CashCall was the “true lender” and consequently was engaged in deceptive practices by servicing and collecting on payday loans in certain states where the interest rate on the loans exceeded the state usury limit and/or where CashCall was not a licensed lender. The CashCall case is related to a tribally related lending program. In reaching its decision, the court adopted a “totality of the circumstances” test to determine which party to the transaction had the “predominant economic interest” in the transaction. Given the fact-intensive nature of a “totality of the circumstances” assessment, the particular and varied details of marketplace lending and other bank partner programs may lead to different outcomes to those reached in CashCall, even in those jurisdictions where courts adopt the “totality of the circumstances” approach. Notably, CashCall did not address the federal preemption of state law under the National Bank Act or any other federal statute. Although CashCall is appealing the decision in the Ninth Circuit, on January 26, 2018, the District Court ordered CashCall to pay approximately $10.2 million in civil money penalties, but no consumer restitution. In issuing the judgment, which was significantly less than the $280 million the CFPB sought in penalties and consumer restitution, the Court found that CashCall had not knowingly or recklessly violated consumer protection laws, and that the CFPB had not demonstrated that consumer restitution was an appropriate remedy.
On September 20, 2016, in Beechum v. Navient Solutions, Inc., the United States District Court for the Central District of California dismissed a class action suit alleging usurious interest rates on private student loans in violation of California law. In doing so, the court rejected the plaintiff’s arguments that the defendants were the de facto “true lenders” of loans made by a national bank under a bank partnership arrangement with a non-bank partner. Consistent with the controlling judicial authority for challenges to the applicability of statutory or constitutional exemptions to California’s usury prohibition, the court determined that “it must look solely to the face of the transaction” in determining whether an exemption applies and did not apply the “totality of the circumstances” test.
In addition to true lender challenges, a question regarding the applicability of state usury rates may arise when a loan is sold from a bank to a non-bank entity. In Madden v. Midland Funding, LLC, the Court of Appeals for the Second Circuit held that the federal preemption of state usury laws did not extend to the purchaser of a loan issued by a national bank. In its brief urging the US Supreme Court to deny certiorari, the US Solicitor General, joined by the OCC, noted that the Second Circuit (Connecticut, New York and Vermont) analysis was incorrect. On remand, the United States District Court for the Southern District of New York concluded on February 27, 2017 that New York’s state usury law, not Delaware's state usury law, was applicable and that the plaintiff’s claims under the FDCPA and state unfair and deceptive acts and practices could proceed. To that end, the court granted Madden’s motion for class certification. At this time, it is unknown whether Madden will be applied outside of the defaulted debt context in which it arose. However, given the uncertainty that Madden created, H.R. 3299 was introduced to restore the “valid-when-made” doctrine to allow purchasers of bank loans on the secondary market to continue to charge and collect interest at the rate that the national was permitted to charge. H.R. 3299 passed the House in February 2018 and is pending before the Senate.
58
The facts in CashCall, Navient and Madden are not directly applicable to Elevate's business, as Elevate does not engage in practices similar to those at issue in CashCall, Navient or Madden, and Elevate does not purchase whole loans or engage in business in states within the Second Circuit. However, to the extent that either the holdings in CashCall or Madden were broadened to cover circumstances applicable to Elevate’s business, or if other litigation on related theories were brought against us and were successful, or we were otherwise found to be the "true lender," we could become subject to state usury limits and state licensing laws, in addition to the state consumer protection laws to which we are already subject, in a greater number of states, loans in such states could be deemed void and unenforceable, and we could be subject to substantial penalties in connection with such loans.
Recently, the Colorado Attorney General recently filed complaints in state court against marketplace lenders Marlette Funding LLC and Avant of Colorado LLC on behalf of the administrator of Colorado’s Uniform Consumer Credit Code (UCCC), alleging violations of the UCCC based on “true lender” and loan assignment cases with respect to lending programs sponsored by WebBank and Cross River Bank, respectively. The complaints allege that the non-bank service providers, Marlette Funding LLC and Avant of Colorado LLC - rather than WebBank and Cross River Bank, are the "true lenders," and therefore subject to Colorado usury limits. Both WebBank and Cross River Bank, responded to those actions by filing lawsuits seeking declaratory relief invalidating the administrator’s lawsuits and recognizing the banks’ continued legal ability to originate loans under interstate banking law. At this time, it is unknown what the outcome of these cases will be and whether any conclusions of law would be applied outside Colorado. Another marketplace lender, Kabbage, Inc. and its bank, Celtic Bank, have been sued in Massachusetts federal court with the defendant alleging that Kabbage, not Celtic Bank, is the “true lender.” In November 2017, H.R. 4439 was introduced in Congress to eliminate the uncertainties created by courts related to “true lender” and reinforces existing federal law with respect to a bank's identity as the true lender of a loan originated by a bank with the assistance of a third-party service provider.
We use third-party collection agencies to assist us with debt collection. Their failure to comply with applicable debt collection regulations could subject us to fines and other liabilities, which could harm our reputation and business.
The FDCPA regulates persons who regularly collect or attempt to collect, directly or indirectly, consumer debts owed or asserted to be owed to another person. Many states impose additional requirements on debt collection communications, and some of those requirements may be more stringent than the federal requirements. Moreover, regulations governing debt collection are subject to changing interpretations that differ from jurisdiction to jurisdiction. We use third-party collections agencies to collect on debts incurred by consumers of our credit products. Regulatory changes could make it more difficult for collections agencies to effectively collect on the loans we originate.
Non-US jurisdictions also regulate debt collection. For example, in the UK, due to new rules under the CONC we have made adjustments to some of our business practices, including our collections processes, which could possibly result in lower collections on loans made by us and has resulted in a decrease in the number of new customers that we are able to approve. In addition, the concerns expressed to us by the OFT and the FCA relate in part to debt collection. We could be subject to fines, written orders or other penalties if we, or parties working on our behalf, are determined to have violated the FDCPA, the CONC or analogous state or international laws, which could have a material adverse effect on our reputation, business, prospects, results of operations, financial condition or cash flows.
Our business is subject to complex and evolving US and international laws and regulations regarding privacy, data protection, and other matters. Many of these laws and regulations are subject to change and uncertain interpretation, and could result in claims, changes to our business practices, monetary penalties, increased cost of operations, or declines in user growth or engagement, or otherwise harm our business.
We receive, transmit and store a large volume of personally identifiable information and other sensitive data from customers and potential customers. Our business is subject to a variety of laws and regulations in the US and the UK that involve user privacy issues, data protection, advertising, marketing, disclosures, distribution, electronic contracts and other communications, consumer protection and online payment services. The introduction of new products or expansion of our activities in certain jurisdictions may subject us to additional laws and regulations. In addition, international data protection, privacy, and other laws and regulations can be more restrictive than those in the US. US federal and state and international laws and regulations, which can be enforced by private parties or government entities, are constantly evolving and can be subject to significant change.
59
A number of proposals are pending before federal, state, and international legislative and regulatory bodies that could impose new obligations in areas such as privacy. For example the European Union's new General Data Protection Regulation ("GDPR") will replace the existing Data Protection Directive (95/46/EC) and will be implemented in the UK in May 28, 2018. The GDPR is more prescriptive than the existing regime and includes new obligations on businesses, including the requirement to appoint a data protection officer, self-report breaches, obtain express consent to data processing and provide more rights to individuals whose data they process, including the "right to be forgotten," by having their records erased. Penalties for non-compliance are also significantly higher than the current maximum fine of £500,000. Under the GDPR, the maximum fine will be the higher of €20 million or 4% of global turnover for the preceding year.
In addition, the 4th European Union's anti-money laundering directive (2015/849/EC) came into effect in June 2017 and requires changes to customer due diligence assessments and greater focus on a risk based approach.
Some countries are also considering or have enacted legislation requiring local storage and processing of data that, if applicable to the markets in which we operate, would increase the cost and complexity of delivering our services. These existing and proposed laws and regulations can be costly to comply with and can delay or impede the development of new products, the expansion into new markets, result in negative publicity, increase our operating costs, require significant management time and attention, and subject us to inquiries or investigations, claims or other liabilities, including demands that we modify or cease existing business practices or pay fines, penalties or other damages.
It is difficult to assess the likelihood of the enactment of any future legislation or the impact that such rules and regulations could have on our business. We are operating on the basis, confirmed by the UK government and the FCA, that the decision of the UK to leave the European Union will not affect the implementation of the new European Union directives on data protection and anti-money laundering as outlined above.
The use of personal data in credit underwriting is highly regulated.
In the US the FCRA regulates the collection, dissemination and use of consumer information, including consumer credit information. Compliance with the FCRA and related laws and regulations concerning consumer reports has recently been under regulatory scrutiny. The FCRA requires us to provide a Notice of Adverse Action to a loan applicant when we deny an application for credit, which, among other things, informs the applicant of the action taken regarding the credit application and the specific reasons for the denial of credit. The FCRA also requires us to promptly update any credit information reported to a consumer reporting agency about a consumer and to allow a process by which consumers may inquire about credit information furnished by us to a consumer reporting agency. Historically, the FTC has played a key role in the implementation, oversight, enforcement and interpretation of the FCRA. Pursuant to the Dodd-Frank Act, the CFPB has primary supervisory, regulatory and enforcement authority of FCRA issues. Although the FTC also retains its enforcement role regarding the FCRA, it shares that role in many respects with the CFPB. The CFPB has taken a more active approach than the FTC, including with respect to regulation, enforcement and supervision of the FCRA. Changes in the regulation, enforcement or supervision of the FCRA may materially affect our business if new regulations or interpretations by the CFPB or the FTC require us to materially alter the manner in which we use personal data in our credit underwriting.
In the UK, we are currently subject to the requirements of the Data Protection Act 1998 (the “DPA”) and are required to be fully registered as a data-controller under the DPA and comply with industry guidance published by the regulator, the Information Commissioner. On May 28, 2018 the DPA will be replaced with the GDPR. As described above in "—Our business is subject to complex and evolving US and international laws and regulations regarding privacy, data protection, and other matters. Many of these laws and regulations are subject to change and uncertain interpretation, and could result in claims, changes to our business practices, monetary penalties, increased cost of operations, or declines in user growth or engagement or otherwise harm our business," the GDPR is more prescriptive than the existing regime and includes new obligations on businesses, including the requirement to appoint a data protection officer, self-report breaches, obtain express consent to data processing and provide more rights to individuals whose data they process, including the “right to be forgotten,” by having their records erased. Penalties for non-compliance are also significantly higher than the current maximum fine of £500 thousand. Under the GDPR, the maximum fine will be the higher of €20 million or 4% of global turnover for the preceding year. There are also strict rules on the use of credit reference data under the CCA regulations and the CONC. We are also subject to laws limiting the transfer of personal data from the European Economic Area to non-European Economic Area countries or territories. There are also strict rules on the instigation of electronic communications such as email, text message and telephone calls under the Privacy and Electronic Communications (EC Directive) Regulations 2003, which prohibit unsolicited direct marketing by electronic means without express consent, as well as the monitoring of devices.
The oversight of the FCRA by both the CFPB and the FTC and any related investigation or enforcement activities or our failure to comply with the DPA and GDPR may have a material adverse impact on our business, including our operations, our mode and manner of conducting business and our financial results.
60
Judicial decisions or amendments to the Federal Arbitration Act could render the arbitration agreements we use illegal or unenforceable.
We include arbitration provisions in our consumer loan agreements. These provisions are designed to allow us to resolve any customer disputes through individual arbitration rather than in court and explicitly provide that all arbitrations will be conducted on an individual and not on a class basis. Thus, our arbitration agreements, if enforced, have the effect of shielding us from class action liability. Our arbitration agreements do not generally have any impact on regulatory enforcement proceedings. We take the position that the arbitration provisions in our consumer loan agreements, including class action waivers, are valid and enforceable; however, the enforceability of arbitration provisions is often challenged in court. If those challenges are successful, our arbitration and class action waiver provisions could be unenforceable, which could subject us to additional litigation, including additional class action litigation.
Any judicial decisions, legislation or other rules or regulations that impair our ability to enter into and enforce consumer arbitration agreements and class action waivers could significantly increase our exposure to class action litigation as well as litigation in plaintiff-friendly jurisdictions, which would be costly and could have a material adverse effect on our business, prospects, results of operations, financial condition or cash flows.
We use marketing affiliates to assist us and the originating lender in obtaining new customers, and if such marketing affiliates do not comply with an increasing number of applicable laws and regulations, or if our ability to use such marketing affiliates is otherwise impaired, it could adversely affect our business.
We depend in part on marketing affiliates as a source of new customers for us and, with respect to the Elastic product, for the originating lender. Our marketing affiliates place our advertisements on their websites that direct potential customers to our websites. As a result, the success of our business depends in part on the willingness and ability of marketing affiliates to provide us customer referrals at acceptable prices.
If regulatory oversight of marketing affiliates relationships is increased, through the implementation of new laws or regulations or the interpretation of existing laws or regulations, our ability to use marketing affiliates could be restricted or eliminated.
Marketing affiliates’ failure to comply with applicable laws or regulations, or any changes in laws or regulations applicable to marketing affiliates relationships or changes in the interpretation or implementation of such laws or regulations, could have an adverse effect on our business and could increase negative perceptions of our business and industry. Additionally, the use of marketing affiliates could subject us to additional regulatory cost and expense. If our ability to use marketing affiliates were to be impaired, our business, prospects, results of operations, financial condition or cash flows could be materially adversely affected.
RISKS RELATED TO THE SECURITIES MARKETS AND OWNERSHIP OF OUR COMMON STOCK
The price of our common stock may be volatile and the value of your investment could decline.
Technology stocks have historically experienced high levels of volatility. The trading price of our common stock may fluctuate substantially depending on many factors, some of which are beyond our control and may not be related to our operating performance. These fluctuations could cause you to lose all or part of your investment in our common stock. Factors that could cause fluctuations in the trading price of our common stock include the following:
• | announcements of new products, services or technologies, relationships with strategic partners, acquisitions or of the termination of, or material changes to, material agreements or of other events by us or our competitors; |
• | changes in economic conditions; |
• | changes in prevailing interest rates; |
• | price and volume fluctuations in the overall stock market from time to time; |
• | significant volatility in the market price and trading volume of technology companies in general and of companies in the financial services industry; |
• | fluctuations in the trading volume of our shares or the size of our public float; |
• | actual or anticipated changes in our operating results or fluctuations in our operating results; |
• | quarterly fluctuations in demand for our loans; |
• | whether our operating results meet the expectations of securities analysts or investors; |
61
• | actual or anticipated changes in the expectations of investors or securities analysts; |
• | regulatory developments in the US, foreign countries or both and our ability to comply with applicable regulations; |
• | material litigation, including class action law suits; |
• | major catastrophic events; |
• | sales of large blocks of our stock; |
• | entry into, modification of or termination of a material agreement; or |
• | departures of key personnel or directors. |
In addition, if the market for technology and financial services stocks or the stock market in general experiences loss of investor confidence, the trading price of our common stock could decline for reasons unrelated to our business, operating results or financial condition. The trading price of our common stock might also decline in reaction to events that affect other companies in our industry even if these events do not directly affect us. In the past, following periods of volatility in the market price of a company’s securities, securities class action litigation has often been brought against that company. If our stock price is volatile, we may become the target of securities litigation. Securities litigation could result in substantial costs and divert our management’s attention and resources from our business. This could have a material adverse effect on our business, operating results and financial condition.
Sales of substantial amounts of our common stock in the public markets, or the perception that they might occur, could reduce the price that our common stock might otherwise attain and may dilute your voting power and your ownership interest in us.
Sales of a substantial number of shares of our common stock in the public market, or the perception that these sales could occur, could adversely affect the market price of our common stock and may make it more difficult for you to sell your common stock at a time and price that you deem appropriate.
In addition, the holders of an aggregate of 14,098,519 shares of our common stock associated with the conversion of preferred shares, or their permitted transferees, have rights, subject to some conditions, to require us to file registration statements covering the sale of their shares or to include their shares in registration statements that we may file for ourselves or other stockholders. We have also registered the offer and sale of all shares of common stock that we may issue under our equity compensation plans.
We may issue our shares of common stock or securities convertible into our common stock from time to time in connection with a financing, acquisition, investments or otherwise. Any such issuance could result in substantial dilution to our existing stockholders and cause the trading price of our common stock to decline.
The requirements of being a public company may strain our resources, divert management’s attention and affect our ability to attract and retain qualified board members.
As a public company, we are subject to the reporting requirements of the Exchange Act, the NYSE listing standards and other applicable securities rules and regulations. Compliance with these rules and regulations increases our legal and financial compliance costs, makes some activities more difficult, time-consuming or costly, and increases demand on our systems and resources, particularly after we are no longer an “emerging growth company” as defined in the Jumpstart Our Business Startups Act (the “JOBS Act.”). Among other things, the Exchange Act requires that we file annual, quarterly and current reports with respect to our business and operating results and maintain effective disclosure controls and procedures and internal control over financial reporting. In order to maintain and, if required, improve our disclosure controls and procedures and internal control over financial reporting to meet this standard, significant resources and management oversight may be required. As a result, management’s attention may be diverted from other business concerns, which could harm our business and operating results.
62
In addition, changing laws, regulations and standards relating to corporate governance and public disclosure are creating uncertainty for public companies, increasing legal and financial compliance costs and making some activities more time consuming. These laws, regulations and standards are subject to varying interpretations, in many cases due to their lack of specificity, and, as a result, their application in practice may evolve over time as new guidance is provided by regulatory and governing bodies. This could result in continuing uncertainty regarding compliance matters and higher costs necessitated by ongoing revisions to disclosure and governance practices. We intend to invest resources to comply with evolving laws, regulations and standards, and this investment may result in increased general and administrative expense and a diversion of management’s time and attention from revenues-generating activities to compliance activities. If our efforts to comply with new laws, regulations and standards differ from the activities intended by regulatory or governing bodies, regulatory authorities may initiate legal proceedings against us and our business may be harmed.
However, for so long as we remain an “emerging growth company” as defined in the JOBS Act, we may take advantage of certain exemptions from various requirements that are applicable to public companies that are not “emerging growth companies,” including not being required to comply with the independent auditor attestation requirements of Section 404 of the Sarbanes-Oxley Act, reduced disclosure obligations regarding executive compensation in our periodic reports and proxy statements, and exemptions from the requirements of holding a nonbinding advisory vote on executive compensation and stockholder approval of any golden parachute payments not previously approved. We may take advantage of these exemptions until we are no longer an “emerging growth company.”
We will cease to be an “emerging growth company” upon the earliest of: (i) the first fiscal year following the fifth anniversary of the completion of our IPO, (ii) the first fiscal year after our annual gross revenues are $1.07 billion or more, (iii) the date on which we have, during the previous three-year period, issued more than $1 billion in non-convertible debt securities, and (iv) as of the end of any fiscal year in which the market value of our common stock held by non-affiliates exceeded $700 million as of the end of the second quarter of that fiscal year.
If securities or industry analysts do not publish research or reports about our business, or publish inaccurate or unfavorable research reports about our business, our share price and trading volume could decline.
The trading market for our common stock, to some extent, depends on the research and reports that securities or industry analysts publish about us or our business. We do not have any control over these analysts. If one or more of the analysts who cover us should downgrade our shares or change their opinion of our shares, our share price would likely decline. If one or more of these analysts should cease coverage of our company or fail to regularly publish reports on us, we could lose visibility in the financial markets, which could cause our share price or trading volume to decline.
We do not intend to pay dividends for the foreseeable future.
We have never declared or paid any dividends on our common stock. We intend to retain any earnings to finance the operation and expansion of our business, and we do not anticipate paying any cash dividends in the future. In addition, pursuant to our financing agreement, we are prohibited from paying cash dividends without the prior consent of VPC. As a result, you may only receive a return on your investment in our common stock if the market price of our common stock increases.
Anti-takeover provisions in our charter documents and Delaware law may delay or prevent an acquisition of our company.
Our amended and restated certificate of incorporation and amended and restated bylaws contain provisions that may have the effect of delaying or preventing a change in control of us or changes in our management. The provisions, among other things:
• | establish a classified Board of Directors so that not all members of our Board of Directors are elected at one time; |
• | permit only our Board of Directors to establish the number of directors and fill vacancies on the Board; |
• | provide that directors may only be removed “for cause” and only with the approval of two-thirds of our stockholders; |
• | require two-thirds approval to amend some provisions in our restated certificate of incorporation and restated bylaws; |
• | authorize the issuance of “blank check” preferred stock that our Board of Directors could use to implement a stockholder rights plan, or a “poison pill;” |
• | eliminate the ability of our stockholders to call special meetings of stockholders; |
• | prohibit stockholder action by written consent, which will require that all stockholder actions must be taken at a stockholder meeting; |
63
• | do not provide for cumulative voting; and |
• | establish advance notice requirements for nominations for election to our Board of Directors or for proposing matters that can be acted upon by stockholders at annual stockholder meetings. |
These provisions, alone or together, could delay or prevent hostile takeovers and changes in control or changes in our management.
In addition, because we are incorporated in Delaware, we are governed by the provisions of Section 203 of the Delaware General Corporation Law (the “DGCL”) which limits the ability of stockholders owning in excess of 15% of our outstanding voting stock to merge or combine with us in certain circumstances.
Any provision of our amended and restated certificate of incorporation or amended and restated bylaws or Delaware law that has the effect of delaying or deterring a change in control could limit the opportunity for our stockholders to receive a premium for their shares of our common stock, and could also affect the price that some investors are willing to pay for our common stock.
Our amended and restated certificate of incorporation designates the Court of Chancery of the State of Delaware as the exclusive forum for certain litigation that may be initiated by our stockholders, which could limit our stockholders’ ability to obtain a favorable judicial forum for disputes with us.
Our amended and restated certificate of incorporation provides that the Court of Chancery of the State of Delaware is the sole and exclusive forum for (i) any derivative action or proceeding brought on our behalf, (ii) any action asserting a claim of breach of a fiduciary duty owed to us or our stockholders by any of our directors, officers, employees or agents, (iii) any action asserting a claim against us arising under the DGCL or (iv) any action asserting a claim against us that is governed by the internal affairs doctrine. The choice of forum provision in our amended and restated certificate of incorporation may limit our stockholders’ ability to obtain a favorable judicial forum for disputes with us.
If we fail to maintain an effective system of disclosure controls and procedures and internal control over financial reporting, we may not be able to accurately report our financial results or prevent fraud.
Ensuring that we have adequate disclosure controls and procedures, including internal controls over financial reporting, in place so that we can produce accurate financial statements on a timely basis is costly and time-consuming and needs to be reevaluated frequently. We are required to comply with Section 404 of the Sarbanes-Oxley Act of 2002 (the “Sarbanes-Oxley Act”) and related rules and regulations Pursuant to Section 404, beginning with our Annual Report on Form 10-K for the year ending December 31, 2018, our management will be required to report on, and, if we cease to be an emerging growth company our independent registered public accounting firm will have to attest to the effectiveness of, our internal control over financial reporting. Our management may conclude that our internal controls over financial reporting are not effective if we fail to cure any identified material weakness or otherwise. Moreover, even if our management concludes that our internal controls over financial reporting are effective, our independent registered public accounting firm may conclude that our internal controls over financial reporting are not effective. In the future, our independent registered public accounting firm may not be satisfied with our internal controls over financial reporting or the level at which our controls are documented, designed, operated or reviewed, or it may interpret the relevant requirements differently from us. In addition, during the course of the evaluation, documentation and testing of our internal controls over financial reporting, we may identify deficiencies that we may not be able to remediate in time to meet the deadline imposed by the SEC for compliance with the requirements of Section 404 of the Sarbanes-Oxley Act. Any such deficiencies may also subject us to adverse regulatory consequences. If we fail to achieve and maintain the adequacy of our internal controls over financial reporting, as these standards may be modified, supplemented or amended from time to time, we may be unable to report our financial information on a timely basis, may not be able to conclude on an ongoing basis that we have effective internal control over financial reporting in accordance with the Sarbanes-Oxley Act, and may suffer adverse regulatory consequences or violations of listing standards. Any of the above could also result in a negative reaction in the financial markets due to a loss of investor confidence in the reliability of our financial statements.
Item 1B. Unresolved Staff Comments
None.
64
Item 2. Properties
The Company leases its corporate headquarters in Fort Worth, Texas pursuant to a lease that expires September 30, 2020 and covers 74,103 square feet. We also lease approximately 39,742 square feet of office space in Addison, Texas (to be expanded to approximately 52,589 in October 2018 pursuant to a lease that expires June 30, 2026); approximately 8,972 square feet of office space in San Diego, California pursuant to a lease that expires June 30, 2024; approximately 6,500 square feet of office space in London, UK pursuant to a lease that expires November 19, 2018; and approximately 6,447 square feet of office space in Bury St. Edmunds, UK, pursuant to a lease that expires March 24, 2019.
Item 3. Legal Proceedings
In addition to the matters discussed below, in the normal course of business, from time to time, we have been and may be named as a defendant in various legal proceedings arising in connection with our business activities. We may also be involved, from time to time, in reviews, investigations and proceedings (both formal and informal) by governmental agencies regarding our business (collectively, “regulatory matters”). We contest liability and/or the amount of damages as appropriate in each such pending matter. We do not anticipate that the ultimate liability, if any, arising out of any such pending matter will have a material effect on our financial condition, results of operations or cash flows.
Civil Investigative Demand
In June 2012, prior to the spin-off from TFI, and in February 2016, after the spin-off, TFI received Civil Investigative Demands from the CFPB. The purpose of the Civil Investigative Demands was to determine whether small-dollar online lenders or other unnamed persons engaged in unlawful acts or practices relating to the advertising, marketing, provision, or collection of small-dollar loan products, in violation of Section 1036 of the Dodd-Frank Wall Street Reform and Consumer Protection Act, the Electronic Funds Transfer Act, the Gramm-Leach-Bliley Act, or any other federal consumer financial law and to determine whether CFPB action to obtain legal or equitable relief would be in the public interest. Further, on November 15, 2017 the CFPB sued TFI alleging it deceived consumers into paying debts that were not valid and that it collected loan payments that consumers did not owe. While TFI’s business is distinct from our business, we cannot predict the final outcome of the Civil Investigative Demands or to what extent any obligations arising out of such final outcome will be applicable to our company or business, if at all.
Item 4. Mine Safety Disclosures
Not applicable.
65
PART II
Item 5. Market for Registrant's Common Equity, Related Shareholder Matters and Issuer Purchases of Equity Securities
Principal Market
Our common stock began trading on the New York Stock Exchange (“NYSE”) under the symbol "ELVT" on April 6, 2017. The following table sets forth the high and low intra-day sales prices per share for our common stock on the NYSE since our initial public offering.
2017 | |||||||
High | Low | ||||||
Second Quarter | $ | 8.98 | $ | 6.80 | |||
Third Quarter | 9.48 | 5.90 | |||||
Fourth Quarter | $ | 9.00 | $ | 6.03 | |||
Stockholders
There were 63 stockholders of record of Elevate common stock as of March 7, 2018.
Dividends
We have never declared or paid cash dividends on our common stock. We currently intend to retain all available funds and any future earnings for use in the operation of our business and do not anticipate paying any dividends on our common stock in the foreseeable future. In addition, pursuant to our financing agreement, we are prohibited from paying cash dividends without the prior consent of VPC. Any future determination to declare dividends will be made at the discretion of our Board of Directors and will depend on our financial condition, operating results, capital requirements, general business conditions and other factors that our Board of Directors may deem relevant.
66
Performance Graph
The following graph shows a comparison of the cumulative total shareholder return for our common stock to the total shareholder return for the S&P SmallCap 600® Index and with our peer group from April 6, 2017 (the date our common stock began trading on the NYSE) through December 31, 2017. This data assumes an investment of $100 in each of our common stock and the two indices on April 6, 2017 and that all dividends were reinvested. Our peer group index is comprised of Aaron's, Inc. (AAN), Alliance Data Systems (ADS), America's Car-Mart (CRMT), Capital One Financial (COF), Conn's, Inc. (CONN), Discover Financial Services (DFS), Enova International, Inc. (ENVA), FirstCash, Inc. (FCFS), LendingClub Corporation (LC), On Deck Capital (ONDK), OneMain Holdings (OMF), Regional Management (RM), Rent-A-Center (RCII), Santander Consumer USA (SC) and World Acceptance Corp (WRLD). The stock price performance shown in this graph is neither necessarily indicative of, nor intended to suggest, future stock price performance.
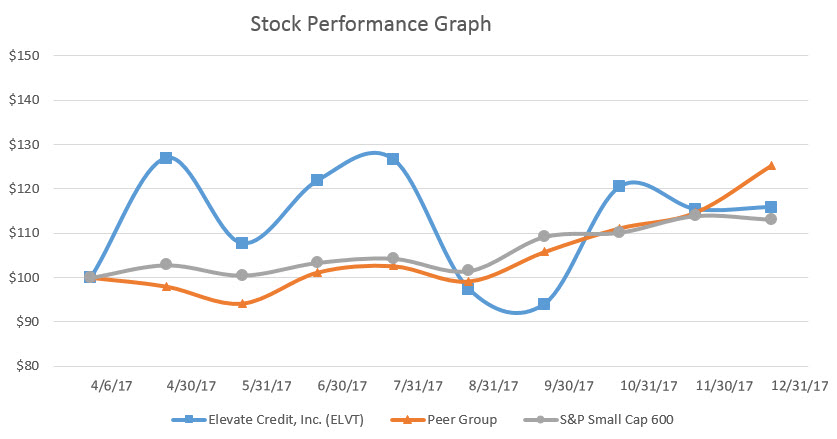
Indexed Returns | ||||||||||||
Elevate Credit, Inc. | Peer Group | S&P SmallCap 600 | ||||||||||
April 6, 2017 | $ | 100 | $ | 100 | $ | 100 | ||||||
April 30, 2017 | 127 | 98 | 103 | |||||||||
May 31, 2017 | 108 | 94 | 101 | |||||||||
June 30, 2017 | 122 | 101 | 103 | |||||||||
July 31, 2017 | 127 | 103 | 104 | |||||||||
August 31, 2017 | 97 | 99 | 102 | |||||||||
September 30, 2017 | 94 | 106 | 109 | |||||||||
October 31, 2017 | 120 | 111 | 110 | |||||||||
November 30, 2017 | 115 | 115 | 114 | |||||||||
December 31, 2017 | $ | 116 | $ | 125 | $ | 113 | ||||||
The performance graph should not be deemed filed or incorporated by reference into any other of our filings under the Securities Act or the Exchange Act, unless we specifically incorporate the performance graph by reference therein.
Issuer Purchases of Equity Securities
The Company purchased no shares of our common stock during the three months ended December 31, 2017.
67
Item 6. Selected Financial Data
The selected consolidated financial data presented below has been derived from our audited consolidated financial statements.
This information should be read in conjunction with “Management’s discussion and analysis of financial condition and results
of operations” and our audited consolidated financial statements and related notes thereto. Our historical results are not
necessarily indicative of the results that may be expected in any future period.
Consolidated statements of operations data (dollars in thousands, except share and per share amounts) | For the years ended December 31, | |||||||||||
2017 | 2016 | 2015 | ||||||||||
Revenues | $ | 673,132 | $ | 580,441 | $ | 434,006 | ||||||
Cost of sales: | ||||||||||||
Provision for loan losses | 357,574 | 317,821 | 232,650 | |||||||||
Direct marketing costs | 72,222 | 65,190 | 61,032 | |||||||||
Other cost of sales | 20,536 | 17,433 | 15,197 | |||||||||
Total cost of sales | 450,332 | 400,444 | 308,879 | |||||||||
Gross profit | 222,800 | 179,997 | 125,127 | |||||||||
Operating expenses: | ||||||||||||
Compensation and benefits | 81,969 | 65,657 | 60,568 | |||||||||
Professional services | 32,848 | 30,659 | 25,134 | |||||||||
Selling and marketing | 8,353 | 9,684 | 7,567 | |||||||||
Occupancy and equipment | 13,895 | 11,475 | 9,690 | |||||||||
Depreciation and amortization | 10,272 | 10,906 | 8,898 | |||||||||
Other | 4,600 | 3,812 | 4,303 | |||||||||
Total operating expenses | 151,937 | 132,193 | 116,160 | |||||||||
Operating income | 70,863 | 47,804 | 8,967 | |||||||||
Other income (expense): | ||||||||||||
Net interest expense | (73,043 | ) | (64,277 | ) | (36,674 | ) | ||||||
Foreign currency transaction gain (loss) | 2,900 | (8,809 | ) | (2,385 | ) | |||||||
Non-operating income (loss) | 2,295 | (43 | ) | 5,523 | ||||||||
Total other expense | (67,848 | ) | (73,129 | ) | (33,536 | ) | ||||||
Income (loss) before taxes | 3,015 | (25,325 | ) | (24,569 | ) | |||||||
Income tax expense (benefit) | 9,931 | (2,952 | ) | (4,658 | ) | |||||||
Net loss | $ | (6,916 | ) | $ | (22,373 | ) | $ | (19,911 | ) | |||
Basic loss per share | $ | (0.20 | ) | $ | (1.74 | ) | $ | (1.59 | ) | |||
Diluted loss per share | $ | (0.20 | ) | $ | (1.74 | ) | $ | (1.59 | ) | |||
Basic weighted average shares outstanding | 33,911,520 | 12,894,262 | 12,525,847 | |||||||||
Diluted weighted average shares outstanding | 33,911,520 | 12,894,262 | 12,525,847 | |||||||||
Adjustments to arrive at Adjusted EBITDA: | ||||||||||||
Net loss | $ | (6,916 | ) | $ | (22,373 | ) | $ | (19,911 | ) | |||
Net interest expense | 73,043 | 64,277 | 36,674 | |||||||||
Share-based compensation | 6,318 | 1,707 | 847 | |||||||||
Foreign currency transaction (gains) losses | (2,900 | ) | 8,809 | 2,385 | ||||||||
Depreciation and amortization | 10,272 | 10,906 | 8,898 | |||||||||
Non-operating (income) loss | (2,295 | ) | 43 | (5,523 | ) | |||||||
Income tax expense (benefit) | 9,931 | (2,952 | ) | (4,658 | ) | |||||||
Adjusted EBITDA(1) | $ | 87,453 | $ | 60,417 | $ | 18,712 | ||||||
68
As of and for the years ended December 31, | ||||||||||||
Other financial and operational data (dollars in thousands, except as noted) | 2017 | 2016 | 2015 | |||||||||
Free cash flow(2) | $ | 16,741 | $ | 19,930 | $ | (29,054 | ) | |||||
Number of new customer loans | 305,186 | 277,637 | 238,238 | |||||||||
Number of loans outstanding | 361,972 | 289,193 | 222,723 | |||||||||
Customer acquisition costs (in dollars) | $ | 237 | $ | 235 | $ | 256 | ||||||
Net charge-offs(3) | $ | 347,010 | $ | 299,700 | $ | 214,795 | ||||||
Additional provision for loan losses(3) | 10,564 | 18,121 | 17,855 | |||||||||
Provision for loan losses | $ | 357,574 | $ | 317,821 | $ | 232,650 | ||||||
Past due combined loans receivable – principal as a percentage of combined loans receivable – principal(4) | 10 | % | 12 | % | 12 | % | ||||||
Net charge-offs as a percentage of revenues | 52 | % | 52 | % | 49 | % | ||||||
Total provision for loan losses as a percentage of revenues | 53 | % | 55 | % | 54 | % | ||||||
Combined loan loss reserve(5) | $ | 93,789 | $ | 82,376 | $ | 65,784 | ||||||
Combined loan loss reserve as a percentage of combined loans receivable(5) | 14 | % | 16 | % | 17 | % | ||||||
Effective APR of combined loan portfolio | 131 | % | 146 | % | 173 | % | ||||||
Ending combined loans receivable – principal(4) | $ | 618,375 | $ | 481,210 | $ | 356,069 | ||||||
(1) | Adjusted EBITDA is not a financial measure prepared in accordance with accounting principles generally accepted in the United States ("US GAAP"). Adjusted EBITDA represents our net loss, adjusted to exclude: net interest expense primarily associated with notes payable under the VPC Facility and ESPV Facility used to fund or purchase loans; foreign currency gains and losses associated with our UK operations; depreciation and amortization expense on fixed assets and intangible assets; share-based compensation; adjustments to contingent consideration payable related to companies previously acquired prior to the spin-off; and income taxes. See “Management’s discussion and analysis of financial condition and results of operations—Non-GAAP Financial Measures” for more information and for a reconciliation of Adjusted EBITDA to net loss, the most directly comparable financial measure calculated in accordance with US GAAP. |
(2) | Free cash flow is not a financial measure prepared in accordance with US GAAP. Free cash flow represents our net cash from operating activities adjusted for the net charge-offs—combined principal loans and capital expenditures incurred during the period. See “Management’s discussion and analysis of financial condition and results of operations—Non-GAAP Financial Measures” for more information and a reconciliation of free cash flow to net cash provided by operating activities. |
(3) | Net charge-offs and additional provision for loan losses are not a financial measure prepared in accordance with US GAAP. Net charge-offs include the amount of principal and accrued interest on loans that are more than 60 days past due, or sooner if we receive notice that the loan will not be collected, such as a bankruptcy notice or identified fraud, offset by any recoveries. Additional provision for loan losses is the amount of provision for loan losses needed for a particular period to adjust the combined loan loss reserve to the appropriate level in accordance with our underlying loan loss reserve methodology. See “Management’s discussion and analysis of financial condition and results of operations—Non-GAAP Financial Measures” for more information and for a reconciliation to provision for loan losses, the most directly comparable financial measure calculated in accordance with US GAAP. |
(4) | Combined loans receivable is defined as loans owned by the Company plus loans originated and owned by third-party lenders pursuant to our CSO programs. See “Management’s discussion and analysis of financial condition and results of operations—Non-GAAP Financial Measures” for more information and for a reconciliation of Combined loans receivable to loans receivable, net, the most directly comparable financial measure calculated in accordance with US GAAP. |
(5) | Combined loan loss reserve is defined as the loan loss reserve for loans owned by the Company plus the loan loss reserve for loans originated and owned by third-party lenders and guaranteed by the Company. See “Management’s discussion and analysis of financial condition and results of operations—Non-GAAP Financial Measures” for more information and for a reconciliation of Combined loan loss reserve to loan loss reserve, the most directly comparable financial measure calculated in accordance with US GAAP. |
69
Item 7. Management’s Discussion and Analysis of Financial Condition and Results of Operations
You should read the following discussion and analysis of our financial condition and results of operations together with our consolidated financial statements and the related notes and other financial information included elsewhere in this Annual Report on Form 10-K. Some of the information contained in this discussion and analysis, including information with respect to our plans and strategy for our business, includes forward-looking statements that involve risks and uncertainties. You should review the “Risk Factors” and "Note About Forward-Looking Statements" sections of this Annual Report on Form 10-K for a discussion of important factors that could cause actual results to differ materially from the results described in or implied by the forward-looking statements contained in the following discussion and analysis. We generally refer to loans, customers and other information and data associated with each of Rise, Elastic and Sunny as Elevate’s loans, customers, information and data, irrespective of whether Elevate directly originates the credit to the customer or whether such credit is originated by a third party.
OVERVIEW
We provide online credit solutions to consumers in the US and the UK who are not well-served by traditional bank products and who are looking for better options than payday loans, title loans, pawn and storefront installment loans. Non-prime consumers now represent a larger market than prime consumers but are risky to underwrite and serve with traditional approaches. We’re succeeding at it - and doing it responsibly - with best-in-class advanced technology and proprietary risk analytics honed by serving approximately 1.9 million customers with $5.2 billion in credit. Our current online credit products, Rise, Elastic and Sunny, reflect our mission to provide customers with access to competitively priced credit and services while helping them build a brighter financial future with credit building and financial wellness features. We call this mission "Good Today, Better Tomorrow."
We earn revenues on the Rise and Sunny installment loans and on the Rise and Elastic lines of credit. For all three products, our revenues, which primarily consist of finance charges, are driven by our average loan balances outstanding and by the average annual percentage rate (“APR”) associated with those outstanding loan balances. We calculate our average loan balances by taking a simple daily average of the ending loan balances outstanding for each period. We present certain key metrics and other information on a “combined” basis to reflect information related to loans originated by us and loans originated by Republic Bank, as well as loans originated by third-party lenders pursuant to CSO programs, which loans originated through CSO programs are not recorded on our balance sheet in accordance with US GAAP. See “—Key Financial and Operating Metrics” and “—Non-GAAP Financial Measures.”
We have experienced rapid growth since launching our current generation of product offerings in 2013. Since their introduction, through December 31, 2017, Rise, Elastic and Sunny, together, have provided approximately $3.8 billion in credit to approximately 1.1 million customers and generated strong growth in revenues and loans outstanding. Our revenues for the year ended December 31, 2017 grew 16% compared to revenues for 2016. Our combined loan principal balances grew 29% from $481.2 million as of December 31, 2016 to $618.4 million as of December 31, 2017. For additional information about our combined loan balances please see “—Non-GAAP Financial Measures—Combined loan information.”
We use our working capital, funds provided by third-party lenders pursuant to CSO programs and our credit facility with Victory Park Management, LLC ("VPC”) to fund the loans we make to our customers. Prior to January 2014, we funded all of our loans to customers out of our existing cash flows. On January 30, 2014, we entered into an agreement with VPC to provide a credit facility (“VPC Facility”) in order to fund our Rise and Sunny products and provide working capital. Since originally entering into the VPC Facility, it has been amended several times to increase the maximum total borrowing amount available from the original amount of $250 million to approximately $433 million at December 31, 2017. See “—Liquidity and Capital Resources—Debt facilities.”
70
The Elastic line of credit product is originated by a third-party lender, Republic Bank, which initially provides all of the funding for that product. Republic Bank retains 10% of the balances of all loans originated and sells a 90% loan participation in the Elastic lines of credit. We purchased these loan participations ourselves through June 30, 2015 and thus earned 90% of the revenues and incurred 90% of the losses associated with the Elastic product through that date. Due to the significant growth in Elastic, commencing July 1, 2015, a new structure was implemented such that the loan participations are sold by Republic Bank to Elastic SPV, Ltd. (“Elastic SPV”) and Elastic SPV receives its funding from VPC in a separate financing facility (the “ESPV Facility”), which was finalized on July 13, 2015. We do not own Elastic SPV but we have a credit default protection agreement with Elastic SPV whereby we provide credit protection to the investors in Elastic SPV against Elastic loan losses in return for a credit premium. Per the terms of this agreement, under US GAAP, the Company is the primary beneficiary of Elastic SPV and is required to consolidate the financial results of Elastic SPV as a variable interest entity in its consolidated financial results.
The ESPV Facility has also been amended several times and the original commitment amount of $50 million has grown to $250 million as of December 31, 2017. See “—Liquidity and Capital Resources—Debt facilities.”
Our management assesses our financial performance and future strategic goals through key metrics based primarily on the following three themes:
• | Revenue growth. Revenues increased by $92.7 million, or 16%, from $580.4 million for the year ended December 31, 2016 to $673.1 million for the year ended December 31, 2017. For the year ended December 31, 2016, our total revenues increased 34% as compared to the 2015, increasing from $434.0 million to $580.4 million. Key metrics related to revenue growth that we monitor by product include the ending and average combined loan balances outstanding, the effective APR of our product loan portfolios, the total dollar value of loans originated, the number of new customer loans made, the ending number of customer loans outstanding and the related customer acquisition costs (“CAC”) associated with each new customer loan made. We include CAC as a key metric when analyzing revenue growth (rather than as a key metric within margin expansion) as we do not intend to lower our CAC over future periods. Instead, as we improve customer acquisition efficiency, we intend to increase spending on direct marketing to acquire a broader customer base to drive further revenue growth. |
• | Stable credit quality. Since the time they were managing our legacy US products, our management team has maintained stable credit quality across the loan portfolio they were managing. Additionally, in the periods covered in this Management's Discussion and Analysis of Financial Condition and Results of Operations, we have continued to maintain stable credit quality. The credit quality metrics we monitor include net charge-offs as a percentage of revenues, the combined loan loss reserve as a percentage of outstanding combined loans, total provision for loan losses as a percentage of revenues and the percentage of past due combined loans receivable – principal. |
• | Margin expansion. We expect that our operating margins will continue to expand over the near term as we lower our direct marketing costs and operating expense as a percentage of revenues while continuing to maintain our stable credit quality levels. Over the next several years, as we continue to scale our loan portfolio, we anticipate that our direct marketing costs primarily associated with new customer acquisitions will decline to approximately 10% of revenues and our operating expenses will decline to approximately 20% of revenues. We aim to manage our business to achieve a long-term operating margin of 20%, and do not expect our operating margin to increase beyond that level, as we intend to pass on any improvements over our targeted margins to our customers in the form of lower APRs. We believe this is a critical component of our responsible lending platform and over time will also help us continue to attract new customers and retain existing customers. |
KEY FINANCIAL AND OPERATING METRICS
As discussed above, we regularly monitor a number of metrics in order to measure our current performance and project our future performance. These metrics aid us in developing and refining our growth strategies and in making strategic decisions.
Certain of our metrics are non-GAAP financial measures. We believe that such metrics are useful in period-to-period comparisons of our core business. However, non-GAAP financial measures are not an alternative to any measure of financial performance calculated and presented in accordance with US GAAP. See “—Non-GAAP Financial Measures” for a reconciliation of our non-GAAP measures to US GAAP.
71
Revenue growth
As of and for the years ended December 31, | ||||||||||||
Revenue growth metrics (dollars in thousands, except as noted) | 2017 | 2016 | 2015 | |||||||||
Revenues | $ | 673,132 | $ | 580,441 | $ | 434,006 | ||||||
Period-over-period revenue growth | 16 | % | 34 | % | 59 | % | ||||||
Ending combined loans receivable – principal(1) | 618,375 | 481,210 | 356,069 | |||||||||
Average combined loans receivable – principal(1)(2) | 506,928 | 395,216 | 250,058 | |||||||||
Total combined loans originated – principal | 1,318,338 | 1,078,180 | 783,627 | |||||||||
Average customer loan balance (in dollars)(3) | 1,708 | 1,664 | 1,599 | |||||||||
Number of new customer loans | 305,186 | 277,637 | 238,238 | |||||||||
Number of loans outstanding | 361,972 | 289,193 | 222,723 | |||||||||
Customer acquisition costs (in dollars) | 237 | 235 | 256 | |||||||||
Effective APR of combined loan portfolio | 131 | % | 146 | % | 173 | % | ||||||
_________
(1) | Combined loans receivable is defined as loans owned by the Company plus loans originated and owned by third-party lenders pursuant to our CSO programs. See “—Non-GAAP financial measures” for more information and for a reconciliation of combined loans receivable to loans receivable, net, the most directly comparable financial measure calculated in accordance with US GAAP. |
(2) | Average combined loans receivable – principal is calculated using an average of daily principal balances. |
(3) | Average customer loan balance is a weighted average of all three products and is calculated for each product by dividing the ending combined loans receivable – principal by the number of loans outstanding at period end. |
Revenues. Our revenues are composed of Rise finance charges, Rise CSO fees (which are fees we receive from customers who obtain a loan through the CSO program for the credit services, including the loan guaranty, we provide) and non-sufficient funds fees (which were discontinued at the beginning of the fourth quarter of 2015) on Rise installment loans, finance charges on Sunny installment loans and revenues earned on Rise and Elastic lines of credit. See “—Components of our Results of Operations—Revenues.”
Ending and average combined loans receivable – principal. We calculate the average combined loans receivable – principal by taking a simple daily average of the ending combined loans receivable – principal for each period. Key metrics that drive the ending and average combined loans receivable – principal include the amount of loans originated in a period and the average customer loan balance. All loan balance metrics include only the 90% participation in the related Elastic line of credit advances (we exclude the 10% held by Republic Bank), but include the full loan balances on CSO loans, which are not presented on our balance sheet.
Total combined loans originated- principal. The amount of loans originated in a period is driven primarily by loans to new customers as well as new loans to prior customers, including refinancings of existing loans to customers in good standing.
Average customer loan balance and effective APR of combined loan portfolio. The average loan amount and its related APR are based on the product and the underlying credit quality of the customer. Generally, better credit quality customers are offered higher loan amounts at lower APRs. Additionally, new customers have more potential risk of loss than prior or existing customers due to lack of payment history and the potential for fraud. As a result, newer customers typically will have lower loan amounts and higher APRs to compensate for that additional risk of loss. The effective APR is calculated based on the actual amount of finance charges generated from a customer loan divided by the average outstanding balance for the loan, and can be lower than the stated APR on the loan due to waived finance charges and other reasons. For example, a Rise customer may receive a $2,000 installment loan with a term of 24 months and a stated rate of 180%. In this example, the customer’s monthly installment loan payment would be $310.86. As the customer can prepay the loan balance at any time with no additional fees or early payment penalty, the customer pays the loan in full in month eight. The customer’s loan earns interest of $2,337.81 over the eight month period and has an average outstanding balance of $1,948.17. The effective APR for this loan is 180% over the eight month period calculated as follows:
($2,337.81 interest earned / $1,948.17 average balance outstanding) x 12 months per year = 180%
8 months
72
In addition, as an example for Elastic, if a customer makes a $2,500 draw on the customer’s line of credit and this draw required bi-weekly minimum payments of 5% (equivalent to 20 bi-weekly payments), and if all minimum payments are made, the draw would earn finance charges of $1,148. The effective APR for the line of credit in this example is 109% over the payment period and is calculated as follows:
($1,148.00 fees earned / $1,369.05 average balance outstanding) x 26 bi-weekly periods per year = 109%
20 payments
The actual amount of revenue we realize on a loan portfolio is also impacted by the amount of prepayments and charged-off customer loans in the portfolio. For a single loan, on average, we typically expect to realize approximately 60% of the revenues that we would otherwise realize if the loan were to fully amortize at the stated APR. From the Rise example above, if we waived $400 of interest for this customer, the effective APR for this loan would decrease to 149%.
Number of new customer loans. We define a new customer loan as the first loan made to a customer for each of our products (so a customer receiving a Rise installment loan and then at a later date taking their first cash advance on an Elastic line of credit would be counted twice). The number of new customer loans is subject to seasonal fluctuations. New customer acquisition is typically slowest during the first six months of each calendar year, primarily in the first quarter, compared to the latter half of the year, as our existing and prospective US customers usually receive tax refunds during this period and, thus, have less of a need for loans from us. Further, many US customers will use their tax refunds to prepay all or a portion of their loan balance during this period, so our overall loan portfolio typically decreases during the first quarter of the calendar year. Overall loan portfolio growth and the number of new customer loans tends to accelerate during the summer months (typically June and July), at the beginning of the school year (typically late August to early September) and during the winter holidays (typically late November to early December).
Customer acquisition costs. A key expense metric we monitor related to loan growth is our CAC. This metric is the amount of direct marketing costs incurred during a period divided by the number of new customer loans originated during that same period. New loans to former customers are not included in our calculation of CAC (except to the extent they receive a loan through a different product) as we believe we incur no material direct marketing costs to make additional loans to a prior customer through the same product.
73
The following tables summarize the changes in customer loans by product for the years ended December 31, 2017, 2016 and 2015.
Year ended December 31, 2017 | ||||||||||||||||||||
Rise (US) | Elastic (US) | Total Domestic | Sunny (UK) | Total | ||||||||||||||||
Beginning number of combined loans outstanding | 121,996 | 89,153 | 211,149 | 78,044 | 289,193 | |||||||||||||||
New customer loans originated | 116,030 | 110,145 | 226,175 | 79,011 | 305,186 | |||||||||||||||
Former customer loans originated | 71,109 | — | 71,109 | — | 71,109 | |||||||||||||||
Attrition | (168,345 | ) | (58,626 | ) | (226,971 | ) | (76,545 | ) | (303,516 | ) | ||||||||||
Ending number of combined loans outstanding | 140,790 | 140,672 | 281,462 | 80,510 | 361,972 | |||||||||||||||
Customer acquisition cost | $ | 281 | $ | 182 | $ | 233 | $ | 249 | $ | 237 | ||||||||||
Average customer loan balance | $ | 2,276 | $ | 1,784 | $ | 2,030 | $ | 584 | $ | 1,708 | ||||||||||
Year ended December 31, 2016 | ||||||||||||||||||||
Rise (US) | Elastic (US) | Total Domestic | Sunny (UK) | Total | ||||||||||||||||
Beginning number of combined loans outstanding | 118,222 | 36,487 | 154,709 | 68,014 | 222,723 | |||||||||||||||
New customer loans originated | 109,686 | 82,880 | 192,566 | 85,071 | 277,637 | |||||||||||||||
Former customer loans originated | 81,174 | 112 | 81,286 | — | 81,286 | |||||||||||||||
Attrition | (187,086 | ) | (30,326 | ) | (217,412 | ) | (75,041 | ) | (292,453 | ) | ||||||||||
Ending number of combined loans outstanding | 121,996 | 89,153 | 211,149 | 78,044 | 289,193 | |||||||||||||||
Customer acquisition cost | $ | 278 | $ | 152 | $ | 224 | $ | 259 | $ | 235 | ||||||||||
Average customer loan balance | $ | 2,196 | $ | 1,909 | $ | 2,075 | $ | 551 | $ | 1,664 | ||||||||||
Year Ended December 31, 2015 | ||||||||||||||||||||
Rise (US) | Elastic (US) | Total Domestic | Sunny (UK) | Total | ||||||||||||||||
Beginning number of combined loans outstanding | 94,045 | 443 | 94,488 | 51,558 | 146,046 | |||||||||||||||
New customer loans originated | 117,950 | 43,219 | 161,169 | 77,069 | 238,238 | |||||||||||||||
Former customer loans originated | 74,438 | 356 | 74,794 | — | 74,794 | |||||||||||||||
Attrition | (168,211 | ) | (7,531 | ) | (175,742 | ) | (60,613 | ) | (236,355 | ) | ||||||||||
Ending number of combined loans outstanding | 118,222 | 36,487 | 154,709 | 68,014 | 222,723 | |||||||||||||||
Customer acquisition cost | $ | 275 | $ | 132 | 237 | $ | 295 | $ | 256 | |||||||||||
Average customer loan balance | $ | 2,057 | $ | 2,030 | $ | 2,050 | $ | 571 | $ | 1,599 | ||||||||||
Recent trends. Our revenues for the year ended December 31, 2017 totaled $673.1 million, up 16% versus the year ended December 31, 2016. Our revenues for the year ended December 31, 2016 totaled $580.4 million, up 34% versus the year ended December 31, 2015. This growth in revenues was driven by a 28% and 58% increase in our average combined loans receivable - principal balance for 2017 and 2016, respectively, as we continued to expand our customer base, with customer loans outstanding increasing 25% at the end of December 2017 over the prior year amount. In particular, our Elastic line of credit product had approximately 58% more customer loans outstanding as of December 31, 2017 as compared to a year ago.
74
The growth in loan balances drove the increase in revenues for the year ended December 31, 2017, offset in part by a decrease in the average APR on the loan portfolio, which declined to 131% during the year ended December 31, 2017 from 146% during the prior year period. In addition, a similar trend took place for the year ended December 31, 2016 with APR declining to 146% during the year ended December 31, 2016 from 173% during the year ended December 31, 2015. This decrease in the average APR resulted primarily from a shift in the mix of our loan portfolio. Elastic, which has grown significantly in volume and as a proportion of our portfolio since 2015, had an average effective APR of approximately 97% during the year ended December 31, 2017 compared to Rise installment, which has an average effective APR of approximately 141% during the year ended December 31, 2017, respectively, contributing to the overall reduction in the consolidated APR. In addition, 2017 loan growth in Rise installment loans has primarily occurred in lower APR states such as Georgia and Illinois, which have effective APR rate caps of 60% and 99%, respectively, thus reducing the average Rise installment APR. While this has slowed the growth in Rise revenue, it has resulted in better credit quality in the Rise loan portfolio and a reduction in loan loss provision. Further, as the loan portfolios for Rise and Sunny installment loans continue to mature, their respective average APR will also continue to drop.
Lastly, we believe the delay in the 2017 tax refund season and the 2017 hurricanes in Texas and Florida had an impact on our revenue growth in 2017. The delay in the 2017 tax refund season slowed our revenue growth that year. We typically start our seasonal growth period in the late April and early May period but in 2017 it was delayed until mid-June costing us approximately $10 million of revenue growth this year. Additionally, we recognized approximately $5 million less revenue this year, primarily related to Elastic, resulting from the 2017 hurricanes. The September and October 2017 direct mail drops for acquiring Elastic customers, which we committed to in early August 2017, had much lower customer response rates in Texas and Florida. This, along with decreased line utilization from existing Elastic customers, resulted in Elastic having lower loans outstanding and revenue than what we were originally forecasting for the fourth quarter of 2017. See “Risk Factors—Risks Related to Our Business and Industry—Our recent growth rate may not be indicative of our ability to continue to grow, if at all, in the future.”
Our CAC during the years ended December 31, 2017 and 2016 were below our targeted range of $250 to $300, even as we funded more new loans during each of those years. This was due to continued strong new customer growth in our Elastic product, which has the lowest CAC of our three products. We believe our CAC in future years will continue to remain within or below our normalized range.
The average customer loan balance also increased during the year ended December 31, 2017 and 2016 as compared to the respective prior year periods. We expect this trend in average customer loan balance to continue as our loan portfolio continues to grow and mature with more existing and repeat customers, who typically have higher loan amounts.
75
Credit quality
As of and for the years ended December 31, | ||||||||||||
Credit quality metrics (dollars in thousands) | 2017 | 2016 | 2015 | |||||||||
Net charge-offs(1) | $ | 347,010 | $ | 299,700 | $ | 214,795 | ||||||
Additional provision for loan losses(1) | 10,564 | 18,121 | 17,855 | |||||||||
Provision for loan losses | $ | 357,574 | $ | 317,821 | 232,650 | |||||||
Past due combined loans receivable – principal as a percentage of combined loans receivable – principal(2)(3) | 10 | % | 12 | % | 12 | % | ||||||
Net charge-offs as a percentage of revenues(1) | 52 | % | 52 | % | 49 | % | ||||||
Total provision for loan losses as a percentage of revenues | 53 | % | 55 | % | 54 | % | ||||||
Combined loan loss reserve(4) | $ | 93,789 | $ | 82,376 | $ | 65,784 | ||||||
Combined loan loss reserve as a percentage of combined loans receivable(4) | 14 | % | 16 | % | 17 | % | ||||||
_________
(1) | Net charge-offs and additional provision for loan losses are not financial measures prepared in accordance with US GAAP. Net charge-offs include the amount of principal and accrued interest on loans that are more than 60 days past due, or sooner if we receive notice that the loan will not be collected, such as a bankruptcy notice or identified fraud, offset by any recoveries. Additional provision for loan losses is the amount of provision for loan losses needed for a particular period to adjust the combined loan loss reserve to the appropriate level in accordance with our underlying loan loss reserve methodology. See “—Non-GAAP Financial Measures” for more information and for a reconciliation to provision for loan losses, the most directly comparable financial measure calculated in accordance with US GAAP. |
(2) | Combined loans receivable is defined as loans owned by the Company plus loans originated and owned by third-party lenders. See “—Non-GAAP Financial Measures” for more information and for a reconciliation of Combined loans receivable to loans receivable, net, the most directly comparable financial measure calculated in accordance with US GAAP. |
(3) | Certain amounts in the prior periods presented here have been reclassified to conform to the current period financial statement presentation related to customers within the 16 day grace period that were reported as past due that were in fact current in accordance with our policy as discussed in Note 1—Basis of Presentation and Accounting Changes of the consolidated financial statements. |
(4) | Combined loan loss reserve is defined as the loan loss reserve for loans originated and owned by the Company plus the loan loss reserve for loans owned by third-party lenders and guaranteed by the Company. See “—Non-GAAP Financial Measures” for more information and for a reconciliation of Combined loan loss reserve to allowance for loan losses, the most directly comparable financial measure calculated in accordance with US GAAP. |
Net principal charge-offs as a percentage of average combined loans receivable - principal (1) (2) (3) | First Quarter | Second Quarter | Third Quarter | Fourth Quarter | ||||
2017 | 15% | 14% | 12% | 13% | ||||
2016 | 14% | 13% | 14% | 15% | ||||
2015 | 16% | 14% | 15% | 15% | ||||
(1) | Net principal charge-offs is comprised of gross principal charge-offs less recoveries. |
(2) | Average combined loans receivable - principal is calculated using an average of daily combined loans receivable - principal balances during each quarter. |
(3) | Combined loans receivable is defined as loans owned by the Company plus loans originated and owned by third-party lenders pursuant to our CSO programs. See "—Non GAAP Financial Measures" for more information and for a reconciliation of combined loans receivable to loans receivable, net, the most directly comparable financial measure calculated in accordance with US GAAP. |
In reviewing the credit quality of our loan portfolio, we break out our total provision for loan losses that is presented on our income statement under US GAAP into two separate items—net charge-offs and additional provision for loan losses. Net charge-offs are indicative of the credit quality of our underlying portfolio, while additional provision for loan losses is subject to more fluctuation based on loan portfolio growth, recent credit quality trends and the effect of normal seasonality on our business. The additional provision for loan losses is the amount needed to adjust the combined loan loss reserve to the appropriate amount at the end of each month based on our loan loss reserve methodology.
Net charge-offs. Net charge-offs comprise gross charge-offs offset by recoveries on prior charge-offs. Gross charge-offs include the amount of principal and accrued interest on loans that are more than 60 days past due, or sooner if we receive notice that the loan will not be collected, such as a bankruptcy notice or identified fraud. Any payments received on loans that have been charged off are recorded as recoveries and reduce the amount of gross charge-offs. Recoveries are typically less than 10% of the amount charged off, and thus, we do not view recoveries as a key credit quality metric. Historically, we have generally incurred net charge-offs as a percentage of revenues of between 42% and 59%.
76
Net charge-offs as a percentage of revenues can vary based on several factors, such as whether or not we experience significant growth or lower the APR of our products. Additionally, although a more seasoned portfolio will typically result in lower net charge-offs as a percentage of revenues, we do not intend to drive down this ratio significantly below our historical ratios and would instead seek to offer our existing products to a broader new customer base to drive additional revenues.
Net charge-offs as a percentage of average combined loans receivable-principal allow us to determine credit quality and evaluate loss experience trends across our loan portfolio. Over the past three years, our quarterly net charge-offs as a percentage of average combined loans receivable-principal have remained consistent and ranged from 12% to 15%, with quarterly trends based on seasonal growth of the loan portfolio.
Additional provision for loan losses. Additional provision for loan losses is the amount of provision for loan losses needed for a particular period to adjust the combined loan loss reserve to the appropriate level in accordance with our underlying loan loss reserve methodology.
Additional provision for loan losses relates to an increase in future inherent losses in the loan portfolio as determined by our loan loss reserve methodology. This increase could be due to a combination of factors such as an increase in the size of the loan portfolio or a worsening of credit quality or increase in past due loans. It is also possible for the additional provision for loan losses for a period to be a negative amount, which would reduce the amount of the combined loan loss reserve needed (due to a decrease in the loan portfolio or improvement in credit quality). The amount of additional provision for loan losses is seasonal in nature, mirroring the seasonality of our new customer acquisition and overall loan portfolio growth, as discussed above. The combined loan loss reserve typically decreases during the first quarter or first half of the calendar year due to a decrease in the loan portfolio from year end. Then, as the rate of growth for the loan portfolio starts to increase during the second half of the year, additional provision for loan losses is typically needed to increase the reserve for future losses associated with the loan growth. Because of this, our provision for loan losses can vary significantly throughout the year without a significant change in the credit quality of our portfolio.
The following provides an example of the application of our loan loss reserve methodology and the break out of the provision for loan losses between the portion associated with replenishing the reserve due to net charge-offs and the amount related to the additional provision for loan losses. If the beginning combined loan loss reserve were $25 million, and we incurred $10 million of net charge-offs during the period and the ending combined loan loss reserve needed to be $30 million according to our loan loss reserve methodology, our total provision for loan losses would be $15 million, comprising $10 million in net charge-offs (provision needed to replenish the combined loan loss reserve) plus $5 million of additional provision related to an increase in future inherent losses in the loan portfolio identified by our loan loss reserve methodology.
Example (dollars in thousands) | |||||||
Beginning combined loan loss reserve | $ | 25,000 | |||||
Less: Net charge-offs | (10,000 | ) | |||||
Provision for loan losses: | |||||||
Provision for net charge-offs | 10,000 | ||||||
Additional provision for loan losses | 5,000 | ||||||
Total provision for loan losses | 15,000 | ||||||
Ending combined loan loss reserve balance | $ | 30,000 | |||||
Loan loss reserve methodology. Our loan loss reserve methodology is calculated separately for each product and, in the case of Rise (for non-CSO and CSO program loans), is calculated separately based on the state in which each customer resides to account for varying state license requirements that affect the amount of the loan offered, repayment terms and other factors. For each product, loss factors are calculated based on the delinquency status of customer loan balances: current, 1 to 30 days past due or 31 to 60 days past due. These loss factors for loans in each delinquency status are based on average historical loss rates by product (or state) associated with each of these three delinquency categories. Hence, another key credit quality metric we monitor is the percentage of past due combined loans receivable – principal, as an increase in past due loans will cause an increase in our combined loan loss reserve and related additional provision for loan losses to increase the reserve. For customers that are not past due, we further stratify these loans into loss rates by payment number, as a new customer that is about to make a first loan payment has a significantly higher risk of loss than a customer who has successfully made ten payments on an existing loan with us. Based on this methodology, we have historically seen our combined loan loss reserve as a percentage of combined loans receivable fluctuate between approximately 14% and 24% depending on the overall mix of new, former and past due customer loans.
77
Recent trends. For the year ended December 31, 2017, net charge-offs as a percentage of revenues totaled 52% and fluctuated within a quarterly range of 12% to 15% when measuring net principal charge-offs as a percentage of average combined loans receivable -principal. In balancing the growth, mix and credit quality of our loan portfolio, we aim to manage net charge-offs as a percentage of revenues between 45% and 55% on an annual basis. Our historical range of net charge-offs as a percentage of revenues is generally from 42% to 59%. The net charge-offs as a percentage of revenues for the year ended December 31, 2017 was within our targeted range. We expect our net charge-offs as a percentage of revenues will continue to trend lower due to continued improvements in our underwriting and the ongoing maturation of the loan portfolio. Total loan loss provision for the year ended December 31, 2017 was 53% of revenues, which was at the high end of our targeted range of 45% to 55% due to the strong growth in combined loans receivable - principal experienced during the third and fourth quarters of 2017. The Company typically experiences strong loan growth and a corresponding increase in total loan loss provision during the second half of every year.
The combined loan loss reserve as a percentage of combined loans receivable totaled 14%, 16% and 17% as of December 31, 2017, 2016 and 2015, respectively, reflecting continued improvements to our underwriting and ongoing maturation of the loan portfolio. Past due loan balances were 10% of total combined loans receivable - principal, versus 12% a year ago.
Additionally, we also look at gross principal loan charge-offs (including both credit and fraud losses) by vintage as a percentage of combined loans originated - principal. As the below table shows, our cumulative principal loan charge-offs through December 31, 2017 for each annual vintage since the 2013 vintage are generally under 30% and continue to generally trend at or slightly below our 25% to 30% targeted range.
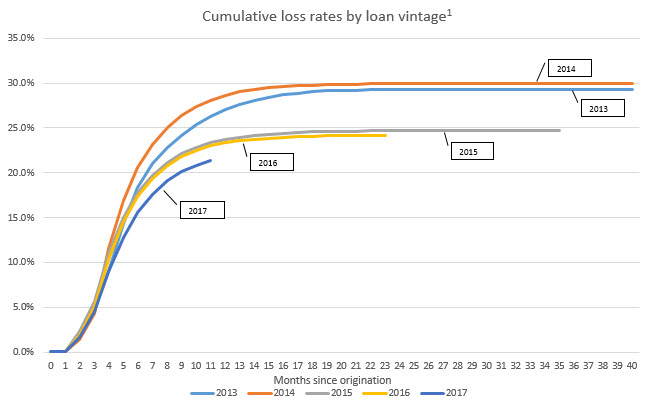
(1) The 2017 vintage is not yet fully mature from a loss perspective.
78
Margins
Twelve Months Ended December 31, | ||||||||||||
Margin metrics (dollars in thousands) | 2017 | 2016 | 2015 | |||||||||
Revenues | $ | 673,132 | $ | 580,441 | $ | 434,006 | ||||||
Net charge-offs(1) | (347,010 | ) | (299,700 | ) | (214,795 | ) | ||||||
Additional provision for loan losses(1) | (10,564 | ) | (18,121 | ) | (17,855 | ) | ||||||
Direct marketing costs | (72,222 | ) | (65,190 | ) | (61,032 | ) | ||||||
Other cost of sales | (20,536 | ) | (17,433 | ) | (15,197 | ) | ||||||
Gross profit | 222,800 | 179,997 | 125,127 | |||||||||
Operating expenses | (151,937 | ) | (132,193 | ) | (116,160 | ) | ||||||
Operating income | $ | 70,863 | $ | 47,804 | $ | 8,967 | ||||||
As a percentage of revenues: | ||||||||||||
Net charge-offs | 52 | % | 52 | % | 49 | % | ||||||
Additional provision for loan losses | 2 | 3 | 4 | |||||||||
Direct marketing costs | 11 | 11 | 14 | |||||||||
Other cost of sales | 3 | 3 | 4 | |||||||||
Gross margin | 33 | 31 | 29 | |||||||||
Operating expenses | 23 | 23 | 27 | |||||||||
Operating margin | 11 | % | 8 | % | 2 | % | ||||||
_________
(1) | Non-GAAP measure. See “—Non-GAAP Financial Measures—Net charge-offs and additional provision for loan losses.” |
Gross margin is calculated as revenues minus cost of sales, or gross profit, expressed as a percentage of revenues, and operating margin is calculated as operating income expressed as a percentage of revenues. We expect our margins to continue to increase as we continue to scale our business.
Recent operating margin trends. For the year ended December 31, 2017, our operating margin was 11%, which was an improvement from 8% in the prior year period and from 2% in 2015.
Our direct marketing expense as a percentage of revenue has declined over the past two years primarily due to two reasons. First, approximately 50% of our loan originations, on average each quarter, are from repeat customers, refinancings or Elastic customers utilizing additional funds on their line of credit. There is no direct marketing expense associated with any of these loan originations (all direct marketing expense is allocated to new customer loan originations). Thus, we are able to generate a significant amount of ongoing revenue from loan originations where we incur no additional direct marketing expense. As a result, year-over-year revenue growth was 16% for the year ended December 31, 2017, while direct marketing expenses increased only 11%. For the year ended December 31, 2016, year-over-year revenue growth was 34%, while direct marketing expenses increased only 7%.
Additionally, we continue to acquire new customers at a CAC lower than our targeted range of $250-$300 while continuing to have strong growth in the number of new customers acquired each year. For the years ended 2017 and 2016, our CAC was $237 and $235 due to continued strong growth in the Elastic product, which has the lowest CAC of our three products. Elastic's CAC is less than $200 primarily because we are able to market this product over a much broader geographic area than the Rise product (40 states versus Rise only marketed in 17 states).
Operating expenses as a percentage of revenues has generally declined over the past two years, although the percentage in 2017 was flat compared to 2016 due to an increase in share-based compensation associated with the IPO as well as some other IPO-related expenses. As we continue to further scale our business, we believe our operating expenses as a percentage of revenues should continue to decline to approximately 20% of revenues.
79
NON-GAAP FINANCIAL MEASURES
We believe that the inclusion of the following non-GAAP financial measures in this Annual Report on Form 10-K can provide a useful measure for period-to-period comparisons of our core business, provide transparency and useful information to investors and others in understanding and evaluating our operating results, and enable investors to better compare our operating performance with the operating performance of our competitors. Management uses these non-GAAP financial measures frequently in its decision-making because they provide supplemental information that facilitates internal comparisons to the historical operating performance of prior periods and give an additional indication of the Company’s core operating performance. However, non-GAAP financial measures are not a measure calculated in accordance with US GAAP, and should not be considered an alternative to any measures of financial performance calculated and presented in accordance with US GAAP. Other companies may calculate these non-GAAP financial measures differently than we do.
Adjusted EBITDA and Adjusted EBITDA Margin
Adjusted EBITDA represents our net income (loss), adjusted to exclude:
• | Net interest expense, primarily associated with notes payable under the VPC Facility and ESPV Facility used to fund our loans; |
• | Share-based compensation; |
• | Foreign currency transaction gains and losses associated with our UK operations; |
• | Depreciation and amortization expense on fixed assets and intangible assets; |
• | Income taxes; and |
• | Fair value gains and losses included in non-operating income (losses). |
Adjusted EBITDA margin is Adjusted EBITDA divided by revenue.
Management believes that Adjusted EBITDA and Adjusted EBITDA margin are useful supplemental measures to assist management and investors in analyzing the operating performance of the business and provide greater transparency into the results of operations of our core business.
Adjusted EBITDA and Adjusted EBITDA margin should not be considered as alternatives to net income (loss) or any other
performance measure derived in accordance with GAAP. Our use of Adjusted EBITDA and Adjusted EBITDA margin has limitations as an analytical tool, and you should not consider it in isolation or as a substitute for analysis of our results as reported under GAAP. Some of these limitations are:
• | Although depreciation and amortization are non-cash charges, the assets being depreciated and amortized may have to be replaced in the future, and Adjusted EBITDA does not reflect expected cash capital expenditure requirements for such replacements or for new capital assets; |
• | Adjusted EBITDA does not reflect changes in, or cash requirements for, our working capital needs; and |
• | Adjusted EBITDA does not reflect interest associated with notes payable used for funding our customer loans, for other corporate purposes or tax payments that may represent a reduction in cash available to us. |
80
The following table presents a reconciliation of net income (loss) to Adjusted EBITDA and Adjusted EBITDA margin for each of the periods indicated:
Twelve Months Ended December 31, | ||||||||||||
(dollars in thousands) | 2017 | 2016 | 2015 | |||||||||
Net loss | $ | (6,916 | ) | $ | (22,373 | ) | $ | (19,911 | ) | |||
Adjustments: | ||||||||||||
Net interest expense | 73,043 | 64,277 | 36,674 | |||||||||
Share-based compensation | 6,318 | 1,707 | 847 | |||||||||
Foreign currency transaction (gains) losses | (2,900 | ) | 8,809 | 2,385 | ||||||||
Depreciation and amortization | 10,272 | 10,906 | 8,898 | |||||||||
Non-operating (income) loss | (2,295 | ) | 43 | (5,523 | ) | |||||||
Income tax expense (benefit) | 9,931 | (2,952 | ) | (4,658 | ) | |||||||
Adjusted EBITDA | $ | 87,453 | $ | 60,417 | $ | 18,712 | ||||||
Adjusted EBITDA margin | 13 | % | 10 | % | 4 | % | ||||||
Free cash flow
Free cash flow (“FCF”) represents our net cash provided by operating activities, adjusted to include:
• | Net charge-offs – combined principal loans; and |
• | Capital expenditures. |
The following table presents a reconciliation of net cash provided by operating activities to FCF for each of the periods indicated:
Twelve Months Ended December 31, | ||||||||||||
(dollars in thousands) | 2017 | 2016 | 2015 | |||||||||
Net cash provided by operating activities(1)(2) | $ | 308,688 | $ | 248,633 | $ | 130,309 | ||||||
Adjustments: | ||||||||||||
Net charge-offs – combined principal loans | (275,192 | ) | (220,390 | ) | (150,091 | ) | ||||||
Capital expenditures | (16,755 | ) | (8,313 | ) | (9,272 | ) | ||||||
FCF | $ | 16,741 | $ | 19,930 | $ | (29,054 | ) | |||||
_________
(1) | Net cash provided by operating activities includes net charge-offs – combined finance charges. |
(2) | Certain amounts in the prior periods presented herein have been reclassified to conform to the current period financial statement presentation related to approximately $99,000 of Principal collections and recoveries on loans receivable that were being inappropriately included in operating activities on the Consolidated Statement of Cash Flows for the twelve months ended December 31, 2016, as discussed in Note 1—Basis of Presentation and Accounting Changes of the consolidated financial statements. |
Net charge-offs and additional provision for loan losses
We break out our total provision for loan losses into two separate items—first, the amount related to net charge-offs, and second, the additional provision for loan losses needed to adjust the combined loan loss reserve to the appropriate amount at the end of each month based on our loan loss provision methodology. We believe this presentation provides more detail related to the components of our total provision for loan losses when analyzing the gross margin of our business.
Net charge-offs. Net charge-offs comprise gross charge-offs offset by recoveries on prior charge-offs. Gross charge-offs include the amount of principal and accrued interest on loans that are more than 60 days past due, or sooner if we receive notice that the loan will not be collected, such as a bankruptcy notice or identified fraud. Any payments received on loans that have been charged off are recorded as recoveries and reduce the amount of gross charge-offs.
81
Additional provision for loan losses. Additional provision for loan losses is the amount of provision for loan losses needed for a particular period to adjust the combined loan loss reserve to the appropriate level in accordance with our underlying loan loss reserve methodology.
Twelve Months Ended December 31, | ||||||||||||
(dollars in thousands) | 2017 | 2016 | 2015 | |||||||||
Net charge-offs | $ | 347,010 | $ | 299,700 | $ | 214,795 | ||||||
Additional provision for loan losses | 10,564 | 18,121 | 17,855 | |||||||||
Provision for loan losses | $ | 357,574 | $ | 317,821 | $ | 232,650 | ||||||
Combined loan information
The Elastic line of credit product is originated by a third party lender, Republic Bank, which initially provides all of the funding for that product. Republic Bank retains 10% of the balances of all of the loans originated and sells a 90% loan participation in the Elastic lines of credit to a third party SPV, Elastic SPV, Ltd. Elevate is required to consolidate Elastic SPV, Ltd. as a variable interest entity under US GAAP and the consolidated financial statements include revenue, losses and loans receivable related to the 90% of Elastic lines of credit originated by Republic Bank and sold to Elastic SPV.
The information presented in the tables below on a combined basis are non-GAAP measures based on a combined portfolio of loans, which includes the total amount of outstanding loans receivable that we own and that are on our balance sheet plus outstanding loans receivable originated and owned by third parties that we guarantee pursuant to CSO programs in which we participate. See “—Basis of Presentation and Critical Accounting Policies—Allowance and liability for estimated losses on consumer loans” and “—Basis of Presentation and Critical Accounting Policies—Liability for estimated losses on credit service organization loans.”
We believe these non-GAAP measures provide investors with important information needed to evaluate the magnitude of potential loan losses and the opportunity for revenue performance of the combined loan portfolio on an aggregate basis. We also believe that the comparison of the combined amounts from period to period is more meaningful than comparing only the amounts reflected on our balance sheet since both revenues and cost of sales as reflected in our financial statements are impacted by the aggregate amount of loans we own and those CSO loans we guarantee.
Our use of total combined loans and fees receivable has limitations as an analytical tool, and you should not consider it in isolation or as a substitute for analysis of our results as reported under US GAAP. Some of these limitations are:
• | Rise CSO loans are originated and owned by a third party lender; and |
• | Rise CSO loans are funded by a third party lender and are not part of the VPC Facility. |
As of each of the period ends indicated, the following table presents a reconciliation of:
• | Loans receivable, net, Company owned (which reconciles to our consolidated balance sheets included elsewhere in this Annual Report on Form 10-K); |
• | Loans receivable, net, guaranteed by the Company (as disclosed in Note 1 of our consolidated financial statements included elsewhere in this Annual Report on Form 10-K); |
• | Combined loans receivable (which we use as a non-GAAP measure); and |
• | Combined loan loss reserve (which we use as a non-GAAP measure). |
82
2015 | 2016 | 2017 | ||||||||||||||||||||||||||||||||||
(dollars in thousands) | December 31 | March 31 | June 30 | September 30 | December 31 | March 31 | June 30 | September 30 | December 31 | |||||||||||||||||||||||||||
Company Owned Loans: | ||||||||||||||||||||||||||||||||||||
Loans receivable – principal, current, company owned(5) | $ | 271,415 | $ | 255,543 | $ | 294,559 | $ | 352,595 | $ | 387,142 | $ | 367,744 | $ | 403,944 | $ | 450,891 | $ | 514,147 | ||||||||||||||||||
Loans receivable – principal, past due, company owned(5) | 40,695 | 34,471 | 41,475 | 57,811 | 57,342 | 48,007 | 45,839 | 61,040 | 61,856 | |||||||||||||||||||||||||||
Loans receivable – principal, total, company owned | 312,110 | 290,014 | 336,034 | 410,406 | 444,484 | 415,751 | 449,783 | 511,931 | 576,003 | |||||||||||||||||||||||||||
Loans receivable – finance charges, company owned | 21,869 | 19,045 | 20,093 | 22,745 | 25,630 | 21,359 | 21,866 | 27,625 | 36,562 | |||||||||||||||||||||||||||
Loans receivable – company owned | 333,979 | 309,059 | 356,127 | 433,151 | 470,114 | 437,110 | 471,649 | 539,556 | 612,565 | |||||||||||||||||||||||||||
Allowance for loan losses on loans receivable, company owned | (59,771 | ) | (51,296 | ) | (54,873 | ) | (73,019 | ) | (77,451 | ) | (69,798 | ) | (66,030 | ) | (80,972 | ) | (87,946 | ) | ||||||||||||||||||
Loans receivable, net, company owned | $ | 274,208 | $ | 257,763 | $ | 301,254 | $ | 360,132 | $ | 392,663 | $ | 367,312 | $ | 405,619 | $ | 458,584 | $ | 524,619 | ||||||||||||||||||
Third Party Loans Guaranteed by the Company: | ||||||||||||||||||||||||||||||||||||
Loans receivable – principal, current, guaranteed by company(5) | $ | 40,696 | $ | 28,556 | $ | 34,748 | $ | 35,388 | $ | 34,466 | $ | 27,841 | $ | 30,210 | $ | 35,690 | $ | 41,220 | ||||||||||||||||||
Loans receivable – principal, past due, guaranteed by company(5) | 3,263 | 2,112 | 2,911 | 2,465 | 2,260 | 957 | 1,066 | 1,267 | 1,152 | |||||||||||||||||||||||||||
Loans receivable – principal, total, guaranteed by company(1) | 43,959 | 30,668 | 37,659 | 37,853 | 36,726 | 28,798 | 31,276 | 36,957 | 42,372 | |||||||||||||||||||||||||||
Loans receivable – finance charges, guaranteed by company(2) | 128 | 1,541 | 1,626 | 3,129 | 3,772 | 2,754 | 2,365 | 2,751 | 3,093 | |||||||||||||||||||||||||||
Loans receivable – guaranteed by company | 44,087 | 32,209 | 39,285 | 40,982 | 40,498 | 31,552 | 33,641 | 39,708 | 45,465 | |||||||||||||||||||||||||||
Liability for losses on loans receivable, guaranteed by company | (6,013 | ) | (4,296 | ) | (7,124 | ) | (5,866 | ) | (4,925 | ) | (3,565 | ) | (3,810 | ) | (5,097 | ) | (5,843 | ) | ||||||||||||||||||
Loans receivable, net, guaranteed by company(3) | $ | 38,074 | $ | 27,913 | $ | 32,161 | $ | 35,116 | $ | 35,573 | $ | 27,987 | $ | 29,831 | $ | 34,611 | $ | 39,622 | ||||||||||||||||||
Combined Loans Receivable(3): | ||||||||||||||||||||||||||||||||||||
Combined loans receivable – principal, current(5) | $ | 312,111 | $ | 284,099 | $ | 329,307 | $ | 387,983 | $ | 421,608 | $ | 395,585 | $ | 434,154 | $ | 486,581 | $ | 555,367 | ||||||||||||||||||
Combined loans receivable – principal, past due(5) | 43,958 | 36,583 | 44,386 | 60,276 | 59,602 | 48,964 | 46,905 | 62,307 | 63,008 | |||||||||||||||||||||||||||
Combined loans receivable – principal | 356,069 | 320,682 | 373,693 | 448,259 | 481,210 | 444,549 | 481,059 | 548,888 | 618,375 | |||||||||||||||||||||||||||
Combined loans receivable – finance charges | 21,997 | 20,586 | 21,719 | 25,874 | 29,402 | 24,113 | 24,231 | 30,376 | 39,655 | |||||||||||||||||||||||||||
Combined loans receivable | $ | 378,066 | $ | 341,268 | $ | 395,412 | $ | 474,133 | $ | 510,612 | $ | 468,662 | $ | 505,290 | $ | 579,264 | $ | 658,030 | ||||||||||||||||||
83
2015 | 2016 | 2017 | ||||||||||||||||||||||||||||||||||
(dollars in thousands) | December 31 | March 31 | June 30 | September 30 | December 31 | March 31 | June 30 | September 30 | December 31 | |||||||||||||||||||||||||||
Combined Loan Loss Reserve(3): | ||||||||||||||||||||||||||||||||||||
Allowance for loan losses on loans receivable, company owned | $ | (59,771 | ) | $ | (51,296 | ) | $ | (54,873 | ) | $ | (73,019 | ) | $ | (77,451 | ) | $ | (69,798 | ) | $ | (66,030 | ) | $ | (80,972 | ) | $ | (87,946 | ) | |||||||||
Liability for losses on loans receivable, guaranteed by company | (6,013 | ) | (4,296 | ) | (7,124 | ) | (5,866 | ) | (4,925 | ) | (3,565 | ) | (3,810 | ) | (5,097 | ) | (5,843 | ) | ||||||||||||||||||
Combined loan loss reserve | $ | (65,784 | ) | $ | (55,592 | ) | $ | (61,997 | ) | $ | (78,885 | ) | $ | (82,376 | ) | $ | (73,363 | ) | $ | (69,840 | ) | $ | (86,069 | ) | $ | (93,789 | ) | |||||||||
Combined loans receivable – principal, past due(3)(5) | $ | 43,958 | $ | 36,583 | $ | 44,386 | $ | 60,276 | $ | 59,602 | $ | 48,964 | $ | 46,905 | $ | 62,307 | $ | 63,008 | ||||||||||||||||||
Combined loans receivable – principal(3) | 356,069 | 320,682 | 373,693 | 448,259 | 481,210 | 444,549 | 481,059 | 548,888 | 618,375 | |||||||||||||||||||||||||||
Percentage past due(5) | 12 | % | 11 | % | 12 | % | 13 | % | 12 | % | 11 | % | 10 | % | 11 | % | 10 | % | ||||||||||||||||||
Combined loan loss reserve as a percentage of combined loans receivable(3)(4) | 17 | % | 16 | % | 16 | % | 17 | % | 16 | % | 16 | % | 14 | % | 15 | % | 14 | % | ||||||||||||||||||
Allowance for loan losses as a percentage of loans receivable – company owned | 18 | % | 17 | % | 15 | % | 17 | % | 16 | % | 16 | % | 14 | % | 15 | % | 14 | % | ||||||||||||||||||
_________
(1) | Represents loans originated by third-party lenders through the CSO programs, which are not included in our financial statements. |
(2) | Represents finance charges earned by third-party lenders through the CSO programs, which are not included in our financial statements. |
(3) | Non-GAAP measure. |
(4) | Combined loan loss reserve as a percentage of combined loans receivable is determined using period-end balances. |
(5) | Certain amounts in the prior periods presented here have been reclassified to conform to the current period financial statement presentation related to customers within the 16 day grace period that were reported as past due that were in fact current in accordance with our policy as discussed in Note 1—Basis of Presentation and Accounting Changes. |
84
COMPONENTS OF OUR RESULTS OF OPERATIONS
Revenues
Our revenues are composed of Rise finance charges and CSO fees, finance charges on Sunny installment loans, cash advance fees attributable to the participation in Elastic lines of credit that we consolidate and marketing and licensing fees received from third-party lenders related to the Rise CSO and Elastic products. See “—Overview” above for further information on the structure of Elastic.
Cost of sales
Provision for loan losses. Provision for loan losses consists of amounts charged against income during the period related to net charge-offs and the additional provision for loan losses needed to adjust the loan loss reserve to the appropriate amount at the end of each month based on our loan loss methodology.
Direct marketing costs. Direct marketing costs consist of online marketing costs such as sponsored search and advertising on social networking sites, and other marketing costs such as purchased television and radio air time and direct mail print advertising. In addition, direct marketing cost includes affiliate costs paid to marketers in exchange for referrals of potential customers. All direct marketing costs are expensed as incurred.
Other cost of sales. Other cost of sales includes data verification costs associated with the underwriting of potential customers and automated clearinghouse (“ACH”) transaction costs associated with customer loan funding and payments.
Operating expenses
Operating expenses consist of compensation and benefits, professional services, selling and marketing, occupancy and equipment, depreciation and amortization as well as other miscellaneous expenses.
Compensation and benefits. Salaries and personnel-related costs, including benefits, bonuses and share-based compensation expense, comprise a majority of our operating expenses and these costs are driven by our number of employees.
Professional services. These operating expenses include costs associated with legal, accounting and auditing, recruiting and outsourced customer support and collections.
Selling and marketing. Selling and marketing costs include costs associated with the use of agencies that perform creative services and monitor and measure the performance of the various marketing channels. Selling and marketing costs also include the production costs associated with media advertisements that are expensed as incurred over the licensing or production period. These expenses do not include direct marketing costs incurred to acquire customers, which comprises CAC.
Occupancy and equipment. Occupancy and equipment includes rent expense on our leased facilities, as well as telephony and web hosting expenses.
Depreciation and amortization. We capitalize all acquisitions of property and equipment of $500 or greater as well as certain software development costs. Costs incurred in the preliminary stages of software development are expensed. Costs incurred thereafter, including external direct costs of materials and services as well as payroll and payroll-related costs, are capitalized. Post-development costs are expensed. Depreciation is computed using the straight-line method over the estimated useful lives of the depreciable assets.
Other income (expense)
Net interest expense. Net interest expense primarily includes the interest expense associated with the VPC Facility that funds the Rise and Sunny installment loans, and after July 1, 2015, the interest expense associated with the ESPV Facility related to the Elastic lines of credit and related Elastic SPV entity. For the year ended December 31, 2017, net interest expense also included amortization of the debt discount for the Convertible Term Notes.
Foreign currency transaction gain (loss). We incur foreign currency transaction gains and losses related to activities associated with our UK entity, Elevate Credit International, Ltd., primarily with regard to the VPC Facility used to fund Sunny installment loans.
85
Non-operating income. Non-operating income primarily includes gains and losses on adjustments to the fair value of derivatives.
RESULTS OF OPERATIONS
The following table sets forth our consolidated statements of operations data for each of the periods indicated:
Years ended December 31, | ||||||||||||
Consolidated statements of operations data (dollars in thousands) | 2017 | 2016 | 2015 | |||||||||
Revenues | $ | 673,132 | $ | 580,441 | $ | 434,006 | ||||||
Cost of sales: | ||||||||||||
Provision for loan losses | 357,574 | 317,821 | 232,650 | |||||||||
Direct marketing costs | 72,222 | 65,190 | 61,032 | |||||||||
Other cost of sales | 20,536 | 17,433 | 15,197 | |||||||||
Total cost of sales | 450,332 | 400,444 | 308,879 | |||||||||
Gross profit | 222,800 | 179,997 | 125,127 | |||||||||
Operating expenses: | ||||||||||||
Compensation and benefits | 81,969 | 65,657 | 60,568 | |||||||||
Professional services | 32,848 | 30,659 | 25,134 | |||||||||
Selling and marketing | 8,353 | 9,684 | 7,567 | |||||||||
Occupancy and equipment | 13,895 | 11,475 | 9,690 | |||||||||
Depreciation and amortization | 10,272 | 10,906 | 8,898 | |||||||||
Other | 4,600 | 3,812 | 4,303 | |||||||||
Total operating expenses | 151,937 | 132,193 | 116,160 | |||||||||
Operating income | 70,863 | 47,804 | 8,967 | |||||||||
Other income (expense): | ||||||||||||
Net interest expense | (73,043 | ) | (64,277 | ) | (36,674 | ) | ||||||
Foreign currency transaction gain (loss) | 2,900 | (8,809 | ) | (2,385 | ) | |||||||
Non-operating income (loss) | 2,295 | (43 | ) | 5,523 | ||||||||
Total other expense | (67,848 | ) | (73,129 | ) | (33,536 | ) | ||||||
Income (loss) before taxes | 3,015 | (25,325 | ) | (24,569 | ) | |||||||
Income tax expense (benefit) | 9,931 | (2,952 | ) | (4,658 | ) | |||||||
Net loss | $ | (6,916 | ) | $ | (22,373 | ) | $ | (19,911 | ) | |||
86
Years ended December 31, | |||||||||
As a percentage of revenues | 2017 | 2016 | 2015 | ||||||
Cost of sales: | |||||||||
Provision for loan losses | 53 | % | 55 | % | 54 | % | |||
Direct marketing costs | 11 | 11 | 14 | ||||||
Other cost of sales | 3 | 3 | 4 | ||||||
Total cost of sales | 67 | 69 | 71 | ||||||
Gross profit | 33 | 31 | 29 | ||||||
Operating expenses: | |||||||||
Compensation and benefits | 12 | 11 | 14 | ||||||
Professional services | 5 | 5 | 6 | ||||||
Selling and marketing | 1 | 2 | 2 | ||||||
Occupancy and equipment | 2 | 2 | 2 | ||||||
Depreciation and amortization | 2 | 2 | 2 | ||||||
Other | 1 | 1 | 1 | ||||||
Total operating expenses | 23 | 23 | 27 | ||||||
Operating income | 11 | 8 | 2 | ||||||
Other income (expense): | |||||||||
Net interest expense | (11 | ) | (11 | ) | (8 | ) | |||
Foreign currency transaction gain (loss) | — | (2 | ) | (1 | ) | ||||
Non-operating income (loss) | — | — | 1 | ||||||
Total other expense | (10 | ) | (13 | ) | (8 | ) | |||
Income (loss) before taxes | — | (4 | ) | (6 | ) | ||||
Income tax expense (benefit) | 1 | (1 | ) | (1 | ) | ||||
Net loss | (1 | )% | (4 | )% | (5 | )% | |||
Comparison of the years ended December 31, 2017 and 2016
Revenues
Years ended December 31, | |||||||||||||||||||||
2017 | 2016 | Period-to-period change | |||||||||||||||||||
(dollars in thousands) | Amount | Percentage of revenues | Amount | Percentage of revenues | Amount | Percentage | |||||||||||||||
Finance charges | $ | 666,554 | 99 | % | $ | 578,417 | 100 | % | $ | 88,137 | 15 | % | |||||||||
Other | 6,578 | 1 | 2,024 | — | 4,554 | 225 | |||||||||||||||
Revenues | $ | 673,132 | 100 | % | $ | 580,441 | 100 | % | $ | 92,691 | 16 | % | |||||||||
87
Revenues increased by $92.7 million, or 16%, from $580.4 million for the year ended December 31, 2016 to $673.1 million for the year ended December 31, 2017. This growth in revenues was primarily attributable to increased finance charges driven by growth in our average loan balances, partially offset by a decrease in our overall APR, as illustrated in the tables below. In addition, the delay in the 2017 tax refund season cost us approximately $10 million of revenue growth this year. We also recognized approximately $5 million less revenue this year, primarily related to Elastic, resulting from the 2017 hurricanes. The September and October 2017 direct mail drops for acquiring Elastic customers, which we committed to in early August 2017, had much lower customer response rates in Texas and Florida. Over time, we expect our average customer loan balance to continue to increase and the related overall effective APR of our loan portfolio to decrease as our loan portfolio continues to grow and mature with more existing and repeat customers who pay lower interest rates over time. The increase in Other revenues was due to an increase in marketing and licensing fees received from the originating lenders related to the Elastic product and Rise CSO programs.
The tables below break out this change in revenue (including CSO fees and cash advance fees) by product:
Year ended December 31, 2017 | ||||||||||||||||||||
(dollars in thousands) | Rise (US) | Elastic (US) | Total Domestic | Sunny (UK) | Total | |||||||||||||||
Average combined loans receivable – principal(1) | $ | 261,101 | $ | 202,530 | $ | 463,631 | $ | 43,297 | $ | 506,928 | ||||||||||
Effective APR | 141 | % | 97 | % | 122 | % | 237 | % | 131 | % | ||||||||||
Finance charges | $ | 368,453 | $ | 195,592 | $ | 564,045 | $ | 102,509 | $ | 666,554 | ||||||||||
Other | 4,345 | 1,926 | 6,271 | 307 | 6,578 | |||||||||||||||
Total revenue | $ | 372,798 | $ | 197,518 | $ | 570,316 | $ | 102,816 | $ | 673,132 | ||||||||||
Year ended December 31, 2016 | ||||||||||||||||||||
(dollars in thousands) | Rise (US) | Elastic (US) | Total Domestic | Sunny (UK) | Total | |||||||||||||||
Average combined loans receivable – principal(1) | $ | 244,201 | $ | 109,892 | $ | 354,093 | $ | 41,123 | $ | 395,216 | ||||||||||
Effective APR | 156 | % | 91 | % | 136 | % | 233 | % | 146 | % | ||||||||||
Finance charges | $ | 382,163 | $ | 100,276 | $ | 482,439 | $ | 95,978 | $ | 578,417 | ||||||||||
Other | 572 | 1,451 | 2,023 | 1 | 2,024 | |||||||||||||||
Total revenue | $ | 382,735 | $ | 101,727 | $ | 484,462 | $ | 95,979 | $ | 580,441 | ||||||||||
_________
(1) | Average combined loans receivable – principal is calculated using daily principal balances. |
88
During the year ended December 31, 2017, our average combined loans receivable – principal increased $111.7 million compared to the prior year period as we continued to market our Rise, Sunny and Elastic products in the US and UK. As a result of the increased average combined loans receivable – principal, finance charges increased $146.3 million during the year ended December 31, 2017 compared to the prior year. This increase was offset by a $59.3 million decrease due to a reduction in our average APR due to the strong growth in Elastic, which has the lowest APR of the three products, the state mix of new Rise loans favoring lower APR states such as Georgia and Illinois, and as the Rise and Sunny installment loan portfolios continue to mature and existing customers continue to receive lower rates on subsequent loans. This decrease was partially offset by the impact of foreign currency translation changes. We expect this trend of increasing average combined loans receivable – principal year-over-year and lower average effective APR to continue.
Cost of sales
Years ended December 31, | Period-to-period change | ||||||||||||||||||||
2017 | 2016 | ||||||||||||||||||||
(dollars in thousands) | Amount | Percentage of revenues | Amount | Percentage of revenues | Amount | Percentage | |||||||||||||||
Cost of sales: | |||||||||||||||||||||
Provision for loan losses | $ | 357,574 | 53 | % | $ | 317,821 | 55 | % | $ | 39,753 | 13 | % | |||||||||
Direct marketing costs | 72,222 | 11 | 65,190 | 11 | 7,032 | 11 | |||||||||||||||
Other cost of sales | 20,536 | 3 | 17,433 | 3 | 3,103 | 18 | |||||||||||||||
Total cost of sales | $ | 450,332 | 67 | % | $ | 400,444 | 69 | % | $ | 49,888 | 12 | % | |||||||||
Provision for loan losses. Provision for loan losses increased by $39.8 million, or 13%, from $317.8 million for the year ended December 31, 2016 to $357.6 million for the year ended December 31, 2017 primarily due to a $47.3 million increase in net charge-offs resulting from an increase in the overall loan portfolio. This increase was accompanied by a decrease of $7.5 million in the additional provision for loan losses due to the improved credit quality of the portfolio.
The tables below break out these changes by loan product:
Year ended December 31, 2017 | ||||||||||||||||||||
(dollars in thousands) | Rise (US) | Elastic (US) | Total Domestic | Sunny (UK) | Total | |||||||||||||||
Combined loan loss reserve(1): | ||||||||||||||||||||
Beginning balance | $ | 53,336 | $ | 19,389 | $ | 72,725 | $ | 9,651 | $ | 82,376 | ||||||||||
Net charge-offs | (209,533 | ) | (99,283 | ) | (308,816 | ) | (38,194 | ) | (347,010 | ) | ||||||||||
Provision for loan losses | 212,064 | 108,764 | 320,828 | 36,746 | 357,574 | |||||||||||||||
Effect of foreign currency | — | — | — | 849 | 849 | |||||||||||||||
Ending balance | $ | 55,867 | $ | 28,870 | $ | 84,737 | $ | 9,052 | $ | 93,789 | ||||||||||
Combined loans receivable(1)(2) | $ | 342,652 | $ | 261,222 | $ | 603,874 | $ | 54,156 | $ | 658,030 | ||||||||||
Combined loan loss reserve as a percentage of ending combined loans receivable | 16 | % | 11 | % | 14 | % | 17 | % | 14 | % | ||||||||||
Net charge-offs as a percentage of revenues | 56 | % | 50 | % | 54 | % | 37 | % | 52 | % | ||||||||||
Provision for loan losses as a percentage of revenues | 57 | % | 55 | % | 56 | % | 36 | % | 53 | % | ||||||||||
89
Year ended December 31, 2016 | ||||||||||||||||||||
(dollars in thousands) | Rise (US) | Elastic (US) | Total Domestic | Sunny (UK) | Total | |||||||||||||||
Combined loan loss reserve(1): | ||||||||||||||||||||
Beginning balance | $ | 46,635 | $ | 10,016 | $ | 56,651 | $ | 9,133 | $ | 65,784 | ||||||||||
Net charge-offs | (214,328 | ) | (49,089 | ) | (263,417 | ) | (36,283 | ) | (299,700 | ) | ||||||||||
Provision for loan losses | 221,029 | 58,462 | 279,491 | 38,330 | 317,821 | |||||||||||||||
Effect of foreign currency | — | — | — | (1,529 | ) | (1,529 | ) | |||||||||||||
Ending balance | $ | 53,336 | $ | 19,389 | $ | 72,725 | $ | 9,651 | $ | 82,376 | ||||||||||
Combined loans receivable(1)(2) | $ | 289,348 | $ | 174,574 | $ | 463,922 | $ | 46,690 | $ | 510,612 | ||||||||||
Combined loan loss reserve as a percentage of ending combined loans receivable | 18 | % | 11 | % | 16 | % | 21 | % | 16 | % | ||||||||||
Net charge-offs as a percentage of revenues | 56 | % | 48 | % | 54 | % | 38 | % | 52 | % | ||||||||||
Provision for loan losses as a percentage of revenues | 58 | % | 57 | % | 58 | % | 40 | % | 55 | % | ||||||||||
_________
(1) | Not a financial measure prepared in accordance with US GAAP. See “—Non-GAAP Financial Measures” for more information and for a reconciliation to the most directly comparable financial measure calculated in accordance with US GAAP. |
(2) | Includes loans originated by third-party lenders through the CSO programs, which are not included in our financial statements. |
Net charge-offs increased $47.3 million for the year ended December 31, 2017 compared to the year ended December 31, 2016, primarily due to loan growth in the Elastic product during 2017. Net charge-offs as a percentage of revenues for the year ended December 31, 2017 totaled 52%, which was consistent with the prior year and within our targeted range of 45% to 55% as discussed in "—Key Financial and Operating Metrics—Credit quality" above. Our net principal charge-offs as a percentage of average combined loans receivable - principal ranged from 12% to 15% for each quarter in 2017 as compared to 13% to 15% for each quarter in 2016. Loan loss provision for the year ended December 31, 2017 totaled 53% of revenues, down from 55% for the year ended December 31, 2016 due to a lower percentage of past due loan balances and improving overall portfolio credit quality. As a result, our combined loan loss reserve as a percentage of ending combined loans receivable decreased to 14% at December 31, 2017, down from 16% at December 31, 2016.
Direct marketing costs. Direct marketing costs increased by $7.0 million, or 11%, from $65.2 million for the year ended December 31, 2016 to $72.2 million for the year ended December 31, 2017. This increase was driven by strong growth in the number of new customers acquired, which increased to 305,186 for the year ended December 31, 2017 compared to 277,637 during the year ended December 31, 2016. The resulting CAC slightly increased by $2, or 1%, increasing to $237, from $235 in the prior year. The increase in the number of new customers was due primarily to continued growth in our Elastic product during the year.
Other cost of sales. Other cost of sales increased by $3.1 million, or 18%, from $17.4 million for the year ended December 31, 2016 to $20.5 million for the year ended December 31, 2017 due to increased data verification costs for all products and settlement expenses primarily related to the Sunny product.
90
Operating expenses
Years ended December 31, | Period-to-period change | ||||||||||||||||||||
2017 | 2016 | ||||||||||||||||||||
(dollars in thousands) | Amount | Percentage of revenues | Amount | Percentage of revenues | Amount | Percentage | |||||||||||||||
Operating expenses: | |||||||||||||||||||||
Compensation and benefits | $ | 81,969 | 12 | % | $ | 65,657 | 11 | % | $ | 16,312 | 25 | % | |||||||||
Professional services | 32,848 | 5 | 30,659 | 5 | 2,189 | 7 | |||||||||||||||
Selling and marketing | 8,353 | 1 | 9,684 | 2 | (1,331 | ) | (14 | ) | |||||||||||||
Occupancy and equipment | 13,895 | 2 | 11,475 | 2 | 2,420 | 21 | |||||||||||||||
Depreciation and amortization | 10,272 | 2 | 10,906 | 2 | (634 | ) | (6 | ) | |||||||||||||
Other | 4,600 | 1 | 3,812 | 1 | 788 | 21 | |||||||||||||||
Total operating expenses | $ | 151,937 | 23 | % | $ | 132,193 | 23 | % | $ | 19,744 | 15 | % | |||||||||
Compensation and benefits. Compensation and benefits increased by $16.3 million, or 25%, from $65.7 million for the year ended December 31, 2016 to $82.0 million for the year ended December 31, 2017 primarily due to an increase in the number of employees as we continue to scale our business and an increase in share-based compensation expense related to our IPO.
Professional services. Professional services increased by $2.2 million, or 7%, from $30.7 million for the year ended December 31, 2016 to $32.8 million for the year ended December 31, 2017 primarily due to increased expenses as a result of becoming a public company.
Selling and marketing. Selling and marketing decreased by $1.3 million, or 14%, from $9.7 million for the year ended December 31, 2016 to $8.4 million for the year ended December 31, 2017 primarily due to decreased advertising agency costs.
Occupancy and equipment. Occupancy and equipment increased by $2.4 million, or 21%, from $11.5 million for the year ended December 31, 2016 to $13.9 million for the year ended December 31, 2017 primarily due to increased licenses and facilities rent expense needed to support an increased number of employees as we continue to scale our business.
Depreciation and amortization. Depreciation and amortization decreased by $0.6 million, or 6%, from $10.9 million for the year ended December 31, 2016 to $10.3 million for the year ended December 31, 2017 primarily due to certain capitalized internally developed software costs fully depreciating during the year.
Other expenses. Other expenses increased by $0.8 million, or 21%, from $3.8 million for the year ended December 31, 2016 to $4.6 million for the year ended December 31, 2017 due to costs associated with scaling our business.
Net interest expense
Years ended December 31, | Period-to-period change | ||||||||||||||||||||
2017 | 2016 | ||||||||||||||||||||
(dollars in thousands) | Amount | Percentage of revenues | Amount | Percentage of revenues | Amount | Percentage | |||||||||||||||
Net interest expense | $ | 73,043 | 11 | % | $ | 64,277 | 11 | % | $ | 8,766 | 14 | % | |||||||||
91
Net interest expense increased $8.8 million, or 14%, during the year ended December 31, 2017 versus the year ended December 31, 2016. This increase was related to increased borrowings under the ESPV Facility used to fund the strong loan growth of our Elastic product during 2017. While our Rise and Sunny loans also experienced loan growth during 2017, we used substantially all of our net IPO proceeds to pay down the VPC Facility used to fund these products, thus reducing the amount of interest expense incurred in 2017 related to these two products.
The following table shows the effective cost of funds of each debt facility for the period:
Years ended December 31, | ||||||||
(dollars in thousands) | 2017 | 2016 | ||||||
VPC Facility | ||||||||
Average facility balance during the period | $ | 307,369 | $ | 308,873 | ||||
Net interest expense | 47,915 | 50,119 | ||||||
Less: acceleration of debt discount associated with the repayment of the Convertible Term Note | (1,974 | ) | — | |||||
Net interest expense, as adjusted | $ | 45,941 | $ | 50,119 | ||||
Cost of funds | 15.6 | % | 16.2 | % | ||||
Cost of funds, as adjusted | 15.0 | % | 16.2 | % | ||||
ESPV Facility | ||||||||
Average facility balance during the period | $ | 174,974 | $ | 100,657 | ||||
Net interest expense | 25,128 | 14,158 | ||||||
Cost of funds | 14.4 | % | 14.1 | % | ||||
Foreign currency transaction gain (loss)
During the year ended December 31, 2017, we realized a $2.9 million gain in foreign currency remeasurement primarily related to the debt facility that our UK entity, Elevate Credit International, Ltd., has with a third party lender, VPC, which is partially denominated in US dollars. The foreign currency remeasurement loss for the year ended December 31, 2016 was $8.8 million and was realized due to the drop in the foreign exchange rate with the pound after the Brexit vote in June 2016. We have reduced our exposure to foreign exchange gains or losses due to $11.1 million of the UK Term Note now being denominated in GBP.
Non-operating income (expense)
During the year ended December 31, 2017, we recognized $2.3 million in non-operating income related to the change in fair value on the embedded derivative in the Convertible Term Notes as discussed in Note 11—Fair Value Measurements in the Consolidated Financial Statements. There was minimal non-operating income or expense recognized in the prior year as the $10 million drawn on the Convertible Term Notes at December 31, 2016 was drawn close to the end of the year so the fair value had not changed significantly by the end of 2016.
Income tax expense (benefit)
Years ended December 31, | Period-to-period change | ||||||||||||||||||||
2017 | 2016 | ||||||||||||||||||||
(dollars in thousands) | Amount | Percentage of revenues | Amount | Percentage of revenues | Amount | Percentage | |||||||||||||||
Income tax expense (benefit) | $ | 9,931 | 1 | % | $ | (2,952 | ) | (1 | )% | $ | (12,883 | ) | (436 | )% | |||||||
Our income tax expense increased $12.9 million, or 436%, from a benefit of ($3.0) million for the year ended December 31, 2016 to an expense of $9.9 million for the year ended December 31, 2017. Due to the impact of US tax reform, US GAAP requires the remeasurement of all US deferred income tax assets and liabilities for temporary differences from the current tax rate of 35% to the new corporate tax rate of 21%. A cumulative adjustment of $12.5 million was recognized in income tax expense in the year ended December 31, 2017, which included the enactment date of the US tax reform law. The Company's consolidated effective tax rates were 329% and 12%, while the Company's US effective tax rates were 219% and 28% for the
92
years ended December 31, 2017 and 2016, respectively. Excluding the $12.5 million income tax expense charge due to the change in corporate tax reform, our 2017 consolidated and US effective tax rates would have been 84% and 56%, respectively. Our US effective tax rates are different from the standard corporate federal income tax rate of 35% primarily due to our corporate state tax obligations in the states where we have lending activities and our permanent non-deductible items. The Company's US cash effective tax rate was approximately 23% for the fourth quarter of 2017. Our UK operations have generated net operating losses which have a full valuation allowance provided due to the lack of sufficient objective evidence regarding the realizability of this asset. Therefore, no UK tax benefit has been recognized in the financial statements for the years ended December 31, 2017 and 2016.
Net loss
Years ended December 31, | Period-to-period change | ||||||||||||||||||||
2017 | 2016 | ||||||||||||||||||||
(dollars in thousands) | Amount | Percentage of revenues | Amount | Percentage of revenues | Amount | Percentage | |||||||||||||||
Net loss | $ | (6,916 | ) | (1 | )% | $ | (22,373 | ) | (4 | )% | $ | 15,457 | 69 | % | |||||||
Our net loss decreased $15.5 million, or 69%, from a net loss of $22.4 million for the year ended December 31, 2016 to $6.9 million for the year ended December 31, 2017. This decrease was due to an increase in revenue that resulted from an increase in our overall loan portfolio in addition to improved efficiencies as we continue to scale our business, partially offset by a $12.5 million one-time income tax expense charge related to the US tax reform law.
Comparison of the years ended December 31, 2016 and 2015
Revenues
Years ended December 31, | |||||||||||||||||||||
2016 | 2015 | Period-to-period change | |||||||||||||||||||
(dollars in thousands) | Amount | Percentage of revenues | Amount | Percentage of revenues | Amount | Percentage | |||||||||||||||
Finance charges | $ | 578,417 | 100 | % | $ | 432,385 | 100 | % | $ | 146,032 | 34 | % | |||||||||
Other | 2,024 | — | 1,621 | — | 403 | 25 | |||||||||||||||
Revenues | $ | 580,441 | 100 | % | $ | 434,006 | 100 | % | $ | 146,435 | 34 | % | |||||||||
Revenues increased by $146.4 million, or 34%, from $434.0 million for the year ended December 31, 2015 to $580.4 million for the year ended December 31, 2016. This growth in revenues was primarily attributable to increased finance charges driven by growth in our average loan balances, partially offset by a decrease in our overall APR, as illustrated in the tables below. Over time, we expect our average customer loan balance to continue to increase and the related overall effective APR of our loan portfolio to decrease as our loan portfolio continues to grow and mature with more existing and repeat customers who pay lower interest rates over time.
93
The tables below break out this change in revenue (including CSO fees and cash advance fees) by product:
Year ended December 31, 2016 | ||||||||||||||||||||
(dollars in thousands) | Rise (US) | Elastic (US) | Total Domestic | Sunny (UK) | Total | |||||||||||||||
Average combined loans receivable – principal(1) | $ | 244,201 | $ | 109,892 | $ | 354,093 | $ | 41,123 | $ | 395,216 | ||||||||||
Effective APR | 156 | % | 91 | % | 136 | % | 233 | % | 146 | % | ||||||||||
Finance charges | $ | 382,163 | $ | 100,276 | $ | 482,439 | $ | 95,978 | $ | 578,417 | ||||||||||
Other | 572 | 1,451 | 2,023 | 1 | 2,024 | |||||||||||||||
Total revenue | $ | 382,735 | $ | 101,727 | $ | 484,462 | $ | 95,979 | $ | 580,441 | ||||||||||
Year ended December 31, 2015 | ||||||||||||||||||||
(dollars in thousands) | Rise (US) | Elastic (US) | Total Domestic | Sunny (UK) | Total | |||||||||||||||
Average combined loans receivable – principal(1) | $ | 190,950 | $ | 27,158 | $ | 218,108 | $ | 31,950 | $ | 250,058 | ||||||||||
Effective APR | 172 | % | 87 | % | 161 | % | 252 | % | 173 | % | ||||||||||
Finance charges | $ | 328,213 | $ | 23,681 | $ | 351,894 | $ | 80,491 | $ | 432,385 | ||||||||||
Other | 929 | 688 | 1,617 | 4 | 1,621 | |||||||||||||||
Total revenue | $ | 329,142 | $ | 24,369 | $ | 353,511 | $ | 80,495 | $ | 434,006 | ||||||||||
_________
(1) | Average combined loans receivable – principal is calculated using daily principal balances. |
During the year ended December 31, 2016, our average combined loans receivable – principal increased $145.2 million as we continued to market our Rise, Elastic and Sunny products in the US and UK. As a result of the increased average combined loans receivable – principal, finance charges increased $211.9 million during the year ended December 31, 2017 compared to the prior year. This increase was offset by a $67.5 million decrease due to a reduction in our average APR. The overall APR of Rise dropped to 156% for the year ended December 31, 2016 compared to 172% for the year ended December 31, 2015 primarily due to our existing Rise customers continuing to receive lower rates. The APR of Sunny may also decrease over time as the portfolio matures and more existing customers receive lower rates on their loans.
Cost of sales
Years ended December 31, | Period-to-period change | ||||||||||||||||||||
2016 | 2015 | ||||||||||||||||||||
(dollars in thousands) | Amount | Percentage of revenues | Amount | Percentage of revenues | Amount | Percentage | |||||||||||||||
Cost of sales: | |||||||||||||||||||||
Provision for loan losses | $ | 317,821 | 55 | % | $ | 232,650 | 54 | % | $ | 85,171 | 37 | % | |||||||||
Direct marketing costs | 65,190 | 11 | 61,032 | 14 | 4,158 | 7 | |||||||||||||||
Other cost of sales | 17,433 | 3 | 15,197 | 4 | 2,236 | 15 | |||||||||||||||
Total cost of sales | $ | 400,444 | 69 | % | $ | 308,879 | 71 | % | $ | 91,565 | 30 | % | |||||||||
Provision for loan losses. Provision for loan losses increased by $85.2 million, or 37%, from $232.7 million for the year ended December 31, 2015 to $317.8 million for the year ended December 31, 2016 due to an increase in the overall loan portfolio. The provision for loan losses increase reflected an $84.9 million increase in net charge-offs combined with a $0.3 million increase in additional loss provisions.
94
The tables below break out these changes by loan product:
Year ended December 31, 2016 | ||||||||||||||||||||
(dollars in thousands) | Rise (US) | Elastic (US) | Total Domestic | Sunny (UK) | Total | |||||||||||||||
Combined loan loss reserve(1): | ||||||||||||||||||||
Beginning balance | $ | 46,635 | $ | 10,016 | $ | 56,651 | $ | 9,133 | $ | 65,784 | ||||||||||
Net charge-offs | (214,328 | ) | (49,089 | ) | (263,417 | ) | (36,283 | ) | (299,700 | ) | ||||||||||
Provision for loan losses | 221,029 | 58,462 | 279,491 | 38,330 | 317,821 | |||||||||||||||
Effect of foreign currency | — | — | — | (1,529 | ) | (1,529 | ) | |||||||||||||
Ending balance | $ | 53,336 | $ | 19,389 | $ | 72,725 | $ | 9,651 | $ | 82,376 | ||||||||||
Combined loans receivable(1)(2) | $ | 289,348 | $ | 174,574 | $ | 463,922 | $ | 46,690 | $ | 510,612 | ||||||||||
Combined loan loss reserve as a percentage of ending combined loans receivable | 18 | % | 11 | % | 16 | % | 21 | % | 16 | % | ||||||||||
Net charge-offs as a percentage of revenues | 56 | % | 48 | % | 54 | % | 38 | % | 52 | % | ||||||||||
Provision for loan losses as a percentage of revenues | 58 | % | 57 | % | 58 | % | 40 | % | 55 | % | ||||||||||
Year ended December 31, 2015 | ||||||||||||||||||||
(dollars in thousands) | Rise (US) | Elastic (US) | Total Domestic | Sunny (UK) | Total | |||||||||||||||
Combined loan loss reserve(1): | ||||||||||||||||||||
Beginning balance | $ | 39,311 | $ | 38 | $ | 39,349 | $ | 9,142 | $ | 48,491 | ||||||||||
Net charge-offs | (179,527 | ) | (9,844 | ) | (189,371 | ) | (25,424 | ) | (214,795 | ) | ||||||||||
Provision for loan losses | 186,851 | 19,822 | 206,673 | 25,977 | 232,650 | |||||||||||||||
Effect of foreign currency | — | — | — | (562 | ) | (562 | ) | |||||||||||||
Ending balance | $ | 46,635 | $ | 10,016 | $ | 56,651 | $ | 9,133 | $ | 65,784 | ||||||||||
Combined loans receivable(1)(2) | $ | 259,825 | $ | 76,031 | $ | 335,856 | $ | 42,210 | $ | 378,066 | ||||||||||
Combined loan loss reserve as a percentage of ending combined loans receivable | 18 | % | 13 | % | 17 | % | 22 | % | 17 | % | ||||||||||
Net charge-offs as a percentage of revenues | 55 | % | 40 | % | 54 | % | 32 | % | 49 | % | ||||||||||
Provision for loan losses as a percentage of revenues | 57 | % | 81 | % | 58 | % | 32 | % | 54 | % | ||||||||||
_________
(1) | Not a financial measure prepared in accordance with US GAAP. See “—Non-GAAP Financial Measures” for more information and for a reconciliation to the most directly comparable financial measure calculated in accordance with US GAAP. |
(2) | Includes loans originated by third-party lenders through the CSO programs, which are not included in our financial statements. |
Net charge-offs increased $84.9 million for the year ended December 31, 2016 versus the year ended December 31, 2015, primarily due to increases in all three products associated with growth in the respective loan portfolio during the year. Despite the large increase in absolute dollar amounts, overall net charge-offs as a percentage of revenues for the year ended December 31, 2016 was 52%, a slight increase from 49% for the comparable period in 2015 and within our targeted range of 45% to 55% as discussed in “—Key Financial and Operating Metrics—Credit quality” above. Our net principal charge-offs as a percentage of average combined loans receivable - principal ranged from 13% to 15% for each quarter in 2016 as compared to 14% to 16% for each quarter in 2015.
The combined loan loss reserve increased $16.6 million for the year ended December 31, 2016, as compared to a $17.3 million increase for the year ended December 31, 2015. This relatively smaller increase in the loan loss reserve was due to both more
95
of the growth in the loan portfolio being driven by the Elastic line of credit product, which has a lower loan loss reserve requirement, and continued improvement in credit quality as the portfolio continues to mature. The combined loan loss reserve as a percentage of total combined loans receivable was 16% as of December 31, 2016, a slight decrease compared to 17% as of December 31, 2015.
Direct marketing costs. Direct marketing costs increased by $4.2 million, or 7%, from $61.0 million for the year ended December 31, 2015 to $65.2 million for the year ended December 31, 2016 driven by an increase in the number of new customers acquired. For the year ended December 31, 2016, the number of new customers acquired increased to 277,637 compared to 238,238 during the year ended December 31, 2015. Despite the increase in direct marketing costs, CAC decreased $21, dropping to $235 from $256 a year earlier. Our targeted CAC is between $250 and $300 per customer on a consolidated basis.
Other cost of sales. Other cost of sales increased by $2.2 million, or 15%, from $15.2 million for the year ended December 31, 2015 to $17.4 million for the year ended December 31, 2016 due to increased data verification, ACH transactions and other costs associated with growth in our loan portfolio.
Operating expenses
Years ended December 31, | Period-to-period change | ||||||||||||||||||||
2016 | 2015 | ||||||||||||||||||||
(dollars in thousands) | Amount | Percentage of revenues | Amount | Percentage of revenues | Amount | Percentage | |||||||||||||||
Operating expenses: | |||||||||||||||||||||
Compensation and benefits | $ | 65,657 | 11 | % | $ | 60,568 | 14 | % | $ | 5,089 | 8 | % | |||||||||
Professional services | 30,659 | 5 | 25,134 | 6 | 5,525 | 22 | |||||||||||||||
Selling and marketing | 9,684 | 2 | 7,567 | 2 | 2,117 | 28 | |||||||||||||||
Occupancy and equipment | 11,475 | 2 | 9,690 | 2 | 1,785 | 18 | |||||||||||||||
Depreciation and amortization | 10,906 | 2 | 8,898 | 2 | 2,008 | 23 | |||||||||||||||
Other | 3,812 | 1 | 4,303 | 1 | (491 | ) | (11 | ) | |||||||||||||
Total operating expenses | $ | 132,193 | 23 | % | $ | 116,160 | 27 | % | $ | 16,033 | 14 | % | |||||||||
Compensation and benefits. Compensation and benefits increased by $5.1 million, or 8%, from $60.6 million for the year ended December 31, 2015 to $65.7 million for the year ended December 31, 2016 primarily due to an increase in the number of employees as we continue to scale our business.
Professional services. Professional services increased by $5.5 million, or 22%, from $25.1 million for the year ended December 31, 2015 to $30.7 million for the year ended December 31, 2016 due to increased costs from customer service support costs due to the growth in the overall loan portfolio and an increase in contractor expense to accelerate key development projects.
Selling and marketing. Selling and marketing increased by $2.1 million, or 28%, from $7.6 million for the year ended December 31, 2015 to $9.7 million for the year ended December 31, 2016 primarily due to increased creative agency costs associated with new TV commercials for advertising our Rise and Sunny installment loans.
Occupancy and equipment. Occupancy and equipment increased by $1.8 million, or 18%, from $9.7 million for the year ended December 31, 2015 to $11.5 million for the year ended December 31, 2016 primarily due to increased licenses and facilities rent expense needed to support an increased number of employees as we continue to scale our business.
Depreciation and amortization. Depreciation and amortization increased by $2.0 million, or 23%, from $8.9 million for the year ended December 31, 2015 to $10.9 million for the year ended December 31, 2016 due primarily to increases in equipment and internally-developed software projects placed into service during 2015 and 2016.
96
Other expenses. Other expenses decreased by $0.5 million, or 11%, from $4.3 million for the year ended December 31, 2015 to $3.8 million for the year ended December 31, 2016 due to decreased travel related expenses and other taxes.
Net interest expense
Years ended December 31, | Period-to-period change | ||||||||||||||||||||
2016 | 2015 | ||||||||||||||||||||
(dollars in thousands) | Amount | Percentage of revenues | Amount | Percentage of revenues | Amount | Percentage | |||||||||||||||
Net interest expense | $ | 64,277 | 11 | % | $ | 36,674 | 8 | % | $ | 27,603 | 75 | % | |||||||||
Net interest expense increased $27.6 million, or 75%, during the year ended December 31, 2016 versus the year ended December 31, 2015 as we expanded the debt facility with our third party lender, VPC, increasing the maximum total borrowing amount under the VPC Facility in February 2016 to $345 million from $335 million and then increasing it again in June 2016 to $395 million. In addition, the total borrowing amount under the ESPV Facility was amended in July 2016, increasing the maximum borrowing amount to $150 million from $100 million. At December 31, 2015, we had $339.8 million in notes payable outstanding under these debt facilities, which increased to $495.3 million at December 31, 2016. The interest rates on these notes varied from 10% to 18%.
The following table shows the effective cost of funds of each debt facility for the period:
Years ended December 31, | ||||||||
(dollars in thousands) | 2016 | 2015 | ||||||
VPC Facility | ||||||||
Average facility balance during the period | $ | 308,873 | $ | 212,827 | ||||
Net interest expense | 50,119 | 33,377 | ||||||
Cost of funds | 16.2 | % | 15.7 | % | ||||
ESPV Facility | ||||||||
Average facility balance during the period | $ | 100,657 | $ | 23,737 | ||||
Net interest expense | 14,158 | 3,297 | ||||||
Cost of funds | 14.1 | % | 13.9 | % | ||||
Foreign currency transaction gain (loss)
During the year ended December 31, 2016, we incurred $8.8 million in foreign currency remeasurement losses, primarily related to the debt facility our UK entity, Elevate Credit International, Ltd., has with a third party lender, VPC, which is denominated in US dollars. The remeasurement loss for the year ended December 31, 2015 was $2.4 million.
Non-operating income (loss)
For the year ended December 31, 2016, we incurred a non-operating loss of $43 thousand related to the derivative embedded in the Convertible Term Notes. For the year ended December 31, 2015, we realized non-operating income of $5.5 million. This income was realized in June 2015, when we entered into a consulting agreement with a related party whereby the related party agreed to release our $5.5 million contingent consideration payable to them, and, in exchange, we agreed to pay the related party a $300 thousand annual fee for the next five years for consulting services.
97
Income tax expense (benefit)
Years ended December 31, | Period-to-period change | ||||||||||||||||||||
2016 | 2015 | ||||||||||||||||||||
(dollars in thousands) | Amount | Percentage of revenues | Amount | Percentage of revenues | Amount | Percentage | |||||||||||||||
Income tax benefit | $ | (2,952 | ) | (1 | )% | $ | (4,658 | ) | (1 | )% | $ | (1,706 | ) | 37 | % | ||||||
Our income tax benefit decreased $1.7 million, or 37%, from $4.7 million for the year ended December 31, 2015 to $3.0 million for the year ended December 31, 2016. Our US effective tax rates for the years ended December 31, 2016 and 2015 were 28% and 32%, respectively. Our US effective tax rates are different from the standard corporate federal income tax rate of 35% primarily due to our corporate state tax obligations in the states where we have lending activities and our permanent non-deductible items. Our UK operations have generated net operating losses which have a full valuation allowance provided due to the lack of sufficient objective evidence regarding the realizability of this asset. Therefore, no UK tax benefit has been recognized in the financial statements for the years ended December 31, 2016 and 2015.
Net loss
Years ended December 31, | Period-to-period change | ||||||||||||||||||||
2016 | 2015 | ||||||||||||||||||||
(dollars in thousands) | Amount | Percentage of revenues | Amount | Percentage of revenues | Amount | Percentage | |||||||||||||||
Net loss | $ | (22,373 | ) | (4 | )% | $ | (19,911 | ) | (5 | )% | $ | (2,462 | ) | (12 | )% | ||||||
Our net loss increased $2.5 million, or 12%, from $19.9 million for the year ended December 31, 2015 to $22.4 million for the year ended December 31, 2016. This increase was primarily due to an increase in net interest expense, as discussed above, in addition to increased operating expenses. These increases were partially offset by increased gross profit that resulted from our growing loan portfolio.
LIQUIDITY AND CAPITAL RESOURCES
We principally rely on our working capital, funds from third party lenders under the CSO programs, and our credit facility with VPC to fund the loans we make to our customers.
Debt Facilities
VPC Facility
On January 30, 2014, we entered into the VPC Facility in order to fund our Rise and Sunny products and provide working capital. Since originally entering into the VPC Facility, it has been amended several times to increase the maximum total borrowing amount available and other terms of the VPC Facility.
The VPC Facility provided the following term notes as of December 31, 2017:
• | US Term Note with a maximum borrowing amount of $350 million at a base rate (defined as the 3-month LIBOR with a 1% floor) plus 11% for the outstanding balance used to fund the Rise loan portfolio. In addition to VPC, which has committed $290 million to this facility and funded the entire amount outstanding as of December 31, 2017, there are currently three other lenders that have committed $20 million each to this facility. Effective January 11, 2018, we entered into an interest rate cap to hedge any interest rate risk associated with the 3-month LIBOR. The interest rate cap limits our exposure to increases in 3-month LIBOR up to 1.75% on a notional amount of $240 million through February 1, 2019. |
• | UK Term Note with a maximum borrowing amount of approximately $48 million at a base rate (defined as the 3-month LIBOR rate) plus 16% used to fund the Sunny loan portfolio. This note was recently amended and the base rate decreased to 14% after January 30, 2018. |
98
• | 4th Tranche Term Note with a maximum borrowing amount of $25 million bearing interest at the greater of 18% or a base rate (defined as the 3-month LIBOR rate, with a 1% floor) plus 17% used to fund working capital. The base rate decreased to a base rate (defined as the 3-month LIBOR rate) plus 13% after January 30, 2018. |
• | Convertible Term Notes with a maximum borrowing amount of $10.1 million bearing interest at the greater of 10% or a base rate (defined as the 3-month LIBOR rate, with a 1% floor) plus 9%. The Company was required to draw-down the maximum borrowing amount of $25 million prior to January 5, 2017. The Company made an initial draw in October 2016 of $10 million and a subsequent draw in January 2017 of $15 million, bringing the total amount drawn-down on the Convertible Term Notes to $25 million. Pursuant to the terms of the Convertible Term Notes, if any amount of the Convertible Term Notes was repaid in cash rather than converted into shares of our common stock upon maturity, we would have been required to pay a premium to VPC, up to $5 million, based on the aggregate amount of the Convertible Term Notes that is repaid in cash in relation to the amount of debt outstanding under the Convertible Term Notes. The conversion feature terminated upon the Company’s IPO and $14.9 million of this facility was repaid in April 2017 with the pro rata portion of the prepayment premium waived. |
• | There are no principal payments due or scheduled under the VPC Facility until the maturity date of the US Term Note, the UK Term Note and the 4th Tranche Term Note on February 1, 2021, excluding $75 million currently outstanding under the US Term Note which has an August 13, 2018 maturity date. We currently expect this amount will not be repaid in 2018 but will instead be extended to a February 1, 2021 maturity date. |
All of our assets are pledged as collateral to secure the VPC Facility. The agreement contains customary financial covenants, including a maximum loan to value ratio of between 0.75 and 0.85, depending on the actual charge-off rate as of the relevant measurement date, a maximum principal charge-off rate of not greater than 20%, determined by the product of the ratio of principal balances charged-off or past due to principal balances due for the current, 1-30 and 31-60 delinquency status periods determined as of the month of charge-off and the preceding two month period, and a maximum first payment default rate of not greater than 20% for any month and not greater than 17.5% for any two months during any three month period. Additionally, our corporate cash balance must exceed $5 million at all times, and the book value of the equity must exceed $5 million as of the last day of any calendar month. The book value of equity covenant was temporarily amended to be $5 million for the December 31, 2016 date and was permanently lowered to $5 million effective February 1, 2017. We were in compliance with all covenants as of December 31, 2017.
The Convertible Term Notes were converted into the 4th Tranche Term Notes on January 30, 2018 per the terms of the VPC Facility. Additionally, the maturity of the Convertible Term Notes (due to their conversion to 4th Tranche Term Notes) was extended to February 1, 2021 and the debt discount on the Convertible Term Notes was fully amortized. Finally, the exit premium under the Convertible Term Notes of $2.0 million was due and paid on January 30, 2018. See Note 7—Notes Payable of our consolidated financial statements for additional information.
ESPV Facility
Elastic funding
The Elastic line of credit product is originated by a third-party lender, Republic Bank, which initially provides all of the funding for that product. Republic Bank retains 10% of the balances of all loans originated and sells a 90% loan participation in the Elastic lines of credit. We purchased such loan participations ourselves through June 30, 2015. As detailed below, beginning July 1, 2015, such participations are being sold to Elastic SPV.
Elastic SPV structure
As of July 1, 2015, loan participations are sold by Republic Bank to Elastic SPV. We do not own Elastic SPV, but effective July 1, 2015 we entered into a credit default protection agreement with Elastic SPV whereby we agreed to provide credit protection to the investors in Elastic SPV against Elastic loan losses in return for a credit premium. Per the terms of the agreement, under US GAAP, the Company qualifies as the primary beneficiary of Elastic SPV and we are required to consolidate the financial results of Elastic SPV as a variable interest entity in our consolidated financial results. Accordingly, the presentation of this structure does not differ from the presentation of the previous structure reflected in our financial statements, as we continue to earn revenues and incur losses on 90% of the Elastic lines of credit originated by Republic Bank that are sold to Elastic SPV.
99
Elastic SPV receives its funding from VPC in the ESPV Facility, which was finalized on July 13, 2015. The ESPV Facility provides for a maximum borrowing amount of $50 million at a base rate (defined as the greater of the 3-month LIBOR rate or 1% per annum) plus 13% for the outstanding balance up to $50 million. To continue to fund Elastic growth, as of October 21, 2015, the maximum borrowing amount was expanded to $100 million at a base rate plus 12% for any outstanding balance greater than $50 million. On July 14, 2016, the ESPV Facility was further amended, providing a credit facility with a maximum borrowing amount of $150 million. Interest is charged at a base rate (defined as the greater of the 3-month LIBOR rate or 1% per annum) plus 13% for the outstanding balance up to $50 million, 12% for the outstanding balance greater than $50 million, and 13.5% for the outstanding balance greater than $100 million.
On April 27, 2017, the ESPV Facility was further amended to increase the borrowing base to $250 million, decrease each of the interest rates by 1.0% effective July 1, 2019 and add a base rate (defined as the greater of the 3-month LIBOR or 1% per annum) plus 12.75% for borrowing amounts greater than $150 million, which will decrease to the base rate plus 11.75% effective July 1, 2019. The amendment also extended the maturity date for the ESPV Facility, to July 1, 2021. As of December 31, 2017, the base rate of the ESPV Facility was 1.3283% per annum for the outstanding balance. Effective January 11, 2018, ESPV entered into an interest rate cap to hedge any interest rate risk associated with the 3-month LIBOR. The interest rate cap limits ESPV's exposure to increases in 3-month LIBOR up to 1.75% on a notional amount of $216 million through February 1, 2019. There are no principal payments due or scheduled until the credit facility maturity date of July 1, 2021 excluding $49 million currently outstanding under the ESPV Facility which has an August 13, 2018 maturity date. We currently expect this amount will not be repaid on its original maturity date but will instead be extended to a July 1, 2021 maturity date.
All of our assets are pledged as collateral to secure the ESPV Facility. The agreement contains customary financial covenants, including a maximum loan to value ratio of between 0.75 and 0.85, depending on the actual charge off rate as of the relevant measurement date, a maximum principal charge-off rate of not greater than 20%, determined by the product of the ratio of principal balances charged-off or past due to principal balances due for the current, 1-30 and 31-60 delinquency status periods determined as of the month of charge-off and the preceding two month period, and a maximum first payment default rate of not greater than 15% for any one calendar month and for two months during any three month period. We were in compliance with all covenants as of December 31, 2017.
Early in 2018, we expect an additional SPV will be created as another funding source for the Elastic line of credit product. This additional SPV for Elastic would provide additional funding, diversified funding sources and further lower the cost of funds.
Outstanding Notes Payable
The outstanding balance of notes payable as of December 31, 2017 is as follows:
(dollars in thousands) | Capacity | Usage | ||||||
US Term Note bearing interest at 3-month LIBOR + 11% | $ | 350,000 | $ | 240,000 | ||||
UK Term Note bearing interest at 3-month LIBOR + 16% | 48,000 | 31,210 | ||||||
4th Tranche Term Note bearing interest at 3-month LIBOR + 17% | 25,000 | 25,000 | ||||||
Convertible Term Notes bearing interest at 3-month LIBOR + 9% | 10,050 | 10,050 | ||||||
ESPV Term Note bearing interest at 3-month LIBOR + 12-13.5% | 250,000 | 208,000 | ||||||
Total | $ | 683,050 | $ | 514,260 | ||||
The following table presents the future debt maturities as of December 31, 2017:
Year (dollars in thousands) | Amount | ||
2018 | $ | 124,000 | |
2019 | — | ||
2020 | — | ||
2021 | 390,260 | ||
2022 | — | ||
Total | $ | 514,260 | |
100
As noted above, all of the debt scheduled to mature in 2018 is expected to be extended to a 2021 maturity date.
Cash and cash equivalents, loans (net of allowance for loan losses), and cash flows
The following table summarizes our cash and cash equivalents, loans receivable, net and cash flows for the periods indicated:
As of and for the years ended December 31, | |||||||||||
(dollars in thousands) | 2017 | 2016 | 2015 | ||||||||
Cash and cash equivalents | $ | 41,142 | $ | 53,574 | 29,050 | ||||||
Loans receivable, net | 524,619 | 392,663 | 274,208 | ||||||||
Cash provided by (used in): | |||||||||||
Operating activities(1) | 308,688 | 248,633 | 130,309 | ||||||||
Investing activities(1) | (424,251 | ) | (375,810 | ) | (290,323 | ) | |||||
Financing activities | 102,695 | 152,222 | 159,979 | ||||||||
(1) | Certain amounts in 2016 presented herein have been reclassified to conform to the current period financial statement presentation related to approximately $99,000 of Principal collections and recoveries on loans receivable that were being inappropriately included in operating activities on the Consolidated Statement of Cash Flows for the twelve months ended 2016 as discussed in Note 1—Basis of Presentation and Accounting Changes of the consolidated financial statements. |
Our cash and cash equivalents at December 31, 2017 were held primarily for working capital purposes. We may, from time to time, use excess cash and cash equivalents to fund our lending activities. We do not enter into investments for trading or speculative purposes. Our policy is to invest any cash in excess of our immediate working capital requirements in investments designed to preserve the principal balance and provide liquidity. Accordingly, our excess cash is invested primarily in demand deposit accounts that are currently providing only a minimal return.
Net cash provided by operating activities
We generated $308.7 million in cash from our operating activities for the year ended December 31, 2017, primarily from revenues derived from our loan portfolio. This was up $60.1 million from the $248.6 million of cash provided by operating activities during the year ended December 31, 2016. This increase was the result of the growth in our loan portfolio in 2017, which contributed to the $92.7 million increase in our revenues for the year ended December 31, 2017 compared to the same prior year period. The increase from $130.3 million in the year ended December 31, 2015 to $248.6 million in the year ended December 31, 2016 was due to continued growth in revenues resulting from a corresponding increase in our loan portfolio.
Net cash used in investing activities
For the years ended December 31, 2017, 2016 and 2015, cash used in investing activities was $424.3 million, $375.8 million and $290.3 million, respectively. The increases were primarily due to increases in net loans issued to customers. The following table summarizes cash used in investing activities for the periods indicated:
For the years ended December 31, | ||||||||||||
(dollars in thousands) | 2017 | 2016 | 2015 | |||||||||
Cash used in investing activities | ||||||||||||
Net loans issued to consumers, less repayments(1) | $ | (402,006 | ) | $ | (364,163 | ) | $ | (286,389 | ) | |||
Participation premium paid | (5,680 | ) | (3,539 | ) | (1,019 | ) | ||||||
Purchases of property and equipment | (16,755 | ) | (8,313 | ) | (9,272 | ) | ||||||
Change in restricted cash | 190 | 205 | 6,357 | |||||||||
$ | (424,251 | ) | $ | (375,810 | ) | $ | (290,323 | ) | ||||
(1) | Certain amounts in 2016 presented herein have been reclassified to conform to the current period financial statement presentation related to approximately $99,000 of Principal collections and recoveries on loans receivable that were being inappropriately included in operating activities on the Consolidated Statement of Cash Flows for the twelve months ended 2016 as discussed in Note 1—Basis of Presentation and Accounting Changes of the consolidated financial statements. |
101
Net cash provided by financing activities
Cash flows from financing activities primarily include cash received from issuing common stock related to our IPO, issuing notes payable and related repayments of those notes payable. For the years ended December 31, 2017, 2016 and 2015, cash provided by financing activities was $102.7 million, $152.2 million and $161.9 million, respectively. The following table summarizes cash provided by (used in) financing activities for the periods indicated:
For the years ended December 31, | ||||||||||||
(dollars in thousands) | 2017 | 2016 | 2015 | |||||||||
Cash provided by (used in) financing activities | ||||||||||||
Proceeds of Notes payable, net | $ | 103,560 | $ | 155,500 | $ | 165,000 | ||||||
Payments on Notes payable | (84,950 | ) | — | — | ||||||||
Proceeds from issuance of stock, net | 86,699 | — | — | |||||||||
Other activities | (2,614 | ) | (3,278 | ) | (3,144 | ) | ||||||
$ | 102,695 | $ | 152,222 | $ | 161,856 | |||||||
The decrease in cash provided by financing activities for the year ended December 31, 2017 versus the comparable period of 2016 was due to using the IPO proceeds received to pay down portions of the VPC Facility in the second quarter of 2017.
Free Cash Flow
In addition to the above, we also review FCF when analyzing our cash flows from operations. We calculate free cash flow as cash flows from operating activities, adjusted for the principal loan net charge-offs and capital expenditures incurred during the period. While this is a non-GAAP measure, we believe it provides a useful presentation of cash flows derived from our core operating activities.
For the years ended December 31, | ||||||||||||
(dollars in thousands) | 2017 | 2016 | 2015 | |||||||||
Net cash provided by operating activities | $ | 308,688 | $ | 248,633 | $ | 130,309 | ||||||
Adjustments: | ||||||||||||
Net charge-offs – combined principal loans | (275,192 | ) | (220,390 | ) | (150,091 | ) | ||||||
Capital expenditures | (16,755 | ) | (8,313 | ) | (9,272 | ) | ||||||
FCF | $ | 16,741 | $ | 19,930 | $ | (29,054 | ) | |||||
Our FCF was $16.7 million for the year ended December 31, 2017 compared to $19.9 million for the prior year. The decrease in our FCF was the result of the increase in net charge-offs - combined principal loans during 2017, as discussed previously, and increased capital expenditures.
Operating and capital expenditure requirements
We believe that our existing cash balances, together with the available borrowing capacity under our VPC Facility and ESPV Facility, will be sufficient to meet our anticipated cash operating expense and capital expenditure requirements through at least the next 12 months. We intend to further diversify our funding sources. If our loan growth exceeds our expectations, our available cash balances and net proceeds from our IPO may be insufficient to satisfy our liquidity requirements, and we may seek additional equity or debt financing. This additional capital may not be available on reasonable terms, or at all.
102
CONTRACTUAL OBLIGATIONS
Our principal commitments consist of obligations under our debt facilities and operating lease obligations. The following table summarizes our contractual obligations as of December 31, 2017.
Payment due by period | ||||||||||||||||||||
(dollars in thousands) | Total | Less than 1 year | 1-3 years | 3-5 years | More than 5 years | |||||||||||||||
Contractual obligations: | ||||||||||||||||||||
Long-term debt obligations | $ | 514,260 | $ | 124,000 | $ | — | $ | 390,260 | $ | — | ||||||||||
Operating lease obligations | 8,836 | 3,473 | 3,563 | 1,033 | 767 | |||||||||||||||
Total contractual obligations | $ | 523,096 | $ | 127,473 | $ | 3,563 | $ | 391,293 | $ | 767 | ||||||||||
The long-term debt obligations due within one year are expected to be extended to 2021.
OFF-BALANCE SHEET ARRANGEMENTS
We provide services in connection with installment loans originated by independent third-party lenders (“CSO lenders”) whereby we act as a credit service organization/credit access business on behalf of consumers in accordance with applicable state laws through our “CSO program.” The CSO program includes arranging loans with CSO lenders, assisting in the loan application, documentation and servicing processes. Under the CSO program, we guarantee the repayment of a customer’s loan to the CSO lenders as part of the credit services we provide to the customer. A customer who obtains a loan through the CSO program pays us a fee for the credit services, including the guaranty, and enters into a contract with the CSO lenders governing the credit services arrangement. We estimate a liability for losses associated with the guaranty provided to the CSO lenders using assumptions and methodologies similar to the allowance for loan losses, which we recognize for our consumer loans.
BASIS OF PRESENTATION AND CRITICAL ACCOUNTING POLICIES
Revenue recognition
We realize revenues in connection with the consumer loans we offer for each of our products, including finance charges, lines of credit fees and fees for services provided through CSO programs (“CSO fees”). We have also historically realized a small amount of non-sufficient funds fees ("NSF fees") on Rise installment loans and may recognize other fees or charges as permitted by applicable laws and pursuant to the agreement with the borrower. We discontinued Rise NSF fees in the fourth quarter of 2015 and now generally all of our revenues consist of finance charges on Rise and Sunny installment loans, cash advance fees associated with the Elastic line of credit product, and fees for services provided through CSO programs associated with Rise installment loans in Texas and Ohio. The Company also recorded revenues related to the sale of customer applications to unrelated third parties. These applications are sold with the customer’s consent in the event that the Company or its CSO lenders are unable to offer the customer a loan. Revenue is recognized at the time of the sale. Other revenues also include marketing and licensing fees received from the originating lender related to the Elastic product and CSO programs. Revenue related to these fees is recognized when service is performed.
We recognize finance charges on installment loans on a constant yield basis over their terms. We realize fees such as CSO fees and lines of credit fees as they are earned over the term of the loan. We do not recognize finance charges or other fees on installment loans or lines of credit more than 60 days past due based on management’s historical experience that such past due loans and lines of credit are unlikely to be repaid, and thus, the loans are charged off. Installment loans and lines of credit are considered past due if a grace period has not been requested and a scheduled payment is not paid on its due date. Payments received on past due loans are applied against the loan and accrued interest balance to bring the loan current. When payments are received, they are first applied to accrued charges and fees, then interest, and then to the principal loan balance.
103
Allowance and liability for estimated losses on consumer loans
Credit losses are an inherent part of outstanding loans receivable. We maintain an allowance for loan losses for loans and interest receivable at a level estimated to be adequate to absorb such losses based primarily on our analysis of historical loss rates by product, stratified by delinquency ranges. We also consider recent collection and delinquency trends, as well as macro-economic conditions that we believe may affect portfolio losses. Additionally, due to the uncertainty of economic conditions and cash flow resources of our customers, we adjust our estimates as needed, with the result that the allowance for loan losses is subject to change in the near-term, which could significantly impact our consolidated financial statements. If a loan is deemed to be uncollectible before it is fully reserved based on information we become aware of (e.g., receipt of customer bankruptcy notice), we charge off such loan at that time. In addition, allowance for loan losses is impacted by the impairment of certain loans considered to be troubled debt restructurings ("TDR").
We classify our loans as either current or past due. A customer in good standing may request a 16 day grace period when or before a payment becomes due, and if granted, the loan is considered current during the grace period. Installment loans and lines of credit are considered past due if a grace period has not been requested and a scheduled payment is not paid on its due date. As noted above, we believe that loans and lines of credit more than 60 days past due have a low probability of being repaid. We charge off such overdue loans and reduce the allowance accordingly. Any recoveries on loans previously charged to the allowance are credited to the allowance when collected.
Liability for estimated losses on credit service organization loans
Under the CSO program, we guarantee the repayment of a customer’s loan to the CSO lenders as part of the credit services we provide to the customer. A customer who obtains a loan through the CSO program pays us a fee for the credit services, including the guaranty, and enters into a contract with the CSO lenders governing the credit services arrangement. We estimate a liability for losses associated with the guaranty provided to the CSO lenders using assumptions and methodologies similar to the allowance for loan losses, which we recognize for our consumer loans.
Goodwill
Goodwill represents the excess of the purchase price over the fair value of the net tangible and identifiable intangible assets acquired in each business combination. We perform an impairment review of goodwill and intangible assets with an indefinite life annually at October 31 and between annual tests if we determine that an event has occurred or circumstances changed in a way that would more likely than not reduce the fair value of a reporting unit below its carrying amount. Such a determination may be based on our consideration of macro-economic and other factors and trends, such as current and projected financial performance, interest rates and access to capital.
Our impairment evaluation of goodwill is based on comparing the fair value of the respective reporting unit to its carrying value. The fair value of the reporting unit is determined based on a weighted average of the income and market approaches. The income approach establishes fair value based on estimated future cash flows of the reporting unit, discounted by an estimated weighted-average cost of capital developed using the capital asset pricing model, which reflects the overall level of inherent risk of the reporting unit. The income approach uses our projections of financial performance for a six- to nine-year period and includes assumptions about future revenue growth rates, operating margins and terminal values. The market approach establishes fair value by applying cash flow multiples to the respective reporting unit’s operating performance. The multiples are derived from other publicly traded companies that are similar but not identical from an operational and economic standpoint.
We completed our 2017 annual test and determined that there was no evidence of impairment of goodwill for the two reporting units that have goodwill. Although no goodwill impairment was noted, there can be no assurances that future goodwill impairments will not occur.
Internal-use software development costs
We capitalize certain costs related to software developed for internal-use, primarily associated with the ongoing development and enhancement of our technology platform. Costs incurred in the preliminary development and post-development stages are expensed. These costs are amortized on a straight-line basis over the estimated useful life of the related asset, generally three years.
104
Income taxes
Our income tax expense and deferred income tax balances in the consolidated financial statements have been calculated on a separate tax return basis. As part of the process of preparing our consolidated financial statements, we are required to estimate income taxes in each of the jurisdictions in which we operate. This process involves estimating the actual current tax expense based on various factors and assumptions, together with assessing temporary differences in recognition of income for tax and accounting purposes. These differences result in net deferred tax assets and are included within the Consolidated Balance Sheets. We then must assess the likelihood that the deferred tax assets will be recovered from future taxable income and, to the extent we believe that recovery is not likely, we must establish a valuation allowance. An expense or benefit is included within the tax provision in the Consolidated Income Statements for any increase or decrease in the valuation allowance for a given period.
We perform an evaluation of the recoverability of our deferred tax assets on a quarterly basis. We establish a valuation allowance if it is more likely than not (greater than 50 percent) that all or some portion of the deferred tax asset will not be realized. We analyze several factors, including the nature and frequency of operating losses, our carryforward period for any losses, the reversal of future taxable temporary differences, the expected occurrence of future income or loss and the feasibility of available tax planning strategies to protect against the loss of deferred tax assets. We have established a full valuation allowance for our UK deferred tax assets due to the lack of sufficient objective evidence supporting the realization of these assets in the foreseeable future.
We account for uncertainty in income taxes in accordance with applicable guidance, which requires that a more-likely-than-not threshold be met before the benefit of a tax position may be recognized in the consolidated financial statements and prescribes how such benefit should be measured. We must evaluate tax positions taken on our tax returns for all periods that are open to examination by taxing authorities and make a judgment as to whether and to what extent such positions are more likely than not to be sustained based on merit.
Our judgment is required in determining the provision for income taxes, the deferred tax assets and liabilities and any valuation allowance recorded against deferred tax assets. Our judgment is also required in evaluating whether tax benefits meet the more-likely-than-not threshold for recognition. We have completed our initial evaluation and accounting for the impact of the change in the federal tax law resulting from the Tax Cuts and Jobs Act (the “Act”, or “Tax Reform”), enacted on December 22, 2017, and we recognized a one-time $12.5 million charge associated with the change in the federal tax law.
Share-Based Compensation
In accordance with applicable accounting standards, all share-based compensation, consisting of stock options and restricted stock units (“RSUs) issued to employees is measured based on the grant-date fair value of the awards and recognized as compensation expense on a straight-line basis over the period during which the recipient is required to perform services in exchange for the award (the requisite service period). Starting July 2017, we also have an employee stock purchase plan (“ESPP”). The determination of fair value of share-based payment awards and ESPP purchase rights on the date of grant using option-pricing models is affected by our stock price as well as assumptions regarding a number of highly complex and subjective variables. These variables include, but are not limited to, the expected stock price volatility over the term of the awards, actual and projected employee stock option exercise activity, risk-free interest rate, expected dividends and expected term. We use the Black-Scholes-Merton Option Pricing Model to estimate the grant-date fair value of stock options. We also use an equity valuation model to estimate the grant-date fair value of RSUs. Additionally, the recognition of stock-based compensation expense requires an estimation of the number of awards that will ultimately vest and the number of awards that will ultimately be forfeited.
Derivative Financial Instruments
All derivatives are recorded as assets or liabilities at fair value, and the changes in fair value are immediately included in earnings. Our derivative financial instruments include bifurcated embedded derivatives that were identified within the Convertible Term Notes.
RECENTLY ISSUED ACCOUNTING PRONOUNCEMENTS AND JOBS ACT ELECTION
Under the Jumpstart Our Business Startups Act (the “JOBS Act”), we meet the definition of an emerging growth company. We have irrevocably elected to opt out of the extended transition period for complying with new or revised accounting standards pursuant to Section 107(b) of the JOBS Act.
105
Recently Adopted Accounting Standards
In March 2016, the Financial Accounting Standards Board ("FASB") issued Accounting Standards Update ("ASU") No. 2016-09, Compensation—Stock Compensation (Topic 718): Improvements to Employee Share-Based Payment Accounting ("ASU 2016-09"). ASU 2016-09 is intended to simplify the accounting for share-based payment transactions, including the income tax consequences, classification of awards as either equity or liabilities and classification on the statement of cash flows. ASU 2016-09 is effective for fiscal years beginning after December 15, 2016, including interim periods within those fiscal years. The Company adopted all amendments of ASU 2016-09 on a prospective basis, except as noted below, as of January 1, 2017 which had the following effects on the Company's financial condition, results of operations and cash flows:
• | Recognized a cumulative effect adjustment to accumulated deficit of approximately $3.3 million for the deferred tax asset attributable to excess tax benefits on stock compensation. |
• | The Company discontinued recording excess tax benefits within additional paid-in capital. |
• | Modified its computation of potentially dilutive shares for earnings per share using the treasury stock method by excluding excess tax benefits (deficiencies) as a component of assumed proceeds; as excess tax benefits are no longer recognized within additional paid-in capital. |
• | Included excess tax benefits for stock-based compensation in cash flows from operating activities rather than cash flows from financing activities in the Consolidated Statements of Cash Flows. |
• | Classified cash paid when directly withholding shares for tax-withholding purposes as a financing activity in the Consolidated Statements of Cash Flows retrospectively. |
Accounting Standards to be Adopted in Future Periods
In February 2018, the FASB issued ASU No. 2018-02, Income Statement—Reporting Comprehensive Income (Topic 220): Reclassification of Certain Tax Effects from Accumulated Other Comprehensive Income ("ASU 2018-02"). The purpose of ASU 2018-02 is to allow an entity to elect to reclassify the stranded tax effects related to the Tax Cuts and Jobs Act of 2017 from accumulated other comprehensive income into retained earnings. The amendments in ASU 2018-02 are effective for all entities for fiscal years beginning after December 15, 2018, and interim periods within those fiscal years. Early adoption is permitted. The Company is still assessing the potential impact of ASU 2018-02 on the Company's consolidated financial statements.
In May 2017, the FASB issued ASU No. 2017-09, Compensation—Stock Compensation (Topic 718): Scope of Modification Accounting ("ASU 2017-09"). The purpose of ASU 2017-09 is to provide clarity and reduce both diversity in practice and cost and complexity when applying the guidance to a change to the terms or conditions of a share-based payment award. Under this new guidance, an entity should account for the effects of a modification unless all of the following are met: (1) The fair value (or calculated value or intrinsic value, if such an alternative measurement method is used) of the modified award is the same as the fair value (or calculated value or intrinsic value, if such an alternative measurement method is used) of the original award immediately before the original award is modified. If the modification does not affect any of the inputs to the valuation technique that the entity uses to value the award, the entity is not required to estimate the value immediately before and after the modification. (2) The vesting conditions of the modified award are the same as the vesting conditions of the original award immediately before the original award is modified. (3) The classification of the modified award as an equity instrument or a liability instrument is the same as the classification of the original award immediately before the original award is modified. The guidance is effective for annual periods, and interim periods within those annual periods, beginning after December 15, 2017. Early adoption is permitted. The Company does not currently expect that the adoption of ASU 2017-09 will have a material effect on its consolidated financial statements.
In January 2017, the FASB issued ASU No. 2017-04, Intangibles—Goodwill and Other (Topic 350): Simplifying the Test for Goodwill Impairment ("ASU 2017-04"). The purpose of ASU 2017-04 is to simplify the subsequent measurement of goodwill. The amendments modify the concept of impairment from the condition that exists when the carrying amount of goodwill exceeds its implied fair value to the condition that exists when the carrying amount of a reporting unit exceeds its fair value. An entity no longer will determine goodwill impairment by calculating the implied fair value of goodwill by assigning the fair value of a reporting unit to all of its assets and liabilities as if that reporting unit had been acquired in a business combination. This guidance is effective for public companies for goodwill impairment tests in fiscal years beginning after December 15, 2019. The Company is still assessing the potential impact of ASU 2017-04 on the Company's consolidated financial statements.
106
In November 2016, the FASB issued ASU No. 2016-18, Statement of Cash Flows (Topic 230): Restricted Cash a consensus of the FASB Emerging Issues Task Force ("ASU 2016-18"). The purpose of ASU 2016-18 is to reduce diversity in practice related to the classification and presentation of changes in restricted cash on the statement of cash flows. Under this new guidance, the statement of cash flows during the reporting period must explain the change in the total of cash, cash equivalents, and amounts generally described as restricted cash or restricted cash equivalents. ASU 2016-18 is effective for public entities for fiscal years beginning after December 15, 2017 and interim periods within those fiscal years. For all other entities, ASU 2016-18 is effective for fiscal years beginning after December 15, 2018, and interim periods within fiscal years beginning after December 15, 2019. Early adoption is permitted. The Company is still assessing the potential impact of ASU 2016-18 on the Company's consolidated financial statements; however, the Company's preliminary assessment of the impact of the adoption of ASU 2016-18 is that, upon adoption, the Company will include any restricted cash balances as part of cash and cash equivalents in its statements of cash flows and not present the change in restricted cash balances as a separate line item under investing activities as it currently presented.
In August 2016, the FASB issued ASU No. 2016-15, Statement of Cash Flows (Topic 230): Classification of Certain Cash Receipts and Cash Payments ("ASU 2016-15"). ASU 2016-15 is intended to reduce diversity in practice for certain cash receipts and cash payments that are presented and classified in the statement of cash flows. For public entities, ASU 2016-15 is effective for fiscal years beginning after December 15, 2017, including interim periods within those fiscal years. Early adoption is permitted. The Company is still assessing the potential impact of ASU 2016-15 on the Company's consolidated financial statements. The Company does not currently expect that the adoption of ASU 2016-15 will have a material effect on its consolidated financial statements.
In June 2016, the FASB issued ASU No. 2016-13, Financial Instruments—Credit Losses (Topic 326): Measurement of Credit Losses on Financial Instruments ("ASU 2016-13"). ASU 2016-13 is intended to replace the incurred loss impairment methodology in current US GAAP with a methodology that reflects expected credit losses and requires consideration of a broader range of reasonable and supportable information to inform credit loss estimates to improve the quality of information available to financial statement users about expected credit losses on financial instruments and other commitments to extend credit held by a reporting entity at each reporting date. For public entities, ASU 2016-13 is effective for fiscal years beginning after December 15, 2019, including interim periods within those fiscal years. The Company is still assessing the potential impact of ASU 2016-13 on the Company's consolidated financial statements. The Company expects to complete its analysis of the impact in 2018.
In February 2016, the FASB issued ASU No. 2016-02, Leases (Topic 842) ("ASU 2016-02"). ASU 2016-02 is intended to improve the reporting of leasing transactions to provide users of financial statements with more decision-useful information. ASU 2016-02 will require organizations that lease assets to recognize on the balance sheet the assets and liabilities for the rights and obligations created by those leases. ASU 2016-02 is effective for fiscal years beginning after December 15, 2018, including interim periods within those fiscal years. Early adoption is permitted. The Company is still assessing the potential impact of ASU 2016-02 on the Company's consolidated financial statements. The Company expects to complete its analysis of the impact in 2018.
In May 2014, the FASB issued ASU 2014-09, Revenue from Contracts with Customers (Topic 606) (“ASU 2014-09”). ASU 2014-09 is a comprehensive new revenue recognition model that requires a company to recognize revenue to depict the transfer of goods or services to a customer at an amount that reflects the consideration it expects to receive in exchange for those goods or services. ASU 2014-09 also requires additional disclosure about the nature, amount, timing and uncertainty of revenue and cash flows arising from customer contracts, including significant judgments and changes in judgments and assets recognized from costs incurred to obtain or fulfill a contract. In August 2015, the FASB issued ASU No. 2015-14, Revenue from Contracts with Customers (Topic 606): Deferral of Effective Date ("ASU 2015-14"), which defers the effective date of this guidance by one year, to the annual reporting periods beginning after December 15, 2017, including interim periods within that reporting period. A reporting entity may choose to early adopt the guidance as of the original effective date. In April 2016, the FASB issued ASU 2016-10, Revenues from Contracts with Customers (Topic 606): Identifying Performance Obligations and Licensing ("ASU 2016-10"), which clarifies the guidance related to identifying performance obligations and licensing implementation. Upon adoption of the new revenue recognition guidance, the Company anticipates using the alternative transition method that requires the application of the guidance only to contracts that are uncompleted on the date of initial application. The Company completed its assessment in evaluating the potential impact on its consolidated financial statements and based on its assessment determined that its financial contracts are excluded from the scope of ASU 2014-09. As a result of the scope exception for financial contracts, the Company's management has determined that there will be no material changes to the nature, extent or timing of revenues and expenses; additionally, the Company's management does not expect the adoption of ASU 2014-09 to have a significant impact to pretax income upon adoption.
107
Item 7A. Quantitative and Qualitative Disclosures About Market Risk
Market risk is the risk of loss to future earnings, values or future cash flows that may result from changes in the price of a financial instrument. The value of a financial instrument may change as a result of changes in interest rates, exchange rates, commodity prices, equity prices and other market changes. We are exposed to market risk related to changes in interest rates and foreign currency exchange rates. We do not use derivative financial instruments for speculative, hedging or trading purposes, although in the future we may enter into interest rate or exchange rate hedging arrangements to manage the risks described below.
Interest rate sensitivity
Our cash and cash equivalents as of December 31, 2017 consisted of demand deposit accounts. Our primary exposure to market risk for our cash and cash equivalents is interest income sensitivity, which is affected by changes in the general level of US interest rates. Given the currently low US interest rates, we generate only a de minimis amount of interest income from these deposits.
All of our customer loan portfolios are fixed APR loans and not variable in nature. Additionally given the high APR’s associated with these loans, we do not believe there is any interest rate sensitivity associated with our customer loan portfolio.
Our VPC Facility and ESPV Facility are variable rate in nature and tied to the 3-month LIBOR rate. Thus, any increase in the 3-month LIBOR rate will result in an increase in our net interest expense. The outstanding balance of our VPC Facility at December 31, 2017 was $306.3 million. The outstanding balance of our ESPV Facility was $208.0 million at December 31, 2017. Based on the average outstanding indebtedness through the year ended December 31, 2017, a 1% (100 basis points) increase in interest rates would have increased our interest expense by approximately $4.7 million.
However, we subsequently entered into interest rate cap transactions on the VPC Facility and ESPV Facility on January 11, 2018 with a counterparty which may mitigate the floating rate interest risk on an aggregate of $240 million and $216 million, respectively, of debt that is currently outstanding under each entity's existing credit facilities.
Foreign currency exchange risk
We provide installment loans to customers in the UK. Interest income from our Sunny UK installment loans is earned in British pounds (“GBP”). Fluctuations in exchange rate of the US dollar (“USD”) against the GBP and cash held in such foreign currency can result, and have resulted, in fluctuations in our operating income and foreign currency transaction gains and losses. We had foreign currency transaction gains of approximately $2.9 million during the year ended December 31, 2017. We currently do not engage in any foreign exchange hedging activity but may do so in the future.
At December 31, 2017, our net GBP-denominated assets were approximately $57.4 million (which excludes the $20.1 million then drawn under the USD-denominated UK term note under the VPC Facility). A hypothetical 10% strengthening or weakening in the value of the USD compared to the GBP at this date would have resulted in a decrease/increase in net assets of approximately $5.7 million. During the year ended December 31, 2017, the GBP-denominated pre-tax income was approximately $7.5 million. A hypothetical 10% strengthening or weakening in the value of the USD compared to the GBP during this period would have resulted in a decrease/increase in the pre-tax income of approximately $0.8 million.
108
Item 8. Financial Statements and Supplementary Data
Index to Consolidated Financial Statements | |
109
Report of Independent Registered Public Accounting Firm
Board of Directors and Shareholders
Elevate Credit, Inc.
Opinion on the financial statements
We have audited the accompanying consolidated balance sheets of Elevate Credit, Inc. (a Delaware corporation) and subsidiaries (the “Company”) as of December 31, 2017 and 2016, the related consolidated statements of operations, comprehensive loss, shareholders’ equity, and cash flows for each of the three years in the period ended December 31, 2017, and the related notes (collectively referred to as the “financial statements”). In our opinion, the financial statements present fairly, in all material respects, the financial position of the Company as of December 31, 2017 and 2016, and the results of its operations and its cash flows for each of the three years in the period ended December 31, 2017, in conformity with accounting principles generally accepted in the United States of America.
Basis for opinion
These financial statements are the responsibility of the Company’s management. Our responsibility is to express an opinion on the Company’s financial statements based on our audits. We are a public accounting firm registered with the Public Company Accounting Oversight Board (United States) (“PCAOB”) and are required to be independent with respect to the Company in accordance with the U.S. federal securities laws and the applicable rules and regulations of the Securities and Exchange Commission and the PCAOB.
We conducted our audits in accordance with the standards of the PCAOB. Those standards require that we plan and perform the audit to obtain reasonable assurance about whether the financial statements are free of material misstatement, whether due to error or fraud. The Company is not required to have, nor were we engaged to perform, an audit of its internal control over financial reporting. As part of our audits we are required to obtain an understanding of internal control over financial reporting but not for the purpose of expressing an opinion on the effectiveness of the Company’s internal control over financial reporting. Accordingly, we express no such opinion.
Our audits included performing procedures to assess the risks of material misstatement of the financial statements, whether due to error or fraud, and performing procedures that respond to those risks. Such procedures included examining, on a test basis, evidence supporting the amounts and disclosures in the financial statements. Our audits also included evaluating the accounting principles used and significant estimates made by management, as well as evaluating the overall presentation of the financial statements. We believe that our audits provide a reasonable basis for our opinion.
/s/ GRANT THORNTON LLP
We have served as the Company’s auditor since 2014.
Dallas, Texas
March 9, 2018
110
Elevate Credit, Inc. and Subsidiaries
CONSOLIDATED BALANCE SHEETS
(Dollars in thousands except share amounts) | December 31, 2017 | December 31, 2016 | ||||||
ASSETS | ||||||||
Cash and cash equivalents* | $ | 41,142 | $ | 53,574 | ||||
Restricted cash | 1,595 | 1,785 | ||||||
Loans receivable, net of allowance for loan losses of $87,946 and $77,451, respectively* | 524,619 | 392,663 | ||||||
Prepaid expenses and other assets* | 10,306 | 11,314 | ||||||
Receivable from CSO lenders | 22,811 | 26,053 | ||||||
Receivable from payment processors* | 21,126 | 19,105 | ||||||
Deferred tax assets, net | 23,545 | 31,197 | ||||||
Property and equipment, net | 24,249 | 16,159 | ||||||
Goodwill | 16,027 | 16,027 | ||||||
Intangible assets, net | 2,123 | 2,304 | ||||||
Total assets | $ | 687,543 | $ | 570,181 | ||||
LIABILITIES AND STOCKHOLDERS’ EQUITY | ||||||||
Accounts payable and accrued liabilities (including $95 and $21 payable to Think Finance, Inc. at December 31, 2017 and 2016, respectively)* | $ | 42,213 | $ | 31,390 | ||||
State and other taxes payable | 884 | 1,026 | ||||||
Deferred revenue* | 33,023 | 28,970 | ||||||
Notes payable, net* | 513,295 | 493,478 | ||||||
Derivative liability | 1,972 | 1,750 | ||||||
Total liabilities | 591,387 | 556,614 | ||||||
COMMITMENTS, CONTINGENCIES AND GUARANTEES (Note 13) | ||||||||
STOCKHOLDERS’ EQUITY | ||||||||
Preferred stock; $0.0004 par value; 24,500,000 and 0 authorized shares, respectively; none issued and outstanding at December 31, 2017 and 2016 | — | — | ||||||
Common stock; $0.0004 par value; 300,000,000 and 41,676,750 authorized shares, respectively; 42,165,524 and 13,001,216 issued and outstanding, respectively | 17 | 5 | ||||||
Convertible preferred stock; Series A, $0.001 par value; 0 and 2,957,059 shares authorized, issued and outstanding, respectively; liquidation preference of $0 and $22,850, respectively | — | 3 | ||||||
Convertible preferred stock; Series B, $0.001 par value; 0 and 2,682,351 shares authorized, issued and outstanding, respectively; liquidation preference of $0 and $40,000, respectively | — | 3 | ||||||
Accumulated other comprehensive income, net of tax effects of $2,273 and $2,347, respectively | 2,003 | 1,087 | ||||||
Additional paid-in capital | 174,090 | 88,854 | ||||||
Accumulated deficit | (79,954 | ) | (76,385 | ) | ||||
Total stockholders’ equity | 96,156 | 13,567 | ||||||
Total liabilities and stockholders’ equity | $ | 687,543 | $ | 570,181 | ||||
* These balances include certain assets and liabilities of a variable interest entity (“VIE”) that can only be used to settle the
liabilities of that VIE. All assets of the Company are pledged as security for the Company’s outstanding debt, including debt
held by the VIE. For further information regarding the assets and liabilities included in the Company's consolidated accounts, see Note 4—
Variable Interest Entity.
The accompanying notes are an integral part of these consolidated financial statements.
111
Elevate Credit, Inc. and Subsidiaries
CONSOLIDATED STATEMENTS OF OPERATIONS
Years Ended December 31, | ||||||||||||
(Dollars in thousands, except share and per share amounts) | 2017 | 2016 | 2015 | |||||||||
Revenues | $ | 673,132 | $ | 580,441 | $ | 434,006 | ||||||
Cost of sales: | ||||||||||||
Provision for loan losses | 357,574 | 317,821 | 232,650 | |||||||||
Direct marketing costs | 72,222 | 65,190 | 61,032 | |||||||||
Other cost of sales | 20,536 | 17,433 | 15,197 | |||||||||
Total cost of sales | 450,332 | 400,444 | 308,879 | |||||||||
Gross profit | 222,800 | 179,997 | 125,127 | |||||||||
Operating expenses: | ||||||||||||
Compensation and benefits | 81,969 | 65,657 | 60,568 | |||||||||
Professional services | 32,848 | 30,659 | 25,134 | |||||||||
Selling and marketing | 8,353 | 9,684 | 7,567 | |||||||||
Occupancy and equipment | 13,895 | 11,475 | 9,690 | |||||||||
Depreciation and amortization | 10,272 | 10,906 | 8,898 | |||||||||
Other | 4,600 | 3,812 | 4,303 | |||||||||
Total operating expenses | 151,937 | 132,193 | 116,160 | |||||||||
Operating income | 70,863 | 47,804 | 8,967 | |||||||||
Other income (expense): | ||||||||||||
Net interest expense | (73,043 | ) | (64,277 | ) | (36,674 | ) | ||||||
Foreign currency transaction gain (loss) | 2,900 | (8,809 | ) | (2,385 | ) | |||||||
Non-operating income (loss) | 2,295 | (43 | ) | 5,523 | ||||||||
Total other expense | (67,848 | ) | (73,129 | ) | (33,536 | ) | ||||||
Income (loss) before taxes | 3,015 | (25,325 | ) | (24,569 | ) | |||||||
Income tax expense (benefit) | 9,931 | (2,952 | ) | (4,658 | ) | |||||||
Net loss | $ | (6,916 | ) | $ | (22,373 | ) | $ | (19,911 | ) | |||
Basic loss per share | $ | (0.20 | ) | $ | (1.74 | ) | $ | (1.59 | ) | |||
Diluted loss per share | $ | (0.20 | ) | $ | (1.74 | ) | $ | (1.59 | ) | |||
Basic weighted average shares outstanding | 33,911,520 | 12,894,262 | 12,525,847 | |||||||||
Diluted weighted average shares outstanding | 33,911,520 | 12,894,262 | 12,525.847 | |||||||||
The accompanying notes are an integral part of these consolidated financial statements.
112
Elevate Credit, Inc. and Subsidiaries
CONSOLIDATED STATEMENTS OF COMPREHENSIVE LOSS
(Dollars in thousands) | Years Ended December 31, | |||||||||||
2017 | 2016 | 2015 | ||||||||||
Net loss | $ | (6,916 | ) | $ | (22,373 | ) | $ | (19,911 | ) | |||
Other comprehensive income, net of tax: | ||||||||||||
Foreign currency translation adjustment, net of tax effects of ($74), $141 and $506, respectively | 916 | 801 | 597 | |||||||||
Total other comprehensive income, net of tax | 916 | 801 | 597 | |||||||||
Total comprehensive loss | $ | (6,000 | ) | $ | (21,572 | ) | $ | (19,314 | ) | |||
The accompanying notes are an integral part of these consolidated financial statements.
113
Elevate Credit, Inc. and Subsidiaries
CONSOLIDATED STATEMENTS OF STOCKHOLDERS’ EQUITY
(Dollars in thousands except share amounts) | Preferred Stock | Common Stock | Series A Convertible Preferred | Series B Convertible Preferred | Accumulated other comprehensive income | Additional paid-in capital | Accumu-lated deficit | Total | ||||||||||||||||||||||||||||||||||||
Shares | Amount | Shares | Amount | Shares | Amount | Shares | Amount | |||||||||||||||||||||||||||||||||||||
Balances at December 31, 2014 | — | $ | — | 12,107,419 | $ | 5 | 2,957,059 | $ | 3 | 2,682,351 | $ | 3 | $ | (311 | ) | $ | 86,591 | $ | (34,101 | ) | $ | 52,190 | ||||||||||||||||||||||
Share-based compensation | — | — | — | — | — | — | — | — | — | 847 | — | 847 | ||||||||||||||||||||||||||||||||
Exercise of stock options | — | — | 689,437 | — | — | — | — | — | — | (1,429 | ) | — | (1,429 | ) | ||||||||||||||||||||||||||||||
Tax benefit of equity issuance costs | — | — | — | — | — | — | — | — | — | 1,081 | — | 1,081 | ||||||||||||||||||||||||||||||||
Comprehensive income: | ||||||||||||||||||||||||||||||||||||||||||||
Foreign currency translation adjustment net of tax effect of $506 | — | — | — | — | — | — | — | — | 597 | — | — | 597 | ||||||||||||||||||||||||||||||||
Net loss | — | — | — | — | — | — | — | — | — | — | (19,911 | ) | (19,911 | ) | ||||||||||||||||||||||||||||||
Balances at December 31, 2015 | — | $ | — | 12,796,856 | $ | 5 | 2,957,059 | $ | 3 | 2,682,351 | $ | 3 | $ | 286 | $ | 87,090 | $ | (54,012 | ) | $ | 33,375 | |||||||||||||||||||||||
Share-based compensation | — | — | — | — | — | — | — | — | — | 1,707 | — | 1,707 | ||||||||||||||||||||||||||||||||
Exercise of stock options | — | — | 204,360 | — | — | — | — | — | — | (757 | ) | — | (757 | ) | ||||||||||||||||||||||||||||||
Tax benefit of equity issuance costs | — | — | — | — | — | — | — | — | — | 814 | — | 814 | ||||||||||||||||||||||||||||||||
Comprehensive income: | ||||||||||||||||||||||||||||||||||||||||||||
Foreign currency translation adjustment net of tax effect of $141 | — | — | — | — | — | — | — | — | 801 | — | — | 801 | ||||||||||||||||||||||||||||||||
Net loss | — | — | — | — | — | — | — | — | — | — | (22,373 | ) | (22,373 | ) | ||||||||||||||||||||||||||||||
Balances at December 31, 2016 | — | $ | — | 13,001,216 | $ | 5 | 2,957,059 | $ | 3 | 2,682,351 | $ | 3 | $ | 1,087 | $ | 88,854 | $ | (76,385 | ) | $ | 13,567 | |||||||||||||||||||||||
Share-based compensation | — | — | — | — | — | — | — | — | — | 6,318 | — | 6,318 | ||||||||||||||||||||||||||||||||
Exercise of stock options | — | — | 486,329 | — | — | — | — | — | — | (356 | ) | — | (356 | ) | ||||||||||||||||||||||||||||||
Vesting of restricted stock units | — | — | 214,551 | — | — | — | — | — | — | (229 | ) | — | (229 | ) | ||||||||||||||||||||||||||||||
ESPP shares granted | — | — | 79,909 | — | — | — | — | — | — | 511 | — | 511 | ||||||||||||||||||||||||||||||||
Tax benefit of equity issuance costs | — | — | — | — | — | — | — | — | — | (1,196 | ) | — | (1,196 | ) | ||||||||||||||||||||||||||||||
Issuance of common stock net of deferred costs | — | — | 14,285,000 | 6 | — | — | — | — | — | 80,188 | — | 80,194 | ||||||||||||||||||||||||||||||||
Conversion of preferred shares | — | — | 5,639,410 | 6 | (2,957,059 | ) | (3 | ) | (2,682,351 | ) | (3 | ) | — | — | — | — | ||||||||||||||||||||||||||||
2.5-for-1 common stock split on converted preferred shares | — | — | 8,459,109 | — | — | — | — | — | — | — | — | — | ||||||||||||||||||||||||||||||||
Comprehensive loss: | ||||||||||||||||||||||||||||||||||||||||||||
Foreign currency translation adjustment net of tax effect of $74 | — | — | — | — | — | — | — | — | 916 | — | — | 916 | ||||||||||||||||||||||||||||||||
Cumulative effect of change in accounting | — | — | — | — | — | — | — | — | — | — | 3,347 | 3,347 | ||||||||||||||||||||||||||||||||
Net loss | — | — | — | — | — | — | — | — | — | — | (6,916 | ) | (6,916 | ) | ||||||||||||||||||||||||||||||
Balances at December 31, 2017 | — | $ | — | 42,165,524 | $ | 17 | — | $ | — | — | $ | — | $ | 2,003 | $ | 174,090 | $ | (79,954 | ) | $ | 96,156 | |||||||||||||||||||||||
The accompanying notes are an integral part of these consolidated financial statements.
114
Elevate Credit, Inc. and Subsidiaries
CONSOLIDATED STATEMENTS OF CASH FLOWS
(Dollars in thousands) | Years Ended December 31, | ||||||||||
2017 | 2016 | 2015 | |||||||||
CASH FLOWS FROM OPERATING ACTIVITIES: | |||||||||||
Net loss | $ | (6,916 | ) | $ | (22,373 | ) | $ | (19,911 | ) | ||
Adjustments to reconcile net loss to net cash provided by operating activities: | |||||||||||
Depreciation and amortization | 10,272 | 10,906 | 8,898 | ||||||||
Provision for loan losses | 357,574 | 317,821 | 232,650 | ||||||||
Share-based compensation | 6,318 | 1,707 | 847 | ||||||||
Amortization of debt issuance costs | 525 | 331 | 199 | ||||||||
Amortization of loan premium | 5,360 | 2,656 | 454 | ||||||||
Amortization of convertible note discount | 3,637 | 448 | — | ||||||||
Deferred income tax expense, net | 9,729 | (3,386 | ) | (5,173 | ) | ||||||
Unrealized (gain) loss from foreign currency transactions | (2,900 | ) | 8,809 | 2,385 | |||||||
Non-operating (income) loss | (2,295 | ) | 43 | (5,523 | ) | ||||||
Changes in operating assets and liabilities: | |||||||||||
Prepaid expenses and other assets | (4,803 | ) | (280 | ) | (1,023 | ) | |||||
Reserve deposits | — | 9,287 | (9,287 | ) | |||||||
Receivables from payment processors | (1,708 | ) | (6,131 | ) | (6,837 | ) | |||||
Receivables from CSO lenders | 2,987 | (16,433 | ) | (2,267 | ) | ||||||
Interest receivable | (93,532 | ) | (83,859 | ) | (70,859 | ) | |||||
State and other taxes payable | 58 | 76 | 178 | ||||||||
Deferred revenue | 15,116 | 27,241 | (963 | ) | |||||||
Accounts payable and accrued liabilities | 9,266 | 1,770 | 6,541 | ||||||||
Net cash provided by operating activities | 308,688 | 248,633 | 130,309 | ||||||||
CASH FLOWS FROM INVESTING ACTIVITIES: | |||||||||||
Loans receivable originated or participations purchased | (1,196,723 | ) | (914,304 | ) | (667,433 | ) | |||||
Principal collections and recoveries on loans receivable | 794,717 | 550,141 | 381,044 | ||||||||
Participation premium paid | (5,680 | ) | (3,539 | ) | (1,019 | ) | |||||
Change in restricted cash | 190 | 205 | 6,357 | ||||||||
Purchases of property and equipment | (16,755 | ) | (8,313 | ) | (9,272 | ) | |||||
Net cash used in investing activities | (424,251 | ) | (375,810 | ) | (290,323 | ) | |||||
The accompanying notes are an integral part of these consolidated financial statements.
115
Elevate Credit, Inc. and Subsidiaries
CONSOLIDATED STATEMENTS OF CASH FLOWS - (Continued)
Years Ended December 31, | ||||||||||||
(Dollars in thousands) | 2017 | 2016 | 2015 | |||||||||
CASH FLOWS FROM FINANCING ACTIVITIES: | ||||||||||||
Proceeds from notes payable | $ | 103,560 | $ | 155,500 | $ | 165,000 | ||||||
Payments of notes payable | (84,950 | ) | — | — | ||||||||
Payment of capital lease obligations | (21 | ) | (242 | ) | (228 | ) | ||||||
Debt issuance costs paid | (788 | ) | (178 | ) | (489 | ) | ||||||
Equity issuance costs paid | (1,731 | ) | (2,114 | ) | (2,863 | ) | ||||||
ESPP shares granted | 511 | — | — | |||||||||
Proceeds from issuance of stock | 86,699 | — | — | |||||||||
Proceeds from stock award exercises | 593 | 40 | 436 | |||||||||
Taxes paid related to net share settlement of equity awards | (1,178 | ) | (784 | ) | (1,877 | ) | ||||||
Net cash provided by financing activities | 102,695 | 152,222 | 159,979 | |||||||||
Effect of exchange rates on cash | 436 | (521 | ) | (712 | ) | |||||||
Net increase (decrease) in cash and cash equivalents | (12,432 | ) | 24,524 | (747) | ||||||||
Cash and cash equivalents, beginning of period | 53,574 | 29,050 | 29,797 | |||||||||
Cash and cash equivalents, end of period | $ | 41,142 | $ | 53,574 | $ | 29,050 | ||||||
Supplemental cash flow information: | ||||||||||||
Interest paid | $ | 68,925 | $ | 61,347 | $ | 34,476 | ||||||
Taxes paid | $ | 442 | $ | 549 | $ | 458 | ||||||
Non-cash activities: | ||||||||||||
CSO fees charged-off included in Deferred revenues and Loans receivable | $ | 11,063 | $ | 5,174 | $ | — | ||||||
CSO fees on loans paid-off prior to maturity included in Receivable from CSO lenders and Deferred revenue | $ | 256 | $ | 99 | $ | — | ||||||
Derivative debt discount on convertible term notes | $ | 2,517 | $ | 1,707 | $ | — | ||||||
Property and equipment accrued but not yet paid | $ | 1,158 | $ | 1,227 | $ | — | ||||||
Prepaid expenses accrued but not yet paid | $ | 832 | $ | — | $ | — | ||||||
Impact on deferred tax assets of adoption of ASU 2016-09 | $ | 3,347 | $ | — | $ | — | ||||||
Deferred IPO costs included in Additional paid-in capital | $ | 6,708 | $ | — | $ | — | ||||||
Tax effect of equity issuance costs included in Additional paid-in capital | $ | 1,196 | $ | — | $ | — | ||||||
The accompanying notes are an integral part of these consolidated financial statements.
116
Elevate Credit, Inc. and Subsidiaries
NOTES TO THE CONSOLIDATED FINANCIAL STATEMENTS
NOTE 1—SUMMARY OF SIGNIFICANT ACCOUNTING POLICIES
The Company’s accounting and reporting policies are in accordance with accounting principles generally accepted in the United States (“US GAAP”) and conform, as applicable, to general practices within the finance company industry. The following is a description of the more significant of these policies used in preparing the consolidated financial statements.
Business Operations
Elevate Credit, Inc. (the “Company”) is a Delaware corporation. The Company provides technology-driven, progressive online credit solutions to non-prime consumers. The Company uses advanced technology and proprietary risk analytics to provide more convenient and more responsible financial options to its customers, who are not well-served by either banks or legacy non-prime lenders. The Company currently offers unsecured online installment loans and lines of credit in the United States (the “US”) and the United Kingdom (the “UK”). The Company’s products, Rise, Elastic and Sunny, reflect its mission of “Good Today, Better Tomorrow” and provide customers with access to competitively priced credit and services while helping them build a brighter financial future with credit building and financial wellness features. In the UK, the Company directly offers unsecured installment loans via the internet through its wholly owned subsidiary, Elevate Credit International (UK), Limited, (“ECI”) under the brand name of Sunny.
Basis of Presentation
The consolidated financial statements include the accounts of the Company, its wholly owned subsidiaries and from July 1, 2015 and thereafter, a variable interest entity ("VIE") (See Note 4—Variable Interest Entity). All significant intercompany transactions and accounts have been eliminated.
Reclassifications
Certain amounts in the prior periods, which the Company does not believe have a material impact on the consolidated financial statements, presented herein have been reclassified to conform to the current period financial statement presentation related to approximately $99 thousand of Principal collections and recoveries on loans receivable that were being inappropriately included in operating activities on the Consolidated Statement of Cash Flows for the twelve months ended 2016.
The Company classifies its loans as either current or past due. A customer in good standing may request a 16 day grace period when or before a payment becomes due and, if granted, the loan is considered current during the grace period. Installment loans and lines of credit are considered past due if a grace period has not been requested and a scheduled payment is not paid on its due date. The Company has added clarity to its determination of a current loan and has reclassified certain loans relating to customers within this grace period as past due that were in fact current in accordance with our policy. This reclassification resulted in an approximate $7.1 million change from past due loans to current loans within the Loans Receivable and Revenue footnote. This reclassification had no effect on previously reported total loans receivable balances in the consolidated balance sheet at December 31, 2016.
The Company reclassified $254 thousand related to the December 31, 2016 deferred tax liability for property and equipment with an offset to the valuation allowance to conform to current year presentation.
Initial Public Offering
On April 11, 2017, the Company completed its initial public offering (“IPO”) in which it issued and sold 12,400,000 shares of common stock at a price of $6.50 per share to the public. In connection with the closing, the underwriters exercised their option to purchase in full for an additional 1,860,000 shares. On April 6, 2017, the Company's stock began trading on the New York Stock Exchange ("NYSE") under the symbol “ELVT.” The aggregate net proceeds received by the Company from the IPO, net of underwriting discounts and commissions and estimated offering expenses, were approximately $80.2 million.
Immediately prior to the closing of the IPO, all then outstanding shares of the Company's convertible preferred stock were converted into 5,639,410 shares of common stock (or 14,098,519 shares of common stock after the 2.5-for-1 forward stock split described below). The related carrying value of shares of preferred stock, in the aggregate amount of approximately $6 thousand, was reclassified as common stock. Additionally, the Company amended and restated its certificate of incorporation, effective April 11, 2017 to, among other things, change the authorized number of shares of common stock to 300,000,000 and the authorized number of shares of preferred stock to 24,500,000, each with a par value of $0.0004 per share.
117
Elevate Credit, Inc. and Subsidiaries
NOTES TO THE CONSOLIDATED FINANCIAL STATEMENTS — (Continued)
Stock options granted to certain employees vest upon the satisfaction of the earlier of either a service condition or a liquidity condition. The service condition for these awards is generally satisfied over four years. The liquidity condition is satisfied upon the occurrence of a qualifying event, defined as the completion of the IPO, which occurred on April 11, 2017. The satisfaction of this vesting condition accelerated the expense attribution period for those stock options, and the Company recognized a cumulative share-based compensation expense of $0.8 million for the portion of those stock options that met the liquidity condition.
Stock Split
On December 11, 2015, the Board of Directors approved the ratio to effect a 2.5-for-1 forward stock split of the Company's common stock. The stock split became effective in connection with the completion of the Company’s IPO. All numbers of shares and per share data in the accompanying consolidated financial statements and related notes have been retroactively adjusted to reflect this stock split for all periods presented.
The Company's IPO and resulting stock split had the following effect on the Company's equity as of December 31, 2017:
• | Convertible Preferred Stock: In April 2017 as a result of the IPO, all then outstanding shares of the Company's convertible preferred stock (5,639,410) were converted on a one-to-one basis without additional consideration into an aggregate of 5,639,410 shares of common stock and, thereafter, into 14,098,519 shares of common stock after the application of the 2.5-for-1 forward stock split. |
• | Common Stock: The IPO and resulting stock split caused an adjustment to the par value for the common stock, from $0.001 per share to $0.0004 per share, and caused a two-and-a-half times increase in the number of authorized and outstanding shares of common stock. The number of shares of common stock and per share common stock data in the accompanying consolidated financial statements and related notes have been retroactively adjusted to reflect a 2.5-for-1 forward stock split for all periods presented. |
• | Share-Based Compensation: The IPO and resulting stock split decreased the exercise price for stock options by two-and-a-half times per share, and reflected a two-and-a-half times increase in the number of stock options and restricted stock units ("RSUs") outstanding. The number of stock options and RSUs and per share common stock data in the accompanying consolidated financial statements and related notes have been adjusted to reflect a 2.5-for-1 forward stock split for all periods presented. |
Capital Structure
The following is a summary of the Company's stock classes after the IPO and 2.5-for-1 forward stock split as of and during the year ended December 31, 2017.
• | Preferred stock, of which 24,500,000 shares are authorized and no shares are issued or outstanding as of December 31, 2017. This class of stock has a par value of $0.0004. |
• | Common stock, of which 300,000,000 shares are authorized and 42,165,524 are issued and outstanding as of December 31, 2017, with a par value of 0.0004. |
• | Convertible Preferred Stock - Series A, of which 2,957,059 had been authorized, issued and outstanding as of December 31, 2016, but were converted into common shares upon completion of the IPO discussed above. This class of stock had a par value of $0.001. No shares were outstanding as of December 31, 2017. |
• | Convertible Preferred Stock - Series B, of which 2,682,351 had been authorized, issued and outstanding as of December 31, 2016, but were converted into common shares upon completion of the IPO discussed above. This class of stock had a par value of $0.001. No shares were outstanding as of December 31, 2017. |
The entire voting power and all voting rights are vested exclusively in the common stock, and each holder of common stock is entitled to one vote for each share of such stock held in such stockholder's name.
Use of Estimates
The preparation of the consolidated financial statements in conformity with US GAAP requires management to make estimates and assumptions that affect the reported amounts of assets and liabilities, disclosure of contingent assets and liabilities at the date of the consolidated financial statements and the reported amounts of revenues and expenses during the reporting period.
118
Elevate Credit, Inc. and Subsidiaries
NOTES TO THE CONSOLIDATED FINANCIAL STATEMENTS — (Continued)
Significant items subject to such estimates and assumptions include the valuation of the allowance for loan losses, goodwill, long-lived and intangible assets, deferred revenues, contingencies, the fair value of derivatives, the income tax provision, valuation of share-based compensation and the valuation allowance against deferred tax assets. The Company bases its estimates on historical experience, current data and assumptions that are believed to be reasonable. Actual results could differ from those estimates.
Cash and Cash Equivalents
The Company considers all highly-liquid investments purchased with an original maturity of three months or less to be cash equivalents.
Restricted Cash
Amounts restricted under lending agreements, third-party processing agreements and state licensing requirements are classified separately as restricted cash.
Installment Loans and Lines of Credit
Installment loans and lines of credit, including receivables for finance charges and fees, are unsecured and reported as Loans receivable on the Consolidated Balance Sheets. Installment loans are multi-payment loans that require the pay-down of portions of the outstanding principal balance in multiple installments. Line of credit accounts include customer cash advances made through the Elastic line of credit product. The lines of credit represent participation interests acquired by a VIE from a third-party lender. Based on agreements with the third-party lender, the VIE pays a loan premium on the participation interests. The loan premium is amortized over the expected life of the outstanding draw. At December 31, 2017, 2016 and 2015, the amortization on the loan premium was $5.4 million, $2.7 million and $0.5 million, respectively, and is included within Revenues in the Consolidated Statements of Operations. See Note 4—Variable Interest Entity for more information regarding these participation interests.
The Company considers impaired loans as accounts over 60 days past due or loans which become uncollectible based on information that the Company becomes aware of (e.g., receipt of customer bankruptcy notice). The impaired loans are charged-off at the time that they are deemed to be uncollectible.
A modification of finance receivable terms is considered a troubled debt restructuring ("TDR") if the borrower is experiencing financial difficulty and the Company grants a concession it would not otherwise have considered to a borrower. The Company considers TDRs to include all installment and line of credit loans that were modified by granting principal and interest forgiveness as a part of a loss mitigation strategy.
Allowance for Loan Losses
The Company has adopted Financial Accounting Standards Board (“FASB”) guidance for disclosures about the credit quality of financing receivables and the allowance for loan losses (“allowance”). The Company maintains an allowance for loan losses for loans and interest receivable for loans not classified as TDRs at a level estimated to be adequate to absorb credit losses inherent in the outstanding loans receivable. The Company primarily utilizes historical loss rates by product, stratified by delinquency ranges, to determine the allowance, but also considers recent collection and delinquency trends, as well as macro-economic conditions that may affect portfolio losses. Additionally, due to the uncertainty of economic conditions and cash flow resources of the Company’s customers, the estimate of the allowance for loan losses is subject to change in the near-term and could significantly impact the consolidated financial statements. If a loan is deemed to be uncollectible before it is fully reserved, it is charged-off at that time. For loans classified as TDRs, impairment is typically measured based on the present value of the expected future cash flows discounted at the original effective interest rate.
The Company classifies its loans as either current or past due. A customer in good standing may request a 16 day grace period when or before a payment becomes due and, if granted, the loan is considered current during the grace period. Installment loans and lines of credit are considered past due if a grace period has not been requested and a scheduled payment is not paid on its due date. Increases in the allowance are created by recording a Provision for loan losses in the Consolidated Statements of Operations. Installment loans and lines of credit are charged off, which reduces the allowance, when they are over 60 days past due or earlier if deemed uncollectible. Recoveries on losses previously charged to the allowance are credited to the allowance when collected.
119
Elevate Credit, Inc. and Subsidiaries
NOTES TO THE CONSOLIDATED FINANCIAL STATEMENTS — (Continued)
Revenue Recognition
The Company recognizes consumer loan fees as revenues for each of the loan products it offers. Revenues on the Consolidated Statements of Operations include: finance charges, lines of credit fees, fees for services provided through CSO programs (“CSO fees”), and non-sufficient funds fees or “NSF fees” on Rise installment loans, which were discontinued in the fourth quarter of 2015, as well as any other fees or charges permitted by applicable laws and pursuant to the agreement with the borrower. The Company also records revenues related to the sale of customer applications to unrelated third parties. These applications are sold with the customer’s consent in the event that the Company or its CSO lenders are unable to offer the customer a loan. Revenue is recognized at the time of the sale. Other revenues also include marketing and licensing fees received from the originating lender related to the Elastic product and from CSO fees related to the Rise product. Revenues related to these fees are recognized when the service is performed.
The Company accrues finance charges on installment loans on a constant yield basis over their terms. The Company accrues and defers fixed charges such as CSO fees and lines of credit fees when they are assessed and recognizes them to earnings as they are earned over the life of the loan. The Company does not accrue finance charges and other fees on installment loans or lines of credit for which payment is greater than 60 days past due. Installment loans and lines of credit are considered past due if a grace period has not been requested and a scheduled payment is not paid on its due date. Payments received on past due loans are applied against the loan and accrued interest balance to bring the loan current. Payments are generally first applied to accrued fees and interest, and then to the principal loan balance.
Effective through April 30, 2015, the Company offered a reward program for certain installment loan customers. Customers could earn points for performing various activities such as making a consecutive number of timely loan payments or completing financial education courses provided by the Company. These points could then be used to reduce the interest rate of an outstanding loan. The Company estimated the expected future interest discounts to be provided based on the likelihood that the customer would earn enough points over the life of the loan to achieve a discount. If a discount would be achieved, an effective yield over the life of the loan was calculated (considering the future discounts) and any interest collected in excess of the effective yield was deferred. The reward program was discontinued on April 30, 2015.
The Company’s business is affected by seasonality, which can cause significant changes in portfolio size and profit margins from quarter to quarter. Although this seasonality does not impact the Company’s policies for revenue recognition, it does generally impact the Company’s results of operations by potentially causing an increase in its profit margins in the first quarter of the year and decreased margins in the second through fourth quarters.
Credit Service Organization
The Company also provides services in connection with installment loans originated by independent third-party lenders (“CSO lenders”), whereby the Company acts as a credit services organization/credit access business on behalf of consumers in accordance with applicable state laws (the “CSO program”). The CSO program includes arranging loans with CSO lenders, assisting in the loan application, documentation and servicing processes.
Under the CSO program, the Company guarantees the repayment of the customer’s loan to the CSO lenders as part of the credit services it provides to the customer. A customer who obtains a loan through the CSO program pays the Company a fee for the credit services, including the guaranty, and enters into a contract with the CSO lenders governing the credit services arrangement. The CSO fee received is initially recognized as deferred revenue and subsequently recognized over the life of the loan. The Company estimates a liability for losses associated with the guaranty provided to the CSO lenders using assumptions and methodologies similar to the allowance for loan losses detailed previously. The CSO program required that the Company fund a cash reserve equal to 25% - 45% of the outstanding loan principal within the CSO program portfolio. As of December 31, 2017 and 2016, respectively, estimated losses of approximately $5.8 million and $4.9 million for the CSO owned loans receivable guaranteed by the Company of approximately $45.5 million and $40.5 million, respectively, are initially recorded at fair value and are included in Accounts payable and accrued liabilities in the Consolidated Balance Sheets. See Note 3—Loans Receivable and Revenues for additional information on loans receivable and the provision for loan losses.
120
Elevate Credit, Inc. and Subsidiaries
NOTES TO THE CONSOLIDATED FINANCIAL STATEMENTS — (Continued)
The Company also had a Receivable from CSO lenders related primarily to CSO fees received by the CSO lenders from customers. The receivables (payables) related to the CSO lenders as of December 31, 2017 and 2016 are as follows:
(Dollars in thousands) | 2017 | 2016 | ||||||
Receivable related to 25%-45% and 30%-45% cash reserve, respectively | $ | 20,730 | $ | 26,136 | ||||
Receivable (payable) related to CSO fees collected by CSO lenders | 721 | (105 | ) | |||||
Receivable related to licensing and servicing arrangements with CSO lenders | 1,360 | 22 | ||||||
Total receivable from CSO lenders | $ | 22,811 | $ | 26,053 | ||||
The CSO lenders are considered VIE's of the Company; however, the Company does not have any ownership interest in the CSO lenders, does not exercise control over them, and is not the primary beneficiary, and therefore, does not consolidate the CSO lenders’ results with its results.
Receivables from Payment Processors
The Company has entered into agreements with third-party service providers to conduct processing activities, including the funding of new customer loans and the collection of customer payments for those loans. In accordance with contractual agreements, these funds are settled back to the Company within one to three business days after the date of the originating transaction. Accordingly, the Company had approximately $21.1 million and $19.1 million due from processing providers as of December 31, 2017 and 2016, respectively, which is included in Receivable from payment processors in the Consolidated Balance Sheets.
Direct Marketing Costs
Marketing expenses consist of online marketing costs such as sponsored search and advertising on social networking sites, and other marketing costs such as purchased television and radio air time and direct mail print advertising. In addition, marketing expense includes affiliate costs paid to marketers in exchange for information for applications from potential customers. Online marketing, affiliate costs and other marketing costs are expensed as incurred.
Selling and Marketing Costs
Selling and marketing costs include costs associated with the use of agencies that perform creative services and monitor and measure the performance of the various marketing channels. Selling and marketing costs also include the production costs associated with media advertisements that are expensed as incurred over the licensing or production period.
Property and Equipment, net
Property and equipment are stated at cost, net of accumulated depreciation and amortization. The Company capitalizes all acquisitions of property and equipment of $500 or greater. The Company capitalizes certain software development costs. Costs incurred in the preliminary stages of development are expensed, but software development costs incurred thereafter, including external direct costs of materials and services as well as payroll and payroll-related costs, are capitalized.
121
Elevate Credit, Inc. and Subsidiaries
NOTES TO THE CONSOLIDATED FINANCIAL STATEMENTS — (Continued)
Software development costs, which are included in Property and equipment, net on the Consolidated Balance Sheets, as of December 31, 2017 and 2016, and related amortization expense, which is included in Depreciation and amortization within the Consolidated Statements of Operations for the years ended December 31, 2017 and 2016 were as follows:
(Dollars in thousands) | 2017 | 2016 | ||||||
Software development costs | $ | 40,378 | $ | 29,144 | ||||
Less: accumulated amortization | (28,442 | ) | (23,658 | ) | ||||
Net book value | $ | 11,936 | $ | 5,486 | ||||
Amortization expense | $ | 4,784 | $ | 5,770 | ||||
Maintenance and repairs that do not extend the useful life of the assets are expensed as incurred. Depreciation and amortization is computed using the straight-line method over the estimated useful lives of the depreciable or amortizable assets as follows:
Furniture and fixtures | 7 years | |
Equipment | 3-5 years | |
Leasehold improvements | The lesser of the related lease term or useful life of 3-5 years | |
Software and software development | 3 years | |
Equity Issuance Costs
Costs incurred related to the Company's IPO were deferred and included in Prepaid expenses and other assets in the consolidated financial statements, and were charged against the gross proceeds of the IPO (i.e., charged against Additional paid-in capital in the accompanying Consolidated Balance Sheets) as of the closing of the IPO on April 11, 2017. The balance of these equity issuance costs that were recorded against Additional paid-in capital in the Consolidated Balance Sheet at December 31, 2017 was approximately $6.7 million.
Income Taxes
Income taxes are accounted for under the asset and liability method. Deferred tax assets and liabilities are recognized for the future tax consequences and benefits attributable to differences between the financial statement carrying amounts of existing assets and liabilities and their respective tax bases and operating loss and tax credit carryforwards. Deferred tax assets and liabilities are measured using enacted tax rates expected to apply to taxable income in the years in which those temporary differences are expected to be recovered or settled. The effect on deferred tax assets and liabilities of a change in tax rates is recognized in income in the period that includes the enactment date. Valuation allowances are established when necessary to reduce deferred tax assets to the amounts that are more likely than not to be realized.
Relative to uncertain tax positions, the Company accrues for losses it believes are probable and can be reasonably estimated. The amount recognized is subject to estimate and management judgment with respect to the likely outcome of each uncertain tax position. The amount that is ultimately sustained for an individual uncertain tax position or for all uncertain tax positions in the aggregate could differ from the amount recognized. If the amounts recorded are not realized or if penalties and interest are incurred, the Company has elected to record all amounts within income tax expense.
The Company has no recorded liabilities for US uncertain tax positions at December 31, 2017 and 2016. Tax periods from fiscal years 2014-2016 remain open and subject to examination for US federal and state tax purposes. As the Company had no operations nor had filed US federal tax returns prior to May 1, 2014, there are no other US federal or state tax years subject to examination.
The Company has reduced the deferred tax asset related to the UK net operating loss ("NOL") carryforward due to an uncertain tax position at December 31, 2017 and 2016. For UK taxes, tax periods from fiscal years 2010-2017 remain open and subject to examination.
122
Elevate Credit, Inc. and Subsidiaries
NOTES TO THE CONSOLIDATED FINANCIAL STATEMENTS — (Continued)
On December 22, 2017, the Tax Cuts and Jobs Act (the "Act", or "Tax Reform") was enacted into law. The Act contains several changes to the US federal tax law including a reduction to the US federal corporate tax rate from 35% to 21%, an acceleration of the expensing of certain business assets, a reduction to the amount of executive pay that could qualify as a tax deduction, and the addition of a repatriation tax on any accumulated offshore earnings and profit. The Act is unclear in many respects and could be subject to potential amendments and technical correction, as well as interpretations and implementing regulations by the Treasury Department and Internal Revenue Service, any of which could affect the estimates included in these financial statements. In addition, it is unclear how these US federal income tax changes will affect state and local taxation, which often uses federal taxable income as a starting point for computing state and local tax liabilities. The Company will continue to evaluate if any adjustment is required, and if any adjustment is required, it will be reflected as an additional expense or benefit in the 2018 financial statements, as allowed by SEC Staff Accounting Bulletin No. 118 ("SAB 118").
The Company has completed its initial evaluation and accounting for the impact of the Act, and as a result, the Company recognized a one-time $12.5 million charge. As of December 31, 2017, the Company's foreign subsidiary, ECI, has an accumulated deficit, and therefore, no earnings to repatriate that would be subject to the repatriation tax. See Note 12—Income Taxes for additional information.
Goodwill and Indefinite Lived Intangible Assets
Goodwill represents the excess of the purchase price over the fair value of the net tangible and identifiable intangible assets acquired in each business combination. In accordance with Accounting Standards Codification ("ASC") 350-20-35, Goodwill—Subsequent Measurement, the Company performs a quantitative approach method impairment review of goodwill and intangible assets with an indefinite life annually at October 31 and between annual tests if an event occurs or circumstances change that would more likely than not reduce the fair value of a reporting unit below its carrying amount. The Company completed its annual test and determined that there was no evidence of impairment of goodwill or indefinite lived intangible assets. No events or circumstances occurred between October 31 and December 31, 2017 that would more likely than not reduce the fair value of the reporting units below the carrying amount.
The Company’s impairment evaluation of goodwill is based on comparing the fair value of the Company’s reporting units to their carrying value. The fair value of the reporting units was determined based on a weighted average of the income and market approaches. The income approach establishes fair value based on estimated future cash flows of the reporting units, discounted by an estimated weighted-average cost of capital developed using the capital asset pricing model, which reflects the overall level of inherent risk of the reporting units. The income approach uses the Company’s projections of financial performance for a six to nine-year period and includes assumptions about future revenues growth rates, operating margins and terminal values. The market approach establishes fair value by applying cash flow multiples to the reporting units’ operating performance. The multiples are derived from other publicly traded companies that are similar but not identical from an operational and economic standpoint.
Intangible Assets Subject to Amortization
Intangible assets primarily include the fair value assigned to non-compete agreements at acquisition less any accumulated amortization. Non-compete agreements are amortized on a straight line basis over the term of the agreement. An evaluation of the recoverability of intangible assets subject to amortization is performed whenever the facts and circumstances indicate that the carrying value may be impaired. An impairment loss is recognized if the future undiscounted cash flows associated with the asset and the estimated fair value of the asset are less than the asset’s corresponding carrying value. The amount of the impairment loss, if any, is the excess of the asset’s carrying value over its estimated fair value. No impairment losses related to intangible assets subject to amortization occurred during the years ended December 31, 2017, 2016 and 2015.
Deferred Rent
The Company recognizes escalating lease payments on a straight-line basis over the term of each respective lease with the difference between cash payment and rent expense recorded as a deferred rent liability. As of December 31, 2017 and 2016, the Company had a deferred rent liability of $1.0 million and $0.4 million, respectively, that are included in Accounts payable and accrued liabilities in the Consolidated Balance Sheets.
123
Elevate Credit, Inc. and Subsidiaries
NOTES TO THE CONSOLIDATED FINANCIAL STATEMENTS — (Continued)
Debt Discount and Issuance Costs
Costs incurred for issuing the Notes payable are deferred and amortized using the straight-line method over the life of the related debt, which approximates the effective interest method. These costs include any debt discount or premium on the notes in addition to debt issuance costs incurred. The unamortized debt discount related to the Convertible Term Notes was approximately $0.1 million and $1.3 million as of December 31, 2017 and 2016, respectively, and is included in Notes payable, net in the Consolidated Balance Sheets. For the years ended December 31, 2017 and 2016, amortization of the debt discount was approximately $3.6 million and $0.4 million, respectively, and is included within Net interest expense in the Consolidated Statements of Operations. See Note 7—Notes Payable for additional information on the Convertible Term Notes.
The Convertible Term Notes converted into the 4th Tranche Term Notes on January 30, 2018 per the terms of the VPC Facility. At that time, the maturity of the 4th Tranche Term Notes was extended to February 1, 2021, and the debt discount on the Convertible Term Notes was fully amortized. In January 2018, the Company paid $2.0 million to Victory Park Management, LLC ("VPC") to settle the derivative liability associated with the Redemption Premium Feature upon the conversion of the Convertible Term Notes to the existing 4th Tranche Term Note. See Note 7—Notes Payable for additional information.
The unamortized balance of debt issuance costs was approximately $0.8 million and $0.6 million at December 31, 2017 and 2016, respectively, and is included in Notes payable, net in the Consolidated Balance Sheets. Amortization of debt issuance costs of approximately $0.5 million, $0.3 million and $0.2 million was recognized for the years ended December 31, 2017, 2016 and 2015, respectively, and is included within Net interest expense in the Consolidated Statements of Operations. There was no amortization of a debt discount in the year ended December 31, 2015.
Foreign Currency Translations and Transactions
The functional currency for ECI is the British Pound (“GBP”). The assets and liabilities of ECI are translated into US dollars (“USD”) at the exchange rates in effect at each balance sheet date, and the resulting adjustments are recorded in Accumulated other comprehensive income (loss), net as a separate component of equity. Revenues and expenses are translated at the monthly average exchange rates occurring during each period. Equity is translated at the historical rates of the respective transactions.
The Company has designated its intercompany loan with ECI as long-term. The intercompany loan was denominated in GBP. As a result, gains and losses related to the remeasurement of this balance were recognized in Accumulated other comprehensive income (loss), net in the accompanying Consolidated Statements of Stockholders’ Equity.
Effective November 30, 2015, the Company converted the intercompany loan principal balance to equity, and forgave the interest (which eliminates upon consolidation) that was accrued and unpaid on the loan at that date. The foreign currency remeasurement loss related to intercompany accounts was $0.3 million for the year ended December 31, 2015. These intercompany loan transactions had no impact on the Company's consolidated results of operations.
As a portion of ECI's term note under the third-party credit facility is denominated in USD, ECI remeasures the portion of its term note denominated in GBP monthly. On August 30, 2017, the UK Term Note commitment amount was amended to approximately $47.9 million (comprised of $35.0 million and £10.0 million). Due to the transfer of $7.0 million of the UK Term Note from USD to GBP in 2017, the Company realized a previously unrealized foreign currency loss of approximately $6.0 million.
The unrealized foreign currency gain / (loss) from foreign remeasurement was approximately $9.1 million, $(8.0) million and $(2.1) million for the years ended December 31, 2017, 2016 and 2015, respectively, and is included in Foreign currency transaction loss in the Consolidated Statements of Operations.
Comprehensive Income
Accumulated other comprehensive income, net is comprised solely of the impact of foreign currency translation adjustments. For the years ended December 31, 2017, 2016 and 2015, the change in total other comprehensive income, net of tax was a gain of approximately $0.9 million, $0.8 million and $0.6 million, respectively, and no amounts have been reclassified from accumulated other comprehensive income to net loss.
124
Elevate Credit, Inc. and Subsidiaries
NOTES TO THE CONSOLIDATED FINANCIAL STATEMENTS — (Continued)
Concentration of Credit Risk
The Company maintains cash and cash equivalent balances in bank deposit accounts that, at times, may exceed federally insured limits. The Company has not experienced any losses in such accounts. The Company believes it is not exposed to any significant credit risk on cash and cash equivalents.
Fair Value Measurements
The Company applies the provisions of ASC Topic 820, Fair Value Measurements and Disclosures, for fair value measurements of financial and non-financial assets and liabilities that are recognized or disclosed at fair value in the financial statements on a recurring or non-recurring basis, as applicable. This guidance defines fair value as the price that would be received to sell an asset or paid to transfer a liability in an orderly transaction between market participants at the measurement date (also referred to as an exit price). This guidance also establishes a framework for measuring fair value and expands disclosures about fair value measurements. See Note 11—Fair Value Measurements for additional information on fair value measurements.
Derivative Financial Instruments
All derivatives are recorded as assets or liabilities initially at fair value, and the changes in fair value at the end of each quarterly reporting period are included in earnings. The Company’s derivative financial instruments include bifurcated embedded derivatives that were identified within the Convertible Term Notes. Upon repayment of a portion of the Convertible Term Notes, approximately $2.0 million was released from the debt discount where the derivative was recorded into Interest expense. See fair value measurements policy above and Note 7—Notes Payable for additional information.
Transfers and Servicing of Financial Assets
The Company applies the provisions of ASC Topic 860, Transfers and Servicing, for accounting for transfers and servicing of financial assets, which requires that specific criteria are met in order to record a transfer of financial assets as a sale. To qualify for sale treatment, the guidance requires that the Company does not have continuing involvement with the sold assets and also requires the Company to no longer retain effective control of the assets. During the years ended December 31, 2017, 2016 and 2015, the Company entered into sales agreements with third-party firms whereby the Company sold charged off customer loans to the third party. The agreements meet the sale criteria, and as a result, proceeds of approximately $31.8 million, $25.6 million and $13.0 million for the years ended December 31, 2017, 2016 and 2015, respectively, were recorded as a recovery of charged off loans in the Allowance for loan losses.
A VIE acquired certain loan participations in unsecured lines of credit originated by a third-party lender to individual borrowers, which meet the criteria of a participation interest. Per the terms of the participation arrangement with the third-party lender, loan servicing is retained by the third-party lender, and the VIE reimburses the lender for the proportionate share of the servicing costs. See Note 4—Variable Interest Entity for additional information related to the participation interests purchased.
Share-Based Compensation
In accordance with ASC Topic 718, Compensation-Stock Compensation, all share-based payments, consisting of stock options, RSUs and ESPP purchase rights, that are issued to employees are measured based on the grant-date fair value of the awards and recognized as compensation expense on a straight-line basis over the period during which the recipient is required to perform services in exchange for the award (the requisite service period). Starting July 2017, the Company also has an employee stock purchase plan ("ESPP"). The determination of fair value of share-based payments on the date of grant using equity-valuation models is affected by the Company’s stock price as well as assumptions regarding a number of highly complex and subjective variables. These variables include, but are not limited to, the expected stock price volatility over the term of the awards, actual and projected employee stock option exercise activity, risk-free interest rate, expected dividends and expected term. The Company uses the Black-Scholes-Merton Option Pricing Model to estimate the grant-date fair value of stock options, and the Company uses an equity valuation model to estimate the grant-date fair value of RSUs. Additionally, the recognition of share-based compensation expense requires an estimation of the number of awards that will ultimately vest and the number of awards that will ultimately be forfeited.
125
Elevate Credit, Inc. and Subsidiaries
NOTES TO THE CONSOLIDATED FINANCIAL STATEMENTS — (Continued)
Convertible Preferred Stock
All of the Company's currently outstanding shares of convertible preferred stock automatically converted into common stock upon completion of the IPO on April 11, 2017. All series of convertible preferred stock converted at a ratio of one share of common stock for each share of preferred stock.
Recently Adopted Accounting Standards
In March 2016, the Financial Accounting Standards Board ("FASB") issued Accounting Standards Update ("ASU") No. 2016-09, Compensation—Stock Compensation (Topic 718): Improvements to Employee Share-Based Payment Accounting ("ASU 2016-09"). ASU 2016-09 is intended to simplify the accounting for share-based payment transactions, including the income tax consequences, classification of awards as either equity or liabilities and classification on the statement of cash flows. ASU 2016-09 is effective for fiscal years beginning after December 15, 2016, including interim periods within those fiscal years. The Company adopted all amendments of ASU 2016-09 on a prospective basis, except as noted below, as of January 1, 2017 which had the following effects on the Company's financial condition, results of operations and cash flows:
• | Recognized a cumulative effect adjustment to accumulated deficit of approximately $3.3 million for the deferred tax asset attributable to excess tax benefits on stock compensation. |
• | The Company discontinued recording excess tax benefits within additional paid-in capital. |
• | Modified its computation of potentially dilutive shares for earnings per share using the treasury stock method by excluding excess tax benefits (deficiencies) as a component of assumed proceeds; as excess tax benefits are no longer recognized within additional paid-in capital. |
• | Included excess tax benefits for stock-based compensation in cash flows from operating activities rather than cash flows from financing activities in the Consolidated Statements of Cash Flows. |
• | Classified cash paid when directly withholding shares for tax-withholding purposes as a financing activity in the Consolidated Statements of Cash Flows retrospectively. |
Accounting Standards to be Adopted in Future Periods
In February 2018, the FASB issued ASU No. 2018-02, Income Statement—Reporting Comprehensive Income (Topic 220): Reclassification of Certain Tax Effects from Accumulated Other Comprehensive Income ("ASU 2018-02"). The purpose of ASU 2018-02 is to allow an entity to elect to reclassify the stranded tax effects related to the Tax Reform from accumulated other comprehensive income into retained earnings. The amendments in ASU 2018-02 are effective for all entities for fiscal years beginning after December 15, 2018, and interim periods within those fiscal years. Early adoption is permitted. The Company is still assessing the potential impact of ASU 2018-02 on the Company's consolidated financial statements.
In May 2017, the FASB issued ASU No. 2017-09, Compensation—Stock Compensation (Topic 718): Scope of Modification Accounting ("ASU 2017-09"). The purpose of ASU 2017-09 is to provide clarity and reduce both diversity in practice and cost and complexity when applying the guidance to a change to the terms or conditions of a share-based payment award. Under this new guidance, an entity should account for the effects of a modification unless all of the following are met: (1) The fair value (or calculated value or intrinsic value, if such an alternative measurement method is used) of the modified award is the same as the fair value (or calculated value or intrinsic value, if such an alternative measurement method is used) of the original award immediately before the original award is modified. If the modification does not affect any of the inputs to the valuation technique that the entity uses to value the award, the entity is not required to estimate the value immediately before and after the modification. (2) The vesting conditions of the modified award are the same as the vesting conditions of the original award immediately before the original award is modified. (3) The classification of the modified award as an equity instrument or a liability instrument is the same as the classification of the original award immediately before the original award is modified. The guidance is effective for annual periods, and interim periods within those annual periods, beginning after December 15, 2017. Early adoption is permitted. The Company does not currently expect that the adoption of ASU 2017-09 will have a material effect on its consolidated financial statements.
126
Elevate Credit, Inc. and Subsidiaries
NOTES TO THE CONSOLIDATED FINANCIAL STATEMENTS — (Continued)
In January 2017, the FASB issued ASU No. 2017-04, Intangibles—Goodwill and Other (Topic 350): Simplifying the Test for Goodwill Impairment ("ASU 2017-04"). The purpose of ASU 2017-04 is to simplify the subsequent measurement of goodwill. The amendments modify the concept of impairment from the condition that exists when the carrying amount of goodwill exceeds its implied fair value to the condition that exists when the carrying amount of a reporting unit exceeds its fair value. An entity no longer will determine goodwill impairment by calculating the implied fair value of goodwill by assigning the fair value of a reporting unit to all of its assets and liabilities as if that reporting unit had been acquired in a business combination. This guidance is effective for public companies for goodwill impairment tests in fiscal years beginning after December 15, 2019. The Company is still assessing the potential impact of ASU 2017-04 on the Company's consolidated financial statements.
In November 2016, the FASB issued ASU No. 2016-18, Statement of Cash Flows (Topic 230): Restricted Cash a consensus of the FASB Emerging Issues Task Force ("ASU 2016-18"). The purpose of ASU 2016-18 is to reduce diversity in practice related to the classification and presentation of changes in restricted cash on the statement of cash flows. Under this new guidance, the statement of cash flows during the reporting period must explain the change in the total of cash, cash equivalents, and amounts generally described as restricted cash or restricted cash equivalents. ASU 2016-18 is effective for public entities for fiscal years beginning after December 15, 2017 and interim periods within those fiscal years. For all other entities, ASU 2016-18 is effective for fiscal years beginning after December 15, 2018, and interim periods within fiscal years beginning after December 15, 2019. Early adoption is permitted. The Company is still assessing the potential impact of ASU 2016-18 on the Company's consolidated financial statements; however, the Company's preliminary assessment of the impact of the adoption of ASU 2016-18 is that, upon adoption, the Company will include any restricted cash balances as part of cash and cash equivalents in its statements of cash flows and not present the change in restricted cash balances as a separate line item under investing activities as it currently presented.
In August 2016, the FASB issued ASU No. 2016-15, Statement of Cash Flows (Topic 230): Classification of Certain Cash Receipts and Cash Payments ("ASU 2016-15"). ASU 2016-15 is intended to reduce diversity in practice for certain cash receipts and cash payments that are presented and classified in the statement of cash flows. For public entities, ASU 2016-15 is effective for fiscal years beginning after December 15, 2017, including interim periods within those fiscal years. Early adoption is permitted. The Company is still assessing the potential impact of ASU 2016-15 on the Company's consolidated financial statements. The Company does not currently expect that the adoption of ASU 2016-15 will have a material effect on its consolidated financial statements.
In June 2016, the FASB issued ASU No. 2016-13, Financial Instruments—Credit Losses (Topic 326): Measurement of Credit Losses on Financial Instruments ("ASU 2016-13"). ASU 2016-13 is intended to replace the incurred loss impairment methodology in current US GAAP with a methodology that reflects expected credit losses and requires consideration of a broader range of reasonable and supportable information to inform credit loss estimates to improve the quality of information available to financial statement users about expected credit losses on financial instruments and other commitments to extend credit held by a reporting entity at each reporting date. For public entities, ASU 2016-13 is effective for fiscal years beginning after December 15, 2019, including interim periods within those fiscal years. The Company is still assessing the potential impact of ASU 2016-13 on the Company's consolidated financial statements. The Company expects to complete its analysis of the impact in 2018.
In February 2016, the FASB issued ASU No. 2016-02, Leases (Topic 842) ("ASU 2016-02"). ASU 2016-02 is intended to improve the reporting of leasing transactions to provide users of financial statements with more decision-useful information. ASU 2016-02 will require organizations that lease assets to recognize on the balance sheet the assets and liabilities for the rights and obligations created by those leases. ASU 2016-02 is effective for fiscal years beginning after December 15, 2018, including interim periods within those fiscal years. Early adoption is permitted. The Company is still assessing the potential impact of ASU 2016-02 on the Company's consolidated financial statements. The Company expects to complete its analysis of the impact in 2018.
127
Elevate Credit, Inc. and Subsidiaries
NOTES TO THE CONSOLIDATED FINANCIAL STATEMENTS — (Continued)
In May 2014, the FASB issued ASU 2014-09, Revenue from Contracts with Customers (Topic 606) (“ASU 2014-09”). ASU 2014-09 is a comprehensive new revenue recognition model that requires a company to recognize revenue to depict the transfer of goods or services to a customer at an amount that reflects the consideration it expects to receive in exchange for those goods or services. ASU 2014-09 also requires additional disclosure about the nature, amount, timing and uncertainty of revenue and cash flows arising from customer contracts, including significant judgments and changes in judgments and assets recognized from costs incurred to obtain or fulfill a contract. In August 2015, the FASB issued ASU No. 2015-14, Revenue from Contracts with Customers (Topic 606): Deferral of Effective Date ("ASU 2015-14"), which defers the effective date of this guidance by one year, to the annual reporting periods beginning after December 15, 2017, including interim periods within that reporting period. A reporting entity may choose to early adopt the guidance as of the original effective date. In April 2016, the FASB issued ASU 2016-10, Revenues from Contracts with Customers (Topic 606): Identifying Performance Obligations and Licensing ("ASU 2016-10"), which clarifies the guidance related to identifying performance obligations and licensing implementation. Upon adoption of the new revenue recognition guidance, the Company anticipates using the alternative transition method that requires the application of the guidance only to contracts that are uncompleted on the date of initial application. The Company completed its assessment in evaluating the potential impact on its consolidated financial statements and based on its assessment determined that its financial contracts are excluded from the scope of ASU 2014-09. As a result of the scope exception for financial contracts, the Company's management has determined that there will be no material changes to the nature, extent or timing of revenues and expenses; additionally, the Company's management does not expect the adoption of ASU 2014-09 to have a significant impact to pretax income upon adoption.
NOTE 2—EARNINGS PER SHARE
In April 2017, the Company effected a 2.5-for-1 forward stock split of its common stock in connection with the completion of the IPO, which has been retroactively applied to previously reported share and earnings per share amounts.
Basic earnings per share ("EPS") is computed by dividing net income by the weighted average number of common shares outstanding ("WASO") during each period. Also, basic EPS includes any fully vested stock and unit awards that have not yet been issued as common stock. There are no unissued fully vested stock and unit awards at December 31, 2017 and 2016.
Diluted EPS is computed by dividing net income by the WASO during each period plus any unvested stock option awards granted, vested unexercised stock options and unvested RSUs using the treasury stock method but only to the extent that these instruments dilute earnings per share.
128
Elevate Credit, Inc. and Subsidiaries
NOTES TO THE CONSOLIDATED FINANCIAL STATEMENTS — (Continued)
The computation of loss per share was as follows for years ended December 31, 2017, 2016 and 2015:
Years Ended December 31, | ||||||||||||
(Dollars in thousands except share and per share amounts) | 2017 | 2016 | 2015 | |||||||||
Numerator (basic): | ||||||||||||
Net loss | $ | (6,916 | ) | $ | (22,373 | ) | $ | (19,911 | ) | |||
Numerator (diluted): | ||||||||||||
Net loss | $ | (6,916 | ) | $ | (22,373 | ) | $ | (19,911 | ) | |||
Denominator (basic): | ||||||||||||
Basic weighted average number of shares outstanding | 33,911,520 | 12,894,262 | 12,525,847 | |||||||||
Denominator (diluted): | ||||||||||||
Basic weighted average number of shares outstanding | 33,911,520 | 12,894,262 | 12,525,847 | |||||||||
Effect of potentially dilutive securities: | ||||||||||||
Convertible Preferred Stock | — | — | — | |||||||||
Employee stock plans (options and RSUs) | — | — | — | |||||||||
Convertible Term Notes | — | — | — | |||||||||
Diluted weighted average number of shares outstanding | 33,911,520 | 12,894,262 | 12,525,847 | |||||||||
Basic and diluted loss per share: | ||||||||||||
Basic loss per share | $ | (0.20 | ) | $ | (1.74 | ) | $ | (1.59 | ) | |||
Diluted loss per share | $ | (0.20 | ) | $ | (1.74 | ) | $ | (1.59 | ) | |||
For the years ended December 31, 2017, 2016 and 2015, the Company excluded the following potential common shares from its diluted loss per share calculation because including these shares would be anti-dilutive.
• | Zero, 5,639,410 and 5,639,410 common shares issuable upon conversion of the Series A and Series B convertible preferred stock; |
• | 1,434,847, 3,501,412 and 3,949,725 common shares issuable upon exercise of the Company's stock options |
• | Zero, 1,547,030 and zero common shares issuable upon conversion of the Convertible Term Notes; and |
• | 519,909, 425,260 and zero common shares issuable upon vesting of the Company's RSUs. |
ASC Topic 260, “Earnings Per Share” (“ASC Topic 260”) requires companies with participating securities to utilize a two-class method for the computation of net income per share attributable to the Company. The two-class method requires a portion of net income attributable to the Company to be allocated to participating securities. Net losses are not allocated to participating securities unless those securities are obligated to participate in losses. The Company did not have any participating securities for the years ended December 31, 2017, 2016 and 2015.
129
Elevate Credit, Inc. and Subsidiaries
NOTES TO THE CONSOLIDATED FINANCIAL STATEMENTS — (Continued)
NOTE 3—LOANS RECEIVABLE AND REVENUES
Revenues
Revenues generated from the Company’s consumer loans for the years ended December 31, 2017, 2016 and 2015 were as follows:
(Dollars in thousands) | 2017 | 2016 | 2015 | |||||||||
Finance charges | $ | 412,954 | $ | 404,200 | $ | 347,445 | ||||||
Lines of credit fees | 195,592 | 100,276 | 23,681 | |||||||||
CSO fees | 58,008 | 73,941 | 61,259 | |||||||||
Other | 6,578 | 2,024 | 1,621 | |||||||||
Total revenues | $ | 673,132 | $ | 580,441 | $ | 434,006 | ||||||
Loans receivable, net of allowance for loan losses
The Company's loan portfolio consists of both installment loans and lines of credit, which are considered the portfolio segments at December 31, 2017 and 2016. The Rise product is primarily installment loans in the US with lines of credit offered in two states. The Sunny product is an installment loans product offered in the UK, and Elastic is a line of credit product in the US. The following reflects the credit quality of the Company’s loans receivable as of December 31, 2017 and 2016 as delinquency status has been identified as the primary credit quality indicator. The Company classifies its loans as either current or past due. A customer in good standing may request up to a 16 day grace period when or before a payment becomes due and, if granted, the loan is considered current during the grace period. Installment loans and lines of credit are considered past due if a grace period has not been requested and a scheduled payment is not paid on its due date. All impaired loans that were not accounted for as a TDR as of December 31, 2017 and 2016 have been charged off.
December 31, 2017 | ||||||||||||
(Dollars in thousands) | Rise and Sunny | Elastic | Total | |||||||||
Current loans | $ | 298,964 | $ | 237,797 | $ | 536,761 | ||||||
Past due loans | 52,379 | 21,076 | 73,455 | |||||||||
Total loans receivable | 351,343 | 258,873 | 610,216 | |||||||||
Net unamortized loan premium | — | 2,349 | 2,349 | |||||||||
Less: Allowance for loan losses | (59,076 | ) | (28,870 | ) | (87,946 | ) | ||||||
Loans receivable, net | $ | 292,267 | $ | 232,352 | $ | 524,619 | ||||||
December 31, 2016 | ||||||||||||
(Dollars in thousands) | Rise and Sunny | Elastic | Total | |||||||||
Current loans1 | $ | 239,392 | $ | 160,199 | $ | 399,591 | ||||||
Past due loans1 | 54,224 | 14,375 | 68,599 | |||||||||
Total loans receivable | 293,616 | 174,574 | 468,190 | |||||||||
Net unamortized loan premium | — | 1,924 | 1,924 | |||||||||
Less: Allowance for loan losses | (58,062 | ) | (19,389 | ) | (77,451 | ) | ||||||
Loans receivable, net | $ | 235,554 | $ | 157,109 | $ | 392,663 | ||||||
1. | Certain amounts in the prior periods presented here have been reclassified to conform to the current period financial statement presentation related to customers within the 16 day grace period that were reported as past due that were in fact current in accordance with our policy as discussed in Note 1—Basis of Presentation and Accounting Changes. |
Total loans receivable includes approximately $36.6 million and $25.6 million of interest receivable at December 31, 2017 and 2016, respectively. The carrying value for Loans receivable, net of the allowance for loan losses approximates the fair value due to the short-term nature of the loans receivable.
130
Elevate Credit, Inc. and Subsidiaries
NOTES TO THE CONSOLIDATED FINANCIAL STATEMENTS — (Continued)
The changes in the allowance for loan losses for the years ended December 31, 2017, 2016 and 2015 are as follows:
December 31, 2017 | ||||||||||||
(Dollars in thousands) | Rise and Sunny | Elastic | Total | |||||||||
Balance beginning of year | $ | 62,987 | $ | 19,389 | $ | 82,376 | ||||||
Provision for loan losses | 248,810 | 108,764 | 357,574 | |||||||||
Charge-offs | (271,746 | ) | (107,417 | ) | (379,163 | ) | ||||||
Recoveries of prior charge-offs | 24,019 | 8,134 | 32,153 | |||||||||
Effect of changes in foreign currency rates | 849 | — | 849 | |||||||||
Total | 64,919 | 28,870 | 93,789 | |||||||||
Accrual for CSO lender owned loans (Note 1) | (5,843 | ) | — | (5,843 | ) | |||||||
Balance end of year | $ | 59,076 | $ | 28,870 | $ | 87,946 | ||||||
December 31, 2016 | ||||||||||||
(Dollars in thousands) | Rise and Sunny | Elastic | Total | |||||||||
Balance beginning of year | $ | 55,768 | $ | 10,016 | $ | 65,784 | ||||||
Provision for loan losses | 259,359 | 58,462 | 317,821 | |||||||||
Charge-offs | (271,820 | ) | (53,510 | ) | (325,330 | ) | ||||||
Recoveries of prior charge-offs | 21,209 | 4,421 | 25,630 | |||||||||
Effect of changes in foreign currency rates | (1,529 | ) | — | (1,529 | ) | |||||||
Total | 62,987 | 19,389 | 82,376 | |||||||||
Accrual for CSO lender owned loans (Note 1) | (4,925 | ) | — | (4,925 | ) | |||||||
Balance end of year | $ | 58,062 | $ | 19,389 | $ | 77,451 | ||||||
December 31, 2015 | ||||||||||||
(Dollars in thousands) | Rise and Sunny | Elastic | Total | |||||||||
Balance beginning of year | $ | 48,453 | $ | 38 | $ | 48,491 | ||||||
Provision for loan losses | 212,828 | 19,822 | 232,650 | |||||||||
Charge-offs | (221,343 | ) | (9,998 | ) | (231,341 | ) | ||||||
Recoveries of prior charge-offs | 16,392 | 154 | 16,546 | |||||||||
Effect of changes in foreign currency rates | (562 | ) | — | (562 | ) | |||||||
Total | 55,768 | 10,016 | 65,784 | |||||||||
Accrual for CSO lender owned loans (Note 1) | (6,013 | ) | — | (6,013 | ) | |||||||
Balance end of year | $ | 49,755 | $ | 10,016 | $ | 59,771 | ||||||
131
Elevate Credit, Inc. and Subsidiaries
NOTES TO THE CONSOLIDATED FINANCIAL STATEMENTS — (Continued)
Troubled Debt Restructurings
In certain circumstances, the Company modifies the terms of its finance receivables for borrowers experiencing financial difficulties. Modifications may include principal and interest forgiveness. A modification of finance receivable terms is considered a TDR if the Company grants a concession to a borrower for economic or legal reasons related to the debtor’s financial difficulties that would not otherwise have been considered. Management considers TDRs to include all installment and line of credit loans that were granted principal and interest forgiveness as a part of a loss mitigation strategy for Rise and Elastic that began in 2017. Once a loan has been classified as a TDR, it is assessed for impairment based on the present value of expected future cash flows discounted at the loan's original effective interest rate considering all available evidence. There were no loans that were modified as TDRs prior to 2017.
The following table summarizes the financial effects, excluding impacts related to credit loss allowance and impairment, of TDRs that occurred for the year ended December 31, 2017:
(Dollars in thousands) | Installment loans and lines of credit | ||
Outstanding recorded investment before TDR | $ | 9,619 | |
Outstanding recorded investment after TDR | 7,726 | ||
Total principal and interest forgiveness included in charge-offs within the Allowance for loan loss | $ | 1,893 | |
A loan that has been classified as a TDR remains so until the loan is liquidated through payoff or charge-off. The table below presents the Company's average outstanding recorded investment and interest income recognized on TDR for the year ended December 31, 2017:
(Dollars in thousands) | Installment loans and lines of credit | ||
Average outstanding recorded investment(1) | $ | 6,416 | |
Interest income recognized | $ | 1,162 | |
1. Simple average based on the number of days between the modification date and the earlier of the liquidation date or December 31, 2017. | |||
The table below presents the Company’s loans modified in TDRs as of December 31, 2017:
(Dollars in thousands) | Installment loans and lines of credit | ||
Current outstanding investment | $ | 2,661 | |
Delinquent outstanding investment | 2,445 | ||
Outstanding recorded investment | 5,106 | ||
Less: Impairment included in Allowance for loan losses | (459 | ) | |
Outstanding recorded investment, net of impairment | $ | 4,647 | |
A TDR is considered to have charged-off when they are over 60 days past due or earlier if deemed uncollectible. There were approximately $2.3 million of loan restructurings accounted for as TDRs that subsequently charged-off for the year ended December 31, 2017. The Company had commitments to lend additional funds of approximately $0.3 million to customers with available and unfunded lines of credit at December 31, 2017.
132
Elevate Credit, Inc. and Subsidiaries
NOTES TO THE CONSOLIDATED FINANCIAL STATEMENTS — (Continued)
NOTE 4—VARIABLE INTEREST ENTITY
The Company is involved with four entities that are deemed to be a VIE: Elastic SPV, Ltd. and three CSO lenders. Under ASC 810-10-15, Variable Interest Entities, a VIE is an entity that: (1) has an insufficient amount of equity investment at risk to permit the entity to finance its activities without additional subordinated financial support by other parties; (2) the equity investors are unable to make significant decisions about the entity’s activities through voting rights or similar rights; or (3) the equity investors do not have the obligation to absorb expected losses or the right to receive residual returns of the entity. The Company is required to consolidate a VIE if it is determined to be the primary beneficiary, that is, the enterprise has both (1) the power to direct the activities of a VIE that most significantly impact the entity’s economic performance and (2) the obligation to absorb losses of the entity that could potentially be significant to the VIE. The Company evaluates its relationships with VIEs to determine whether it is the primary beneficiary of a VIE at the time it becomes involved with the entity and it re-evaluates that conclusion each reporting period.
Elastic SPV, Ltd.
On July 1, 2015, the Company entered into several agreements with a third-party lender and Elastic SPV, Ltd. (“ESPV”), an entity formed by third party investors for the purpose of purchasing loan participations from the third-party lender. On that date, approximately $20.2 million of loan participations in the Elastic lines of credit outstanding held by the Company were transferred to ESPV for no gain or loss. Per the terms of the agreements, the Company provides customer acquisition services to generate loan applications submitted to the third-party lender. In addition, the Company licenses loan underwriting software and provides services to the third-party lender to evaluate the credit quality of those loan applications in accordance with the third-party lender’s credit policies. ESPV accounts for the loan participations acquired in accordance with ASC 860-10-40, Transfers and Services, Derecognition, as the lines of credit acquired meet the criteria of a participation interest.
Once the third-party lender originates the loan, ESPV has the right, but not the obligation, to purchase a 90% interest in each Elastic line of credit. VPC entered into an agreement (the "ESPV Facility") under which it loans ESPV all funds necessary up to a maximum borrowing amount to purchase such participation interests in exchange for a fixed return (see Note 7—Notes Payable—ESPV Facility). The Company entered into a separate credit default protection agreement with ESPV whereby the Company agreed to provide credit protection to the investors in ESPV against Elastic loan losses in return for a credit premium. The Company does not hold a direct ownership interest in ESPV, however, as a result of the credit default protection agreement, ESPV was determined to be a VIE and the Company qualifies as the primary beneficiary.
133
Elevate Credit, Inc. and Subsidiaries
NOTES TO THE CONSOLIDATED FINANCIAL STATEMENTS — (Continued)
The following table summarizes the assets and liabilities of the VIE that are included within the Company’s Consolidated Balance Sheets at December 31, 2017 and 2016:
(Dollars in thousands) | 2017 | 2016 | |||||
ASSETS | |||||||
Cash and cash equivalents | $ | 14,928 | $ | 15,096 | |||
Loans receivable, net of allowance for loan losses of $28,869 and $19,389, respectively | 232,353 | 157,109 | |||||
Prepaid expenses and other assets ($50 and $52, respectively, eliminates upon consolidation) | 50 | 52 | |||||
Receivable from payment processors | 9,889 | 7,351 | |||||
Total assets | $ | 257,220 | $ | 179,608 | |||
LIABILITIES AND MEMBERS’ EQUITY | |||||||
Accounts payable and accrued liabilities ($7,606 and $4,856, respectively, eliminates upon consolidation)1 | $ | 13,922 | $ | 9,944 | |||
Deferred revenue | 4,363 | 2,636 | |||||
Reserve deposit liability ($31,200 and $21,825, respectively, eliminates upon consolidation) | 31,200 | 21,825 | |||||
Notes payable, net | 207,735 | 145,203 | |||||
Members' equity | — | — | |||||
Total liabilities and members’ equity | $ | 257,220 | $ | 179,608 | |||
1. | As previously disclosed in the Company's quarterly report on Form 10-Q for the period ended March 31, 2017, in the course of preparing its consolidated financial statements as of and for the three months ended March 31, 2017, the Company identified a disclosure error related to the amount of accounts payable and accrued liabilities that was eliminated upon consolidation at December 31, 2016 associated with credit default premiums. The actual amount eliminated at December 31, 2016 was $4.9 million as opposed to $1.1 million that was previously disclosed in the consolidated financial statements of the Company included in the Company's registration statement on Form S-1 (File No. 333-207888), as amended (the "Registration Statement"), filed with the US Securities and Exchange Commission (the "SEC") on April 6, 2017. The Company has determined that the error was not material to its consolidated financial statements and the correction of this error resulted in a revision to the amount disclosed only and had no impact on accounts payable and accrued liabilities in the Company's Consolidated Balance Sheet at December 31, 2016. |
CSO Lenders
The three CSO lenders are considered VIE's of the Company; however, the Company does not have any ownership interest in the CSO lenders, does not exercise control over them, and is not the primary beneficiary, and therefore, does not consolidate the CSO lenders’ results with its results.
NOTE 5—PROPERTY AND EQUIPMENT
Property and equipment as of December 31, 2017 and 2016 consists of the following:
(Dollars in thousands) | 2017 | 2016 | ||||||
Furniture and fixtures | $ | 3,052 | $ | 2,557 | ||||
Equipment | 12,635 | 10,010 | ||||||
Leasehold improvements | 1,889 | 723 | ||||||
Software development cost | 40,378 | 29,144 | ||||||
Software-purchased | 11,973 | 8,828 | ||||||
69,927 | 51,262 | |||||||
Less accumulated depreciation | (45,678 | ) | (35,103 | ) | ||||
$ | 24,249 | $ | 16,159 | |||||
134
Elevate Credit, Inc. and Subsidiaries
NOTES TO THE CONSOLIDATED FINANCIAL STATEMENTS — (Continued)
There were no capital leases outstanding as of December 31, 2017. As of December 31, 2016, there were capital leases outstanding of $21 thousand. The following summarizes the balances above which were acquired through leasing arrangements that qualified as capital leases:
(Dollars in thousands) | 2017 | 2016 | ||||||
Equipment | $ | 687 | $ | 687 | ||||
Less: accumulated depreciation | (687 | ) | (649 | ) | ||||
$ | — | $ | 38 | |||||
The capital lease obligation is included in Accounts payable and accrued liabilities in the Consolidated Balance Sheets. Depreciation expense, which includes depreciation related to capital leases, was approximately $10.1 million, $10.7 million and $8.7 million for the years ended December 31, 2017, 2016 and 2015, respectively.
NOTE 6—ACCOUNTS PAYABLE AND ACCRUED LIABILITIES
Accounts payable and accrued liabilities at December 31, 2017 and 2016 consist of the following:
(Dollars in thousands) | 2017 | 2016 | ||||||
Accounts payable | $ | 18,668 | $ | 10,880 | ||||
Accounts payable to related party (Note 15) | 95 | 21 | ||||||
Accrued compensation | 6,866 | 4,260 | ||||||
Liability for losses on CSO lender-owned consumer loans | 5,843 | 4,925 | ||||||
Interest payable | 6,393 | 6,464 | ||||||
Capital lease liability | — | 21 | ||||||
Other accrued liabilities | 4,348 | 4,819 | ||||||
$ | 42,213 | $ | 31,390 | |||||
NOTE 7—NOTES PAYABLE
The Company has two debt facilities with VPC. The Rise SPV, LLC ("RSPV," a subsidiary of the Company) credit facility (the "VPC Facility") and the ESPV Facility.
VPC Facility
The VPC Facility provides the following term notes at December 31, 2017:
• | A maximum borrowing amount of $350 million at a base rate (defined as the 3-month LIBOR, with a 1% floor) plus 11% used to fund the Rise loan portfolio (“US Term Note”). The blended interest rate on the outstanding balance at December 31, 2017 and 2016 was 12.64% and 14.94%, respectively. In addition, the US Term Note has a 1% unused commitment fee and cost sharing amounts that are recognized as interest expense. |
• | A maximum borrowing amount of $48 million and $50 million at a base rate (defined as the 3-month LIBOR rate) plus 16% used to fund the UK Sunny loan portfolio (“UK Term Note”) as of December 31, 2017 and 2016. The blended interest rate at December 31, 2017 and 2016 was 17.64% and 16.93%, respectively. |
• | A maximum borrowing amount of $0 million and $45 million at a base rate (defined as the 3-month LIBOR rate) plus 18% used to fund working capital (“ELCS Sub-debt Term Note”) as of December 31, 2017 and 2016, respectively. In April 2017, the Company paid down the entire $45.0 million using proceeds from the IPO. The blended interest rate at December 31, 2016 was 18.93%. The outstanding balance of this note was $0 as of December 31, 2017. |
• | A maximum borrowing amount of $25 million bearing interest at the greater of 18% or a base rate (defined as the 3-month LIBOR, with a 1% floor) plus 17% (“4th Tranche Term Note”). The blended interest rate at December 31, 2017 and 2016 was 18.64% and 18.00%, respectively. |
135
Elevate Credit, Inc. and Subsidiaries
NOTES TO THE CONSOLIDATED FINANCIAL STATEMENTS — (Continued)
• | A maximum borrowing amount of $10 million and $25 million as of December 31, 2017 and 2016, respectively, bearing interest at the greater of 10% or a base rate (defined as the 3-month LIBOR, with a 1% floor) plus 9% (“Convertible Term Notes”). The blended interest rate at December 31, 2017 and 2016 was 10.64% and 10.00%, respectively. |
At January 1, 2016, the VPC Facility provided a total credit facility of $335 million to RSPV, ECI and Elevate Credit Service, LLC ("ELCS"), all subsidiaries of the Company. During 2016, the VPC Facility was amended twice with an overall increase in the credit facility to a maximum total borrowing amount of $395 million to RSPV, ECI and ELCS. On January 5, 2017, the VPC Facility was amended to extend the required draw-down date of the $15.0 million remaining undrawn principal on the Convertible Term Notes from December 31, 2016 to January 5, 2017.
On February 1, 2017, the VPC Facility was amended to:
• | increase the maximum borrowing on the US Term Note from $250 million to $350 million, |
• | lower the interest rate on the US Term Note to a base rate (defined as the 3-month LIBOR, with a 1% floor) plus 11%, |
• | extend the maturity date for the US Term Note to February 1, 2021, excluding $75 million currently outstanding under the note which is subject to an August 13, 2018 maturity date, and |
• | permanently reduce the book value of equity covenant from $10 million to $5 million. |
On August 30, 2017, the VPC Facility was amended to:
• | convert the existing Convertible Term Notes balance to become a part of the existing 4th Tranche Term Note effective January 30, 2018, |
• | extend the maturity date of the 4th Tranche Term Note to February 1, 2021 effective on January 30, 2018, |
• | lower the 4th Tranche Term Note interest rate to the base rate plus 13% after January 30, 2018, |
• | increase the UK Term Note commitment amount to approximately $47.9 million (comprised of $35.0 million and £10.0 million), |
• | extend the maturity date of the UK Term Note to February 1, 2021, and |
• | lower the UK Term Note interest rate to the base rate plus 14% after January 30, 2018. |
Due to the transfer of $7.0 million of the UK Term Note from USD to GBP related to this amendment, the Company realized a previously unrealized foreign currency loss of approximately $6.0 million.
The US Term Note has a maturity date of February 1, 2021, excluding $75 million currently outstanding under the US Term Note which has an August 13, 2018 maturity date. The Company expects the $75 million will not be repaid in 2018 but will instead be extended to a February 1, 2021 maturity date as well. The UK Term Note and the 4th Tranche Term Note have a maturity date of February 1, 2021. On January 30, 2018, the Convertible Term Notes, which otherwise would have matured on such date, became a part of the 4th Tranche Term Note. There are no principal payments due or scheduled until the respective maturity dates. All assets of the Company are pledged as collateral to secure the VPC Facility. The VPC Facility contains certain financial covenants that require, among other things, maintenance of minimum amounts and ratios of working capital; minimum amounts of tangible net worth; maximum ratio of indebtedness; and maximum ratios of charge-offs. The Company was in compliance with all covenants related to the VPC Facility as of December 31, 2017 and 2016.
The Convertible Term Notes were convertible, at the lender's option, into common stock upon the completion of specific defined liquidity events, including certain equity financings, certain mergers and acquisitions or the sale of substantially all of the Company's assets, or during the period from the receipt of notice of the anticipated commencement of a roadshow in connection with the Company's IPO until immediately prior to the effectiveness of the Registration Statement in connection with such IPO. The Convertible Term Notes were convertible into common stock at the market value (or a set discount to market value) of the shares on the date of conversion and since the Convertible Term Notes included a conversion option that continuously reset as the underlying stock price increased or decreased and provided a fixed value of common stock to the lender, it was considered share-settled debt. The Company did not elect and was not required to measure the Convertible Term Notes at fair value; as such, the Company measured the Convertible Term Notes at the accreted value, determined using the effective interest method.
136
Elevate Credit, Inc. and Subsidiaries
NOTES TO THE CONSOLIDATED FINANCIAL STATEMENTS — (Continued)
Share-settled debt may settle by providing the holder with a variable number of shares with an aggregate fair value equaling the debt principal outstanding. Share-settled debt may use a discount to the fair value of the share price to determine the number of shares to be delivered, resulting in settlement at a premium, and is analyzed to determine whether the share settled debt contains a beneficial conversion feature or contingent beneficial conversion feature. Share-settled debt may be measured at fair value or at its accreted value depending on the specific terms of the settlement provisions of the debt instrument. The Company evaluates the embedded features within debt instruments to determine if embedded features are required to be bifurcated and recognized as a derivative instrument. If more than one feature is required to be bifurcated, the features are accounted for as a single compound derivative. The fair value of a single compound derivative is recognized as a derivative liability and a debt discount. The derivative liability is measured at fair value on a recurring basis with changes reported in other income (expense). The debt discount is amortized to non-cash interest expense using the effective interest method over the life of the associated debt. In connection with the conversion (i.e., settlement) of share-settled debt into common stock, the Company will recognize a gain or loss for the change in fair value of the associated derivative liabilities on conversion and a loss on extinguishment of debt from the acceleration of the unamortized balance of the debt discount and issuance costs. See Note 11—Fair Value Measurements for additional information.
The Company took an initial draw on the Convertible Term Notes of $10 million in October 2016 and a subsequent draw of $15 million in January 2017. A debt discount and derivative liability of $4 million was recognized upon the respective draws on the Convertible Term Notes. The weighted average effective interest rate associated with the debt discount was approximately 27%.
The Convertible Term Notes contained embedded features that were required to be assessed as derivatives. The Company determined that two of the features it assessed were required to be bifurcated and accounted for under derivative accounting as follows: (i) An embedded redemption feature upon conversion into common shares of the Company's stock ("Share-Settlement Feature") that includes a provision for the adjustment to the conversion price to a price less than the transaction-date fair value price per share if the Company is a party to certain qualifying liquidity or equity financing transactions. The incremental undiscounted present value of the embedded redemption feature is $6.3 million. (ii) An embedded redemption feature that requires the Company to pay an amount up to $5 million ("Redemption Premium Feature") upon a cash redemption at maturity or upon a redemption caused by certain events of default.
These two embedded features have been accounted for together as a single compound derivative. The Company estimated the fair value of the compound derivative using a probability-weighted valuation scenario model. The assumptions included in the calculations are highly subjective and subject to interpretation. The fair value of the single compound derivative was recognized as principal draw-downs were made and in proportion to the amount of principal draw-downs to the maximum borrowing amount. The initial fair value of the single compound derivative is recognized and presented as a debt discount and a derivative liability. The debt discount is amortized using the effective interest method from the principal draw-down date(s) through the maturity date. The derivative liability is accounted for in the same manner as a freestanding derivative pursuant to Accounting Standards Codification 815—Derivatives and Hedging ("ASC 815"), with subsequent changes in fair value recorded in earnings each period.
During the period from the receipt of notice from the Company to VPC of the anticipated commencement of the roadshow in connection with its IPO until immediately prior to the effectiveness of the Registration Statement, VPC had the option to convert the Convertible Term Notes, in whole or in part, into that number of shares of the Company's common stock determined by the outstanding principal balance of and accrued, but unpaid, interest on the Convertible Term Notes divided by the product of (a) 0.8 multiplied by (b) the IPO price per share. VPC did not elect to exercise its right to convert; however, VPC purchased 2.3 million shares in the offering at the IPO price, and the Company used the proceeds from that purchase, approximately $14.95 million, to reduce an equivalent amount of indebtedness under the Convertible Term Notes. Accordingly, the Company released $2.0 million of the debt discount associated with this repayment into Net interest expense on the Consolidated Statement of Operations.
Additionally, upon the effectiveness of the Registration Statement, VPC's option to convert was terminated, and the Convertible Term Notes are no longer convertible in whole or in part into shares of the Company's common stock. Furthermore, VPC agreed to waive approximately $3 million of the Redemption Premium Feature associated with the $14.95 million of Convertible Term Notes the Company repaid. The remaining fair value of the derivative recognized by the Company relates to the Redemption Premium Feature. See Note 11—Fair Value Measurements for additional information.
137
Elevate Credit, Inc. and Subsidiaries
NOTES TO THE CONSOLIDATED FINANCIAL STATEMENTS — (Continued)
As discussed above, the Convertible Term Notes were converted into the 4th Tranche Term Notes on January 30, 2018 per the terms of the VPC Facility. Additionally, the maturity of the Convertible Term Notes was extended to February 1, 2021 and the debt discount on the Convertible Term Notes was fully amortized. Finally, the exit premium under the Convertible Term Notes of $2.0 million was due and paid on January 30, 2018.
ESPV Facility
At December 31, 2016, the ESPV Facility had a maximum borrowing amount of $150 million. Interest is charged at a base rate (defined as the greater of the 3-month LIBOR rate or 1% per annum) plus 13% for the outstanding balance up to $50 million, plus 12% for the outstanding balance greater than $50 million and plus 13.5% for any amounts in excess of $100 million. The ESPV Facility is used to purchase loan participations from a third party bank partner.
On April 27, 2017, the ESPV Facility was amended to increase the borrowing base to $250 million, decrease each of the interest rates by 1.0% effective July 1, 2019, and add a base rate (defined as the greater of the 3-month LIBOR or 1% per annum) plus 12.75% for borrowing amounts greater than $150 million, which will decrease to the base rate plus 11.75% effective July 1, 2019. The amendment also extended the maturity date for a portion of the ESPV Facility to July 1, 2021, excluding $49 million currently outstanding under the ESPV Facility which has an August 13, 2018 maturity date. The Company expects this amount will not be repaid on its original maturity date but will instead be extended to a July 1, 2021 maturity date as well. The blended interest rate at December 31, 2017 and 2016 was 14.45% and 13.81%, respectively.
There are no principal payments due or scheduled until the respective maturity dates. All assets of the Company and ESPV are pledged as collateral to secure the ESPV Facility. The ESPV Facility contains financial covenants, including a borrowing base calculation and certain financial ratios. ESPV was in compliance with all covenants related to the ESPV Facility as of December 31, 2017 and 2016.
VPC and ESPV Facilities:
The outstanding balance of Notes payable, net of debt issuance costs, for the years ended December 31, 2017 and 2016 are as follows:
(Dollars in thousands) | 2017 | 2016 | ||||||
US Term Note bearing interest at 3-month LIBOR +11% (2017) + 13-15% (2016) | $ | 240,000 | $ | 222,000 | ||||
UK Term Note bearing interest at 3-month LIBOR + 16% | 31,210 | 47,800 | ||||||
ELCS Sub-debt Term Note bearing interest at 3-month LIBOR + 18% | — | 45,000 | ||||||
4th Tranche Term Note bearing interest at 3-month LIBOR + 17% | 25,000 | 25,000 | ||||||
Convertible Term Notes bearing interest at 3-month LIBOR + 9% | 10,050 | 10,000 | ||||||
ESPV Term Note bearing interest at 3-month LIBOR + 12-13.5% | 208,000 | 145,500 | ||||||
Debt discount and issuance costs | (965 | ) | (1,822 | ) | ||||
Total | $ | 513,295 | $ | 493,478 | ||||
The Company has evaluated the interest rates for its debt and believes they represent market rates based on the Company’s size, industry, operations and recent amendments. As a result, the carrying value for the debt approximates the fair value.
Future debt maturities as of December 31, 2017 are as follows:
Year (dollars in thousands) | Amount | ||
2018 | $ | 124,000 | |
2019 | — | ||
2020 | — | ||
2021 | 390,260 | ||
2022 | — | ||
Total | $ | 514,260 | |
138
Elevate Credit, Inc. and Subsidiaries
NOTES TO THE CONSOLIDATED FINANCIAL STATEMENTS — (Continued)
The Company current expects that the $124 million due in 2018 will not be repaid on its original maturity date but will instead be extended to a July 1, 2021 maturity date.
NOTE 8—GOODWILL AND INTANGIBLE ASSETS
The carrying value of goodwill at December 31, 2017 and 2016 was approximately $16.0 million. There were no changes to goodwill during the years ended December 31, 2017, 2016 and 2015. Goodwill represents the excess purchase price over the estimated fair market value of the net assets acquired by the predecessor parent company, Think Finance, Inc. ("Think Finance"), related to the Elastic and UK reporting units. Of the total goodwill balance, approximately $0.5 million is deductible for tax purposes.
The carrying value of acquired intangible assets as of December 31, 2017 is presented in the table below:
(Dollars in thousands) | Cost | Accumulated Amortization | Net | |||||||||
Assets subject to amortization: | ||||||||||||
Acquired technology | $ | 946 | $ | (946 | ) | $ | — | |||||
Non-compete | 3,404 | (1,961 | ) | 1,443 | ||||||||
Customers | 126 | (126 | ) | — | ||||||||
Assets not subject to amortization: | ||||||||||||
Domain names | 680 | — | 680 | |||||||||
$ | 5,156 | $ | (3,033 | ) | $ | 2,123 | ||||||
The carrying value of acquired intangible assets as of December 31, 2016 is presented in the table below:
(Dollars in thousands) | Cost | Accumulated Amortization | Net | |||||||||
Assets subject to amortization: | ||||||||||||
Acquired technology | $ | 946 | $ | (946 | ) | $ | — | |||||
Non-compete | 3,404 | (1,780 | ) | 1,624 | ||||||||
Customers | 126 | (126 | ) | — | ||||||||
Assets not subject to amortization: | ||||||||||||
Domain names | 680 | — | 680 | |||||||||
$ | 5,156 | $ | (2,852 | ) | $ | 2,304 | ||||||
Total amortization expense recognized for the years ended December 31, 2017, 2016 and 2015 was approximately $0.2 million for all three years. The weighted average remaining amortization period for the intangible assets was 8.00, 9.00 and 10.00 years at December 31, 2017, 2016 and 2015, respectively.
Estimated amortization expense relating to intangible assets subject to amortization for the succeeding five years is as follows:
Year (dollars in thousands) | Amount | ||
2018 | $ | 180 | |
2019 | 180 | ||
2020 | 180 | ||
2021 | 180 | ||
2022 | 180 | ||
139
Elevate Credit, Inc. and Subsidiaries
NOTES TO THE CONSOLIDATED FINANCIAL STATEMENTS — (Continued)
NOTE 9—LEASES
The Company has non-cancelable operating leases for facility space and equipment, including subleases with Think Finance (see Note 15—Related Parties). Rent expense for the years ended December 31, 2017, 2016 and 2015 was approximately $3.9 million, $3.2 million and $2.7 million, respectively, and is reported in Occupancy and equipment in the Consolidated Statements of Operations. Future minimum lease payments as of December 31, 2017 are as follows:
Year (dollars in thousands) | Amount | ||
2018 | $ | 3,473 | |
2019 | 1,963 | ||
2020 | 1,600 | ||
2021 | 509 | ||
2022 | 524 | ||
Thereafter | 767 | ||
Total | $ | 8,836 | |
As discussed in Note 5—Property and Equipment, the Company purchased equipment through leasing arrangements that qualified as capital leases. The capital leases included provisions which allow for the purchase of the equipment at de minimis amounts at the end of their lease term. Future minimum lease payments for years ended as of December 31, 2017 and 2016 are as follows:
(Dollars in thousands) | 2017 | 2016 | ||||||
Capital leases | $ | — | $ | 21 | ||||
Interest and executory costs | — | — | ||||||
Total | $ | — | $ | 21 | ||||
NOTE 10—SHARE-BASED COMPENSATION
In April 2017, the Company effected a 2.5-for-1 forward stock split of its common stock in connection with the completion of the IPO. Reported share amounts have been retroactively restated for the forward stock split.
Share-based compensation expense recognized for the years ended December 31, 2017, 2016 and 2015 totaled approximately $6.3 million, $1.7 million and $0.8 million, respectively.
2016 Omnibus Incentive Plan
The 2016 Omnibus Incentive Plan (“2016 Plan”) was adopted by the Company’s Board of Directors on January 5, 2016 and approved by the Company’s stockholders thereafter. The 2016 Plan became effective on June 23, 2016. The 2016 Plan provides for the grant of incentive stock options to the Company’s employees, and for the grant of non-qualified stock options, stock appreciation rights, restricted stock, restricted stock units, dividend equivalent rights, cash-based awards (including annual cash incentives and long-term cash incentives), and any combination thereof to the Company’s employees, directors and consultants. In connection with the 2016 Plan, the Company has reserved but not issued under the 2016 Plan 5,764,041 shares of common stock, which includes shares that would otherwise return to the 2014 Equity Incentive Plan (the "2014 Plan") as a result of forfeiture, termination, or expiration of awards previously granted under the 2014 Plan and outstanding when the 2016 Plan became effective.
The 2016 Plan will automatically terminate 10 years following the date it became effective, unless the Company terminates it sooner. In addition, the Company’s Board of Directors has the authority to amend, suspend or terminate the 2016 Plan provided such action does not impair the rights under any outstanding award.
140
Elevate Credit, Inc. and Subsidiaries
NOTES TO THE CONSOLIDATED FINANCIAL STATEMENTS — (Continued)
As of December 31, 2017, the total number of shares available for future grants under the 2016 Plan was 450,589 shares.
2014 Equity Incentive Plan
The Company adopted the 2014 Plan on May 1, 2014. The 2014 Plan permitted the grant of incentive stock options, nonstatutory stock options, and restricted stock. On April 27, 2017 the Company's Board of Directors terminated the 2014 Plan as to future awards and confirmed that underlying shares corresponding to awards under the 2014 Plan that were outstanding at the time the 2016 Plan became effective that are forfeited, terminated or expire will become available for issuance under the 2016 Plan.
In conjunction with the 2016 and 2014 Plans, as of December 31, 2017, the Company had granted stock options and RSUs which are described in more detail below.
Modification of Stock Awards
During 2017, certain employee stock option awards were converted into RSU equity awards using conversion ratios designed to preserve the value of these awards to the holders. On October 26, 2017, affected employees received 165,524 RSU awards based upon cancellation of 228,780 stock option awards. Adjustments to our outstanding stock based compensation awards resulted in an additional compensation expense of $0.7 million to be recognized over the remaining vesting life of the underlying awards.
Stock Options
Stock options are awarded to encourage ownership of the Company's common stock by employees and to provide increased incentive for employees to render services and to exert maximum effort for the success of the Company. The Company's stock options generally permit net-share settlement upon exercise. The option exercise price, vesting schedule and exercise period are determined for each grant by the administrator of the applicable plan. The Company's stock options generally have a 10-year contractual term and vest over a 4-year period from the grant date.
The weighted-average grant-date fair value for options granted in 2017 was $8.08. These options have a contractual term of 10 years and vest 25% on the first anniversary of the effective date and 2.083% each month thereafter until full vesting on the fourth anniversary of the effective date. The assumptions used to determine the fair value of options granted in the years ended December 31, 2017 and 2016 using the Black-Scholes-Merton model are as follows:
2017 | 2016 | |||||
Dividend yield | 0 | % | 0 | % | ||
Risk-free interest rate | 2.03% to 2.28% | 1.13% to 1.59% | ||||
Expected volatility (weighted average and range, if applicable) | 33% (31% to 34%) | 32% (31% to 34%) | ||||
Expected term | 5-7 years | 5-7 years | ||||
The expected term of the options granted is the period of time from the grant date to the date of expected exercise estimated using historical data. The expected volatility was determined based on an average of companies in similar industries and other factors. The risk-free interest rate used is the current yield on US Treasury notes with a term equal to the expected term of the options at the grant date. The expected dividend yield is based on annualized dividends on the underlying share during the expected term of the option.
141
Elevate Credit, Inc. and Subsidiaries
NOTES TO THE CONSOLIDATED FINANCIAL STATEMENTS — (Continued)
A summary of stock option activity as of and for the year ended December 31, 2017 is presented below:
Stock Options(1) | Shares | Weighted Average Exercise Price | Weighted Average Remaining Contractual Life (in years) | ||||||
Outstanding at December 31, 2016 | 3,501,412 | $ | 4.18 | ||||||
Granted | 111,177 | 8.08 | |||||||
Exercised(2) | (753,507 | ) | 2.31 | ||||||
Cancelled/Forfeited | (330,157 | ) | 7.58 | ||||||
Outstanding at December 31, 2017 | 2,528,925 | 4.48 | 5.43 | ||||||
Options exercisable at December 31, 2017 | 2,364,062 | $ | 4.32 | 5.27 | |||||
(1) | All awards presented in this table are for Elevate stock only. |
(2) | During the year ended December 31, 2017, certain exercised options were net share-settled to cover the required exercise price and withholding tax and the remaining amounts were converted into an equivalent number of shares of the Company's common stock. The Company withheld 267,179 shares which had a value equivalent to the aggregate exercise price of approximately $1.1 million plus the employees' minimum statutory obligation of approximately $949 thousand for applicable income and other employment taxes, and remitted the cash to the appropriate taxing authorities. The total shares withheld was based on the value of the Elevate common stock on the exercise dates. These net-share settlements had the effect of share repurchases by the Company as they reduced the number of shares that would have otherwise have been issued. |
At December 31, 2017, the following options were outstanding at their respective exercise price:
Exercise Price | Options Outstanding |
$2.13 | 918,750 |
$3.16 | 12,500 |
$4.29 - 4.57 | 287,500 |
$5.15 - 5.59 | 542,379 |
$6.31 | 574,119 |
$8.08 - 8.32 | 193,677 |
Total | 2,528,925 |
At December 31, 2017, there was approximately $0.3 million of unrecognized compensation cost related to non-vested stock options which is expected to be recognized over a weighted average period of 1.4 years. The total intrinsic value of options exercised for the year December 31, 2017 was $4.2 million.
Restricted Stock Units
RSUs are awarded to serve as a key retention tool for the Company to retain its employees. RSUs will transfer value to the holder even if the Company’s stock price falls below the price on the date of grant, provided that the recipient provides the requisite service during the period required for the award to “vest.”
The weighted-average grant-date fair value for RSUs granted during the year ended December 31, 2017 was $7.47. These RSUs primarily vest 25% on the first anniversary of the effective date, and 25% each year thereafter, until full vesting on the fourth anniversary of the effective date.
142
Elevate Credit, Inc. and Subsidiaries
NOTES TO THE CONSOLIDATED FINANCIAL STATEMENTS — (Continued)
A summary of RSU activity as of and for the year ended December 31, 2017 is presented below:
RSUs(1) | Shares | Weighted Average Grant-Date Fair Value | Weighted Average Remaining Contractual Life (in years) | ||||||
Nonvested at December 31, 2016 | 425,260 | $ | 8.12 | ||||||
Granted | 2,653,460 | 7.47 | |||||||
Vested(2) | (249,704 | ) | 7.61 | ||||||
Forfeited | (44,492 | ) | 7.87 | ||||||
Nonvested at December 31, 2017 | 2,784,524 | 7.55 | 9.34 | ||||||
Expected to vest at December 31, 2017 | 2,207,280 | $ | 7.55 | 9.33 | |||||
(1) | All awards presented in this table are for Elevate common stock only. |
(2) | During the year ended December 31, 2017, certain RSUs were net share-settled to cover the required withholding tax and the remaining amounts were converted into an equivalent number of shares of the Company's common stock. The Company withheld 35,153 shares for applicable income and other employment taxes, and remitted the cash to the appropriate taxing authorities. |
During the year ended December 31, 2017, the aggregate intrinsic value of vested RSUs was $1.7 million.
At December 31, 2017, there was approximately $13.6 million of unrecognized compensation cost related to non-vested RSUs which is expected to be recognized over a weighted average period of 3.1 years. The total vest-date fair value of RSUs for the year ended December 31, 2017 was $1.9 million.
Employee Stock Purchase Plan
The Company offers an Employee Stock Purchase Plan ("ESPP") to eligible employees. There are currently 525,000 shares authorized and reserved for the ESPP. There were 79,909 shares purchased under the ESPP for the year ended December 31, 2017.
NOTE 11—FAIR VALUE MEASUREMENTS
The accounting guidance on fair value measurements establishes a fair value hierarchy that prioritizes the inputs to valuation techniques used to measure fair value. The hierarchy gives the highest priority to unadjusted quoted prices in active markets for identical assets or liabilities (Level 1 measurements) and the lowest priority to measurements involving significant unobservable inputs (Level 3 measurements).
The Company groups its assets and liabilities measured at fair value in three levels of the fair value hierarchy, based on the fair value measurement technique, as described below:
Level 1—Valuation is based upon quoted prices (unadjusted) for identical assets and liabilities in active exchange markets that the Company has the ability to access at the measurement date.
Level 2—Valuation is based upon quoted prices for similar instruments in active markets, quoted prices for identical or similar instruments in markets that are not active, and model-based valuation techniques with significant assumptions and inputs that are observable in the market or can be derived principally from or corroborated by observable market data.
Level 3—Valuation is derived from model-based techniques that use inputs and significant assumptions that are supported by little or no observable market data. These unobservable assumptions reflect estimates of assumptions that market participants would use in pricing the asset or liability. Valuation techniques include the use of pricing models, discounted cash flow models and similar techniques.
The Company monitors the market conditions and evaluates the fair value hierarchy levels at least quarterly. For any transfers in and out of the levels of the fair value hierarchy, the Company discloses the fair value measurement at the beginning of the reporting period during which the transfer occurred. For the years ended December 31, 2017 and 2016, there were no significant transfers between levels.
143
Elevate Credit, Inc. and Subsidiaries
NOTES TO THE CONSOLIDATED FINANCIAL STATEMENTS — (Continued)
The level of fair value hierarchy within which a fair value measurement in its entirety falls is based on the lowest-level input that is most significant to the fair value measurement in its entirety. In the determination of the classification of assets and liabilities in Level 2 or Level 3 of the fair value hierarchy, the Company considers all available information, including observable market data, indications of market conditions, and its understanding of the valuation techniques and significant inputs used. Based upon the specific facts and circumstances, judgments are made regarding the significance of the Level 3 inputs to the fair value measurements of the respective assets and liabilities in their entirety. If the valuation techniques that are most significant to the fair value measurements are principally derived from assumptions and inputs that are corroborated by little or no observable market data, the asset or liability is classified as Level 3.
Financial Assets and Liabilities Not Measured at Fair Value
The Company has evaluated Loans receivable, net of allowance for loan losses, Receivable from CSO lenders, Receivable from payment processors and Accounts payable and accrued expenses, and believes the carrying value approximates the fair value due to the short-term nature of these balances. The Company has also evaluated the interest rates for Notes payable and believes they represent market rates based on the Company’s size, industry, operations and recent amendments. As a result, the carrying value for Notes payable approximates the fair value. The Company classifies its fair value measurement techniques for the fair value disclosures associated with Loans receivable, net of allowance for loan losses, Receivable from CSO lenders, Receivable from payment processors, Accounts payable and accrued liabilities and Notes payable, net as Level 3 in accordance with ASC 820-10, Fair Value Measurements and Disclosures (“ASC 820-10”).
Fair Value Measurements on a Recurring Basis
Upon the initial $10 million draw on the Convertible Term Notes in October 2016, a derivative liability of approximately $1.7 million was recorded at fair value and was included as debt discount in Notes Payable and as a Derivative Liability on the Consolidated Balance Sheets at December 31, 2016. Upon the $15 million draw on the Convertible Term Notes in January 2017, an additional derivative liability of approximately $2.5 million was recorded at fair value and was included as a debt discount in Notes Payable and as a Derivative Liability. This liability is considered to be Level 3 in accordance with ASC 820-10 and is measured at fair value on a recurring basis. See Note 7—Notes Payable for additional information.
During the period from the receipt of notice from the Company to VPC of the anticipated commencement of the roadshow in connection with its IPO until immediately prior to the effectiveness of the Registration Statement, VPC had the option to convert the Convertible Term Notes, in whole or in part, into a number of shares of the Company's common stock determined by the outstanding principal balance of, and accrued, but unpaid interest on, the Convertible Term Notes divided by the product of (a) 0.8 multiplied by (b) the IPO price per share. VPC did not elect to exercise its right to convert, and an unpaid balance on the Convertible Term Notes remained outstanding after the IPO. Upon the effectiveness of the Registration Statement, VPC's option to convert was terminated, and the Convertible Term Notes are no longer convertible in whole or part into shares of the Company's common stock; as a result, the share-settlement ceased to be an embedded derivative feature requiring separate recognition and disclosure. However, a pro-rata portion of the Redemption Premium Feature to be paid upon the cash redemption at maturity, or upon a redemption caused by certain events of default, remains an embedded derivative feature that the Company will be required to assess and recognize as a derivative liability. In January 2018, the Company paid $2.0 million to VPC to settle the derivative liability associated with the Redemption Premium Feature upon the conversion of the Convertible Term Notes to the existing 4th Tranche Term Note. See Note 7—Notes Payable for additional information.
144
Elevate Credit, Inc. and Subsidiaries
NOTES TO THE CONSOLIDATED FINANCIAL STATEMENTS — (Continued)
The Company has no derivative amounts subject to enforceable master netting arrangements that are offset on the Consolidated Balance Sheets. The Derivative liability related to the Convertible Term Notes is measured at fair value on a recurring basis. The change in the Derivative liability for the years ended December 31, 2017, 2016 and 2015 are shown in the following table:
(Dollars in thousands) | Embedded Derivative Liability in Convertible Term Notes | Contingent Consideration Liability | ||||||
Balance at December 31, 2014 | $ | — | $ | 5,529 | ||||
Fair value adjustment (Non-operating expense in the Consolidated Income Statements) | — | (5,529 | ) | |||||
Balance at December 31, 2015 | — | — | ||||||
Derivative recognized upon $10.0 million draw on the underlying Convertible Term Note | 1,707 | — | ||||||
Fair value adjustment (Non-operating expense in the Consolidated Statements of Operations) | 43 | — | ||||||
Balance, December 31, 2016 | 1,750 | — | ||||||
Additional derivative recognized upon $15.0 million draw on the underlying Convertible Term Note | 2,517 | — | ||||||
Reduction of derivative due to $14.9 million repayment of the underlying Convertible Term Note (Non-operating expense in the Consolidated Statements of Operations) | (2,746 | ) | — | |||||
Fair value adjustment (Non-operating expense in the Consolidated Statements of Operations) | 451 | — | ||||||
Balance, December 31, 2017 | $ | 1,972 | $ | — | ||||
The Convertible Term Notes and the Derivative liability were not outstanding at December 31, 2015.
The Company’s derivative liability associated with its Convertible Term Notes is measured at fair value using a probability-weighted valuation scenario model based on the likelihood of the Company successfully completing an IPO or other qualified financing. The inputs and assumptions included in the calculations are highly subjective and subject to interpretation and include inputs and assumptions including estimates of redemption and conversion behaviors. Significant unobservable estimates of redemption and conversion behaviors prior to the IPO included (i) the 75% cumulative probability for the Company’s successful achievement of an IPO or other qualified financing prior to January 31, 2018 and (ii) the 90% probability that the Convertible Term Notes will be required to be redeemed at their maturation on January 31, 2018 (i.e., the holder will opt-out of converting the Convertible Term Notes into shares of the Company's common stock). The floating rate is based on the three-month LIBOR rate. The risk-free interest rate is based on the implied yield available on US Treasury zero-coupon issues over the expected life of the Convertible Term Notes. The expected life is impacted by all of the underlying assumptions and calibration of the Company’s model. Significant increases or decreases in inputs could result in significantly lower or higher fair value measurements. The ranges of significant inputs and assumptions used in measuring the fair value of the embedded derivative liability in the Convertible Term Notes for the years ended December 31, 2017 and 2016 are as follows:
2017 | 2016 | |||||
Expected life (months) | 1 | 6-13 | ||||
Conversion discount percentage | N/A | 20 | % | |||
Floating rate | 10.69% - 10.77% | 10.00% - 10.62% | ||||
Risk-free rate | 1.58 | % | 0.92 | % | ||
Market yield | 23.81 | % | 23.86 | % | ||
Non-marketability discount | N/A | 9 | % | |||
Non-marketability discount volatility | N/A | 53.9 | % | |||
145
Elevate Credit, Inc. and Subsidiaries
NOTES TO THE CONSOLIDATED FINANCIAL STATEMENTS — (Continued)
NOTE 12—INCOME TAXES
Income tax expense (benefit) for the years ended December 31, 2017, 2016 and 2015 consists of the following:
(Dollars in thousands) | 2017 | 2016 | 2015 | |||||||||
Current income tax expense (benefit): | ||||||||||||
Federal | $ | — | $ | — | $ | 264 | ||||||
State | 202 | 434 | 251 | |||||||||
Total current income tax expense | 202 | 434 | 515 | |||||||||
Deferred income tax expense (benefit): | ||||||||||||
Federal | 9,973 | (2,785 | ) | (4,717 | ) | |||||||
State | (244 | ) | (601 | ) | (456 | ) | ||||||
Total deferred income tax expense (benefit) | 9,729 | (3,386 | ) | (5,173 | ) | |||||||
Total income tax expense (benefit) | $ | 9,931 | $ | (2,952 | ) | $ | (4,658 | ) | ||||
No penalties or interest related to taxes were recognized for the years ended December 31, 2017, 2016 and 2015.
The Company's consolidated effective tax rates were 329%, 12% and 19%, while the Company's US effective tax rates were 219%, 28% and 32% for the years ended December 31, 2017, 2016 and 2015, respectively. The consolidated and US effective tax rates were significantly higher in 2017 than in prior years as a result of the Tax Reform, which reduced the US federal corporate tax rate from 35% to 21% in 2018, and for which the Company recognized a one-time $12.5 million charge. The differences between the provision for income tax and the amount that would result if the federal statutory rate were applied to the pre-tax financial income for the years ended December 31, 2017, 2016 and 2015 were as follows:
(Dollars in thousands) | 2017 | 2016 | 2015 | |||||||||
Federal statutory rate of 35% | $ | 1,055 | $ | (8,854 | ) | $ | (8,599 | ) | ||||
State income tax provision | (537 | ) | (109 | ) | (166 | ) | ||||||
Permanent differences | 161 | 690 | 640 | |||||||||
Change in valuation allowance | (1,198 | ) | (878 | ) | (3,131 | ) | ||||||
Rate differential | (1,616 | ) | 2,511 | 1,588 | ||||||||
Change in federal statutory rate - US tax reform | 12,462 | — | — | |||||||||
Change in foreign statutory tax rate | 399 | 2,033 | 2,753 | |||||||||
Change in reserve for uncertain tax positions | 190 | 1,525 | 1,491 | |||||||||
Other | (985 | ) | 130 | 766 | ||||||||
Total | $ | 9,931 | $ | (2,952 | ) | $ | (4,658 | ) | ||||
Also on December 22, 2017, the SEC issued SAB 118, which provides guidance on accounting for tax effects of the Act. SAB 118 provides a measurement period of up to one year from the enactment date to complete the accounting. The Company has completed its accounting of the impact of the reduction in the corporate tax rate and remeasurement of certain deferred tax assets and liabilities based on the rate at which they are expected to reverse in the future, generally 21%. The below table reconciles the changes to the Deferred tax asset balance, including impacts of the Act, with deferred income tax expense.
146
Elevate Credit, Inc. and Subsidiaries
NOTES TO THE CONSOLIDATED FINANCIAL STATEMENTS — (Continued)
(Dollars in thousands) | 2017 | |||
Beginning balance | $ | 31,197 | ||
Deferred income tax expense | (9,729 | ) | ||
Impact of adoption of ASU 2016-09 (offset to Retained earnings) | 3,347 | |||
Tax effect of equity issuance costs (offset to Additional paid-in capital) | (1,196 | ) | ||
Tax adjustment for foreign currency translation | (74 | ) | ||
Ending balance | $ | 23,545 | ||
The tax effects of temporary differences that give rise to significant portions of deferred tax assets and deferred tax liabilities at December 31, 2017 and 2016 are presented below:
(Dollars in thousands) | 2017 | 2016 | ||||||
Deferred Tax Assets: | ||||||||
Allowance for losses on loans receivable | $ | 13,781 | $ | 20,372 | ||||
Net operating loss carryforward – foreign | 4,179 | 5,648 | ||||||
Net operating loss carryforward – domestic | 10,321 | 10,690 | ||||||
Cumulative translation adjustment – domestic | 2,274 | 2,347 | ||||||
Accrued expenses | 1,718 | 1,246 | ||||||
Deferred equity issuance costs | 25 | 1,895 | ||||||
Other | 1,880 | 1,817 | ||||||
Total deferred tax assets | 34,178 | 44,015 | ||||||
Deferred Tax Liabilities: | ||||||||
Property and equipment, principally due to differences in depreciation | (638 | ) | (1,092 | ) | ||||
Amortization of intangible assets | (4,382 | ) | (4,549 | ) | ||||
Prepaid expenses | (1,068 | ) | (1,180 | ) | ||||
Net deferred tax assets before valuation allowance | 28,090 | 37,194 | ||||||
Valuation allowance | (4,545 | ) | (5,997 | ) | ||||
Deferred tax assets, net | $ | 23,545 | $ | 31,197 | ||||
Uncertain tax positions
The following table sets forth the changes in the Company’s unrecognized tax benefits related to the UK tax provision for the years ended December 31, 2017, 2016 and 2015:
(Dollars in thousands) | 2017 | 2016 | 2015 | |||||||||
Balance at beginning of the year | $ | 5,736 | $ | 4,211 | $ | 2,720 | ||||||
Reductions for tax positions related to the prior year | (166 | ) | (1,079 | ) | (220 | ) | ||||||
Additions for tax positions related to the current year | 356 | 2,604 | 1,711 | |||||||||
Balance at the end of the period | $ | 5,926 | $ | 5,736 | $ | 4,211 | ||||||
If the cumulative unrecognized tax benefit is recognized, there will be no effect on the Company's effective tax rate due to the full valuation allowance on the UK's deferred tax asset. Due to the nature of the unrecognized tax benefits and the existence of tax attributes, the Company has not accrued any interest or penalties associated with unrecognized tax benefits in the Consolidated Statements of Operations nor has it recognized a liability in the Consolidated Balance Sheets. The Company does not believe the total amount of unrecognized benefit as of December 31, 2017 will increase or decrease significantly in the next twelve months.
147
Elevate Credit, Inc. and Subsidiaries
NOTES TO THE CONSOLIDATED FINANCIAL STATEMENTS — (Continued)
For purposes of evaluating the need for a deferred tax valuation allowance, significant weight is given to evidence that can be objectively verified. The following provides an overview of the assessment that was performed for both the domestic and foreign deferred tax assets, net.
US deferred tax assets, net
At December 31, 2017 and 2016, the Company did not establish a valuation allowance for its US deferred tax assets "DTAs” based on management’s expectation of generating sufficient taxable income in a look forward period over the next three to five years. The NOL carryforward from US operations at December 31, 2017 was approximately $42.9 million. The NOL carryforward expires beginning in 2034. The ultimate realization of the resulting deferred tax asset is dependent upon generating sufficient taxable income prior to the expiration of this carryforward. The Company considered the following positive and negative factors when making their assessment regarding the ultimate realizability of the deferred tax assets.
Significant positive factors include the following:
• | In 2017, the Company continued to grow its operating income (from $9 million in 2015 to $48 million in 2016 and to $71 million in 2017). The US-only pre-tax loss decreased from $10.4 million in 2016 to $4.5 million in 2017, a 57% improvement from prior year. The US only pre-tax loss is attributed to slower loan growth for Rise early in the year, due to a delay in the tax refund season, coupled with slower loan growth for Elastic, in September and October, due to the impact of the hurricanes in Texas and Florida. |
• | For 2018, the Company is forecasting U.S. taxable income as it continues to scale its business and generate even greater operating income. The continued growth of the loan portfolio within the credit quality and marketing cost targets will drive improved gross margins for the Company. The Company's operating expenses are within targeted efficiency ratios and are expected to hold flat. The Company used the IPO proceeds to pay down its debt balances, as well as re-negotiated its debt facilities to lower interest rates, which will drive improved profitability from lower interest costs in future years. Various forecast scenarios have been performed with the results reflecting a majority, if not total, usage of the US NOL in 2018. |
• | Management’s success in developing accurate forecasts and management’s track record of launching new and successful products, is another source of positive evidence which was evaluated. The Company believes that the unique circumstance of the 2014 spin-off from a company that was successful prior to the spin-off provides it with several positive objectively verifiable factors that would not normally be available to a new company with a limited operating history. |
Significant negative factor include:
• | The Company has cumulative losses and a lack of taxable income from the 2014 spin-off through 2017. A net taxable loss was incurred for the years ended December 31, 2017, 2016 and 2015 due to the establishment of an infrastructure for the Company separate from Think Finance while the Company was scaling the growth of the relatively new products of Rise and Elastic. Additionally, the Company originally forecasted US taxable income for the year ended December 31, 2017. The slower loan growth than expected in Rise and Elastic as well as the impact of the adoption of ASU 2016-09 and the 2017 deductible IPO transaction costs were significant contributors to the net taxable loss for the year ended December 31, 2017 as compared to the expected results for 2017. |
The Company has given due consideration to all the factors and believes the positive evidence outweighs the negative evidence and has concluded that the US deferred tax asset is expected to be realized based on management’s expectation of generating sufficient taxable income in a look-forward period over the next three to five years. Although realization is not assured, management believes it is more likely than not that all of the recorded deferred tax assets will be realized. The amount of the deferred tax assets considered realizable, however, could be adjusted in the future if estimates of future taxable income change. As a result, at December 31, 2017 and 2016, the Company did not establish a valuation allowance for the US DTA.
148
Elevate Credit, Inc. and Subsidiaries
NOTES TO THE CONSOLIDATED FINANCIAL STATEMENTS — (Continued)
UK deferred tax assets, net
At December 31, 2017 and 2016, the Company recognized a full valuation allowance for its foreign deferred tax assets due to the lack of sufficient objective evidence regarding the realization of these assets in the foreseeable future. For the years ended December 31, 2017 and 2016, the valuation allowance decreased by approximately $1.2 million and decreased by approximately $0.9 million, respectively, due to the decrease of the net deferred tax assets related to the UK, which primarily consists of the NOL carryforward. Regardless of the deferred tax valuation allowance recognized at December 31, 2017 and 2016, the Company continues to retain NOL carryforwards for foreign income tax purposes of approximately $22.5 million and $30.0 million, respectively, available to offset future foreign taxable income. To the extent that the Company generates taxable income in the future to utilize the tax benefits of the related deferred tax assets, subject to certain potential limitations, it may be able to reduce its effective tax rate by reducing the valuation allowance. The Company’s foreign NOL carryforward of approximately $22.5 million and $30.0 million for December 31, 2017 and 2016, respectively, can be carried forward indefinitely.
NOTE 13—COMMITMENTS, CONTINGENCIES AND GUARANTEES
Contingencies
Currently and from time to time, the Company may become a defendant in various legal and regulatory actions. While the Company cannot determine the ultimate outcome of these actions, it believes their resolution will not have a material adverse effect on the Company's financial condition, results of operations or liquidity.
The Company is cooperating with the Consumer Financial Protection Bureau (the “CFPB”) related to a civil investigative demand (“CID”) received by Think Finance requesting information about the operations of Think Finance prior to the spin-off. The CFPB has not made any specific allegation of violation(s) of law or initiated litigation in connection with the CID as of this date.
Commitments
The Elastic product, which offers lines of credit to consumers, had approximately $198.9 million and $110.7 million in available and unfunded credit lines at December 31, 2017 and 2016, respectively. In May 2017, the Rise product began offering lines of credit to consumers in certain states and had approximately $3.5 million and $0 at December 31, 2017 and 2016, respectively, in available and unfunded credit lines. While these amounts represented the total available unused credit lines, the Company has not experienced and does not anticipate that all line of credit customers will access their entire available credit lines at any given point in time. The Company has not recorded a loan loss reserve for unfunded credit lines as the Company has the ability to cancel commitments within a relatively short timeframe.
Effective June 2017, the Company entered into a seven year lease agreement for office space in San Diego, California. Upon the commencement of the lease, the Company was required to provide the lessor with an irrevocable and unconditional $500 thousand letter of credit. Provided the Company is not in default of any terms of the lease agreement, the outstanding required balance of the letter of credit will be reduced by $100 thousand per year beginning on the second anniversary of the lease commencement and ending on the fifth anniversary of the lease agreement. The minimum balance of the letter of credit will be at least $100 thousand throughout the duration of the lease. At December 31, 2017 and 2016, the Company had $500 thousand and $0, respectively, of cash balances securing the letter of credit which is included in Restricted cash within the Consolidated Balance Sheets.
Guarantees
In connection with its CSO programs, the Company guarantees consumer loan payment obligations to CSO lenders and is required to purchase any defaulted loans it has guaranteed. The guarantee represents an obligation to purchase specific loans that go into default.
149
Elevate Credit, Inc. and Subsidiaries
NOTES TO THE CONSOLIDATED FINANCIAL STATEMENTS — (Continued)
Indemnification
In the ordinary course of business, the Company may indemnify customers, vendors, lessors, investors, and other parties with respect to certain matters subject to various terms and scopes. Such indemnification may include losses from the Company's breach of such agreements and the services it provides. The Company has not incurred material costs to settle claims related to such indemnification provisions at December 31, 2017 and 2016. The fair value of these liabilities is immaterial and accordingly have no liabilities recorded for these agreements at December 31, 2017 and 2016.
NOTE 14—OPERATING SEGMENT INFORMATION
The Company determines operating segments based on how its chief operating decision maker manages the business, including making operating decisions, deciding how to allocate resources and evaluating operating performance. The Company's chief operating decision-maker is the Chief Executive Officer, who reviews the Company's operating results on a consolidated basis on a monthly basis.
The Company has one reportable segment, which provides online financial services for subprime credit consumers, which is composed of the Company’s operations in the United States and the United Kingdom. The Company has aggregated all components of its business into a single reportable segment based on the similarities of the economic characteristics, the nature of the products and services, the distribution methods, the type of customers and the nature of the regulatory environments.
Information related to each reportable segment is outlined below. Segment revenue is used to measure performance because management believes that this information is the most relevant in evaluating the results of the respective segments relative to other entities that operate in the same industry.
150
Elevate Credit, Inc. and Subsidiaries
NOTES TO THE CONSOLIDATED FINANCIAL STATEMENTS — (Continued)
The following tables summarize the allocation of net revenues and long-lived assets based on geography. The geographic presentation of the Company's segment assets were based on the geographic location of the asset and revenue by the Company's country of domicile.
Years ended December 31, | ||||||||||||
(Dollars in thousands) | 2017 | 2016 | 2015 | |||||||||
Revenues | ||||||||||||
United States | $ | 570,316 | $ | 484,462 | $ | 353,511 | ||||||
United Kingdom | 102,816 | 95,979 | 80,495 | |||||||||
Total | $ | 673,132 | $ | 580,441 | $ | 434,006 | ||||||
Long-lived assets | ||||||||||||
United States | $ | 29,317 | $ | 23,141 | $ | 24,391 | ||||||
United Kingdom | 13,082 | 11,349 | 11,890 | |||||||||
Total | $ | 42,399 | $ | 34,490 | $ | 36,281 | ||||||
NOTE 15—RELATED PARTIES
The Company has entered into sublease agreements with Think Finance for office space that expire beginning in 2018 through 2019. Total rent and utility payments made to Think Finance for office space were approximately $0.9 million, $1.5 million and $1.7 million for the years ended December 31, 2017, 2016 and 2015, respectively. Rent and utility expense is included in Occupancy and equipment within the Consolidated Statements of Operations. Total payments for equipment were approximately $0.0 million, $0.3 million and $0.3 million for the years ended December 31, 2017, 2016 and 2015, respectively. Equipment payments were included as a reduction of the capital lease liability included in Accounts payable and accrued liabilities within the Consolidated Balance Sheets and as interest expense included in Net interest expense within the Consolidated Statements of Operations. For the year ended December 31, 2015, the Company made a tax settlement payment to Think Finance of $0.3 million.
At December 31, 2017 and 2016, the Company had approximately $95 thousand and $21 thousand, respectively, due to Think Finance related to reimbursable costs, which is included in Accounts payable and accrued liabilities within the Consolidated Balance Sheets.
Expenses related to board of director fees, stock compensation, and a consulting arrangement with a related party are included in Professional services within the Consolidated Statement of Operations. Travel reimbursements and meals and entertainment expenses are included in Other within the Consolidated Statement of Operations. These expenses for the years ended December 31, 2017, 2016 and 2015 were as follows:
Years Ended December 31, | ||||||||||||
(Dollars in thousands) | 2017 | 2016 | 2015 | |||||||||
Fees and travel expenses | $ | 541 | $ | 316 | $ | 278 | ||||||
Stock compensation | 728 | 208 | 156 | |||||||||
Consulting | 300 | 303 | 176 | |||||||||
Total board related expenses | $ | 1,569 | $ | 827 | $ | 610 | ||||||
In addition to amounts due to Think Finance as disclosed above, at December 31, 2017 and 2016, the Company had approximately $65 thousand and $25 thousand, respectively, due to related parties, which is included in Accounts payable and accrued liabilities within the Consolidated Balance Sheets.
151
Elevate Credit, Inc. and Subsidiaries
NOTES TO THE CONSOLIDATED FINANCIAL STATEMENTS — (Continued)
NOTE 16—401(k) PLAN
The Company adopted a 401(k) Plan (the “Plan”) on June 1, 2014. All employees are eligible to participate in the Plan upon reaching the age of 21 years and completing one month of service with the Company. The Plan is a “safe harbor 401k plan” and the Company matches 100% of each participant’s first 4% of compensation that is contributed to the Plan each year. Participants may contribute up to 70% of their eligible earnings to the applicable Plan, subject to regulatory and other plan restrictions. Company and employee contributions are fully vested at the time of contribution. The Company’s consolidated matching contributions in the years ended December 31, 2017, 2016 and 2015 totaled approximately $1.8 million, $1.5 million and $1.2 million, respectively.
In addition, the Company operates a defined contribution pension scheme for its employees in the United Kingdom. The assets of the scheme are held separately to those of the Company in an independently administered fund. The pension cost charge represents approximately $0.3 million in contributions paid by the Company to the fund during each of the years ended December 31, 2017, 2016 and 2015.
NOTE 17—QUARTERLY FINANCIAL DATA (UNAUDITED)
The Company’s operations are subject to seasonal fluctuations. Demand in the US has historically been highest in the third and fourth quarters of each year, corresponding to the holiday season, and lowest in the first quarter of each year, corresponding to our customers’ receipt of income tax refunds in the US. Typically, the Company’s loan loss provision, a significant portion of cost of sales in addition to direct marketing and other cost of sales, is lowest as a percentage of revenue in the first quarter of each year. The following is a summary of the quarterly results of operations for the years ended December 31, 2017 and 2016 (in thousands, except per share data):
(Dollars in thousands) | First Quarter | Second Quarter | Third Quarter | Fourth Quarter | ||||||||||||
2017 | ||||||||||||||||
Total revenue | $ | 156,367 | $ | 150,471 | $ | 172,851 | $ | 193,443 | ||||||||
Total cost of sales | 97,389 | 96,314 | 122,279 | 134,350 | ||||||||||||
Gross profit | $ | 58,978 | $ | 54,157 | $ | 50,572 | $ | 59,093 | ||||||||
Net income (loss) | $ | 1,668 | $ | 3,020 | $ | 590 | $ | (12,194 | ) | |||||||
Basic earnings (loss) per share | $ | 0.06 | $ | 0.08 | $ | 0.01 | $ | (0.29 | ) | |||||||
Diluted earnings (loss) per share | $ | 0.06 | $ | 0.08 | $ | 0.01 | $ | (0.29 | ) | |||||||
Basic weighted average shares outstanding(1) | 27,237,470 | 38,541,965 | 41,717,231 | 41,897,080 | ||||||||||||
Diluted weighted average shares outstanding(1) | 28,735,749 | 39,950,760 | 43,158,515 | 41,897,080 | ||||||||||||
2016 | ||||||||||||||||
Total revenue | $ | 130,722 | $ | 126,780 | $ | 153,920 | $ | 169,019 | ||||||||
Total cost of sales | 72,278 | 89,140 | 119,152 | 119,874 | ||||||||||||
Gross profit | $ | 58,444 | $ | 37,640 | $ | 34,768 | $ | 49,145 | ||||||||
Net income (loss) | $ | 5,792 | $ | (7,496 | ) | $ | (16,247 | ) | $ | (4,422 | ) | |||||
Basic earnings (loss) per share | $ | 0.45 | $ | (0.59 | ) | $ | (1.25 | ) | $ | (0.34 | ) | |||||
Diluted earnings (loss) per share(2) | $ | 0.39 | $ | (0.59 | ) | $ | (1.25 | ) | $ | (0.34 | ) | |||||
Basic weighted average shares outstanding | 12,797,458 | 12,800,795 | 12,976,067 | 13,001,220 | ||||||||||||
Diluted weighted average shares outstanding(2) | 14,707,898 | 12,800,795 | 12,976,067 | 13,001,220 | ||||||||||||
(1) Unaudited pro-forma basic and diluted net income per share has been computed for first quarter of 2017 only to give effect to the automatic conversion of the convertible preferred stock into shares of common stock upon the completion of the IPO using the if converted method as though the conversion had occurred as of the beginning of the period.
(2) Diluted weighted average shares outstanding for the first quarter of 2016 was originally reported in our Quarterly Report on Form 10-Q issued on May 18, 2017 including the conversion of our Convertible Preferred Stock of 14,098,519 shares for comparability with the quarter ended March 31, 2017. The conversion of the Convertible Preferred Stock has been excluded from the quarter ended March 31, 2016 in the above presentation. This exclusion increased diluted earnings per share by $0.19 per share.
152
Elevate Credit, Inc. and Subsidiaries
NOTES TO THE CONSOLIDATED FINANCIAL STATEMENTS — (Continued)
NOTE 18—SUBSEQUENT EVENTS
The Company evaluated subsequent events and determined there have been no material subsequent events that required recognition or additional disclosure in these financial statements, except as follows:
Notes Payable
The Convertible Term Notes were converted into the 4th Tranche Term Notes on January 30, 2018 per the terms of the VPC Facility. Additionally, the maturity of the Convertible Term Notes was extended to February 1, 2021 and the debt discount on the Convertible Term Notes was fully amortized. Finally, the exit premium under the Convertible Term Notes of $2.0 million was due and paid on January 30, 2018.
The Company made draws on the ESPV Facility of $8 million subsequent to December 31, 2017.
Lease Agreement
On January 24, 2018, the Company entered into a new lease agreement with COP-Spectrum Center, LLC to increase the office space leased at 5080 Spectrum Drive (the "Building") to approximately 53,000 square feet. This lease will commence on October 1, 2018 and expire June 30, 2026.
Interest Rate Cap
RSPV and ESPV entered into interest rate cap transactions on January 11, 2018 with a counterparty to mitigate the floating rate interest risk on an aggregate of $240 million and $216 million, respectively, of debt that is currently outstanding under each entity's existing credit facilities. Both interest rate caps have effective dates of January 11, 2018 and maturity dates of February 1, 2019. RSPV and ESPV paid fixed premiums of $719 thousand and $648 thousand, respectively, on January 16, 2018.
153
Item 9. Changes in and Disagreements with Accountants
None.
Item 9A. Controls and Procedures
Evaluation of Disclosure Controls and Procedures
Under the supervision and with the participation of our Chief Executive Officer and Chief Financial Officer, our management has evaluated the effectiveness of the design and operation of our disclosure controls and procedures (as defined in Rules 13a-15(e) and 15d-15(e) under the Securities Exchange Act of 1934) as of December 31, 2017 (the “Evaluation Date”). Based upon that evaluation, the Chief Executive Officer and Chief Financial Officer concluded that, as of the Evaluation Date, our disclosure controls and procedures are effective and provide reasonable assurance (i) that information required to be disclosed in reports that we file or submit under the Exchange Act is recorded, processed, summarized and reported within the time periods specified in the Securities and Exchange Commission rules and forms; and (ii) that information required to be disclosed in the reports that we file or submit under the Exchange Act is accumulated and communicated to management, including our Chief Executive Officer and Chief Financial Officer, to allow timely decisions regarding required disclosures.
Limitations on the Effectiveness of Controls
Our management, including our Chief Executive Officer and Chief Financial Officer, does not expect that our disclosure controls and procedures or internal control over financial reporting will prevent or detect all possible misstatements due to error and fraud. Our disclosure controls and procedures and internal control over financial reporting are, however, designed to provide reasonable assurance of achieving their objectives.
Report of Management on Internal Control over Financial Reporting
This report does not include an annual report of management’s assessment regarding internal control over financial reporting due to a transition period established by the rules of the SEC for newly public companies.
In addition, because we are an "emerging growth company" under the JOBS Act, our independent registered public accounting firm will not be required to attest to the effectiveness of our internal control over financial reporting for so long as we are an emerging growth company.
Changes in Internal Control over Financial Reporting
There has been no change in our internal control over financial reporting that occurred during our most recent fiscal quarter that has materially affected, or is reasonably likely to materially affect, our internal control over financial reporting.
Item 9B. Other Information
None.
PART III
Item 10. Directors, Executive Officers and Corporate Governance
The Company plans to file its Proxy Statement for the 2018 Annual Meeting of Stockholders (the "Proxy Statement") within 120 days after December 31, 2017. Information required by this Item 10 is included in our Proxy Statement under the caption "Corporate Governance" and is incorporated herein by reference.
The Company has adopted a Code of Business Conduct and Ethics Policy that applies to all of its directors, officers (including all of its executive officers) and employees. This Code of Business Conduct and Ethics Policy is publicly available on the Company’s website at www.elevate.com in the Investor Relations section under “Corporate Governance—Governance Documents—Code of Business Conduct and Ethics Policy.” We intend to satisfy the disclosure requirement under Item 5.05 of Form 8-K regarding amendment to, or waiver from, a provision of our Code of Business Conduct and Ethics Policy by posting such information on our investor relations website under the heading “Corporate Governance—Governance Documents” at http://investors.elevate.com.
Item 11. Executive Compensation
The information required by this item will be included under the headings “Executive Compensation” and “Corporate Governance” in the Proxy Statement and is incorporated herein by reference.
154
Item 12. Security Ownership of Certain Beneficial Owners and Management and Related Stockholder Matters
The information required by this item will be included under the captions “Security Ownership of Certain Beneficial Owners and Management and Related Stockholder Matters” and “Executive Compensation” in the Proxy Statement and is incorporated herein by reference.
Item 13. Certain Relationships and Related Transactions
The information required by this item will be included under the captions “Certain Relationships and Related Transactions” and “Corporate Governance” in the Proxy Statement and is incorporated herein by reference.
Item 14. Principal Accounting Fees and Services
The information required by this item will be included under the caption “Independent Registered Public Accounting Firm Fees and Services” in the Proxy Statement and is incorporated herein by reference.
PART IV
Item 15. Exhibits, Financial Statement Schedules
Item 15(a)(1) and (2) and 15(c) Financial Statements and Schedules
See “Index to Consolidated Financial Statements” in Item 8 of this Annual Report on Form 10-K. Other financial statement schedules have not been included because they are not applicable or the information is included in the financial statements or notes thereto.
Item 15(a)(3) and Item 15(b) Exhibits
The exhibits identified below are filed or incorporated by reference as part of this Annual Report on Form 10-K, in each case as indicated therein (numbered in accordance with Item 601 of Regulation S-K). We have identified below each management contract and compensation plan filed as an exhibit to this Annual Report on Form 10-K in response to Item 15(a)(3) of Form 10-K.
155
Item 15(b) Exhibits
The documents listed in the Exhibit Index of this report are incorporated by reference or are filed with this Annual Report on Form 10-K, in each case as indicated therein (numbered in accordance with Item 601 of Regulation S-K).
Item 16. 10-K Summary
None.
156
Exhibit index
Exhibit number | Description | Filed / Incorporated by Reference from Form | Incorporated by Reference from Exhibit Number | Date Filed |
3.1 | 8-K | 3.1 | April 14, 2017 | |
3.2 | 8-K | 3.1 | September 20, 2017 | |
3.3 | 8-K | 3.2 | April 14, 2017 | |
4.1 | S-1 | 4.1 | January 11, 2016 | |
4.2 | S-1 | 4.2 | January 11, 2016 | |
10.1∞ | S-1 | 10.5 | November 9, 2015 | |
10.2∞ | S-1 | 10.76 | January 30, 2017 | |
10.3∞ | S-1 | 10.6 | November 9, 2015 | |
10.4∞ | S-1 | 10.7 | November 9, 2015 | |
10.5∞ | S-1 | 10.8 | November 9, 2015 | |
10.6∞ | S-1 | 10.11 | November 9, 2015 | |
10.7∞ | S-1 | 10.9 | November 9, 2015 | |
10.8 | S-1 | 10.36 | November 9, 2015 | |
10.9∞ | S-1 | 10.53 | January 30, 2017 | |
10.10∞ | 8-K | 10.1 | May 2, 2017 | |
10.11∞ | S-1 | 10.79 | March 27, 2017 | |
10.12 | S-1 | 10.80 | March 27, 2017 | |
157
Exhibit number | Description | Filed / Incorporated by Reference from Form | Incorporated by Reference from Exhibit Number | Date Filed |
10.13∞ | 8-K | 10.1 | September 1, 2017 | |
10.14 | S-1 | 10.10 | November 9, 2015 | |
10.15∞ | 8-K | 10.1 | October 5, 2017 | |
10.16 | 8-K | 10.2 | October 5, 2017 | |
10.17 | 8-K | 10.3 | October 5, 2017 | |
10.18 | 8-K | 10.4 | October 5, 2017 | |
10.19 | 8-K | 10.5 | October 5, 2017 | |
10.20 | 8-K | 10.6 | October 5, 2017 | |
10.21 | 8-K | 10.7 | October 5, 2017 | |
10.22 | 8-K | 10.8 | October 5, 2017 | |
10.23 | 8-K | 10.9 | October 5, 2017 | |
10.24∞ | 8-K | 10.10 | October 5, 2017 | |
10.25 | S-1 | 10.68 | January 30, 2017 | |
10.26∞ | 10-Q | 10.12 | November 9, 2017 | |
10.27∞ | 10-Q | 10.13 | November 9, 2017 | |
10.28 | S-1 | 10.69 | January 30, 2017 | |
158
Exhibit number | Description | Filed / Incorporated by Reference from Form | Incorporated by Reference from Exhibit Number | Date Filed |
10.29 | S-1 | 10.71 | January 30, 2017 | |
10.30 | S-1 | 10.70 | January 30, 2017 | |
10.31 | S-1 | 10.65 | January 30, 2017 | |
10.32 | S-1 | 10.66 | January 30, 2017 | |
10.33 | S-1 | 10.67 | January 30, 2017 | |
10.34∞ | S-1 | 10.28 | November 9, 2015 | |
10.35 | S-1 | 10.29 | November 9, 2015 | |
10.36 | S-1 | 10.30 | November 9, 2015 | |
10.37 | S-1 | 10.31 | November 9, 2015 | |
10.38 | S-1 | 10.72 | January 30, 2017 | |
10.39∞ | S-1 | 10.73 | January 30, 2017 | |
10.40∞ | S-1 | 10.34 | November 9, 2015 | |
10.41 | Filed herewith. | |||
10.42 | Filed herewith. | |||
10.43 | S-1 | 10.12 | November 9, 2015 | |
10.44 | S-1 | 10.54 | January 30, 2017 | |
10.45 | S-1 | 10.55 | January 30, 2017 | |
10.46∞ | S-1 | 10.56 | January 30, 2017 | |
10.47∞ | S-1 | 10.17 | November 9, 2015 | |
159
Exhibit number | Description | Filed / Incorporated by Reference from Form | Incorporated by Reference from Exhibit Number | Date Filed |
10.48∞ | S-1 | 10.16 | November 9, 2015 | |
10.49 | S-1 | 10.15 | November 9, 2015 | |
10.50∞ | filed herewith | |||
10.51+ | S-1 | 10.18 | March 10, 2017 | |
10.52+ | S-1 | 10.19 | November 9, 2015 | |
10.53+ | S-1 | 10.20 | November 9, 2015 | |
10.54+ | S-1 | 10.21 | November 9, 2015 | |
10.55+ | S-1 | 10.22 | November 9, 2015 | |
10.56+ | S-1 | 10.37 | January 11, 2016 | |
10.57+ | S-1 | 10.43 | December 31, 2015 | |
10.58+ | S-1 | 10.47 | December 31, 2015 | |
10.59+ | S-1 | 10.44 | December 31, 2015 | |
10.60+ | S-1 | 10.48 | December 31, 2015 | |
10.61+ | S-1 | 10.74 | January 30, 2017 | |
10.62+ | S-1 | 10.45 | December 31, 2015 | |
10.63+ | S-1 | 10.46 | December 31, 2015 | |
10.64+ | 10-Q | 10.2 | August 11, 2017 | |
10.65+ | S-1 | 10.24 | November 9, 2015 | |
10.66+ | S-1 | 10.39 | December 31, 2015 | |
10.67+ | S-1 | 10.81 | March 10, 2017 | |
10.68+ | S-1 | 10.25 | November 9, 2015 | |
10.69+ | S-1 | 10.40 | December 31, 2015 | |
10.70+ | S-1 | 10.82 | March 10, 2017 | |
160
Exhibit number | Description | Filed / Incorporated by Reference from Form | Incorporated by Reference from Exhibit Number | Date Filed |
10.71+ | S-1 | 10.26 | November 9, 2015 | |
10.72+ | S-1 | 10.41 | December 31, 2015 | |
10.73+ | S-1 | 10.83 | March 10, 2017 | |
10.74+ | S-1 | 10.27 | November 9, 2015 | |
10.75+ | S-1 | 10.42 | December 31, 2015 | |
21.1 | Filed herewith. | |||
23.1 | Filed herewith. | |||
31.1 | Filed herewith. | |||
31.2 | Filed herewith. | |||
32.1& | Filed herewith. | |||
32.2& | Filed herewith. | |||
99.1∞ | S-1 | 99.1 | November 9, 2015 | |
101.INS* | XBRL Instance Document. | Filed herewith. | ||
101.SCH* | XBRL Taxonomy Extension Schema Document. | Filed herewith. | ||
101.CAL* | XBRL Taxonomy Extension Calculation Linkbase Document. | Filed herewith. | ||
101.DEF* | XBRL Taxonomy Extension Definition Linkbase Document. | Filed herewith. | ||
101.LAB* | XBRL Taxonomy Extension Labels Linkbase Document. | Filed herewith. | ||
101.PRE* | XBRL Taxonomy Extension Presentation Linkbase Document. | Filed herewith. | ||
+ | Indicates a management contract or compensatory plan. | |
∞ | Confidential treatment has been requested or granted as to certain portions of this exhibit, which portions have been omitted and submitted separately to the Securities and Exchange Commission. | |
& | This certification is deemed not filed for purposes of section 18 of the Securities Exchange Act of 1934, as amended (Exchange Act), or otherwise subject to the liability of that section, nor shall it be deemed incorporated by reference into any filing under the Securities Act or the Exchange Act. | |
* | Pursuant to applicable securities laws and regulations, these interactive data files are deemed not filed or part of a registration statement or prospectus for purposes of sections 11 or 12 of the Securities Act, are deemed not filed for purposes of section 18 of the Exchange Act and otherwise are not subject to liability under these sections. | |
161
Signatures
Pursuant to the requirements of Section 13 or 15(d) of the Securities Exchange Act of 1934, Elevate Credit, Inc. has duly caused this report to be signed on its behalf by the undersigned, thereunto duly authorized in the City of Fort Worth, State of Texas, on March 9, 2018.
Elevate Credit, Inc. | ||||
By: | /s/ Kenneth E. Rees | |||
Kenneth E. Rees | ||||
Chief Executive Officer and Chairman (Principal Executive Officer) | ||||
POWER OF ATTORNEY
KNOW ALL PERSONS BY THESE PRESENTS, that each person whose signature appears below constitutes and appoints Kenneth E. Rees, Christopher Lutes and Sarah Fagin Cutrona, jointly and severally, as his or her true and lawful attorneys-in-fact and agents, with full power of substitution and resubstitution, for him or her and in his or her name, place and stead, in any and all capacities, to sign any and all amendments to this Annual Report on Form 10-K, and to file the same, with all exhibits thereto, and other documents in connection therewith, with the Securities and Exchange Commission, granting unto said attorneys-in-fact and agents full power and authority to do and perform each and every act and thing requisite or necessary to be done in and about the premises hereby ratifying and confirming all that said attorneys-in-fact and agents, or his, or their substitute or substitutes, may lawfully do or cause to be done by virtue hereof.
Pursuant to the requirements of the Securities Exchange Act of 1934, this report has been signed below by the following persons in the capacities and on the date indicated.
162
Signature | Title | Date | ||
/s/ Kenneth E. Rees | Chief Executive Officer and Chairman (Principal Executive Officer) | March 9, 2018 | ||
Kenneth E. Rees | ||||
/s/ Christopher Lutes | Chief Financial Officer (Principal Financial Officer) | March 9, 2018 | ||
Christopher Lutes | ||||
/s/ Chad Bradford | Chief Accounting Officer (Principal Accounting Officer) | March 9, 2018 | ||
Chad Bradford | ||||
/s/ John C. Dean | Director | March 9, 2018 | ||
John C. Dean | ||||
/s/ Stephen B. Galasso | Director | March 9, 2018 | ||
Stephen B. Galasso | ||||
/s/ Tyler Head | Director | March 9, 2018 | ||
Tyler Head | ||||
/s/ Robert L. Johnson | Director | March 9, 2018 | ||
Robert L. Johnson | ||||
/s/ John C. Rosenberg | Director | March 9, 2018 | ||
John C. Rosenberg | ||||
/s/ Saundra D. Schrock | Director | March 9, 2018 | ||
Saundra D. Schrock | ||||
/s/ Stephen J. Shaper | Director | March 9, 2018 | ||
Stephen J. Shaper | ||||
/s/ Bradley Strock | Director | March 9, 2018 | ||
Bradley Strock | ||||
163