Attached files
| file | filename |
|---|---|
| EX-99.1 - EXHIBIT 99.1 - Philip Morris International Inc. | earningsreleasepm-ex991xq3.htm |
| EX-99.2 - EXHIBIT 99.2 - Philip Morris International Inc. | earningscallscriptpm-ex992.htm |
| 8-K - 8-K - Philip Morris International Inc. | a2018-10x18form8xk.htm |

Exhibit 99.3 2018 Third-Quarter Results October 18, 2018
Introduction A glossary of key terms and definitions, including the definition for reduced-risk products, or "RRPs," as well as adjustments, other calculations and reconciliations to the most directly comparable U.S. GAAP measures, are at the end of today’s webcast slides, which are posted on our website 2
Forward-Looking and Cautionary Statements • This presentation and related discussion contain projections of future results and other forward-looking statements. Achievement of future results is subject to risks, uncertainties and inaccurate assumptions. In the event that risks or uncertainties materialize, or underlying assumptions prove inaccurate, actual results could vary materially from those contained in such forward-looking statements. Pursuant to the "safe harbor" provisions of the Private Securities Litigation Reform Act of 1995, PMI is identifying important factors that, individually or in the aggregate, could cause actual results and outcomes to differ materially from those contained in any forward-looking statements made by PMI • PMI's business risks include: excise tax increases and discriminatory tax structures; increasing marketing and regulatory restrictions that could reduce our competitiveness, eliminate our ability to communicate with adult consumers, or ban certain of our products; health concerns relating to the use of tobacco products and exposure to environmental tobacco smoke; litigation related to tobacco use; intense competition; the effects of global and individual country economic, regulatory and political developments, natural disasters and conflicts; changes in adult smoker behavior; lost revenues as a result of counterfeiting, contraband and cross-border purchases; governmental investigations; unfavorable currency exchange rates and currency devaluations, and limitations on the ability to repatriate funds; adverse changes in applicable corporate tax laws; adverse changes in the cost and quality of tobacco and other agricultural products and raw materials; and the integrity of its information systems and effectiveness of its data privacy policies. PMI's future profitability may also be adversely affected should it be unsuccessful in its attempts to produce and commercialize reduced-risk products or if regulation or taxation do not differentiate between such products and cigarettes; if it is unable to successfully introduce new products, promote brand equity, enter new markets or improve its margins through increased prices and productivity gains; if it is unable to expand its brand portfolio internally or through acquisitions and the development of strategic business relationships; or if it is unable to attract and retain the best global talent. Future results are also subject to the lower predictability of our reduced-risk product category's performance • PMI is further subject to other risks detailed from time to time in its publicly filed documents, including the Form 10-Q for the quarter ended June 30, 2018. PMI cautions that the foregoing list of important factors is not a complete discussion of all potential risks and uncertainties. PMI does not undertake to update any forward-looking statement that it may make from time to time, except in the normal course of its public disclosure obligations 3
2018: Reaffirming EPS Guidance • Reaffirming 2018 reported diluted EPS guidance range of $4.97 to $5.02, at prevailing exchange rates, compared to $3.88 in 2017 • Guidance includes 12 cents of unfavorable currency • Excluding the unfavorable currency, our guidance continues to represent a growth rate of approximately 8% to 9% compared to our adjusted diluted EPS of $4.72 in 2017 Source: PMI Financials or estimates 4
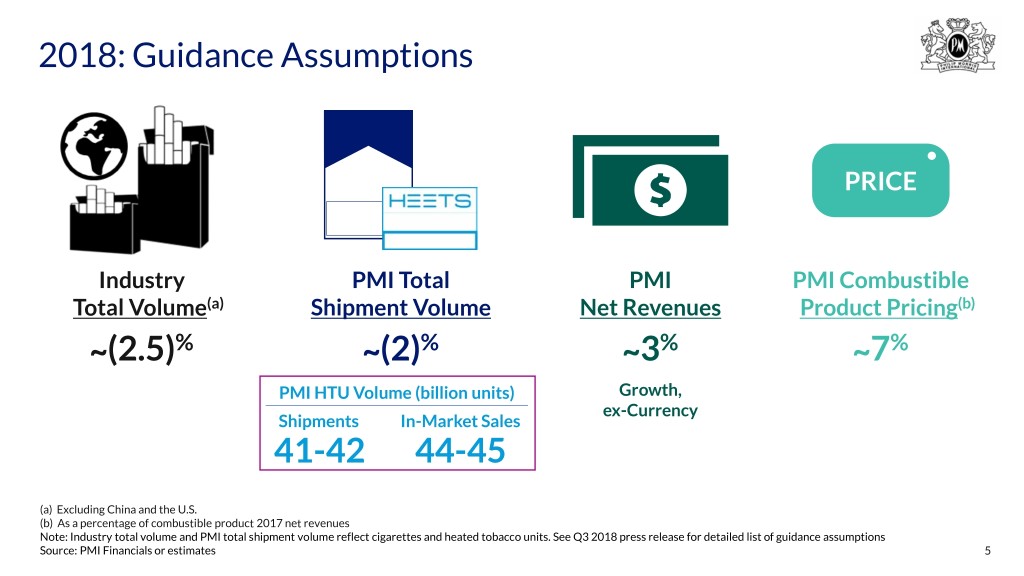
2018: Guidance Assumptions PRICE Industry PMI Total PMI PMI Combustible Total Volume(a) Shipment Volume Net Revenues Product Pricing(b) ̴ (2.5)% ̴ (2)% ̴ 3% ̴ 7% PMI HTU Volume (billion units) Growth, ex-Currency Shipments In-Market Sales 41-42 44-45 (a) Excluding China and the U.S. (b) As a percentage of combustible product 2017 net revenues Note: Industry total volume and PMI total shipment volume reflect cigarettes and heated tobacco units. See Q3 2018 press release for detailed list of guidance assumptions Source: PMI Financials or estimates 5
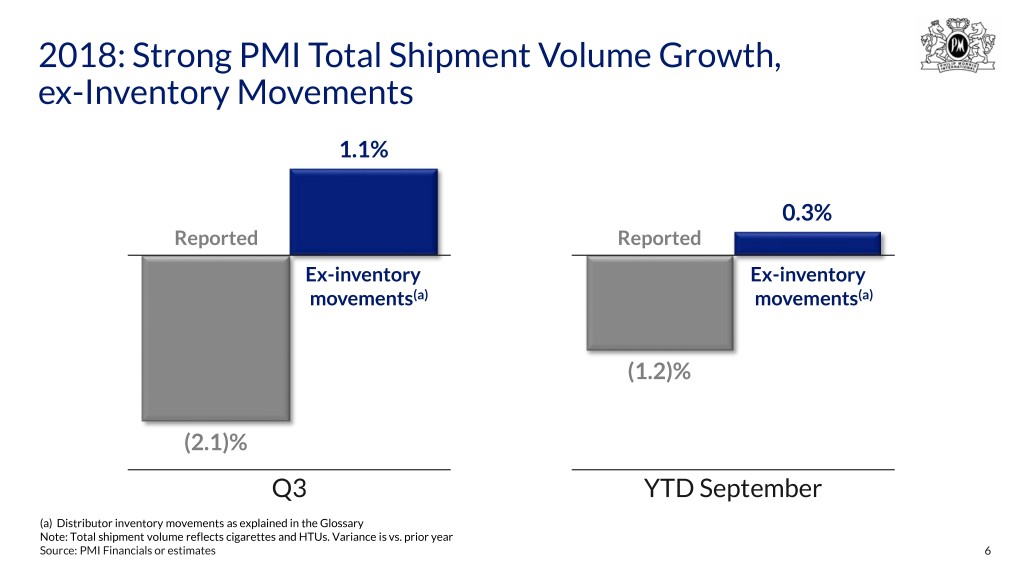
2018: Strong PMI Total Shipment Volume Growth, ex-Inventory Movements 1.1% 0.3% Reported Reported Ex-inventory Ex-inventory movements(a) movements(a) (1.2)% (2.1)% Q3 YTD September (a) Distributor inventory movements as explained in the Glossary Note: Total shipment volume reflects cigarettes and HTUs. Variance is vs. prior year Source: PMI Financials or estimates 6
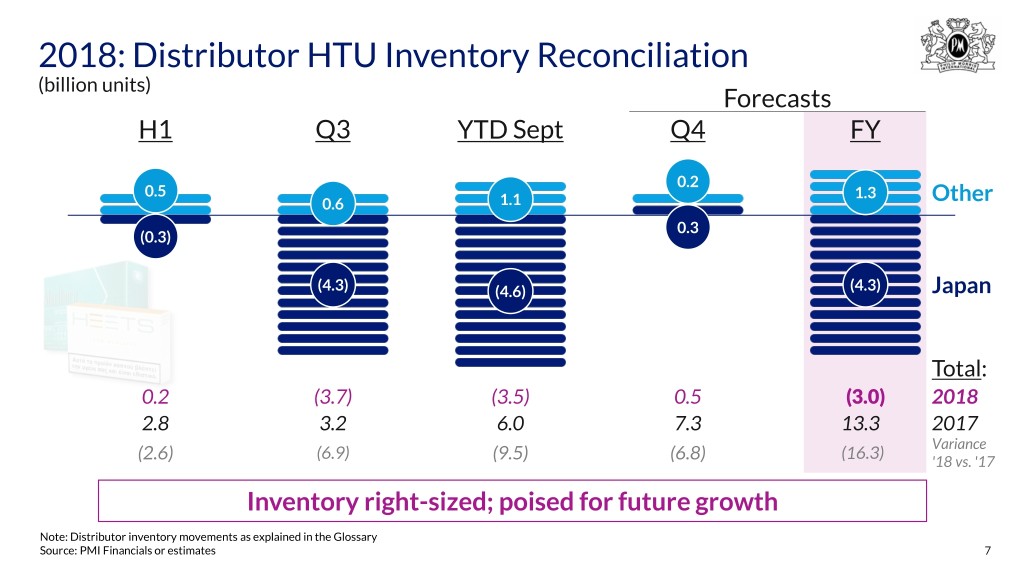
2018: Distributor HTU Inventory Reconciliation (billion units) Forecasts H1 Q3 YTD Sept Q4 FY 0.2 0.5 1.3 0.6 1.1 Other 0.3 (0.3) (4.3) (4.6) (4.3) Japan Total: 0.2 (3.7) (3.5) 0.5 (3.0) 2018 2.8 3.2 6.0 7.3 13.3 2017 Variance (6.9) (16.3) (2.6) (9.5) (6.8) '18 vs. '17 Inventory right-sized; poised for future growth Note: Distributor inventory movements as explained in the Glossary Source: PMI Financials or estimates 7
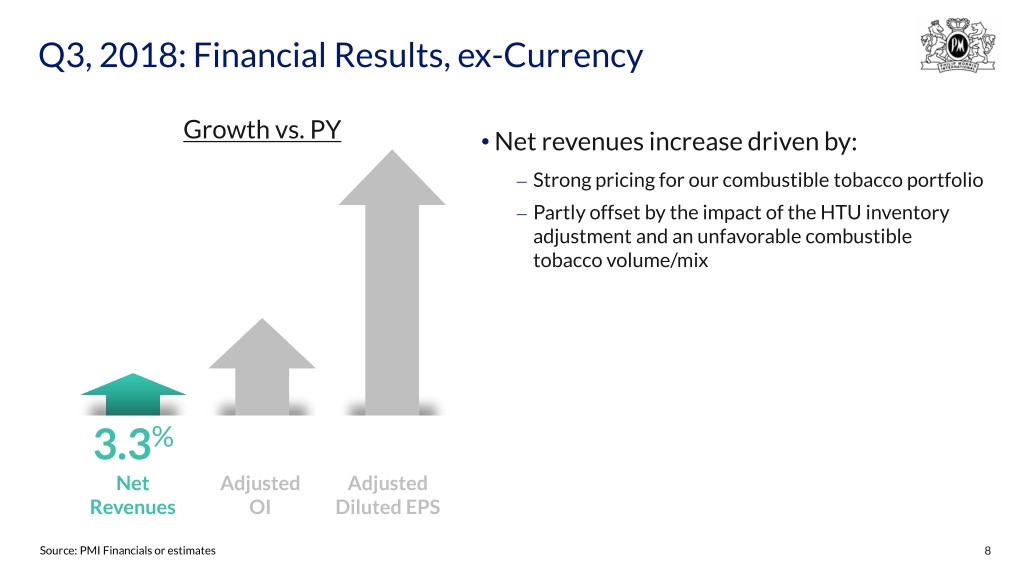
Q3, 2018: Financial Results, ex-Currency Growth vs. PY • Net revenues increase driven by: Strong pricing for our combustible tobacco portfolio Partly offset by the impact of the HTU inventory ⎼ adjustment and an unfavorable combustible ⎼ tobacco volume/mix 3.3% Net Adjusted Adjusted Revenues OI Diluted EPS Source: PMI Financials or estimates 8
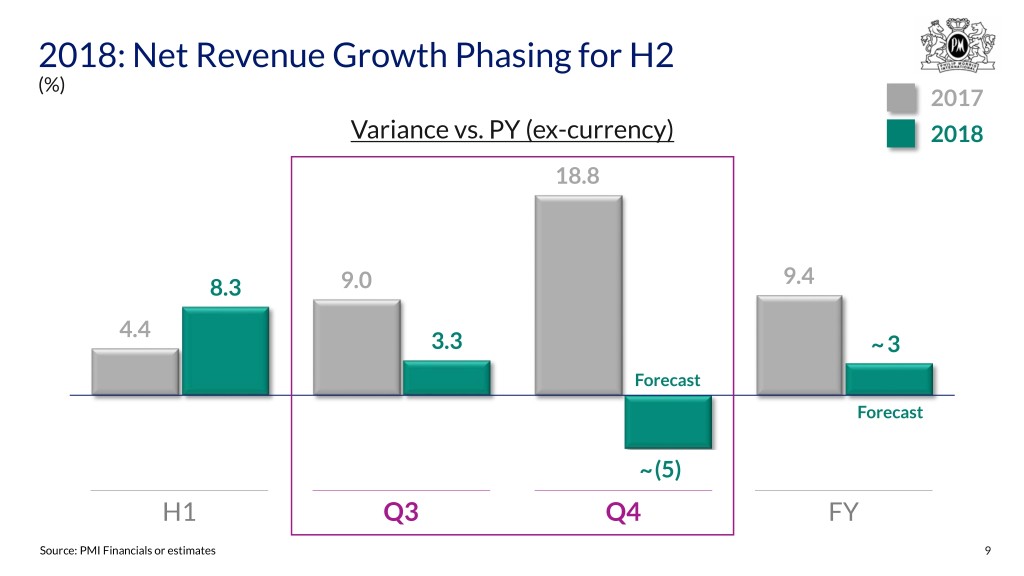
2018: Net Revenue Growth Phasing for H2 (%) 2017 Variance vs. PY (ex-currency) 2018 18.8 9.4 8.3 9.0 4.4 3.3 ̴ 3 Forecast Forecast ̴ (5) H1 Q3 Q4 FY Source: PMI Financials or estimates 9
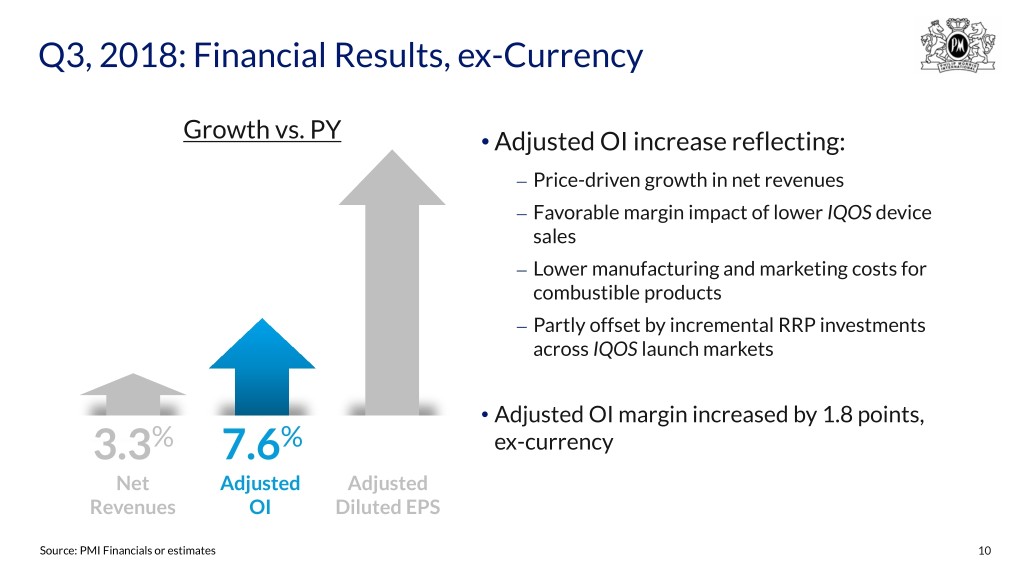
Q3, 2018: Financial Results, ex-Currency Growth vs. PY • Adjusted OI increase reflecting: Price-driven growth in net revenues Favorable margin impact of lower IQOS device ⎼ sales ⎼ Lower manufacturing and marketing costs for combustible products ⎼ Partly offset by incremental RRP investments across IQOS launch markets ⎼ • Adjusted OI margin increased by 1.8 points, 3.3% 7.6% ex-currency Net Adjusted Adjusted Revenues OI Diluted EPS Source: PMI Financials or estimates 10
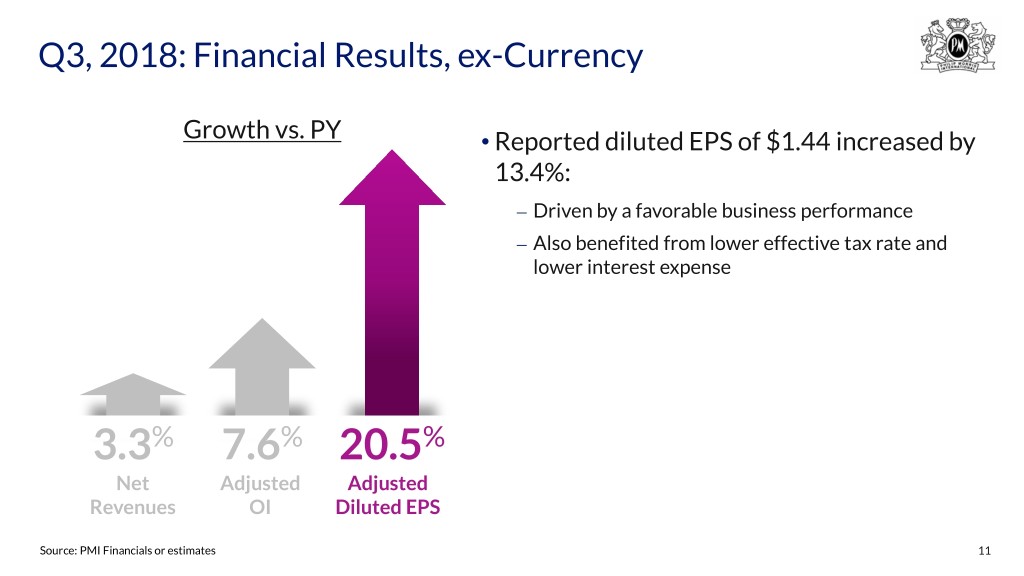
Q3, 2018: Financial Results, ex-Currency Growth vs. PY • Reported diluted EPS of $1.44 increased by 13.4%: Driven by a favorable business performance Also benefited from lower effective tax rate and ⎼ lower interest expense ⎼ 3.3% 7.6% 20.5% Net Adjusted Adjusted Revenues OI Diluted EPS Source: PMI Financials or estimates 11
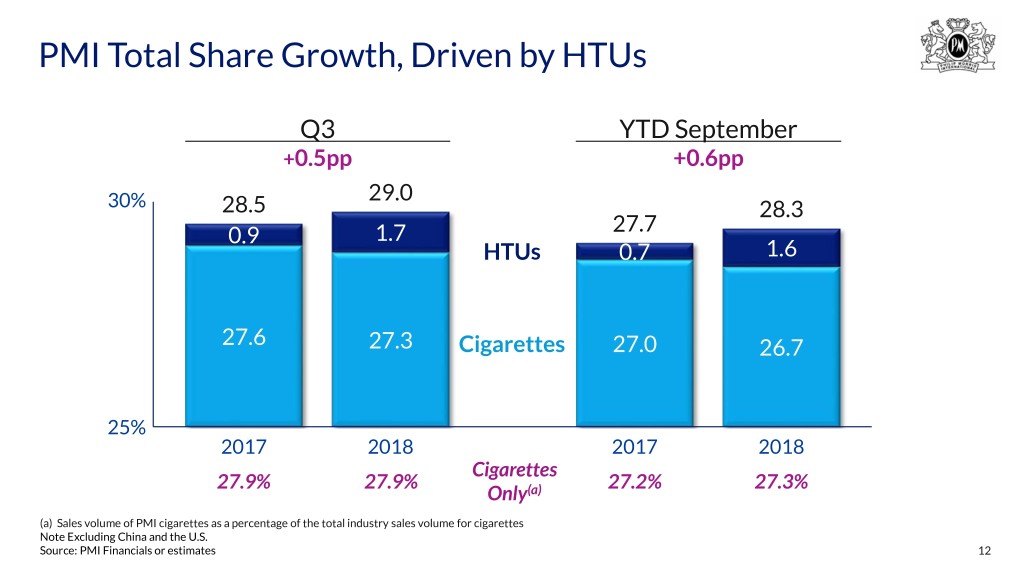
PMI Total Share Growth, Driven by HTUs Q3 YTD September +0.5pp +0.6pp 29.0 30% 28.5 28.3 27.7 0.9 1.7 HTUs 0.7 1.6 27.6 27.3 Cigarettes 27.0 26.7 25% 2017 2018 2017 2018 Cigarettes 27.9% 27.9% 27.2% 27.3% Only(a) (a) Sales volume of PMI cigarettes as a percentage of the total industry sales volume for cigarettes Note Excluding China and the U.S. Source: PMI Financials or estimates 12
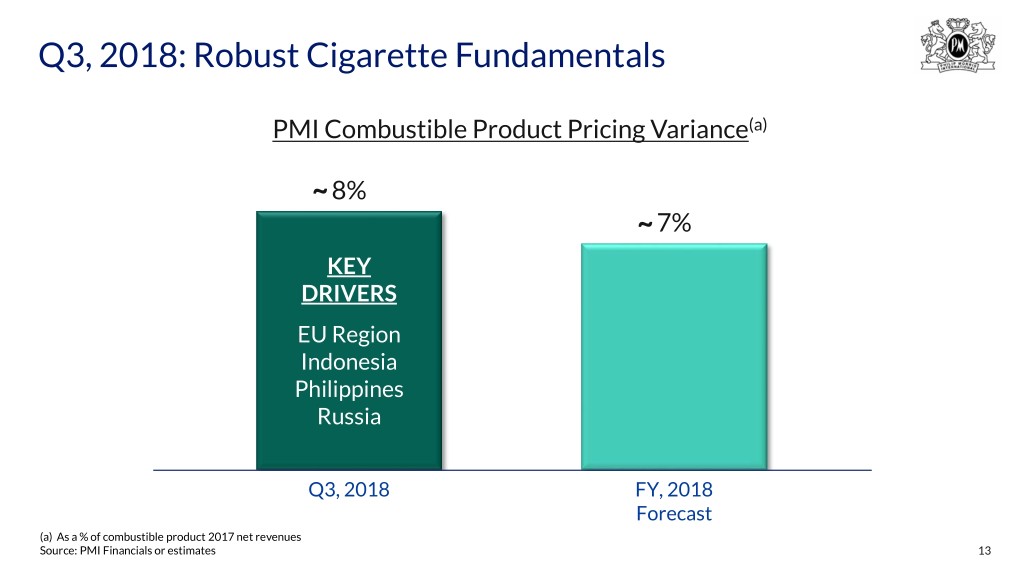
Q3, 2018: Robust Cigarette Fundamentals PMI Combustible Product Pricing Variance(a) ̴ 8% ̴ 7% KEY DRIVERS EU Region Indonesia Philippines Russia Q3, 2018 FY, 2018 Forecast (a) As a % of combustible product 2017 net revenues Source: PMI Financials or estimates 13
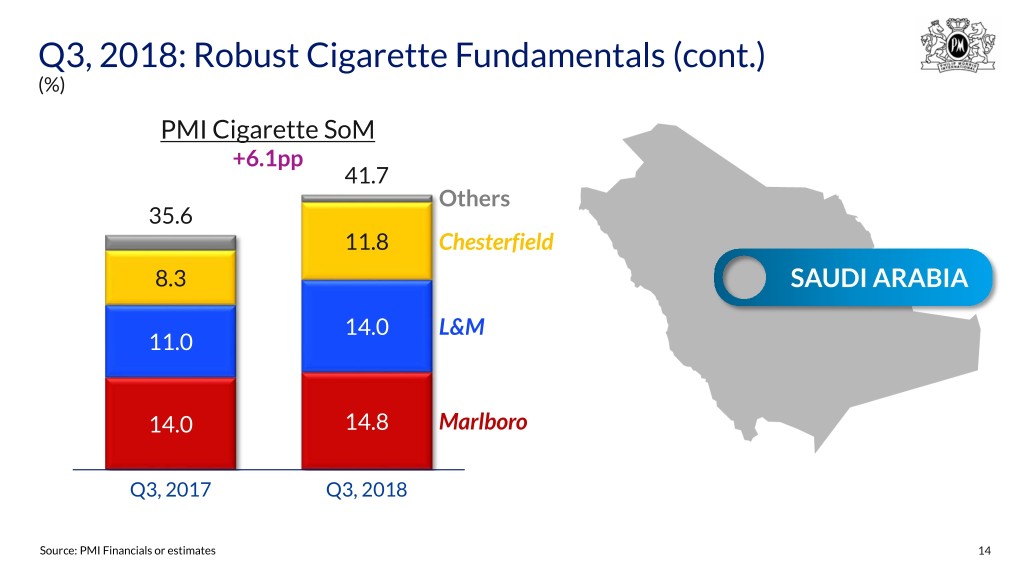
Q3, 2018: Robust Cigarette Fundamentals (cont.) (%) PMI Cigarette SoM +6.1pp 41.7 Others 35.6 11.8 Chesterfield 8.3 SAUDI ARABIA 14.0 L&M 11.0 14.0 14.8 Marlboro Q3, 2017 Q3, 2018 Source: PMI Financials or estimates 14
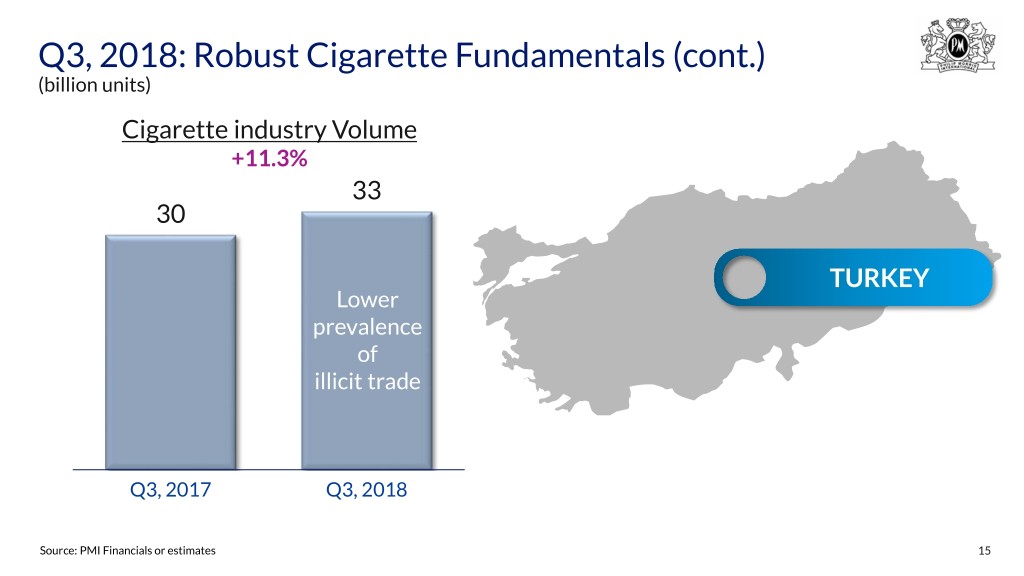
Q3, 2018: Robust Cigarette Fundamentals (cont.) (billion units) Cigarette industry Volume +11.3% 33 30 TURKEY Lower prevalence of illicit trade Q3, 2017 Q3, 2018 Source: PMI Financials or estimates 15
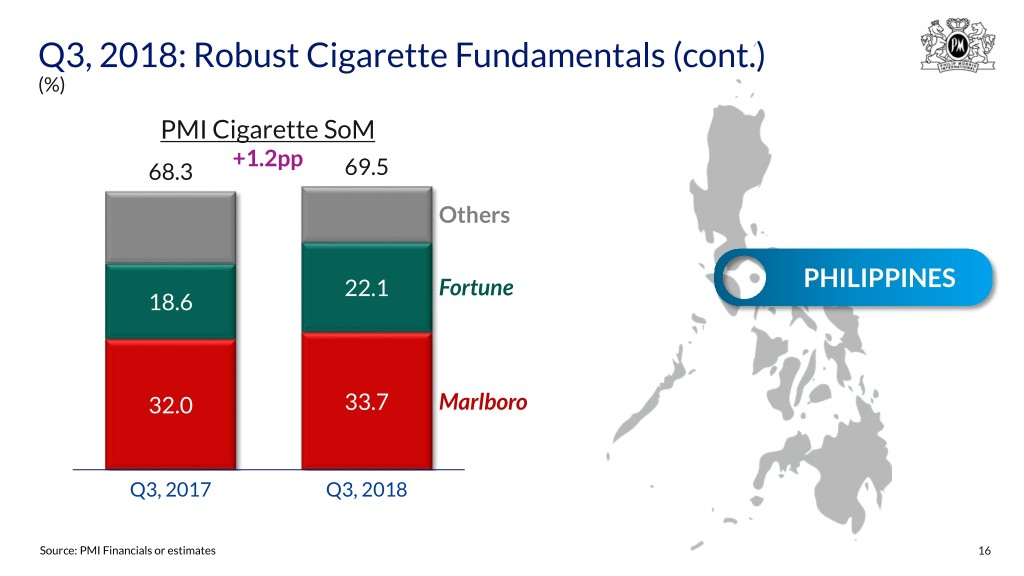
Q3, 2018: Robust Cigarette Fundamentals (cont.) (%) PMI Cigarette SoM +1.2pp 68.3 69.5 Others 22.1 Fortune PHILIPPINES 18.6 32.0 33.7 Marlboro Q3, 2017 Q3, 2018 Source: PMI Financials or estimates 16
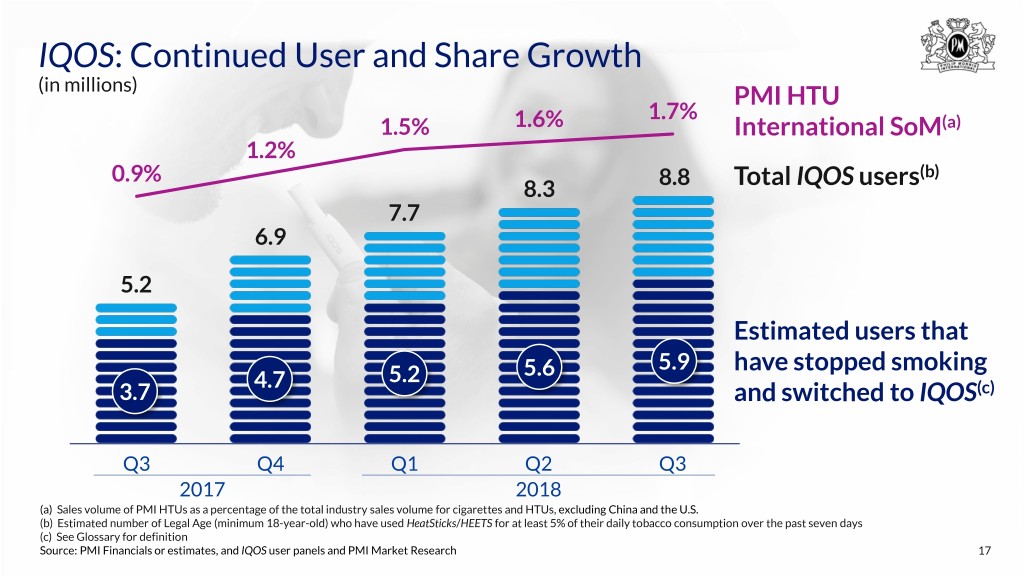
IQOS: Continued User and Share Growth (in millions) PMI HTU 1.7% 1.5% 1.6% International SoM(a) 1.2% 0.9% 8.8 Total users(b) 8.3 IQOS 7.7 6.9 5.2 Estimated users that 5.6 5.9 have stopped smoking 4.7 5.2 3.7 and switched to IQOS(c) Q3 Q4 Q1 Q2 Q3 2017 2018 (a) Sales volume of PMI HTUs as a percentage of the total industry sales volume for cigarettes and HTUs, excluding China and the U.S. (b) Estimated number of Legal Age (minimum 18-year-old) who have used HeatSticks/HEETS for at least 5% of their daily tobacco consumption over the past seven days (c) See Glossary for definition Source: PMI Financials or estimates, and IQOS user panels and PMI Market Research 17
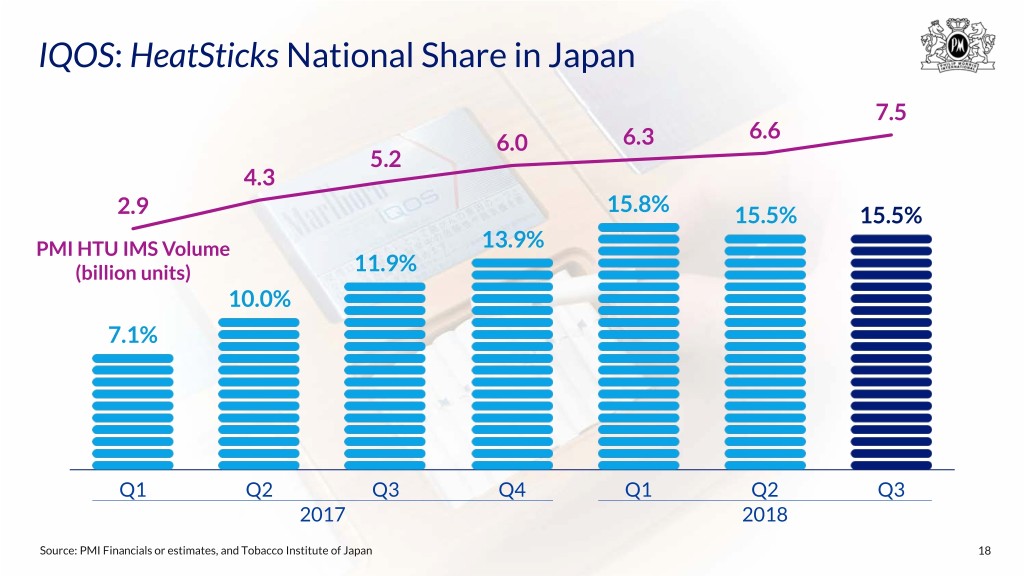
IQOS: HeatSticks National Share in Japan 7.5 6.6 6.0 6.3 5.2 4.3 2.9 15.8% 15.5% 15.5% PMI HTU IMS Volume 13.9% (billion units) 11.9% 10.0% 7.1% Q1 Q2 Q3 Q4 Q1 Q2 Q3 2017 2018 Source: PMI Financials or estimates, and Tobacco Institute of Japan 18
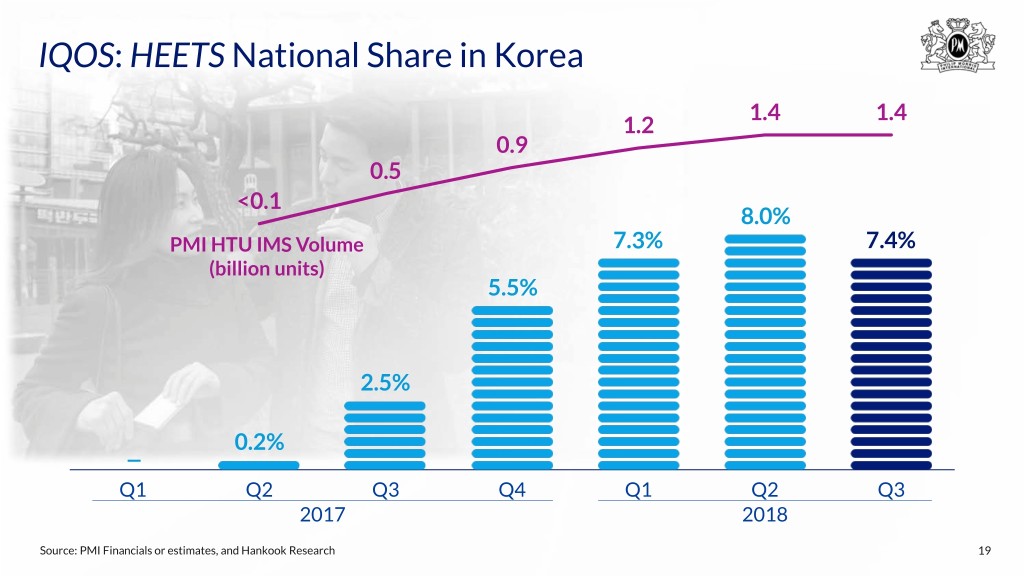
IQOS: HEETS National Share in Korea 1.4 1.4 1.2 0.9 0.5 <0.1 8.0% PMI HTU IMS Volume 7.3% 7.4% (billion units) 5.5% 2.5% 0.2% ̶ Q1 Q2 Q3 Q4 Q1 Q2 Q3 2017 2018 Source: PMI Financials or estimates, and Hankook Research 19
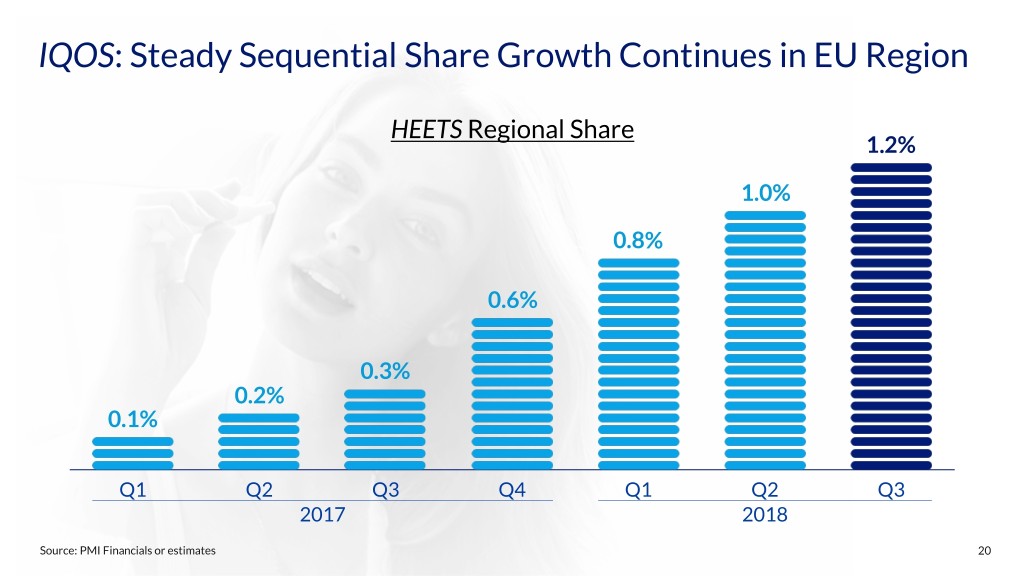
IQOS: Steady Sequential Share Growth Continues in EU Region HEETS Regional Share 1.2% 1.0% 0.8% 0.6% 0.3% 0.2% 0.1% Q1 Q2 Q3 Q4 Q1 Q2 Q3 2017 2018 Source: PMI Financials or estimates 20
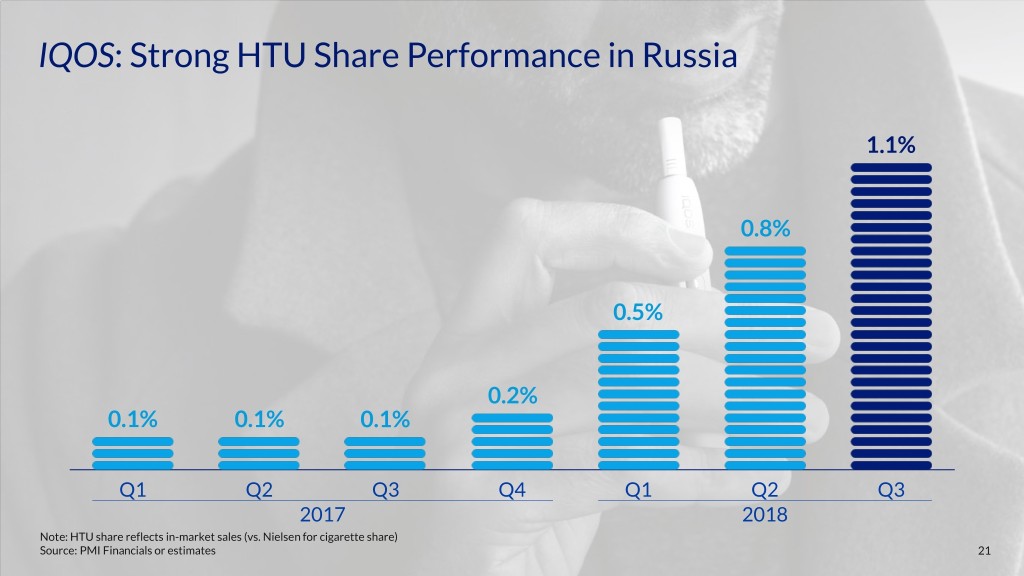
IQOS: Strong HTU Share Performance in Russia 1.1% 0.8% 0.5% 0.2% 0.1% 0.1% 0.1% Q1 Q2 Q3 Q4 Q1 Q2 Q3 2017 2018 Note: HTU share reflects in-market sales (vs. Nielsen for cigarette share) Source: PMI Financials or estimates 21
2018 Business Outlook Remains Intact • Solid Q3 results, ex-currency • 2018 business outlook remains intact, supported by: Robust fundamentals for combustible products Increasingly broad-based IQOS growth across geographies ⎼ ⎼ • Reaffirming 2018 reported diluted EPS guidance: Continues to represent a growth rate of approximately 8% to 9%, ex-currency, compared to adjusted diluted EPS of $4.72 in 2017 ⎼ Source: PMI Financials or estimates 22

2018 Third-Quarter Results Questions & Answers Have you downloaded the PMI Investor Relations App yet? iOS Download Android Download The free IR App is available to download at the Apple App Store for iOS devices and at Google Play for Android mobile devices Or go to: www.pmi.com/irapp
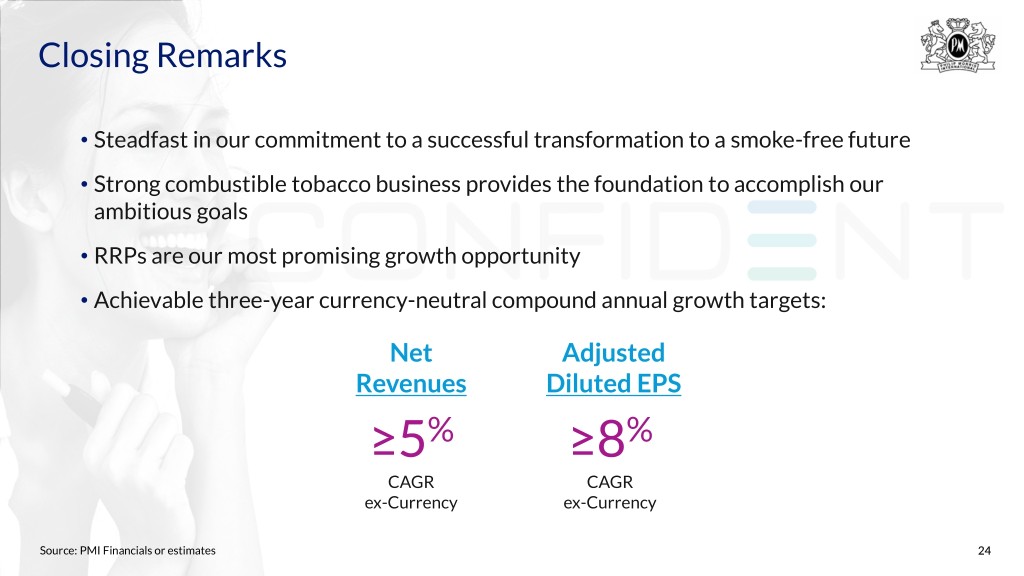
Closing Remarks • Steadfast in our commitment to a successful transformation to a smoke-free future • Strong combustible tobacco business provides the foundation to accomplish our ambitious goals • RRPs are our most promising growth opportunity • Achievable three-year currency-neutral compound annual growth targets: Net Adjusted Revenues Diluted EPS ≥5% ≥8% CAGR CAGR ex-Currency ex-Currency Source: PMI Financials or estimates 24

2018 Third-Quarter Results October 18, 2018
Appendix, Glossary of Key Terms and Definitions, and Reconciliation of Non-GAAP Measures 26
Glossary: General Terms • "PMI" refers to Philip Morris International Inc. and its subsidiaries • Until March 28, 2008, PMI was a wholly owned subsidiary of Altria Group, Inc. ("Altria"). Since that time the company has been independent and is listed on the New York Stock Exchange (ticker symbol "PM") • Trademarks are italicized • Comparisons are made to the same prior-year period unless otherwise stated • Unless otherwise stated, references to total industry, total market, PMI shipment volume and PMI market share performance reflect cigarettes and heated tobacco units • References to total international market, defined as worldwide cigarette and heated tobacco unit volume excluding the United States, total industry, total market and market shares are PMI estimates for tax-paid products based on the latest available data from a number of internal and external sources and may, in defined instances, exclude the People's Republic of China and/or PMI's duty free business • "OTP" is defined as "other tobacco products," primarily roll-your-own and make-your-own cigarettes, pipe tobacco, cigars and cigarillos, and does not include reduced-risk products • "Combustible products" is the term PMI uses to refer to cigarettes and OTP, combined • In-market sales, or "IMS," is defined as sales to the retail channel, depending on the market and distribution model • "PMI volume" is defined as the combined total of cigarette shipment volume and heated tobacco unit shipment volume • Effective January 1, 2018, PMI began managing its business in six reporting segments as follows: the European Union Region (EU); the Eastern Europe Region (EE); the Middle East & Africa Region (ME&A), which includes PMI Duty Free; the South & Southeast Asia Region (S&SA); the East Asia & Australia Region (EA&A); and the Latin America & Canada Region (LA&C) • "SoM" stands for share of market 27
Glossary: General Terms (cont.) • From time to time, PMI’s shipment volumes are subject to the impact of distributor inventory movements, and estimated total industry/market volumes are subject to the impact of inventory movements in various trade channels that include estimated trade inventory movements of PMI’s competitors arising from market-specific factors that significantly distort reported volume disclosures. Such factors may include changes to the manufacturing supply chain, shipment methods, consumer demand, timing of excise tax increases or other influences that may affect the timing of sales to customers. In such instances, in addition to reviewing PMI shipment volumes and certain estimated total industry/market volumes on a reported basis, management reviews these measures on an adjusted basis that excludes the impact of distributor and/or estimated trade inventory movements. Management also believes that disclosing PMI shipment volumes and estimated total industry/market volumes in such circumstances on a basis that excludes the impact of distributor and/or estimated trade inventory movements improves the comparability of performance and trends for these measures over different reporting periods 28
Glossary: Financial Terms • Net revenues related to combustible products refer to the operating revenues generated from the sale of these products, including shipping and handling charges billed to customers, net of sales and promotion incentives, and excise taxes. PMI recognizes revenue when control is transferred to the customer, typically either upon shipment or delivery of goods • Net revenues related to RRPs represent the sale of heated tobacco units, IQOS devices and related accessories, and other nicotine-containing products, primarily e-vapor products, including shipping and handling charges billed to customers, net of sales and promotion incentives, and excise taxes. PMI recognizes revenue when control is transferred to the customer, typically either upon shipment or delivery of goods • PMI has adopted Accounting Standard Update ASU 2014-09 "Revenue from Contracts with Customers" as of January 1, 2018 on a retrospective basis. PMI made an accounting policy election to exclude excise taxes collected from customers from the measurement of the transaction price, thereby presenting revenues, net of excise taxes in all periods. The underlying principles of the new standard, relating to the measurement of revenue and the timing of recognition, are closely aligned with PMI's current business model and practices • PMI adopted Accounting Standard Update ASU 2017-07 "Compensation - Retirement Benefits" as of January 1, 2018 on a retrospective basis. Previously, total pension and other employee benefit costs were included in operating income. Beginning January 1, 2018, only the service cost component is required to be shown in operating income, while all other cost components are presented in a new line item "pension and other employee benefit costs" below operating income • Prior to 2018, management evaluated business segment performance, and allocated resources, based on operating companies income, or "OCI." Effective January 1, 2018, management began evaluating business segment performance, and allocating resources, based on operating income, or "OI" • "Adjusted OI margin" is calculated as adjusted OI, divided by net revenues 29
Glossary: Financial Terms (cont.) • Management reviews net revenues, OI, OI margins, operating cash flow and earnings per share, or "EPS," on an adjusted basis, which may exclude the impact of currency and other items such as acquisitions, asset impairment and exit costs, tax items and other special items 30
Glossary: Reduced-Risk Products • "Reduced-risk products," or "RRPs," is the term PMI uses to refer to products that present, are likely to present, or have the potential to present less risk of harm to smokers who switch to these products versus continued smoking. PMI has a range of RRPs in various stages of development, scientific assessment and commercialization. Because PMI's RRPs do not burn tobacco, they produce an aerosol that contains far lower quantities of harmful and potentially harmful constituents than found in cigarette smoke • "Aerosol" refers to a gaseous suspension of fine solid particles and/or liquid droplets • "Combustion" is the process of burning a substance in oxygen, producing heat and often light • "Smoke" is a visible suspension of solid particles, liquid droplets and gases in air, emitted when a material burns • The "IQOS" heat-not-burn device is a precisely controlled heating device into which a specially designed and proprietary tobacco unit is inserted and heated to generate an aerosol • "Heated tobacco product," or "HTP," is a manufactured tobacco product that delivers a nicotine containing vapor (aerosol), without combustion of the tobacco mixture • "Heated tobacco units," or "HTUs," is the term PMI uses to refer to heated tobacco consumables, which include the company's HEETS, HEETS Marlboro and HEETS FROM MARLBORO, defined collectively as HEETS, as well as Marlboro HeatSticks and Parliament HeatSticks • Heated tobacco unit "offtake volume" represents the estimated retail offtake of heated tobacco units based on a selection of sales channels that vary by market, but notably include retail points of sale and e-commerce platforms • Heated tobacco unit "offtake share" represents the estimated retail offtake volume of heated tobacco units divided by the sum of estimated total offtake volume for cigarettes, heated tobacco units and, where the data is available, other RRPs • National market share for heated tobacco units is defined as the total sales volume for heated tobacco units as a percentage of the total estimated sales volume for cigarettes and heated tobacco units 31
Glossary: Reduced-Risk Products (cont.) • "Converted IQOS Users" means the estimated number of Legal Age (minimum 18-year-old) IQOS users that used HeatSticks /HEETS heated tobacco units for over 95% of their daily tobacco consumption over the past seven days • "Predominant IQOS Users" means the estimated number of Legal Age (minimum 18-year-old) IQOS users that used HeatSticks /HEETS heated tobacco units for between 70% and 95% of their daily tobacco consumption over the past seven days • New PMI methodology as of 2018 for estimating the number of people who have stopped smoking and made the change to IQOS: for markets where IQOS is the only heated tobacco product, daily individual consumption of PMI heated tobacco units represents the totality of their daily tobacco consumption in the past seven days. For markets where IQOS is one among other heated tobacco products, daily individual consumption of heated tobacco units represents the totality of their daily tobacco consumption in the past seven days, of which at least 70% are PMI heated tobacco units • "Situational IQOS Users" means the estimated number of Legal Age (minimum 18-year-old) IQOS users that used HeatSticks /HEETS heated tobacco units for between 5% and less than 70% of their daily tobacco consumption over the past seven days • "Abandoned IQOS Users" means the estimated number of Legal Age (minimum 18-year-old) IQOS users that used HeatSticks /HEETS heated tobacco units for less than 5% of their daily tobacco consumption over the past seven days 32
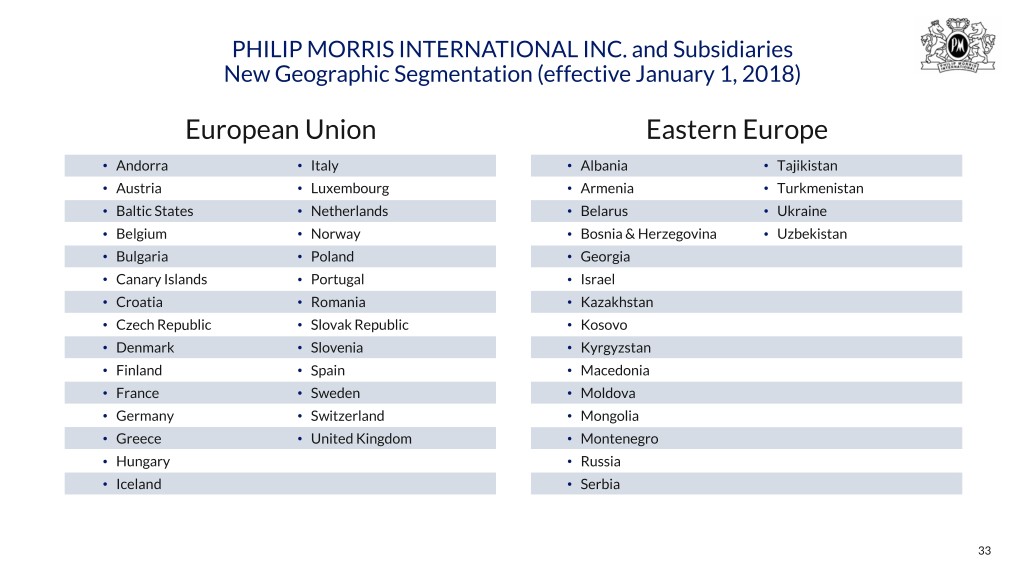
PHILIP MORRIS INTERNATIONAL INC. and Subsidiaries New Geographic Segmentation (effective January 1, 2018) European Union Eastern Europe • Andorra • Italy • Albania • Tajikistan • Austria • Luxembourg • Armenia • Turkmenistan • Baltic States • Netherlands • Belarus • Ukraine • Belgium • Norway • Bosnia & Herzegovina • Uzbekistan • Bulgaria • Poland • Georgia • Canary Islands • Portugal • Israel • Croatia • Romania • Kazakhstan • Czech Republic • Slovak Republic • Kosovo • Denmark • Slovenia • Kyrgyzstan • Finland • Spain • Macedonia • France • Sweden • Moldova • Germany • Switzerland • Mongolia • Greece • United Kingdom • Montenegro • Hungary • Russia • Iceland • Serbia 33
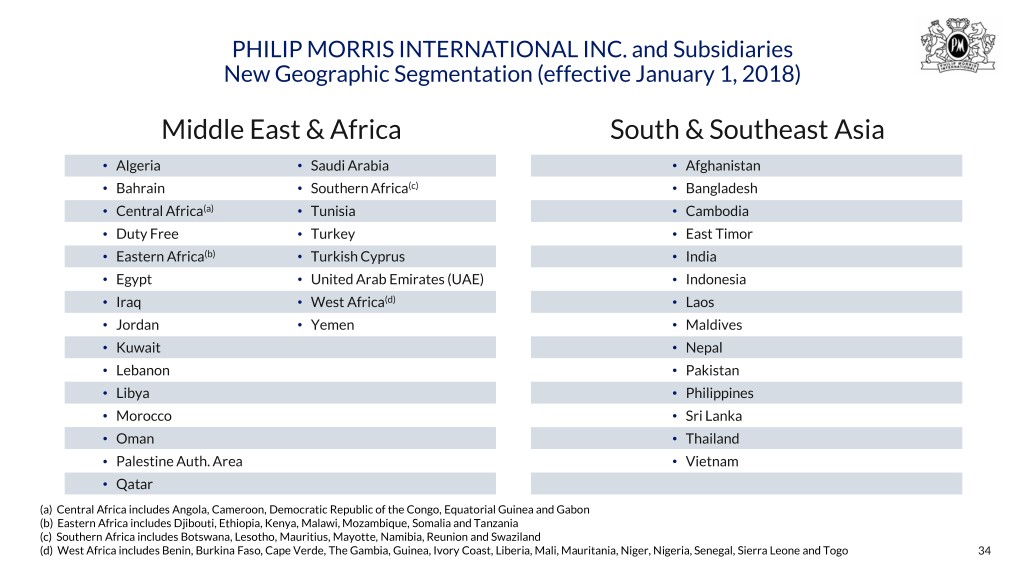
PHILIP MORRIS INTERNATIONAL INC. and Subsidiaries New Geographic Segmentation (effective January 1, 2018) Middle East & Africa South & Southeast Asia • Algeria • Saudi Arabia • Afghanistan • Bahrain • Southern Africa(c) • Bangladesh • Central Africa(a) • Tunisia • Cambodia • Duty Free • Turkey • East Timor • Eastern Africa(b) • Turkish Cyprus • India • Egypt • United Arab Emirates (UAE) • Indonesia • Iraq • West Africa(d) • Laos • Jordan • Yemen • Maldives • Kuwait • Nepal • Lebanon • Pakistan • Libya • Philippines • Morocco • Sri Lanka • Oman • Thailand • Palestine Auth. Area • Vietnam • Qatar (a) Central Africa includes Angola, Cameroon, Democratic Republic of the Congo, Equatorial Guinea and Gabon (b) Eastern Africa includes Djibouti, Ethiopia, Kenya, Malawi, Mozambique, Somalia and Tanzania (c) Southern Africa includes Botswana, Lesotho, Mauritius, Mayotte, Namibia, Reunion and Swaziland (d) West Africa includes Benin, Burkina Faso, Cape Verde, The Gambia, Guinea, Ivory Coast, Liberia, Mali, Mauritania, Niger, Nigeria, Senegal, Sierra Leone and Togo 34
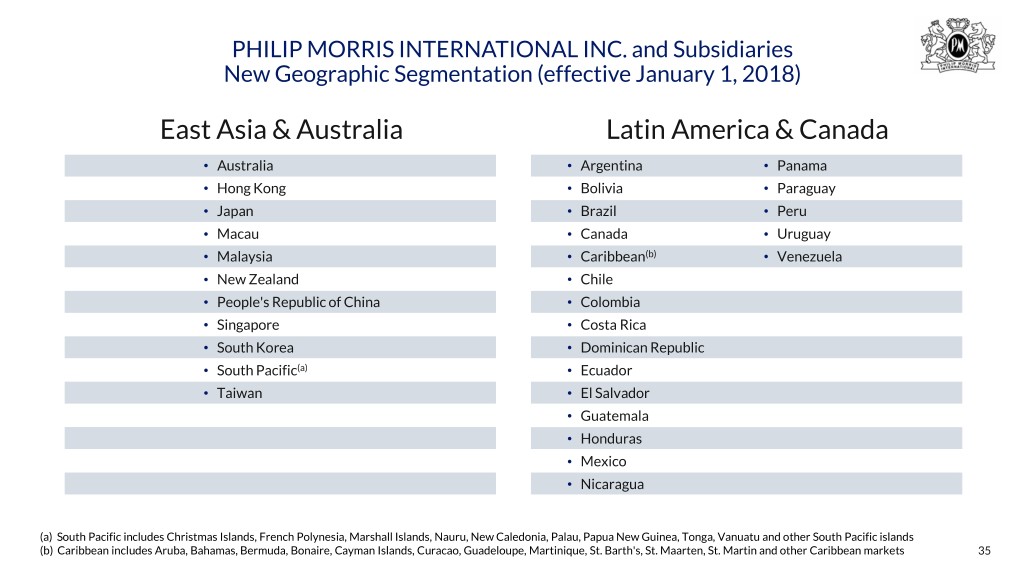
PHILIP MORRIS INTERNATIONAL INC. and Subsidiaries New Geographic Segmentation (effective January 1, 2018) East Asia & Australia Latin America & Canada • Australia • Argentina • Panama • Hong Kong • Bolivia • Paraguay • Japan • Brazil • Peru • Macau • Canada • Uruguay • Malaysia • Caribbean(b) • Venezuela • New Zealand • Chile • People's Republic of China • Colombia • Singapore • Costa Rica • South Korea • Dominican Republic • South Pacific(a) • Ecuador • Taiwan • El Salvador • Guatemala • Honduras • Mexico • Nicaragua (a) South Pacific includes Christmas Islands, French Polynesia, Marshall Islands, Nauru, New Caledonia, Palau, Papua New Guinea, Tonga, Vanuatu and other South Pacific islands (b) Caribbean includes Aruba, Bahamas, Bermuda, Bonaire, Cayman Islands, Curacao, Guadeloupe, Martinique, St. Barth's, St. Maarten, St. Martin and other Caribbean markets 35
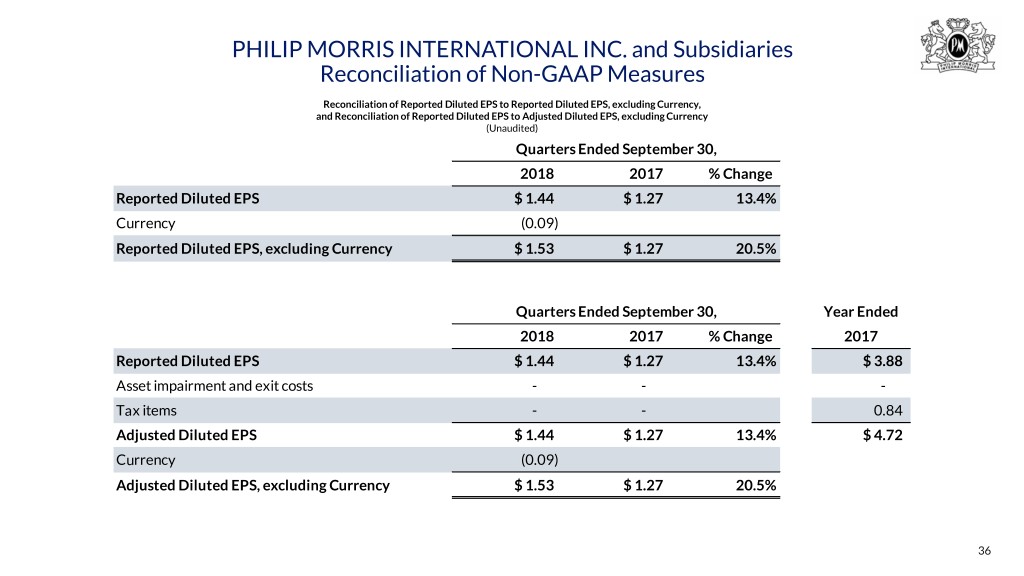
PHILIP MORRIS INTERNATIONAL INC. and Subsidiaries Reconciliation of Non-GAAP Measures Reconciliation of Reported Diluted EPS to Reported Diluted EPS, excluding Currency, and Reconciliation of Reported Diluted EPS to Adjusted Diluted EPS, excluding Currency (Unaudited) Quarters Ended September 30, 2018 2017 % Change Reported Diluted EPS $ 1.44 $ 1.27 13.4% Currency (0.09) Reported Diluted EPS, excluding Currency $ 1.53 $ 1.27 20.5% Quarters Ended September 30, Year Ended 2018 2017 % Change 2017 Reported Diluted EPS $ 1.44 $ 1.27 13.4% $ 3.88 Asset impairment and exit costs - - - Tax items - - 0.84 Adjusted Diluted EPS $ 1.44 $ 1.27 13.4% $ 4.72 Currency (0.09) Adjusted Diluted EPS, excluding Currency $ 1.53 $ 1.27 20.5% 36
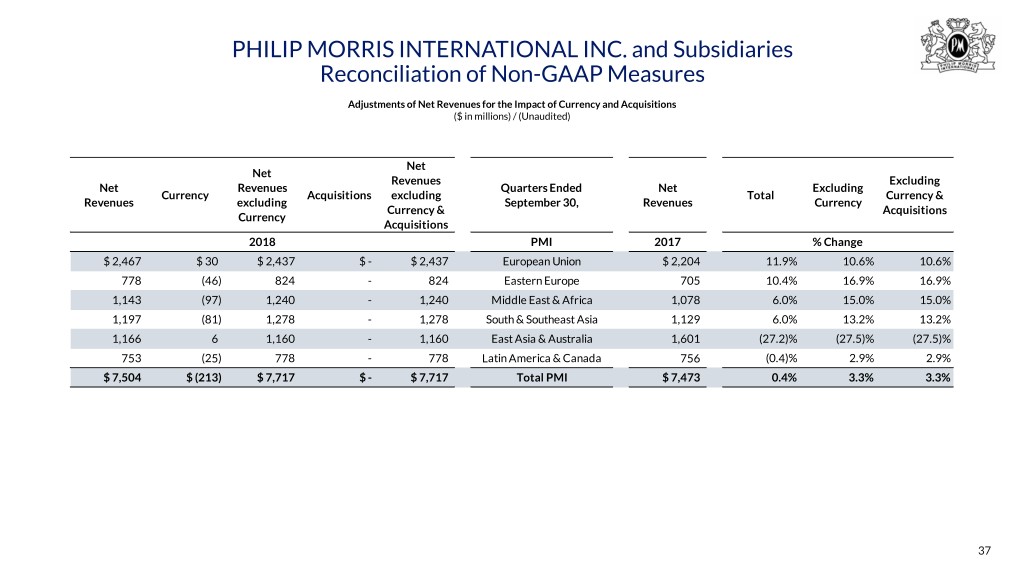
PHILIP MORRIS INTERNATIONAL INC. and Subsidiaries Reconciliation of Non-GAAP Measures Adjustments of Net Revenues for the Impact of Currency and Acquisitions ($ in millions) / (Unaudited) Net Net Revenues Excluding Net Revenues Quarters Ended Net Excluding Currency Acquisitions excluding Total Currency & Revenues excluding September 30, Revenues Currency Currency & Acquisitions Currency Acquisitions 2018 PMI 2017 % Change $ 2,467 $ 30 $ 2,437 $ - $ 2,437 European Union $ 2,204 11.9% 10.6% 10.6% 778 (46) 824 - 824 Eastern Europe 705 10.4% 16.9% 16.9% 1,143 (97) 1,240 - 1,240 Middle East & Africa 1,078 6.0% 15.0% 15.0% 1,197 (81) 1,278 - 1,278 South & Southeast Asia 1,129 6.0% 13.2% 13.2% 1,166 6 1,160 - 1,160 East Asia & Australia 1,601 (27.2)% (27.5)% (27.5)% 753 (25) 778 - 778 Latin America & Canada 756 (0.4)% 2.9% 2.9% $ 7,504 $ (213) $ 7,717 $ - $ 7,717 Total PMI $ 7,473 0.4% 3.3% 3.3% 37
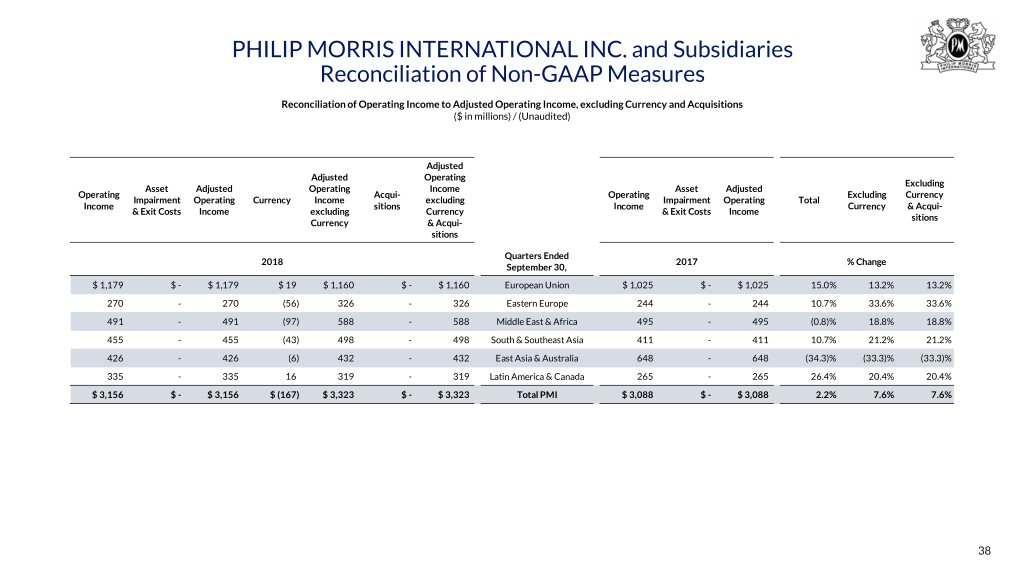
PHILIP MORRIS INTERNATIONAL INC. and Subsidiaries Reconciliation of Non-GAAP Measures Reconciliation of Operating Income to Adjusted Operating Income, excluding Currency and Acquisitions ($ in millions) / (Unaudited) Adjusted Adjusted Operating Excluding Asset Adjusted Operating Income Asset Adjusted Operating Acqui- Operating Excluding Currency Impairment Operating Currency Income excluding Impairment Operating Total Income sitions Income Currency & Acqui- & Exit Costs Income excluding Currency & Exit Costs Income sitions Currency & Acqui- sitions Quarters Ended 2018 2017 % Change September 30, $ 1,179 $ - $ 1,179 $ 19 $ 1,160 $ - $ 1,160 European Union $ 1,025 $ - $ 1,025 15.0% 13.2% 13.2% 270 - 270 (56) 326 - 326 Eastern Europe 244 - 244 10.7% 33.6% 33.6% 491 - 491 (97) 588 - 588 Middle East & Africa 495 - 495 (0.8)% 18.8% 18.8% 455 - 455 (43) 498 - 498 South & Southeast Asia 411 - 411 10.7% 21.2% 21.2% 426 - 426 (6) 432 - 432 East Asia & Australia 648 - 648 (34.3)% (33.3)% (33.3)% 335 - 335 16 319 - 319 Latin America & Canada 265 - 265 26.4% 20.4% 20.4% $ 3,156 $ - $ 3,156 $ (167) $ 3,323 $ - $ 3,323 Total PMI $ 3,088 $ - $ 3,088 2.2% 7.6% 7.6% 38
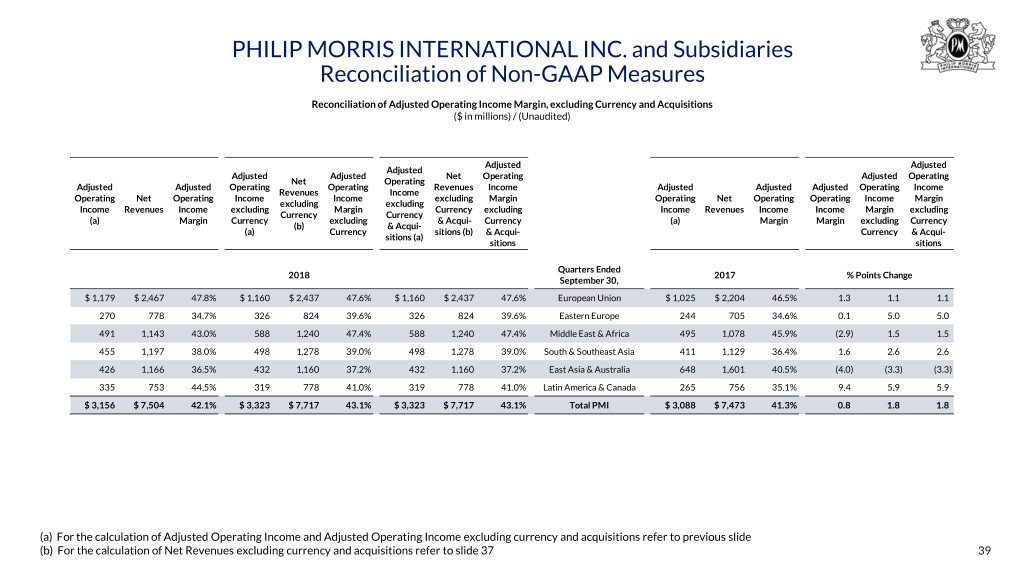
PHILIP MORRIS INTERNATIONAL INC. and Subsidiaries Reconciliation of Non-GAAP Measures Reconciliation of Adjusted Operating Income Margin, excluding Currency and Acquisitions ($ in millions) / (Unaudited) Adjusted Adjusted Adjusted Adjusted Adjusted Net Operating Adjusted Operating Net Operating Adjusted Adjusted Operating Operating Revenues Income Adjusted Adjusted Adjusted Operating Income Revenues Income Operating Net Operating Income Income excluding Margin Operating Net Operating Operating Income Margin excluding excluding Income Revenues Income excluding Margin Currency excluding Income Revenues Income Income Margin excluding Currency Currency (a) Margin Currency excluding & Acqui- Currency (a) Margin Margin excluding Currency (b) & Acqui- (a) Currency sitions (b) & Acqui- Currency & Acqui- sitions (a) sitions sitions Quarters Ended 2018 2017 % Points Change September 30, $ 1,179 $ 2,467 47.8% $ 1,160 $ 2,437 47.6% $ 1,160 $ 2,437 47.6% European Union $ 1,025 $ 2,204 46.5% 1.3 1.1 1.1 270 778 34.7% 326 824 39.6% 326 824 39.6% Eastern Europe 244 705 34.6% 0.1 5.0 5.0 491 1,143 43.0% 588 1,240 47.4% 588 1,240 47.4% Middle East & Africa 495 1,078 45.9% (2.9) 1.5 1.5 455 1,197 38.0% 498 1,278 39.0% 498 1,278 39.0% South & Southeast Asia 411 1,129 36.4% 1.6 2.6 2.6 426 1,166 36.5% 432 1,160 37.2% 432 1,160 37.2% East Asia & Australia 648 1,601 40.5% (4.0) (3.3) (3.3) 335 753 44.5% 319 778 41.0% 319 778 41.0% Latin America & Canada 265 756 35.1% 9.4 5.9 5.9 $ 3,156 $ 7,504 42.1% $ 3,323 $ 7,717 43.1% $ 3,323 $ 7,717 43.1% Total PMI $ 3,088 $ 7,473 41.3% 0.8 1.8 1.8 (a) For the calculation of Adjusted Operating Income and Adjusted Operating Income excluding currency and acquisitions refer to previous slide (b) For the calculation of Net Revenues excluding currency and acquisitions refer to slide 37 39
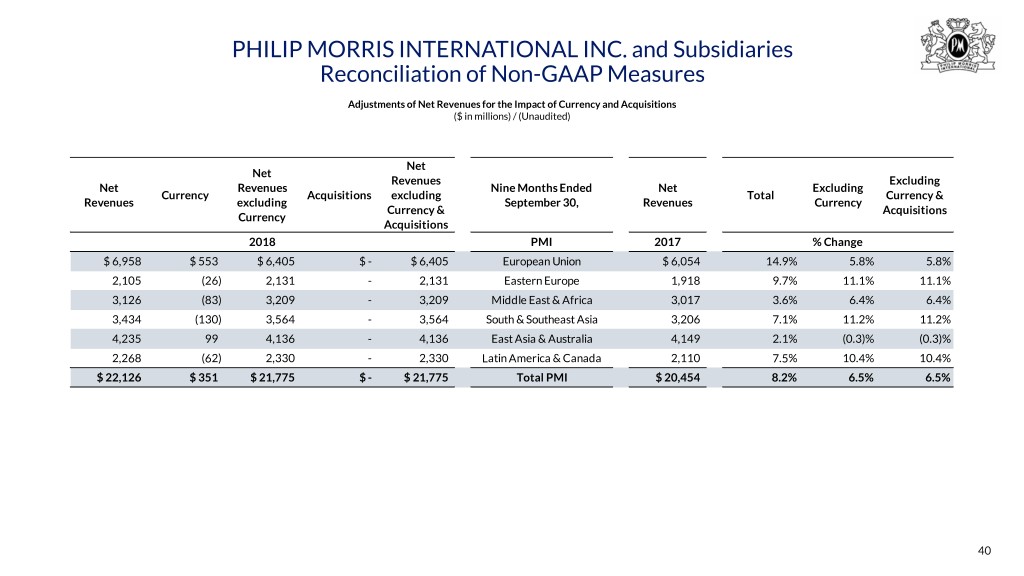
PHILIP MORRIS INTERNATIONAL INC. and Subsidiaries Reconciliation of Non-GAAP Measures Adjustments of Net Revenues for the Impact of Currency and Acquisitions ($ in millions) / (Unaudited) Net Net Revenues Excluding Net Revenues Nine Months Ended Net Excluding Currency Acquisitions excluding Total Currency & Revenues excluding September 30, Revenues Currency Currency & Acquisitions Currency Acquisitions 2018 PMI 2017 % Change $ 6,958 $ 553 $ 6,405 $ - $ 6,405 European Union $ 6,054 14.9% 5.8% 5.8% 2,105 (26) 2,131 - 2,131 Eastern Europe 1,918 9.7% 11.1% 11.1% 3,126 (83) 3,209 - 3,209 Middle East & Africa 3,017 3.6% 6.4% 6.4% 3,434 (130) 3,564 - 3,564 South & Southeast Asia 3,206 7.1% 11.2% 11.2% 4,235 99 4,136 - 4,136 East Asia & Australia 4,149 2.1% (0.3)% (0.3)% 2,268 (62) 2,330 - 2,330 Latin America & Canada 2,110 7.5% 10.4% 10.4% $ 22,126 $ 351 $ 21,775 $ - $ 21,775 Total PMI $ 20,454 8.2% 6.5% 6.5% 40
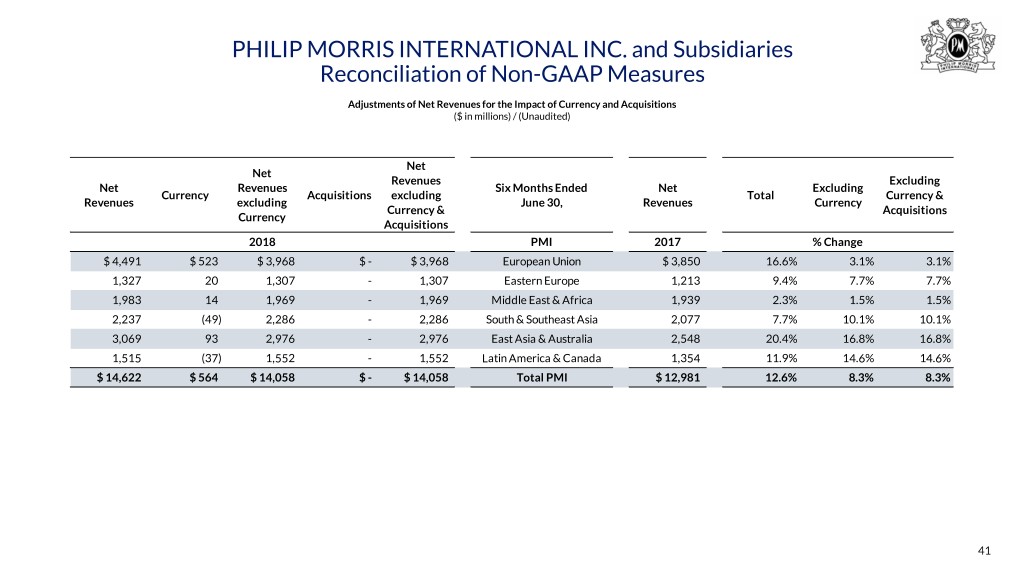
PHILIP MORRIS INTERNATIONAL INC. and Subsidiaries Reconciliation of Non-GAAP Measures Adjustments of Net Revenues for the Impact of Currency and Acquisitions ($ in millions) / (Unaudited) Net Net Revenues Excluding Net Revenues Six Months Ended Net Excluding Currency Acquisitions excluding Total Currency & Revenues excluding June 30, Revenues Currency Currency & Acquisitions Currency Acquisitions 2018 PMI 2017 % Change $ 4,491 $ 523 $ 3,968 $ - $ 3,968 European Union $ 3,850 16.6% 3.1% 3.1% 1,327 20 1,307 - 1,307 Eastern Europe 1,213 9.4% 7.7% 7.7% 1,983 14 1,969 - 1,969 Middle East & Africa 1,939 2.3% 1.5% 1.5% 2,237 (49) 2,286 - 2,286 South & Southeast Asia 2,077 7.7% 10.1% 10.1% 3,069 93 2,976 - 2,976 East Asia & Australia 2,548 20.4% 16.8% 16.8% 1,515 (37) 1,552 - 1,552 Latin America & Canada 1,354 11.9% 14.6% 14.6% $ 14,622 $ 564 $ 14,058 $ - $ 14,058 Total PMI $ 12,981 12.6% 8.3% 8.3% 41
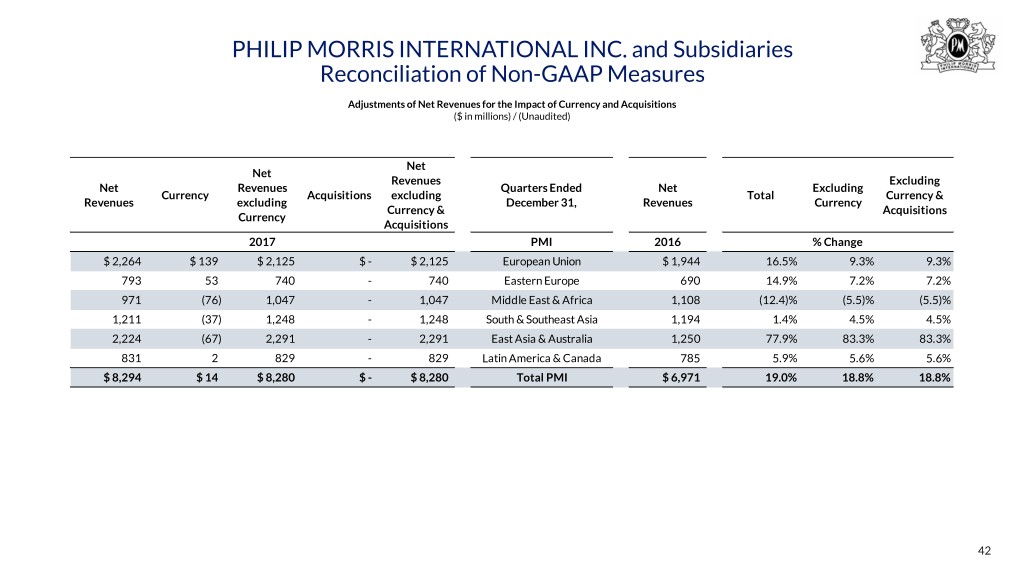
PHILIP MORRIS INTERNATIONAL INC. and Subsidiaries Reconciliation of Non-GAAP Measures Adjustments of Net Revenues for the Impact of Currency and Acquisitions ($ in millions) / (Unaudited) Net Net Revenues Excluding Net Revenues Quarters Ended Net Excluding Currency Acquisitions excluding Total Currency & Revenues excluding December 31, Revenues Currency Currency & Acquisitions Currency Acquisitions 2017 PMI 2016 % Change $ 2,264 $ 139 $ 2,125 $ - $ 2,125 European Union $ 1,944 16.5% 9.3% 9.3% 793 53 740 - 740 Eastern Europe 690 14.9% 7.2% 7.2% 971 (76) 1,047 - 1,047 Middle East & Africa 1,108 (12.4)% (5.5)% (5.5)% 1,211 (37) 1,248 - 1,248 South & Southeast Asia 1,194 1.4% 4.5% 4.5% 2,224 (67) 2,291 - 2,291 East Asia & Australia 1,250 77.9% 83.3% 83.3% 831 2 829 - 829 Latin America & Canada 785 5.9% 5.6% 5.6% $ 8,294 $ 14 $ 8,280 $ - $ 8,280 Total PMI $ 6,971 19.0% 18.8% 18.8% 42
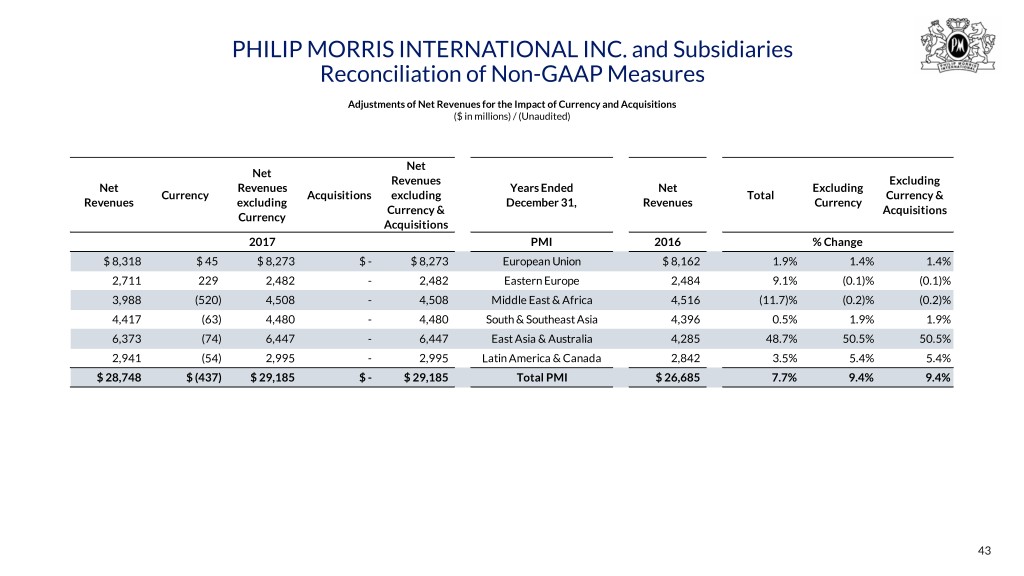
PHILIP MORRIS INTERNATIONAL INC. and Subsidiaries Reconciliation of Non-GAAP Measures Adjustments of Net Revenues for the Impact of Currency and Acquisitions ($ in millions) / (Unaudited) Net Net Revenues Excluding Net Revenues Years Ended Net Excluding Currency Acquisitions excluding Total Currency & Revenues excluding December 31, Revenues Currency Currency & Acquisitions Currency Acquisitions 2017 PMI 2016 % Change $ 8,318 $ 45 $ 8,273 $ - $ 8,273 European Union $ 8,162 1.9% 1.4% 1.4% 2,711 229 2,482 - 2,482 Eastern Europe 2,484 9.1% (0.1)% (0.1)% 3,988 (520) 4,508 - 4,508 Middle East & Africa 4,516 (11.7)% (0.2)% (0.2)% 4,417 (63) 4,480 - 4,480 South & Southeast Asia 4,396 0.5% 1.9% 1.9% 6,373 (74) 6,447 - 6,447 East Asia & Australia 4,285 48.7% 50.5% 50.5% 2,941 (54) 2,995 - 2,995 Latin America & Canada 2,842 3.5% 5.4% 5.4% $ 28,748 $ (437) $ 29,185 $ - $ 29,185 Total PMI $ 26,685 7.7% 9.4% 9.4% 43
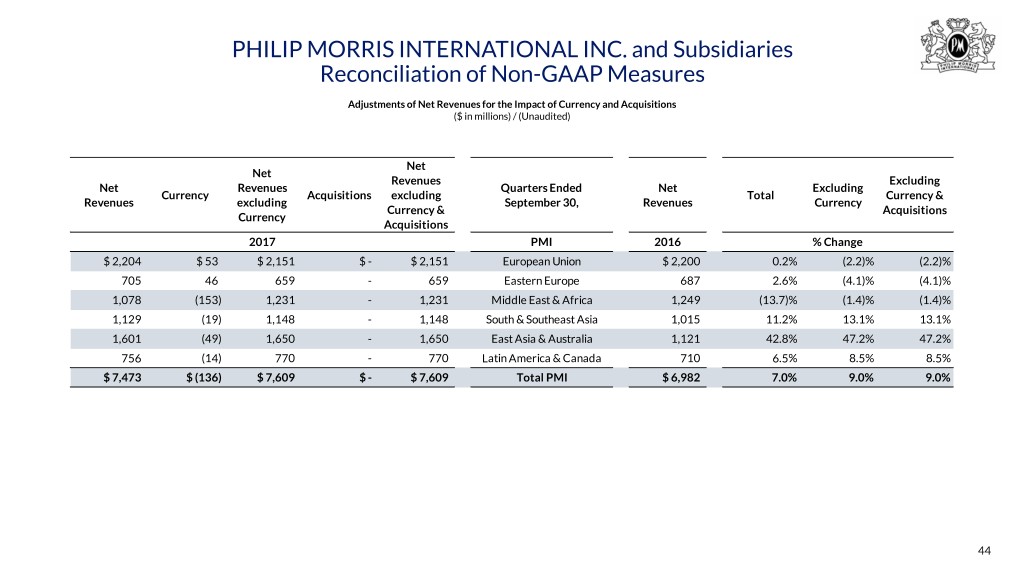
PHILIP MORRIS INTERNATIONAL INC. and Subsidiaries Reconciliation of Non-GAAP Measures Adjustments of Net Revenues for the Impact of Currency and Acquisitions ($ in millions) / (Unaudited) Net Net Revenues Excluding Net Revenues Quarters Ended Net Excluding Currency Acquisitions excluding Total Currency & Revenues excluding September 30, Revenues Currency Currency & Acquisitions Currency Acquisitions 2017 PMI 2016 % Change $ 2,204 $ 53 $ 2,151 $ - $ 2,151 European Union $ 2,200 0.2% (2.2)% (2.2)% 705 46 659 - 659 Eastern Europe 687 2.6% (4.1)% (4.1)% 1,078 (153) 1,231 - 1,231 Middle East & Africa 1,249 (13.7)% (1.4)% (1.4)% 1,129 (19) 1,148 - 1,148 South & Southeast Asia 1,015 11.2% 13.1% 13.1% 1,601 (49) 1,650 - 1,650 East Asia & Australia 1,121 42.8% 47.2% 47.2% 756 (14) 770 - 770 Latin America & Canada 710 6.5% 8.5% 8.5% $ 7,473 $ (136) $ 7,609 $ - $ 7,609 Total PMI $ 6,982 7.0% 9.0% 9.0% 44
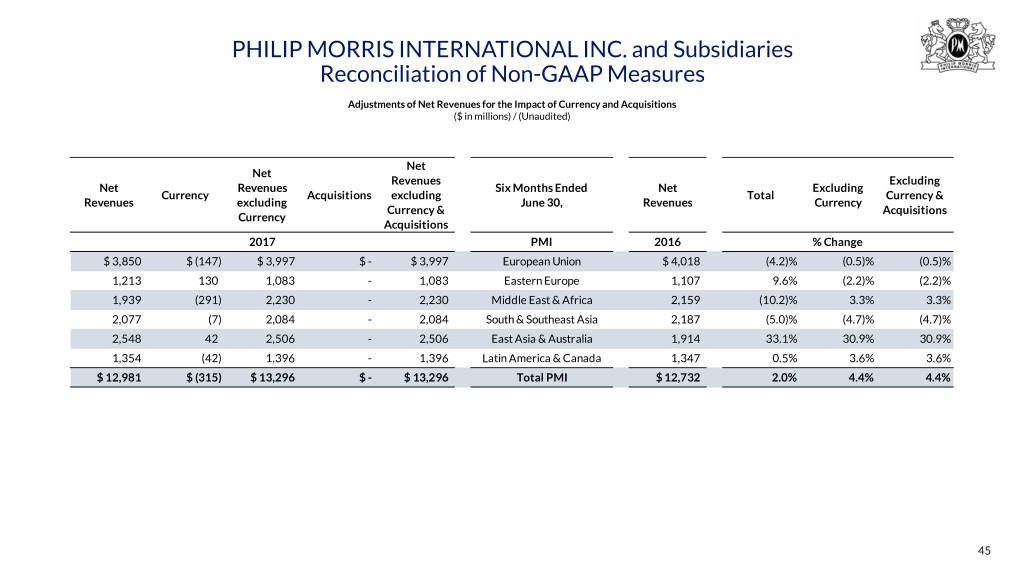
PHILIP MORRIS INTERNATIONAL INC. and Subsidiaries Reconciliation of Non-GAAP Measures Adjustments of Net Revenues for the Impact of Currency and Acquisitions ($ in millions) / (Unaudited) Net Net Revenues Excluding Net Revenues Six Months Ended Net Excluding Currency Acquisitions excluding Total Currency & Revenues excluding June 30, Revenues Currency Currency & Acquisitions Currency Acquisitions 2017 PMI 2016 % Change $ 3,850 $ (147) $ 3,997 $ - $ 3,997 European Union $ 4,018 (4.2)% (0.5)% (0.5)% 1,213 130 1,083 - 1,083 Eastern Europe 1,107 9.6% (2.2)% (2.2)% 1,939 (291) 2,230 - 2,230 Middle East & Africa 2,159 (10.2)% 3.3% 3.3% 2,077 (7) 2,084 - 2,084 South & Southeast Asia 2,187 (5.0)% (4.7)% (4.7)% 2,548 42 2,506 - 2,506 East Asia & Australia 1,914 33.1% 30.9% 30.9% 1,354 (42) 1,396 - 1,396 Latin America & Canada 1,347 0.5% 3.6% 3.6% $ 12,981 $ (315) $ 13,296 $ - $ 13,296 Total PMI $ 12,732 2.0% 4.4% 4.4% 45

2018 Third-Quarter Results October 18, 2018
