Attached files
| file | filename |
|---|---|
| EX-99.1 - PRESS RELEASE - COLONY BANKCORP INC | exh_991.htm |
| 8-K - FORM 8-K - COLONY BANKCORP INC | f8k_101818.htm |
EXHIBIT 99.2

October 2018

Certain statements contained in this presentation that are not statements of historical fact constitute forward - looking statemen ts within the meaning of the Private Securities Litigation Reform Act of 1995 (the “Act”), notwithstanding that such statements are not specifically identified. In addition, certain statements may be contained in the Company’s future filings with the SEC, in pr ess releases, and in oral and written statements made by or with the approval of the Company that are not statements of historical fact and constitute forward - looking statements within the meaning of the Act. Examples of forward - looking statements include, but are not limited to: (i) projections of revenues, income or loss, earnings or loss per share, the payment or nonpayment of dividends, cap ital structure and other financial items; (ii) statement of plans and objectives of Colony Bankcorp, Inc. or its management or Boa rd of Directors, including those relating to products or services; (iii) statements of future economic performance; and (iv) statem ent s of assumptions underlying such statements. Words such as “believes,” “anticipates,” “expects,” “intends,” “targeted” and similar expressions are intended to identify forward - looking statements but are not the exclusive means of identifying such statements. Prospective investors are cautioned that any such forward - looking statements are not guarantees of future performance and involv e known and unknown risks and uncertainties, including, among others, the Company’s ability to implement its various strategic initiatives, which may cause the actual results, performance or achievements of the Company to be materially different from t he future results, performance or achievements expressed or implied by such forward - looking statements. Forward - looking statements are based on the information known to, and current beliefs and expectations of, the Company’s management and are subject to signi fic ant risks and uncertainties. Actual results may differ materially from those contemplated by such forward - looking statements. A numb er of factors could cause actual results to differ materially from those contemplated by the forward - looking statements in this pre ss release. Many of these factors are beyond the Company’s ability to control or predict. These forward - looking statements are based upon information presently known to the Company’s management and are inherently subjective, uncertain and subject to change due to any number of risks and uncertainties, including, without limitation, the ris ks and other factors set forth in the Company’s filings with the Securities and Exchange Commission, the Company’s Annual Report on For m 10 - K for the year ended December 31, 2017, under the captions “Forward - Looking Statements and Factors that Could Affect Future Results” and “Risk Factors” and in the Company’s quarterly reports on Form 10 - Q and current reports on Form 8 - K. Forward - looking statements speak only as of the date on which such statements are made. The Company undertakes no obligation to update any forward - looking statement to reflect events or circumstances after the date on which such statement is made, or to re flect the occurrence of unanticipated events. Readers are cautioned not to place undue reliance on these forward - looking statements. Cautionary Statements 1
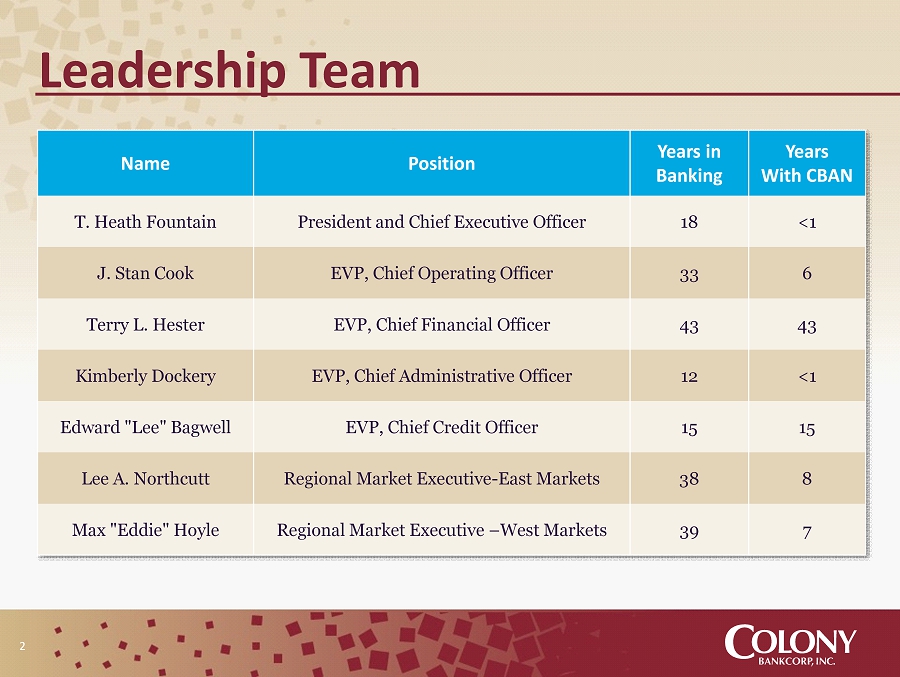
Name Position Years in Banking Years With CBAN T. Heath Fountain President and Chief Executive Officer 18 <1 J. Stan Cook EVP, Chief Operating Officer 33 6 Terry L. Hester EVP, Chief Financial Officer 43 43 Kimberly Dockery EVP, Chief Administrative Officer 12 <1 Edward " Lee " Bagwell EVP, Chief Credit Officer 15 15 Lee A. Northcutt Regional Market Executive - East Markets 38 8 Max "Eddie" Hoyle Regional Market Executive – West Markets 39 7 Leadership Team 2

▪ Founded in 1975 ▪ Headquartered in Fitzgerald, Georgia ▪ $1.2 billion in assets at September 30, 2018 ▪ New leadership focused on growth ▪ 26 locations in Central, Southern and Coastal Georgia ▪ The ninth largest Georgia - based bank in the state and the largest community bank in South Georgia ▪ Strong capital position, solid credit quality Company Profile Locations at September 30, 2018 Atlanta Warner Robins Statesboro Savannah Columbus Albany Fitzgerald Valdosta 3

▪ Size and capabilities ▪ Attractive footprint ▪ Clean balance sheet ▪ No TARP overhang ▪ New, seasoned leadership with a proven track record Strategic Advantages 4

Driving High Performance ▪ Change the culture ▪ Assess current talent ▪ Strengthen out team where needed ▪ Initiate new procedures and processes ▪ Proactive business development ▪ Implement a better tracking program ▪ Increase accountability ▪ Implement incentives to retain and attract high caliber bankers 5
Driving High Performance ▪ Change the culture ▪ Reallocate our resources ▪ Focus on loan and deposit opportunities ▪ Realign balance sheet 6

Driving High Performance ▪ Change the culture ▪ Reallocate our resources ▪ Attract new bankers ▪ Identify bankers and teams from larger institutions ▪ Create the ideal culture for top bankers ▪ Become the banker’s bank of choice 7

Driving High Performance ▪ Reaccelerate expansion ▪ Lift out/add to banking teams in current and new markets ▪ Identify potential whole - bank acquisitions ▪ Desired acquisition targets are smaller than targets typically pursued by larger acquisitive banks ▪ Less competition to enter smaller MSAs ▪ Colony offers a good fit culturally ▪ Enhance efficiencies ▪ Leverage expansion profitably ▪ Change the culture ▪ Reallocate our resources ▪ Attract new bankers 8

Driving High Performance 9 ▪ Reaccelerate expansion ▪ Target line of business growth ▪ Government guaranteed lending (SBA, USDA) ▪ Mortgage lending ▪ Treasury services ▪ Consider new lines of business as opportunities arise ▪ Change the culture ▪ Reallocate our resources ▪ Attract new bankers

Nine Months Ended September 30, 2015 2016 2017 2018 2017 Diluted earnings per share $0.71 $0.84 $0.87* $1.04 $0.81 Dividends per share $0.00 $0.00 $0.10 $0.15 $0.075 Return on average assets 0.52% 0.62% 0.63% 1.00% 0.78% Return on average total equity 5.90% 7.17% 8.28% 13.37% 10.23% Net interest margin 3.52% 3.51% 3.46% 3.56% 3.45% Efficiency ratio 71.84% 71.74% 69.11% 69.90% 69.69% Three - year Financial Highlights * Net income includes a non - cash charge of $2.0 million or $0.24 per diluted share to revalue the Company’s net deferred tax asset relating to federal income tax legislation enacted on December 22, 2017. 10

▪ Cash dividends suspended in 2009 ▪ In 2017, the Company reinstated its quarterly cash dividend at a rate of $0.025 per share ▪ In 2018, the Company increased the quarterly cash dividend to $0.05 per share ▪ The current indicated annual rate is $0.20 per share, equating to a yield of 1.1% and a payout ratio of 13.5% ▪ Positioned to consider further increases in dividends if earnings continue to grow Dividends Restored 11

10.7% 10.3% 9.9% 10.5% 10.2% 15.5% 15.5% 14.6% 15.0% 14.9% 16.6% 16.6% 15.6% 15.9% 15.7% 10.3% 11.3% 11.8% 12.2% 12.0% 2015 2016 2017 Q3 2018 Q3 2017 Tier One Leverage Ratio Tier One Ratio Total Risk-based Capital Ratio Common Equity Tier One Capital Ratio Capital Ratios 12
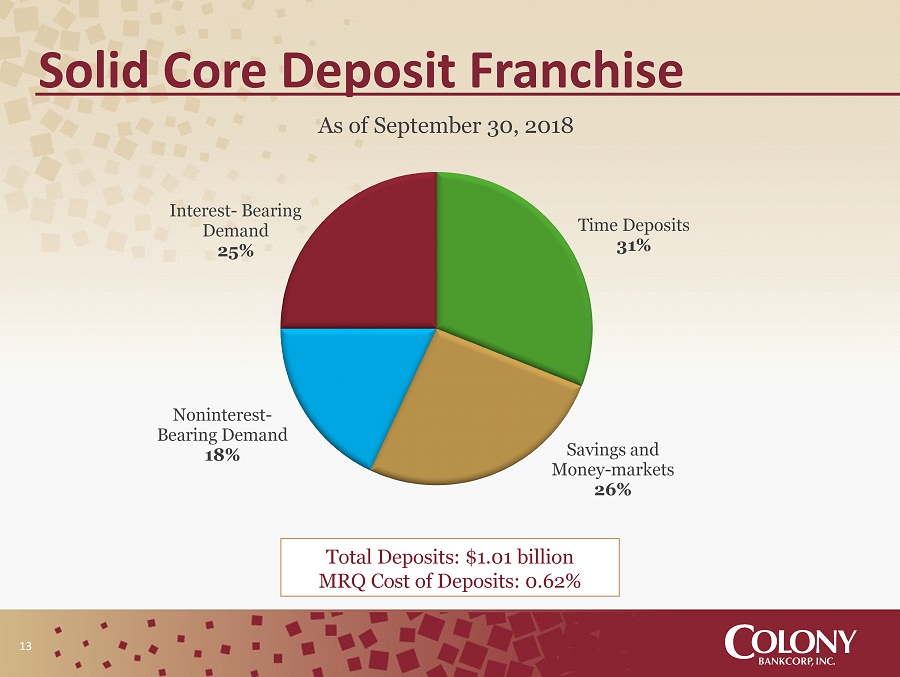
Solid Core Deposit Franchise 13 Time Deposits 31% Savings and Money - markets 26% Noninterest - Bearing Demand 18% Interest - Bearing Demand 25% As of September 30, 2018 Total Deposits: $1.01 billion MRQ Cost of Deposits: 0.62%

Loan Portfolio Breakdown Real estate 87% Commercial and agricultural 9% Consumer and other 4% As of September 30, 2018 Commercial construction 8% Residential construction 2% Commercial real estate 52% Residential real estate 28% Farmland 10% $779.4 million $675.1 million 14

Loan Portfolio Growth (Dollars in millions) $12.5 - $4.4 $11.0 $9.4 2015 2016 2017 9M 2018 Net Loan Growth 15

(Dollars in millions) $14.4 $12.4 $7.5 $8.1 $8.8 $23.3 $18.7 $11.8 $10.3 $13.3 2015 2016 2017 Q3 2018 Q3 2017 Nonperforming Loans Nonperforming Assets Asset Quality Trends 16

▪ Strong, experienced management team ▪ Renewed focus on generating organic loan and deposit growth ▪ Potential acquisition opportunities ▪ Nimble, with responsive decision/credit process ▪ Positioned to expand in existing and new lines of business ▪ Strong capital position, solid credit quality Key Investment Points 17

NASDAQ: CBAN