Attached files
| file | filename |
|---|---|
| EX-3.2 - EXHIBIT 3.2 - COLONY BANKCORP INC | ex_179251.htm |
| EX-32 - EXHIBIT 32 - COLONY BANKCORP INC | ex_175782.htm |
| EX-31.2 - EXHIBIT 31.2 - COLONY BANKCORP INC | ex_175781.htm |
| EX-31.1 - EXHIBIT 31.1 - COLONY BANKCORP INC | ex_175780.htm |
| EX-23 - EXHIBIT 23 - COLONY BANKCORP INC | ex_179265.htm |
| EX-21 - EXHIBIT 21 - COLONY BANKCORP INC | ex_175779.htm |
| EX-13 - EXHIBIT 13 - COLONY BANKCORP INC | ex_175787.htm |
| EX-4.1 - EXHIBIT 4.1 - COLONY BANKCORP INC | ex_178323.htm |
|
UNITED STATES |
|
SECURITIES AND EXCHANGE COMMISSION |
|
WASHINGTON, D.C. 20549 |
|
FORM 10-K |
|
☒ ANNUAL REPORT UNDER SECTION 13 OR 15(d) OF THE SECURITIES EXCHANGE ACT OF 1934 |
|
For the Fiscal Year Ended December 31, 2019 |
|
|
|
☐ TRANSITION REPORT UNDER SECTION 13 OR 15(d) OF THE SECURITIES EXCHANGE ACT OF 1934 |
|
For the Transition Period from _____________to ______________ |
|
|
|
Commission File Number 000-12436 |
|
COLONY BANKCORP, INC. |
|
(Exact Name of Registrant Specified in its Charter) |

|
Georgia |
|
58-1492391 |
|
(State or Other Jurisdiction of Incorporation or Organization) |
|
(I.R.S. Employer Identification Number) |
|
115 South Grant Street |
|
|
|
Fitzgerald, Georgia |
|
31750 |
|
(Address of Principal Executive Offices) |
|
(Zip Code) |
|
|
||
|
(229) 426-6000 |
||
|
Registrant’s Telephone Number, Including Area Code |
||
|
|
||
|
Securities Registered Pursuant to Section 12(b) of the Act: |
||
|
|
Title of each class |
Trading Symbol(s) |
Name of each Exchange on which registered |
|
|
|
Common Stock, Par Value $1.00 per share |
CBAN |
The NASDAQ Stock Market |
|
Securities Registered Pursuant to Section 12(g) of the Act: None.
|
Indicate by check mark if the registrant is a well-known seasoned issuer, as defined in Rule 405 of the Securities Act. Yes ☐ No ☒ |
|
|
|
|
|
Indicate by check mark if the registrant is not required to file reports pursuant to Section 13 or Section 15(d) of the Act. Yes ☐ No ☒ |
|
|
|
|
|
Indicate by check mark whether the registrant (1) has filed all reports required to be filed by Section 13 or 15(d) of the Securities Exchange Act of 1934 during the past 12 months (or for such shorter period that the registrant was required to file such reports), and (2) has been subject to such filing requirements for the past 90 days. Yes ☒ No ☐ |
|
Indicate by check mark whether the registrant has submitted electronically every Interactive Data File required to be submitted pursuant to Rule 405 of Regulation S-T (§232.405 of this chapter) during the preceding 12 months (or for such shorter period that the registrant was required to submit such files). Yes ☒ No ☐ |
|
|
|
|
|
Indicate by check mark whether the registrant is a large accelerated filer, an accelerated filer, a non-accelerated filer, a smaller reporting company, or an emerging growth company. See the definitions of “large accelerated filer,” “accelerated filer,” “smaller reporting company,” and “emerging growth company” in Rule 12b-2 of the Exchange Act. |
|
|
Large Accelerated Filer ☐ |
Accelerated Filer ☒ |
|
Non-accelerated Filer ☐ |
Smaller Reporting Company ☒ |
|
|
Emerging Growth Company ☐ |
|
|
|
|
If an emerging growth company, indicate by check mark if the registrant has elected not to use the extended transition period for complying with any new or revised financial accounting standards provided pursuant to Section 13(a) of the Exchange Act. ☐ |
|
|
|
|
|
Indicate by check mark whether the registrant is a shell company (as defined in Rule 12b-2 of the Act): Yes ☐ No ☒ |
|
| The aggregate market value of Colony Bankcorp, Inc. common stock held by non-affiliates, computed by reference to the price at which the stock was last sold on June 28, 2019, as reported on the NASDAQ Global Market was $122.4 million. |
|
|
| The number of shares outstanding of Colony Bankcorp, Inc. common stock, par value $1.00 per share, as of March 13, 2020, was 9,498,783 shares. |
|
DOCUMENTS INCORPORATED BY REFERENCE |
|
|
| Portions of the Registrant’s Proxy Statement for the 2020 Annual Meeting of Shareholders are incorporated by reference into Part III of this Annual Report on Form 10-K to the extent stated herein. Such Proxy Statement will be filed with the Securities and Exchange Commission within 120 days after the end of the registrant’s fiscal year ended December 31, 2019. |
TABLE OF CONTENTS
|
|
|
Page |
|
PART I |
|
|
|
|
|
|
|
Item 1. |
Business |
2 |
|
Item 1A. |
Risk Factors |
11 |
|
Item 1B. |
Unresolved Staff Comments |
23 |
|
Item 2. |
Properties |
23 |
|
Item 3. |
Legal Proceedings |
23 |
|
Item 4. |
Mine Safety Disclosures |
23 |
|
|
|
|
|
PART II |
|
|
|
|
|
|
|
Item 5. |
Market for Registrant’s Common Equity, Related Stockholder Matters and Issuer Purchases of Equity Securities |
24 |
|
Item 6. |
Selected Financial Data |
26 |
|
Item 7. |
Management’s Discussion and Analysis of Financial Condition and Results of Operations |
28 |
|
Item 7A. |
Quantitative and Qualitative Disclosures About Market Risk |
60 |
|
Item 8. |
Financial Statements and Supplementary Data |
60 |
|
Item 9. |
Changes in and Disagreements with Accountants on Accounting and Financial Disclosure |
62 |
|
Item 9A. |
Controls and Procedures |
62 |
|
Item 9B. |
Other Information |
63 |
|
|
|
|
|
PART III |
|
|
|
|
|
|
|
Item 10. |
Directors and Executive Officers and Corporate Governance |
63 |
|
Item 11. |
Executive Compensation |
63 |
|
Item 12. |
Security Ownership of Certain Beneficial Owners and Management and Related Stockholder Matters |
64 |
|
Item 13. |
Certain Relationships and Related Transactions and Director Independence |
64 |
|
Item 14. |
Principal Accounting Fees and Services |
64 |
|
|
|
|
|
PART IV |
|
|
|
|
|
|
|
Item 15. |
Exhibits, Financial Statement Schedules |
65 |
|
Item 16. |
Form 10-K Summary |
68 |
|
Signatures |
|
69 |
CAUTIONARY NOTE REGARDING FORWARD-LOOKING STATEMENTS
This Annual Report on Form 10-K contains forward-looking statements within the meaning of Section 27A of the Securities Act of 1933, as amended (the “Securities Act”) and Section 21E of the Securities Exchange Act of 1934, as amended (the “Exchange Act”). These forward-looking statements reflect our current views with respect to, among other things, future events and our financial performance. These statements are often, but not always, made through the use of words or phrases such as “may,” “might,” “should,” “could,” “predict,” “potential,” “believe,” “expect,” “continue,” “will,” “anticipate,” “seek,” “estimate,” “intend,” “plan,” “strive,” “projection,” “goal,” “target,” “outlook,” “aim,” “would,” “annualized” and “outlook,” or the negative version of those words or other comparable words or phrases of a future or forward-looking nature. These forward-looking statements are not historical facts, and are based on current expectations, estimates and projections about our industry, management’s beliefs and certain assumptions made by management, many of which, by their nature, are inherently uncertain and beyond our control. Accordingly, we caution you that any such forward-looking statements are not guarantees of future performance and are subject to risks, assumptions, estimates and uncertainties that are difficult to predict. Although we believe that the expectations reflected in these forward-looking statements are reasonable as of the date made, actual results may prove to be materially different from the results expressed or implied by the forward-looking statements.
A number of important factors could cause our actual results to differ materially from those indicated in these forward-looking statements, including those factors discussed elsewhere in this Annual Report and the following:
|
● |
business and economic conditions, particularly those affecting the financial services industry and our primary market areas; |
|
● |
factors that can impact the performance of our loan portfolio, including real estate values and liquidity in our primary market areas, the financial health of our borrowers and the success of various projects that we finance; |
|
● |
concentration of our loan portfolio in real estate loans and changes in the prices, values and sales volumes of commercial and residential real estate; |
|
● |
credit and lending risks associated with our construction and development, commercial real estate, commercial and industrial and residential real estate loan portfolios; |
|
● |
our ability to attract sufficient loans that meet prudent credit standards, including in our construction and development, commercial and industrial and owner-occupied commercial real estate loan categories; |
|
● |
our ability to attract and maintain business banking relationships with well-qualified businesses, real estate developers and investors with proven track records in our market areas; |
|
● |
changes in interest rate environment, including changes to the federal funds rate, and competition in our markets may result in increased funding costs or reduced earning assets yields, thus reducing our margins and net interest income; |
|
● |
our ability to successfully manage our credit risk and the sufficiency of our allowance for loan losses; |
|
● |
the adequacy of our reserves (including allowance for loan losses) and the appropriateness of our methodology for calculating such reserves; |
|
● |
our ability to successfully execute our business strategy to achieve profitable growth; |
|
● |
the concentration of our business within our geographic areas of operation in Georgia and neighboring markets; |
|
● |
our focus on small and mid-sized businesses; |
|
● |
our ability to manage our growth; |
|
● |
our ability to increase our operating efficiency; |
|
● |
liquidity issues, including fluctuations in the fair value and liquidity of the securities we hold for sale and our ability to raise additional capital, if necessary; |
|
● |
failure to maintain adequate liquidity and regulatory capital and comply with evolving federal and state banking regulations; |
|
● |
risks that our cost of funding could increase, in the event we are unable to continue to attract stable, low-cost deposits and reduce our cost of deposits; |
|
● |
inability of our risk management framework to effectively mitigate credit risk, interest rate risk, liquidity risk, price risk, compliance risk, operational risk, strategic risk and reputational risk; |
|
● |
the makeup of our asset mix and investments; |
|
● |
external economic, political and/or market factors, such as changes in monetary and fiscal policies and laws, including the interest rate policies of the Federal Reserve, inflation or deflation, changes in the demand for loans, and fluctuations in consumer spending, borrowing and savings habits, which may have an adverse impact on our financial condition; |
|
● |
continued or increasing competition from other financial institutions, credit unions, and non-bank financial services companies, many of which are subject to different regulations than we are; |
|
● |
challenges arising from unsuccessful attempts to expand into new geographic markets, products, or services; |
|
● |
restraints on the ability of the Bank to pay dividends to us, which could limit our liquidity; |
|
● |
increased capital requirements imposed by banking regulators, which may require us to raise capital at a time when capital is not available on favorable terms or at all; |
|
● |
a failure in the internal controls we have implemented to address the risks inherent to the business of banking; |
|
● |
inaccuracies in our assumptions about future events, which could result in material differences between our financial projections and actual financial performance; |
|
● |
changes in our management personnel or our inability to retain motivate and hire qualified management personnel; |
|
● |
the dependence of our operating model on our ability to attract and retain experienced and talented bankers in each of our markets; |
|
● |
our ability to identify and address cyber-security risks, fraud and systems errors; |
|
● |
disruptions, security breaches, or other adverse events, failures or interruptions in, or attacks on, our information technology systems; |
|
● |
disruptions, security breaches, or other adverse events affecting the third-party vendors who perform several of our critical processing functions; |
|
● |
an inability to keep pace with the rate of technological advances due to a lack of resources to invest in new technologies; |
|
● |
fraudulent and negligent acts by our clients, employees or vendors and our ability to identify and address such acts; |
|
● |
risks related to potential acquisitions; |
|
● |
the impact of any claims or legal actions to which we may be subject, including any effect on our reputation; |
|
● |
compliance with governmental and regulatory requirements, including the Dodd-Frank Act and others relating to banking, consumer protection, securities and tax matters, and our ability to maintain licenses required in connection with commercial mortgage origination, sale and servicing operations; |
|
| ● | impact of the current outbreak of the novel coronavirus (COVID-19); |
|
● |
changes in the scope and cost of FDIC insurance and other coverage; |
|
● |
changes in our accounting standards; |
|
● |
changes in tariffs and trade barriers; |
|
● |
changes in federal tax law or policy; and |
|
● |
other risks and factors identified in this Form 10-K under the heading “Risk Factors”. |
The foregoing factors should not be construed as exhaustive and should be read together with the other cautionary statements included in this Annual Report on Form 10-K. Because of these risks and other uncertainties, our actual future results, performance or achievement, or industry results, may be materially different from the results indicated by the forward looking statements in this Annual Report on Form 10-K. In addition, our past results of operations are not necessarily indicative of our future results. You should not rely on any forward looking statements, which represent our beliefs, assumptions and estimates only as of the dates on which they were made, as predictions of future events. Any forward-looking statement speaks only as of the date on which it is made, and we do not undertake any obligation to update or review any forward-looking statement, whether as a result of new information, future developments or otherwise.
Part I
Item 1
Business
COLONY BANKCORP, INC.
General
Colony Bankcorp, Inc. (the “Company” or “Colony”) is a Georgia business corporation which was incorporated on November 8, 1982. The Company was organized for the purpose of operating as a bank holding company under the Bank Holding Company Act of 1956, as amended, and the bank holding company laws of Georgia (Georgia Laws 1976, p. 168, et. seq.). On July 22, 1983, the Company, after obtaining the requisite regulatory approvals, acquired 100% of the issued and outstanding common stock of Colony Bank (formerly Colony Bank of Fitzgerald and The Bank of Fitzgerald), Fitzgerald, Georgia (the “Bank” or “Colony Bank”), through the merger of the Bank with a subsidiary of the Company which was created for the purpose of organizing the Bank into a one-bank holding company. Since that time, Colony Bank has operated as a wholly-owned subsidiary of the Company. Our business is conducted primarily through our wholly-owned bank subsidiary, which provides a broad range of banking services to its retail and commercial customers. We operate thirty-three domestic banking offices and two corporate operations offices and, at December 31, 2019, we had approximately $1.5 billion in total assets, $968.8 million in total loans, $1.3 billion in total deposits and $130.5 million in stockholder’s equity. Deposits are insured, up to applicable limits, by the Federal Deposit Insurance Corporation.
The Parent Company
Because the Company is a bank holding company, its principal operations are conducted through the Bank. It has 100 percent ownership of its subsidiary and maintains systems of financial, operational and administrative controls that permit centralized evaluation of the operations of the subsidiary bank in selected functional areas including operations, accounting, marketing, investment management, purchasing, human resources, computer services, auditing, compliance and credit review. As a bank holding company, we perform certain shareholder and investor relations functions.
Colony Bank - Banking Services
Our principal subsidiary is the Bank. The Bank, headquartered in Fitzgerald, Georgia, offers traditional banking products and services to commercial and consumer customers in our markets. Our product line includes, among other things, loans to small and medium-sized businesses, residential and commercial construction and land development loans, commercial real estate loans, commercial loans, agri-business and production loans, residential mortgage loans, home equity loans, consumer loans and a variety of demand, savings and time deposit products. We also offer internet banking services, electronic bill payment services, safe deposit box rentals, telephone banking, credit and debit card services, remote depository products and access to a network of ATMs to our customers. The Bank conducts a general full service commercial, consumer and mortgage banking business through thirty-three offices located in central, south and coastal Georgia cities of Fitzgerald, Warner Robins, Centerville, Ashburn, Leesburg, Cordele, Albany, Thomaston, Columbus, Sylvester, Tifton, Moultrie, Douglas, Broxton, Savannah, Eastman, Soperton, Rochelle, Quitman, Valdosta and Statesboro, Georgia.
For additional discussion of our loan portfolio and deposit accounts, see “Management’s Discussion and Analysis of Financial Condition and Results of Operations - Loans" and "Management's Discussion and Analysis of Financial Condition and Results of Operations - Deposits.”
Subordinated Debentures (Trust Preferred Securities)
During the second quarter of 2004, the Company formed Colony Bankcorp Statutory Trust III for the sole purpose of issuing $4,500,000 in Trust Preferred Securities through a pool sponsored by FTN Financial Capital Market. The securities have a maturity of thirty years and are redeemable after five years with certain exceptions.
During the second quarter of 2006, the Company formed Colony Bankcorp Capital Trust I for the sole purpose of issuing $5,000,000 in Trust Preferred Securities through a pool sponsored by SunTrust Bank Capital Markets. The securities have a maturity of thirty years and are redeemable after five years with certain exceptions.
During the first quarter of 2007, the Company formed Colony Bankcorp Capital Trust II for the sole purpose of issuing $9,000,000 in Trust Preferred Securities through a pool sponsored by Trapeza Capital Management, LLC. The securities have a maturity of thirty years and are redeemable after five years with certain exceptions. Proceeds from this issuance were used to pay off trust preferred securities issued on March 26, 2002 through Colony Bankcorp Statutory Trust I.
During the third quarter of 2007, the Company formed Colony Bankcorp Capital Trust III for the sole purpose of issuing $5,000,000 in Trust Preferred Securities through a pool sponsored by Trapeza Capital Management, LLC. The securities have a maturity of thirty years and are redeemable after five years with certain exceptions. Proceeds from this issuance were used to pay off trust preferred securities issued on December 19, 2002 through Colony Bankcorp Statutory Trust II.
Recent Developments
On May 1, 2019, the Bank completed its purchase of the mortgage division from Planters First Bank, PFB Mortgage, which added several mortgage originators within the following markets in Georgia: Albany, Athens, Macon and Warner Robins. In addition, the Bank established a new mortgage loan origination office in LaGrange, Georgia in March 2019.
On May 1, 2019, the Company completed its acquisition of LBC Bancshares, Inc., a bank holding company headquartered in LaGrange, Georgia. Upon consummation of the acquisition, LBC Bancshares, Inc. was merged with and into the Company, with Colony as the surviving entity in the merger. At that time, LBC’s wholly owned bank subsidiary, Calumet Bank, was also merged with and into the Bank. The acquisition expanded the Company’s market presence in LaGrange, Georgia and Columbus, Georgia, as well as adding a loan production office in Atlanta, Georgia. Under the terms of the Agreement and Plan of Merger, each LBC shareholder had the option to receive either $23.50 in cash or 1.3239 shares of the Company’s common stock in exchange for each share of LBC common stock, subject to proration such that 55% of LBC Bancshares, Inc. shares of common stock received the stock consideration and 45% received the cash consideration, with at least 50% of the merger consideration paid in the Company's common stock. As a result, the Company issued 1,053,875 common shares at a fair value of $18.7 million and paid $15.3 million in cash to the former shareholders of LBC Bancshares, Inc. as merger consideration.
Markets and Competition
The banking industry in general is highly competitive. Our market areas of central, south and coastal Georgia have experienced good economic and population growth over the past several years. In contrast to our rural markets, in which we typically rank in the top three in terms of market share, we face competitive pressures in attracting deposits and making loans from larger regional banks and smaller community banks. The Bank's competition includes not only other banks of comparable or larger size in the same markets, but also various other nonbank financial institutions, including savings and loan associations, credit unions, mortgage companies, personal and commercial financial companies, peer to peer lending businesses, investment brokerage and financial advisory firms and mutual fund companies. The Bank competes for deposits, commercial, fiduciary and investment services and various types of loans and other financial services. The Bank also competes for interest-bearing funds with a number of other financial intermediaries, including brokerage and insurance firms, as well as investment alternatives, including mutual funds, governmental and corporate bonds, and other securities. Continued consolidation and rapid technological changes within the financial services industry will likely change the nature and intensity of competition, but also will create opportunities for the Company to demonstrate and leverage its competitive advantages.
Competitors include not only financial institutions based in Georgia, but also a number of large out-of-state and foreign banks, bank holding companies and other financial institutions that have an established market presence in Georgia or that offer internet-based products. Many of the Company's competitors are engaged in local, regional, national and international operations and have greater assets, personnel and other resources. Some of these competitors are subject to less regulation and/or more favorable tax treatment. Many of these institutions have greater resources, broader geographic markets and higher lending limits, and may offer services that the Company does not offer. In addition, these institutions may be able to better afford and make broader use of media advertising, support services, and electronic and other technology. To offset these potential competitive disadvantages, the Company depends on its reputation for superior service, ability to make credit and other business decisions quickly, and the delivery of an integrated distribution of traditional branches and bankers, with digital technology.
Correspondents
Colony Bank has correspondent relationships with the following banks: Federal Reserve Bank of Atlanta; Truist Bank in Atlanta, Georgia; FTN Financial in Memphis, Tennessee; CenterState Bank in Lake Wales, Florida and the Federal Home Loan Bank of Atlanta. These correspondent relationships facilitate the transactions of business by means of loans, collections, investment services, lines of credit and exchange services, particularly in markets in which Colony Bank does not have a physical presence. As compensation for these services, the Bank maintains balances with its correspondents in primarily interest-bearing accounts and pays some service charges.
Employees
On December 31, 2019, the Company had a total of 370 employees, 360 of which are full-time equivalent employees. We consider our relationship with our employees to be satisfactory.
The Company has a profit-sharing plan covering all employees, subject to certain minimum age and service requirements. In addition, the Company maintains a comprehensive employee benefit program providing, among other benefits, hospitalization, major medical, life insurance and disability insurance. Management considers these benefits to be competitive with those offered by other financial institutions in our market area. Colony’s employees are not represented by any collective bargaining group.
Corporate Information
The Company’s headquarters is located at 115 South Grant Street, Fitzgerald, Georgia 31750, its telephone number is 229-426-6000 and its internet address is www.colonybank.com. The information contained on or accessible from our website does not constitute a part of this Annual Report on Form 10-K and is not incorporated by reference herein.
SUPERVISION AND REGULATION
General
We are extensively regulated under federal and state law. The following is a brief summary that does not purport to be a complete description of all regulations that affect us or all aspects of those regulations. This discussion is qualified in its entirety by reference to the particular statutory and regulatory provisions described below and is not intended to be an exhaustive description of the statutes or regulations applicable to the Company’s and the Bank’s business. In addition, proposals to change the laws and regulations governing the banking industry are frequently raised at both the state and federal levels. The likelihood and timing of any changes in these laws and regulations, and the impact such changes may have on us and the Bank, are difficult to predict. In addition, bank regulatory agencies may issue enforcement actions, policy statements, interpretive letters and similar written guidance applicable to us or the Bank. Changes in applicable laws, regulations or regulatory guidance, or their interpretation by regulatory agencies or courts may have a material adverse effect on our and the Bank’s business, operations, and earnings. Supervision and regulation of banks, their holding companies and affiliates is intended primarily for the protection of depositors and customers, the Deposit Insurance Fund (“DIF”) of the Federal Deposit Insurance Corporation (“FDIC”), and the U.S. banking and financial system rather than holders of our capital stock.
Regulation of the Company
We are registered as a bank holding company with the Federal Reserve under the Bank Holding Company Act of 1956, as amended (the “BHC Act”) and have elected to be treated as a financial holding company. As such, we are subject to comprehensive supervision and regulation by the Federal Reserve and are subject to its regulatory reporting requirements. Federal law subjects bank holding companies, such as the Company, to particular restrictions on the types of activities in which they may engage, and to a range of supervisory requirements and activities, including regulatory enforcement actions for violations of laws and regulations. Violations of laws and regulations, or other unsafe and unsound practices, may result in regulatory agencies imposing fines or penalties, cease and desist orders, or taking other enforcement actions. Under certain circumstances, these agencies may enforce these remedies directly against officers, directors, employees and other parties participating in the affairs of a bank or bank holding company.
Activity Limitations. As a financial holding company, we are permitted to engage directly or indirectly in a broader range of activities than those permitted for a bank holding company that has not elected to be a financial holding company. Bank holding companies are generally restricted to engaging in the business of banking, managing or controlling banks and certain other activities determined by the Federal Reserve to be closely related to banking. Financial holding companies may also engage in activities that are considered to be financial in nature, as well as those incidental or, if determined by the Federal Reserve, complementary to financial activities. We and Colony Bank must each remain “well-capitalized” and “well-managed” and Colony Bank must receive a CRA rating of at least “Satisfactory” at its most recent examination in order for us to maintain our status as a financial holding company. If Colony Bank ceases to be “well capitalized” or “well managed” under applicable regulatory standards, or if Colony Bank receives a rating of less than satisfactory under the CRA, the Federal Reserve Board may, among other things, place limitations on our ability to conduct these broader financial activities or, if the deficiencies persist, require us to divest the banking subsidiary or the businesses engaged in activities permissible only for financial holding companies.
In addition, the Federal Reserve has the power to order a bank holding company or its subsidiaries to terminate any nonbanking activity or terminate its ownership or control of any nonbank subsidiary, when it has reasonable cause to believe that continuation of such activity or such ownership or control constitutes a serious risk to the financial safety, soundness, or stability of any bank subsidiary of that bank holding company.
Source of Strength Obligations. A financial holding company is required to act as a source of financial and managerial strength to its subsidiary bank and to maintain resources adequate to support its bank. The term “source of financial strength” means the ability of a company, such as us, that directly or indirectly owns or controls an insured depository institution, such as the Bank, to provide financial assistance to such insured depository institution in the event of financial distress. The appropriate federal banking agency for the depository institution (in the case of the Bank, this agency is the FDIC) may require reports from us to assess our ability to serve as a source of strength and to enforce compliance with the source of strength requirements by requiring us to provide financial assistance to the Bank in the event of financial distress.
Acquisitions. The BHC Act permits acquisitions of banks by bank holding companies, such that we and any other bank holding company, whether located in Georgia or elsewhere, may acquire a bank located in any other state, subject to certain deposit-percentage, age of bank charter requirements, and other restrictions. The BHC Act requires that a bank holding company obtain the prior approval of the Federal Reserve before (i) acquiring direct or indirect ownership or control of more than 5% of the voting shares of any additional bank or bank holding company, (ii) taking any action that causes an additional bank or bank holding company to become a subsidiary of the bank holding company, or (iii) merging or consolidating with any other bank holding company. The Federal Reserve may not approve any such transaction that would result in a monopoly or would be in furtherance of any combination or conspiracy to monopolize or attempt to monopolize the business of banking in any section of the United States, or the effect of which may be substantially to lessen competition or to tend to create a monopoly in any section of the country, or that in any other manner would be in restraint of trade, unless the anticompetitive effects of the proposed transaction are clearly outweighed by the public interest in meeting the convenience and needs of the community to be served. The Federal Reserve is also required to consider: (1) the financial and managerial resources of the companies involved, including pro forma capital ratios; (2) the risk to the stability of the United States banking or financial system; (3) the convenience and needs of the communities to be served, including performance under the Community Reinvestment Act, further described below; and (4) the effectiveness of the companies in combatting money laundering.
Change in Control. Federal law restricts the amount of voting stock of a bank holding company or a bank that a person may acquire without the prior approval of banking regulators. Under the federal Change in Bank Control Act and the regulations thereunder, a person or group must give advance notice to the Federal Reserve before acquiring control of any bank holding company, such as the Company, and the FDIC before acquiring control of the Bank. Upon receipt of such notice, the bank regulatory agencies may approve or disapprove the acquisition. The Change in Bank Control Act creates a rebuttable presumption of control if a member or group acquires a certain percentage or more of a bank holding company’s or bank’s voting stock, or if one or more other control factors are present. As a result, a person or entity generally must provide prior notice to the Federal Reserve before acquiring the power to vote 10% or more of our outstanding common stock. The overall effect of such laws is to make it more difficult to acquire a bank holding company and a bank by tender offer or similar means than it might be to acquire control of another type of corporation. Consequently, shareholders of the Company may be less likely to benefit from the rapid increases in stock prices that may result from tender offers or similar efforts to acquire control of other companies. Investors should be aware of these requirements when acquiring shares of our stock.
Governance and Financial Reporting Obligations. We are required to comply with various corporate governance and financial reporting requirements under the Sarbanes-Oxley Act of 2002, as well as rules and regulations adopted by the SEC, the Public Company Accounting Oversight Board, and the Nasdaq Stock Market. In particular, we are required to include management and independent registered public accounting firm reports on internal controls as part of our Annual Report on Form 10-K in order to comply with Section 404 of the Sarbanes-Oxley Act. We have evaluated our controls, including compliance with the SEC rules on internal controls, and have and expect to continue to spend significant amounts of time and money on compliance with these rules. Our failure to comply with these internal control rules may materially adversely affect our reputation, ability to obtain the necessary certifications to financial statements, and the values of our securities.
Corporate Governance. The Dodd-Frank Act addresses many investor protections, corporate governance, and executive compensation matters that will affect most U.S. publicly traded companies. The Dodd-Frank Act (1) grants shareholders of U.S. publicly traded companies an advisory vote on executive compensation; (2) enhances independence requirements for Compensation Committee members; and (3) requires companies listed on national securities exchanges to adopt incentive-based compensation claw-back policies for executive officers.
Incentive Compensation. The Dodd-Frank Act required the banking agencies and the SEC to establish joint rules or guidelines for financial institutions with more than $1 billion in assets, such as us and the Bank, which prohibit incentive compensation arrangements that the agencies determine to encourage inappropriate risks by the institution. The banking agencies issued proposed rules in 2011 and previously issued guidance on sound incentive compensation policies. In 2016, the Federal Reserve and the FDIC also proposed rules that would, depending upon the assets of the institution, directly regulate incentive compensation arrangements and would require enhanced oversight and recordkeeping. As of December 31, 2019, these rules have not been implemented. We and the Bank have undertaken efforts to ensure that our incentive compensation plans do not encourage inappropriate risks, consistent with three key principles - that incentive compensation arrangements should appropriately balance risk and financial rewards, be compatible with effective controls and risk management, and be supported by strong corporate governance.
Shareholder Say-On-Pay Votes. The Dodd-Frank Act requires public companies to take shareholders’ votes on proposals addressing compensation (known as say-on-pay), the frequency of a say-on-pay vote, and the golden parachutes available to executives in connection with change-in-control transactions. Public companies must give shareholders the opportunity to vote on the compensation at least every three years and the opportunity to vote on frequency at least every six years, indicating whether the say-on-pay vote should be held annually, biennially, or triennially. The say-on-pay, the say-on-parachute and the say-on-frequency votes are explicitly nonbinding and cannot override a decision of our board of directors.
Other Regulatory Matters. We and our subsidiaries are subject to oversight by the SEC, the Financial Industry Regulatory Authority, (“FINRA”), the PCAOB, the Nasdaq Stock Market and various state securities regulators. We and our subsidiaries have from time to time received requests for information from regulatory authorities in various states, including state attorneys general, securities regulators and other regulatory authorities, concerning our business practices. Such requests are considered incidental to the normal conduct of business.
Capital Requirements
The Bank is required under federal law to maintain certain minimum capital levels based on ratios of capital to total assets and capital to risk-weighted assets. The required capital ratios are minimums, and the federal banking agencies may determine that a banking organization, based on its size, complexity or risk profile, must maintain a higher level of capital in order to operate in a safe and sound manner. Risks such as concentration of credit risks and the risk arising from non-traditional activities, as well as the institution’s exposure to a decline in the economic value of its capital due to changes in interest rates, and an institution’s ability to manage those risks are important factors that are to be taken into account by the federal banking agencies in assessing an institution’s overall capital adequacy. The following is a brief description of the relevant provisions of these capital rules and their potential impact on our capital levels.
The Bank is subject to the following risk-based capital ratios: a common equity Tier 1 (“CET1”) risk-based capital ratio, a Tier 1 risk-based capital ratio, which includes CET1 and additional Tier 1 capital, and a total capital ratio, which includes Tier 1 and Tier 2 capital. CET1 is primarily comprised of the sum of common stock instruments and related surplus net of treasury stock, retained earnings, and certain qualifying minority interests, less certain adjustments and deductions, including with respect to goodwill, intangible assets, mortgage servicing assets and deferred tax assets subject to temporary timing differences. Additional Tier 1 capital is primarily comprised of noncumulative perpetual preferred stock, tier 1 minority interests and grandfathered trust preferred securities. Tier 2 capital consists of instruments disqualified from Tier 1 capital, including qualifying subordinated debt, other preferred stock and certain hybrid capital instruments, and a limited amount of loan loss reserves up to a maximum of 1.25% of risk-weighted assets, subject to certain eligibility criteria. The capital rules also define the risk-weights assigned to assets and off-balance sheet items to determine the risk-weighted asset components of the risk-based capital rules, including, for example, certain “high volatility” commercial real estate, past due assets, structured securities and equity holdings.
The leverage capital ratio, which serves as a minimum capital standard, is the ratio of Tier 1 capital to quarterly average assets net of goodwill, certain other intangible assets, and certain required deduction items. The required minimum leverage ratio for all banks is 4%.
In addition, as of January 1, 2019, the capital rules require a capital conservation buffer of 2.5%, constituted of CET1, above each of the minimum capital ratio requirements (CET1, Tier 1, and total risk-based capital), which is designed to absorb losses during periods of economic stress. These buffer requirements must be met for a bank to be able to pay dividends, engage in share buybacks or make discretionary bonus payments to executive management without restriction.
Failure to be well-capitalized or to meet minimum capital requirements could result in certain mandatory and possible additional discretionary actions by regulators that, if undertaken, could have an adverse material effect on our operations or financial condition. For example, only a well-capitalized depository institution may accept brokered deposits without prior regulatory approval. Failure to be well-capitalized or to meet minimum capital requirements could also result in restrictions on the Bank’s ability to pay dividends or otherwise distribute capital or to receive regulatory approval of applications or other restrictions on its growth.
The Federal Deposit Insurance Corporation Improvement Act of 1991 (“FDICIA”), among other things, requires the federal bank regulatory agencies to take “prompt corrective action” regarding depository institutions that do not meet minimum capital requirements. FDICIA establishes five regulatory capital tiers: “well capitalized,” “adequately capitalized,” “undercapitalized,” “significantly undercapitalized,” and “critically undercapitalized.” A depository institution’s capital tier will depend upon how its capital levels compare to various relevant capital measures and certain other factors, as established by regulation. FDICIA generally prohibits a depository institution from making any capital distribution (including payment of a dividend) or paying any management fee to its holding company if the depository institution would thereafter be undercapitalized. The FDICIA imposes progressively more restrictive restraints on operations, management and capital distributions, depending on the category in which an institution is classified. Undercapitalized depository institutions are subject to restrictions on borrowing from the Federal Reserve System. In addition, undercapitalized depository institutions may not accept brokered deposits absent a waiver from the FDIC, are subject to growth limitations and are required to submit capital restoration plans for regulatory approval. A depository institution’s holding company must guarantee any required capital restoration plan, up to an amount equal to the lesser of 5% of the depository institution’s assets at the time it becomes undercapitalized or the amount of the capital deficiency when the institution fails to comply with the plan. Federal banking agencies may not accept a capital plan without determining, among other things, that the plan is based on realistic assumptions and is likely to succeed in restoring the depository institution’s capital. If a depository institution fails to submit an acceptable plan, it is treated as if it is significantly undercapitalized. All of the federal bank regulatory agencies have adopted regulations establishing relevant capital measures and relevant capital levels for federally insured depository institutions.
To be well-capitalized, the Bank must maintain at least the following capital ratios:
|
● |
6.5% CET1 to risk-weighted assets; |
|
● |
8.0% Tier 1 capital to risk-weighted assets; |
|
● |
10.0% Total capital to risk-weighted assets; and |
|
● |
5.0% leverage ratio. |
As of December 31, 2019, our Bank's regulatory capital ratios were above the applicable well-capitalized standards and met the then-applicable capital conservation buffer.
The Economic Growth, Regulatory Relief, and Consumer Protection Act (the “Economic Growth Act”) signed into law in May 2018 scaled back certain requirements of the Dodd-Frank Act and provided other regulatory relief. Among the provisions of the Economic Growth Act was a requirement that the Federal Reserve raise the asset threshold for those bank holding companies subject to the Federal Reserve’s Small Bank Holding Company Policy Statement (“Policy Statement”) to $3 billion. As a result, as of the effective date of that change in 2018, the Company was no longer required to comply with the risk-based capital rules applicable to the Bank as described above. The Federal Reserve may however, require smaller bank holding companies subject to the Policy Statement to maintain certain minimum capital levels, depending upon general economic conditions and a bank holding company’s particular condition, risk profile and growth plans.
On October 29, 2019, the federal banking agencies issued a final rule to simplify the regulatory capital requirements for eligible banks and holding companies with less than $10 billion in consolidated assets that opt into the Community Bank Leverage Ratio (“CBLR”) framework, as required by Section 201 of the Economic Growth, Relief and Consumer Protection Act (the “Regulatory Relief Act”). A qualifying community banking organization that exceeds the CBLR threshold would be exempt from the agencies’ current capital framework, including the risk-based capital requirements and capital conservation buffer described above, and would be deemed well-capitalized under the agencies’ prompt corrective action regulations. The Regulatory Relief Act defines a “qualifying community banking organization” as a depository institution or depository institution holding company with total consolidated assets of less than $10 billion. Under the final rule, if a qualifying community banking organization elects to use the CBLR framework, it will be considered “well-capitalized” so long as its CBLR is greater than 9%. The CBLR framework will first be available for banking organizations, such as the Bank, to use in its March 31, 2020 regulatory reports.
On December 21, 2018, federal banking agencies issued a joint final rule to revise their regulatory capital rules to (i) address the upcoming implementation of the “current expected credit losses” (“CECL”) accounting standard under GAAP; (ii) provide an optional three-year phase-in period for the day-one adverse regulatory capital effects that banking organizations are expected to experience upon adopting CECL; and (iii) require the use of CECL in stress tests beginning with the 2020 capital planning and stress testing cycle for certain banking organizations. In June 2016, the Financial Accounting Standards Board issued Accounting Standards Update No. 2016-13, which introduced CECL as the methodology to replace the current “incurred loss” methodology for financial assets measured at amortized cost, and changed the approaches for recognizing and recording credit losses on available-for-sale debt securities and purchased credit impaired financial assets. Under the incurred loss methodology, credit losses are recognized only when the losses are probable or have been incurred; under CECL, companies are required to recognize the full amount of expected credit losses for the lifetime of the financial assets, based on historical experience, current conditions and reasonable and supportable forecasts. This change will result in earlier recognition of credit losses that the Company deems expected but not yet probable. For SEC reporting companies with smaller reporting company designation and December 31 fiscal-year ends, such as the Company, CECL will become effective beginning with the first quarter of 2023.
Payment of Dividends
We are a legal entity separate and distinct from the Bank and our other subsidiaries. Our primary source of cash, other than securities offerings, is dividends from the Bank. Under the laws of the State of Georgia, we, as a business corporation, may declare and pay dividends in cash or property unless the payment or declaration would be contrary to restrictions contained in our Articles of Incorporation, as amended, or unless, after payment of the dividend, we would not be able to pay our debts when they become due in the usual course of our business or our total assets would be less than the sum of our total liabilities. In addition, we are also subject to federal regulatory capital requirements that effectively limit the amount of cash dividends that we may pay.
The primary sources of funds for our payment of dividends to our shareholders are cash on hand and dividends from the Bank and our non-bank subsidiaries. Various federal and state statutory provisions and regulations limit the amount of dividends that the Bank and our non-bank subsidiaries may pay. The Bank is a Georgia bank. Under the regulations of the Georgia Department of Banking and Finance, a Georgia bank must have approval of the Georgia Department of Banking and Finance to pay cash dividends if, at the time of such payment:
|
● |
the ratio of Tier 1 capital to adjusted total assets is less than 6%; |
|
● |
the aggregate amount of dividends to be declared or anticipated to be declared during the current calendar year exceeds 50% of its net after-tax profits before dividends for the previous calendar year; or |
|
● |
its total classified assets in its most recent regulatory examination exceeded 80% of its Tier 1 capital plus its allowance for loan and lease losses. |
The Georgia Financial Institutions Code contains restrictions on the ability of a Georgia bank to pay dividends other than from retained earnings without the approval of the Georgia Department of Banking and Finance. As a result of the foregoing restrictions, the Bank may be required to seek approval from the Georgia Department of Banking and Finance to pay dividends.
In addition, we and the Bank are subject to various general regulatory policies and requirements relating to the payment of dividends, including requirements to maintain adequate capital above regulatory minimums. The appropriate federal bank regulatory authority may prohibit the payment of dividends where it has determined that the payment of dividends would be an unsafe or unsound practice and to prohibit payment thereof. The FDIC and the Federal Reserve have indicated that paying dividends that deplete a bank’s capital base to an inadequate level would be an unsound and unsafe banking practice. The FDIC and the Federal Reserve have each indicated that depository institutions and their holding companies should generally pay dividends only out of current operating earnings. Prior approval by the FDIC is required if the total of all dividends declared by a bank in any calendar year exceeds the bank’s profits for that year combined with its retained net profits for the preceding two calendar years.
Under a Federal Reserve policy adopted in 2009, the board of directors of a bank holding company must consider different factors to ensure that its dividend level is prudent relative to maintaining a strong financial position, and is not based on overly optimistic earnings scenarios, such as potential events that could affect its ability to pay, while still maintaining a strong financial position. As a general matter, the Federal Reserve has indicated that the board of directors of a bank holding company should consult with the Federal Reserve and eliminate, defer or significantly reduce the bank holding company’s dividends if:
|
● |
its net income available to shareholders for the past four quarters, net of dividends previously paid during that period, is not sufficient to fully fund the dividends; |
|
● |
its prospective rate of earnings retention is not consistent with its capital needs and overall current and prospective financial condition; or |
|
● |
it will not meet, or is in danger of not meeting, its minimum regulatory capital adequacy ratios. |
Regulation of the Bank
The Bank is subject to comprehensive supervision and regulation by the FDIC and is subject to its regulatory reporting requirements. The Bank also is subject to certain Federal Reserve regulations. In addition, as discussed in more detail below, the Bank and any
other of our subsidiaries that offer consumer financial products and services are subject to regulation and potential supervision by the Consumer Financial Protection Bureau ("CFPB"). Authority to supervise and examine the Company and the Bank for compliance with federal consumer laws remains largely with the Federal Reserve and the FDIC, respectively. However, the CFPB may participate in examinations on a “sampling basis” and may refer potential enforcement actions against such institutions to their primary regulators. The CFPB also may participate in examinations of our other direct or indirect subsidiaries that offer consumer financial products or services. In addition, the Dodd-Frank Act permits states to adopt consumer protection laws and regulations that are stricter than those regulations promulgated by the CFPB, and state attorneys general are permitted to enforce certain federal consumer financial protection rules adopted by the CFPB.
Broadly, regulations applicable to the Bank include limitations on loans to a single borrower and to its directors, officers and employees; restrictions on the opening and closing of branch offices; the maintenance of required capital and liquidity ratios; the granting of credit under equal and fair conditions; the disclosure of the costs and terms of such credit; requirements to maintain reserves against deposits and loans; limitations on the types of investment that may be made by the Bank; and requirements governing risk management practices. The Bank is permitted under federal law to branch on a de novo basis across state lines where the laws of that state would permit a bank chartered by that state to open a de novo branch.
Transactions with Affiliates and Insiders. The Bank is subject to restrictions on extensions of credit and certain other transactions between the Bank and the Company or any nonbank affiliate. Generally, these covered transactions with either the Company or any affiliate are limited to 10% of the Bank’s capital and surplus, and all such transactions between the Bank and the Company and all of its nonbank affiliates combined are limited to 20% of the Bank’s capital and surplus. Loans and other extensions of credit from the Bank to the Company or any affiliate generally are required to be secured by eligible collateral in specified amounts. In addition, any transaction between the Bank and the Company or any affiliate are required to be on an arm’s length basis. Federal banking laws also place similar restrictions on certain extensions of credit by insured banks, such as the Bank, to their directors, executive officers and principal shareholders.
Reserves. Federal Reserve rules require depository institutions, such as the Bank, to maintain reserves against their transaction accounts, primarily NOW and regular checking accounts. For 2019, the first $16.3 million of covered balances are exempt from these reserve requirements, aggregate balances between $16.3 million and $124.2 million are subject to a 3% reserve requirement, and aggregate balances above $124.2 million are subject to a reserve requirement of $2.7 million plus 10% of the amount over $124.2 million. These reserve requirements are subject to annual adjustment by the Federal Reserve.
FDIC Insurance Assessments and Depositor Preference. The Bank’s deposits are insured by the FDIC’s DIF up to the limits under applicable law, which currently are set at $250,000 per depositor, per insured bank, for each account ownership category. The Bank is subject to FDIC assessments for its deposit insurance. The FDIC calculates quarterly deposit insurance assessments based on an institution’s average total consolidated assets less its average tangible equity, and applies one of four risk categories determined by reference to its capital levels, supervisory ratings, and certain other factors. The assessment rate schedule can change from time to time, at the discretion of the FDIC, subject to certain limits. In addition, the Bank was subject to quarterly assessments by the FDIC to pay interest on Financing Corporation (“FICO”) bonds, ending the first quarter of 2019.
Insurance of deposits may be terminated by the FDIC upon a finding that the institution has engaged in unsafe and unsound practices, is in an unsafe or unsound condition to continue operations, or has violated any applicable law, regulation, rule, order or condition imposed by a bank’s federal regulatory agency. In addition, the Federal Deposit Insurance Act provides that, in the event of the liquidation or other resolution of an insured depository institution, the claims of depositors of the institution, including the claims of the FDIC as subrogee of insured depositors, and certain claims for administrative expenses of the FDIC as a receiver, will have priority over other general unsecured claims against the institution, including those of the parent bank holding company.
Standards for Safety and Soundness. The Federal Deposit Insurance Act requires the federal bank regulatory agencies to prescribe, by regulation or guideline, operational and managerial standards for all insured depository institutions relating to: (1) internal controls; (2) information systems and audit systems; (3) loan documentation; (4) credit underwriting; (5) interest rate risk exposure; and (6) asset quality.
The federal banking agencies have adopted regulations and Interagency Guidelines Establishing Standards for Safety and Soundness to implement these required standards. These guidelines set forth the safety and soundness standards used to identify and address problems at insured depository institutions before capital becomes impaired. Under the regulations, if a regulator determines that a bank fails to meet any standards prescribed by the guidelines, the regulator may require the bank to submit an acceptable plan to achieve compliance, consistent with deadlines for the submission and review of such safety and soundness compliance plans.
Anti-Money Laundering. Anti-Money Laundering. Under the Uniting and Strengthening America by Providing Appropriate Tools Required to Intercept and Obstruct Terrorism (“USA PATRIOT”) Act of 2001, financial institutions are subject to prohibitions against specified financial transactions and account relationships as well as enhanced due diligence and “know your customer” standards in their dealings with foreign financial institutions and foreign customers. The USA PATRIOT Act, and its implementing regulations adopted by the FinCEN, a bureau of the U.S. Department of the Treasury, requires financial institutions to establish anti-money laundering programs with minimum standards that include:
|
● |
the development of internal policies, procedures, and controls; |
|
● |
the designation of a compliance officer; |
|
● |
an ongoing employee training program; and |
|
● |
an independent audit function to test the programs. |
In addition, FinCEN issued rules that became effective on May 11, 2018, that require, subject to certain exclusions and exemptions, covered financial institutions to identify and verify the identity of beneficial owners of legal entity customers.
Banking regulators will consider compliance with the Act’s money laundering provisions in acting upon acquisition and merger proposals. Bank regulators routinely examine institutions for compliance with these obligations and have been active in imposing cease and desist and other regulatory orders and money penalty sanctions against institutions found to be violating these obligations. Sanctions for violations of the Act can be imposed in an amount equal to twice the sum involved in the violating transaction, up to $1 million.
Economic Sanctions. The Office of Foreign Assets Control (“OFAC”) is responsible for helping to ensure that U.S. entities do not engage in transactions with certain prohibited parties, as defined by various Executive Orders and acts of Congress. OFAC publishes, and routinely updates, lists of names of persons and organizations suspected of aiding, harboring or engaging in terrorist acts, including the Specially Designated Nationals and Blocked Persons List. If we find a name on any transaction, account or wire transfer that is on an OFAC list, we must undertake certain specified activities, which could include blocking or freezing the account or transaction requested, and we must notify the appropriate authorities.
Concentrations in Lending. During 2006, the federal bank regulatory agencies released guidance on “Concentrations in Commercial Real Estate Lending” (the “Guidance”) and advised financial institutions of the risks posed by commercial real estate (“CRE”) lending concentrations. The Guidance requires that appropriate processes be in place to identify, monitor and control risks associated with real estate lending concentrations. Higher allowances for loan losses and capital levels may also be required. The Guidance is triggered when CRE loan concentrations exceed either:
|
● |
Total reported loans for construction, land development, and other land of 100% or more of a bank’s total risk based capital; or |
|
● |
Total reported loans secured by multifamily and nonfarm nonresidential properties and loans for construction, land development, and other land of 300% or more of a bank’s total risk based capital. |
The Guidance also applies when a bank has a sharp increase in CRE loans or has significant concentrations of CRE secured by a particular property type. We have always had exposures to loans secured by commercial real estate due to the nature of our markets and the loan needs of both retail and commercial customers. We believe our long term experience in CRE lending, underwriting policies, internal controls, and other policies currently in place, as well as our loan and credit monitoring and administration procedures, are generally appropriate to managing our concentrations as required under the Guidance.
Community Reinvestment Act. The Bank is subject to the provisions of the Community Reinvestment Act (“CRA”), which imposes a continuing and affirmative obligation, consistent with their safe and sound operation, to help meet the credit needs of entire communities where the bank accepts deposits, including low- and moderate-income neighborhoods. The FDIC’s assessment of the Bank’s CRA record is made available to the public. Further, a less than satisfactory CRA rating will slow, if not preclude, expansion of banking activities and prevent a company from becoming or remaining a financial holding company. Following the enactment of the Gramm-Leach-Bliley Act (“GLB”), CRA agreements with private parties must be disclosed and annual CRA reports must be made to a bank’s primary federal regulator. A bank holding company will not be permitted to become or remain a financial holding company and no new activities authorized under GLB may be commenced by a holding company or by a bank financial subsidiary if any of its bank subsidiaries received less than a “satisfactory” CRA rating in its latest CRA examination. Federal CRA regulations require, among other things, that evidence of discrimination against applicants on a prohibited basis, and illegal or abusive lending practices be considered in the CRA evaluation. The Bank has a rating of “Satisfactory” in its most recent CRA evaluation.
Privacy and Data Security. The GLB generally prohibits disclosure of consumer information to non-affiliated third parties unless the consumer has been given the opportunity to object and has not objected to such disclosure. Financial institutions are further required to disclose their privacy policies to customers annually. Financial institutions, however, will be required to comply with state law if it is more protective of consumer privacy than the GLB. The GLB also directed federal regulators, including the FDIC, to prescribe standards for the security of consumer information. The Bank is subject to such standards, as well as standards for notifying customers in the event of a security breach. Under federal law, the Bank must disclose its privacy policy to consumers, permit customers to opt out of having nonpublic customer information disclosed to third parties in certain circumstances, and allow customers to opt out of receiving marketing solicitations based on information about the customer received from another subsidiary. States may adopt more extensive privacy protections. We are similarly required to have an information security program to safeguard the confidentiality and security of customer information and to ensure proper disposal. Customers must be notified when unauthorized disclosure involves sensitive customer information that may be misused.
Consumer Regulation. Activities of the Bank are subject to a variety of statutes and regulations designed to protect consumers. These laws and regulations include, among numerous other things, provisions that:
|
● |
limit the interest and other charges collected or contracted for by the Bank, including new rules respecting the terms of credit cards and of debit card overdrafts; |
|
● |
govern the Bank’s disclosures of credit terms to consumer borrowers; |
|
● |
require the Bank to provide information to enable the public and public officials to determine whether it is fulfilling its obligation to help meet the housing needs of the community it serves; |
|
● |
prohibit the Bank from discriminating on the basis of race, creed or other prohibited factors when it makes decisions to extend credit; |
|
● |
govern the manner in which the Bank may collect consumer debts; and |
|
● |
prohibit unfair, deceptive or abusive acts or practices in the provision of consumer financial products and services. |
Mortgage Regulation. The CFPB adopted a rule that implements the ability-to-repay and qualified mortgage provisions of the Dodd-Frank Act (the “ATR/QM rule”), which requires lenders to consider, among other things, income, employment status, assets, payment amounts, and credit history before approving a mortgage, and provides a compliance “safe harbor” for lenders that issue certain “qualified mortgages.” The ATR/QM rule defines a “qualified mortgage” to have certain specified characteristics, and generally prohibit loans with negative amortization, interest-only payments, balloon payments, or terms exceeding 30 years from being qualified mortgages. The rule also establishes general underwriting criteria for qualified mortgages, including that monthly payments be calculated based on the highest payment that will apply in the first five years of the loan and that the borrower have a total debt-to-income ratio that is less than or equal to 43%. While “qualified mortgages” will generally be afforded safe harbor status, a rebuttable presumption of compliance with the ability-to-repay requirements will attach to “qualified mortgages” that are “higher priced mortgages” (which are generally subprime loans). In addition, the securitizer of asset-backed securities must retain not less than 5% of the credit risk of the assets collateralizing the asset-backed securities, unless subject to an exemption for asset-backed securities that are collateralized exclusively by residential mortgages that qualify as “qualified residential mortgages.”
The CFPB has also issued rules to implement requirements of the Dodd-Frank Act pertaining to mortgage loan origination (including with respect to loan originator compensation and loan originator qualifications) as well as integrated mortgage disclosure rules. In addition, the CFPB has issued rules that require servicers to comply with new standards and practices with regard to: error correction; information disclosure; force-placement of insurance; information management policies and procedures; requiring information about mortgage loss mitigation options be provided to delinquent borrowers; providing delinquent borrowers access to servicer personnel with continuity of contact about the borrower’s mortgage loan account; and evaluating borrowers’ applications for available loss mitigation options. These rules also address initial rate adjustment notices for adjustable-rate mortgages (ARMs), periodic statements for residential mortgage loans, and prompt crediting of mortgage payments and response to requests for payoff amounts.
Non-Discrimination Policies. The Bank is also subject to, among other things, the provisions of the Equal Credit Opportunity Act (the “ECOA”) and the Fair Housing Act (the “FHA”), both of which prohibit discrimination based on race or color, religion, national origin, sex, and familial status in any aspect of a consumer or commercial credit or residential real estate transaction. The Department of Justice (the “DOJ”), and the federal bank regulatory agencies have issued an Interagency Policy Statement on Discrimination in Lending that provides guidance to financial institutions in determining whether discrimination exists, how the agencies will respond to lending discrimination, and what steps lenders might take to prevent discriminatory lending practices. The DOJ has increased its efforts to prosecute what it regards as violations of the ECOA and FHA.
Item 1A.
Risk Factors
Our operations and financial results are subject to various risks and uncertainties, including, but not limited to, the material risks described below. Many of these risks are beyond our control although efforts are made to manage those risks while simultaneously optimizing operational and financial results. The occurrence of any of the following risks, as well as risks of which we are currently unaware or currently deem immaterial, could materially and adversely affect our assets, business, cash flows, condition (financial or otherwise), liquidity, prospects, results of operations and the trading price of our common stock. It is impossible to predict or identify all such factors and, as a result, you should not consider the following factors to be a complete discussion of the risks, uncertainties and assumptions that could materially and adversely affect our assets, business, cash flows, condition (financial or otherwise), liquidity, prospects, results of operations and the trading price of our common stock.
In addition, certain statements in the following risk factors constitute forward-looking statements. Please refer to the section entitled “Cautionary Note Regarding Forward-Looking Statements” beginning on page 1 of this Annual Report.
Strong competition and changing banking environment may limit growth and profitability.
Competition in the banking and financial services industry is intense. We compete with commercial banks, savings institutions, mortgage brokerage firms, credit unions, finance companies, mutual funds, insurance companies, brokerage and investment banking firms operating locally and elsewhere, and non-traditional financial institutions, including non-depository financial services providers. Many of these competitors (whether regional or national institutions) have substantially greater resources and lending limits than we have and may offer certain services that we do not or cannot provide. Additionally, non-traditional financial institutions may not have the same regulatory requirements or burdens as we do, despite playing a rapidly increasing role in the financial services industry including providing services previously limited to commercial banks. Such competition could ultimately limit our growth, profitability and shareholder value. Our profitability depends upon our ability to successfully compete in our market areas and adapt to the ever changing banking environment.
Any future economic downturn could have a material adverse effect on our capital, financial condition, results of operations, and future growth.
Our management continually monitors market conditions and economic factors throughout our footprint, especially in light of the recent economic downturn, and we cannot make any assurance that these economic conditions - both nationally and in our principal markets - will not worsen in the future. If these conditions were to worsen, then we could see a sharp increase in our total net charge-offs and also be required to significantly increase our allowance for loan losses. Furthermore, the demand for loans and our other products and services could decline. Any future increase in our non-performing assets and related increases in our provision for loan losses, coupled with a potential decrease in the demand for loans and our other products and services, could negatively affect our business and could have a material adverse effect on our capital, financial condition, results of operations and future growth.
Governmental responses to market disruptions and other events may be inadequate and may have unintended consequences.
Congress and financial regulators may implement measures designed to stabilize financial markets in periods of disruption. The overall impact of these efforts on the financial markets may be unclear and could adversely affect our business. We compete with a number of financial services companies that are not subject to the same degree of regulatory oversight. The impact of the existing regulatory framework and any future changes to it could negatively affect our ability to compete with these institutions, which could have a material adverse effect on our results of operations and prospects.
We may need to rely on the financial markets to provide needed capital.
Our common stock is listed and traded on the NASDAQ Global Market. If our capital resources prove in the future to be inadequate to meet our capital requirements, we may need to raise additional debt or equity capital. If conditions in the capital markets are not favorable, we may be constrained in raising capital, and an inability to raise additional capital on acceptable terms when and if needed could have a material adverse effect on our business, financial condition or results of operations.
The interest rates that we pay on our securities are also influenced by, among other things, the credit ratings that we, our affiliates and/or our securities receive from recognized rating agencies. Our credit ratings are based on a number of factors, including our financial strength and some factors not entirely within our control such as conditions affecting the financial services industry generally, and remain subject to change at any time. A downgrade to the credit rating of us or our affiliates could affect our ability to access the capital markets, increase our borrowing costs and negatively impact our profitability. A downgrade to us, our affiliates or our securities could create obligations or liabilities to us under the terms of our outstanding securities that could increase our costs or otherwise have a negative effect on our results of operations or financial condition. Additionally, a downgrade to the credit rating of any particular security issued by us or our affiliates could negatively affect the ability of the holders of that security to sell the securities and the prices at which any such securities may be sold.
Because our decision to incur debt and issue securities in future offerings will depend on market conditions and other factors beyond our control, we cannot predict or estimate the amount, timing or nature of our future offerings and debt financings. Further, market conditions could require us to accept less favorable terms for the issuance of our securities in the future. In addition, geopolitical and worldwide market conditions may cause disruption or volatility in the U.S. equity and debt markets, which could hinder our ability to issue debt and equity securities in the future on favorable terms.
A reduction in consumer confidence could negatively impact our results of operations and financial condition.
Individual, economic, political, industry-specific conditions and other factors outside of our control, such as real estate values or other factors that affect customer income levels, could alter anticipated customer behavior, including borrowing, repayment, investment and deposit practices. Such a change in these practices could materially adversely affect our ability to anticipate business needs and meet regulatory requirements. Further, difficult economic conditions may negatively affect consumer confidence levels. A decrease in consumer confidence levels would likely aggravate the adverse effects of these difficult market conditions on us, our customers and others in the financial institutions industry.
Our business may be adversely affected by downturns in our national and local economies and our concentration in Georgia make us vulnerable to local weather catastrophes, public health issues, and other external events, which could adversely affect our results of operations and financial condition.
Our operations are significantly affected by national and local economic conditions. Substantially all of our loans are to businesses and individuals in Georgia, and all of our branches and most of our deposit customers are also located in this area. As a result, local economic conditions significantly affect the demand for loans and other products we offer to our customers (including real estate, commercial and construction loans), the ability of borrowers to repay these loans and the value of the collateral securing these loans. A decline in the economies in which we operate could have a material adverse effect on our business, financial condition and results of operations.
A deterioration in economic conditions in the market areas we serve could result in the following consequences, any of which could have a material adverse effect on our business, financial condition and results of operations:
|
|
● |
Demand for our loans, deposits and services may decline; |
|
|
● |
Loan delinquencies, problem assets and foreclosures may increase; |
|
|
● |
Weak economic conditions may continue to limit the demand for loans by creditworthy borrowers, limiting our capacity to leverage our retail deposits and maintain our net interest income; |
|
|
● |
Collateral for our loans may decline further in value; and |
|
|
● |
The amount of our low-cost or non-interest bearing deposits may decrease. |
Changes in interest rates and in the policies of monetary authorities and other government action could adversely affect our results of operations and financial condition.
Interest rates and our financial performance are affected by credit policies of monetary authorities, particularly the Federal Reserve. The instruments of monetary policy employed by the Federal Reserve include open market transactions in U.S. government securities, changes in the discount rate or the federal funds rate on bank borrowings and changes in reserve requirements against bank deposits. In view of changing conditions in the national economy and in the money markets, we cannot predict the potential impact of future changes in interest rates, deposit levels, and loan demand on our business and earnings. Furthermore, the actions of the U.S. government and other governments may result in currency fluctuations, exchange controls, market disruption, material decreases in the values of certain of our financial assets and other adverse effects.
Our results of operations and financial condition are significantly affected by changes in interest rates. Our results of operations depend substantially on our net interest income, which is the difference between the interest income we earn on our interest-earning assets, such as loans and securities, and the interest expense we pay on our interest-bearing liabilities, such as deposits and borrowings. Because our interest-bearing liabilities generally reprice or mature more quickly than our interest-earning assets, a sustained increase in interest rates generally would tend to reduce our interest income.
The Federal Reserve raised rates nine times during 2015-2018, and reduced rates three times in 2019. Further rate changes reportedly are dependent on the Federal Reserve’s assessment of economic data as it becomes available. If interest rates continue to decline, our net interest income may decrease. In addition, a decrease in interest rates could negatively impact our margins and profitability. As the Federal Reserve Board increases the Fed Funds rate, overall interest rates have also risen, which may negatively impact the U.S. economy. Further, changes in monetary policy, including changes in interest rates, could influence (i) the amount of interest we receive on loans and securities, (ii) the amount of interest we pay on deposits and borrowings, (iii) our ability to originate loans and obtain deposits, (iv) the fair value of our assets and liabilities, and (v) the reinvestment risk associated with changes in the duration of our mortgage-backed securities portfolio. When interest-bearing liabilities reprice or mature more quickly than interest-earning assets, an increase in interest rates generally would tend to result in a decrease in net interest income.
Changes in interest rates also affect the current fair value of our interest-earning securities portfolio. Generally, the value of securities moves inversely with changes in interest rates. At December 31, 2019, the fair value of our portfolio of investment securities totaled $347.3 million. Net unrealized gains on these securities totaled $458,000 at December 31, 2019.
Additionally, 39.4% of our one- to four-family loan portfolio is comprised of adjustable-rate loans. Any rise in market interest rates may result in increased payments for borrowers who have adjustable-rate mortgage loans, which would increase the possibility of default.
Although management believes it has implemented an effective asset and liability management strategy to manage the potential effects of changes in interest rates, including the use of adjustable rate and/or short-term assets, and FHLB advances or longer term repurchase agreements, any substantial, unexpected, prolonged change in market interest rates could have a material adverse effect on our financial condition and results of our operation and/or our strategies may not always be successful in managing the risk associated with changes in interest rates.
Interest rates on our outstanding financial instruments might be subject to change based on developments related to LIBOR, which could adversely affect our revenue, expenses, and the value of our financial instruments.
On July 27, 2017, the United Kingdom’s Financial Conduct Authority, which regulates LIBOR, publicly announced that it intends to stop persuading or compelling banks to submit LIBOR rates after 2021. U.S. regulatory authorities have voiced similar support for phasing out LIBOR. It is unclear whether, at that time, LIBOR will cease to exist or if new methods of calculating LIBOR will be established, and no consensus exists at this time as to what benchmark rate or rates may become accepted alternatives to LIBOR. In the U.S., efforts to identify a set of alternative U.S. dollar reference interest rates include proposals by the Alternative Reference Rates Committee of the Federal Reserve and the Federal Reserve Bank of New York and its Secured Overnight Finance Rate (“SOFR”) as an alternative to LIBOR. SOFR is a broad measure of the cost of borrowing cash in the overnight U.S. treasury repurchase market. At this time, it is impossible to predict whether SOFR or another reference rate will become an accepted alternative to LIBOR.
The uncertainty regarding the future of LIBOR as well as the transition from LIBOR to another benchmark rate or rates is complex and could have a range of adverse effects on our business, financial condition and results of operations. In particular, any such transition could:
|
● |
adversely affect the interest rates paid or received on, and the revenue and expenses associated with, and the value of Colony’s floating rate obligations, loans, deposits, derivatives and other financial instruments tied to LIBOR rates, or other securities or financial arrangements given LIBOR’s role in determining market interest rates globally; |
|
● |
prompt inquiries or other actions from regulators in respect of our preparation and readiness for the replacement of LIBOR with an alternative reference rate; |
|
● |
result in disputes, litigation or other actions with counterparties regarding the interpretation and enforceability of certain fallback language, or the absence of such language, in LIBOR-based securities and loans; |
|
● |
result in customer uncertainty and disputes around how variable rates should be calculated in light of the foregoing, thereby damaging our reputation and resulting in a loss of customers and additional costs to us; and |
|
● |
require the transition to or development of appropriate systems and analytics to effectively transition Colony’s risk management processes from LIBOR-based products to those based on the applicable alternative pricing benchmark, such as SOFR. |
The manner and impact of this transition, as well as the effect of these developments on Colony’s funding costs, loan, and investment and trading securities portfolios, asset liability management and business is uncertain.
Our allowance for loan losses may not cover actual losses, and we may be required to materially increase our allowance, which may adversely affect our capital, financial condition and results of operations.
We derive the most significant portion of our revenues from our lending activities. When we lend money, commit to lend money or enter into a letter of credit or other contract with a counterparty, we incur credit risk, which is the risk of losses if our borrowers do not repay their loans or our counterparties fail to perform according to the terms of their contracts. We estimate and maintain an allowance for loan losses, which is a reserve established through a provision for loan losses charged to expenses, which represents management's best estimate of probable credit losses that have been incurred within the existing portfolio of loans, as described under Note 5 of Notes to Consolidated Financial Statements in this Report and under “Allowance for Loan Losses” under “Part II - Item 7. Management's Discussion and Analysis of Financial Condition and Results of Operations” of this Report.
The allowance, in the judgment of management, is established to reserve for estimated loan losses and risks inherent in the loan portfolio. The determination of the appropriate level of the allowance for loan losses inherently involves a high degree of subjectivity and requires us to make significant estimates of current credit risks using existing qualitative and quantitative information, all of which may undergo material changes. Changes in economic conditions affecting borrowers, new information regarding existing loans, identification of additional problem loans, risk ratings, and other factors, both within and outside of our control, may require an increase in the allowance for loan losses.
Because the risk rating of the loans is dependent on some subjective information and subject to changes in the borrower's credit risk profile, evolving local market conditions and other factors, it can be difficult for us to predict the effects that those factors will have on the classifications assigned to the loan portfolio, and thus difficult to anticipate the velocity or volume of the migration of loans through the classification process and effect on the level of the allowance for loan losses. An increase in the allowance for loan losses would result in a decrease in net income and capital, and could have a material adverse effect on our capital, financial condition and results of operations. Accordingly, we monitor our credit quality and our reserve requirements and use that as a basis for capital planning and other purposes. See “Item 7. Management's Discussion and Analysis of Financial Condition and Results of Operations – Capital Requirements” of this Report for further information.
Our commercial real estate, real estate construction, and commercial business loans increase our exposure to credit risks.
Over the last several years, we have increased our non-residential lending in order to improve the yield and reduce the average duration of our assets. At December 31, 2019, our portfolio of commercial real estate and commercial, financial and agricultural loans totaled $750.7 million, or 77.5% of total loans compared $570.4 million, or 73.0% of total loans of total loans at December 31, 2018. At December 31, 2019, the amount of nonperforming commercial real estate and commercial, financial and agricultural loans was $5.4 million, or 58.8% of total nonperforming loans. These loans may expose us to a greater risk of non-payment and loss than residential real estate loans because, in the case of commercial loans, repayment often depends on the successful operation and earnings of the borrower's businesses and, in the case of consumer loans, the applicable collateral is subject to rapid depreciation. Additionally, commercial real estate loans typically involve larger loan balances to single borrowers or groups of related borrowers compared to residential real estate loans. If loans that are collateralized by real estate become troubled and the value of the real estate has been significantly impaired, then we may not be able to recover the full contractual amount of principal and interest due on the loan, which could cause us to increase our provision for loan losses and adversely affect our financial condition and operating results.
We hold certain intangible assets that in the future could be classified as either partially or fully impaired, which would reduce our earnings and the book values of these assets.
Pursuant to applicable accounting requirements, we are required to periodically test our goodwill and core deposit intangible assets for impairment. The impairment testing process considers a variety of factors, including the current market price of our common shares, the estimated net present value of our assets and liabilities and information concerning the terminal valuation of similarly situated insured depository institutions. Future impairment testing may result in a partial or full impairment of the value of our goodwill or core deposit intangible assets, or both. If an impairment determination is made in a future reporting period, our earnings and the book value of these intangible assets will be reduced by the amount of the impairment.
Acquisitions could disrupt our business and adversely affect our operating results.
To the extent that we grow through acquisitions, we may not be able to adequately or profitably manage this growth. In addition, such acquisitions may involve the issuance of securities, which may have a dilutive effect on earnings per share. Acquiring banks, bank branches or businesses involves risks commonly associated with acquisitions, including:
|
● |
Potential exposure to unknown or contingent liabilities we acquire; |
|
● |
Exposure to potential asset quality problems of the acquired financial institutions, businesses or branches; |
|
● |
Difficulty and expense of integrating the operations and personnel of financial institutions, businesses or branches we acquire; |
|
● |
Higher than expected deposit attrition; |
|
● |
Potential diversion of our management’s time and attention; |
|
● |
The possible loss of key employees and customers of financial institutions, businesses or branches we acquire; |
|
● |
Difficulty in safely investing any cash generated by the acquisition; |
|
● |
Inability to utilize potential tax benefits from such transactions; |
|
● |
Difficulty in estimating the fair value of the financial institutions, businesses or branches to be acquired which affects the profits we generate from the acquisitions; and |
|
● |
Potential changes in banking or tax laws or regulations that may affect the financial institutions or businesses to be acquired. |
Reductions in service charge income or failure to comply with payment network rules could negatively impact our earnings.
We derive significant revenue from service charges on deposit accounts, the bulk of which comes from overdraft-related fees. Changes in banking regulations could have an adverse impact on our ability to derive income from service charges. Increased competition from other financial institutions or changes in consumer behavior could lead to declines in our deposit balances, which would result in a decline in service charge fees. Such a reduction could have a material impact on our earnings.
Reductions in interchange income could negatively impact our earnings.
Interchange income is derived from fees paid by merchants to the interchange network in exchange for the use of the network's infrastructure and payment facilitation. These fees are paid to card issuers to compensate them for the costs associated with issuance and operation. We earn interchange fees on card transactions from debit cards, including $3.8 million during the year ended December 31, 2019. Merchants have attempted to negotiate lower interchange rates, and the Durbin Amendment to the Dodd-Frank Act limits the amount of interchange fees that may be charged for certain debit card transactions. Merchants may also continue to pursue alternative payment platforms, such as Apple Pay, to lower their processing costs. Any such new payment system may reduce our interchange income. Our failure to comply with the operating regulations set forth by payment card networks, which may change, could subject us to penalties, fees or the termination of our license to use the networks. Any of these scenarios could have a material impact on our business, financial condition and results of operations.
Because the nature of the financial services business involves a high volume of transactions, we face significant operational risks.
We are exposed to many types of operation risks, including reputational risk, legal and regulatory and compliance risk, the risk of fraud, theft, illegal, wrongful or suspicious activities, and/or activities resulting in consumer harm that adversely affects our customers and/or our business by employees or persons outside our Company, including the execution of unauthorized transactions by employees or operational errors, clerical or record-keeping errors or those resulting from faulty or disabled computer or telecommunications systems. The precautions we take to detect and prevent such misconduct may not always be effective and regulatory sanctions and/or penalties, serious harm to our reputation, financial condition, customer relationships and ability to attract new customers. In addition, improper use or disclosure of confidential information by our employees, even if inadvertent, could result in serious harm to our reputation, financial condition and current and future business relationships. The precautions we take to detect and prevent such misconduct may not always be effective. Actual or alleged conduct by Colony Bank can result in negative public opinion about our business. Negative public opinion can result from our actual or alleged conduct in any number of activities, including lending practices, corporate governance and acquisitions and from actions taken by government regulators and community organizations in response to those activities. Negative public opinion can adversely affect our ability to attract and keep customers and can expose us to litigation and regulatory action. Negative public opinion could also affect our credit ratings, which are important to our access to unsecured wholesale borrowings.
Our business involves storing and processing sensitive consumer and business customer data. If personal, non-public, confidential or proprietary information of customers in our possession were to be mishandled or misused, we could suffer significant regulatory consequences, reputational damage and financial loss. Such mishandling or misuse could include, for example, if such information were erroneously provided to parties who were not permitted to have that information, either by fault of our systems, employees, or counterparties, or where such information is intercepted or otherwise inappropriately taken by third parties. Furthermore, a cybersecurity breach could result in theft of such data.
Because we operate in diverse markets and rely on the ability of our employees and systems to process a high number of transactions, certain errors may be repeated or compounded before they are discovered and successfully rectified. Our necessary dependence upon automated systems to record and process transactions, and our large transaction volume, may further increase the risk that technical flaws or employee tampering or manipulation of those systems will result in losses that are difficult to detect. We also may be subject to disruptions of our operating systems arising from events that are wholly or partially beyond our control (for example, security breaches, denial of service attacks, viruses, worms and other disruptive problems caused by hackers, computer break-ins, phishing and other disruptions or electrical or telecommunications outages, or natural disasters, disease pandemics or other damage to property or physical assets) which may result in violations of consumer privacy laws including the Gramm-Leach-Bliley Act, cause significant liability to us and give reason for existing and potential customers to refrain from doing business with us. Although we, with the help of third-party service providers, intend to continue to implement security technology and establish operational procedures to prevent such damage and potential liability, there can be no assurance that these security measures will be successful. In addition, advances in computer capabilities, new discoveries in the field of cryptography or other developments could result in a compromise or breach of the algorithms we and our third-party service providers use to encrypt and protect customer transaction data. We are further exposed to the risk that our external vendors may be unable to fulfill their contractual obligations (or will be subject to the same risk of fraud or operational errors by their respective employees as we are) and to the risk that our (or our vendors’) business continuity and data security systems prove to be inadequate. The occurrence of any of these risks could result in a diminished ability of us to operate our business (for example, by requiring us to expend significant resources to correct the defect), as well as potential liability to clients, reputational damage and regulatory intervention, which could adversely affect our business, financial condition or operations results, perhaps materially.
As an issuer of debit cards, we are exposed to losses in the event that holders of our cards experience fraud on their card accounts.
Our customers regularly use Colony Bank-issued debit cards to pay for transactions with retailers and other businesses. There is the risk of data security breaches at these retailers and other businesses that could result in the misappropriation of our customers’ debit card information. When our customers use Colony Bank-issued cards to make purchases from those businesses, card account information is provided to the business. If the business’s systems that process or store card account information are subject to a data security breach, holders of our cards who have made purchases from that business may experience fraud on their card accounts. Colony Bank may suffer losses associated with reimbursing our customers for such fraudulent transactions on customers’ card accounts, as well as for other costs related to data security compromise events, such as replacing cards associated with compromised card accounts.
The financial services market is undergoing rapid technological changes, and if we are unable to stay current with those changes, we will not be able to effectively compete.
The financial services market, including banking services, is undergoing rapid changes with frequent introductions of new technology-driven products and services. Our future success will depend, in part, on our ability to keep pace with the technological changes and to use technology to satisfy and grow customer demand for our products and services and to create additional efficiencies in our operations. We expect that we will need to make substantial investments in our technology and information systems to compete effectively and to stay current with technological changes. Some of our competitors have substantially greater resources to invest in technological improvements and will be able to invest more heavily in developing and adopting new technologies, which may put us at a competitive disadvantage.
We may not be able to effectively implement new technology-driven products and services or be successful in marketing these products and services to our customers. As a result, our ability to effectively compete to retain or acquire new business may be impaired, and our business, financial condition or results of operations may be adversely affected.
The implementation of other new lines of business or new products and services may subject us to additional risk.
We continuously evaluate our service offerings and may implement new lines of business or offer new products and services within existing lines of business in the future. There are substantial risks and uncertainties associated with these efforts. In developing and marketing new lines of business and/or new products and services, we undergo a new product process to assess the risks of the initiative, and invest significant time and resources to build internal controls, policies and procedures to mitigate those risks, including hiring experienced management to oversee the implementation of the initiative. Initial timetables for the introduction and development of new lines of business and/or new products or services may not be achieved and price and profitability targets may not prove feasible. External factors, such as compliance with regulations, competitive alternatives, and shifting market preferences, may also impact the successful implementation of a new line of business and/or a new product or service. Furthermore, any new line of business and/or new product or service could require the establishment of new key and other controls and have a significant impact on our existing system of internal controls. Failure to successfully manage these risks in the development and implementation of new lines of business and/or new products or services could have a material adverse effect on our business and, in turn, our financial condition and results of operations.
Any deficiencies in our financial reporting or internal controls could materially and adversely affect us, including resulting in material misstatements in our financial statements, and could materially and adversely affect the market price of our common stock.
If we fail to maintain effective internal controls over financial reporting, our operating results could be harmed and it could result in a material misstatement in our financial statements in the future. Inferior controls and procedures or the identification of accounting errors could cause our investors to lose confidence in our internal controls and question our reported financial information, which, among other things, could have a negative impact on the trading price of our common stock. Additionally, we could become subject to increased regulatory scrutiny and a higher risk of shareholder litigation, which could result in significant additional expenses and require additional financial and management resources.
We face significant cyber and data security risk that could result in the dissemination of confidential and sensitive information, adversely affecting our business or reputation and exposing us to material liabilities.
Our business model enables our customers to utilize the internet and other remote channels to transact business. As a financial institution, we are under continuous threat of loss due to the swiftness and sophistication of hacking and cyber-attacks. This risk, although considerable at the present, will only increase in the future. Two of the most significant cyber-attack risks that we face are electronic fraud and loss of sensitive customer data. Loss from electronic fraud occurs when cybercriminals breach and extract funds directly from customer accounts or our own accounts. The attempts to breach sensitive customer data, such as account numbers, social security numbers, or other personal information are less frequent but would present significant legal and/or regulatory costs to us if successful, as well as potentially damage our reputation among the markets we serve. Our risk and exposure to these matters will remain relevant because of the evolving nature and complexity of the threats posed by cybercriminals and hackers along with our plans to continue to provide internet banking and mobile banking avenues for transacting business. While we have not experienced material losses relating to cyber-attacks or other information security breaches to date, we have been the subject of attempted hacking and cyber-attacks and there can be no assurance that we will not suffer such losses in the future.
The occurrence of any cyber-attack or information security breach could result in material adverse consequences including damage to our reputation and the loss of current or potential customers. We also could face litigation or additional regulatory scrutiny due to such an occurrence. Litigation or regulatory actions in turn could lead to material liability, including, but not limited to, fines and penalties or reimbursement to customers adversely affected by a data breach. Even if we do not suffer any material adverse consequences as a result of events affecting us directly, successful attacks or systems failures at other financial institutions could lead to a general loss of customer confidence in our Company.
We continually review our network and systems security and make the necessary investments to improve the resiliency of our systems and their security from attack. Nonetheless, there remains the risk that we may be materially harmed by a cyber-attack or information security breach. Methods used to attack information systems continue to evolve in sophistication, swiftness, and frequency and can occur from a variety of sources, such as foreign governments, hacktivists, or other well-financed entities, and may originate from remote and less regulated areas of the world. If such an attack or breach were to occur, we might not be able to address and find a solution in a timely and adequate manner. We will, however, promptly take reasonable and customary measures to address the situation.
We may be alleged to have infringed upon intellectual property rights owned by others, or may be unable to protect our intellectual property.
Competitors or other third parties may allege that we, or consultants or other third parties retained or indemnified by us, infringe on their intellectual property rights. We also may face allegations that our employees have misappropriated intellectual property of their former employers or other third parties. Given the complex, rapidly changing and competitive technological and business environment in which we operate, and the potential risks and uncertainties of intellectual property-related litigation, an assertion of an infringement claim against us may cause us to spend significant amounts to defend the claim (even if we ultimately prevail); to pay significant money damages; to lose significant revenues; to be prohibited from using the relevant systems, processes, technologies or other intellectual property; to cease offering certain products or services or to incur significant license, royalty or technology development expenses. Moreover, it has become common in recent years for individuals and groups to purchase intellectual property assets for the sole purpose of making claims of infringement and attempting to extract settlements from companies like ours. Even in instances where we believe that claims and allegations of intellectual property infringement against us are without merit, defending against such claims is time consuming and expensive and could result in the diversion of time and attention of our management and employees. In addition, although in some cases a third party may have agreed to indemnify us for such costs, such indemnifying party may refuse, or be unable, to uphold its contractual obligations.
Moreover, we rely on a variety of measures to protect our intellectual property and proprietary information, including copyrights, trademarks and controls on access and distribution. These measures may not prevent misappropriation or infringement of our intellectual property or proprietary information and a resulting loss of competitive advantage, and in any event, we may be required to litigate to protect our intellectual property and proprietary information from misappropriation or infringement by others, which is expensive, could cause a diversion of resources and may not be successful. Third parties may challenge, invalidate or circumvent our intellectual property, or our intellectual property may not be sufficient to provide us with competitive advantages. In addition, the usage of branding that could be confused with ours could create negative perceptions and risks to our brand and reputation. Our competitors or other third parties may independently design around or develop technology similar to ours or otherwise duplicate our services or products such that we could not assert our intellectual property rights against them. In addition, our contractual arrangements may not effectively prevent disclosure of our intellectual property or confidential and proprietary information or provide an adequate remedy in the event of an unauthorized disclosure.
As a community bank, our recruitment and retention efforts may not be sufficient enough to implement our business strategy and execute successful operations.
Our financial success depends upon our ability to attract and retain highly motivated, well-qualified personnel. We face significant competition in the recruitment of qualified employees from financial institutions and others. As we continue to grow, we may find our recruitment and retention efforts more challenging. If we do not succeed in attracting, hiring, and integrating experienced or qualified personnel, we may not be able to successfully implement our business strategy, and we may be required to substantially increase our overall compensation or benefits to attract and retain such employees. Furthermore, in June 2010, the Federal Reserve, the Office of the Comptroller of the Currency, the Office of Thrift Supervision, and the FDIC jointly issued comprehensive final guidance designed to ensure that incentive compensation policies do not undermine the safety and soundness of banking organizations by encouraging employees to take imprudent risks. This regulation significantly restricts the amount, form, and context in which we pay incentive-based compensation and may put us at a competitive disadvantage compared to non-financial institutions in terms of attracting and retaining senior level employees.
We are a community bank and our ability to maintain our reputation is critical to the success of our business and the failure to do so may materially adversely affect our performance.
Our reputation is one of the most valuable components of our business. As such, we strive to conduct our business in a manner that enhances our reputation. This is done, in part, by recruiting, hiring and retaining employees who share our core values of being an integral part of the communities we serve, delivering superior service to our customers and caring about our customers and associates. If our reputation is negatively affected, by the actions of our employees or otherwise, our business and, therefore, our operating results may be materially adversely affected.
We rely on third-party vendors for key components of our business.
Many key components of our operations, including data processing, recording and monitoring transactions, online interfaces and services, internet connections and network access are provided by other companies. Our vendor management process selects third-party vendors carefully, but we do not control their actions. Problems, including disruptions in communication, security breaches, or failure of a vendor to provide services, could hurt our operations or our relationships with customers. If our vendors suffer financial or operational issues, our operations and reputation could suffer if it harms the vendors’ ability to serve us and our customers. Third-party vendors are also a source of operational and information security risk to us. Replacing or renegotiating contracts with vendors could entail significant operational expense and delays. The use of third-party vendors represents an unavoidable inherent risk to our Company.
Hurricanes or other adverse weather events would negatively affect our local economies or disrupt our operations, which would have an adverse effect on our business or results of operations.
Our market area is located in the southeastern region of the United States and is susceptible to natural disasters, such as hurricanes, tornadoes, tropical storms, other severe weather events and related flooding and wind damage, and man-made disasters. These natural disasters could negatively impact regional economic conditions, cause a decline in the value or destruction of mortgaged properties and an increase in the risk of delinquencies, foreclosures or loss on loans originated by us, damage our banking facilities and offices and negatively impact our growth strategy. Climate change may be increasing the nature, severity and frequency of adverse weather conditions, making the impact from these types of natural disasters on us or our customers worse. Such weather events can disrupt operations, result in damage to properties and negatively affect the local economies in the markets where they operate. We cannot predict whether or to what extent damage that may be caused by future hurricanes or tornadoes will affect our operations or the economies in our current or future market areas, but such weather events could negatively impact economic conditions in these regions and result in a decline in local loan demand and loan originations, a decline in the value or destruction of properties securing our loans and an increase in delinquencies, foreclosures or loan losses. Our business or results of operations may be adversely affected by these and other negative effects of natural or man-made disasters.
The effects of widespread public health emergencies may negatively affect our local economies or disrupt our operations, which would have an adverse effect on our business or results of operations.
Widespread health emergencies, such as the recent global COVID-19 pandemic, can disrupt our operations through their impact on our employees, clients and their businesses, and the communities in which we operate. Disruptions to our clients could result in increased risk of delinquencies, defaults, foreclosures and losses on our loans, negatively impact regional economic conditions, result in a decline in local loan demand, loan originations and deposit availability and negatively impact the implementation of our growth strategy. Any one or more of these developments could have a material adverse effect on our business, financial condition and results of operations.
We may be adversely affected by the soundness of other financial institutions.
Financial services institutions are interrelated as a result of trading, clearing, counterparty, or other relationships. We have exposure to many different industries and counterparties and routinely execute transactions with counterparties in the financial services industry, including commercial banks, brokers and dealers, investment banks, and other institutional clients. Many of these transactions expose us to credit risk in the event of a default by a counterparty or client. Any such losses could have a material adverse effect on our financial condition and results of operations.
Changes in U.S. trade policies and other factors beyond the Company's control, including the imposition of tariffs and retaliatory tariffs, may adversely impact its business, financial condition and results of operations.
In recent years, there has been discussion and dialogue regarding potential changes to U.S. trade policies, legislation, treaties and tariffs, including trade policies and tariffs affecting other countries, including China, the European Union, Canada and Mexico and retaliatory tariffs by such countries. Tariffs and retaliatory tariffs have been imposed, and additional tariffs and retaliation tariffs have been proposed. Such tariffs, retaliatory tariffs or other trade restrictions on products and materials that the Company's customers import or export, including among others, agricultural products, could cause the prices of its customers' products to increase, which could reduce demand for such products, or reduce its customer margins, and adversely impact their revenues, financial results and ability to service debt. This, in turn, could adversely affect the Company's financial condition and results of operations.
In addition, to the extent changes in the political environment have a negative impact on the Company or on the markets in which the Company operates its business, results of operations and financial condition could be materially and adversely impacted in the future. It remains unclear what the U.S. Administration or foreign governments will or will not do with respect to tariffs already imposed, additional tariffs that may be imposed, or international trade agreements and policies. A trade war or other governmental action related to tariffs or international trade agreements or policies has the potential to negatively impact the Company's and/or its customers' costs, demand for its customers' products, and/or the U.S. economy or certain sectors thereof and, thus, adversely impact the Company's business, financial condition and results of operations.
United Kingdom’s exit from the European Union (“Brexit”) could adversely affect financial markets generally.
The uncertainty regarding Brexit could adversely affect financial markets generally. While the Company has no direct loans to or deposits from foreign entities, the uncertain impact of Brexit on British and European businesses, financial markets, and related businesses in the United States could also adversely affect financial markets generally. The commercial soundness of many financial institutions may be closely interrelated as a result of relationships between the institutions. As a result, concerns about, or a default or threatened default by, one institution could lead to significant market-wide liquidity and credit problems, losses or defaults by other institutions. The Company’s business could be adversely affected directly by the default of another institution or if the financial services industry experiences significant market-wide liquidity and credit problems.
Tax law and regulatory changes could adversely affect our financial condition and results of operations.
The Tax Cuts and Jobs Act enacted in 2017 provided significant changes to U.S. corporate and individual tax laws. Future changes to tax laws, including a repeal of all or part of this Act, could significantly impact our business in the form of greater than expected income tax expense. Such changes may also negatively impact the financial condition of our customers and/or overall economic conditions.
Regulation of the financial services industry continues to undergo major changes, and future legislation could increase our cost of doing business or harm our competitive position.
The Dodd-Frank Act brought about a significant overhaul of many aspects of the regulation of the financial services industry, addressing, among other things, systemic risk, capital adequacy, deposit insurance assessments, consumer financial protection, interchange fees, derivatives, lending limits, mortgage lending practices, registration of investment advisors and changes among the bank regulatory agencies.
Major changes in the law could materially impact the profitability of our business, the value of assets we hold or the collateral available for our loans, require changes to business practices or force us to discontinue businesses and expose us to additional costs, taxes, liabilities, enforcement actions and reputational risk. We cannot fully predict the effect that compliance with changing laws or any implementing regulations will have on the Company’s or the Bank’s businesses or our ability to pursue future business opportunities, our financial condition or results of operations. See “Item 1. Business - Supervision and Regulation” of this Report for further information. We cannot predict whether new legislation will be enacted and, if enacted, the effect that it, or any regulations, would have on our business, financial condition, or results of operations.
New regulations could restrict our ability to originate and sell mortgage loans.
The Consumer Financial Protection Bureau has issued a rule designed to clarify for lenders how they can avoid monetary damages under the Dodd-Frank Act, which would hold lenders accountable for ensuring a borrower’s ability to repay a mortgage. Loans that meet this “qualified mortgage” definition will be presumed to have complied with the new ability-to-repay standard. Under the Consumer Financial Protection Bureau’s rule, a “qualified mortgage” loan must not contain certain specified features, including:
|
● |
Excessive upfront points and fees (those exceeding 3% of the total loan amount, less “bona fide discount points” for prime loans); |
|
● |
Interest-only payments; |
|
● |
Negative-amortization; and |
|
● |
Terms longer than 30 years. |
Also, to qualify as a “qualified mortgage,” a borrower’s total monthly debt-to-income ratio may not exceed 43%. Lenders must also verify and document the income and financial resources relied upon to qualify the borrower for the loan and underwrite the loan based on a fully amortizing payment schedule and maximum interest rate during the first five years, taking into account all applicable taxes, insurance and assessments. The Consumer Financial Protection Bureau’s rule on qualified mortgages could limit our ability or desire to make certain types of loans or loans to certain borrowers, or could make it more expensive/and or time consuming to make these loans, which could limit our growth or profitability.
Changes in laws and regulations and the cost of regulatory compliance with new laws and regulations may adversely affect our operations and our income.
Bank regulatory agencies, such as the FDIC, govern the activities in which we may engage, primarily for the protection of depositors, and not for the protection or benefit of potential investors. In addition, new laws and regulations are likely to increase our costs of regulatory compliance and costs of doing business, and otherwise affect our operations. New laws and regulations may significantly affect the markets in which we do business, the markets for and value of our loans and investments, the fees we can charge, and our ongoing operations, costs and profitability. For example, regulatory changes to our overdraft protection programs could decrease the amount of fees we receive for these services. We cannot fully predict the effect that changes in law or regulation will have on the Company’s or the Bank’s businesses or our ability to pursue future business opportunities, our financial condition or results of operations.
Changes in accounting policies or in accounting standards, including the implementation of Current Expected Credit Loss methodology, could materially affect how we report our financial condition and results of operations.
The preparation of consolidated financial statements in conformity with U.S generally accepted accounting principles (“GAAP”), including the accounting rules and regulations of the Securities and Exchange Commission and the FASB, requires management to make significant estimates and assumptions that impact our financial statements by affecting the value of our assets or liabilities and results of operations. Some of our accounting policies are critical because they require management to make difficult, subjective and complex judgments about matters that are inherently uncertain and because materially different amounts may be reported if different estimates or assumptions are used. If such estimates or assumptions underlying our financial statements are incorrect, our financial condition and results of operations could be adversely affected.
From time to time, the FASB and the Securities and Exchange Commission change the financial accounting and reporting standards or the interpretation of such standards that govern the preparation of our external financial statements. These changes are beyond our control, can be difficult to predict, may require extraordinary efforts or additional costs to implement and could materially impact how we report our financial condition and results of operations. Additionally, we may be required to apply a new or revised standard retrospectively, resulting in the restatement of prior period financial statements in material amounts.
The Financial Accounting Standards Board adopted a new accounting standard for determining the amount of our allowance for credit losses (ASU 2016-13 Financial Instruments - Credit Losses (Topic 326)) that will be effective for us January 1, 2023, referred to as Current Expected Credit Loss, or CECL. Implementation of CECL will require that we determine periodic estimates of lifetime expected future credit losses on loans in the allowance for loan and lease losses in the period when the loans are booked. We believe the adoption of ASU 2016-13 will not have a material impact to our current valuation of the allowance for loan and lease losses. The ongoing impact of CECL will be significantly influenced by the composition, characteristics and quality of our loan portfolio, as well as the prevailing economic conditions and forecasts utilized. Should these factors materially change, we may be required to increase or decrease our allowance for loan and lease losses, decreasing or increasing our net income, and introducing additional volatility into our net income.
Our management team’s strategies for the enhancement of shareholder value may not succeed.
Our management team is taking and considering actions to enhance shareholder value, including reviewing personnel, developing new products, issuing dividends and exploring acquisition opportunities. These actions may not enhance shareholder value. For example, holders of our common stock are only entitled to receive such dividends as our Board of Directors may declare out of funds legally available for such payments. We are not legally required to do so. Further, the Federal Reserve could decide at any time that paying any dividends on our common stock could be an unsafe or unsound banking practice. The reduction or elimination of dividends paid on our common stock could adversely affect the market price of our common stock.
An investment in our common stock is not an insured deposit.
An investment in our common stock is not a bank deposit and, therefore, is not insured against loss by the FDIC, any other deposit insurance fund or by any other public or private entity. Investment in our common stock is inherently risky for the reasons described herein, and is subject to the same market forces that affect the price of common stock in any company. As a result, if you acquire our common stock, you could lose some or all of your investment.
Our stock price may be volatile due to limited trading volume.
Our common stock is traded on the NASDAQ Global Market. However, the average daily trading volume in the Company’s common stock has been relatively small, averaging approximately 34 total trades per day during 2019. As a result, trades involving a relatively small number of shares may have a significant effect on the market price of the common stock, and it may be difficult for investors to acquire or dispose of large blocks of stock without significantly affecting the market price.
The costs and effects of litigation, investigations or similar matters involving us or other financial institutions or counterparties, or adverse facts and developments related thereto, could materially affect our business, operating results and financial condition.
We may be involved from time to time in a variety of litigation, investigations, inquiries or similar matters arising out of our business, including those described in “Item 3. Legal Proceedings” and "Item 8. Financial Statements and Supplementary Data" of this Report. We cannot predict the outcome of these or any other legal matters. We establish reserves for legal claims when payments associated with the claims become probable and the losses can be reasonably estimated. We may still incur legal costs for a matter even if we have not established a reserve. In addition, the actual cost of resolving a legal claim may be substantially higher than any amounts reserved for that matter. In addition, in the future, we may need to record additional litigation reserves with respect to these matters. Further, regardless of how these matters proceed, it could divert our management's attention and other resources away from our business. Our insurance may not cover all claims that may be asserted against it and indemnification rights to which we are entitled may not be honored, and any claims asserted against us, regardless of merit or eventual outcome, may harm our reputation. Should the ultimate judgments or settlements in any litigation or investigation significantly exceed our insurance coverage, they could have a material adverse effect on our business, financial condition and results of operations. In addition, premiums for insurance covering the financial and banking sectors are rising. We may not be able to obtain appropriate types or levels of insurance in the future, nor may we be able to obtain adequate replacement policies with acceptable terms or at historic rates, if at all. Finally, in recent years, a number of judicial decisions have upheld the right of borrowers to sue lending institutions on the basis of various evolving legal theories, collectively termed “lender liability.” Generally, lender liability is founded on the premise that a lender has either violated a duty, whether implied or contractual, of good faith and fair dealing owed to the borrower or has assumed a degree of control over the borrower resulting in the creation of a fiduciary duty owed to the borrower or its other creditors or shareholders. We could become subject to claims based on this or other evolving legal theories in the future.
Our stock price is subject to fluctuations, and the value of your investment may decline.
The trading price of our common stock is subject to wide fluctuations. The stock market in general, and the market for the stocks of commercial banks and other financial services companies in particular, has experienced significant price and volume fluctuations that sometimes have been unrelated or disproportionate to the operating performance of those companies. These broad market and industry factors may seriously harm the market price of our common stock, regardless of our operating performance, and the value of your investment may decline.
Our ability to deliver and pay dividends depends primarily upon the results of operations of our subsidiary Bank, and we may not pay, or be permitted to pay, dividends in the future.
We are a bank holding company that conducts substantially all of our operations through our subsidiary Bank. As a result, our ability to make dividend payments on our common stock will depend primarily upon the receipt of dividends and other distributions from the Bank. The ability of the Bank to pay dividends or make other payments to us, as well as our ability to pay dividends on our common stock, is limited by the Bank’s obligation to maintain sufficient capital and by other general regulatory restrictions on its dividends, which have tightened since the financial crisis. The Federal Reserve has stated that bank holding companies should not pay dividends from sources other than current earnings. If these requirements are not satisfied, we will be unable to pay dividends on our common stock. We may also decide to limit the payment of dividends even when we have the legal ability to pay them in order to retain earnings for use in our business, which could adversely affect the market value of our common stock. There can be no assurance of whether or when we may pay dividends in the future.
Securities analysts might not continue coverage on our common stock, which could adversely affect the market for our common stock.
The trading price of our common stock depends in part on the research and reports that securities analysts publish about us and our business. We do not have any control over these analysts, and they may not continue to cover our common stock. If securities analysts do not continue to cover our common stock, the lack of research coverage may adversely affect the market price of our common stock. If securities analysts continue to cover our common stock, and our common stock is the subject of an unfavorable report, the price of our common stock may decline. If one or more of these analysts cease to cover us or fail to publish regular reports on us, we could lose visibility in the financial markets, which could cause the price or trading volume of our common stock to decline.
Item 1B
Unresolved Staff Comments
None.
Item 2
Properties
The principal properties of the Company consist of the properties of the Bank. The Company's headquarters is located at 115 South Grant Street, Fitzgerald, Georgia 31750. The Bank currently operates thirty-three domestic banking offices and two corporate operations offices in Georgia. The Bank owns all of the banking offices occupied except one office in Valdosta, one office in Albany and one office in Douglas which are leased. In addition, the Company owns the corporate operation offices located in Fitzgerald, Georgia and Warner Robins Georgia. We believe that our banking offices are in good condition and are suitable and adequate to our needs.
Item 3
Legal Proceedings
The Company and its subsidiary may become parties to various legal proceedings arising from the normal course of business. As of December 31, 2019, there are no material pending legal proceedings to which Colony or its subsidiary are a party or of which any of its or its subsidiaries' assets or properties are subject.
Item 4
Mine Safety Disclosures
Not applicable.
Part II
Item 5
Market for the Registrant’s Common Equity, Related Stockholder Matters and Issuer Purchase of Equity Securities
Effective April 2, 1998, Colony Bankcorp, Inc. common stock is quoted on the NASDAQ Global Market under the symbol “CBAN.” Prior to this date, there was no public market for the common stock of the Company.
As of March 13, 2020, there were 9,498,783 shares of our common stock outstanding held by 984 holders of record.
During 2019, the Company paid $2.7 million in cash dividends on its common stock. During 2018, the Company paid $1.7 million in cash dividends on its common stock. We have no obligation to pay dividends and we may change our dividend policy at any time without notice to our shareholders. Any future determination to pay dividends to holders of our common stock will depend on our results of operations, financial condition, capital requirements, banking regulations, contractual restrictions and any other factors that our board of directors may deem relevant.
As a Georgia corporation, the Company is subject to certain restrictions on dividends under the Georgia Business Corporation Code. We are also subject to certain restrictions on the payment of cash dividends as a result of banking laws, regulations and policies. See “Item 1 – Business – Supervision and Regulation – Regulation of the Company – Payment of Dividends.”
Issuer Purchase of Equity Securities
The Company did not purchase any shares of the Company’s common stock during the quarter ended December 31, 2019.
Securities Authorized for Issuance Under Equity Compensation Plans
See the information included under Part III, Item 12, which is incorporated in response to this item by reference.
Performance Graph
The performance graph below compares the cumulative total shareholder return on the Company’s Common Stock with the cumulative total return on the equity securities of companies included in the NASDAQ Composite Index and the SNL Southeast Bank Index, measured at the last trading day of each year shown. The graph assumes an investment of $100 on December 31, 2014 through December 31, 2019, and assumes the reinvestment of dividends, if any. The performance graph represents past performance and should not be considered to be an indication of future performance.
|
Colony Bankcorp, Inc. |
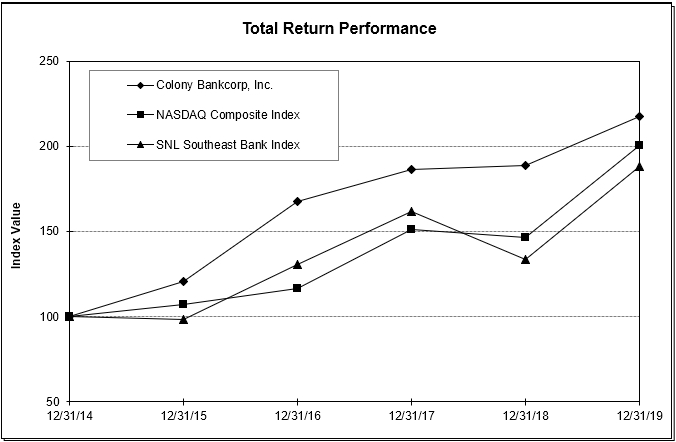
|
Period Ending |
||||||||||||||||||||||||
|
Index |
12/31/14 |
12/31/15 |
12/31/16 |
12/31/17 |
12/31/18 |
12/31/19 |
||||||||||||||||||
|
Colony Bankcorp, Inc. |
100.00 | 120.94 | 167.51 | 186.65 | 188.94 | 217.51 | ||||||||||||||||||
|
NASDAQ Composite Index |
100.00 | 106.96 | 116.45 | 150.96 | 146.67 | 200.49 | ||||||||||||||||||
|
SNL Southeast Bank Index |
100.00 | 98.44 | 130.68 | 161.65 | 133.56 | 188.08 | ||||||||||||||||||
Source: S&P Global Market Intelligence
Pursuant to the regulations of the SEC, this performance graph is not “soliciting material,” is not deemed filed with the SEC and is not to be incorporated by reference in any filing of the Company under the Securities Act or the Exchange Act.
Item 6
Selected Financial Data
The following table sets forth selected historical consolidated financial data of the Company as of and for each of the years ended December 31, 2019, 2018, 2017, 2016 and 2015, and is derived from our audited consolidated financial statements. This information should be read in conjunction with “Item 7 – Management’s Discussion and Analysis of Financial Condition and Results of Operations” and “Item 8 – Financial Statements and Supplementary Data” of this report. Our historical results for any prior period are not necessarily indicative of results to be expected in any future period.
|
Year Ended December 31, |
||||||||||||||||||||
|
2019 |
2018 |
2017 |
2016 |
2015 |
||||||||||||||||
|
(dollars in thousands, except per share data) |
||||||||||||||||||||
|
Selected Balance Sheet Data |
||||||||||||||||||||
|
Total assets |
$ | 1,515,313 | $ | 1,251,878 | $ | 1,232,755 | $ | 1,210,442 | $ | 1,174,149 | ||||||||||
|
Total loans, net of unearned interest and fees |
968,814 | 781,526 | 764,788 | 753,922 | 758,279 | |||||||||||||||
|
Total deposits |
1,293,742 | 1,085,125 | 1,067,985 | 1,044,357 | 1,011,554 | |||||||||||||||
|
Investment securities |
347,332 | 353,066 | 354,247 | 323,658 | 296,149 | |||||||||||||||
|
Federal Home Loan Bank stock |
4,288 | 2,978 | 3,043 | 3,010 | 2,731 | |||||||||||||||
|
Stockholders’ equity |
130,506 | 95,692 | 90,323 | 93,388 | 95,457 | |||||||||||||||
|
Selected Income Statement Data |
||||||||||||||||||||
|
Interest income |
60,483 | 49,022 | 45,916 | 44,589 | 44,275 | |||||||||||||||
|
Interest expense |
12,638 | 8,225 | 6,873 | 6,483 | 6,569 | |||||||||||||||
|
Net interest income |
47,845 | 40,797 | 39,043 | 38,106 | 37,706 | |||||||||||||||
|
Provision for loan losses |
1,104 | 201 | 390 | 1,062 | 866 | |||||||||||||||
|
Other income |
14,762 | 9,621 | 9,735 | 9,553 | 9,045 | |||||||||||||||
|
Other expense |
48,894 | 35,300 | 33,860 | 34,073 | 33,724 | |||||||||||||||
|
Income before tax |
12,609 | 14,917 | 14,528 | 12,524 | 12,161 | |||||||||||||||
|
Income tax expense |
2,398 | 3,000 | 6,777 | 3,851 | 3,788 | |||||||||||||||
|
Net income |
10,211 | 11,917 | 7,751 | 8,673 | 8,373 | |||||||||||||||
|
Preferred stock dividends |
- | - | 211 | 1,493 | 2,375 | |||||||||||||||
|
Net income available to common stockholders |
$ | 10,211 | $ | 11,917 | $ | 7,540 | $ | 7,180 | $ | 5,998 | ||||||||||
|
Weighted average basic shares outstanding |
9,130 | 8,439 | 8,439 | 8,439 | 8,439 | |||||||||||||||
|
Weighted average diluted shares outstanding |
9,130 | 8,539 | 8,634 | 8,513 | 8,458 | |||||||||||||||
|
Common shares outstanding |
9,499 | 8,445 | 8,439 | 8,439 | 8,439 | |||||||||||||||
|
Intangible Assets |
$ | 19,533 | $ | 758 | $ | 45 | $ | 81 | $ | 116 | ||||||||||
|
Dividends Declared |
2,692 | 1,688 | 844 | - | - | |||||||||||||||
|
Average Assets |
1,413,758 | 1,201,874 | 1,200,631 | 1,163,863 | 1,146,984 | |||||||||||||||
|
Average Stockholders’ Equity |
117,118 | 89,478 | 91,045 | 100,114 | 101,710 | |||||||||||||||
|
Net Charge-Offs |
1,518 | 431 | 1,805 | 743 | 1,064 | |||||||||||||||
|
Reserve for Loan Losses |
6,863 | 7,277 | 7,508 | 8,923 | 8,604 | |||||||||||||||
|
OREO |
1,320 | 1,841 | 4,256 | 6,439 | 8,839 | |||||||||||||||
|
Nonperforming Loans |
9,826 | 9,482 | 7,503 | 12,350 | 14,416 | |||||||||||||||
|
Nonperforming Assets |
1,320 | 11,323 | 11,759 | 18,789 | 23,255 | |||||||||||||||
|
Average Interest-Earning Assets |
1,336,676 | 1,149,036 | 1,133,700 | 1,090,967 | 1,074,556 | |||||||||||||||
|
Noninterest-Bearing Deposits |
232,635 | 192,847 | 190,928 | 159,059 | 133,886 | |||||||||||||||
|
Year Ended December 31, |
||||||||||||||||||||
|
2019 |
2018 |
2017 |
2016 |
2015 |
||||||||||||||||
|
(dollars in thousands, except per share data) |
||||||||||||||||||||
|
Per share data: |
||||||||||||||||||||
|
Net income per common share (diluted) |
$ | 1.12 | $ | 1.40 | $ | 0.87 | $ | 0.84 | $ | 0.71 | ||||||||||
|
Common book value per share |
13.74 | 11.33 | 10.70 | 9.96 | 9.18 | |||||||||||||||
|
Tangible common book value per share(2) |
11.68 | 11.24 | 10.69 | 9.95 | 9.16 | |||||||||||||||
|
Dividends per common share |
0.30 | 0.20 | 0.10 | 0.00 | 0.00 | |||||||||||||||
|
Profitability ratios: |
||||||||||||||||||||
|
Net income to average assets |
0.72 |
% |
0.99 |
% |
0.63 |
% |
0.62 |
% |
0.52 |
% |
||||||||||
|
Net income to average stockholders’ equity |
8.72 | 13.32 | 8.28 | 7.17 | 5.90 | |||||||||||||||
|
Net interest margin |
3.59 | 3.56 | 3.46 | 3.51 | 3.52 | |||||||||||||||
|
Loan quality ratios: |
||||||||||||||||||||
|
Net charge-offs to total loans |
0.16 | 0.06 | 0.24 | 0.10 | 0.14 | |||||||||||||||
|
Allowance for loan losses to total loans and OREO |
0.71 | 0.93 | 0.98 | 1.17 | 1.12 | |||||||||||||||
|
Nonperforming assets to total loans and OREO |
1.15 | 1.44 | 1.53 | 2.47 | 3.03 | |||||||||||||||
|
Allowance for loan losses to nonperforming loans |
69.85 | 76.74 | 100.06 | 72.25 | 59.68 | |||||||||||||||
|
Allowance for loan losses to nonperforming assets |
61.57 | 64.27 | 63.85 | 47.49 | 37.00 | |||||||||||||||
|
Liquidity ratios: |
||||||||||||||||||||
|
Loans to total deposits (1) |
74.88 | 72.02 | 71.61 | 72.19 | 74.96 | |||||||||||||||
|
Loans to average interest-earning assets (1) |
72.48 | 68.02 | 67.46 | 69.11 | 70.57 | |||||||||||||||
|
Noninterest-bearing deposits to total deposits |
17.98 | 17.77 | 17.88 | 15.23 | 13.24 | |||||||||||||||
|
Capital adequacy ratios: |
||||||||||||||||||||
|
Common stockholders’ equity to total assets |
8.61 | 7.64 | 7.33 | 6.94 | 6.60 | |||||||||||||||
|
Total stockholders’ equity to total assets |
8.61 | 7.64 | 7.33 | 7.72 | 8.13 | |||||||||||||||
|
Dividend payout ratio |
24.36 | 14.16 | 11.24 | 0.00 | 0.00 | |||||||||||||||
(1) Total loans, net of unearned interest and fees.
(2) Non-GAAP measure - see "GAAP Reconciliation and Management Explanation of Non-GAAP Financial Measures" for more information and a reconciliation to GAAP.
Item 7
Management’s Discussion and Analysis of Financial Condition and Results of Operations
The following discussion and analysis of our financial condition and results of operations should be read in conjunction with “Item 6. - Selected Financial Data” and our consolidated financial statements and related notes included elsewhere in this Annual Report on Form 10-K. This discussion and analysis contains forward-looking statements that involve risk, uncertainties and, assumptions. Certain risks, uncertainties and other factors, including but not limited to those set forth under “Cautionary Note Regarding Forward-Looking Statements,” “Risk Factors,” and elsewhere in this Annual Report on Form 10-K, may cause actual results to differ materially from those projected in the forward looking statements. We assume no obligation to update any of these forward-looking statements.
The Company
Colony Bankcorp, Inc. is a bank holding company headquartered in Fitzgerald, Georgia that provides, through its wholly-owned subsidiary Colony Bank (collectively referred to as the Company), a broad array of products and services throughout central, south and coastal Georgia markets. The Company offers commercial, consumer and mortgage banking services.
Recent Developments
In May 2019, the Company opened its first full service banking office in Statesboro, Georgia. In October 2018, the Bank purchased a vacant lot of real estate in Albany, Georgia from the branch acquisition transaction with Planters First Bank. The Bank intends to build a new branch office in the future.
On May 1, 2019, the Bank completed its purchase of the mortgage division from Planters First Bank, PFB Mortgage, which added several mortgage originators within the following markets in Georgia: Albany, Athens, Macon and Warner Robins. In addition, the Bank established a new mortgage loan origination office in LaGrange, Georgia in March 2019.
On May 1, 2019, the Company completed its acquisition of LBC Bancshares, Inc. and its banking subsidiary, Calumet Bank, which has merged with and into the Company and the Bank, respectively. The acquisition expanded the Company’s market presence in LaGrange, Georgia and Columbus, Georgia, as well as adding a loan production office in Atlanta, Georgia. The Company issued 1,053,875 common shares at a fair value of $18.7 million and paid $15.3 million in cash to the former shareholders of LBC as merger consideration.
On May 20, 2019, the Company announced the retirement of Terry L. Hester, Executive Vice President and Chief Financial Officer of the Company, and announced the hiring of Tracie Youngblood as the new Executive Vice President and Chief Financial Officer. Ms. Youngblood joined the Company on June 24, 2019. In addition, the Company announced the realignment of roles within the senior management team with M. Eddie Hoyle being appointed to Chief Banking Officer, Edward Lee Bagwell being appointed to Chief Risk Officer and General Counsel, J. Stan Cook being appointed to Chief Credit Officer, and the addition of Lance Whitley as Chief People Officer.
In July 2019, the Bank announced the startup of a Small Business Specialty Lending Group and the hiring of two veteran bankers to lead the group. This new unit will expand the Bank’s participation in government guaranteed loans and expand its footprint into new markets, provide the Bank with an opportunity to service new clients and provide additional fee income.
In July 2019, a new subsidiary of the Company was incorporated under the name Colony Risk Management, Inc. Colony Risk Management, Inc. is a captive insurance subsidiary which insures various liability and property damage policies for the Company and its related subsidiaries. Colony Risk Management is located in Las Vegas, Nevada and is regulated by the State of Nevada Division of Insurance.
The Company reinstated dividend payments during the first quarter of 2017 and has continued to pay dividends to its shareholders throughout 2018 and 2019 on a quarterly basis. In 2019, we had a quarterly dividend of $0.075 per common stock and in 2018, we paid a quarterly dividend of $0.05 per common stock.
GAAP Reconciliation and Management Explanation of Non-GAAP Financial Measures
Our accounting and reporting policies conform to generally accepted accounting principles (GAAP) in the United States and prevailing practices in the banking industry. However, certain non-GAAP measures are used by management to supplement the evaluation of our performance. These include the fully-taxable equivalent measures: tax-equivalent net interest income, tax-equivalent net interest margin and tax-equivalent net interest spread, which include the effects of taxable-equivalent adjustments using a federal income tax rate of 21% in 2018 and 34% in prior years to increase tax-exempt interest income to a tax-equivalent basis. Tax-equivalent adjustments are reported in Notes 1 and 2 to the Average Balances with Average Yields and Rates table under Rate/Volume Analysis. Tangible common book value per common share is also a non-GAAP measure used in the Selected Financial Data section.
Tax-equivalent net interest income, net interest margin and net interest spread. Net interest income on a tax-equivalent basis is a non-GAAP measure that adjusts for the tax-favored status of net interest income from loans and investments. We believe this measure to be the preferred industry measurement of net interest income and it enhances comparability of net interest income arising from taxable and tax-exempt sources. The most directly comparable financial measure calculated in accordance with GAAP is our net interest income. Net interest margin on a tax-equivalent basis is net interest income on a tax-equivalent basis divided by average interest-earning assets on a tax-equivalent basis. The most directly comparable financial measure calculated in accordance with GAAP is our net interest margin. Net interest spread on a tax-equivalent basis is the difference in the average yield on average interest-earning assets on a tax equivalent basis and the average rate paid on average interest-bearing liabilities. The most directly comparable financial measure calculated in accordance with GAAP is our net interest spread.
These non-GAAP financial measures should not be considered alternatives to GAAP-basis financial statements, and other bank holding companies may define or calculate these non-GAAP measures or similar measures differently.
A reconciliation of these performance measures to GAAP performance measures is included in the tables below.
Non-GAAP Performance Measures Reconciliation
|
Years Ended December 31, |
||||||||||||||||||||
|
2019 |
2018 |
2017 |
2016 |
2015 |
||||||||||||||||
|
(dollars in thousands, except per share data) |
||||||||||||||||||||
|
Interest income reconciliation |
||||||||||||||||||||
|
Interest income – taxable equivalent |
$ | 60,494 | $ | 49,034 | $ | 45,943 | $ | 44,762 | $ | 44,407 | ||||||||||
|
Tax equivalent adjustment |
(11) |
|
(12) |
|
(27) |
|
(173) |
|
(132) |
|
||||||||||
|
Interest income (GAAP) |
$ | 60,483 | $ | 49,022 | $ | 45,916 | $ | 44,589 | $ | 44,275 | ||||||||||
|
Net interest income reconciliation |
||||||||||||||||||||
|
Net interest Income – taxable equivalent |
$ | 47,856 | $ | 40,809 | $ | 39,070 | $ | 38,279 | $ | 37,838 | ||||||||||
|
Tax equivalent adjustment |
(11) |
|
(12) |
|
(27) |
|
(173) |
|
(132) |
|
||||||||||
|
Net interest income (GAAP) |
$ | 47,845 | $ | 40,797 | $ | 39,043 | $ | 38,106 | $ | 37,706 | ||||||||||
|
Net interest margin reconciliation |
||||||||||||||||||||
|
Net interest margin – taxable equivalent |
3.59 |
% |
3.56 |
% |
3.46 |
% |
3.51 |
% |
3.52 |
% |
||||||||||
|
Tax equivalent adjustment |
(0.01) |
% |
(0.01) |
|
(0.02) |
|
(0.02) |
|
(0.01) |
|
||||||||||
|
Net interest margin (GAAP) |
3.58 |
% |
3.55 |
% |
3.44 |
% |
3.49 |
% |
3.51 |
% |
||||||||||
|
Interest rate spread reconciliation |
||||||||||||||||||||
|
Interest rate spread – taxable equivalent |
3.37 |
% |
3.39 |
% |
3.34 |
% |
3.40 |
% |
3.41 |
% |
||||||||||
|
Tax equivalent adjustment |
- | - | (0.02) |
|
(0.02) |
|
(0.01) |
|
||||||||||||
|
Interest rate spread (GAAP) |
3.37 |
% |
3.39 |
% |
3.32 |
% |
3.38 |
% |
3.40 |
% |
||||||||||
|
Selected Financial Data |
||||||||||||||||||||
|
Tangible Common Book Value Per Common Share |
$ | 11.68 | $ | 11.24 | $ | 10.69 | $ | 9.95 | $ | 9.16 | ||||||||||
|
Effect of Other Intangible Assets |
2.06 | 0.09 | 0.01 | 0.01 | 0.02 | |||||||||||||||
|
Common Book Value Per Common Share (GAAP) |
$ | 13.74 | $ | 11.33 | $ | 10.70 | $ | 9.96 | $ | 9.18 | ||||||||||
Overview
The following discussion and analysis presents the more significant factors affecting the Company’s financial condition as of December 31, 2019 and 2018, and results of operations for each of the three year-periods ended December 31, 2019. This discussion and analysis should be read in conjunction with the Company’s consolidated financial statements, notes thereto and other financial information appearing elsewhere in this report.
Taxable-equivalent adjustments are the result of increasing income from tax-free loans and investments by an amount equal to the taxes that would be paid if the income were fully taxable based on a 21% federal tax rate for 2019 and 2018 and 34% federal tax rate for 2017, thus making tax-exempt yields comparable to taxable asset yields.
Dollar amounts in tables are stated in thousands, except for per share amounts.
Results of Operations
The Company’s results of operations are determined by its ability to effectively manage interest income and expense, to minimize loan and investment losses, to generate noninterest income and to control noninterest expense. Since market forces and economic conditions beyond the control of the Company determine interest rates, the ability to generate net interest income is dependent upon the Company’s ability to obtain an adequate spread between the rate earned on interest-earning assets and the rate paid on interest-bearing liabilities. Thus, the key performance for net interest income is the interest margin or net yield, which is taxable-equivalent net interest income divided by average interest-earning assets. Net income available to common shareholders totaled $10.2 million, or $1.12 per diluted shares in 2019, compared to $11.9 million, or $1.40 per diluted shares in 2018 and compared to $7.54 million, or $0.87 per diluted common share in 2017.
Selected income statement data, returns on average assets and average equity and dividends per share for the comparable periods were as follows:
| $ |
% |
$ |
% |
|||||||||||||||||||||||||||||
|
(dollars in thousands, except per share data) |
2019 |
2018 |
Variance |
Variance |
2018 |
2017 |
Variance |
Variance |
||||||||||||||||||||||||
|
Taxable-equivalent net interest income(1) |
$ | 47,856 | $ | 40,809 | $ | 7,048 | 17.27 | % | $ | 40,809 | $ | 39,070 | $ | 1,739 | 4.09 | % | ||||||||||||||||
|
Taxable-equivalent adjustment |
(11) | (12) | - | 0.00 | % | (12) | (27) | 15 | -55.56 | % | ||||||||||||||||||||||
|
Net interest income |
47,845 | 40,797 | 7,048 | 17.28 | % | 40,797 | 39,043 | 1,754 | 4.49 | % | ||||||||||||||||||||||
|
Provision for loan losses |
1,104 | 201 | 903 | 449.25 | % | 201 | 390 | (189) | -48.46 | % | ||||||||||||||||||||||
|
Noninterest income |
14,762 | 9,621 | 5,141 | 53.44 | % | 9,621 | 9,735 | (114) | -1.17 | % | ||||||||||||||||||||||
|
Noninterest expense |
48,894 | 35,300 | 13,594 | 38.51 | % | 35,300 | 33,860 | 1,440 | 4.25 | % | ||||||||||||||||||||||
|
Income before income taxes |
$ | 12,609 | $ | 14,917 | $ | (2,308) | -15.47 | % | $ | 14,917 | $ | 14,528 | $ | 389 | 2.68 | % | ||||||||||||||||
|
Income taxes |
2,398 | 3,000 | (602) | -20.07 | % | 3,000 | 6,777 | (3,777) | -55.73 | % | ||||||||||||||||||||||
|
Net income |
10,211 | 11,917 | (1,706) | -14.32 | % | 11,917 | 7,751 | 4,166 | 53.75 | % | ||||||||||||||||||||||
|
Preferred stock dividends |
- | - | - | 0.00 | % | - | 211 | (211) | -100.00 | % | ||||||||||||||||||||||
|
Net income available to common shareholders: |
$ | 10,211 | $ | 11,917 | $ | (1,706) | -14.32 | % | $ | 11,917 | $ | 7,540 | $ | 4,377 | 58.05 | % | ||||||||||||||||
|
Basic |
1.12 | 1.41 | (0.29) | -20.57 | % | 1.41 | 0.89 | 0.52 | 58.43 | % | ||||||||||||||||||||||
|
Diluted |
1.12 | 1.40 | (0.28) | -20.00 | % | 1.40 | 0.87 | 0.53 | 60.92 | % | ||||||||||||||||||||||
|
Return on average assets |
0.72 | % | 0.99 | % | -0.27 | % | -27.04 | % | 0.99 | % | 0.63 | % | 0.36 | % | 0.57 | |||||||||||||||||
|
Return on average total equity |
8.73 | % | 13.32 | % | -4.59 | % | -34.46 | % | 13.32 | % | 8.28 | % | 5.04 | % | 60.87 | % | ||||||||||||||||
(1) Non-GAAP measure - see "GAAP Reconciliation and Management Explanation of Non-GAAP Financial Measures" for more information and a reconciliation to GAAP.
Net Interest Income
Net interest income is the difference between interest income on earning assets, such as loans and securities, and interest expense on liabilities, such as deposits and borrowings, which are used to fund those assets. Net interest income is the Company’s largest source of revenue, representing 76.4% of total revenue during 2019, 80.9% of total revenue during 2018 and 80.0% of total revenue during 2017.
Net interest margin is the taxable-equivalent net interest income as a percentage of average interest-earning assets for the period. The level of interest rates and the volume and mix of interest-earning assets and interest-bearing liabilities impact net interest income and net interest margin.
The Company’s loan portfolio is significantly affected by changes in the prime interest rate. The prime interest rate, which is the rate offered on loans to borrowers with strong credit, was 4.75% and 5.25% as of December 31, 2019 and 2018, respectively. The Federal Reserve Board sets general market rates of interest, including the deposit and loan rates offered by many financial institutions. During 2017, the prime interest rate increased overall by 75 basis points. During 2018, the prime interest rate increased overall by 100 basis points. During 2019, the prime interest rate decreased overall by 50 basis points.
The following table presents the changes in taxable-equivalent net interest income and identifies the changes due to differences in the average volume of interest-earning assets and interest-bearing liabilities and the changes due to changes in the average interest rate on those assets and liabilities. The changes in net interest income due to changes in both average volume and average interest rate have been allocated to the average volume change or the average interest rate change in proportion to the absolute amounts of the change in each. The Company’s consolidated average balance sheets along with an analysis of taxable-equivalent net interest earnings are presented in the Rate/Volume Analysis.
Rate/Volume Analysis
The rate/volume analysis presented hereafter illustrates the change from year to year for each component of the taxable equivalent net interest income separated into the amount generated through volume changes and the amount generated by changes in the yields/rates.
|
Changes from 2018 to 2019 (a) |
Changes from 2017 to 2018 (a) |
|||||||||||||||||||||||
|
(dollars in thousands) |
Volume |
Rate |
Total |
Volume |
Rate |
Total |
||||||||||||||||||
|
Interest income |
||||||||||||||||||||||||
|
Loans, net of unearned fees |
$ | 6,945 | $ | 2,651 | $ | 9,596 | $ | 515 | $ | 1,554 | $ | 2,069 | ||||||||||||
|
Investment securities, taxable |
719 | 454 | 1,173 | (9) | 841 | 832 | ||||||||||||||||||
|
Investment securities, exempt |
(10) | 10 | - | (7) | (18) | (25) | ||||||||||||||||||
|
Interest-bearing deposits |
496 | 86 | 582 | 93 | 85 | 178 | ||||||||||||||||||
|
Federal funds sold |
64 | - | 64 | - | - | - | ||||||||||||||||||
|
Interest-bearing other assets |
6 | 39 | 45 | 39 | (2) | 37 | ||||||||||||||||||
|
Total interest income |
8,220 | 3,240 | 11,460 | 552 | 2,461 | 3,091 | ||||||||||||||||||
|
Interest expense |
||||||||||||||||||||||||
|
Interest-bearing demand and savings deposits |
703 | 802 | 1,505 | 88 | 785 | 873 | ||||||||||||||||||
|
Time deposits |
561 | 1,927 | 2,488 | (276) | 702 | 426 | ||||||||||||||||||
|
FHLB advances |
(107) | (42) | (149) | (37) | (153) | (190) | ||||||||||||||||||
|
Other borrowed money |
494 | (954) | (460) | 2 | - | 2 | ||||||||||||||||||
| Subordinated debentures | - | 1,029 | 1,029 | - | 241 | 241 | ||||||||||||||||||
|
Total interest expense |
1,651 | 2,762 | 4,413 | (223) | 1,575 | 1,352 | ||||||||||||||||||
|
Net interest income |
$ | 6,569 | $ | 478 | $ | 7,047 | $ | 854 | $ | 885 | $ | 1,739 | ||||||||||||
|
(a) |
Changes in net interest income for the periods, based on either changes in average balances or changes in average rates for interest-earning assets and interest-bearing liabilities, are shown on this table. During each year there are numerous and simultaneous balance and rate changes; therefore, it is not possible to precisely allocate the changes between balances and rates. For the purpose of this table, changes that are not exclusively due to balance changes or rate changes have been attributed to rates. |
The Company maintains about 20.1% of its loan portfolio in adjustable rate loans that reprice with prime rate changes, while the bulk of its other loans mature within 3 years. The liabilities to fund assets are primarily in non-maturing core deposits and short term certificates of deposit that mature within one year. The Federal Reserve rates increased 75 basis points in 2017 followed by a 100 basis point increase during 2018. During 2019 Federal Reserve rates decreased 50 basis points. We have seen the net interest margin change to 3.59% for 2019, compared to 3.55% for 2018 and 3.45% for 2017.
Taxable-equivalent net interest income for 2019 increased by $7.0 million, or 17.3%, compared to 2018 while taxable-equivalent net interest income for 2018 increased by $1.7 million, or 4.5% compared to 2017. The average volume of interest-earning assets during 2019 increased $183.7 million compared to 2018 while over the same period the net interest margin increased to 3.59% from 3.55%. The average volume of interest-earning assets during 2018 increased $16.1 million compared to 2017 while over the same period the net interest margin increased to 3.55% from 3.45%. The change in the net interest margin in 2019 and 2018 was primarily driven by a higher level of low yielding assets offset by an increase in the cost of funds. Growth in average earning assets during 2019 was primarily in loans, investments and interest-bearing deposits in other banks. These increases mostly stem from the acquisition of LBC Bancshares, Inc. that occurred in the second quarter of 2019.
The average volume of loans increased $123.8 million in 2019 compared to 2018 and $9.77 million in 2018 compared to 2017. The average yield on loans increased 34 basis points in 2019 compared to 2018 and increased 21 basis points in 2018 compared to 2017. The average volume of deposits increased $178.4 million in 2019 compared to 2018. The average volume of deposits increased $4.1 million in 2018 compared to 2017. Demand deposits made up $38.0 million of the increase in average deposits in 2019 compared to $14.5 million of the increase in average deposits in 2018.
Accordingly, the ratio of average interest-bearing deposits to total average deposits was 82.6% in 2019, 83.2% in 2018 and 84.6% in 2017. For 2019, this deposit mix, combined with a general increase in interest rates, had the effect of (i) increasing the average cost of total deposits by 30 basis points in 2019 compared to 2018 and (ii) offset a portion of the impact of increasing yields on interest-earning assets on the Company’s net interest income. For 2018, this deposit mix, combined with a general increase in interest rates, had the effect of (i) increasing the average cost of total deposits by 15 basis points in 2018 compared to 2017 and (ii) offset a portion of the impact of increasing yields on interest-earning assets on the Company’s net interest income.
The Company’s net interest spread, which represents the difference between the average rate earned on interest-earning assets and the average rate paid on interest-bearing liabilities, was 3.37% in 2019 compared to 3.39% in 2018 and 3.32% in 2017. The net interest spread, as well as the net interest margin, will be impacted by future changes in short-term and long-term interest rate levels, as well as the impact from the competitive environment. A discussion of the effects of changing interest rates on net interest income is set forth in "Market Risk and Interest Rate Sensitivity" included elsewhere in this report.
AVERAGE BALANCE SHEETS
|
2019 |
2018 |
2017 |
||||||||||||||||||||||||||||||||||
|
Average |
Income/ |
Yields/ |
Average |
Income/ |
Yields/ |
Average |
Income/ |
Yields/ |
||||||||||||||||||||||||||||
|
(dollars in thousands) |
Balances |
Expense |
Rates |
Balances |
Expense |
Rates |
Balances |
Expense |
Rates |
|||||||||||||||||||||||||||
|
Assets |
||||||||||||||||||||||||||||||||||||
|
Loans, net of unearned fees (1) (2) |
$ | 896,098 | $ | 50,278 | 5.61 | % | $ | 772,327 | $ | 40,682 | 5.27 | % | $ | 762,554 | $ | 38,613 | 5.06 | % | ||||||||||||||||||
|
Investment securities, taxable |
374,718 | 8,872 | 2.37 | % | 344,369 | 7,699 | 2.24 | % | 344,790 | 6,867 | 1.99 | % | ||||||||||||||||||||||||
|
Investment securities, exempt (3) |
1,737 | 56 | 3.22 | 2,046 | 56 | 3.18 | % | 2,310 | 81 | 3.51 | % | |||||||||||||||||||||||||
|
Interest-bearing deposits |
54,166 | 992 | 1.83 | % | 27,072 | 410 | 1.51 | % | 20,920 | 232 | 1.11 | % | ||||||||||||||||||||||||
|
Federal funds sold |
2,725 | 64 | 2.35 | % | - | - | 0.00 | % | - | - | 0.00 | % | ||||||||||||||||||||||||
|
Other investments |
4,064 | 232 | 5.71 | % | 3,951 | 187 | 4.73 | % | 3,126 | 150 | 4.80 | % | ||||||||||||||||||||||||
|
Total interest-earning assets |
$ | 1,333,508 | $ | 60,494 | 4.54 | % | $ | 1,149,765 | $ | 49,034 | 4.27 | % | $ | 1,133,700 | $ | 45,943 | 4.05 | % | ||||||||||||||||||
|
Total noninterest-earning assets |
80,251 | 51,784 | 66,931 | |||||||||||||||||||||||||||||||||
|
Total assets |
$ | 1,413,759 | $ | 1,201,549 | $ | 1,200,631 | ||||||||||||||||||||||||||||||
|
Liabilities and Stockholders' Equity |
||||||||||||||||||||||||||||||||||||
|
Interest-bearing liabilities: |
||||||||||||||||||||||||||||||||||||
|
Savings and interest-bearing demand deposits |
$ | 640,180 | $ | 4,274 | 0.67 | % | $ | 534,887 | $ | 2,769 | 0.52 | % | $ | 517,974 | $ | 1,896 | 0.37 | % | ||||||||||||||||||
|
Time deposits |
361,319 | 5,776 | 1.60 | % | 326,243 | 3,288 | 1.01 | % | 353,587 | 2,862 | 0.81 | % | ||||||||||||||||||||||||
|
Total interest-bearing deposits |
1,001,499 | 10,050 | 1.00 | % | 861,130 | 6,057 | 0.70 | % | 871,561 | 4,758 | 0.55 | % | ||||||||||||||||||||||||
|
FHLB advances |
45,233 | 1,046 | 2.31 | % | 49,845 | 1,195 | 2.40 | % | 51,388 | 1,385 | 2.70 | % | ||||||||||||||||||||||||
|
Other borrowings |
9,930 | 508 | 5.12 | % | 275 | 5 | 1.82 | % | 178 | 3 | 1.69 | % | ||||||||||||||||||||||||
|
Subordinated deferrable interest debentures |
24,229 | 1,034 | 4.27 | % | 24,229 | 968 | 4.00 | % | 24,229 | 727 | 2.79 | % | ||||||||||||||||||||||||
|
Total interest-bearing liabilities |
1,080,891 | 12,638 | 1.17 | % | 935,479 | 8,225 | 0.88 | % | 75,795 | 6,873 | 0.73 | % | ||||||||||||||||||||||||
|
Noninterest-bearing demand deposits |
211,462 | 173,442 | 158,924 | |||||||||||||||||||||||||||||||||
|
Other liabilities |
4,437 | 3,222 | 3,306 | |||||||||||||||||||||||||||||||||
|
Stockholders' equity |
116,969 | 89,406 | 91,045 | |||||||||||||||||||||||||||||||||
|
Total liabilities and stockholders' equity |
$ | 1,413,759 | $ | 1,201,549 | $ | 1,200,631 | ||||||||||||||||||||||||||||||
|
Interest rate spread |
3.37 | % | 3.39 | % | 3.32 | % | ||||||||||||||||||||||||||||||
|
Net interest income |
$ | 47,856 | $ | 40,809 | $ | 39,070 | ||||||||||||||||||||||||||||||
|
Net interest margin |
3.59 | % | 3.55 | % | 3.45 | % | ||||||||||||||||||||||||||||||
|
(1) |
Includes loans held for sale. |
|
(2) |
Included in the average balance of loans outstanding are loans where the accrual of interest has been discontinued. |
|
(3) |
Taxable-equivalent adjustments totaling $11,000 for 2019, $12,000 for 2018 and $27,000 for 2017, respectively, are included in tax-exempt interest on investment securities. The adjustments are based on a federal tax rate of 21% for 2019 and 2018 and 34% for 2017 with appropriate reductions for the effect of disallowed interest expense incurred in carrying tax-exempt obligations. |
Provision for Loan Losses
The provision for loan losses is determined by management as the amount to be added to the allowance for loan losses after net charge-offs have been deducted to bring the allowance to a level which, in management’s best estimate, is necessary to absorb probable losses within the existing loan portfolio. The provision for loan losses totaled $1.1 million in 2019 compared to $201,000 in 2018 and $390,000 in 2017. See the section captioned “Allowance for Loan Losses” elsewhere in this discussion for further analysis of the provision for loan losses.
Noninterest Income
The components of noninterest income were as follows:
| $ |
% |
$ |
% |
|||||||||||||||||||||||||||||
|
(dollars in thousands) |
2019 |
2018 |
Variance |
Variance |
2018 |
2017 |
Variance |
Variance |
||||||||||||||||||||||||
|
Service charges on deposit accounts |
$ | 4,783 | $ | 4,374 | $ | 409 | 9.35 | % | $ | 4,374 | $ | 4,467 | $ | (93 | ) | -2.08 | % | |||||||||||||||
|
Other charges, commissions and fees |
4,263 | 3,254 | 1,009 | 31.01 | % | 3,254 | 3,049 | 205 | 6.72 | % | ||||||||||||||||||||||
|
Mortgage fee income |
3,199 | 652 | 2,547 | 390.64 | % | 652 | 859 | (207 | ) | -24.10 | % | |||||||||||||||||||||
|
Securities gains (losses) |
97 | 116 | (19 | ) | -16.38 | % | 116 | - | 116 | 100.00 | % | |||||||||||||||||||||
|
Other |
2,420 | 1,225 | 1,195 | 97.55 | % | 1,225 | 1,360 | (135 | ) | -9.93 | % | |||||||||||||||||||||
|
Total |
$ | 14,762 | $ | 9,621 | $ | 5,141 | 53.44 | % | $ | 9,621 | $ | 9,735 | $ | (114 | ) | -1.17 | % | |||||||||||||||
Other Charges, Commissions and Fees. Significant amounts impacting the comparable periods was primarily attributed to ATM and debit card interchange fees which increased $978,000 in 2019 compared to 2018 and $219,000 in 2018 compared to 2017.
Mortgage Fee Income. The increase in 2019 was primarily attributed to the acquisition of the PFB Mortgage division in May 2019. In addition, the Bank opened a new mortgage location in LaGrange in March 2019.The decrease in mortgage fee income in 2018 compared to the same period in 2017 was due to a decrease in the volume of mortgage loans.
Other. The increase in 2019 was primarily attributed to the gain on sale of other real estate owned. During the second quarter of 2019, the Bank realized a gain of approximately $1.0 million from the sale of several other real estate owned properties within one relationship. The decrease in other income in 2018 was attributable to a decrease in revenue from cash surrender life insurance policies which decreased $124 thousand in 2018 compared to 2017.
Noninterest Expense
The components of noninterest expense were as follows:
|
$ |
% |
$ |
% |
|||||||||||||||||||||||||||||
|
(dollars in thousands) |
2019 |
2018 |
Variance |
Variance |
2018 |
2017 |
Variance |
Variance |
||||||||||||||||||||||||
|
Salaries and employee benefits |
$ | 26,218 | $ | 20,123 | $ | 6,095 | 30.29 | % | $ | 20,123 | $ | 19,223 | $ | 900 | 4.68 | % | ||||||||||||||||
|
Occupancy and equipment |
4,850 | 4,180 | 670 | 16.03 | % | 4,180 | 3,948 | 232 | 5.88 | % | ||||||||||||||||||||||
|
Acquisition related expenses |
2,733 | 224 | 2,509 | 1120.09 | % | 224 | - | 224 | 100.00 | % | ||||||||||||||||||||||
|
Deposit intangible expenses |
600 | 48 | 552 | 1150.00 | % | 48 | - | 48 | 100.00 | % | ||||||||||||||||||||||
|
Other |
14,493 | 10,725 | 3,768 | 35.13 | % | 10,725 | 10,689 | 36 | 0.34 | % | ||||||||||||||||||||||
|
Total |
$ | 48,894 | $ | 35,300 | $ | 13,594 | 38.51 | % | $ | 35,300 | $ | 33,860 | $ | 1,440 | 4.25 | % | ||||||||||||||||
Salaries and Employee Benefits. The increase in 2019 was primarily attributable to merit pay increases and increase in headcount mostly from the two acquisitions completed in May 2019 of LBC Bancshares, Inc and PFB Mortgage. In addition, the Company hired several key employees during the second quarter of 2019 as part of the strategic changes that are being made to enhance its profitability in line with the Company's growth initiatives. The increase in salary and employee benefits for 2018 was due to merit pay increases and an increase in number of employees.
Occupancy and Equipment. The increase in 2019 was primarily attributable to the new locations stemming from the acquisitions of LBC Bancshares, Inc. and PFB Mortgage. The increase in 2018 was primarily attributable to an increase in depreciation expense in 2018 and an increase in maintenance on equipment and building in 2018 when compared to 2017.
Acquisition Related Expenses. The increase in 2019 was primarily attributable to the acquisition of LBC Bancshares, Inc. The largest expense the Company has incurred from the acquisition relates to the contract buyout of Calumet’s data processing system which was approximately $1.08 million. Other expenses incurred relating to the acquisition were legal expenses and broker expenses. The increase in 2018 was primarily attributable to conversion expenses of $224,000 related to the 2018 purchase of a branch in Albany, Georgia from Planters First Bank.
Deposit Intangible Expenses. The Bank recognized a core deposit intangible related to the Planters First Bank Albany branch acquisition in October 2018 and the LBC Bancshares, Inc. acquisition in May 2019. The deposit intangible expense increased to account for the amortization of the core deposit intangibles that is being amortized over the average remaining life of each acquired customers’ deposits.
Other. The increase in 2019 was primarily attributable to legal, business development and data processing expenses. The increase in 2018 was primarily attributable to software and data processing as the Bank changed its information technology processes from an in-house approach to outsourcing with our core processing provider during the first quarter of 2018. With this change, the Company showed a decrease of $400,000 in software expense in 2018 that was offset by an increase of $629,000 in data processing expense in 2018 compared to 2017.
Sources and Uses of Funds
The following table illustrates, during the years presented, the mix of the Company’s funding sources and the assets in which those funds are invested as a percentage of the Company’s average total assets for the period indicated. Average assets totaled $1.4 billion in 2019 compared to $1.2 billion in 2018 and $1.2 billion in 2017.
|
(dollars in thousands) |
2019 |
2018 |
2017 |
|||||||||||||||||||||
|
Sources of Funds: |
||||||||||||||||||||||||
|
Noninterest-bearing deposits |
$ | 211,462 | 14.96 | % | $ | 173,422 | 14.43 | % | $ | 158,924 | 13.24 | % | ||||||||||||
|
Interest-bearing deposits |
1,001,499 | 70.84 | % | 861,130 | 71.67 | % | 871,561 | 72.59 | % | |||||||||||||||
|
FHLB advances |
45,233 | 3.20 | % | 49,845 | 4.15 | % | - | 0.00 | % | |||||||||||||||
| Other borrowings | 9,930 | 0.70 | % | 275 | 0.02 | % | 178 | 0.01 | % | |||||||||||||||
|
Subordinated debentures |
24,229 | 1.71 | % | 24,229 | 2.02 | % | 75,617 | 6.30 | % | |||||||||||||||
|
Other noninterest-bearing liabilities |
4,437 | 0.31 | % | 3,222 | 0.27 | % | 3,306 | 0.28 | % | |||||||||||||||
|
Equity capital |
116,969 | 8.28 | % | 89,406 | 7.44 | % | 91,045 | 7.58 | % | |||||||||||||||
|
Total |
$ | 1,413,759 | 100.00 | % | $ | 1,201,549 | 100.00 | % | $ | 1,200,631 | 100.00 | % | ||||||||||||
|
Uses of Funds: |
||||||||||||||||||||||||
|
Loans (net of allowance) |
$ | 896,098 | 63.38 | % | $ | 772,327 | 64.28 | % | $ | 762,554 | 63.51 | % | ||||||||||||
|
Investment securities |
376,455 | 26.63 | % | 346,415 | 28.83 | % | 347,100 | 28.91 | % | |||||||||||||||
|
Federal funds sold |
2,725 | 0.19 | % | - | 0.00 | % | - | 0.00 | % | |||||||||||||||
|
Interest-bearing deposits |
54,166 | 3.83 | % | 27,072 | 2.25 | % | 20,920 | 1.75 | % | |||||||||||||||
|
Other interest-earning assets |
4,064 | 0.29 | % | 3,951 | 0.33 | % | 3,126 | 0.26 | % | |||||||||||||||
|
Other noninterest-earning assets |
80,251 | 5.68 | % | 51,784 | 4.31 | % | 66,931 | 5.57 | % | |||||||||||||||
|
Total |
$ | 1,413,759 | 100.00 | % | $ | 1,201,549 | 100.00 | % | $ | 1,200,631 | 100.00 | % | ||||||||||||
Deposits continue to be the Company’s primary source of funding. Over the comparable periods, interest-bearing deposits continues to be the largest component of the Company's mix of deposits. Interest-bearing deposits totaled 82.6% of total average deposits in 2019 compared to 83.2% in 2018 and 84.6% in 2017.
The Company primarily invests funds in loans and securities. Loans continue to be the largest component of the Company’s mix of invested assets. The Company acquired $130.6 million of loans as part of the acquisition of LBC Bancshares, Inc. in May 2019. This acquisition combined with increases in organic loan growth resulted in loans of $968.8 million at December 31, 2019, up 24.0%, compared to loans of $781.5 million at December 31, 2018, which increased 2.2%, compared to loans of $764.8 million at December 31, 2017. See additional discussion regarding the Company’s loan portfolio in the section captioned “Loans” on the following page. The majority of funds provided by deposits have been invested in loans and securities.
Loans
The following table presents the composition of the Company’s loan portfolio as of December 31 for the past five years.
|
(dollars in thousands) |
December 31, 2019 |
December 31, 2018 |
December 31, 2017 |
December 31, 2016 |
December 31, 2015 |
|||||||||||||||
|
Construction, land & land development |
$ | 96,097 | $ | 60,310 | $ | 53,762 | $ | 42,168 | $ | 49,497 | ||||||||||
|
Other commercial real estate |
540,239 | 435,961 | 418,669 | 415,768 | 407,850 | |||||||||||||||
|
Total commercial real estate |
636,336 | 496,271 | 472,431 | 457,936 | 457,347 | |||||||||||||||
|
Residential real estate |
194,796 | 187,592 | 193,924 | 195,486 | 196,909 | |||||||||||||||
|
Commercial , financial, & agricultural |
114,360 | 74,166 | 64,523 | 64,074 | 66,943 | |||||||||||||||
|
Consumer & other |
23,322 | 23,497 | 33,911 | 36,426 | 37,080 | |||||||||||||||
|
Total loans, net of unearned fees |
968,814 | 781,526 | 764,789 | 753,922 | 758,279 | |||||||||||||||
|
Allowance for loan losses |
(6,863 | ) | (7,277 | ) | (7,508 | ) | (8,923 | ) | (8,604 | ) | ||||||||||
|
Loans, net |
$ | 961,951 | $ | 774,249 | $ | 757,281 | $ | 744,999 | $ | 749,675 | ||||||||||
The following table presents total loans as of December 31, 2019 according to maturity distribution and/or repricing opportunity on adjustable rate loans.
Maturity and Repricing Opportunity
| (dollars in thousands) | One year or less | After one year through three years | After three years through five years | Over five years |
Total |
||||||||||
| Construction, land & land development | $ | 51,215 | $ | 21,767 | $ | 14,553 | $ | 8,562 | $ | 96,097 | |||||
| Other commercial real estate | 99,384 | 198,078 | 77,461 | 165,316 | 540,239 | ||||||||||
| Total commercial real estate | 150,599 | 219,845 | 92,014 | 173,878, | 636,336 | ||||||||||
| Residential real estate | 32,823 | 54,361 | 29,453 | 78,159 | 194,796 | ||||||||||
| Commercial , financial, & agricultural | 37,406 | 23,828 | 23,565 | 29,561 | 114,360 | ||||||||||
| Consumer & other | 5,200 | 10,222 | 6,023 | 1,877 | 23,322 | ||||||||||
| Total loans, net of unearned fees | 226,028 | 308,256 | 151,055 | 283,475 | 968,814 |
Overview. Loans totaled $968.8 million at December 31, 2019 up 24.0% from $781.5 million at December 31, 2018. The majority of the Company’s loan portfolio is comprised of the real estate loans. Commercial and residential real estate which is primarily 1-4 family residential properties, nonfarm nonresidential properties and real estate construction loans made up 85.8% and 87.5% of total loans at December 31, 2019 and December 31, 2018, respectively.
Loan origination/risk management. In accordance with the Company’s decentralized banking model, loan decisions are made at the local bank level. The Company utilizes both an Executive Loan Committee and a Director Loan Committee to assist lenders with the decision making and underwriting process of larger loan requests. Due to the diverse economic markets served by the Company, evaluation and underwriting criterion may vary slightly by market. Overall, loans are extended after a review of the borrower’s repayment ability, collateral adequacy, and overall credit worthiness.
Commercial purpose, commercial real estate, and agricultural loans are underwritten similarly to how other loans are underwritten throughout the Company. The properties securing the Company’s commercial real estate portfolio are diverse in terms of type and geographic location. In addition, the Company restricts total loans to $10 million per borrower, subject to exception and approval by the Director Loan Committee. This diversity helps reduce the Company’s exposure to adverse economic events that affect any single market or industry. Management monitors and evaluates commercial real estate loans monthly based on collateral, geography, and risk grade criteria. The Company also utilizes information provided by third-party agencies to provide additional insight and guidance about economic conditions and trends affecting the markets it serves.
The Company extends loans to builders and developers that are secured by non-owner occupied properties. In such cases, the Company reviews the overall economic conditions and trends for each market to determine the desirability of loans to be extended for residential construction and development. Sources of repayment for these types of loans may be pre-committed permanent loans from approved long-term lenders, sales of developed property or an interim mini-perm loan commitment from the Company until permanent financing is obtained. In some cases, loans are extended for residential loan construction for speculative purposes and are based on the perceived present and future demand for housing in a particular market served by the Company. These loans are monitored by on-site inspections and are considered to have higher risks than other real estate loans due to their ultimate repayment being sensitive to interest rate changes, general economic conditions and trends, the demand for the properties, and the availability of long-term financing.
The Company originates consumer loans at the bank level. Due to the diverse economic markets served by the Company, underwriting criterion may vary slightly by market. The Company is committed to serving the borrowing needs of all markets served and, in some cases, adjusts certain evaluation methods to meet the overall credit demographics of each market. Consumer loans represent relatively small loan amounts that are spread across many individual borrowers to help minimize risk. Additionally, consumer trends and outlook reports are reviewed by management on a regular basis.
The Company utilizes an independent third party company for loan review and validation of the credit risk program on an ongoing quarterly basis. Results of these reviews are presented to management and the audit committee. The loan review process complements and reinforces the risk identification and assessment decisions made by lenders and credit personnel, as well as the Company’s policies and procedures.
Commercial, financial and agricultural. Commercial and agricultural loans at December 31, 2019 increased 54.2% to $114.4 million from December 31, 2018 at $74.2 million. This increase was primarily attributable to the acquisition of LBC Bancshares, Inc. in May 2019. The Company’s commercial and agricultural loans are a diverse group of loans to small, medium and large businesses. The purpose of these loans varies from supporting seasonal working capital needs to term financing of equipment. While some short-term loans may be made on an unsecured basis, most are secured by the assets being financed with collateral margins that are consistent with the Company’s loan policy guidelines.
Construction, land and land development. Construction, land and land development loans increased by $35.8 million, or 59.3%, at December 31, 2019 to $96.1 million from $60.3 million at December 31, 2018. This increase was primarily attributable to the acquisition of LBC Bancshares, Inc. in May 2019 and partially due to new construction loans being financed during the year that were not completed by the end of the year.
Other commercial real estate. Other commercial real estate loans increased by $104.3 million, or 23.9%, at December 31, 2019 to $540.2 million from $436.0 million at December 31, 2018. This increase was primarily attributable to the acquisition of LBC Bancshares, Inc. in May 2019. This portion of our loan portfolio consists primarily of loans secured by farmland, multi-family residential properties and nonfarm, nonresidential real estate properties.
Residential Real Estate Loans. Residential real estate loans increased by $7.2 million, or 3.8%, at December 31, 2019 to $194.8 million from $187.6 million at December 31, 2018. This increase was primarily attributable to the acquisition of LBC Bancshares, Inc. in May 2019. Residential real estate loans consist of revolving, open-end and closed-end loans as well as those secured by closed-end first and junior liens.
Consumer and other. Consumer and other loans include loans to individuals for personal and household purposes, including secured and unsecured installment loans and revolving lines of credit. Consumer and other loans at December 31, 2019 decreased 0.7% to $23.3 million from $23.5 million at December 31, 2018.
Industry concentrations. As of December 31, 2019 and December 31, 2018, there were no concentrations of loans within any single industry in excess of 10% of total loans, as segregated by Standard Industrial Classification code (“SIC code”). The SIC code is a federally designed standard industrial numbering system used by the Company to categorize loans by the borrower’s type of business. The Company has established industry-specific guidelines with respect to maximum loans permitted for each industry with which the Company does business.
Collateral concentrations. Concentrations of credit risk can exist in relation to individual borrowers or groups of borrowers, certain types of collateral, certain types of industries, or certain geographic regions. The Company has a concentration in real estate loans as well as a geographic concentration that could pose an adverse credit risk, particularly with the current economic downturn in the real estate market. At December 31, 2019, approximately 85.8% of the Company’s loan portfolio was concentrated in loans secured by real estate. A substantial portion of borrowers’ ability to honor their contractual obligations is dependent upon the viability of the real estate economic sector. In addition, a large portion of the Company’s foreclosed assets are also located in these same geographic markets, making the recovery of the carrying amount of foreclosed assets susceptible to changes in market conditions. Management continues to monitor these concentrations and has considered these concentrations in its allowance for loan loss analysis. In recent years, we have seen real estate values stabilizing in our markets. The stabilization of rates has resulted in a decrease in the number of loans being classified as impaired over the past several years.
Large credit relationships. The Company is currently in eighteen counties in central, south and coastal Georgia and includes metropolitan markets in Dougherty, Lowndes, Houston, Chatham and Muscogee counties. As a result, the Company originates and maintains large credit relationships with several commercial customers in the ordinary course of business. The Company considers large credit relationships to be those with commitments equal to or in excess of $5.0 million prior to any portion being sold. Large relationships also include loan participations purchased if the credit relationship with the agent is equal to or in excess of $5.0 million. In addition to the Company’s normal policies and procedures related to the origination of large credits, the Company’s Executive Loan Committee and Director Loan Committee must approve all new and renewed credit facilities which are part of large credit relationships. The following table provides additional information on the Company’s large credit relationships outstanding at December 31, 2019 and December 31, 2018.
|
December 31, 2019 |
December 31, 2018 |
|||||||||||||||||||||||
|
Period End Balances |
Period End Balances |
|||||||||||||||||||||||
|
Number of |
Number of |
|||||||||||||||||||||||
|
Relationships |
Committed |
Outstanding |
Relationships |
Committed |
Outstanding |
|||||||||||||||||||
| (dollars in thousands) | ||||||||||||||||||||||||
|
Large Credit Relationships: |
||||||||||||||||||||||||
|
$10 million or greater |
7
|
$ |
77,391
|
$ | 70,006 | 3 | $ | 35,394 | $ | 32,445 | ||||||||||||||
|
$5 million to $9.9 million |
13
|
97,366 | 86,215 | 24 | 123,331 | 103,124 | ||||||||||||||||||
Maturities and sensitivities of loans to changes in interest rates. The following table presents the maturity distribution of the Company’s loans at December 31, 2019. The table also presents the portion of loans that have fixed interest rates or variable interest rates that fluctuate over the life of the loans in accordance with changes in an interest rate index such as the prime rate.
|
(dollars in thousands) |
Due in One Year or Less |
After One, but Within Three Years |
After Three, but Within Five Years |
After Five Years |
Total |
|||||||||||||||
|
Loans with fixed interest rates |
$ | 186,391 | $ | 282,123 | $ | 144,577 | $ | 161,230 | $ | 774,321 | ||||||||||
|
Loans with floating interest rates |
39,709 | 25,948 | 6,426 | 122,410 | 194,493 | |||||||||||||||
|
Total |
$ | 226,100 | $ | 308,071 | $ | 151,003 | $ | 283,640 | $ | 968,814 | ||||||||||
The Company may renew loans at maturity when requested by a customer whose financial strength appears to support such renewal or when such renewal appears to be in the Company’s best interest. In such instances, the Company generally requires payment of accrued interest and may adjust the rate of interest, require a principal reduction or modify other terms of the loan at the time of renewal.
Nonperforming Assets and Potential Problem Loans
Year-end nonperforming assets and accruing past due loans were as follows:
|
(dollars in thousands) |
2019 |
2018 |
2017 |
2016 |
2015 |
|||||||||||||||
|
Loans accounted for on nonaccrual |
$ | 9,827 | $ | 9,482 | $ | 7,503 | $ | 12,350 | $ | 14,408 | ||||||||||
|
Loans accruing past due 90 days or more |
- | - | - | - | 8 | |||||||||||||||
|
Other real estate foreclosed |
1,320 | 1,841 | 4,256 | 6,439 | 8,839 | |||||||||||||||
|
Total nonperforming assets |
$ | 11,146 | $ | 11,323 | $ | 11,759 | $ | 18,789 | $ | 23,255 | ||||||||||
|
Nonperforming loans by segment |
||||||||||||||||||||
|
Construction, land & land development |
$ | 128 | $ | 883 | $ | 2,630 | $ | 3,376 | $ | 7,106 | ||||||||||
|
Commercial real estate |
3,772 | 5,874 | 4,635 | 9,982 | 11,011 | |||||||||||||||
|
Residential real estate |
3,728 | 3,299 | 3,309 | 4,375 | 4,197 | |||||||||||||||
|
Commercial, financial & agricultural |
2,061 | 1,051 |
997
|
844
|
762
|
|||||||||||||||
|
Consumer & other |
138 |
216
|
188
|
212
|
179 | |||||||||||||||
|
Total nonperforming loans |
$ | 9,827 | $ | 11,323 | $ | 11,759 | $ | 18,789 | $ | 23,255 | ||||||||||
|
Nonperforming assets as a percentage of: |
||||||||||||||||||||
|
Total loans and foreclosed assets |
1.15 | % | 1.44 | % | 1.53 | % | 2.47 | % | 3.03 | % | ||||||||||
|
Total assets |
0.74 | % | 0.90 | % | 0.95 | % | 1.55 | % | 1.98 | % | ||||||||||
|
Nonperforming loans as a percentage of: |
||||||||||||||||||||
|
Total loans |
1.01 | % | 1.21 | % | 0.98 | % | 1.64 | % | 1.90 | % | ||||||||||
|
Supplemental data: |
||||||||||||||||||||
|
Trouble debt restructured loans in compliance with modified terms |
$ | 12,337 | $ | 14,128 | $ | 18,363 | $ | 17,992 | $ | 19,375 | ||||||||||
|
Trouble debt restructured loans |
||||||||||||||||||||
|
Past due 30-89 days |
- | 864 | 131 | 319 | 344 | |||||||||||||||
|
Accruing past due loans: |
||||||||||||||||||||
|
30-89 days past due |
$ | 1,914 | $ | 8,234 | $ | 4,558 | $ | 4,469 | $ | 10,959 | ||||||||||
|
90 or more days past due |
- | - | 8 | |||||||||||||||||
|
Total accruing past due loans |
$ | 1,914 | $ | 8,234 | $ | 4,558 | $ | 4,469 | $ | 10,967 | ||||||||||
|
Allowance for loan losses |
$ | 6,863 | $ | 7,277 | $ | 7,508 | $ | 8,923 | $ | 8,604 | ||||||||||
|
Allowance for loan losses as a percentage of: |
||||||||||||||||||||
|
Total loans |
0.71 | % | 0.93 | % | 0.98 | % | 1.18 | % | 1.13 | % | ||||||||||
|
Nonperforming loans |
69.85 | % | 76.74 | % | 100.06 | % | 72.25 | % | 59.68 | % | ||||||||||
Nonperforming assets include nonaccrual loans, loans past due 90 days or more, foreclosed real estate and nonaccrual securities. Nonperforming assets at December 31, 2019 decreased 1.56% from December 31, 2018, primarily due to the sale of other real estate owned property. Nonperforming assets at December 31, 2018 decreased 3.71% from December 31, 2017.
Generally, loans are placed on nonaccrual status if principal or interest payments become 90 days past due and/or management deems the collectability of the principal and/or interest to be in question, as well as when required by regulatory requirements. Loans to a customer whose financial condition has deteriorated are considered for nonaccrual status whether or not the loan is 90 days or more past due. For consumer loans, collectability and loss are generally determined before the loan reaches 90 days past due. Accordingly, losses on consumer loans are recorded at the time they are determined. Consumer loans that are 90 days or more past due are generally either in liquidation/payment status or bankruptcy awaiting confirmation of a plan. Once interest accruals are discontinued, accrued but uncollected interest is charged to current year operations. Subsequent receipts on nonaccrual loans are recorded as a reduction of principal, and interest income is recorded only after principal recovery is reasonably assured. Classification of a loan as nonaccrual does not preclude the ultimate collection of loan principal or interest.
Troubled debt restructured loans are loans on which, due to deterioration in the borrower’s financial condition, the original terms have been modified in favor of the borrower or either principal or interest has been forgiven.
Foreclosed assets represent property acquired as the result of borrower defaults on loans. Foreclosed assets are recorded at estimated fair value, less estimated selling costs, at the time of foreclosure. Write-downs occurring at foreclosure are charged against the allowance for loan losses. On an ongoing basis, properties are appraised as required by market indications and applicable regulations. Write-downs are provided for subsequent declines in value and are included in other non-interest expense along with other expenses related to maintaining the properties.
Allowance for Loan Losses
The allowance for loan losses is a reserve established through a provision for loan losses charged to expense, which represents management’s best estimate of probable losses that have been incurred within the existing portfolio of loans. The allowance, in the judgment of management, is necessary to reserve for estimated loan losses and risks inherent in the loan portfolio. The allowance for loan losses includes allowance allocations calculated in accordance with current U.S. accounting standards. The level of the allowance reflects management’s continuing evaluation of industry concentrations, specific credit risks, loan loss experience, current loan portfolio quality, present economic, political and regulatory conditions and unidentified losses inherent in the current loan portfolio. Portions of the allowance may be allocated for specific credits; however, the entire allowance is available for any credit that, in management’s judgment, should be charged off. While management utilizes its best judgment and information available, the ultimate adequacy of the allowance is dependent upon a variety of factors beyond the Company’s control, including the performance of the Company’s loan portfolio, the economy, changes in interest rates and the view of the regulatory authorities toward loan classifications.
The Company’s allowance for loan losses consists of specific valuation allowances established for probable losses on specific loans and historical valuation allowances for other loans with similar risk characteristics. The allowances established for probable losses on specific loans are the result of management’s quarterly review of substandard loans with an outstanding balance of $250,000 or more. This review process usually involves regional credit officers along with local lending officers reviewing the loans for impairment. Specific valuation allowances are determined after considering the borrower’s financial condition, collateral deficiencies, and economic conditions affecting the borrower’s industry, among other things. In the case of collateral dependent loans, collateral shortfall is most often based upon local market real estate value estimates. This review process is performed at the subsidiary bank level and is reviewed at the parent Company level.
Once the loan becomes impaired, it is removed from the pool of loans covered by the general reserve and reviewed individually for exposure as described above. In cases where the individual review reveals no exposure, no reserve is recorded for that loan, either through an individual reserve or through a general reserve. If, however, the individual review of the loan does indicate some exposure, management often charges off this exposure, rather than recording a specific reserve. In these instances, a loan which becomes nonperforming could actually reduce the allowance for loan losses. Those loans deemed uncollectible are transferred to our problem loan department for workout, foreclosure and/or liquidation. The problem loan department obtains a current appraisal on the property in order to record the fair market value (less selling expenses) when the property is foreclosed on and moved into other real estate.
The allowances established for the remainder of the loan portfolio are based on historical loss factors, adjusted for certain qualitative factors, which are applied to groups of loans with similar risk characteristics. Loans are segregated into fifteen separate groups based on call codes. Most of the Company’s charge-offs during the past two years have been real estate dependent loans. The historical loss ratios applied to these groups of loans are updated quarterly based on actual charge-off experience. The historical loss ratios are further adjusted by qualitative factors.
Management evaluates the adequacy of the allowance for each of these components on a quarterly basis. Peer comparisons, industry comparisons, and regulatory guidelines are also used in the determination of the general valuation allowance. Loans identified as losses by management, internal loan review, and/or bank examiners are charged off. Additional information about the Company’s allowance for loan losses is provided in the Notes to the Consolidated Financial Statements for Allowance for Loan Losses.
The following table sets forth the breakdown of the allowance for loan losses by loan category for the periods indicated. The allocation of the allowance to each category is subjective and is not necessarily indicative of future losses and does not restrict the use of the allowance to absorb losses in any other category.
|
December 31, |
December 31, |
December 31, |
December 31, |
December 31, |
||||||||||||||||||||||||||||||||||||
|
(dollars in thousands) |
2019 |
2018 |
2017 |
2016 |
2015 |
|||||||||||||||||||||||||||||||||||
|
Reserve |
%* |
Reserve |
%* |
Reserve |
%* |
Reserve |
%* |
Reserve |
%* |
|||||||||||||||||||||||||||||||
|
Construction, land & land development |
$ | 215 | 9.9 | % | $ | 131 | 7.7 | % | $ | 1,216 | 7.0 | % | $ | 336 | 5.6 | % | $ | 711 | 6.5 | % | ||||||||||||||||||||
|
Commercial real estate |
3,908 | 55.8 | % | 5,251 | 55.8 | % | 4,654 | 54.7 | % | 6,473 | 55.2 | % | 4,763 | 53.8 | % | |||||||||||||||||||||||||
|
Residential real estate |
980 | 20.1 | % | 1,181 | 24.0 | % | 968 | 25.4 | % | 1,396 | 25.9 | % | 1,990 | 26.0 | % | |||||||||||||||||||||||||
|
Commercial , financial, & agricultural |
1,657 | 11.8 | % | 618 | 9.5 | % | 633 | 8.5 | % | 624 | 8.5 | % | 1,058 | 8.8 | % | |||||||||||||||||||||||||
|
Consumer & other |
103 | 2.4 | % | 96 | 3.0 | % | 37 | 4.4 | % | 94 | 4.8 | % | 82 | 4.9 | % | |||||||||||||||||||||||||
| $ | 6,863 | 100.0 | % | $ | 7,277 | 100.0 | % | $ | 7,508 | 100.0 | % | $ | 8,923 | 100.0 | % | $ | 8,604 | 100.0 | % | |||||||||||||||||||||
|
* |
Percentage represents the loan balance in each category expressed as a percentage of total end of period loans. |
The following table presents an analysis of the Company’s loan loss experience for the periods indicated.
|
(dollars in thousands) |
2019 |
2018 |
2017 |
2016 |
2015 |
|||||||||||||||
|
Allowance for loan losses at beginning of year |
$ | 7,277 | $ | 7,508 | $ | 8,923 | $ | 8,604 | $ | 8,802 | ||||||||||
|
Charge-offs |
||||||||||||||||||||
|
Construction, land & land development |
29 | - | 52 | 25 | 98 | |||||||||||||||
|
Commercial real estate |
119 | 257 | 1,027 | 1,112 | 315 | |||||||||||||||
|
Residential real estate |
758 | 162 | 1,048 | 362 | 930 | |||||||||||||||
|
Commercial , financial, & agricultural |
403 | 247 | 458 | 324 | 460 | |||||||||||||||
|
Consumer & other |
784 | 299 | 330 | 265 | 280 | |||||||||||||||
|
Total charge-offs |
$ | 2,093 | $ | 965 | $ | 2,915 | $ | 2,088 | $ | 2,083 | ||||||||||
|
Recoveries |
||||||||||||||||||||
|
Construction, land & land development |
82 | 155 | 266 | 814 | 486 | |||||||||||||||
|
Commercial real estate |
218 | 52 | 544 | 351 | 290 | |||||||||||||||
|
Residential real estate |
174 | 91 | 82 | 50 | 110 | |||||||||||||||
|
Commercial , financial, & agricultural |
36 | 161 | 141 | 71 | 55 | |||||||||||||||
|
Consumer & other |
65 | 74 | 77 | 59 | 62 | |||||||||||||||
|
Total recoveries |
575 | 533 | 1,110 | 1,345 | 1,003 | |||||||||||||||
|
Net charge-offs |
1,518 | 432 | 1,805 | 743 | 1,080 | |||||||||||||||
|
Provision for loans losses |
1,104 | 201 | 390 | 1,062 | 866 | |||||||||||||||
|
Allowance for loan losses at end of year |
$ | 6,863 | $ | 7,277 | $ | 7,508 | $ | 8,923 | $ | 8,588 | ||||||||||
|
Ratio of net charge-offs to average loans |
0.17 | % | 0.06 | % | 0.24 | % | 0.10 | % | 0.14 | % | ||||||||||
The allowance for loan losses decreased from $7.3 million, or 0.93% of total loans at December 31, 2018 to $6.9 million, or 0.71% of total loans at December 31, 2019. The provision for loan losses reflects loan quality trends, including the level of net charge-offs or recoveries, among other factors. The decline in 2019 was primarily due to the acquisitions of LBC Bancshares, Inc, which had over $130 million in total loans. Applicable accounting guidance did not allow us to record an allowance for loan losses upon the acquisition of loans – instead the acquired loans were recorded at their discounted fair value, which included the consideration of any expected losses. No allowance for loan losses will be recorded for the acquired loans until the expected credit losses exceed the remaining unamortized discounts – based on an individual basis for purchased credit impaired loans and on a pooled basis for performing acquired loans. Significant changes in the allowance during 2018 was the reduction in the net charge-offs in 2018 to $432,000 from $1.8 million in 2017, or a decrease of $1.4 million. Significant changes in the allowance during 2017 was the increase in the net charge-offs in 2017 to $1.8 million from $743,000 in 2016. The Company believes that collection efforts have reduced impaired loans and the reduction in net charge-offs runs parallel with the improvement in the substandard assets. During 2019, we have continued to see stabilization in the economy, housing and the real estate market, as such we expect continued improvement in our substandard assets, including net charge-offs. There were no charge-offs or recoveries related to foreign loans during any of the periods presented.
Investment Portfolio
The following table presents carrying values of investment securities held by the Company as of December 31, 2019, 2018 and 2017.
|
(dollars in thousands) |
2019 |
2018 |
2017 |
|||||||||
|
State, county and municipal securities |
$ | 5,115 | $ | 3,989 | $ | 4,493 | ||||||
|
Corporate debt securities |
2806 | 2,872 | 2,060 | |||||||||
|
Mortgage-backed securities |
339,411 | 346,205 | 347,694 | |||||||||
|
Total debt securities |
$ | 347,332 | $ | 353,066 | $ | 354,247 | ||||||
The following table represents expected maturities and weighted-average yields of investment securities held by the Company as of December 31, 2019 (mortgage-backed securities are based on the average life at the projected speed, while State and Political Subdivisions reflect anticipated calls being exercised).
|
After 1 Year But |
After 5 Years But |
|||||||||||||||||||||||||||||||
|
Within 1 Year |
Within 5 Years |
Within 10 Years |
After 10 Years |
|||||||||||||||||||||||||||||
|
(dollars in thousands) |
Amount |
Yield |
Amount |
Yield |
Amount |
Yield |
Amount |
Yield |
||||||||||||||||||||||||
|
State, county and municipal securities |
$ |
150 |
2.03 | % | $ | 1,193 | 2.38 | % | $ | 744 | 3.15 | % | $ | 3,028 | 2.57 | % | ||||||||||||||||
|
Corporate debt securities |
- | - | 2,022 | 4.03 | - | - | 784 | 3.12 | ||||||||||||||||||||||||
|
Mortgage-backed securities |
- | - | 1,935 | 3.35 | 61,933 | 2.70 | 275,543 | 2.17 | ||||||||||||||||||||||||
|
Total debt securities |
$ | 150 | 2.03 | % | $ | 5,150 | 3.39 | % | $ | 62,677 | 2.71 | % | $ | 279,355 | 2.18 | % | ||||||||||||||||
Securities are classified as held to maturity and carried at amortized cost when management has the positive intent and ability to hold them to maturity. Securities are classified as available for sale when they might be sold before maturity. Securities available for sale are carried at fair value, with unrealized holding gains and losses reported in other comprehensive income. The Company has 100% of its portfolio classified as available for sale.
At December 31, 2019, there were no holdings of any one issuer, other than the U.S. government and its agencies, in an amount greater than 10% of the Company’s stockholders’ equity.
The average yield of the securities portfolio was 2.37% in 2019 compared to 2.24% in 2018 and 2.00% in 2017. The increase in the average yield from 2018 to 2019 and from 2017 to 2018 was primarily attributed to the purchase of new securities which have a higher yield.
Deposits
The following table presents the average amount outstanding and the average rate paid on deposits by the Company for the years 2019, 2018 and 2017.
|
2019 |
2018 |
2017 |
||||||||||||||||||||||
|
Average |
Average |
Average |
Average |
Average |
Average |
|||||||||||||||||||
|
(dollars in thousands) |
Amount |
Rate |
Amount |
Rate |
Amount |
Rate |
||||||||||||||||||
|
Noninterest-bearing demand deposits |
$ | 211,462 | - | $ | 173,442 | - | $ | 158,924 | - | |||||||||||||||
|
Interest-bearing demand and savings deposits |
640,180 | 0.67 | % | 534,887 | 0.52 | % | 517,974 | 0.37 | % | |||||||||||||||
|
Time deposits |
361,319 | 1.60 | % | 326,243 | 1.01 | % | 353,587 | 0.81 | % | |||||||||||||||
|
Total deposits |
$ | 1,212,961 | 0.83 | % | $ | 1,034,572 | 0.59 | % | $ | 1,030,485 | 0.46 | % | ||||||||||||
The following table presents the maturities of the Company’s time deposits as of December 31, 2019.
|
Time |
Time |
|||||||||||
|
Deposits |
Deposits |
|||||||||||
| $250,000 |
Less than |
|||||||||||
|
(dollars in thousands) |
or Greater |
$250,000 |
Total |
|||||||||
|
Months to Maturity |
||||||||||||
|
3 or less |
$ | 8,179 | $ | 61,724 | $ | 69,903 | ||||||
|
Over 3 through 6 |
12,212 | 88,926 | 101,138 | |||||||||
|
Over 6 through 12 |
17,675 | 58,542 | 76,217 | |||||||||
|
Over 12 Months |
17,611 | 82,610 | 100,221 | |||||||||
| $ | 55,677 | $ | 291,802 | $ | 347,479 | |||||||
Average deposits increased $178.4 million in 2019 compared to 2018 and increased $4.1 million in 2018 compared to 2017. The increase in 2019 included $105.3 million, or 19.7% in interest-bearing demand and savings deposits while, at the same time noninterest bearing deposits increased $38.0 million, or 21.9% and time deposits increased $35.1 million, or 10.8%. The 2019 increases were primarily attributable to the acquisition of LBC Bancshares, Inc. in May 2019. The increase in 2018 included $16.9 million, or 3.3% in interest-bearing demand and savings deposits while, at the same time noninterest bearing deposits increased $14.5 million, or 9.1% and time deposits decreased $27.3 million, or 7.7%. Accordingly, the ratio of average noninterest-bearing deposits to total average deposits was 17.4% in 2019, 16.8% in 2018 and 15.4% in 2017. The general increase in market rates in 2019 had the effect of (i) increasing the average cost of interest-bearing deposits by 30 basis points in 2019 compared to 2018 and (ii) offset a portion of the impact of increasing yields on interest-earning assets on the Company’s net interest income in 2018. The general increase in market rates in 2018 had the effect of (i) increasing the average cost of interest-bearing deposits by 15 basis points in 2018 compared to 2017 and (ii) offset a portion of the impact of increasing yields on interest-earning assets on the Company’s net interest income in 2018.
Total average interest-bearing deposits increased $140.4 million, or 16.3% in 2019 compared to 2018 and decreased $10.4 million, or 1.20% in 2018 compared to 2017. The increase in 2019 was primarily attributable to the acquisition of LBC Bancshares, Inc. in May 2019 The decrease in 2018 was primarily attributable to the decrease in time deposits, and for 2017, the increase was primarily attributable to the increase in interest-bearing demand and savings accounts.
The Company supplements deposit sources with brokered deposits. As of December 31, 2019, the Company had $2.0 million, or 0.2% of total deposits, in brokered certificates of deposit attracted by external third parties. Additional information is provided in the Notes to Consolidated Financial Statements for Deposits.
Off-Balance-Sheet Arrangements and Contractual Obligations
In the ordinary course of business, our Bank has granted commitments to extend credit to approved customers. Generally, these commitments to extend credit have been granted on a temporary basis for seasonal or inventory requirements or for construction period financing and have been approved within the Bank’s credit guidelines. Our Bank has also granted commitments to approved customers for financial standby letters of credit. These commitments are recorded in the financial statements when funds are disbursed or the financial instruments become payable. The Bank uses the same credit policies for these off-balance-sheet commitments as it does for financial instruments that are recorded in the consolidated financial statements. Commitments generally have fixed expiration dates or other termination clauses and may require payment of a fee. Since many of the commitment amounts expire without being drawn upon, the total commitment amounts do not necessarily represent future cash requirements.
The following table summarizes commitments and contractual obligations outstanding at December 31, 2019.
|
(dollars in thousands) |
Payments Due by Period |
|||||||||||||||||||
|
Total |
Less Than 1 Year |
1 – 3 Years |
3 – 5 Years |
More Than 5 Years |
||||||||||||||||
|
Contractual Obligations: |
||||||||||||||||||||
|
Subordinated debentures |
$ | 24,229 | $ | - | $ | - | $ | - | $ | 24,229 | ||||||||||
| Other borrowed money | 61,563 | 3,500 | 23,313 | 3,000 | 31,750 | |||||||||||||||
|
Operating lease liabilities |
587 | 186 | 183 | 90 | 128 | |||||||||||||||
|
Time Deposits |
347,479 | 246,342 | 87,068 | 13,702 | 367 | |||||||||||||||
| 433,858 | 250,028 |
110,564
|
16,792 | 56,474 | ||||||||||||||||
|
Other Commitments: |
||||||||||||||||||||
|
Loan commitments |
102,890 | 102,890 | - | - | - | |||||||||||||||
|
Standby letters of credit |
1,576 | 1,576 | - | - | - | |||||||||||||||
| 104,466 | 104,466 | - | - | - | ||||||||||||||||
|
Total Contractual Obligations and Other Commitments |
$ | 538,324 | $ | 354,494 | $ | 110,564 | $ | 16,792 | $ | 56,474 | ||||||||||
In the ordinary course of business, the Company has entered into off-balance sheet financial instruments which are not reflected in the consolidated financial statements. These instruments include commitments to extend credit, standby letters of credit, performance letters of credit, guarantees and liability for assets held in trust.
Such financial instruments are recorded in the financial statements when funds are disbursed or the instruments become payable. The Company uses the same credit policies for these off-balance sheet financial instruments as they do for instruments that are recorded in the consolidated financial statements.
Loan Commitments. The Company enters into contractual commitments to extend credit, normally with fixed expiration dates or termination clauses, at specified rates and for specific purposes. Substantially all of the Company’s commitments to extend credit are contingent upon customers maintaining specific credit standards at the time of loan funding. The Company minimizes its exposure to loss under these commitments by subjecting them to credit approval and monitoring procedures. Management assesses the credit risk associated with certain commitments to extend credit in determining the level of the allowance for loan losses. Loan commitments outstanding at December 31, 2019 are included in the preceding table.
Standby Letters of Credit. Letters of credit are written conditional commitments issued by the Company to guarantee the performance of a customer to a third party. In the event the customer does not perform in accordance with the terms of the agreement with the third party, the Company would be required to fund the commitment. The maximum potential amount of future payments the Company could be required to make is represented by the contractual amount of the commitment. If the commitment is funded, the Company would be entitled to seek recovery from the customer. The Company’s policies generally require that standby letters of credit arrangements contain security and debt covenants similar to those contained in loan agreements. Standby letters of credit outstanding at December 31, 2019 are included in the preceding table.
Capital Requirements
The Bank is required under federal law to maintain certain minimum capital levels based on ratios of capital to total assets and capital to risk-weighted assets. The required capital ratios are minimums, and the federal banking agencies may determine that a banking organization, based on its size, complexity or risk profile, must maintain a higher level of capital in order to operate in a safe and sound manner. Risks such as concentration of credit risks and the risk arising from non-traditional activities, as well as the institution’s exposure to a decline in the economic value of its capital due to changes in interest rates, and an institution’s ability to manage those risks are important factors that are to be taken into account by the federal banking agencies in assessing an institution’s overall capital adequacy. For more information, see “Item 1. Business – Supervision and Regulation – Regulation of the Company – Capital Requirements.”
At December 31, 2019, shareholders’ equity totaled $130.5 million compared to $95.7 million at December 31, 2018. In addition to net income of $10.2 million, other significant changes in shareholders’ equity during 2019 included $2.7 million of dividends declared on common stock and $18.7 million of common stock issued as part of the LBC Bancshares, Inc. acquisition. The accumulated other comprehensive loss component of stockholders’ equity totaled $362,000 at December 31, 2019 compared to $(8.2) million at December 31, 2018. This fluctuation was mostly related to the after-tax effect of changes in the fair value of securities available for sale. Under regulatory requirements, the unrealized gain or loss on securities available for sale does not increase or reduce regulatory capital and is not included in the calculation of risk-based capital and leverage ratios. Regulatory agencies for banks and bank holding companies utilize capital guidelines designed to measure Tier 1 and total capital and take into consideration the risk inherent in both on-balance sheet and off-balance sheet items.
Tier 1 capital consists of common stock and qualifying preferred stockholders’ equity less goodwill and disallowed deferred tax assets. Tier 2 capital consists of certain convertible, subordinated and other qualifying debt and the allowance for loan losses up to 1.25% of risk-weighted assets. The Company has no Tier 2 capital other than the allowance for loan losses.
Using the capital requirements presently in effect, the Tier 1 ratio as of December 31, 2019 was 12.52% and total Tier 1 and 2 risk-based capital was 13.17%. Both of these measures compare favorably with the regulatory minimum of 6% for Tier 1 and 8% for total risk-based capital. The Company’s common equity Tier 1 ratio as of December 31, 2019 was 10.33%, which exceeds the regulatory minimum of 4.50%. The Company’s Tier 1 leverage ratio as of December 31, 2019 was 8.92%, which exceeds the required ratio standard of 4%.
For 2019, average capital was $117.0 million, representing 8.3% of average assets for the year. This compares to average capital of 89.4 million, representing 7.4% of average assets for 2018.
For 2019, the Company did not have any material commitments for capital expenditures.
On August 23, 2018, the Company granted 5,650 restricted shares of common stock to T. Heath Fountain, President and Chief Executive Officer, as part of his employment agreement. The restricted shares will vest over a three year period.
The Company reinstated payment of common stock dividends in 2017. A cash dividend of $2.7 million was paid in 2019 and a cash dividend of $1.69 million was paid in 2018.
The Company redeemed the remaining $9.36 million in preferred stock in 2017. In 2018, the Company repurchased $3.17 million of warrants. Additional information is provided in the Notes to the Consolidated Financial Statements for Preferred Stock and Warrants.
Liquidity
The Company, primarily through the actions of its subsidiary bank, engages in liquidity management to ensure adequate cash flow for deposit withdrawals, credit commitments and repayments of borrowed funds. Needs are met through loan repayments, net interest and fee income and the sale or maturity of existing assets. In addition, liquidity is continuously provided through the acquisition of new deposits, the renewal of maturing deposits and external borrowings.
Management monitors deposit flow and evaluates alternate pricing structures to retain and grow deposits. To the extent needed to fund loan demand, traditional local deposit funding sources are supplemented by the use of FHLB borrowings, brokered deposits and other wholesale deposit sources outside the immediate market area. Internal policies have been updated to monitor the use of various core and non-core funding sources, and to balance ready access with risk and cost. Through various asset/liability management strategies, a balance is maintained among goals of liquidity, safety and earnings potential. Internal policies that are consistent with regulatory liquidity guidelines are monitored and enforced by the Bank.
The investment portfolio provides a ready means to raise cash if liquidity needs arise. As of December 31, 2019, the available for sale bond portfolio totaled $347.3 million. At December 31, 2018, the available for sale bond portfolio totaled $353.1 million. Only marketable investment grade bonds are purchased. Although approximately half of the Bank’s bond portfolio is encumbered as pledges to secure various public funds deposits, repurchase agreements, and for other purposes, management can restructure and free up investment securities for sale if required to meet liquidity needs.
Management continually monitors the relationship of loans to deposits as it primarily determines the Company’s liquidity posture. Colony had ratios of loans to deposits of 74.9% as of December 31, 2019 and 72.0% as of December 31, 2018. Management employs alternative funding sources when deposit balances will not meet loan demands. The ratios of loans to all funding sources (excluding Subordinated Debentures) at December 31, 2019 and December 31, 2018 were 71.5% and 69.2%, respectively. Management continues to emphasize programs to generate local core deposits as our Company’s primary funding sources. The stability of the Banks’ core deposit base is an important factor in Colony’s liquidity position. A heavy percentage of the deposit base is comprised of accounts of individuals and small businesses with comprehensive banking relationships and limited volatility. At December 31, 2019 and December 31, 2018, the Bank had $55.7 million and $53.9 million, respectively, in certificates of deposit of $250,000 or more. These larger deposits represented 4.3% and 5.0% of total deposits as of December 31, 2019 and 2018, respectively. Management seeks to monitor and control the use of these larger certificates, which tend to be more volatile in nature, to ensure an adequate supply of funds as needed. Relative interest costs to attract local core relationships are compared to market rates of interest on various external deposit sources to help minimize the Company’s overall cost of funds.
The Company supplemented deposit sources with brokered deposits. As of December 31, 2019, the Company had $2.0 million or 0.2% of total deposits in CDARS. Additional information is provided in the Notes to the Consolidated Financial Statements regarding these brokered deposits. Additionally, the Company uses external deposit listing services to obtain out-of-market certificates of deposit at competitive interest rates when funding is needed. The deposits obtained from listing services are often referred to as wholesale or internet CDs. As of December 31, 2019, the Company had $6.0 million, or 0.5% of total deposits, in internet certificates of deposit obtained through deposit listing services.
To plan for contingent sources of funding not satisfied by both local and out-of-market deposit balances, Colony and its subsidiary have established multiple borrowing sources to augment their funds management. The Company has borrowing capacity through membership of the Federal Home Loan Bank program. The Bank has also established overnight borrowing for Federal Funds Purchased through various correspondent banks. Management believes the various funding sources discussed above are adequate to meet the Company’s liquidity needs in the future without any material adverse impact on operating results.
Liquidity measures the ability to meet current and future cash flow needs as they become due. The liquidity of a financial institution reflects its ability to meet loan requests, to accommodate possible outflows in deposits and to take advantage of interest rate market opportunities. The ability of a financial institution to meet its current financial obligations is a function of balance sheet structure, the ability to liquidate assets, and the availability of alternative sources of funds. The Company seeks to ensure its funding needs are met by maintaining a level of liquid funds through asset/liability management.
Asset liquidity is provided by liquid assets which are readily marketable or pledgeable or which will mature in the near future. Liquid assets include cash, interest-bearing deposits in banks, securities available for sale and federal funds sold and securities purchased under resale agreements.
Liability liquidity is provided by access to funding sources which include core deposits. Should the need arise, the Company also maintains relationships with the Federal Home Loan Bank, Federal Reserve Bank, two correspondent banks and repurchase agreement lines that can provide funds on short notice.
Since Colony is a bank holding Company and does not conduct operations, its primary sources of liquidity are dividends up streamed from the subsidiary bank and borrowings from outside sources.
The liquidity position of the Company is continuously monitored and adjustments are made to the balance between sources and uses of funds as deemed appropriate. Management is not aware of any events that are reasonably likely to have a material adverse effect on the Company’s liquidity, capital resources or operations. In addition, management is not aware of any regulatory recommendations regarding liquidity, which if implemented, would have a material adverse effect on the Company.
Impact of Inflation and Changing Prices
The Company’s financial statements included herein have been prepared in accordance with accounting principles generally accepted in the United States (GAAP). GAAP presently requires the Company to measure financial position and operating results primarily in terms of historic dollars. Changes in the relative value of money due to inflation or recession are generally not considered. The primary effect of inflation on the operations of the Company is reflected in increased operating costs, though given recent economic conditions, the Company has not experienced any material effects of inflation during the last three fiscal years. In management’s opinion, changes in interest rates affect the financial condition of a financial institution to a far greater degree than changes in the inflation rate. While interest rates are greatly influenced by changes in the inflation rate, they do not necessarily change at the same rate or in the same magnitude as the inflation rate. Interest rates are highly sensitive to many factors that are beyond the control of the Company, including changes in the expected rate of inflation, the influence of general and local economic conditions and the monetary and fiscal policies of the United States government, its agencies and various other governmental regulatory authorities, among other things, as further discussed in the next section.
Regulatory and Economic Policies
The Company’s business and earnings are affected by general and local economic conditions and by the monetary and fiscal policies of the United States government, its agencies and various other governmental regulatory authorities, among other things. The Federal Reserve Board regulates the supply of money in order to influence general economic conditions. Among the instruments of monetary policy available to the Federal Reserve Board are (i) conducting open market operations in United States government obligations, (ii) changing the discount rate on financial institution borrowings, (iii) imposing or changing reserve requirements against financial institution deposits, and (iv) restricting certain borrowings and imposing or changing reserve requirements against certain borrowings by financial institutions and their affiliates. These methods are used in varying degrees and combinations to affect directly the availability of bank loans and deposits, as well as the interest rates charged on loans and paid on deposits. For that reason alone, the policies of the Federal Reserve Board have a material effect on the earnings of the Company.
Governmental policies have had a significant effect on the operating results of commercial banks in the past and are expected to continue to do so in the future; however, the Company cannot accurately predict the nature, timing or extent of any effect such policies may have on its future business and earnings.
Recently Issued Accounting Pronouncements
See Note 1 - Summary of Significant Accounting Policies included in the Notes to the Consolidated Financial Statements.
Market Risk and Interest Rate Sensitivity
Our financial performance is impacted by, among other factors, interest rate risk and credit risk. We do not utilize derivatives to mitigate our credit risk, relying instead on an extensive loan review process and our allowance for loan losses.
Interest rate risk is the change in value due to changes in interest rates. The Company is exposed only to U.S. dollar interest rate changes and, accordingly, the Company manages exposure by considering the possible changes in the net interest margin. The Company does not have any trading instruments nor does it classify any portion of its investment portfolio as held for trading. The Company does not engage in any hedging activity or utilize any derivatives. The Company has no exposure to foreign currency exchange rate risk, commodity price risk and other market risks. Interest rate risk is addressed by our Risk Management Committee which includes senior management representatives. The Risk Management Committee monitors interest rate risk by analyzing the potential impact to the net portfolio of equity value and net interest income from potential changes to interest rates and considers the impact of alternative strategies or changes in balance sheet structure.
Interest rates play a major part in the net interest income of financial institutions. The repricing of interest earnings assets and interest-bearing liabilities can influence the changes in net interest income. The timing of repriced assets and liabilities is Gap management and our Company has established its policy to maintain a Gap ratio in the one-year time horizon of .80 to 1.20.
Our exposure to interest rate risk is reviewed at least quarterly by our Board of Directors and by our Risk Management Committee. Interest rate risk exposure is measured using interest rate sensitivity analysis to determine our change in net portfolio value in the event of assumed changes in interest rates. In order to reduce the exposure to interest rate fluctuations, we have implemented strategies to more closely match our balance sheet composition. The Company has engaged FTN Financial to run a quarterly asset/liability model for interest rate risk analysis. We are generally focusing our investment activities on securities with terms or average lives in the 3 ½ - 5 ½ year range.
Market risk reflects the risk of economic loss resulting from adverse changes in market prices and interest rates. This risk of loss can be reflected in either reduced current market values or reduced current and potential net income. Colony’s most significant market risk is interest rate risk. This risk arises primarily from Colony’s extension of loans and acceptance of deposits.
Managing interest rate risk is a primary goal of the asset liability management function. Colony attempts to achieve stability in net interest income while limiting volatility arising from changes in interest rates. Colony seeks to achieve this goal by balancing the maturity and repricing characteristics of assets and liabilities. Colony manages its exposure to fluctuations in interest rates through policies established by the Risk Management Committee and approved by the Board of Directors. The Risk Management Committee meets at least quarterly and has responsibility for developing asset liability management policies, reviewing the interest rate sensitivity of Colony, and developing and implementing strategies to improve balance sheet structure and interest rate risk positioning.
Colony measures the sensitivity of net interest income to changes in market interest rates through the utilization of Asset/Liability simulation modeling. On at least a quarterly basis, the following twenty-four month time period is simulated to determine a baseline net interest income forecast and the sensitivity of this forecast to changes in interest rates. These simulations include all of Colony’s earning assets and liabilities. Forecasted balance sheet changes, primarily reflecting loan and deposit growth and forecasts, are included in the periods modeled. Projected rates for loans and deposits are based on management’s outlook and local market conditions.
The magnitude and velocity of rate changes among the various asset and liability groups exhibit different characteristics for each possible interest rate scenario; additionally, customer loan and deposit preferences can vary in response to changing interest rates. Simulation modeling enables Colony to capture the expected effect of these differences. Assumptions utilized in the model are updated on an ongoing basis and are reviewed and approved by the Risk Management Committee of the Board of Directors.
Colony has modeled its baseline net interest income forecast assuming a flat interest rate environment with the federal funds rate at the Federal Reserve's targeted range of 1.50% to 1.75% and the prime rate of 4.75% at December 31, 2019. Colony has modeled the impact of a gradual increase in short-term rates of 100 and 200 basis points and a decline of 100 basis points to determine the sensitivity of net interest income for the next twelve months. As illustrated in the table below, the net interest income sensitivity model indicates that, compared with a net interest income forecast assuming stable rates, net interest income is projected to increase by 2.54% and 3.87% if interest rates increased by 100 and 200 basis points, respectively. Net interest income is projected to decline by 4.12% if interest rates decreased by 100 basis points. These changes were within Colony’s policy limit of a maximum 15% negative change.
| Twelve Month Net Interest Income Sensitivity | ||||||||
|
Estimated Change in Net Interest Income As of December 31, |
||||||||
|
Change in Short-term Interest Rates (in basis points) |
2019 |
2018 |
||||||
|
+200 |
3.87% | 2.36% | ||||||
|
+100 |
2.54% | 1.46% | ||||||
|
Flat |
-% | -% | ||||||
| -100 | -4.12% | -2.86% | ||||||
The measured interest rate sensitivity indicates an asset sensitive position over the next year, which could serve to improve net interest income in a rising interest rate environment. The actual realized change in net interest income would depend on several factors, some of which could serve to reduce or eliminate the asset sensitivity noted above. These factors include a higher than projected level of deposit customer migration to higher cost deposits, such as certificates of deposit, which would increase total interest expense and serve to reduce the realized level of asset sensitivity. Another factor which could impact the realized interest rate sensitivity in a rising rate environment is the repricing behavior of interest bearing non-maturity deposits. Assumptions for repricing are expressed as a beta relative to the change in the prime rate. For instance, a 25% beta would correspond to a deposit rate that would increase 0.25% for every 1% increase in the prime rate. Projected betas for interest bearing non-maturity deposit repricing are a key component of determining the Company's interest rate risk position. Should realized betas be higher than projected betas, the expected benefit from higher interest rates would be reduced.
Colony is also subject to market risk in certain of its fee income business lines. Mortgage banking income is subject to market risk. Mortgage loan originations are sensitive to levels of mortgage interest rates and therefore, mortgage banking income could be negatively impacted during a period of rising interest rates. The extension of commitments to customers to fund mortgage loans also subjects Colony to market risk. This risk is primarily created by the time period between making the commitment and closing and delivering the loan. Colony seeks to minimize this exposure by utilizing various risk management tools, the primary of which are forward sales commitments and best efforts commitments.
Return on Assets and Stockholders’ Equity
The following table presents selected financial ratios for each of the periods indicated.
|
Years Ended December 31 |
||||||||||||
|
2019 |
2018 |
2017 |
||||||||||
|
Return on Average Assets(1) |
0.72 |
% |
0.99 |
% |
0.63 |
% |
||||||
|
Return on Average Equity(1) |
8.73 |
% |
13.32 |
% |
8.28 |
% |
||||||
|
Equity to Assets |
8.61 |
% |
7.64 |
% |
7.33 |
% |
||||||
|
Common Stock Dividends Declared |
$ | 0.30 | $ | 0.20 | $ | 0.10 | ||||||
(1) Computed using net income available to common shareholders.
Item 7A
Quantitative and Qualitative Disclosures About Market Risk
The information required by this item is located in Item 7 under the heading Market Risk and Interest Rate Sensitivity.
Item 8
Financial Statements and Supplemental Data
The following consolidated financial statements of the Company and its subsidiaries are included on Exhibit 13 of this Annual Report on Form 10-K:
Consolidated Balance Sheets - December 31, 2019 and 2018
Consolidated Statements of Income - Years Ended December 31, 2019 and 2018
Consolidated Statements of Comprehensive Income - Years Ended December 31, 2019 and 2018
Consolidated Statements of Changes in Stockholders’ Equity - Years Ended December 31, 2019 and 2018
Consolidated Statements of Cash Flows - Years Ended December 31, 2019 and 2018
Notes to Consolidated Financial Statements
Quarterly Results of Operations (Unaudited)
The following is a summary of the unaudited quarterly results of operations for the years ended December 31, 2019 and 2018:
|
Three Months Ended |
||||||||||||||||
|
December 31 |
September 30 |
June 30 |
March 31 |
|||||||||||||
|
(dollars in thousands, except per share data) |
||||||||||||||||
|
2019 |
||||||||||||||||
|
Interest income |
$ | 16,182 | $ | 16,190 | $ | 15,098 | $ | 13,013 | ||||||||
|
Interest expense |
3,167 | 3,542 | 3,273 | 2,656 | ||||||||||||
|
Net interest income |
13,015 | 12,648 | 11,825 | 10,357 | ||||||||||||
|
Provision for loan losses |
580 | 214 | 179 | 131 | ||||||||||||
|
Securities gains |
(2) |
|
34 | 65 | - | |||||||||||
|
Noninterest income |
4,391 | 4,005 | 3,935 | 2,334 | ||||||||||||
|
Noninterest expense |
13,496 | 13,358 | 13,014 | 9,026 | ||||||||||||
|
Income before income taxes |
3,328 | 3,115 | 2,632 | 3,534 | ||||||||||||
|
Provision for income taxes |
571 | 597 | 531 | 699 | ||||||||||||
|
Net income |
2,757 | 2,518 | 2,101 | 2,835 | ||||||||||||
|
Net income per common share |
||||||||||||||||
|
Basic |
$ | 0.29 | $ | 0.27 | $ | 0.23 | $ | 0.34 | ||||||||
|
Diluted |
$ | 0.29 | $ | 0.27 | $ | 0.23 | $ | 0.34 | ||||||||
|
2018 |
||||||||||||||||
|
Interest income |
$ | 12,852 | $ | 12,251 | $ | 12,109 | $ | 11,810 | ||||||||
|
Interest expense |
2,454 | 2,146 | 1,944 | 1,681 | ||||||||||||
|
Net interest income |
10,398 | 10,105 | 10,165 | 10,129 | ||||||||||||
|
Provision for loan losses |
70 | 61 | 44 | 26 | ||||||||||||
|
Securities gains |
- | - | 116 | - | ||||||||||||
|
Noninterest income |
2,458 | 2,405 | 2,208 | 2,434 | ||||||||||||
|
Noninterest expense |
9,085 | 9,078 | 8,601 | 8,536 | ||||||||||||
|
Income before income taxes |
3,701 | 3,371 | 3,844 | 4,001 | ||||||||||||
|
Provision for income taxes |
736 | 676 | 775 | 813 | ||||||||||||
|
Net income |
2,965 | 2,695 | 3,069 | 3,188 | ||||||||||||
|
Net income per common share |
||||||||||||||||
|
Basic |
$ | 0.35 | $ | 0.32 | $ | 0.36 | $ | 0.38 | ||||||||
|
Diluted |
$ | 0.35 | $ | 0.32 | $ | 0.36 | $ | 0.37 | ||||||||
Item 9
Changes in and Disagreements with Accountants on Accounting and Financial Disclosure
The Company did not change auditors in 2019. In addition, there was no accounting or disclosure disagreement or reportable event with the current auditors that would have required the filing of a report on Form 8-K.
Item 9A
Controls and Procedures
The Company’s Chief Executive Officer and Chief Financial Officer have evaluated the Company’s disclosure controls and procedures (as such term is defined in Rules 13a-15(e) or 15d-15(e) promulgated under the Securities Exchange Act of 1934, as amended (the “Exchange Act”)), as of the end of the period covered by this report, as required by paragraph (b) of Rules 13a-15 or 15d-15 of the Exchange Act. Based on such evaluation, such officers have concluded that, as of the end of the period covered by this report, the Company’s disclosure controls and procedures were effective for ensuring that information the Company is required to disclose in reports that it files or submits under the Exchange Act, as amended, is recorded, processed, summarized and reported within the time periods specified in the SEC's rules and forms and that such information is accumulated and communicated to the Company's senior management, including its Chief Executive Officer and Chief Financial Officer, as appropriate to allow timely decisions regarding required disclosure.
During the year ended December 31, 2019, there were no changes in the Company’s internal control over financial reporting identified in connection with the evaluation required by paragraph (d) of Rules 13a-15 or 15d-15 of the Exchange Act that has materially affected, or is reasonably likely to materially affect, the Company’s internal control over financial reporting.
Management’s Report on Internal Control Over Financial Reporting
Colony’s management is responsible for establishing and maintaining adequate internal control over financial reporting. Colony’s internal control over financial reporting is a process designed under the supervision of the Chief Executive Officer and Chief Financial Officer to provide reasonable assurance regarding the reliability of financial reporting and the preparation of Colony’s financial statements for external purposes in accordance with generally accepted accounting principles.
Because of its inherent limitations, internal control over financial reporting may not prevent or detect misstatements. Therefore, even those systems determined to be effective can provide only reasonable assurance with respect to financial statement preparation and presentation.
Colony’s management assessed the effectiveness of Colony’s internal control over financial reporting as of December 31, 2019 based on the criteria for effective internal control over financial reporting established in Internal Control-Integrated Framework (2013), issued by the Committee of Sponsoring Organizations of the Treadway Commission. Based on the assessment, management determined that Colony maintained effective internal control over financial reporting as of December 31, 2019.
McNair, McLemore, Middlebrooks & Co., LLC, the independent registered public accounting firm that audited our consolidated financial statements included in this Annual Report on Form 10-K, has issued an audit report on the effectiveness of Colony’s internal control over financial reporting as of December 31, 2019. The report, which expresses an unqualified opinion on Colony’s internal control over financial reporting as of December 31, 2019 is included in this Annual Report on Form 10-K.
Colony Bankcorp, Inc.
March 30, 2020
Changes in Internal Controls
There were no changes made in our internal controls during the period covered by this report or, to our knowledge, in other factors that have materially affected, or are reasonably likely to materially affect these controls.
See the Certifications pursuant to Section 302 of the Sarbanes-Oxley Act of 2002.
Item 9B
Other Information
None.
Part III
Item 10
Directors and Executive Officers and Corporate Governance
Code of Ethics
Colony Bankcorp, Inc. has adopted a Code of Ethics that applies to the Company’s principal executive officer and principal accounting and financial officer. A copy of the Code of Ethics will be provided to any person without charge, upon written request mailed to Tracie Youngblood, Colony Bankcorp, Inc., 115 S. Grant Street, Fitzgerald, Georgia 31750.
The remaining information required by this item is incorporated by reference to the Directors and Nominees section of the Company’s definitive Proxy Statement to be filed with the Securities and Exchange Commission pursuant to Regulation 14A within 120 days after the end of the fiscal year covered by this Annual Report.
Item 11
Executive Compensation
The information required by this item is incorporated by reference to the Executive Compensation section of the Company’s definitive Proxy Statement to be filed with the Securities and Exchange Commission pursuant to Regulation 14A within 120 days after the end of the fiscal year covered by this Annual Report.
Item 12
Security Ownership of Certain Beneficial Owners and Management and Related Stockholder Matters
EQUITY COMPENSATION PLAN INFORMATION
The Company does not currently have any securities authorized for issuance pursuant to the grant or exercise of awards under an equity compensation plan.
The remaining information required by this item is incorporated by reference to Security Ownership of Certain Beneficial Owners section of the Company’s definitive Proxy Statement to be filed with the Securities and Exchange Commission pursuant to Regulation 14A within 120 days after the end of the fiscal year covered by this Annual Report.
Item 13
Certain Relationships and Related Transactions and Director Independence
The information required by this item is incorporated by reference to the Governance of the Company and Related Party Transactions with the Company sections of the Company’s definitive Proxy Statement to be filed with Securities and Exchange Commission pursuant to Regulation 14A within 120 days after the fiscal year covered by this Annual Report.
Item 14
Principal Accounting Fees and Services
The information required by this item is incorporated by reference to the Independent Public Accountants section of the Company’s definitive Proxy Statement to be filed with Securities and Exchange Commission pursuant to Regulation 14A within 120 days after the fiscal year covered by this Annual Report.
Part IV
Item 15
Exhibits, Financial Statement Schedules
|
(a) |
The following documents are filed as part of this report: |
||
|
|
|
|
|
|
|
(1) |
The consolidated financial statements of Colony Bankcorp, Inc. and subsidiaries are included on Exhibit 13 of this Annual Report on Form 10-K |
|
| Consolidated balance sheets – December 31, 2019 and 2018 | |||
| Consolidated statements of income – Years ended December 31, 2019 and 2018 | |||
| Consolidated statements of other comprehensive income – Years ended December 31, 2019 and 2018 | |||
| Consolidated statements of changes in stockholders’ equity– Years ended December 31, 2019 and 2018 | |||
|
|
|
Consolidated statements of cash flows –Years ended December 31, 2019 and 2018 |
|
| Notes to consolidated financial statements | |||
|
|
(2) |
Financial Statements Schedules: |
|
|
|
|
|
|
|
|
|
All schedules are omitted as the required information is inapplicable or the information is presented in the financial statements or the related notes. |
|
|
|
|
|
|
|
|
(3) |
A list of the exhibits required by Item 601 of Regulation S-K to be filed as a part of this report is shown on the “Exhibit Index” filed herewith. |
|
|
|
|
|
|
|
Exhibit Index |
|||
|
|
|
|
|
|
2.1 |
Agreement and Plan of Merger, dated December 17, 2018, by and between Colony Bankcorp, Inc. and LBC Bancshares, Inc. | ||
|
|
|
|
|
|
|
|
-filed as Exhibit 2.1 to the Registrant’s Current Report on Form 8-K (File No. 000-12436), filed with the Commission on December 18, 2018 and incorporated herein by reference. | |
|
|
|
|
|
|
3.1 |
Articles of Incorporation, as amended | ||
|
|
|
|
|
|
|
|
-filed as Exhibit 99.1 to the Registrant’s Quarterly Report on Form 10-Q (File No. 0-12436), filed with the Commission on August 4, 2014 and incorporated herein by reference. | |
|
|
|
|
|
|
3.2 |
Amended and Restated Bylaws | ||
| 4.1 | Description of Securities | ||
|
10.1 |
Deferred Compensation Plan and Sample Director Agreement† |
|
|
|
|
|
|
|
|
-filed as Exhibit 10(a) to the Registrant’s Registration Statement on Form 10 (File No. 0-18486), filed with the Commission on April 25, 1990 and incorporated herein by reference. |
|
|
|
|
|
10.2 |
Profit-Sharing Plan Dated January 1, 1979† |
|
|
|
|
|
|
|
|
-filed as Exhibit 10(b) to the Registrant’s Registration Statement on Form 10 (File No. 0-18486), filed with the Commission on April 25, 1990 and incorporated herein by reference. |
|
|
|
|
|
10.3 |
1999 Restricted Stock Grant Plan and Restricted Stock Grant Agreement† |
|
|
|
|
|
|
|
|
-filed as Exhibit 10.C to the Registrant’s Annual Report on Form 10-K405 (File 000-12436), filed with the Commission on March 30, 2001 and incorporated herein by reference. |
|
|
|
|
|
10.4 |
2004 Restricted Stock Grant Plan and Restricted Stock Grant Agreement† |
|
|
|
|
|
|
|
|
-filed as Exhibit C to the Registrant’s Definitive Proxy Statement for Annual Meeting of Stockholders held on April 27, 2004, filed with the Commission on March 3, 2004 (File No. 000-12436) and incorporated herein by reference. |
|
|
|
|
|
10.5 |
||
|
|
|
|
|
|
|
-filed as Exhibit 10.5 to the Registrant’s Quarterly Report on Form 10-Q (File No. 000-12436), filed with the Commission on November 5, 2004 and incorporated herein by reference. |
|
|
|
|
|
10.6 |
Employment Agreement, Dated May 14, 2012, Between Edward P. Loomis, Jr. and Colony Bankcorp, Inc.† |
|
|
|
|
|
|
|
|
-filed as Exhibit 10.1 to the Registrant’s Current Report on Form 8-K (File No. 000-12436), filed with the Commission on May 3, 2012 and incorporated herein by reference. |
|
10.7 |
||
|
|
|
|
|
|
|
-filed as Exhibit 99.1 to the Registrant’s Quarterly Report on Form 10-Q (File No. 000-12436), filed with the Commission on May 4, 2015 and incorporated herein by reference. |
|
|
|
|
|
10.8 |
Restricted Stock Award Between T. Heath Fountain and Colony Bankcorp, Inc.† |
|
|
|
|
|
|
|
|
-filed as Exhibit 10.1 to the Registrant’s Registration Statement on Form S-8 (File No. 333-226984), filed with the Commission on August 23, 2018 and incorporated herein by reference. |
|
|
|
|
|
10.9 |
Retention Agreement, Dated October 24, 2016, Between Colony Bank and Edward Lee Bagwell, III† |
|
|
|
|
|
|
|
|
-filed as Exhibit 99.2 to the Registrant’s Annual Report on Form 10-K (File No. 000-12436), filed with the Commission on March 10, 2017 and incorporated herein by reference. |
|
|
|
|
|
10.10 |
Renewal Agreement, Dated February 20, 2018, Between Colony Bank and Edward P. Loomis† |
|
|
|
|
|
|
|
|
-filed as Exhibit 99.3 to the Registrant’s Quarterly Report on Form 10-Q (File No. 000-12436), filed with the Commission on May 4, 2018 and incorporated herein by reference. |
|
|
|
|
| 10.11 | Employment Agreement, Dated July 27, 2018, Between T. Heath Fountain and Colony Bankcorp, Inc.† | |
| -filed as Exhibit 99.4 to the Registrant’s Quarterly Report on Form 10-Q (File No. 000-12436), filed with the Commission on November 2, 2018 and incorporated herein by reference. | ||
| 10.12 | Retention Agreement, Dated January 15, 2019, Between Colony Bank and Kimberly C. Dockery† | |
| -filed as Exhibit 99.2 to the Registrant’s Current Report on Form 8-K (File No. 000-12436), filed with the Commission on January 17, 2019 and incorporated herein by reference. | ||
| 10.13 | Separation Agreement, Dated May 31, 2019, Between Colony Bank and Lee A. Northcutt† | |
| -filed as Exhibit 10.1 to the Registrant’s Current Report on Form 8-K/A (File No. 000-12436), filed with the Commission on June 6, 2019 and incorporated herein by reference. | ||
| 10.14 | Employment Agreement, Dated June 24, 2019, Between Colony Bank and Tracie Youngblood† | |
| -filed as Exhibit 10.1 to the Registrant’s Current Report on Form 8-K/A (File No. 000-12436), filed with the Commission on June 24, 2019 and incorporated herein by reference. | ||
|
13 |
Consolidated Financial Statements of Colony Bankcorp, Inc. as of December 31, 2019 and 2018 |
|
|
|
|
|
|
21 |
||
|
|
|
|
| 23 | Consent of McNair, McLemore, Middlebrooks & Co., LLC | |
|
31.1 |
Certificate of Chief Executive Officer Pursuant to Section 302 of the Sarbanes-Oxley Act of 2002 |
|
|
|
|
|
|
31.2 |
||
|
|
|
|
|
32 |
||
|
|
|
|
|
101.INS |
XBRL Instance Document |
|
|
|
|
101.SCH |
XBRL Schema Document |
|
|
|
|
101.CAL |
XBRL Calculation Linkbase Document |
|
|
|
|
101.DEF |
XBRL Definition Linkbase Document |
|
|
|
|
101.LAB |
XBRL Label Linkbase Document |
|
|
|
|
101.PRE |
XBRL Presentation Linkbase Document |
| † |
Represents a management contract or a compensatory plan or arrangement. |
Item 16. Form 10-K Summary
None.
SIGNATURES
Pursuant to the requirements of Section 13 or 15(d) of the Securities Exchange Act of 1934, Colony Bankcorp, Inc. has duly caused this report to be signed on its behalf by the undersigned, thereunto duly authorized:
COLONY BANKCORP, INC.
|
/s/ T. Heath Fountain |
|
|
T. Heath Fountain President/Director/Chief Executive Officer |
|
| (Principal Executive Officer) | |
|
|
|
|
March 30, 2020 |
|
|
Date |
|
|
|
|
|
|
|
|
/s/ Tracie Youngblood |
|
|
Tracie Youngblood Executive Vice-President/Chief Financial Officer |
|
| (Principal Financial and Principal Accounting Officer) | |
|
|
|
|
March 30, 2020 |
|
|
Date |
|
Pursuant to the requirements of the Securities Exchange Act of 1934, this report has been signed below by the following persons on behalf of the registrant and in the capacities and on the dates indicated:
|
/s/ Mark H. Massee |
|
March 30, 2020 |
|
Mark H. Massee, Director |
|
Date |
|
|
|
|
| /s/ Terry L. Hester | March 30, 2020 | |
|
Terry L. Hester, Director |
|
Date |
|
|
|
|
|
/s/ Jonathan W. R. Ross |
|
March 30, 2020 |
|
Jonathan W. R. Ross, Director |
|
Date |
|
|
|
|
|
/s/ M. Frederick Dwozan |
|
March 30, 2020 |
|
M. Frederick Dwozan, Director |
|
Date |
|
|
|
|
| /s/ Meagan M. Mowry | March 30, 2020 | |
|
Meagan M. Mowry, Director |
|
Date |
|
|
|
|
|
/s/ Scott Lowell Downing |
|
March 30, 2020 |
|
Scott Lowell Downing, Director |
|
Date |
|
|
|
|
|
/s/ Matthew D. Reed |
March 30, 2020 | |
|
Matthew D. Reed, Director |
|
Date |
|
|
|
|
|
/s/ Edward P. Loomis |
|
March 30, 2020 |
|
Edward P. Loomis, Director |
|
Date |
- 69 -