Attached files
| file | filename |
|---|---|
| EX-32.2 - EXHIBIT 32.2 - Research Solutions, Inc. | tv502422_ex32-2.htm |
| EX-32.1 - EXHIBIT 32.1 - Research Solutions, Inc. | tv502422_ex32-1.htm |
| EX-31.2 - EXHIBIT 31.2 - Research Solutions, Inc. | tv502422_ex31-2.htm |
| EX-31.1 - EXHIBIT 31.1 - Research Solutions, Inc. | tv502422_ex31-1.htm |
| EX-23 - EXHIBIT 23 - Research Solutions, Inc. | tv502422_ex23.htm |
| EX-10.39 - EXHIBIT 10.39 - Research Solutions, Inc. | tv502422_ex10-39.htm |
| EX-10.38 - EXHIBIT 10.38 - Research Solutions, Inc. | tv502422_ex10-38.htm |
| EX-10.37 - EXHIBIT 10.37 - Research Solutions, Inc. | tv502422_ex10-37.htm |
| EX-10.36 - EXHIBIT 10.36 - Research Solutions, Inc. | tv502422_ex10-36.htm |
| EX-10.35 - EXHIBIT 10.35 - Research Solutions, Inc. | tv502422_ex10-35.htm |
UNITED STATES
SECURITIES AND EXCHANGE COMMISSION
Washington, D.C. 20549
FORM 10-K
| (Mark One) | |
| x | ANNUAL REPORT PURSUANT TO SECTION 13 OR 15(d) OF THE SECURITIES EXCHANGE ACT OF 1934 |
For the fiscal year ended: June 30, 2018
| ¨ | TRANSITION REPORT PURSUANT TO SECTION 13 OR 15(d) OF THE SECURITIES EXCHANGE ACT OF 1934 |
For the transition period from _____________ to _____________
Commission File No. 000-53501
RESEARCH SOLUTIONS, INC.
(Exact name of registrant as specified in its charter)
| Nevada | 11-3797644 |
| (State or other jurisdiction of incorporation or organization) | (I.R.S. Employer Identification No.) |
| 15821 Ventura Blvd., Suite 165, Encino, California | 91436 |
| (Address of principal executive offices) | (Zip Code) |
(310) 477-0354
(Registrant’s telephone number, including area code)
(Former name, former address and former fiscal year, if changed since last report)
Securities registered pursuant to Section 12(b) of the Act: None
Securities registered pursuant to Section 12(g) of the Act: common stock, par value $0.001 per share
Indicate by check mark if the registrant is a well-known seasoned issuer, as defined in Rule 405 of the Securities Act. Yes ¨ No þ
Indicate by check mark if the registrant is not required to file reports pursuant to Section 13 or Section 15(d) of the Act. Yes ¨ No þ
Indicate by check mark whether the registrant: (1) has filed all reports required to be filed by Section 13 or 15(d) of the Securities Exchange Act of 1934 during the preceding 12 months (or for such shorter period that the registrant was required to file such reports), and (2) has been subject to such filing requirements for the past 90 days. Yes þ No ¨
Indicate by check mark whether the registrant has submitted electronically every Interactive Data File required to be submitted pursuant to Rule 405 of Regulation S-T (§ 232.405 of this chapter) during the preceding 12 months (or for such shorter period that the registrant was required to submit such files). Yes þ No ¨
Indicate by check mark if disclosure of delinquent filers pursuant to Item 405 of Regulation S-K is not contained herein, and will not be contained, to the best of the registrant's knowledge, in definitive proxy or information statements incorporated by reference in Part III of this Form 10-K or any amendments to this Form 10-K. þ
Indicate by check mark whether the registrant is a large accelerated filer, an accelerated filer, a non-accelerated filer, a smaller reporting company or an emerging growth company. See the definitions of “large accelerated filer,” “accelerated filer,” “smaller reporting company” and “emerging growth company” in Rule 12b-2 of the Exchange Act.
| Large accelerated filer ¨ | Accelerated filer ¨ |
| Non-accelerated filer þ | Smaller reporting company þ |
| Emerging growth company ¨ |
If an emerging growth company, indicate by check mark if the registrant has elected not to use the extended transition period for complying with any new or revised financial accounting standards provided pursuant to Section 13(a) of the Exchange Act. ¨
Indicate by check mark whether the registrant is a shell company (as defined in Rule 12b-2 of the Exchange Act). Yes ¨ No þ
The aggregate market value of the voting and non-voting common equity held by non-affiliates of the registrant as of December 31, 2017, the last business day of the registrant’s most recently completed second fiscal quarter, was $9,227,308 based on the closing price of $1.22 per share as reported on the OTCQB as of that date.
Indicate the number of shares outstanding of each of the issuer’s classes of common stock as of the latest practicable date.
| Title of Class | Number of Shares Outstanding on September 14, 2018 | |
| Common Stock, $0.001 par value | 24,186,126 |
TABLE OF CONTENTS
| 2 |
Cautionary Notice Regarding Forward-Looking Statements
Unless otherwise indicated, (i) the terms “Research Solutions,” “we,” “us” and “our” refer to Research Solutions, Inc., a Nevada corporation, and our two wholly-owned subsidiaries Reprints Desk, Inc., a Delaware corporation (“Reprints Desk”) and Reprints Desk Latin America S. de R.L. de C.V, an entity organized under the laws of Mexico (“Reprints Desk Latin America”), and (ii) the term “common stock” refers to the common stock, par value $0.001 per share, of Research Solutions. The financial information included herein is presented in United States dollars (“US Dollars”), the functional currency of our company. Although the majority of our revenue and costs are in US Dollars, the costs of Reprints Desk Latin America are in Mexican Pesos.
All statements included or incorporated by reference in this Annual Report on Form 10-K, other than statements or characterizations of historical fact, are forward-looking statements. Examples of forward-looking statements include, but are not limited to, statements concerning our accounting estimates; assumptions and judgments; the demand for our products; the competitive nature of and anticipated growth in our industry; and our prospective needs for additional capital. These forward-looking statements are based on our current expectations, estimates, approximations and projections about our industry and business, management’s beliefs, and certain assumptions made by us, all of which are subject to change. Forward-looking statements can often be identified by words such as “anticipates,” “expects,” “intends,” “plans,” “predicts,” “believes,” “seeks,” “estimates,” “may,” “will,” “should,” “would,” “could,” “potential,” “continue,” “ongoing,” and similar expressions, and variations or negatives of these words. These statements are not guarantees of future performance and are subject to risks, uncertainties and assumptions that are difficult to predict. Therefore, our actual results could differ materially and adversely from those expressed in any forward-looking statements as a result of various factors, some of which are listed under “Risk Factors” in Item 1A of this report. These forward-looking statements speak only as of the date of this report. We undertake no obligation to revise or update publicly any forward-looking statement for any reason, except as otherwise required by law.
This Annual Report on Form 10-K also contains estimates and other information concerning our industry, including market size and customer satisfaction ratings, that we obtained from industry publications, surveys and forecasts. This information involves a number of assumptions and limitations, and you are cautioned not to give undue weight to these estimates. Although we believe the information in these industry publications, surveys and forecasts is reliable, we have not independently verified the accuracy or completeness of the information. The industry in which we operate is subject to a high degree of uncertainty and risk due to a variety of factors.
Company Overview
Research Solutions was incorporated in the State of Nevada on November 2, 2006, and is a publicly traded holding company with two wholly owned subsidiaries at June 30, 2018: Reprints Desk, Inc., a Delaware corporation and Reprints Desk Latin America S. de R.L. de C.V, an entity organized under the laws of Mexico.
On June 30, 2017, we sold the intangible assets of our Reprints and ePrints business line, but specifically excluding billed accounts receivable and respective liabilities, pursuant to an Asset Purchase Agreement dated June 20, 2017. The aggregate net consideration for the sale is comprised of $450,000 paid on the closing date, and earn-out payments of 45% of gross margin over the 30 month period subsequent to the closing date. We have made a policy election to record the contingent consideration when the consideration is determined to be realizable (each 6-month period ending subsequent to the closing date).
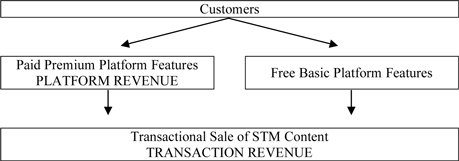
We provide two service offerings to our customers: annual licenses that allow customers to access and utilize certain premium features of our cloud based software-as-a-service (“SaaS”) research intelligence platform (“Platforms”) and the transactional sale of published scientific, technical, and medical (“STM”) content managed, sourced and delivered through the Platform (“Transactions”). Platforms and Transactions are packaged as a single solution that enable life science and other research intensive organizations to speed up research and development activities with faster, single sourced access and management of content and data used throughout the intellectual property development lifecycle.
Platforms
Our cloud-based SaaS research intelligence platform consists of proprietary software and Internet-based interfaces. Legacy functionality allows customers to initiate orders, route orders for the lowest cost acquisition, manage transactions, obtain spend and usage reporting, automate authentication, and connect seamlessly to in-house and third-party software systems. Customers can also enhance the information resources they already own or license and collaborate around bibliographic information.
Additional functionality has recently been added to our Platform in the form of interactive app-like gadgets. An alternative to manual data filtering, identification and extraction, gadgets are designed to gather, augment, and extract data across a variety of formats, including bibliographic citations, tables of contents, RSS feeds, PDF files, XML feeds, and web content. We are rapidly developing new gadgets in order to build an ecosystem of gadgets. Together, these gadgets will provide researchers with an “all in one” toolkit, delivering efficiencies in core research workflows and knowledge creation processes.
| 3 |
Our Platform is deployed as a single, multi-tenant system across our entire customer base. Customers securely access the Platform through online web interfaces and via web service APIs that enable customers to leverage Platform features and functionality from within in-house and third-party software systems. The Platform can also be configured to satisfy a customer’s individual preferences. We leverage our Platform’s efficiencies in scalability, stability and development costs to fuel rapid innovation and competitive advantage.
Transactions
Researchers and knowledge workers in life science and other research-intensive organizations generally require single copies of published STM journal articles for use in their research activities. These individuals are our primary users. Our Platform provides our customers with a single source to the universe of published STM content that includes over 70 million existing STM articles and over one million newly published STM articles each year.
Our Platform allows customers to find and download digital versions of STM articles that are critical to their research. Customers submit orders for the articles they need which we source and electronically deliver to them generally in under an hour. This service is generally known in the industry as single article delivery or document delivery. We also obtain the necessary permission licenses from the content publisher or other rights holder so that our customer’s use complies with applicable copyright laws. We have arrangements with hundreds of content publishers that allow us to distribute their content. The majority of these publishers provide us with electronic access to their content, which allows us to electronically deliver single articles to our customers often in a matter of minutes.
Competitive Strengths
We believe that we possess the following competitive strengths:
Services and Technology
We have developed proprietary software, a sophisticated information logistics technology backbone, and Internet-based interfaces that allow customers to initiate orders for STM content, manage these transactions, obtain reporting, automate authentication, improve seamless connectivity to in-house and third-party software systems, and maximize the information resources they already own or license, as well as organize workgroups to collaborate around bibliographic information. We are focused on rapidly developing an ecosystem of new interactive app-like gadgets for researchers that will deliver time saving efficiencies in core research workflows and knowledge creation processes. We continually enhance the performance of our existing proprietary software and systems and develop and implement new technologies that expand the available methods of discovering, obtaining and managing content.
Our services are highly configurable to meet customers’ needs and provide a personalized yet turnkey solution that covers the full spectrum of customer requirements; from identifying and locating articles, to facilitating copyright compliance, maximizing information resources already owned, monitoring usage, and automating end-user authentication. Our services alleviate the need for our customers to develop internal systems or contact multiple content publishers in order to obtain the content that is critical to their research.
Experienced Management Team
Our management team has well over 100 years of experience satisfying customers across the information services and STM publishing and technology industries. We are led by CEO Peter Derycz, an innovator in the space for more many decades and earning many accolades along the way, including being nominated to the Pharma Voice 100 list of most inspiring people in the Pharmaceutical industry.
Customer Loyalty
The majority of our revenue comes from our loyal base of customers, indicative of our focus on customer satisfaction and quality. Since our inception we have ranked first overall and in every category for every Document Delivery Buyer Survey conducted by industry research and advisory firm Outsell, Inc.: customer satisfaction (depth and breadth of coverage, fair pricing, and ease of doing business) and loyalty (intention to renew or continue service, and willingness to recommend the service to others).
Industry Presence and Established Relationships
We have a well-established presence and a network of contacts with our customers (life science companies, academic institutions, and other research intensive organizations), STM publishing partners, and others in the information services space. We have existing arrangements with hundreds of content publishers that allow us to distribute their content.
| 4 |
Promotion
We employ a segment-focused marketing approach that focuses on traditional buyers such as corporate libraries as well as new types of non-library buyers across a variety of business functions, including those within research and development. In pursuit of growth, we invest in vertical integration and channel relationships to increase the value we provide to customers, extend our promotional reach, and decrease customer acquisition costs. We anticipate growth coming from cross-selling into our existing customer base, penetrating new market verticals, and generating market demand and preference from both existing and new customers. While we place emphasis on the life science market, with a focus on pharmaceutical, biotechnology and medical device customers, we are also penetrating the following markets: academic, aerospace, automotive, electronics, chemicals and food and agriculture.
Growth Strategy
Organic Growth
We seek to grow our customer base through targeted direct and channel promotions of our Platform to potential customers. This strategy for sales and marketing is supported by inbound marketing driven by educational content, innovative technological systems, competitive pricing and high quality service. We are also positioning our sales force to be able to better serve small and medium sized businesses that we consider to be largely underserved today.
In addition, we submit proposals to potential customers in response to requests for proposals, or “Request for Proposals” (RFPs). We are continually improving our operations and technology to ensure that they are capable of delivering proposed solutions and supporting future growth.
Acquisitions and Combinations
From time to time, and as opportunities arise, we may explore strategic acquisitions and combinations, including the acquisition of customer lists, that bring revenue, profitability, growth potential and additional technology, products, services, operations and/or geographic capabilities to our company.
International Expansion
We have expanded internationally through increased sales to companies located abroad, particularly in Europe and Japan. From time to time, and as opportunities arise, we may further expand internationally through partnerships or acquisitions.
Publisher Agreements
We have arrangements with all of the major STM content publishers and most of the smaller STM publishers that allow us to distribute their content, and we regularly advance new business opportunities such as rentals through amendments to existing agreements. In addition, we regularly contact publishers to negotiate additional publisher agreements. A typical publisher agreement would allow us to distribute the publisher’s content according to a negotiated price list, thereby eliminating the need to contact the publisher and obtain the rights for each individual order. The majority of these publishers provide us with electronic access to their content, which allows us to further expedite the delivery of single articles to our customers. In addition, we rely on a small number of content publishers for the majority of our content costs.
Company Services
We generate revenue by providing two service offerings to our customers: annual licenses that allow customers to access and utilize certain premium features of our cloud based SaaS research intelligence platform (“Platforms”) and the transaction sale of STM content managed, sourced and delivered through the Platform (“Transactions”).
Platforms
We charge a subscription fee that allows customers to access and utilize certain premium features of our Platform. Revenue is recognized ratably over the term of the subscription agreement, which is typically one year, provided all other revenue recognition criteria have been met. Billings or payments received in advance of revenue recognition are recorded as deferred revenue.
| 5 |
Transactions
We charge a transactional service fee for the electronic delivery of single articles, and a corresponding copyright fee for the permitted use of the content. We recognize revenue from single article delivery services upon delivery to the customer only when the selling price is fixed or determinable, and collectability is reasonably assured.
Customers and Suppliers
There were no customers that accounted for greater than 10% of our revenue for the years ended June 30, 2018 and 2017.
Approximately 38% and 35% of our content cost for the years ended June 30, 2018 and 2017, respectively, was derived from our three largest suppliers of content. Loss of any or all of these suppliers of content would significantly reduce our revenue, which would have a material adverse effect on our results of operations. We can provide no assurance that these suppliers of content will continue to supply us with content in the future.
Sales and Marketing
To efficiently acquire customers, we rely on marketing in close cooperation with value based selling to acquire new small, medium and large geographically-dispersed enterprises. The promotional mix of tactics we utilize includes: search engine optimization and digital marketing, educational content, advertising, events, direct response and integrated marketing campaigns, public relations and content publicity, thought leadership programs, channel alliances training, and analyst relations. In addition, we focus on customer retention, which, we believe, increases total lifetime customer value and generates referrals for new business.
Competition
The markets in which we compete are highly competitive. The primary methods of competition in our industry are price, service, technology and niche focus. Competition based on price is often successful in the short-term, but can limit the ability of a supplier to provide adequate service levels. Competition based on service and/or technology requires significant investment in systems and that investment requires time to produce results. Niche operators focus on narrow activities, but cannot aggregate sufficient content, technology and services to satisfy broad customer needs. We believe that many customers and potential customers are less price sensitive if the service levels are high and the technology creates efficiency and/or management information that has not been available previously.
Our competition includes:
| · | Gadget –Like Toolkit Providers – We consider the rapidly increasing number of companies that are focused on specialized toolkits for researchers as competition. These include: Accelrys, Benchling, ChemAxon, Comsol Multiphysics, Genomenom, Main GCl, Workbench, Molsoft, and SnapGene. | |
| · | Reference Management Applications – We expect to increasingly compete with tools that exist in the marketplace that are used to aid in organizing references, storing personal content assets, and prepare scholarly papers for submission to congresses and journals. | |
| · | Piracy - Perhaps, our most serious competitor. Many entities use content for commercial purposes without complying with applicable copyright laws, and paying the required copyright to the content publisher. As information becomes more readily available, the opportunity for piracy increases. | |
| · | STM Single Article Delivery Vendors and Content Aggregators - Our primary competitors for global, full-service single article delivery services are Copyright Clearance Center, regional interlibrary loan networks throughout the world such as those owned and operated by OCLC, and numerous national libraries located outside of the United States. | |
| · | Customer In-House Services - While single article delivery services are challenging for our customers to provide in-house, many existing and potential customers manage these services internally. | |
| · | Publisher In-House Capabilities - Some large publishers have developed in-house capabilities to service the content re-use market, however, many of them neglect other content repurposing opportunities and may not be able to aggregate content from other publishers. |
Corporate History and Structure
Research Solutions was incorporated in the State of Nevada on November 2, 2006, and in November 2006 entered into a Share Exchange Agreement with Reprints Desk. At the closing of the transaction contemplated by the Share Exchange Agreement, Research Solutions acquired all of the outstanding shares of Reprints Desk from its stockholders and issued 8,000,003 shares of common stock to the former stockholders of Reprints Desk. Following completion of the exchange transaction, Reprints Desk became a wholly-owned subsidiary of Research Solutions.
| 6 |
On July 24, 2012, we formed Reprints Desk Latin America to provide operational and administrative support services to Reprints Desk.
On March 4, 2013, we consummated a merger with DYSC Subsidiary Corporation, our wholly-owned subsidiary, pursuant to which we, in connection with such merger, amended our Articles of Incorporation to change our name to Research Solutions, Inc. (formerly Derycz Scientific, Inc.).
On June 30, 2017, we sold the intangible assets of our Reprints and ePrints business line, but specifically excluding billed accounts receivable and respective liabilities, pursuant to an Asset Purchase Agreement dated June 20, 2017. The aggregate net consideration for the sale is comprised of $450,000 paid on the closing date, and earn-out payments of 45% of gross margin over the 30 month period subsequent to the closing date. We have made a policy election to record the contingent consideration when the consideration is determined to be realizable (each 6-month period ending subsequent to the closing date).
Employees
As of September 14, 2018, we had 125 full time employees.
Investing in our common stock involves a high degree of risk. You should carefully consider the risks and uncertainties described below, together with all of the other information in this prospectus, including our consolidated financial statements and related notes, before investing in our common stock. The following summarizes material risks that investors should carefully consider before deciding to buy or maintain an investment in our common stock. Any of the following risks, if they actually occur, would likely harm our business, financial condition and results of operations. As a result, the trading price of our common stock could decline, and investors could lose the money they paid to buy our common stock.
Risks Related to Our Business and Our Industry
We have incurred significant losses, and may be unable to maintain profitability. If we continue to incur losses, we may have to curtail our operations, which may prevent us from successfully operating and expanding our business.
Historically, we have relied upon cash from financing activities to fund substantially all of the cash requirements of our activities and have incurred significant losses and experienced negative cash flow. For our fiscal years ended June 30, 2018 and 2017, we incurred a net loss of $1,678,741 and $2,293,563, respectively. As of June 30, 2018, we had an accumulated deficit of $19,554,599. We cannot predict if we will be profitable. We may continue to incur losses for an indeterminate period of time and may be unable to sustain profitability. An extended period of losses and negative cash flow may prevent us from successfully operating and expanding our business. We may be unable to sustain or increase our profitability on a quarterly or annual basis.
The loss of our largest customers would significantly reduce our revenue and adversely affect our results of operations.
There were no customers that accounted for greater than 10% of our revenue for the years ended June 30, 2018 and 2017. The loss of our largest customers would significantly reduce our revenue, which would have a material adverse effect on our results of operations. We can provide no assurance that these customers will continue to place orders in the future.
The loss of our largest suppliers of content would significantly reduce our revenue and adversely affect our results of operations.
Approximately 38% and 35% of our content cost for the years ended June 30, 2018 and 2017, respectively, was derived from our three largest suppliers of content. Loss of any or all of these suppliers of content would significantly reduce the attractiveness of our services and our revenue, which would have a material adverse effect on our results of operations. We can provide no assurance that these suppliers of content will continue to supply us with content in the future. Moreover, our arrangements with content providers are non-exclusive. As a result, our content providers can provide the same content to our competitors.
We are exposed to credit risk on our accounts receivable and prepayments to suppliers of content. This risk is heightened during periods when economic conditions worsen.
There were no customers that accounted for greater than 10% of our accounts receivable as of June 30, 2018 and 2017. In addition, we have made prepayments to suppliers of content. While we have procedures to monitor and limit exposure to credit risk on our trade receivables as well as long-term prepayments, there can be no assurance such procedures will effectively limit our credit risk and avoid losses, which could have a material adverse effect on our results of operations.
| 7 |
Our services, technology and industry relationships are key assets and competitive advantages of our company and our business may be affected by how we are perceived in the marketplace.
Our services, technology and industry relationships are key assets that enable us to effectively compete in our industry. Our ability to attract and retain customers is highly dependent upon external perceptions of the quality, efficacy, responsiveness and ease-of-use of our services and business practices, and overall financial condition. Negative perceptions or publicity regarding these matters could damage our reputation with customers and the public, which could make it difficult for us to attract and maintain customers. Adverse developments with respect to our industry may also, by association, negatively impact our reputation. Negative perceptions or publicity could have a material adverse effect on our business and financial results.
Our business performance is dependent upon the effectiveness of our technology investments, the failure of which could materially impact our business and financial results.
We have and will continue to undertake significant investments in our technology infrastructure to continually strengthen our position in research and marketing solutions and improve our existing technology platform. We may fail to effectively invest such amounts, or we may invest significant amounts in technologies that do not ultimately assist us in achieving our strategic goals. We may also fail to maintain our technology infrastructure in a manner that allows us to readily meet our customers’ needs. If we experience any of these or similar failures related to our technology investments, we will not achieve our expected revenue growth, or desired cost savings, and we could experience a significant competitive disadvantage in the marketplace, which could have a material adverse effect on our business and financial results.
In addition, the failure to continue to invest in our business could result in a material adverse effect on our future financial results. Such investments may include: executing on, and mitigating risks associated with, new product offerings and entrance into new geographic markets; and ensuring continued compatibility of our new platforms and technologies with our customers’ networks and systems.
We may be subject to intellectual property rights claims by third parties, which are extremely costly to defend, could require us to pay significant damages and could limit our ability to use certain technologies.
Third parties, including our content providers, may assert claims of infringement of intellectual property rights against us or our customers for which we may be liable or have an indemnification obligation. Any claim of infringement by a third party, even those without merit, could cause us to incur substantial costs defending against the claim and could distract our management from our business. Although third parties may offer a license to their content, the terms of any offered license may not be acceptable and the failure to obtain a license or the costs associated with any license could cause our business, results of operations or financial condition to be materially and adversely affected. In addition, our licenses are generally non-exclusive, and therefore our competitors may have access to the same content licensed to us. Furthermore, a successful claimant could secure a judgment or we may agree to a settlement that prevents us from providing certain content or that requires us to pay substantial damages, including treble damages if we are found to have willfully infringed the claimant’s copyrights, royalties or other fees. Any of these events could seriously harm our business, operating results and financial condition.
Our industry is subject to intense competition and rapid technological change, which may result in products or new solutions that are superior to our products or solutions under development. If we are unable to anticipate or keep pace with changes in the marketplace and the direction of technological innovation and customer demands, our products or solutions may become less useful or obsolete and our operating results will suffer.
The industry in which we operate in general is subject to intense and increasing competition and rapidly evolving technologies. Because our products are expected to have long development cycles, we must anticipate changes in the marketplace and the direction of technological innovation and customer demands. To compete successfully, we will need to demonstrate the advantages of our products and solutions.
Our future success will depend in large part on our ability to establish and maintain a competitive position in current and future technologies. Rapid technological development may render our products under development, or any future solutions we may have, and related technologies obsolete. Many of our competitors have or may have greater corporate, financial, operational, sales and marketing resources, and more experience in research and development than we have. We cannot assure you that our competitors will not succeed in developing or marketing technologies or products that are more effective or commercially attractive than our products or that would render our solutions and related technologies obsolete. We may not have or be able to raise or develop the financial resources, technical expertise, or support capabilities to compete successfully in the future. Our success will depend in large part on our ability to maintain a competitive position with our products and solutions.
Increased accessibility of free or relatively inexpensive information sources may reduce demand for our products and services.
In recent years, more public sources of free or relatively inexpensive information have become available, particularly through the Internet, and this trend is expected to continue. For example, some governmental and regulatory agencies have increased the amount of information they make publicly available at no cost. Public sources of free or relatively inexpensive information may reduce demand for our products and services. Our financial results may be adversely affected if our customers choose to use these public sources as a substitute for our products or services.
| 8 |
We depend on the services of Peter Victor Derycz and other key personnel, and may not be able to operate and grow our business effectively if we lose their services or are unable to attract qualified personnel in the future.
Our success depends in part upon the continued service of Peter Victor Derycz, who is our President and Chief Executive Officer. Mr. Derycz is critical to the overall management of our company as well as to the development of our technologies, our culture and our strategic direction and is instrumental in developing and maintaining close ties with our customer base. We also rely heavily on our senior management team because they have substantial experience with our diverse service offerings and business strategies. In addition, we rely on our senior management team to identify internal expansion and external growth opportunities. Our ability to retain senior management and other key personnel is therefore very important to our future success. We have employment agreements with our senior management, but these employment agreements do not ensure that they will not voluntarily terminate their employment with us. In addition, our key personnel are subject to non-solicitation and confidential information restrictions. We do not have key man insurance for any of our current management or other key personnel. The loss of any key personnel would require the remaining key personnel to divert immediate attention to seeking a replacement. Competition for senior management personnel is intense, and fit is important to us. Our inability to find a suitable replacement for any departing executive officer or key employee on a timely basis could adversely affect our ability to operate and grow our business.
We rely on our proprietary software systems, and our websites and online networks, and a disruption, failure or security compromise of these systems would disrupt our business, damage our reputation and adversely affect our revenue and profitability.
Our proprietary software systems are critical to our business because they enable the efficient and timely service of a large number of customer orders. Similarly, we rely on our websites, online networks, and email systems to obtain content and deliver customer orders, and provide timely, relevant and dependable business information to our customers. Therefore, network or system shutdowns caused by events such as computer hacking, sabotage, dissemination of computer viruses, worms and other destructive or disruptive software, denial of service attacks and other malicious activity, as well as loss of service from third parties, power outages, natural disasters and similar events, could affect our ability to store, handle and deliver data and services to our customers. Any such interruption of our operations could negatively impact customer satisfaction and revenue.
Breaches of our data security systems or unintended disclosure of our customer data could result in large expenditures to repair or replace such systems, to remedy any security breaches and to protect us from similar events in the future.
Our infrastructure may be vulnerable to physical or electronic break-ins, computer viruses, or similar disruptive problems. In addition to shutdowns, our systems are subject to risks caused by misappropriation, misuse, leakage, falsification and accidental release or loss of information. We process, store, and transmit data, including personally identifiable information and payment card industry data of our customers, and it is critical that this data remains secure and is perceived by the marketplace to be secure.
Personal data is increasingly subject to legal and regulatory protections around the world, which vary widely in approach and which possibly conflict with one another. In recent years, for example, U.S. legislators and regulatory agencies, such as the Federal Trade Commission, as well as U.S. states, have increased their focus on protecting personal data by law and regulation, and have increased enforcement actions for violations of privacy and data protection requirements. In May 2018 The European Commission approved and adopted the General Data Protection Regulation ("GDPR") in the European Union, a new data protection law. These data protection laws and regulations are intended to protect the privacy and security of personal data, including credit card information that is collected, processed and transmitted in or from the relevant jurisdiction. Implementation of and compliance with these laws and regulations may be more costly or take longer than we anticipate, or could otherwise adversely affect our business operations, which could negatively impact our financial position or cash flows. Our business could be materially adversely affected by our inability, or the inability of our vendors who receive personal data from us, to comply with legal obligations regarding the use of personal data, new data handling requirements that conflict with or negatively impact our business practices. In addition, our agreements with customers may also require that we indemnify the customer for liability arising from data breaches under the terms of our agreements with these customers.
Disruptions or security compromises of our systems could result in large expenditures to repair or replace such systems, to remedy any security breaches and protect us from similar events in the future. We also could be exposed to negligence claims or other legal proceedings brought by our customers or their clients, and we could incur significant legal expenses and our management’s attention may be diverted from our operations in defending ourselves against and resolving lawsuits or claims. In addition, if we were to suffer damage to our reputation as a result of any system failure or security compromise, our revenue and profitability could be adversely affected.
We are exposed to risks associated with PCI compliance.
The PCI Data Security Standard (“PCI DSS”) is a specific set of comprehensive security standards required by credit card brands for enhancing payment account data security, including but not limited to requirements for security management, policies, procedures, network architecture, and software design. PCI DSS compliance is required in order to maintain credit card processing services. Compliance does not guarantee a completely secure environment and notwithstanding the results of this assessment there can be no assurance that payment card brands will not request further compliance assessments or set forth additional requirements to maintain access to credit card processing services. Compliance is an ongoing effort and the requirements evolve as new threats are identified. In the event that we were to lose PCI DSS compliance status (or fail to renew compliance under a future version of the PCI DSS), we could be exposed to increased operating costs, fines and penalties and, in extreme circumstances, may have our credit card processing privileges revoked, which would have a material adverse effect on our business.
| 9 |
Our failure to comply with the covenants contained in our loan agreement could result in an event of default that could adversely affect our financial condition and ability to operate our business as planned.
We currently have a line of credit with Silicon Valley Bank, maturing on December 31, 2019, under which there were no outstanding borrowings as of June 30, 2018. Our loan agreement contains, and any agreements to refinance our debt likely will contain, financial and restrictive covenants. We were in compliance with these covenants as of June 30, 2018, however, our failure to comply with these covenants in the future may result in an event of default, which if not cured or waived, could result in the bank preventing us from accessing availability under our line of credit and requiring us to repay any outstanding borrowings. There can be no assurance that we will be able to obtain waivers of future covenant violations or that such waivers will be available on commercially acceptable terms.
In addition, the indebtedness under our loan agreement is secured by a security interest in substantially all of our tangible and intangible assets, and therefore, if we are unable to repay such indebtedness the bank could foreclose on these assets and sell the pledged equity interests, which would adversely affect our ability to operate our business. If any of these were to occur, we may not be able to continue operations as planned, implement our planned growth strategy or react to opportunities for or downturns in our business.
Government regulations related to the Internet could increase our cost of doing business, affect our ability to grow or may otherwise negatively affect our business.
Governmental agencies and federal and state legislatures have adopted, and may continue to adopt, new laws and regulatory practices in response to the increasing use of the Internet and other online services. These new laws may be related to issues such as online privacy and data protection requirements, copyrights, trademarks and service mark, sales taxes, fair business practices, domain name ownership and the requirement that our operating units register to do business as foreign entities or otherwise be licensed to do business in jurisdictions where they have no physical location or other presence. In addition, these new laws, regulations or interpretations relating to doing business through the Internet could increase our costs materially and adversely affect our revenue and results of operations.
We may be adversely affected by changes in legislation and regulation.
Laws relating to communications, data protection, e-commerce, direct marketing and digital advertising and the use of public records have become more prevalent in recent years. Existing and proposed legislation and regulations, including changes in the manner in which such legislation and regulations are interpreted by courts in the United States, Europe and other jurisdictions, may impose limits on our collection and use of certain kinds of information and our ability to communicate such information effectively to our customers. It is difficult to predict in what form laws and regulations will be adopted or how they will be construed by the relevant courts, or the extent to which nay changes might adversely affect us.
Our growth strategy may require significant additional resources, and such additional resources might not be available on terms acceptable to us, if at all, which may in turn hamper our growth and adversely affect our business.
Our growth strategy will require us to significantly expand the capabilities of our administrative and operational resources. We intend to continue to make investments to support our business growth and may require additional funds to respond to business challenges, including the need to develop new technology, improve our operating infrastructure or acquire complementary businesses and technologies. Accordingly, we may need to undertake equity, equity-linked or debt financings to secure additional funds. If we raise additional funds through future issuances of equity or convertible debt securities, our existing stockholders could suffer significant dilution, and any new equity securities we issue could have rights, preferences and privileges superior to those of holders of our common stock. Any debt financing that we secure in the future could involve restrictive covenants relating to our capital raising activities and other financial and operational matters, including the ability to pay dividends. This may make it more difficult for us to obtain additional capital and to pursue business opportunities. We may not be able to obtain additional financing on terms favorable to us, if at all. If we are unable to obtain adequate financing or financing on terms satisfactory to us when we require it, our ability to continue to support our business growth and respond to business challenges could be significantly impaired, and our business may be adversely affected. In addition, our failure to successfully manage our growth could result in our sales not increasing commensurately with our capital investments. If we are unable to successfully manage our growth, we may be unable to achieve our goals.
Acquisitions, joint ventures or similar strategic relationships may disrupt or otherwise have a material adverse effect on our business and financial results.
As part of our strategy, we may explore strategic acquisitions and combinations, including the acquisition of customer lists, or enter into joint ventures or similar strategic relationships. These transactions are subject to the following risks:
| · | Acquisitions, joint ventures or similar relationships may cause a disruption in our ongoing business, distract our management and make it difficult to maintain our standards, controls and procedures; |
| · | We may not be able to integrate successfully the services, content, products and personnel of any such transaction into our operations; |
| · | We may not derive the revenue improvements, cost savings and other intended benefits of any such transaction; and |
| · | There may be risks, exposures and liabilities of acquired entities or other third parties with whom we undertake a transaction, that may arise from such third parties’ activities prior to undertaking a transaction with us. |
| 10 |
Our prior acquisitions have resulted in significant impairment charges and have operated at losses. We can provide no assurance that future acquisitions, joint ventures or strategic relationships will be accretive to our business overall or will result in profitable operations.
We are subject to risks related to our foreign operations which could adversely affect our operations and financial performance.
We have an operational and administrative support organization in Mexico, and sell our services worldwide. Foreign operations are subject to various risks which could have a material adverse effect on those operations or our business as a whole, including: exposure to local economic conditions; exposure to local political conditions; currency exchange rate fluctuations; reliance of local management; and additional potential costs of complying with rules and regulations of foreign jurisdictions. Any adverse consequence resulting from the materialization of the foregoing risks would adversely affect our financial performance and results of operations.
Unfavorable general economic conditions in the United States, Europe, or in other major markets could negatively impact our financial performance.
Unfavorable general economic conditions, such as a recession or economic slowdown in the United States, Europe, Japan, or in one or more of our other major markets, could negatively affect demand for our services and our results of operations. Under difficult economic conditions, businesses may seek to reduce spending on our services, or shift away from our services to in-house alternatives.
Risks Relating to Ownership of Our Common Stock
We cannot predict the extent to which an active public trading market for our common stock will develop or be sustained. If an active public trading market does not develop or cannot be sustained, you may be unable to liquidate your investment in our common stock.
We cannot predict the extent to which an active public market for our common stock will develop or be sustained due to a number of factors, including the fact that we are a small company that is relatively unknown to stock analysts, stock brokers, institutional investors, and others in the investment community that generate or influence sales volume, and that even if we came to the attention of such persons, they tend to be risk-averse and would be reluctant to follow an unproven company such as ours or purchase or recommend the purchase of our shares of common stock until such time as we became more seasoned and viable. As a consequence, there may be periods of several days or more when trading activity in our shares is minimal or non-existent, as compared to a seasoned issuer which has a large and steady volume of trading activity that will generally support continuous sales without an adverse effect on share price. We cannot give you any assurance that an active public trading market for our common stock will develop or be sustained. If such a market cannot be sustained, you may be unable to liquidate your investment in our common stock.
Our common stock may be subject to significant price volatility which may have an adverse effect on your ability to liquidate your investment in our common stock.
The market for our common stock may be characterized by significant price volatility when compared to seasoned issuers, and we expect that our share price will be more volatile than a seasoned issuer for the indefinite future. The potential volatility in our share price is attributable to a number of factors. First, our common shares may be sporadically and/or thinly traded. As a consequence of this lack of liquidity, the trading of relatively small quantities of shares by our stockholders may disproportionately influence the price of those shares in either direction. The price for our shares could, for example, decline precipitously in the event that a large number of our common shares are sold on the market without commensurate demand, as compared to a seasoned issuer that could better absorb those sales without adverse impact on its share price. Secondly, an investment in us is a speculative or “risky” investment due to our lack of meaningful profits to date and uncertainty of future profits. As a consequence of this enhanced risk, more risk-adverse investors may, under the fear of losing all or most of their investment in the event of negative news or lack of progress, be more inclined to sell their shares on the market more quickly and at greater discounts than would be the case with the stock of a seasoned issuer.
We have not paid cash dividends in the past and do not expect to pay cash dividends in the foreseeable future. Any return on your investment may be limited to increases in the market price of our common stock.
We have never paid cash dividends on our common stock and do not anticipate paying cash dividends on our common stock in the foreseeable future. In addition, our Loan and Security Agreement with Silicon Valley Bank prohibits us from paying cash dividends. The payment of dividends on our common stock will depend on our earnings, financial condition and other business and economic factors affecting us at such time as the board of directors may consider relevant. If we do not pay dividends, our common stock may be less valuable because a return on your investment might only occur if the market price of our common stock appreciates.
Voting power of a significant percentage of our common stock is held by our president and chief executive officer, and his brother-in-law, who together are able to exert significant influence over the outcome of matters to be voted on by our stockholders.
As of September 14, 2018, Peter Victor Derycz, our President and Chief Executive Officer, had voting power equal to approximately 15% of votes eligible to be cast at a meeting of our stockholders. Paul Kessler, the brother-in-law of Mr. Derycz, exercises investment and voting control over the shares held by Bristol Investment Fund, Ltd., and had, as of September 14, 2018, voting power equal to approximately 20% of votes eligible to be cast at a meeting of our stockholders. As a result of their significant ownership interests, Mr. Derycz and Mr. Kessler together currently have the ability to exert significant influence over the election of directors, and other matters submitted to a vote of all of our stockholders. They may also have interests that differ from yours and may vote in a manner that is adverse to your interests. This concentration of ownership may have the effect of deterring, delaying or preventing a change of control of our company, could deprive our stockholders of an opportunity to receive a premium for their common stock as part of a sale of our company and might ultimately affect the market price of our common stock.
| 11 |
The exercise of outstanding options and warrants to purchase our common stock could substantially dilute your investment.
Under the terms of our outstanding options and warrants to purchase our common stock issued to employees and others, the holders are given an opportunity to profit from a rise in the market price of our common stock that, upon the exercise of the options and/or warrants, could result in dilution in the interests of our other stockholders.
The market price of our common stock and the value of your investment could substantially decline if our warrants or options are exercised and our common stock is issued and resold into the market, or if a perception exists that a substantial number of shares will be issued upon exercise of our warrants and option and then resold into the market.
If the exercise prices of our warrants or options are lower than the price at which you made your investment, immediate dilution of the value of your investment will occur. In addition, sales of a substantial number of shares of common stock issued upon exercise of our warrants and options, or even the perception that such sales could occur, could adversely affect the market price of our common stock. You could, therefore, experience a substantial decline in the value of your investment as a result of both the actual and potential exercise of our warrants or options.
Because we are subject to the “Penny Stock” rules, the level of trading activity in our common stock may be reduced.
Our common stock is currently quoted on the OTCQB tier of the OTC Markets Group Inc., under the symbol “RSSS.” On September 14, 2018, the last reported sale price of our common stock on the OTCQB was $2.10. As a result, our common stock constitutes a “Penny Stock.” Broker-dealer practices in connection with transactions in Penny Stocks are regulated by rules adopted by the Securities and Exchange Commission, or SEC. Penny Stocks are generally equity securities with a price per share of less than $5.00 (other than securities registered on certain national exchanges). The Penny Stock rules require a broker-dealer, prior to a transaction in Penny Stocks not exempt from the rules, to deliver a standardized risk disclosure document that provides information about Penny Stocks and the nature and level of risks in the Penny Stock market. The broker-dealer must also provide the customer with current bid and offer quotations for the Penny Stock, the compensation of the broker-dealer and the salesperson in the transaction, and monthly accounting statements showing the market value of each Penny Stock held in the customer’s account. In addition, the broker-dealer must make a special written determination that the Penny Stock is a suitable investment for the purchaser and receive the purchaser’s written agreement to the transaction. These requirements may have the effect of reducing the level of trading activity in a Penny Stock, such as our common stock, and investors in our common stock may find it difficult to sell their shares.
Because our common stock is not currently listed on a national securities exchange, you may find it difficult to dispose of or obtain quotations for our common stock.
Our common stock is quoted on the OTCQB under the symbol “RSSS.” Because our stock is quoted on the OTCQB rather than on a national securities exchange, you may find it difficult to either dispose of, or to obtain quotations as to the price of, our common stock.
Failure to achieve and maintain effective internal controls in accordance with Section 404 of the Sarbanes-Oxley Act of 2002 could result in a restatement of our financial statements, cause investors to lose confidence in our financial statements and our company and have a material adverse effect on our business and stock price.
We produce our financial statements in accordance with accounting principles generally accepted in the United States, or GAAP. Effective internal controls are necessary for us to provide reliable financial reports to help mitigate the risk of fraud and to operate successfully as a publicly traded company. As a public company, we are required to document and test our internal control procedures in order to satisfy the requirements of Section 404 of the Sarbanes-Oxley Act of 2002, or Section 404. Further, Section 404 requires annual management assessments of the effectiveness of our internal controls over financial reporting.
Testing and maintaining internal controls can divert our management’s attention from other matters that are important to our business. We may not be able to conclude on an ongoing basis that we have effective internal controls over financial reporting in accordance with Section 404. If we are unable to conclude that we have effective internal controls over financial reporting, investors could lose confidence in our reported financial information and our company, which could result in a decline in the market price of our common stock, and cause us to fail to meet our reporting obligations in the future, which in turn could impact our ability to raise additional financing if needed in the future.
Our board of directors has broad discretion to issue additional securities.
We are entitled under our certificate of incorporation to issue up to 100,000,000 shares of common stock and 20,000,000 shares of “blank check” preferred stock, although these amounts may change in the future subject to stockholder approval. Shares of our blank check preferred stock provide our board of directors’ broad authority to determine voting, dividend, conversion, and other rights. As of June 30, 2018 we had issued and outstanding 24,016,999 shares of common stock and we had 6,401,326 shares of common stock reserved for future grants under our equity compensation plans and for issuances upon the exercise or conversion of currently outstanding options, warrants and convertible securities. As of June 30, 2018, we had no shares of preferred stock issued and outstanding. Accordingly, as of June 30, 2018, we could issue up to 69,581,675 additional shares of common stock and 20,000,000 additional shares of “blank check” preferred stock. Any additional stock issuances could be made at a price that reflects a discount or premium to the then-current market price of our common stock. In addition, in order to raise capital, we may need to issue securities that are convertible into or exchangeable for a significant amount of our common stock. Our board may generally issue those common and preferred shares, or convertible securities to purchase those shares, without further approval by our stockholders. Any preferred shares we may issue could have such rights, preferences, privileges and restrictions as may be designated from time-to-time by our board, including preferential dividend rights, voting rights, conversion rights, redemption rights and liquidation provisions. We may also issue additional securities to our directors, officers, employees and consultants as compensatory grants in connection with their services, both in the form of stand-alone grants or under our stock incentive plans. The issuance of additional securities may cause substantial dilution to our stockholders.
| 12 |
Our articles of incorporation, bylaws and Nevada law have anti-takeover provisions that could discourage, delay or prevent a change in control, which may cause our stock price to decline.
Our articles of incorporation, bylaws and Nevada law contain provisions which could make it more difficult for a third party to acquire us, even if closing such a transaction would be beneficial to our stockholders. We are currently authorized to issue up to 20,000,000 shares of “blank check” preferred stock. This preferred stock may be issued in one or more series, the terms of which may be determined at the time of issuance by our board of directors without further action by stockholders. The terms of any series of preferred stock may include voting rights (including the right to vote as a series on particular matters), preferences as to dividend, liquidation, conversion and redemption rights and sinking fund provisions. No shares of our preferred stock are currently outstanding. The issuance of any preferred stock could materially adversely affect the rights of the holders of our common stock, and therefore, reduce the value of our common stock. In particular, specific rights granted to future holders of preferred stock could be used to restrict our ability to merge with, or sell our assets to, a third party and thereby preserve control by current management.
Provisions of our articles of incorporation, bylaws and Nevada law also could have the effect of discouraging potential acquisition proposals or making a tender offer or delaying or preventing a change in control, including changes a stockholder might consider favorable. Such provisions may also prevent or frustrate attempts by our stockholders to replace or remove our management. In particular, our articles of incorporation, our bylaws and Nevada law, as applicable, among other things, provide our board of directors with the ability to alter our bylaws without stockholder approval, and provide that vacancies on our board of directors may be filled by a majority of directors in office, although less than a quorum.
We may become subject to Nevada’s control share acquisition laws (Nevada Revised Statutes 78.378 -78.3793), which prohibit an acquirer, under certain circumstances, from voting shares of a corporation’s stock after crossing specific threshold ownership percentages, unless the acquirer obtains the approval of the issuing corporation’s stockholders. We are also subject to Nevada’s Combination with Interested Stockholders Statute (Nevada Revised Statutes 78.411 -78.444) which prohibits an interested stockholder from entering into a “combination” with the corporation, unless certain conditions are met. These provisions are expected to discourage certain types of coercive takeover practices and inadequate takeover bids and to encourage persons seeking to acquire control of our company to first negotiate with our board of directors. These provisions may delay or prevent someone from acquiring or merging with us, which may cause the market price of our common stock to decline.
Item 1B. Unresolved Staff Comments
Not applicable.
Our executive offices are located at 15821 Ventura Blvd., Suite 165, Encino, California. We lease approximately 3,765 square feet of office space for approximately $10,500 per month from an unrelated third party. The lease expires on January 31, 2021.
Reprints Desk Latin America S. de R.L. de C.V, rents on a month to month basis approximately 280 square meters of office space in Monterrey, Mexico, for approximately $1,200 (22,000 Mexican Pesos) per month.
We believe that our existing facilities are sufficient to meet our present and anticipated needs for the foreseeable future.
We are involved in legal proceedings in the ordinary course of our business. Although our management cannot predict the ultimate outcome of these legal proceedings with certainty, it believes that the ultimate resolution of our legal proceedings, including any amounts we may be required to pay, will not have a material effect on our consolidated financial statements.
Item 4. Mine Safety Disclosures
Not applicable.
| 13 |
Item 5. Market for Registrant’s Common Equity, Related Stockholder Matters and Issuer Purchases of Equity Securities
Market Information and Approximate Number of Holders of Common Stock
Our common stock is quoted on the OTCQB under the symbol "RSSS." The following table sets forth, for the periods indicated, the reported high and low bid quotations for our common stock as reported on the OTCQB. The bid prices reflect inter-dealer quotations, do not include retail markups, markdowns, or commissions, and do not necessarily reflect actual transactions
| High Bid | Low Bid | |||||||
| Year Ended June 30, 2018: | ||||||||
| First Quarter (July 1 – September 30) | $ | 1.16 | $ | 0.90 | ||||
| Second Quarter (October 1 – December 31) | $ | 1.24 | $ | 1.02 | ||||
| Third Quarter (January 1 – March 31) | $ | 1.29 | $ | 1.01 | ||||
| Fourth Quarter (April 1 – June 30) | $ | 1.83 | $ | 1.25 | ||||
| Year Ended June 30, 2017: | ||||||||
| First Quarter (July 1 – September 30) | $ | 1.17 | $ | 0.89 | ||||
| Second Quarter (October 1 – December 31) | $ | 1.04 | $ | 0.75 | ||||
| Third Quarter (January 1 – March 31) | $ | 1.20 | $ | 1.00 | ||||
| Fourth Quarter (April 1 – June 30) | $ | 1.04 | $ | 0.66 | ||||
As of September 14, 2018, we had a total of 24,186,126 shares of our common stock outstanding and the closing sales price was $2.10 per share on the OTCQB. According to the records of our transfer agent, we had 36 record holders of our common stock as of September 14, 2018. Because brokers and other institutions hold shares on behalf of stockholders, we are unable to estimate the total number of stockholders represented by these record holders.
Dividends
We have never declared or paid dividends on our common stock. In addition, our Loan and Security Agreement with Silicon Valley Bank prohibits us from paying cash dividends. We currently intend to retain all available funds and any future earnings for use in the operation of our business and do not anticipate paying any dividends on our common stock in the foreseeable future, if at all. Any future determination to declare dividends will be made at the discretion of our board of directors and will depend on our financial condition, operating results, capital requirements, general business conditions and other factors that our board of directors may deem relevant.
Common Stock Repurchases
On February 16, 2017, the Compensation Committee of our Board of Directors authorized the repurchase, over a 12-month period on the last day of each trading window and otherwise in accordance with our insider trading policies, of up to $300,000 of outstanding common stock (at prices no greater than $2.00 per share) from our employees to satisfy their tax obligations in connection with the vesting of stock incentive awards. The actual number of shares repurchased will be determined by applicable employees in their discretion, and will depend on their evaluation of market conditions and other factors.
On February 8, 2018, the Compensation Committee of our Board of Directors authorized the repurchase, over a 12-month period on the last day of each trading window and otherwise in accordance with our insider trading policies, of up to $300,000 of outstanding common stock (at prices no greater than $2.00 per share) from our employees to satisfy their tax obligations in connection with the vesting of stock incentive awards. The actual number of shares repurchased will be determined by applicable employees in their discretion, and will depend on their evaluation of market conditions and other factors.
During the years ended June 30, 2018 and 2017, we repurchased 120,900 and 195,958 shares of our common stock under the repurchase plan at an average price of approximately $1.26 and $1.02 per share, respectively, for an aggregate amount of $152,739 and $199,328, respectively. As of June 30, 2018, $250,216 remains under the current authorization to repurchase our outstanding common stock from our employees.
Shares repurchased are retired and deducted from common stock for par value and from additional paid in capital for the excess over par value. Direct costs incurred to acquire the shares are included in the total cost of the shares.
| 14 |
The following table summarizes repurchases of our common stock on a monthly basis:
| Period | Total
Number of Shares Purchased1 | Average Price Paid per Share | Total Number of Shares Purchased as Part of Publicly Announced Plans or Programs | Approximate Dollar Value of Shares that May Yet Be Purchased Under the Plans or Programs | ||||||||||||
| September 2016 | 25,508 | $ | 1.04 | - | - | |||||||||||
| December 2016 | 54,200 | $ | 1.03 | - | - | |||||||||||
| March 2017 | 7,250 | $ | 1.10 | - | - | |||||||||||
| June 2017 | 109,000 | $ | 1.00 | - | - | |||||||||||
| Year ended June 30, 2017 | 195,958 | $ | 1.02 | - | - | |||||||||||
| September 2017 | 34,800 | $ | 1.14 | - | - | |||||||||||
| December 2017 | 52,300 | $ | 1.21 | - | - | |||||||||||
| March 2018 | 19,750 | $ | 1.29 | - | $ | 274,523 | ||||||||||
| June 2018 | 14,050 | $ | 1.73 | - | $ | 250,216 | ||||||||||
| Year ended June 30, 2018 | 120,900 | $ | 1.26 | - | $ | 250,216 | ||||||||||
1 Consists of shares of common stock purchased from employees to satisfy tax obligations in connection with the vesting of stock incentive awards.
Equity Compensation Plan Information
Information relating to compensation plans under which our equity securities are authorized for issuance is set forth in Item 12 of this report under “Security Ownership of Certain Beneficial Owners and Management and Related Stockholder Matters.”
Item 6. Selected Financial Data
Not required.
| 15 |
Item 7. Management’s Discussion and Analysis of Financial Condition and Results of Operations
Cautionary Notice Regarding Forward-Looking Statements
The following discussion and analysis of our financial condition and results of operations for the years ended June 30, 2018 and 2017 should be read in conjunction with our consolidated financial statements and related notes to those financial statements that are included elsewhere in this report. Our discussion includes forward-looking statements based upon current expectations that involve risks and uncertainties, such as our plans, objectives, expectations and intentions. Actual results and the timing of events could differ materially from those anticipated in these forward-looking statements as a result of a number of factors, including those set forth under “Risk Factors” and elsewhere in this report.
We use words such as “anticipate,” “estimate,” “plan,” “project,” “continuing,” “ongoing,” “expect,” “believe,” “intend,” “may,” “will,” “should,” “could,” and similar expressions to identify forward-looking statements. All forward-looking statements included in this report are based on information available to us on the date hereof and, except as required by law, we assume no obligation to update any such forward-looking statements.
Overview
Research Solutions was incorporated in the State of Nevada on November 2, 2006, and is a publicly traded holding company with two wholly owned subsidiaries at June 30, 2018: Reprints Desk, Inc., a Delaware corporation and Reprints Desk Latin America S. de R.L. de C.V, an entity organized under the laws of Mexico.
On June 30, 2017, we sold the intangible assets of our Reprints and ePrints business line, but specifically excluding billed accounts receivable and respective liabilities, pursuant to an Asset Purchase Agreement dated June 20, 2017. The aggregate net consideration for the sale is comprised of $450,000 paid on the closing date, and earn-out payments of 45% of gross margin over the 30 month period subsequent to the closing date. We have made a policy election to record the contingent consideration when the consideration is determined to be realizable (each 6-month period ending subsequent to the closing date).
We provide two service offerings to our customers: annual licenses that allow customers to access and utilize certain premium features of our cloud based software-as-a-service (“SaaS”) research intelligence platform (“Platforms”) and the transactional sale of published scientific, technical, and medical (“STM”) content managed, sourced and delivered through the Platform (“Transactions”). Platforms and Transactions are packaged as a single solution that enable life science and other research intensive organizations to speed up research and development activities with faster, single sourced access and management of content and data used throughout the intellectual property development lifecycle.
Platforms
Our cloud-based SaaS research intelligence platform consists of proprietary software and Internet-based interfaces. Legacy functionality allows customers to initiate orders, route orders for the lowest cost acquisition, manage transactions, obtain spend and usage reporting, automate authentication, and connect seamlessly to in-house and third-party software systems. Customers can also enhance the information resources they already own or license and collaborate around bibliographic information.
Additional functionality has recently been added to our Platform in the form of interactive app-like gadgets. An alternative to manual data filtering, identification and extraction, gadgets are designed to gather, augment, and extract data across a variety of formats, including bibliographic citations, tables of contents, RSS feeds, PDF files, XML feeds, and web content. We are rapidly developing new gadgets in order to build an ecosystem of gadgets. Together, these gadgets will provide researchers with an “all in one” toolkit, delivering efficiencies in core research workflows and knowledge creation processes.
Our Platform is deployed as a single, multi-tenant system across our entire customer base. Customers securely access the Platform through online web interfaces and via web service APIs that enable customers to leverage Platform features and functionality from within in-house and third-party software systems. The Platform can also be configured to satisfy a customer’s individual preferences. We leverage our Platform’s efficiencies in scalability, stability and development costs to fuel rapid innovation and competitive advantage.
Transactions
Researchers and knowledge workers in life science and other research-intensive organizations generally require single copies of published STM journal articles for use in their research activities. These individuals are our primary users. Our Platform provides our customers with a single source to the universe of published STM content that includes over 70 million existing STM articles and over one million newly published STM articles each year.
Our Platform allows customers to find and download digital versions of STM articles that are critical to their research. Customers submit orders for the articles they need which we source and electronically deliver to them generally in under an hour. This service is generally known in the industry as single article delivery or document delivery. We also obtain the necessary permission licenses from the content publisher or other rights holder so that our customer’s use complies with applicable copyright laws. We have arrangements with hundreds of content publishers that allow us to distribute their content. The majority of these publishers provide us with electronic access to their content, which allows us to electronically deliver single articles to our customers often in a matter of minutes.
| 16 |
Critical Accounting Policies and Estimates
The preparation of our consolidated financial statements in conformity with accounting principles generally accepted in the United States, or GAAP, requires us to make estimates and assumptions that affect the reported amounts of assets, liabilities, revenue and expenses, and related disclosure of contingent assets and liabilities. When making these estimates and assumptions, we consider our historical experience, our knowledge of economic and market factors and various other factors that we believe to be reasonable under the circumstances. Actual results may differ under different estimates and assumptions.
The accounting estimates and assumptions discussed in this section are those that we consider to be the most critical to an understanding of our financial statements because they inherently involve significant judgments and uncertainties.
Revenue Recognition
Our policy is to recognize revenue when services have been performed, risk of loss and title to the product transfers to the customer, the selling price is fixed or determinable, and collectability is reasonably assured. We generate revenue by providing two service offerings to our customers: annual licenses that allow customers to access and utilize certain premium features of our cloud based SaaS research intelligence platform (“Platforms”) and the transaction sale of STM content managed, sourced and delivered through the Platform (“Transactions”).
Platforms
We charge a subscription fee that allows customers to access and utilize certain premium features of our Platform. Revenue is recognized ratably over the term of the subscription agreement, which is typically one year, provided all other revenue recognition criteria have been met. Billings or payments received in advance of revenue recognition are recorded as deferred revenue.
Transactions
We charge a transactional service fee for the electronic delivery of single articles, and a corresponding copyright fee for the permitted use of the content. We recognize revenue from single article delivery services upon delivery to the customer only when the selling price is fixed or determinable, and collectability is reasonably assured.
Stock-Based Compensation
We periodically issue stock options, warrants and restricted stock to employees and non-employees for services, in capital raising transactions, and for financing costs. We account for share-based payments under the guidance as set forth in the Share-Based Payment Topic 718 of the FASB Accounting Standards Codification, which requires the measurement and recognition of compensation expense for all share-based payment awards made to employees, officers, directors, and consultants, including employee stock options, based on estimated fair values. We estimate the fair value of stock option and warrant awards to employees and directors on the date of grant using an option-pricing model, and the value of the portion of the award that is ultimately expected to vest is recognized as expense over the required service period in our Statements of Operations. We estimate the fair value of restricted stock awards to employees and directors using the market price of our common stock on the date of grant, and the value of the portion of the award that is ultimately expected to vest is recognized as expense over the required service period in our Statements of Operations. We account for share-based payments to non-employees in accordance with Topic 505 of the FASB Accounting Standards Codification, whereby the value of the stock compensation is based upon the measurement date as determined at either a) the date at which a performance commitment is reached, or b) the date at which the necessary performance to earn the equity instruments is complete. Stock-based compensation is based on awards ultimately expected to vest and is reduced for estimated forfeitures. Forfeitures are estimated at the time of grant and revised, as necessary, in subsequent periods if actual forfeitures differ from those estimates.
Allowance for doubtful accounts
We evaluate the collectability of our trade accounts receivable based on a number of factors. In circumstances where we become aware of a specific customer’s inability to meet its financial obligations to us, we estimate and record a specific reserve for bad debts, which reduces the recognized receivable to the estimated amount we believe will ultimately be collected. In addition to specific customer identification of potential bad debts, bad debt charges are recorded based on our historical losses and an overall assessment of past due trade accounts receivable outstanding. We established an allowance for doubtful accounts of $115,040 and $119,536 as of June 30, 2018 and 2017, respectively.
| 17 |
Foreign Currency
The accompanying consolidated financial statements are presented in United States dollars, the functional currency of our company. Capital accounts of foreign subsidiaries are translated into US dollars from foreign currencies at their historical exchange rates when the capital transactions occurred. Assets and liabilities are translated at the exchange rate as of the balance sheet date. Income and expenditures are translated at the average exchange rate of the period. Although the majority of our revenue and costs are in US dollars, the costs of Reprints Desk Latin America are in Mexican Pesos. As a result, currency exchange fluctuations may impact our revenue and the costs of our operations. We currently do not engage in any currency hedging activities.
The following table summarizes the exchange rates used:
| Year Ended June 30, | ||||||||
| 2018 | 2017 | |||||||
| Period end Euro : US Dollar exchange rate | 1.17 | 1.14 | ||||||
| Average period Euro : US Dollar exchange rate | 1.19 | 1.09 | ||||||
| Period end Mexican Peso : US Dollar exchange rate | 0.05 | 0.05 | ||||||
| Average period Mexican Peso : US Dollar exchange rate | 0.05 | 0.05 | ||||||
Quarterly Information (Unaudited)
The following table sets forth unaudited and quarterly financial data for the four quarters of fiscal years 2018 and 2017:
| June 30, | Mar. 31, | Dec. 31, | Sept. 30, | June 30, | Mar. 31, | Dec. 31, | Sept. 30, | |||||||||||||||||||||||||
| 2018 | 2018 | 2017 | 2017 | 2017 | 2017 | 2016 | 2016 | |||||||||||||||||||||||||
| Revenue: | ||||||||||||||||||||||||||||||||
| Platforms | $ | 528,581 | $ | 489,219 | $ | 413,404 | $ | 387,945 | $ | 318,194 | $ | 270,920 | $ | 219,137 | $ | 172,072 | ||||||||||||||||
| Transactions | 6,637,292 | 6,792,289 | 6,409,816 | 6,359,895 | 6,521,313 | 6,372,679 | 5,866,562 | 6,006,399 | ||||||||||||||||||||||||
| Total revenue | 7,165,873 | 7,281,508 | 6,823,220 | 6,747,840 | 6,839,507 | 6,643,599 | 6,085,699 | 6,178,471 | ||||||||||||||||||||||||
| Cost of revenue: | ||||||||||||||||||||||||||||||||
| Platforms | 101,370 | 103,185 | 90,362 | 83,987 | 71,097 | 58,367 | 45,623 | 29,964 | ||||||||||||||||||||||||
| Transactions | 5,118,851 | 5,259,959 | 4,996,988 | 4,914,414 | 5,060,500 | 4,997,842 | 4,664,690 | 4,714,999 | ||||||||||||||||||||||||
| Total cost of revenue | 5,220,221 | 5,363,144 | 5,087,350 | 4,998,401 | 5,131,597 | 5,056,209 | 4,710,313 | 4,744,963 | ||||||||||||||||||||||||
| Gross profit: | ||||||||||||||||||||||||||||||||
| Platforms | 427,211 | 386,034 | 323,042 | 303,958 | 247,097 | 212,553 | 173,514 | 142,108 | ||||||||||||||||||||||||
| Transactions | 1,518,441 | 1,532,330 | 1,412,828 | 1,445,481 | 1,460,813 | 1,374,837 | 1,201,872 | 1,291,400 | ||||||||||||||||||||||||
| Total gross profit | 1,945,652 | 1,918,364 | 1,735,870 | 1,749,439 | 1,707,910 | 1,587,390 | 1,375,386 | 1,433,508 | ||||||||||||||||||||||||
| Operating expenses: | ||||||||||||||||||||||||||||||||
| Sales and marketing | 455,250 | 522,894 | 524,587 | 678,963 | 682,455 | 698,346 | 592,254 | 393,105 | ||||||||||||||||||||||||
| Technology and product dev. | 454,053 | 436,672 | 454,507 | 452,816 | 413,249 | 396,765 | 379,725 | 286,301 | ||||||||||||||||||||||||
| General and administrative | 1,062,981 | 1,091,928 | 1,098,795 | 1,131,402 | 1,220,056 | 1,120,480 | 1,108,926 | 1,112,380 | ||||||||||||||||||||||||
| Depreciation and amortization | 32,731 | 32,768 | 46,330 | 40,568 | 36,893 | 33,906 | 32,426 | 30,469 | ||||||||||||||||||||||||
| Stock-based comp. expense | 75,089 | 114,340 | 314,565 | 286,242 | 112,151 | 112,326 | 303,097 | 102,589 | ||||||||||||||||||||||||
| Foreign currency transaction loss (gain) | 14,589 | (9,737 | ) | (485 | ) | (12,387 | ) | (6,362 | ) | 6,272 | 17,631 | 3,324 | ||||||||||||||||||||
| Total operating expenses | 2,094,693 | 2,188,865 | 2,438,299 | 2,577,604 | 2,458,442 | 2,368,095 | 2,434,059 | 1,928,168 | ||||||||||||||||||||||||
| Other income (expenses and income taxes) | 12,615 | 5,238 | (1,504 | ) | (1,949 | ) | (6,425 | ) | 1,599 | (6,913 | ) | (11,895 | ) | |||||||||||||||||||
| Loss from continuing operations | (136,426 | ) | (265,263 | ) | (703,933 | ) | (830,114 | ) | (756,957 | ) | (779,106 | ) | (1,065,586 | ) | (506,555 | ) | ||||||||||||||||
| Income from discontinued operations | - | - | - | - | 113,314 | 141,616 | 222,626 | 95,889 | ||||||||||||||||||||||||
| Gain on sale of discontinued operations | 51,216 | 69,277 | 79,353 | 57,149 | 241,196 | - | - | - | ||||||||||||||||||||||||
| Net income (loss) | (85,210 | ) | (195,986 | ) | (624,580 | ) | (772,965 | ) | (402,447 | ) | (637,490 | ) | (842,960 | ) | (410,666 | ) | ||||||||||||||||
| 18 |
| June 30, | Mar. 31, | Dec. 31, | Sept. 30, | June 30, | Mar. 31, | Dec. 31, | Sept. 30, | |||||||||||||||||||||||||
| 2018 | 2018 | 2017 | 2017 | 2017 | 2017 | 2016 | 2016 | |||||||||||||||||||||||||
| Net income (loss): | ||||||||||||||||||||||||||||||||
| Loss from continuing operations | $ | (136,426 | ) | $ | (265,263 | ) | $ | (703,933 | ) | $ | (830,114 | ) | $ | (756,957 | ) | $ | (779,106 | ) | $ | (1,065,586 | ) | $ | (506,555 | ) | ||||||||
| Income from discontinued operations | 51,216 | 69,277 | 79,353 | 57,149 | 354,510 | 141,616 | 222,626 | 95,889 | ||||||||||||||||||||||||
| Net income (loss) | $ | (85,210 | ) | $ | (195,986 | ) | $ | (624,580 | ) | $ | (772,965 | ) | $ | (402,447 | ) | $ | (637,490 | ) | $ | (842,960 | ) | $ | (410,666 | ) | ||||||||
| Basic income (loss) per common share: | ||||||||||||||||||||||||||||||||
| Loss per share from continuing operations | $ | (0.01 | ) | $ | (0.01 | ) | $ | (0.03 | ) | $ | (0.04 | ) | $ | (0.03 | ) | $ | (0.03 | ) | $ | (0.05 | ) | $ | (0.02 | ) | ||||||||
| Income per share from discontinued operations | $ | - | $ | - | $ | - | $ | - | $ | 0.01 | $ | - | $ | 0.01 | $ | - | ||||||||||||||||
| Net income (loss) per share | $ | (0.01 | ) | $ | (0.01 | ) | $ | (0.03 | ) | $ | (0.04 | ) | $ | (0.02 | ) | $ | (0.03 | ) | $ | (0.04 | ) | $ | (0.02 | ) | ||||||||
| Basic weighted average common shares outstanding | 23,560,781 | 23,498,796 | 23,455,654 | 23,380,437 | 23,369,727 | 23,265,939 | 23,200,975 | 23,131,570 | ||||||||||||||||||||||||
| Diluted income (loss) per common share: | ||||||||||||||||||||||||||||||||
| Loss per share from continuing operations | $ | (0.01 | ) | $ | (0.01 | ) | $ | (0.03 | ) | $ | (0.04 | ) | $ | (0.03 | ) | $ | (0.03 | ) | $ | (0.05 | ) | $ | (0.02 | ) | ||||||||
| Income per share from discontinued operations | $ | - | $ | - | $ | - | $ | - | $ | 0.01 | $ | - | $ | 0.01 | $ | - | ||||||||||||||||
| Net income (loss) per share | $ | (0.01 | ) | $ | (0.01 | ) | $ | (0.03 | ) | $ | (0.04 | ) | $ | (0.02 | ) | $ | (0.03 | ) | $ | (0.04 | ) | $ | (0.02 | ) | ||||||||
| Diluted weighted average common shares outstanding | 23,560,781 | 23,498,796 | 23,455,654 | 23,380,437 | 23,369,727 | 23,265,939 | 23,200,975 | 23,131,570 | ||||||||||||||||||||||||
Comparison of the Years Ended June 30, 2018 and 2017
Results of Operations
| Year Ended June 30, | ||||||||||||||||
| 2018 | 2017 | 2018-2017 $ Change | 2018-2017 % Change | |||||||||||||
| Revenue: | ||||||||||||||||
| Platforms | $ | 1,819,149 | $ | 980,323 | $ | 838,826 | 85.6 | % | ||||||||
| Transactions | 26,199,292 | 24,766,953 | 1,432,339 | 5.8 | % | |||||||||||
| Total revenue | 28,018,441 | 25,747,276 | 2,271,165 | 8.8 | % | |||||||||||
| Cost of revenue: | ||||||||||||||||
| Platforms | 378,904 | 205,051 | 173,853 | 84.8 | % | |||||||||||
| Transactions | 20,290,212 | 19,438,031 | 852,181 | 4.4 | % | |||||||||||
| Total cost of revenue | 20,669,116 | 19,643,082 | 1,026,034 | 5.2 | % | |||||||||||
| Gross profit: | ||||||||||||||||
| Platforms | 1,440,245 | 775,272 | 664,973 | 85.8 | % | |||||||||||
| Transactions | 5,909,080 | 5,328,922 | 580,158 | 10.9 | % | |||||||||||
| Total gross profit | 7,349,325 | 6,104,194 | 1,245,131 | 20.4 | % | |||||||||||
| Operating expenses: | ||||||||||||||||
| Sales and marketing | 2,181,694 | 2,366,160 | (184,466 | ) | (7.8 | )% | ||||||||||
| Technology and product development | 1,798,048 | 1,476,040 | 322,008 | 21.8 | % | |||||||||||
| General and administrative | 4,385,106 | 4,561,842 | (176,736 | ) | (3.9 | )% | ||||||||||
| Depreciation and amortization | 152,397 | 133,694 | 18,703 | 14.0 | % | |||||||||||
| Stock-based compensation expense | 790,236 | 630,163 | 160,073 | 25.4 | % | |||||||||||
| Foreign currency transaction loss (gain) | (8,020 | ) | 20,865 | (28,885 | ) | (138.4 | )% | |||||||||
| Total operating expenses | 9,299,461 | 9,188,764 | 110,697 | 1.2 | % | |||||||||||
| Loss from operations | (1,950,136 | ) | (3,084,570 | ) | 1,134,434 | 36.8 | % | |||||||||
| Other income (expenses): | ||||||||||||||||
| Interest expense | (4,000 | ) | (12,000 | ) | 8,000 | 66.7 | % | |||||||||
| Other income | 58,179 | 23,861 | 34,318 | 143.8 | % | |||||||||||
| Total other income | 54,179 | 11,861 | 42,318 | 356.8 | % | |||||||||||
| Loss from operations before provision for income taxes | (1,895,957 | ) | (3,072,709 | ) | 1,176,752 | 38.3 | % | |||||||||
| Provision for income taxes | (39,779 | ) | (35,495 | ) | (4,284 | ) | (12.1 | )% | ||||||||
| Loss from continuing operations | (1,935,736 | ) | (3,108,204 | ) | 1,172,468 | 37.7 | % | |||||||||
| Discontinued operations: | ||||||||||||||||
| Income from discontinued operations | - | 573,445 | (573,445 | ) | (100.0 | )% | ||||||||||
| Gain from sale of discontinued operations | 256,995 | 241,196 | 15,799 | 6.6 | % | |||||||||||
| Income from discontinued operations | 256,995 | 814,641 | (557,646 | ) | (68.5 | )% | ||||||||||
| Net loss | $ | (1,678,741 | ) | $ | (2,293,563 | ) | $ | 614,822 | 26.8 | % | ||||||
| 19 |
Revenue
| Years Ended June 30, | ||||||||||||||||
| 2018 | 2017 | 2018-2017 $ Change | 2018-2017 % Change | |||||||||||||
| Revenue: | ||||||||||||||||
| Platforms | $ | 1,819,149 | $ | 980,323 | $ | 838,826 | 85.6 | % | ||||||||
| Transactions | 26,199,292 | 24,766,953 | 1,432,339 | 5.8 | % | |||||||||||
| Total revenue | $ | 28,018,441 | $ | 25,747,276 | $ | 2,271,165 | 8.8 | % | ||||||||
Total revenue increased $2,271,165, or 8.8%, for the year ended June 30, 2018 compared to the prior year, due to the following:
| Category | Impact | Key Drivers | ||||||
| Platforms | ↑ | $ | 838,826 | Increased due to additional deployments to new and existing customers, and expansion from existing customers. Revenue is recognized ratably over the term of the subscription agreement, which is typically one year, provided all other revenue recognition criteria have been met. Billings or payments received in advance of revenue recognition are recorded as deferred revenue. | ||||
| Transactions | ↑ | $ | 1,432,339 | Increased primarily due to orders from new customers. | ||||
Cost of Revenue
| Years Ended June 30, | ||||||||||||||||
| 2018 | 2017 | 2018-2017 $ Change | 2018-2017 % Change | |||||||||||||
| Cost of Revenue: | ||||||||||||||||
| Platforms | $ | 378,904 | $ | 205,051 | $ | 173,853 | 84.8 | % | ||||||||
| Transactions | 20,290,212 | 19,438,031 | 852,181 | 4.4 | % | |||||||||||
| Total cost of revenue | $ | 20,669,116 | $ | 19,643,082 | $ | 1,026,034 | 5.2 | % | ||||||||
| Years Ended June 30, | ||||||||||||
| 2018 | 2017 | 2018-2017 Change * | ||||||||||
| As a percentage of revenue: | ||||||||||||
| Platforms | 20.8 | % | 20.9 | % | (0.1 | )% | ||||||
| Transactions | 77.4 | % | 78.5 | % | (1.1 | )% | ||||||
| Total | 73.8 | % | 76.3 | % | (2.5 | )% | ||||||
| * The difference between current and prior period cost of revenue as a percentage of revenue | ||||||||||||
Total cost of revenue as a percentage of revenue decreased 2.5%, from 76.3% for the previous year to 73.8%, for the year ended June 30, 2018.
| 20 |
| Category | Impact
as percentage of revenue |
Key Drivers | ||||||
| Platforms | ↓ | 0.1 | % | Decreased primarily due to lower personnel costs, offset by higher third-party data costs. | ||||
| Transactions | ↓ | 1.1 | % | Decreased primarily due to an increase in copyright discounts. | ||||
Gross Profit
| Years Ended June 30, | ||||||||||||||||
| 2018 | 2017 | 2018-2017 $ Change | 2018-2017 % Change | |||||||||||||
| Gross Profit: | ||||||||||||||||
| Platforms | $ | 1,440,245 | $ | 775,272 | $ | 664,973 | 85.8 | % | ||||||||
| Transactions | 5,909,080 | 5,328,922 | 580,158 | 10.9 | % | |||||||||||
| Total gross profit | $ | 7,349,325 | $ | 6,104,194 | $ | 1,245,131 | 20.4 | % | ||||||||
| Years Ended June 30, | ||||||||||||
| 2018 | 2017 | 2018-2017 Change * | ||||||||||
| As a percentage of revenue: | ||||||||||||
| Platforms | 79.2 | % | 79.1 | % | 0.1 | % | ||||||
| Transactions | 22.6 | % | 21.5 | % | 1.1 | % | ||||||
| Total | 26.2 | % | 23.7 | % | 2.5 | % | ||||||
| * The difference between current and prior period gross profit as a percentage of revenue | ||||||||||||
Operating Expenses
| Years Ended June 30, | ||||||||||||||||
| 2018 | 2017 | 2018-2017 $ Change | 2018-2017 % Change | |||||||||||||
| Operating Expenses: | ||||||||||||||||
| Sales and marketing | $ | 2,181,694 | $ | 2,366,160 | $ | (184,466 | ) | (7.8 | )% | |||||||
| Technology and product development | 1,798,048 | 1,476,040 | 322,008 | 21.8 | % | |||||||||||
| General and administrative | 4,385,106 | 4,561,842 | (176,736 | ) | (3.9 | )% | ||||||||||
| Depreciation and amortization | 152,397 | 133,694 | 18,703 | 14.0 | % | |||||||||||
| Stock-based compensation expense | 790,236 | 630,163 | 160,073 | 25.4 | % | |||||||||||
| Foreign currency transaction loss (gain) | (8,020 | ) | 20,865 | (28,885 | ) | (138.4 | )% | |||||||||
| Total operating expenses | $ | 9,299,461 | $ | 9,188,764 | $ | 110,697 | 1.2 | % | ||||||||
| Category | Impact | Key Drivers | ||||||
| Sales and marketing | ↓ | $ | 184,466 | Decreased primarily due to lower personnel costs. | ||||
| Technology and product development | ↑ | $ | 322,008 | Increased primarily due to greater personnel costs. | ||||
| General and administrative | ↓ | $ | 176,736 | Decreased primarily due to lower personnel costs. | ||||
Interest Expense
For the year ended June 30, 2018, interest expense was $4,000, compared to $12,000 for the prior year, a decrease of $8,000.
Provision for Income Taxes
During the years ended June 30, 2018 and 2017, we recorded a provision for income taxes of $39,779 and $35,495, respectively, an increase of $4,284.
Net Income (Loss)
| Year Ended June 30, | ||||||||||||||||
| 2018 | 2017 | 2018-2017 $ Change | 2018-2017 % Change | |||||||||||||
| Net Income (Loss): | ||||||||||||||||
| Loss from continuing operations | $ | (1,935,736 | ) | $ | (3,108,204 | ) | $ | 1,172,468 | 37.7 | % | ||||||
| Income from discontinued operations | 256,995 | 814,641 | (557,646 | ) | (68.5 | )% | ||||||||||
| Total net loss | $ | (1,678,741 | ) | $ | (2,293,563 | ) | $ | 614,822 | 26.8 | % | ||||||
| 21 |
Loss from continuing operations decreased $1,172,468 or 37.7%, for the year ended June 30, 2018 compared to the prior year, primarily due to increased gross profit, partially offset by increased operating expenses as described above.
Liquidity and Capital Resources
| Year Ended June 30, | ||||||||
| Consolidated Statements of Cash Flow Data: | 2018 | 2017 | ||||||
| Net cash used in operating activities | $ | (605,314 | ) | $ | (436,842 | ) | ||
| Net cash provided by (used in) investing activities | (86,736 | ) | 361,348 | |||||
| Net cash used in financing activities | (152,739 | ) | (199,328 | ) | ||||
| Effect of exchange rate changes | (20,981 | ) | (28,103 | ) | ||||
| Net decrease in cash and cash equivalents | (865,770 | ) | (302,925 | ) | ||||
| Cash and cash equivalents, beginning of period | 5,773,950 | 6,076,875 | ||||||
| Cash and cash equivalents, end of period | $ | 4,908,180 | $ | 5,773,950 | ||||
Liquidity
Since our inception, we have funded our operations primarily through private sales of equity securities and the exercise of warrants, which have provided aggregate net cash proceeds to date of approximately $15,972,000. As of June 30, 2018, we had working capital of $3,107,176 and stockholders’ equity of $3,279,402. For the year ended June 30, 2018, we recorded a net loss of $1,678,741, cash used by operating activities was $605,314. We may incur losses for an indeterminate period and may never sustain profitability. We may be unable to achieve and maintain profitability on a quarterly or annual basis. An extended period of losses and negative cash flow may prevent us from successfully operating and expanding our business.
As of June 30, 2018, we had cash and cash equivalents of $4,908,180, compared to $5,773,950 as of June 30, 2017, decrease of $865,770. This decrease was primarily due to cash used by operating activities.
Operating Activities
Net cash used by operating activities was $605,314 for the year ended June 30, 2018 and resulted primarily from net loss and reconciling items of $882,509, and a decrease in accounts payable and accrued expenses of $1,756,110, partially offset by an increase in accounts receivable of $1,214,048, an increase in prepaid royalties of $472,946, and an increase in deferred revenue of $330,271.
Net cash used by operating activities was $436,842 for the year ended June 30, 2017 and resulted primarily from net loss and reconciling items of $1,725,799, an increase in prepaid royalties of $392,617, partially offset by an increase in accounts payable and accrued expenses of $752,288, an increase in deferred revenue of $695,641, and an increase in accounts receivable of $296,561.
Investing Activities
Net cash used in investing activities was $86,736 for the year ended June 30, 2018 and resulted primarily from the purchase of intangible assets and property and equipment
Net cash provided by investing activities was $361,348 for the year ended June 30, 2017 and resulted primarily from the proceeds from sale of discontinued operations of $435,000, partially offset by purchase of intangible assets and property and equipment
Financing Activities
Net cash used by financing activities was $152,739 for the year ended June 30, 2018 and resulted from the repurchase of common stock.
Net cash used by financing activities was $199,328 for the year ended June 30, 2017 and resulted from the repurchase of common stock.
We entered into a Loan and Security Agreement with Silicon Valley Bank (“SVB”) on July 23, 2010, which, as amended, provides for a revolving line of credit for the lesser of $2,500,000, or 80% of eligible accounts receivable. The line of credit matures on December 31, 2019, and is subject to certain financial and performance covenants with which we were in compliance as of June 30, 2018. Financial covenants include maintaining an adjusted quick ratio of unrestricted cash and net accounts receivable, divided by current liabilities plus debt less deferred revenue of at least 1.15 to 1.0, and maintaining tangible net worth of $1,500,000, plus 50% of net income for the fiscal quarter ended from and after December 31, 2017, plus 50% of the dollar value of equity issuances after October 1, 2017 and the principal amount of subordinated debt. The line of credit bears interest at the prime rate plus 2.25% for periods in which we maintain an adjusted quick ratio of 1.3 to 1.0 (the “Streamline Period”), and at the prime rate plus 5.25% when a Streamline Period is not in effect. The interest rate on the line of credit was 6.75% as of June 30, 2018. The line of credit was secured by our consolidated assets.
| 22 |
There were no outstanding borrowings under the line as of June 30, 2018 and June 30, 2017, respectively. As of June 30, 2018 and June 30, 2017, approximately $1,901,000 and $3,277,000, respectively, of available credit was unused.
Non-GAAP Measure – Adjusted EBITDA
In addition to our GAAP results, we present Adjusted EBITDA as a supplemental measure of our performance. However, Adjusted EBITDA is not a recognized measurement under GAAP and should not be considered as an alternative to net income, income from operations or any other performance measure derived in accordance with GAAP or as an alternative to cash flow from operating activities as a measure of liquidity. We define Adjusted EBITDA as net income (loss), plus interest expense, other income (expense), foreign currency transaction loss, provision for income taxes, depreciation and amortization, stock-based compensation, income from discontinued operations and gain on sale of discontinued operations. Management considers our core operating performance to be that which our managers can affect in any particular period through their management of the resources that affect our underlying revenue and profit generating operations that period. Non-GAAP adjustments to our results prepared in accordance with GAAP are itemized below. You are encouraged to evaluate these adjustments and the reasons we consider them appropriate for supplemental analysis. In evaluating Adjusted EBITDA, you should be aware that in the future we may incur expenses that are the same as or similar to some of the adjustments in this presentation. Our presentation of Adjusted EBITDA should not be construed as an inference that our future results will be unaffected by unusual or non-recurring items.
Set forth below is a reconciliation of Adjusted EBITDA to net income (loss) for the year ended June 30, 2018 and 2017:
| Years Ended June 30, | ||||||||||||
| 2018 | 2017 | 2018-2017 $ Change | ||||||||||
| Net loss | $ | (1,678,741 | ) | $ | (2,293,563 | ) | $ | 614,822 | ||||
| Add (deduct): | ||||||||||||
| Interest expense | 4,000 | 12,000 | (8,000 | ) | ||||||||
| Other (income) expense | (58,179 | ) | (23,861 | ) | (34,318 | ) | ||||||
| Foreign currency transaction loss (gain) | (8,020 | ) | 20,865 | (28,885 | ) | |||||||
| Provision for income taxes | 39,779 | 35,495 | 4,284 | |||||||||
| Depreciation and amortization | 152,397 | 133,694 | 18,703 | |||||||||
| Stock-based compensation | 790,236 | 630,163 | 160,073 | |||||||||
| Income from discontinued operations | - | (573,445 | ) | 573,445 | ||||||||
| Gain on sale of discontinued operations | (256,995 | ) | (241,196 | ) | (15,799 | ) | ||||||
| Adjusted EBITDA | $ | (1,015,523 | ) | $ | (2,299,848 | ) | $ | 1,284,325 | ||||
We present Adjusted EBITDA because we believe it assists investors and analysts in comparing our performance across reporting periods on a consistent basis by excluding items that we do not believe are indicative of our core operating performance. In addition, we use Adjusted EBITDA in developing our internal budgets, forecasts and strategic plan; in analyzing the effectiveness of our business strategies in evaluating potential acquisitions; and in making compensation decisions and in communications with our board of directors concerning our financial performance. Adjusted EBITDA has limitations as an analytical tool, which includes, among others, the following:
| · | Adjusted EBITDA does not reflect our cash expenditures, or future requirements, for capital expenditures or contractual commitments; |
| · | Adjusted EBITDA does not reflect changes in, or cash requirements for, our working capital needs; |
| · | Adjusted EBITDA does not reflect interest expense, or the cash requirements necessary to service interest or principal payments, on our debts; and |
| · | although depreciation and amortization are non-cash charges, the assets being depreciated and amortized will often have to be replaced in the future, and Adjusted EBITDA does not reflect any cash requirements for such replacements. |
Off-Balance Sheet Arrangements
We do not have any off-balance sheet arrangements.
Recently Issued Accounting Pronouncements
For information about recently issued accounting standards, refer to Note 2 to our Consolidated Financial Statements appearing elsewhere in this report.
| 23 |
Item 7A. Quantitative and Qualitative Disclosures About Market Risk
Not required.
| 24 |
REPORT OF INDEPENDENT REGISTERED PUBLIC ACCOUNTING FIRM
To the Stockholders and Board of Directors
Research Solutions, Inc. and Subsidiaries
Encino, California
Opinion on the Financial Statements
We have audited the accompanying consolidated balance sheets of Research Solutions, Inc. (the “Company”) and Subsidiaries as of June 30, 2018 and 2017, the related statements of operations and other comprehensive loss, stockholders’ equity, and cash flows for the years then ended, and the related notes (collectively referred to as the “financial statements”). In our opinion, the financial statements present fairly, in all material respects, the financial position of the Company as of June 30, 2018 and 2017, and the results of its operations and its cash flows for the years then ended, in conformity with accounting principles generally accepted in the United States of America.
Basis for Opinion
These financial statements are the responsibility of the Company’s management. Our responsibility is to express an opinion on the Company’s financial statements based on our audits. We are a public accounting firm registered with the Public Company Accounting Oversight Board (United States) (“PCAOB”) and are required to be independent with respect to the Company in accordance with the U.S. federal securities laws and the applicable rules and regulations of the Securities and Exchange Commission and the PCAOB.
We conducted our audits in accordance with the standards of the PCAOB. Those standards require that we plan and perform the audit to obtain reasonable assurance about whether the financial statements are free of material misstatement, whether due to error or fraud. The Company is not required to have, nor were we engaged to perform, an audit of its internal control over financial reporting. As part of our audits we are required to obtain an understanding of internal control over financial reporting but not for the purpose of expressing an opinion on the effectiveness of the Company’s internal control over financial reporting. Accordingly, we express no such opinion.
Our audits included performing procedures to assess the risks of material misstatement of the financial statements, whether due to error or fraud, and performing procedures that respond to those risks. Such procedures included examining, on a test basis, evidence regarding the amounts and disclosures in the financial statements. Our audits also included evaluating the accounting principles used and significant estimates made by management, as well as evaluating the overall presentation of the financial statements. We believe that our audits provide a reasonable basis for our opinion.
| /s/ Weinberg and Company, P.A |
We have served as the Company’s auditor since 2006.
Los Angeles, California
September 20, 2018
| 25 |
Research Solutions, Inc. and Subsidiaries
Consolidated Balance Sheets
| June 30, | June 30, | |||||||
| 2018 | 2017 | |||||||
| Assets | ||||||||
| Current assets: | ||||||||
| Cash and cash equivalents | $ | 4,908,180 | $ | 5,773,950 | ||||
| Accounts receivable, net of allowance of $115,040 and $119,536, respectively | 4,251,251 | 5,465,299 | ||||||
| Prepaid expenses and other current assets | 326,887 | 196,820 | ||||||
| Prepaid royalties | 93,336 | 566,282 | ||||||
| Total current assets | 9,579,654 | 12,002,351 | ||||||
| Other assets: | ||||||||
| Property and equipment, net of accumulated depreciation of $749,923 and $699,421, respectively | 59,043 | 85,737 | ||||||
| Intangible assets, net of accumulated amortization of $723,036 and $623,714, respectively | - | 41,870 | ||||||
| Deposits and other assets | 14,372 | 14,466 | ||||||
| Right of use asset, net of accumulated amortization of $155,698 and $45,105, respectively | 307,324 | 417,917 | ||||||
| Total assets | $ | 9,960,393 | $ | 12,562,341 | ||||
| Liabilities and Stockholders’ Equity | ||||||||
| Current liabilities: | ||||||||
| Accounts payable and accrued expenses | $ | 4,686,946 | $ | 6,443,056 | ||||
| Deferred revenue | 1,665,746 | 1,335,475 | ||||||
| Lease liability, current portion | 119,786 | 110,888 | ||||||
| Total current liabilities | 6,472,478 | 7,889,419 | ||||||
| Long-term liabilities: | ||||||||
| Lease liability, long-term portion | 208,513 | 328,299 | ||||||
| Total liabilities | 6,680,991 | 8,217,718 | ||||||
| Commitments and contingencies | ||||||||
| Stockholders’ equity: | ||||||||
| Preferred stock; $0.001 par value; 20,000,000 shares authorized; no shares issued and outstanding | - | - | ||||||
| Common stock; $0.001 par value; 100,000,000 shares authorized; 24,016,999 and 23,883,145 shares issued and outstanding, respectively | 24,017 | 23,883 | ||||||
| Additional paid-in capital | 22,904,691 | 22,267,327 | ||||||
| Accumulated deficit | (19,554,599 | ) | (17,875,858 | ) | ||||
| Accumulated other comprehensive loss | (94,707 | ) | (70,729 | ) | ||||
| Total stockholders’ equity | 3,279,402 | 4,344,623 | ||||||
| Total liabilities and stockholders’ equity | $ | 9,960,393 | $ | 12,562,341 | ||||
See notes to consolidated financial statements
| 26 |
Research Solutions, Inc. and Subsidiaries
Consolidated Statements of Operations and Other Comprehensive Loss
| Years Ended | ||||||||
| June 30, | ||||||||
| 2018 | 2017 | |||||||
| Revenue: | ||||||||
| Platforms | $ | 1,819,149 | $ | 980,323 | ||||
| Transactions | 26,199,292 | 24,766,953 | ||||||
| Total revenue | 28,018,441 | 25,747,276 | ||||||
| Cost of revenue: | ||||||||
| Platforms | 378,904 | 205,051 | ||||||
| Transactions | 20,290,212 | 19,438,031 | ||||||
| Total cost of revenue | 20,669,116 | 19,643,082 | ||||||
| Gross profit | 7,349,325 | 6,104,194 | ||||||
| Operating expenses: | ||||||||
| Selling, general and administrative | 9,147,064 | 9,055,070 | ||||||
| Depreciation and amortization | 152,397 | 133,694 | ||||||
| Total operating expenses | 9,299,461 | 9,188,764 | ||||||
| Loss from operations | (1,950,136 | ) | (3,084,570 | ) | ||||
| Other income (expenses): | ||||||||
| Interest expense | (4,000 | ) | (12,000 | ) | ||||
| Other income | 58,179 | 23,861 | ||||||
| Total other income | 54,179 | 11,861 | ||||||
| Loss from continuing operations before provision for income taxes | (1,895,957 | ) | (3,072,709 | ) | ||||
| Provision for income taxes | (39,779 | ) | (35,495 | ) | ||||
| Loss from continuing operations | (1,935,736 | ) | (3,108,204 | ) | ||||
| Discontinued operations: | ||||||||
| Income from discontinued operations | - | 573,445 | ||||||
| Gain from sale of discontinued operations | 256,995 | 241,196 | ||||||
| Income from discontinued operations | 256,995 | 814,641 | ||||||
| Net loss | (1,678,741 | ) | (2,293,563 | ) | ||||
| Other comprehensive loss: | ||||||||
| Foreign currency translation | (23,978 | ) | (27,508 | ) | ||||
| Comprehensive loss | $ | (1,702,719 | ) | $ | (2,321,071 | ) | ||
| Loss per common share: | ||||||||
| Loss per share from continuing operations, basic and diluted | $ | (0.08 | ) | $ | (0.14 | ) | ||
| Income per share from discontinued operations, basic and diluted | $ | 0.01 | $ | 0.04 | ||||
| Net loss per share, basic and diluted | $ | (0.07 | ) | $ | (0.10 | ) | ||
| Weighted average common shares outstanding, basic and diluted | 23,473,105 | 23,241,572 | ||||||
See notes to consolidated financial statements
| 27 |
Research Solutions, Inc. and Subsidiaries
Consolidated Statement of Stockholders' Equity
For the Years Ended June 30, 2018 and 2017
| Additional | Other | Total | ||||||||||||||||||||||
| Common Stock | Paid-in | Accumulated | Comprehensive | Stockholders' | ||||||||||||||||||||
| Shares | Amount | Capital | Deficit | Loss | Equity | |||||||||||||||||||
| Balance, July 1, 2016 | 23,809,593 | 23,810 | 21,642,763 | (15,582,295 | ) | (43,221 | ) | 6,041,057 | ||||||||||||||||
| Fair value of vested stock options | - | - | 375,244 | - | - | 375,244 | ||||||||||||||||||
| Fair value of vested restricted common stock | 269,510 | 268 | 366,023 | - | - | 366,291 | ||||||||||||||||||
| Repurchase of common stock | (195,958 | ) | (195 | ) | (199,133 | ) | - | - | (199,328 | ) | ||||||||||||||
| Modification cost of stock options in connection with sale of discontinued operations | - | - | 82,430 | - | - | 82,430 | ||||||||||||||||||
| Net loss | - | - | - | (2,293,563 | ) | - | (2,293,563 | ) | ||||||||||||||||
| Foreign currency translation | - | - | - | - | (27,508 | ) | (27,508 | ) | ||||||||||||||||
| Balance, June 30, 2017 | 23,883,145 | 23,883 | 22,267,327 | (17,875,858 | ) | (70,729 | ) | 4,344,623 | ||||||||||||||||
| Fair value of vested stock options | - | - | 451,475 | - | - | 451,475 | ||||||||||||||||||
| Fair value of vested restricted common stock | 423,107 | 424 | 332,105 | - | - | 332,529 | ||||||||||||||||||
| Forfeited restricted common stock | (214,324 | ) | (214 | ) | 214 | - | ||||||||||||||||||
| Repurchase of common stock | (120,900 | ) | (121 | ) | (152,618 | ) | - | - | (152,739 | ) | ||||||||||||||
| Modification cost of stock options | - | - | 6,233 | - | - | 6,233 | ||||||||||||||||||
| Common stock issued upon exercise of stock options | 45,971 | 45 | (45 | ) | - | |||||||||||||||||||
| Net loss | - | - | - | (1,678,741 | ) | - | (1,678,741 | ) | ||||||||||||||||
| Foreign currency translation | - | - | - | - | (23,978 | ) | (23,978 | ) | ||||||||||||||||
| Balance, June 30, 2018 | 24,016,999 | $ | 24,017 | $ | 22,904,691 | $ | (19,554,599 | ) | $ | (94,707 | ) | $ | 3,279,402 | |||||||||||
See notes to consolidated financial statements
| 28 |
Research Solutions, Inc. and Subsidiaries
Consolidated Statements of Cash Flows
| Years Ended | ||||||||
| June 30, | ||||||||
| 2018 | 2017 | |||||||
| Cash flow from operating activities: | ||||||||
| Net loss | $ | (1,678,741 | ) | $ | (2,293,563 | ) | ||
| Adjustment to reconcile net loss to net cash used in operating activities of continuing operations: | ||||||||
| Gain from sale of discontinued operations | (256,995 | ) | (241,196 | ) | ||||
| Depreciation and amortization | 152,397 | 133,694 | ||||||
| Amortization of lease right | 110,593 | 45,105 | ||||||
| Fair value of vested stock options | 451,475 | 263,870 | ||||||
| Fair value of vested restricted common stock | 332,529 | 366,291 | ||||||
| Modification cost of stock options | 6,233 | - | ||||||
| Changes in operating assets and liabilities: | ||||||||
| Accounts receivable | 1,214,048 | 296,561 | ||||||
| Prepaid expenses and other current assets | 126,928 | (32,210 | ) | |||||
| Prepaid royalties | 472,946 | (392,617 | ) | |||||
| Deposits and other assets | - | (6,872 | ) | |||||
| Accounts payable and accrued expenses | (1,756,110 | ) | 752,288 | |||||
| Deferred revenue | 330,271 | 695,641 | ||||||
| Lease liability | (110,888 | ) | (23,834 | ) | ||||
| Net cash used in operating activities | (605,314 | ) | (436,842 | ) | ||||
| Cash flow from investing activities: | ||||||||
| Purchase of property and equipment | (29,284 | ) | (59,595 | ) | ||||
| Purchase of intangible assets | (57,452 | ) | (14,057 | ) | ||||
| Proceeds from sale of discontinued operations | - | 435,000 | ||||||
| Net cash provided by (used in) investing activities | (86,736 | ) | 361,348 | |||||
| Cash flow from financing activities: | ||||||||
| Common stock repurchase and retirement | (152,739 | ) | (199,328 | ) | ||||
| Net cash used in financing activities | (152,739 | ) | (199,328 | ) | ||||
| Effect of exchange rate changes | (20,981 | ) | (28,103 | ) | ||||
| Net decrease in cash and cash equivalents | (865,770 | ) | (302,925 | ) | ||||
| Cash and cash equivalents, beginning of period | 5,773,950 | 6,076,875 | ||||||
| Cash and cash equivalents, end of period | $ | 4,908,180 | $ | 5,773,950 | ||||
| Supplemental disclosures of cash flow information: | ||||||||
| Cash paid for income taxes | $ | 39,779 | $ | 35,495 | ||||
| Cash paid for interest | $ | 4,000 | $ | 12,000 | ||||
| Supplemental noncash investing and financing activities: | ||||||||
| Acquisition of leased asset and lease liability | $ | - | 463,022 | |||||
See notes to consolidated financial statements
| 29 |
RESEARCH SOLUTIONS, INC. AND SUBSIDIARIES
NOTES TO CONSOLIDATED FINANCIAL STATEMENTS
For the Years Ended June 30, 2018 and 2017
| Note 1. | Organization, Nature of Business and Basis of Presentation |
Organization
Research Solutions, Inc. (the “Company,” “Research Solutions,” “we,” “us” or “our”) was incorporated in the State of Nevada on November 2, 2006, and is a publicly traded holding company with two wholly owned subsidiaries at June 30, 2018: Reprints Desk, Inc., a Delaware corporation and Reprints Desk Latin America S. de R.L. de C.V, an entity organized under the laws of Mexico.
On June 30, 2017, we sold the intangible assets of our Reprints and ePrints business line, but specifically excluding billed accounts receivable and respective liabilities, pursuant to an Asset Purchase Agreement dated June 20, 2017. The aggregate net consideration for the sale is comprised of $450,000 paid on the closing date, and earn-out payments of 45% of gross margin over the 30 month period subsequent to the closing date. We have made a policy election to record the contingent consideration when the consideration is determined to be realizable (each 6-month period ending subsequent to the closing date).
Nature of Business
We provide two service offerings to our customers: annual licenses that allow customers to access and utilize certain premium features of our cloud based software-as-a-service (“SaaS”) research intelligence platform (“Platforms”) and the transactional sale of published scientific, technical, and medical (“STM”) content managed, sourced and delivered through the Platform (“Transactions”). Platforms and Transactions are packaged as a single solution that enable life science and other research intensive organizations to speed up research and development activities with faster, single sourced access and management of content and data used throughout the intellectual property development lifecycle.
Platforms
Our cloud-based SaaS research intelligence platform consists of proprietary software and Internet-based interfaces. Legacy functionality allows customers to initiate orders, route orders for the lowest cost acquisition, manage transactions, obtain spend and usage reporting, automate authentication, and connect seamlessly to in-house and third-party software systems. Customers can also enhance the information resources they already own or license and collaborate around bibliographic information.
Additional functionality has recently been added to our Platform in the form of interactive app-like gadgets. An alternative to manual data filtering, identification and extraction, gadgets are designed to gather, augment, and extract data across a variety of formats, including bibliographic citations, tables of contents, RSS feeds, PDF files, XML feeds, and web content. We are rapidly developing new gadgets in order to build an ecosystem of gadgets. Together, these gadgets will provide researchers with an “all in one” toolkit, delivering efficiencies in core research workflows and knowledge creation processes.
Our Platform is deployed as a single, multi-tenant system across our entire customer base. Customers securely access the Platform through online web interfaces and via web service APIs that enable customers to leverage Platform features and functionality from within in-house and third-party software systems. The Platform can also be configured to satisfy a customer’s individual preferences. We leverage our Platform’s efficiencies in scalability, stability and development costs to fuel rapid innovation and competitive advantage.
Transactions
Researchers and knowledge workers in life science and other research-intensive organizations generally require single copies of published STM journal articles for use in their research activities. These individuals are our primary users. Our Platform provides our customers with a single source to the universe of published STM content that includes over 70 million existing STM articles and over one million newly published STM articles each year.
Our Platform allows customers to find and download digital versions of STM articles that are critical to their research. Customers submit orders for the articles they need which we source and electronically deliver to them generally in under an hour. This service is generally known in the industry as single article delivery or document delivery. We also obtain the necessary permission licenses from the content publisher or other rights holder so that our customer’s use complies with applicable copyright laws. We have arrangements with hundreds of content publishers that allow us to distribute their content. The majority of these publishers provide us with electronic access to their content, which allows us to electronically deliver single articles to our customers often in a matter of minutes.
Principles of Consolidation
The accompanying financial statements are consolidated and include the accounts of the Company and its wholly-owned subsidiaries. Intercompany balances and transactions have been eliminated in consolidation.
| 30 |
| Note 2. | Summary of Significant Accounting Policies |
Use of Estimates
The preparation of financial statements in conformity with Generally Accepted Accounting Principles (“GAAP”) requires management to make estimates and assumptions that affect the reported amounts of assets and liabilities and disclosures of contingent assets and liabilities at the date of the financial statements and the reported amounts of revenue and expenses during the reporting periods. Actual results could differ from these estimates.
These estimates and assumptions include estimates for reserves of uncollectible accounts, analysis of impairments of recorded intangibles, accruals for potential liabilities, assumptions made in valuing equity instruments issued for services or acquisitions, and realization of deferred tax assets.
Cash and cash equivalents
For purposes of the statements of cash flows, the Company defines cash equivalents as all highly liquid debt instruments purchased with an original maturity of three months or less.
Fair value of financial instruments
Under Financial Accounting Standards Board (“FASB”) Accounting Standards Codification (“ASC”) Topic 820, Fair Value Measurements and Disclosures, fair value is defined as the price at which an asset could be exchanged or a liability transferred in a transaction between knowledgeable, willing parties in the principal or most advantageous market for the asset or liability. Where available, fair value is based on observable market prices or parameters or derived from such prices or parameters. Where observable prices or parameters are not available, valuation models are applied. A fair value hierarchy prioritizes the inputs used in measuring fair value into three broad levels as follows:
Level 1 – Quoted prices in active markets for identical assets or liabilities.
Level 2 – Inputs, other than the quoted prices in active markets, are observable either directly or indirectly.
Level 3 – Unobservable inputs based on the Company's assumptions.
The Company is required to use observable market data if such data is available without undue cost and effort. The Company has no fair value items required to be disclosed as of June 30, 2018 or 2017 under these requirements.
The carrying amounts of financial assets and liabilities, such as cash and cash equivalents, accounts receivable and accounts payable, approximate their fair values because of the short maturity of these instruments.
Allowance for doubtful accounts
The Company evaluates the collectability of its trade accounts receivable based on a number of factors. In circumstances where the Company becomes aware of a specific customer’s inability to meet its financial obligations to the Company, a specific reserve for bad debts is estimated and recorded, which reduces the recognized receivable to the estimated amount the Company believes will ultimately be collected. In addition to specific customer identification of potential bad debts, bad debt charges are recorded based on the Company’s historical losses and an overall assessment of past due trade accounts receivable outstanding. The Company established an allowance for doubtful accounts of $115,040 and $119,536 as of June 30, 2018 and 2017, respectively.
Concentration of Credit Risk
Financial instruments, which potentially subject the Company to concentrations of credit risk, consist of cash and cash equivalents and accounts receivable. The Company places its cash with high quality financial institutions and at times may exceed the FDIC $250,000 insurance limit. The Company does not anticipate incurring any losses related to these credit risks. The Company extends credit based on an evaluation of the customer's financial condition, generally without collateral. Exposure to losses on receivables is principally dependent on each customer's financial condition. The Company monitors its exposure for credit losses and intends to maintain allowances for anticipated losses, as required.
Cash denominated in Euros with a US Dollar equivalent of $109,585 and $93,359 at June 30, 2018 and 2017, respectively, was held in accounts at financial institutions located in Europe.
The Company has no customers that represent 10% of revenue or more for the years ended June 30, 2018 and 2017.
The Company has no customers that accounted for greater than 10% of accounts receivable as of June 30, 2018 and 2017.
| 31 |
The following table summarizes our content costs from our vendors:
Year Ended June 30, | ||||||||
| 2018 | 2017 | |||||||
| Vendor A | 15 | % | 16 | % | ||||
| Vendor B | 12 | % | 11 | % | ||||
| Vendor C | 11 | % | * | |||||
* Less than 10%
Property and equipment
Property and equipment are stated at cost and are depreciated using the straight-line method over their estimated useful lives of 3 to 7 years. Leasehold improvements are amortized over the shorter of the useful lives of the related assets, or the lease term. Expenditures for maintenance and repairs are charged to operations as incurred while renewals and betterments are capitalized. Gains and losses on disposals are included in the consolidated statements of operations.
Management assesses the carrying value of property and equipment whenever events or changes in circumstances indicate that the carrying value may not be recoverable. If there is indication of impairment, management prepares an estimate of future cash flows expected to result from the use of the asset and its eventual disposition. If these cash flows are less than the carrying amount of the asset, an impairment loss is recognized to write down the asset to its estimated fair value. For the years ended June 30, 2018 and 2017, the Company did not recognize any impairments for its property and equipment.
Intangible Assets
Management performs impairment tests of indefinite-lived intangible assets at least annually, or whenever an event occurs or circumstances change that indicates impairment has more likely than not occurred.
The Company reviews intangible assets subject to amortization at least annually to determine if any adverse conditions exist or a change in circumstances has occurred that would indicate impairment or a change in the remaining useful life. If the carrying value of an asset exceeds its undiscounted cash flows, the Company writes down the carrying value of the intangible asset to its fair value in the period identified. If the carrying value of assets is determined not to be recoverable, the Company records an impairment loss equal to the excess of the carrying value over the fair value of the assets. The Company’s estimate of fair value is based on the best information available, in the absence of quoted market prices. The Company generally calculates fair value as the present value of estimated future cash flows that the Company expects to generate from the asset using a discounted cash flow income approach as described above. If the estimate of an intangible asset’s remaining useful life is changed, the Company amortizes the remaining carrying value of the intangible asset prospectively over the revised remaining useful life.
As of June 30, 2018 and 2017, the Company determined that there were no indicators of impairment of its recorded intangible assets.
Revenue Recognition
The Company’s policy is to recognize revenue when services have been performed, risk of loss and title to the product transfers to the customer, the selling price is fixed or determinable, and collectability is reasonably assured. We generate revenue by providing two service offerings to our customers: annual licenses that allow customers to access and utilize certain premium features of our cloud based SaaS research intelligence platform (“Platforms”) and the transaction sale of STM content managed, sourced and delivered through the Platform (“Transactions”).
Platforms
We charge a subscription fee that allows customers to access and utilize certain premium features of our Platform. Revenue is recognized ratably over the term of the subscription agreement, which is typically one year, provided all other revenue recognition criteria have been met. Billings or payments received in advance of revenue recognition are recorded as deferred revenue.
| 32 |
Transactions
We charge a transactional service fee for the electronic delivery of single articles, and a corresponding copyright fee for the permitted use of the content. We recognize revenue from single article delivery services upon delivery to the customer only when the selling price is fixed or determinable, and collectability is reasonably assured.
Deferred Revenue
Customer deposits and billings or payments received in advance of revenue recognition are recorded as deferred revenue.
Cost of Revenue
Platforms
Cost of Platform revenue consists primarily of personnel costs of our operations team, and to a lesser extent managed hosting providers and other third-party service and data providers.
Transactions
Cost of Transaction revenue consists primarily of the respective copyright fee for the permitted use of the content, less a discount in most cases, and to a much lesser extent, personnel costs of our operations team and third-party service providers.
Stock-Based Compensation
The Company periodically issues stock options, warrants and restricted stock to employees and non-employees for services, in capital raising transactions, and for financing costs. The Company accounts for share-based payments under the guidance as set forth in the Share-Based Payment Topic 718 of the FASB Accounting Standards Codification, which requires the measurement and recognition of compensation expense for all share-based payment awards made to employees, officers, directors, and consultants, including employee stock options, based on estimated fair values. The Company estimates the fair value of stock option and warrant awards to employees and directors on the date of grant using an option-pricing model, and the value of the portion of the award that is ultimately expected to vest is recognized as expense over the required service period in the Company's Statements of Operations. The Company estimates the fair value of restricted stock awards to employees and directors using the market price of the Company’s common stock on the date of grant, and the value of the portion of the award that is ultimately expected to vest is recognized as expense over the required service period in the Company's Statements of Operations. The Company accounts for share-based payments to non-employees in accordance with Topic 505 of the FASB Accounting Standards Codification, whereby the value of the stock compensation is based upon the measurement date as determined at either a) the date at which a performance commitment is reached, or b) the date at which the necessary performance to earn the equity instruments is complete. Stock-based compensation is based on awards ultimately expected to vest and is reduced for estimated forfeitures. Forfeitures are estimated at the time of grant and revised, as necessary, in subsequent periods if actual forfeitures differ from those estimates.
Foreign Currency
The accompanying consolidated financial statements are presented in United States dollars, the functional currency of the Company. Capital accounts of foreign subsidiaries are translated into US Dollars from foreign currency at their historical exchange rates when the capital transactions occurred. Assets and liabilities are translated at the exchange rate as of the balance sheet date. Income and expenditures are translated at the average exchange rate of the period. Although the majority of our revenue and costs are in US dollars, the costs of Reprints Desk Latin America are in Mexican Pesos. As a result, currency exchange fluctuations may impact our revenue and the costs of our operations. We currently do not engage in any currency hedging activities.
Gains and losses from foreign currency transactions, which result from a change in exchange rates between the functional currency and the currency in which a foreign currency transaction is denominated, are included in selling, general and administrative expenses and amounted to a gain of $8,020 and a loss of $20,865, for the years ended June 30, 2018 and 2017, respectively. Cash denominated in Euros with a US Dollar equivalent of $109,585 and $93,359 at June 30, 2018 and 2017, respectively, was held in accounts at financial institutions located in Europe.
The following table summarizes the exchange rates used:
| Year Ended June 30, | ||||||||
| 2018 | 2017 | |||||||
| Period end Euro : US Dollar exchange rate | 1.17 | 1.14 | ||||||
| Average period Euro : US Dollar exchange rate | 1.19 | 1.09 | ||||||
| Period end Mexican Peso : US Dollar exchange rate | 0.05 | 0.05 | ||||||
| Average period Mexican Peso : US Dollar exchange rate | 0.05 | 0.05 | ||||||
| 33 |
Net Income (Loss) Per Share
Basic net income (loss) per share is computed by dividing net income (loss) by the weighted average number of common shares outstanding for the period, excluding unvested restricted common stock. Shares of restricted stock are included in the basic weighted average number of common shares outstanding from the time they vest. Diluted earnings per share is computed by dividing the net income applicable to common stock holders by the weighted average number of common shares outstanding plus the number of additional common shares that would have been outstanding if all dilutive potential common shares had been issued, using the treasury stock method. Shares of restricted stock are included in the diluted weighted average number of common shares outstanding from the date they are granted. Potential common shares are excluded from the computation when their effect is antidilutive. At June 30, 2018 potentially dilutive securities include options to acquire 2,991,835 shares of common stock, warrants to acquire 1,985,000 shares of common stock and unvested restricted common stock of 416,619. At June 30, 2017 potentially dilutive securities include options to acquire 3,130,310 shares of common stock, warrants to acquire 1,985,000 shares of common stock and unvested restricted common stock of 513,194. The dilutive effect of potentially dilutive securities is reflected in diluted net income per share if the exercise prices were lower than the average fair market value of common shares during the reporting period.
Basic and diluted net loss per common share is the same for the years ended June 30, 2018 and 2017 because all stock options, warrants, and unvested restricted common stock are anti-dilutive.
Income taxes
The Company accounts for income taxes using the asset and liability method whereby deferred tax assets are recognized for deductible temporary differences, and deferred tax liabilities are recognized for taxable temporary differences. Temporary differences are the differences between the reported amounts of assets and liabilities and their tax bases. Deferred tax assets are reduced by a valuation allowance when, in the opinion of management, it is more likely than not that some portion or all of the deferred tax assets will be realized. Deferred tax assets and liabilities are adjusted for the effects of changes in tax laws and rates on the date of enactment.
Recently Issued Accounting Pronouncements
In May 2014, the FASB issued Accounting Standards Update (ASU) No. 2014-09, Revenue from Contracts with Customers. ASU 2014-09 will eliminate transaction- and industry-specific revenue recognition guidance under current U.S. GAAP and replace it with a principle based approach for determining revenue recognition. ASU 2014-09 will require that companies recognize revenue based on the value of transferred goods or services as they occur in the contract. The ASU also will require additional disclosure about the nature, amount, timing and uncertainty of revenue and cash flows arising from customer contracts, including significant judgments and changes in judgments and assets recognized from costs incurred to obtain or fulfill a contract. ASU 2014-09 is effective for interim and annual periods beginning after December 15, 2017. Early adoption is permitted only in annual reporting periods beginning after December 15, 2016, including interim periods therein. Entities can transition to the standard either retrospectively or as a cumulative-effect adjustment as of the date of adoption. The Company will adopt ASU 2014-09 effective July 1, 2018 and has chosen the modified retrospective approach as it applies to any revenue and commission impact. The adoption of ASU 2014-09 is not expected to have a material impact.
In June 2018, the FASB issued ASU 2018-07, “Compensation – Stock Compensation (Topic 718): Improvements to Nonemployee Share-Based Payment Accounting.” The ASU expands the scope of Topic 718 to include share-based payment transactions for acquiring goods and services from nonemployees. The ASU also clarifies that Topic 718 does not apply to share-based payments used to effectively provide (1) financing to the issuer or (2) awards granted in conjunction with selling goods or services to customers as part of a contract accounted for under Revenue from Contracts with Customers (Topic 606). The guidance is effective for fiscal years beginning after December 15, 2018, including interim periods within that fiscal year. Early adoption is permitted. The Company is currently assessing the effect that the ASU will have on our financial position, results of operations, and disclosures.
| 34 |
Other recent accounting pronouncements issued by the FASB, including its Emerging Issues Task Force, the American Institute of Certified Public Accountants, and the Securities and Exchange Commission did not or are not believed by management to have a material impact on the Company's present or future consolidated financial statements.
| Note 3. | Property and Equipment |
Property and equipment consists of the following as of June 30, 2018 and 2017:
June 30, 2018 | June 30, 2017 | |||||||
| Computer equipment | $ | 489,540 | $ | 473,731 | ||||
| Software | 279,817 | 271,057 | ||||||
| Furniture and fixtures | 39,609 | 40,370 | ||||||
| Total | 808,966 | 785,158 | ||||||
| Less accumulated depreciation | (749,923 | ) | (699,421 | ) | ||||
| Net, Property and equipment | $ | 59,043 | $ | 85,737 | ||||
Depreciation expense for the years ended June 30, 2018 and 2017 was $53,075 and $56,660, respectively.
| Note 4. | Intangible Assets |
Intangible assets consist of customer lists, which are amortized over an estimated useful life of two years.
Intangible assets consist of the following as of June 30, 2018 and 2017:
June 30, 2018 | June 30, 2017 | |||||||
| Customer lists | $ | 706,611 | $ | 649,159 | ||||
| Intellectual property licenses | 16,425 | 16,425 | ||||||
| Total | 723,036 | 665,584 | ||||||
| Less accumulated amortization | (723,036 | ) | (623,714 | ) | ||||
| Net, Intangible assets | $ | - | $ | 41,870 | ||||
Amortization expense for the years ended June 30, 2018 and 2017 was $99,322 and $77,034, respectively.
| Note 5. | Line of Credit |
The Company entered into a Loan and Security Agreement with Silicon Valley Bank (“SVB”) on July 23, 2010, which, as amended, provides for a revolving line of credit for the lesser of $2,500,000, or 80% of eligible accounts receivable. The line of credit matures on December 31, 2019, and is subject to certain financial and performance covenants with which we were in compliance as of June 30, 2018. Financial covenants include maintaining an adjusted quick ratio of unrestricted cash and net accounts receivable, divided by current liabilities plus debt less deferred revenue of at least 1.15 to 1.0, and maintaining tangible net worth of $1,500,000, plus 50% of net income for the fiscal quarter ended from and after December 31, 2017, plus 50% of the dollar value of equity issuances after October 1, 2017 and the principal amount of subordinated debt. The line of credit bears interest at the prime rate plus 2.25% for periods in which we maintain an adjusted quick ratio of 1.3 to 1.0 (the “Streamline Period”), and at the prime rate plus 5.25% when a Streamline Period is not in effect. The interest rate on the line of credit was 6.75% as of June 30, 2018. The line of credit is secured by the Company’s consolidated assets.
There were no outstanding borrowings under the line as of June 30, 2018 and June 30, 2017, respectively. As of June 30, 2018 and June 30, 2017, approximately $1,901,000 and $3,277,000, respectively, of available credit was unused.
| Note 6. | Lease Obligations |
On December 30, 2016, the Company entered into a 48 month non-cancellable lease for its office facilities that will require monthly payments ranging from $10,350 to $11,475 through January 2021. In accounting for the lease, the Company adopted ASU 2016-02, Leases which requires a lessee to record a right-of-use asset and a corresponding lease liability at the inception of the lease initially measured at the present value of the lease payments. The Company classified the lease as an operating lease and determined that the fair value of the lease assets and liability at the inception of the lease was $463,000 using a discount rate of 3.75%. During the twelve months ended June 30, 2018, the Company made payments of $110,888 towards the lease liability. As of June 30, 2018 and 2017, lease liability amounted to $328,299 and $439,187, respectively. ASU 2016-02 requires recognition in the statement of operations of a single lease cost, calculated so that the cost of the lease is allocated over the lease term, generally on a straight-line basis. Rent expense, including real estate taxes, for the years ended June 30, 2018 and 2017 was $142,742 and $121,565, respectively. The right of use asset at June 30, 2017 was $417,917. During the years ended June 30, 2018 and 2017, the Company reflected amortization of right of use asset of $110,593 and $45,105 related to this lease, respectively, resulting in a net asset balance of $307,324 as of June 30, 2018.
| 35 |
Future minimum lease payments under the leases are as follows:
| Years Ending June 30, | Amount | |||
| 2019 | $ | 130,469 | ||
| 2020 | 135,035 | |||
| 2021 | 80,356 | |||
| Total payments | 345,860 | |||
| Less: Amount representing interest | 17,561 | |||
| Present value of net minimum lease payments | 328,299 | |||
| Less: Current portion | 119,786 | |||
| Non-current portion | $ | 208,513 | ||
| Note 7. | Stockholders’ Equity |
Stock Options
In December 2007, we established the 2007 Equity Compensation Plan (the “2007 Plan”) and in November 2017 we established the 2017 Omnibus Incentive Plan (the “2017 Plan”), collectively (the “Plans”). The Plans were approved by our board of directors and stockholders. The purpose of the Plans is to grant stock and options to purchase our common stock, and other incentive awards, to our employees, directors and key consultants. On November 10, 2016, the maximum number of shares of common stock that may be issued pursuant to awards granted under the 2007 Plan increased from 5,000,000 to 7,000,000. On November 21, 2017, the Company’s stockholders approved the adoption of the 2017 Plan (previously adopted by our board of directors on September 14, 2017), which authorized a maximum of 1,874,513 shares of common stock that may be issued pursuant to awards granted under the 2017 Plan. Upon adoption of the 2017 Plan we ceased granting incentive awards under the 2007 Plan and commenced granting incentive awards under the 2017 Plan. The shares of our common stock underlying cancelled and forfeited awards issued under the 2017 Plan may again become available for grant under the 2017 Plan. Cancelled and forfeited awards issued under the 2007 Plan that were cancelled or forfeited prior to November 21, 2017 became available for grant under the 2007 Plan. As of June 30, 2018, there were 1,424,491 shares available for grant under the 2017 Plan, and no shares were available for grant under the 2007 Plan. All incentive stock award grants prior to the adoption of the 2017 Plan on November 21, 2017 were made under the 2007 Plan, and all incentive stock award grants after the adoption of the 2017 Plan on November 21, 2017 were made under the 2017 Plan.
The majority of awards issued under the Plan vest immediately or over three years, with a one year cliff vesting period, and have a term of ten years. Stock-based compensation cost is measured at the grant date, based on the fair value of the awards that are ultimately expected to vest, and recognized on a straight-line basis over the requisite service period, which is generally the vesting period.
The following table summarizes vested and unvested stock option activity:
| All Options | Vested Options | Unvested Options | ||||||||||||||||||||||
| Shares | Weighted Average Exercise Price | Shares | Weighted Average Exercise Price | Shares | Weighted Average Exercise Price | |||||||||||||||||||
| Outstanding at July 1, 2016 | 2,717,193 | 1.16 | 2,517,333 | 1.17 | 199,860 | 1.06 | ||||||||||||||||||
| Granted | 630,117 | 1.11 | 542,000 | 1.12 | 88,117 | 1.05 | ||||||||||||||||||
| Options vesting | - | - | 152,518 | 1.04 | (152,518 | ) | 1.04 | |||||||||||||||||
| Exercised | - | - | - | - | - | - | ||||||||||||||||||
| Forfeited/Cancelled | (217,000 | ) | 1.23 | (217,000 | ) | 1.23 | - | - | ||||||||||||||||
| Outstanding at June 30, 2017 | 3,130,310 | 1.15 | 2,994,851 | 1.15 | 135,459 | 1.07 | ||||||||||||||||||
| Granted | 807,000 | 1.31 | 750,000 | 1.30 | 57,000 | 1.44 | ||||||||||||||||||
| Options vesting | - | - | 74,333 | 1.07 | (74,333 | ) | 1.07 | |||||||||||||||||
| Exercised | (462,766 | ) | 1.19 | (462,766 | ) | 1.19 | - | - | ||||||||||||||||
| Forfeited/Cancelled | (482,709 | ) | 1.31 | (471,042 | ) | 1.32 | (11,667 | ) | 1.07 | |||||||||||||||
| Outstanding at June 30, 2018 | 2,991,835 | $ | 1.16 | 2,885,376 | $ | 1.15 | 106,459 | $ | 1.27 | |||||||||||||||
| 36 |
The following table presents the assumptions used to estimate the fair values based upon a Black-Scholes option pricing model of the stock options granted during the years ended June 30, 2018 and 2017.
| Years Ended June 30, | ||||||||
| 2018 | 2017 | |||||||
| Expected dividend yield | 0 | % | 0 | % | ||||
| Risk-free interest rate | 1.45% - 2.88 | % | 1.27% - 2.06 | % | ||||
| Expected life (in years) | 2.6 - 6.0 | 5.0 - 6.0 | ||||||
| Expected volatility | 68% - 76 | % | 77% - 81 | % | ||||
The weighted average remaining contractual life of all options outstanding as of June 30, 2018 was 5.61 years. The remaining contractual life for options vested and exercisable at June 30, 2018 was 5.48 years. Furthermore, the aggregate intrinsic value of options outstanding as of June 30, 2018 was $2,377,376, and the aggregate intrinsic value of options vested and exercisable at June 30, 2018 was $2,304,710, in each case based on the fair value of the Company’s common stock on June 30, 2018.
During the year ended June 30, 2018, the Company granted 807,000 options to employees and directors with a fair value of $455,040. The total fair value of options that vested during the year ended June 30, 2018 was $451,475 and was included in selling, general and administrative expenses in the accompanying statement of operations. As of June 30, 2018, the amount of unvested compensation related to these options was $73,353 which will be recorded as an expense in future periods as the options vest.
During the year ended June 30, 2017, the Company granted 630,117 options to employees and directors with a fair value of $362,531. The total fair value of options that vested during the year ended June 30, 2017 was $375,244, of which $263,870 is included in selling, general and administrative expenses, and $111,374 is included as a reduction to the gain on sale of discontinued operations in the accompanying statement of operations.
On September 30, 2017, options originally issued to a former director to purchase an aggregate of 17,600 shares of the Company’s common stock were modified to extend the exercise period from three months to approximately five years. Stock-based compensation cost of $6,233 was recorded during the year ended June 30, 2018 as a result of the modification.
On June 30, 2017, options originally issued to employees to purchase an aggregate of 173,237 shares of the Company’s common stock were modified in connection with the sale of the Reprints and ePrints business line to extend the exercise period from three months to five years and immediately vest 40,387 unvested options. The Company calculated the fair value of the options before and after the modification and recorded a change of $82,430 relating to the modification. This cost was recorded as an offset to the gain on sale of discontinued operations during the year ended June 30, 2017.
Additional information regarding stock options outstanding and exercisable as of June 30, 2018 is as follows:
| Option Exercise Price | Options Outstanding | Remaining Contractual Life (in years) | Options Exercisable | |||||||||||
| $ | 0.59 | 8,150 | 4.00 | 8,150 | ||||||||||
| 0.60 | 5,000 | 4.00 | 5,000 | |||||||||||
| 0.65 | 6,150 | 4.00 | 6,150 | |||||||||||
| 0.70 | 225,000 | 7.44 | 225,000 | |||||||||||
| 0.77 | 59,500 | 5.26 | 59,500 | |||||||||||
| 0.80 | 16,000 | 7.15 | 16,000 | |||||||||||
| 0.90 | 25,667 | 5.81 | 25,667 | |||||||||||
| 0.97 | 6,000 | 4.00 | 6,000 | |||||||||||
| 1.00 | 290,249 | 2.15 | 290,249 | |||||||||||
| 1.02 | 227,000 | 2.43 | 227,000 | |||||||||||
| 1.05 | 447,529 | 8.13 | 421,695 | |||||||||||
| 1.07 | 53,898 | 4.30 | 53,898 | |||||||||||
| 1.09 | 156,165 | 7.46 | 132,540 | |||||||||||
| 1.10 | 105,000 | 7.01 | 105,000 | |||||||||||
| 1.14 | 3,674 | 4.00 | 3,674 | |||||||||||
| 1.15 | 209,400 | 3.32 | 209,400 | |||||||||||
| 1.20 | 353,414 | 9.07 | 331,414 | |||||||||||
| 1.25 | 32,000 | 4.63 | 32,000 | |||||||||||
| 1.30 | 243,000 | 3.68 | 243,000 | |||||||||||
| 1.50 | 295,000 | 4.25 | 295,000 | |||||||||||
| 1.59 | 35,000 | 9.87 | - | |||||||||||
| 1.75 | 1,067 | 4.00 | 1,067 | |||||||||||
| 1.80 | 162,550 | 4.95 | 162,550 | |||||||||||
| 1.85 | 24,000 | 4.59 | 24,000 | |||||||||||
| 1.97 | 1,422 | 4.00 | 1,422 | |||||||||||
| Total | 2,991,835 | 2,885,376 | ||||||||||||
| 37 |
Warrants
The following table summarizes warrant activity:
Number of Warrants | Weighted Average Exercise Price | |||||||
| Outstanding, June 30, 2016 | 1,990,000 | $ | 1.25 | |||||
| Granted | - | - | ||||||
| Exercised | - | - | ||||||
| Expired/Cancelled | (5,000 | ) | 3.75 | |||||
| Outstanding, June 30, 2017 | 1,985,000 | 1.25 | ||||||
| Granted | - | - | ||||||
| Exercised | - | - | ||||||
| Expired/Cancelled | - | - | ||||||
| Outstanding, June 30, 2018 | 1,985,000 | $ | 1.25 | |||||
| Exercisable, June 30, 2017 | 1,985,000 | $ | 1.25 | |||||
| Exercisable, June 30, 2018 | 1,985,000 | $ | 1.25 | |||||
The intrinsic value for all warrants outstanding as of June 30, 2018 was $1,395,500, based on the fair value of the Company’s common stock on June 30, 2018.
Additional information regarding warrants outstanding and exercisable as of June 30, 2018 is as follows:
| Warrant Exercise Price | Warrants Outstanding | Remaining Contractual Life (in years) | Warrants Exercisable | |||||||||||
| $ | 1.19 | 100,000 | 3.48 | 100,000 | ||||||||||
| 1.25 | 1,885,000 | 2.95 | 1,885,000 | |||||||||||
| Total | 1,985,000 | 1,985,000 | ||||||||||||
Restricted Common Stock
Prior to July 1, 2016, the Company issued 1,303,687 shares of restricted common stock to employees valued at $1,286,474, of which $783,574 had been recognized as an expense. As of June 30, 2016, 706,642 of these shares with a grant date fair value of $502,629 had not yet vested.
During the year ended June 30, 2017, the Company issued 269,510 shares of restricted stock to employees. These shares vest over a three year period, with a one year cliff vesting period, and remain subject to forfeiture if vesting conditions are not met. The aggregate fair value of the stock awards was $276,600 based on the market price of our common stock ranging from $0.97 to $1.14 per share on the date of grant, which will be amortized over the three-year vesting period.
The total fair value of restricted common stock vested during the year ended June 30, 2017 was $366,291 and is included in selling, general and administrative expenses in the accompanying statements of operations. As of June 30, 2017, the amount of unvested compensation related to issuances of restricted common stock was $412,938, which will be recognized as an expense in future periods as the shares vest. When calculating basic net income (loss) per share, these shares are included in weighted average common shares outstanding from the time they vest. When calculating diluted net income per share, these shares are included in weighted average common shares outstanding as of their grant date.
During the year ended June 30, 2018, the Company issued an additional 423,107 shares of restricted stock to employees. These shares vest over a three year period, with a one year cliff vesting period, and remain subject to forfeiture if vesting conditions are not met. The aggregate fair value of the stock awards was $467,952 based on the market price of our common stock ranging from $1.02 to $1.59 per share on the date of grant, which will be amortized over the three-year vesting period.
The total fair value of restricted common stock vested during the year ended June 30, 2018 was $332,527 and is included in selling, general and administrative expenses in the accompanying statements of operations. As of June 30, 2018, the amount of unvested compensation related to issuances of restricted common stock was $360,160, which will be recognized as an expense in future periods as the shares vest. When calculating basic net income (loss) per share, these shares are included in weighted average common shares outstanding from the time they vest. When calculating diluted net income per share, these shares are included in weighted average common shares outstanding as of their grant date.
| 38 |
The following table summarizes restricted common stock activity:
Number of Shares | Fair Value | Weighted Average Grant Date Fair Value | ||||||||||
| Non-vested, June 30, 2016 | 706,642 | $ | 502,629 | $ | 0.82 | |||||||
| Granted | 269,510 | 276,600 | 1.03 | |||||||||
| Vested | (462,958 | ) | (366,291 | ) | 0.82 | |||||||
| Forfeited | - | - | - | |||||||||
| Non-vested, June 30, 2017 | 513,194 | 412,938 | 0.92 | |||||||||
| Granted | 423,107 | 467,952 | 1.11 | |||||||||
| Vested | (305,358 | ) | (332,527 | ) | 0.91 | |||||||
| Forfeited | (214,324 | ) | (188,203 | ) | 1.00 | |||||||
| Non-vested, June 30, 2018 | 416,619 | $ | 360,160 | $ | 1.08 | |||||||
Common Stock Repurchase and Retirement
On February 16, 2017, the Compensation Committee of our Board of Directors authorized the repurchase, over a 12-month period on the last day of each trading window and otherwise in accordance with our insider trading policies, of up to $300,000 of outstanding common stock (at prices no greater than $2.00 per share) from our employees to satisfy their tax obligations in connection with the vesting of stock incentive awards. The actual number of shares repurchased will be determined by applicable employees in their discretion, and will depend on their evaluation of market conditions and other factors.
On February 8, 2018, the Compensation Committee of our Board of Directors authorized the repurchase, over a 12-month period on the last day of each trading window and otherwise in accordance with our insider trading policies, of up to $300,000 of outstanding common stock (at prices no greater than $2.00 per share) from our employees to satisfy their tax obligations in connection with the vesting of stock incentive awards. The actual number of shares repurchased will be determined by applicable employees in their discretion, and will depend on their evaluation of market conditions and other factors.
During the years ended June 30, 2018 and 2017, we repurchased 120,900 and 195,958 shares of our common stock under the repurchase plan at an average price of approximately $1.26 and $1.02 per share, respectively, for an aggregate amount of $152,739 and $199,328, respectively. As of June 30, 2018, $250,216 remains under the current authorization to repurchase our outstanding common stock from our employees.
Shares repurchased are retired and deducted from common stock for par value and from additional paid in capital for the excess over par value. Direct costs incurred to acquire the shares are included in the total cost of the shares.
The following table summarizes repurchases of our common stock on a monthly basis:
| Period | Total Number of Shares Purchased1 | Average Price Paid per Share | Total Number of Shares Purchased as Part of Publicly Announced Plans or Programs | Approximate Dollar Value of Shares that May Yet Be Purchased Under the Plans or Programs | ||||||||||||
| September 2016 | 25,508 | $ | 1.04 | - | - | |||||||||||
| December 2016 | 54,200 | $ | 1.03 | - | - | |||||||||||
| March 2017 | 7,250 | $ | 1.10 | - | - | |||||||||||
| June 2017 | 109,000 | $ | 1.00 | - | - | |||||||||||
| Year ended June 30, 2017 | 195,958 | $ | 1.02 | - | - | |||||||||||
| September 2017 | 34,800 | $ | 1.14 | - | - | |||||||||||
| December 2017 | 52,300 | $ | 1.21 | - | - | |||||||||||
| March 2018 | 19,750 | $ | 1.29 | - | $ | 274,523 | ||||||||||
| June 2018 | 14,050 | $ | 1.73 | - | $ | 250,216 | ||||||||||
| Year ended June 30, 2018 | 120,900 | $ | 1.26 | - | $ | 250,216 | ||||||||||
1 Consists of shares of common stock purchased from employees to satisfy tax obligations in connection with the vesting of stock incentive awards.
| 39 |
| Note 8. | Contingencies and Commitments |
Legal Proceedings
The Company is involved in legal proceedings in the ordinary course of its business. Although management of the Company cannot predict the ultimate outcome of these legal proceedings with certainty, it believes that the ultimate resolution of the Company’s legal proceedings, including any amounts it may be required to pay, will not have a material effect on the Company’s consolidated financial statements.
| Note 9. | Income Taxes |
The provision for income taxes consists of the following for the years ended June 30, 2018 and 2017:
| Years Ended June 30, | ||||||||
| 2018 | 2017 | |||||||
| Current | ||||||||
| Federal | $ | - | $ | - | ||||
| State | 2,629 | 5,943 | ||||||
| Foreign (Mexico) | 37,150 | 29,552 | ||||||
| Deferred | ||||||||
| Federal | - | - | ||||||
| Foreign | - | - | ||||||
| State | - | - | ||||||
| Provision for income tax expense | $ | 39,779 | $ | 35,495 | ||||
During the year ended June 30, 2018, the Company recorded a provision for income tax expense of $39,779 which consisted of $2,629 in state income tax payments and $37,150 in foreign (Mexico) income tax payments. During the year ended June 30, 2017, the Company recorded a provision for income tax expense of $35,495 which consisted of $5,943 in state income tax payments and $29,552 in foreign (Mexico) income tax payments.
The reconciliation of the effective income tax rate to the federal statutory rate is as follows:
| Years Ended June 30, | ||||||||
| 2018 | 2017 | |||||||
| Federal income tax rate | 34.0 | % | 34.0 | % | ||||
| State tax, net of federal benefit | (5.0 | )% | (5.0 | )% | ||||
| Permanent differences | 2.8 | % | 1.6 | )% | ||||
| Effect of reversal of deferred tax liability | - | % | - | % | ||||
| Change in valuation allowance | (34.1 | )% | (32.2 | )% | ||||
| Other | - | % | - | % | ||||
| Effective income tax rate | (2.4 | )% | (1.6 | )% | ||||
Deferred income taxes reflect the net tax effects of temporary differences between the carrying amounts of assets and liabilities for financial statement purposes and the amounts used for income tax purposes. Significant components of the Company's deferred tax assets and liabilities at June 30, 2018 and 2017 are as follows:
June 30, 2018 | June 30, 2017 | |||||||
| Deferred tax assets: | ||||||||
| Federal net operating loss carryforward | $ | 1,657,440 | $ | 2,447,315 | ||||
| State net operating loss carryforward | 387,112 | 527,342 | ||||||
| Intangibles amortization | 156,196 | 244,620 | ||||||
| Stock based compensation | 1,177,731 | 1,638,123 | ||||||
| Other | 165,901 | 234,602 | ||||||
| Total deferred tax assets | 3,544,380 | 5,092,002 | ||||||
| Deferred tax liability: | ||||||||
| Intangible Assets | - | - | ||||||
| Fixed asset depreciation | 40,248 | 57,318 | ||||||
| Net deferred tax assets | 3,584,628 | 5,149,320 | ||||||
| Less valuation allowance | (3,584,628 | ) | (5,149,320 | ) | ||||
| $ | - | $ | - | |||||
| 40 |
The Company has provided a valuation allowance on the deferred tax assets at June 30, 2018 and 2017 to reduce such asset to zero, since there is no assurance that the Company will generate future taxable income to utilize such asset. Management will review this valuation allowance requirement periodically and make adjustments as warranted. The net change in the valuation allowance for the year ended June 30, 2018 was a decrease of $1,564,692.
At June 30, 2018 and 2017, the Company had federal net operating loss (“NOL”) carryforwards of approximately $11,010,000 and $11,619,000, respectively, and state NOL carryforwards of approximately $6,990,000 and $7,254,000, respectively. Federal NOLs could, if unused, completely expire in 2033. State NOLs, if unused, completely expire in 2038.
Effective January 1, 2007, the Company adopted FASB guidelines that address the determination of whether tax benefits claimed or expected to be claimed on a tax return should be recorded in the financial statements. Under this guidance, we may recognize the tax benefit from an uncertain tax position only if it is more likely than not that the tax position will be sustained on examination by the taxing authorities, based on the technical merits of the position. The tax benefits recognized in the financial statements from such a position should be measured based on the largest benefit that has a greater than fifty percent likelihood of being realized upon ultimate settlement. This guidance also provides guidance on derecognition, classification, interest and penalties on income taxes, accounting in interim periods and requires increased disclosures. At the date of adoption, and as of June 30, 2018 and 2017, the Company did not have a liability for unrecognized tax benefits, and no adjustment was required at adoption.
The Company’s policy is to record interest and penalties on uncertain tax provisions as income tax expense. As of June 30, 2018 and 2017, the Company has no accrued interest or penalties related to uncertain tax positions.
Company is subject to taxation in the United States and various states and Mexico. The Company is subject to United States federal or state income tax examinations by tax authorities for fiscal years after 2014.
| Note 10. | Gain from Sale of Discontinued Operations (Reprints and ePrints business line) |
On June 30, 2017, we sold the intangible assets of our Reprints and ePrints business line, but specifically excluding billed accounts receivable and respective liabilities, pursuant to an Asset Purchase Agreement dated June 20, 2017. The aggregate net consideration for the sale is comprised of $450,000 paid on the closing date, and earn-out payments of 45% of gross margin over the 30 month period subsequent to the closing date. We have made a policy election to record the contingent consideration when the consideration is determined to be realizable (each 6-month period ending subsequent to the closing date), which amounted to $256,995 for the year ended June 30, 2018.
The gain from sale of discontinued operations for the year ended June 30, 2017 consists of the following:
| Description | Amount | |||
| Net cash paid on the closing date | $ | 450,000 | ||
| Less: | ||||
| Stock compensation - issuance of stock options | (111,374 | ) | ||
| Stock compensation - modification of stock options | (82,430 | ) | ||
| Legal fees | (15,000 | ) | ||
| Total | $ | 241,196 | ||
The current assets and liabilities related to the Reprints and ePrints business line were $1,281,598 and $1,806,901 as of June 30, 2017. In addition, revenue and expenses from discontinued operations were as follows:
Year Ended June 30, 2017 | ||||
| Revenue | $ | 7,936,379 | ||
| Cost of revenue | 7,362,934 | |||
| Income from discontinued operations | $ | 573,445 | ||
| Note 11. | Subsequent Events |
Stock Options
On July 3, 2018, the Company granted 295,000 options to employees with a fair value of $324,500. The options vest over a three-year period, and have a term of ten years.
Warrants
On August 13, 2018, the Company granted 39,000 shares of common stock upon the exercise of 100,000 warrants on a cashless basis.
| 41 |
Restricted Common Stock
On August 9, 2018, the Company issued 130,127 shares of restricted stock to employees. These shares vest over a three year period, with a one year cliff vesting period, and remain subject to forfeiture if vesting conditions are not met. The aggregate value of the stock award was $258,953 based on the market price of our common stock of $1.99 per share on the date of grant, which will be amortized over the three-year vesting period.
Item 9. Changes in and Disagreements With Accountants on Accounting and Financial Disclosure
There were no changes in or disagreements with our accountants on accounting and financial disclosure during the last two fiscal years.
Item 9A. Controls and Procedures
Evaluation of Disclosure Controls and Procedures
Our management, with the participation of our Chief Executive Officer and Chief Financial Officer, evaluated the effectiveness of our disclosure controls and procedures as of the end of the period covered by this Annual Report on Form 10-K. For purposes of this section, the term disclosure controls and procedures means controls and other procedures of an issuer that are designed to ensure that information required to be disclosed by the issuer in the reports that it files or submits under the Securities Exchange Act of 1934, as amended (the “Exchange Act”), is recorded, processed, summarized and reported within the time periods specified in the SEC’s rules and forms. Disclosure controls and procedures include, without limitation, controls and procedures designed to ensure that information required to be disclosed by an issuer in the reports that it files or submits under the Exchange Act is accumulated and communicated to the issuer's management, including its principal executive and principal financial officers, or persons performing similar functions, as appropriate to allow timely decisions regarding required disclosure.
Based upon that evaluation, our Chief Executive Officer and Chief Financial Officer have concluded that, as of June 30, 2018, the end of the period covered by this report, our disclosure controls and procedures were effective at a reasonable assurance level.
Management’s Report on Internal Control over Financial Reporting
Our management is responsible for establishing and maintaining adequate internal control over financial reporting. Internal control over financial reporting is defined in Rule 13a-15(f) or 15d-15(f) promulgated under the Exchange Act as a process designed by, or under the supervision of, the company's principal executive and principal financial officers and effected by the company's board of directors, management and other personnel, to provide reasonable assurance regarding the reliability of financial reporting and the preparation of financial statements for external purposes in accordance with accounting principles generally accepted in the United States of America and includes those policies and procedures that:
| (i) | Pertain to the maintenance of records that in reasonable detail accurately and fairly reflect the transactions and dispositions of the assets of the company; |
| (ii) | Provide reasonable assurance that transactions are recorded as necessary to permit preparation of financial statements in accordance with accounting principles generally accepted in the United States of America and that receipts and expenditures of the company are being made only in accordance with authorizations of management and directors of the company; and |
| (iii) | Provide reasonable assurance regarding prevention or timely detection of unauthorized acquisition, use or disposition of the company's assets that could have a material effect on the financial statements. |
Because of its inherent limitations, internal control over financial reporting may not prevent or detect misstatements. Projections of any evaluation of effectiveness to future periods are subject to the risk that controls may become inadequate because of changes in conditions, or that the degree of compliance with the policies or procedures may deteriorate. All internal control systems, no matter how well designed, have inherent limitations. Therefore, even those systems determined to be effective can provide only reasonable assurance with respect to financial statement preparation and presentation. Because of the inherent limitations of internal control, there is a risk that material misstatements may not be prevented or detected on a timely basis by internal control over financial reporting. However, these inherent limitations are known features of the financial reporting process. Therefore, it is possible to design into the process safeguards to reduce, though not eliminate, this risk.
Management evaluated the effectiveness of our internal control over financial reporting as of June 30, 2018, using the framework set forth in the report of the Treadway Commission’s Committee of Sponsoring Organizations (“COSO”), “2013 Internal Control - Integrated Framework.” Based upon that evaluation, management believes our internal control over financial reporting was effective as of June 30, 2018.
Inherent Limitations on the Effectiveness of Controls
Management does not expect that our disclosure controls and procedures or our internal control over financial reporting will prevent or detect all errors and all fraud. A control system, no matter how well conceived and operated, can provide only reasonable, not absolute, assurance that the objectives of the control systems are met. Further, the design of a control system must reflect the fact that there are resource constraints, and the benefits of controls must be considered relative to their costs. Because of the inherent limitations in a cost-effective control system, no evaluation of internal control over financial reporting can provide absolute assurance that misstatements due to error or fraud will not occur or that all control issues and instances of fraud, if any, have been or will be detected.
| 42 |
These inherent limitations include the realities that judgments in decision-making can be faulty and that breakdowns can occur because of a simple error or mistake. Controls can also be circumvented by the individual acts of some persons, by collusion of two or more people, or by management override of the controls. The design of any system of controls is based in part on certain assumptions about the likelihood of future events, and there can be no assurance that any design will succeed in achieving its stated goals under all potential future conditions. Projections of any evaluation of controls effectiveness to future periods are subject to risks. Over time, controls may become inadequate because of changes in conditions or deterioration in the degree of compliance with policies or procedures.
Changes in Internal Controls Over Financial Reporting
Management has evaluated, with the participation of our Chief Executive Officer and Chief Financial Officer, whether any changes in our internal control over financial reporting that occurred during our last fiscal year have materially affected, or are reasonably likely to materially affect, our internal control over financial reporting. Based on the evaluation we conducted, management has concluded that no such changes have occurred.
None.
| 43 |
Item 10. Directors, Executive Officers and Corporate Governance
The following table sets forth the name, age, position, and date of appointment of each of our directors and executive officers as of September 14, 2018:
| Name | Age | Position | Date of Appointment | |||
| Peter Victor Derycz | 56 | Chief Executive Officer, President and Director | January 6, 2006 | |||
| Alan Louis Urban | 49 | Chief Financial Officer and Secretary | November 3, 2011 | |||
| Scott Ahlberg | 55 | Chief Operating Officer | July 1, 2007 | |||
| Marc Nissan | 42 | Chief Technology Officer | July 1, 2007 | |||
| Rogier van Erkel | 43 | Chief Sales Officer | July 2, 2018 | |||
| Yohann Georgel | 32 | Chief Marketing Officer | June 11, 2018 | |||
| John Regazzi (1)(3) | 70 | Chairman of the Board | June 22, 2015 | |||
| Gen. Merrill McPeak (1)(2) | 82 | Director | November 5, 2010 | |||
| Chad J. Cooper (1)(4) | 48 | Director | March 31, 2016 | |||
| Roy W. Olivier (1) | 59 | Director | January 9, 2018 |
| (1) | Member of Audit Committee, Compensation Committee, and Nominating and Governance Committee |
| (2) | Chairman of the Compensation Committee |
| (3) | Chairman of the Audit Committee |
| (4) | Chairman of the Nominating and Governance Committee |
Peter Victor Derycz – Chief Executive Officer and President, Director
Mr. Derycz founded Reprints Desk and has served as its Chief Executive Officer and President since January 6, 2006. Mr. Derycz also served as Chairman of the Board from January 6, 2006 through August 19, 2015. Mr. Derycz was a founder of Infotrieve, Inc. in 1989 and served as its President from February 2003 until September 2003. He served as the Chief Executive Officer of Puerto Luperon, Ltd. (Bahamas), a real estate development company, from January 2004 until December 2005. He currently serves on the Internation Advisory Board of the San Jose State University School of Information, and served as a member of the board of directors of Insignia Systems, Inc. (NASDAQ:ISIG), a consumer products advertising company from 2006 to 2014. Mr. Derycz received a B.A. in Psychology from the University of California at Los Angeles. Our board of directors believes that Mr. Derycz’ familiarity with our day-to-day operations, his strategic vision for our business and his past leadership and management experience make him uniquely qualified to serve as a director.
Alan Louis Urban – Chief Financial Officer and Secretary
Mr. Urban joined Research Solutions in 2011 and has over 25 years of experience in corporate finance and accounting. Mr. Urban has previously served in numerous senior management positions, including: Vice President of Finance and Treasurer for Infotrieve from 2000 to 2004; Chief Financial Officer of a leading online poker company from 2005 to 2006; and Chief Financial Officer of ReachLocal (NASDAQ:RLOC) from 2007 to 2009, an internet marketing company that ranked #1 on Deloitte’s Tech Fast 500 List. Mr. Urban has also held positions as an audit and tax manager in public accounting, and as an internal auditor. He holds a B.S. in Business, with a concentration in Accounting Theory and Practice, from California State University, Northridge and has been a Certified Public Accountant (currently inactive) since 1998.
Scott Ahlberg – Chief Operating Officer
Mr. Ahlberg has effectively served as the Chief Operating Officer since July 1, 2007, and has many years of experience in content and startup businesses. Mr. Ahlberg started with Dynamic Information (EbscoDoc) in the 1980s, then went on to lead Sales and Marketing at Infotrieve, Inc. After leaving Infotrieve in 2005 Mr. Ahlberg provided consulting services to ventures in professional networking and medical podcasting. He joined Reprints Desk in 2006. His areas of expertise include strategic planning, operational innovation, copyright and content licensing, and quality management. Mr. Ahlberg has degrees from Stanford University (B.A., 1984) and the University of London (M.A., 1990).
Marc Nissan –Chief Technology Officer
Mr. Nissan has 15 years of experience in systems architecture and technology build-out. Mr. Nissan is an experienced software developer with strong hands-on management and interpersonal skills. Mr. Nissan has performed full implementation and integration of custom software solutions for clients, including interviewing users, gathering requirements, analysis, design, and documentation. During the past 15 years, Mr. Nissan has held various technology architecture positions at Infotrieve, Ultralink, and MPDN.
Rogier van Erkel – Chief Sales Officer
Mr. van Erkel has 12 years of sales management experience at Elsevier, an information and analytics company, and one of the world's major providers of scientific, technical and medical information. In his most recent role, he served as sales director, leading a global team and agent network. He managed a diverse sales portfolio consisting of four product groups selling to businesses all over the world. In that role, he specialized in information products, input for discovery tools and solutions to optimize and maximize customer workflow. He also served in other senior sales roles in Elsevier and before that, managed sales and operations teams for five years at Renewi (formerly Van Gansewinkel), a leading waste management company operating across Europe. Mr. van Erkel earned his Master’s degree from the University of Amsterdam and his Bachelor of Arts in Business Economics from Hanze University of Applied Sciences Groningen. For charity, Mr. van Erkel coaches start-ups to improve their sales through his involvement in incubator firms Rockstart and ACE.
Yohann Georgel – Chief Marketing Officer
Mr. Georgel has 12 years of marketing experience, most recently serving as senior director of digital marketing for PrimeSport for over six years. PrimeSport is the leader in providing direct access to the biggest sporting events on the planet, offering tickets, travel and hospitality. Prior to that, he was a director of digital marketing for OleOle, a social media platform for soccer fans worldwide. While there, he was in charge of marketing in 10 different languages. Mr. Georgel's passion for data and algorithms led him to pursue a career in digital marketing, specifically search engine optimization and marketing. Other areas of his expertise include data analysis, social media and user experience.
| 44 |
John Regazzi – Chairman of the Board
Mr. Regazzi was appointed to our board of directors on June 22, 2015 and was appointed Chairman of the Board effective August 20, 2015. Mr. Regazzi is an information services and IT industry innovator, with more than four decades of experience. He is currently managing director of Akoya Capital Partners, a sector-focused private investment firm, where for the last few years he has served as its professional information services sector leader. He has also been a professor at the Long Island University’s College of Education, Information and Technology since 2005, and has served as dean of LIU’s College of Information and Computer Science. Before joining Akoya Capital Partners, Mr. Regazzi served for several years as CEO of Elsevier Inc. and managing director of the NYSE-listed Reed Elsevier, the world’s largest publisher and information services company for journal and related scientific, technical and medical content. At Reed Elsevier, he oversaw its expansive electronic publishing portfolio, with a program staff of 3,000 and revenues exceeding $1 billion. He was previously CEO of Engineering Information, which he helped turn around before being acquired by Reed Elsevier. As a recognized industry thought leader, Mr. Regazzi has designed, launched, and managed some of the most innovative and well-known information services in the professional communities, including the Engineering Village, Science Direct, Scirus and Scopus, as well as numerous other electronic information services dating back to the early days of the online and CD-ROM industries. Mr. Regazzi has served on a variety of corporate and industry boards, including the British Standards Institute Group and the American Institute of Physics, and he recently was appointed and serves as chairman of the board of National Technical Information Service, a division of the U.S. Department of Commerce. He currently serves as chairman of DiSTI and Inflexxion, both Akoya portfolio companies, and as a member of the board of managers and Treasurer of AIP Publishing. Mr. Regazzi earned his B.S. from St. Johns University, M.A. from University of Iowa, M.S. from Columbia University, and Ph.D. in Information Science from Rutgers University. Our board of directors concluded that Mr. Regazzi should serve as a director in light of his extensive experience in the information services industry.
General Merrill McPeak – Director
Gen. McPeak was appointed to our Board of directors on November 5, 2010. He is President of McPeak and Associates, a company he founded in 1995. From 1990 until his retirement from active military service in late-1994, he was chief of staff of the U.S. Air Force. During this period, he was the senior officer responsible for organization, training and equipage of a combined active duty, National Guard, Reserve and civilian work force of over 850,000 people serving at 1,300 locations in the United States and abroad. As a member of the Joint Chiefs of Staff, he and the other service chiefs were military advisors to the Secretary of Defense and the President. Gen. McPeak has served on the board of directors of several publicly traded companies, including long service with Trans World Airlines, Inc. and with the test and measurement company, Tektronix, Inc. He was for many years Chairman of the Board of ECC International Corp., until that company was acquired by Cubic Corporation. Currently, Gen. McPeak is a director of Aerojet Rocketdyne (NYSE: AJRD), Lilis Energy (NASDAQ: LLEX) and Lion Biotechnologies, Inc. (NASDAQ: LBIO). He is a director of Valence Surface Technologies, the country’s largest privately held provider of metal processing and finishing services. General McPeak was a founding investor, director and chairman of Ethicspoint, Inc., a software-as-a-service provider of secure, confidential employee reporting systems, that was acquired by private equity at a return making it one of Oregon’s most successful business startups in decades. Our board of directors concluded that Gen. McPeak should serve as a director in light of his demonstrated leadership abilities and years of experience serving on the boards of directors of numerous publicly traded corporations.
Chad J. Cooper – Director
Mr. Cooper has more than 15 years of experience in the financial markets. He has served in various capacities, including investment management, investment banking and capital markets. Mr. Cooper served as a Board member at ARI Networks (NASDAQ: ARIS) from 2014 to 2017, until True Wind Capital Management took the company private in August 2017. Mr. Cooper currently serves on the Board of YouMail, Inc., and Wings for Crossover, a 501(c)3 non-profit organization. Mr. Cooper has a B.A. in International Relations from the University of Southern California and M.B.A. from Georgetown University. In light of Mr. Cooper's financial and executive experience, our board of directors believes it to be in the Company's best interests that Mr. Cooper serve as a director.
Roy W. Olivier – Director
Mr. Olivier currently serves as president and CEO of ARI Network Services (formerly NASDAQ: ARIS), a provider of an award-winning suite of SaaS tools and marketing services. Before joining ARI in 2006, Mr. Olivier was a consultant to start-up and small and medium-sized businesses. Prior to that, he served as VP of sales and marketing for ProQuest Media Solutions, a business he founded in 1993 and sold to ProQuest in 2000. He previously held various executive and managerial positions with other companies in the telecommunications and computer industries, including Multicom Publishing, Tandy Corporation, BusinessLand and PacTel. In light of Mr. Olivier's executive and operational experience, our board of directors believes it to be in the Company's best interests that Mr. Olivier serve as a director.
Term of Office and Family Relationships
Each director serves until our next annual meeting or until his or her successor is duly elected and qualified. Each executive officer is elected by our board of directors and serves at its discretion.
Section 16(a) Beneficial Ownership Reporting Compliance
Section 16(a) of the Exchange Act requires our officers, directors, and persons who own more than ten percent of a registered class of our equity securities to file reports of ownership and changes in ownership with the SEC and to furnish the Company with copies of all Section 16(a) forms they file. Our review of copies of the Section 16(a) reports filed during the fiscal year ended June 30, 2018 indicates that all filing requirements applicable to our officers, directors, and greater than ten percent beneficial owners were complied with, except that 12 West Capital Management LP failed to timely file a Form 3, and a Form 4 reporting one transaction, Ms. Peterson failed to timely file a Form 4 reporting one transaction, and each of Messrs. Ahlberg, Cooper, Derycz, McPeak, Palmer, Regazzi, and Urban failed to timely file a Form 4 reporting one transaction.
| 45 |
Audit Committee Financial Expert
Our board of directors has a separately designated standing Audit Committee, comprised of Messrs. Cooper (Chairman), Regazzi, McPeak and Olivier, each of whom our board of directors has determined to be an independent director as that term is defined in the applicable rules for companies traded on the NASDAQ Stock Market. Our board of directors has determined that Mr. Regazzi qualifies as an “audit committee financial expert” as defined under SEC rules.
Code of Ethics
Our board of directors has adopted a Code of Ethical Conduct that applies to all of our employees, officers and directors, including our Chief Executive Officer, Chief Financial Officer and other executive and senior financial officers. The code is available in the Corporate Governance – Code of Ethical Conduct section of our website, www.researchsolutions.com.
Item 11. Executive Compensation
Compensation of Executive Officers
The following table summarizes all compensation for the last two fiscal years awarded to, earned by, or paid to our Chief Executive Officer (principal executive officer) and our two most highly compensated executive officers other than our CEO who were serving as executive officers at the end of our last completed fiscal year, whose total compensation exceeded $100,000 during such fiscal year ends.
Compensation of Executive Officers for Fiscal Years Ended June 30, 2018 and 2017
Name and principle Position | Fiscal Year | Salary ($) | Bonus ($) | Stock awards ($) | Option awards ($) | All other compensation ($) | Total ($) | |||||||||||||||||||
| Peter Victor Derycz | 2018 | 340,000 | 119,367 | 108,910 | (1) | - | 12,474 | 580,751 | ||||||||||||||||||
| Chief Executive Officer and President | 2017 | 330,095 | 96,327 | 54,997 | (2) | - | 15,817 | 497,236 | ||||||||||||||||||
| Alan Louis Urban | 2018 | 250,000 | 88,545 | 82,281 | (3) | - | 14,523 | 435,349 | ||||||||||||||||||
| Chief Financial Officer and Secretary | 2017 | 240,700 | 73,210 | 41,249 | (4) | - | 14,061 | 369,220 | ||||||||||||||||||
| Scott Ahlberg | 2018 | 220,000 | 88,545 | 77,186 | (5) | 30,750 | (7) | 14,768 | 431,249 | |||||||||||||||||
| Chief Operating Officer | 2017 | 213,125 | 73,210 | 46,368 | (6) | - | 14,168 | 346,871 | ||||||||||||||||||
| (1) | Represents the grant date fair value of 62,487 shares of restricted stock granted on August 22, 2017, 10,975 shares of restricted stock granted on November 21, 2017, 12,185 shares of restricted stock granted on February 8, 2018, and 11,315 shares of restricted stock granted on May 10, 2018. The grant date fair value was estimated using the market price of our common stock at the date of grant. The restricted stock vests over a three-year period, with a one year cliff vesting period, and remains subject to forfeiture if vesting conditions are not met. |
| (2) | Represents the grant date fair value of 21,818 shares of restricted stock granted on August 23, 2016, 6,666 shares of restricted stock granted on November 21, 2016, 11,305 shares of restricted stock granted on February 16, 2017, and 13,947 shares of restricted stock granted on May 11, 2017. The grant date fair value was estimated using the market price of our common stock at the date of grant. The restricted stock vests over a three-year period, with a one year cliff vesting period, and remains subject to forfeiture if vesting conditions are not met. |
| (3) | Represents the grant date fair value of 47,829 shares of restricted stock granted on August 22, 2017, 8,136 shares of restricted stock granted on November 21, 2017, 9,030 shares of restricted stock granted on February 8, 2018, and 8,395 shares of restricted stock granted on May 10, 2018. The grant date fair value was estimated using the market price of our common stock at the date of grant. The restricted stock vests over a three-year period, with a one year cliff vesting period, and remains subject to forfeiture if vesting conditions are not met. |
| (4) | Represents the grant date fair value of 16,364 shares of restricted stock granted on August 23, 2016, 5,000 shares of restricted stock granted on November 21, 2016, 8,479 shares of restricted stock granted on February 16, 2017, and 10,460 shares of restricted stock granted on May 11, 2017. The grant date fair value was estimated using the market price of our common stock at the date of grant. The restricted stock vests over a three-year period, with a one year cliff vesting period, and remains subject to forfeiture if vesting conditions are not met. |
| (5) | Represents the grant date fair value of 42,834 shares of restricted stock granted on August 22, 2017, 8,136 shares of restricted stock granted on November 21, 2017, 9,030 shares of restricted stock granted on February 8, 2018, and 8,395 shares of restricted stock granted on May 10, 2018. The grant date fair value was estimated using the market price of our common stock at the date of grant. The restricted stock vests over a three-year period, with a one year cliff vesting period, and remains subject to forfeiture if vesting conditions are not met. |
| 46 |
| (6) | Represents the grant date fair value of 16,364 shares of restricted stock granted on August 23, 2016, 8,333 shares of restricted stock granted on November 21, 2016, 9,903 shares of restricted stock granted on February 16, 2017, and 10,456 shares of restricted stock granted on May 11, 2017. The grant date fair value was estimated using the market price of our common stock at the date of grant. The restricted stock vests over a three-year period, with a one year cliff vesting period, and remains subject to forfeiture if vesting conditions are not met. |
| (7) | Represents the grant date fair value of options granted on September 30, 2017 to purchase 75,000 shares of common stock at an exercise price of $1.50. The grant date fair value was estimated using the Black-Scholes option pricing model with the following weighted-average assumptions: risk-free interest rate of 1.45%; volatility of 76%; expected term of 2.6 years; and no dividend yield. The stock options vest over a three year period, with a one year cliff vesting period, and expire on December 21, 2022. |
Employment Agreements
Peter Victor Derycz
On July 1, 2010, we entered into an executive employment agreement with Mr. Derycz which was subsequently amended on June 30, 2017. Under the terms of the executive employment agreement, Mr. Derycz has agreed to serve as our Chief Executive Officer and President on an at-will basis. The term of the agreement ends on June 30, 2019. The agreement provides for a base salary of $340,000 per year. No part of Mr. Derycz’s salary is allocated to his duties as a director of our company.
The agreement contains provisions that prohibit Mr. Derycz from soliciting our customers or employees during his employment with us and for one year afterward. The agreement also contains provisions that restrict disclosure by Mr. Derycz of our confidential information and assign ownership to us of inventions related to our business that are created by him during his employment. We may terminate the agreement at any time, with or without cause. Mr. Derycz will be eligible to receive an amount equal to three (3) months of his then-current base salary payable in the form of salary continuation if he is terminated without cause. Mr. Derycz may terminate the agreement at any time, with or without reason, upon four weeks’ advance written notice.
Alan Louis Urban
On November 3, 2011, we entered into an executive employment agreement with Mr. Urban which was subsequently amended on June 30, 2017. Under the terms of the executive employment agreement, Mr. Urban has agreed to serve as our Chief Financial Officer on an at-will basis. The term of the agreement ends on June 30, 2019. The agreement provides for a base salary of $250,000 per year.
The agreement contains provisions that prohibit Mr. Urban from soliciting our customers or employees during his employment with us and for one year afterward. The agreement also contains provisions that restrict disclosure by Mr. Urban of our confidential information and assign ownership to us of inventions related to our business that are created by him during his employment. We may terminate the agreement at any time, with or without cause. Mr. Urban will be eligible to receive an amount equal to three (3) months of his then-current base salary payable in the form of salary continuation if he is terminated without cause. Mr. Urban may terminate the agreement at any time, with or without reason, upon four weeks’ advance written notice.
Scott Ahlberg
On July 1, 2010, we entered into an executive employment agreement with Mr. Ahlberg which was subsequently amended on June 30, 2017. Under the terms of the executive employment agreement, Mr. Ahlberg has agreed to serve as Chief Operating Officer on an at-will basis. The term of the agreement ends on June 30, 2019. The agreement provides for a base salary of $220,000 per year.
The agreement contains provisions that prohibit Mr. Ahlberg from soliciting our customers or employees during his employment with us and for one year afterward. The agreement also contains provisions that restrict disclosure by Mr. Ahlberg of our confidential information and assign ownership to us of inventions related to our business that are created by him during his employment. We may terminate the agreement at any time, with or without cause. Mr. Ahlberg will be eligible to receive an amount equal to three (3) months of his then-current base salary payable in the form of salary continuation if he is terminated without cause. Mr. Ahlberg may terminate the agreement at any time, with or without reason, upon four weeks’ advance written notice.
Marc Nissan
On July 1, 2013, we entered into an executive employment agreement with Mr. Nissan which was subsequently amended on June 30, 2017. Under the terms of the executive employment agreement, Mr. Nissan has agreed to serve as Chief Technology Officer on an at-will basis. The term of the agreement ends on June 30, 2019. The agreement provides for a base salary of $225,000 per year.
The agreement contains provisions that prohibit Mr. Nissan from soliciting our customers or employees during his employment with us and for one year afterward. The agreement also contains provisions that restrict disclosure by Mr. Nissan of our confidential information and assign ownership to us of inventions related to our business that are created by him during his employment. We may terminate the agreement at any time, with or without cause. Mr. Nissan will be eligible to receive an amount equal to three (3) months of his then-current base salary payable in the form of salary continuation if he is terminated without cause. Mr. Nissan may terminate the agreement at any time, with or without reason, upon four weeks’ advance written notice.
| 47 |
Rogier van Erkel
On May 18, 2018, we entered into a consulting agreement with Mr. van Erkel. Under the terms of the consulting agreement, Mr. van Erkel has agreed to serve as our Chief Sales Officer. The term of the agreement ends on July 2, 2021. The agreement provides for total compensation of approximately $250,000 per year assuming certain performance targets are attained.
The agreement contains provisions that prohibit Mr. van Erkel from soliciting our customers or employees during his service with us. The agreement also contains provisions that restrict disclosure by Mr. van Erkel of our confidential information and assign ownership to us of inventions related to our business that are created by him during his service with us. After the first year we may terminate the agreement at any time, with or without cause. Mr. van Erkel will be eligible to receive an amount equal to three (3) months of his then-current base salary payable in the form of salary continuation if he is terminated without cause. After the first year Mr. van Erkel may terminate the agreement at any time, with or without reason, upon 60 days notice.
Yohann Georgel
On June 11, 2018, Mr. Georgel was hired and agreed to serve as our Chief Marketing Officer. Mr. Georgel’s employment offer provides for total compensation of approximately $220,000 per year assuming certain performance targets are attained.
Mr. Georgel has agreed to not solicit our customers or employees during his employment with us and for one year afterward. He has also agreed to not disclose our confidential information and assign ownership to us of inventions related to our business that are created by him during his employment. We may terminate his employment at any time, with or without cause. Mr. Georgel may terminate his employment at any time, with or without reason.
Outstanding Equity Awards at Fiscal Year Ended June 30, 2018
The following table sets forth information regarding stock options, warrants and other stock awards (restricted stock) for each named executive officer as of June 30, 2018.
Outstanding Equity Awards at Fiscal Year Ended June 30, 2018
| Name | Number of securities underlying unexercised options/warrants exercisable (#) | Number of securities underlying unexercised options/warrants unexercisable (#) | Option/ Warrant exercise price ($) | Option/ Warrant expiration date (1) | Stock Awards: Number of shares
of stock | Stock
Awards: shares of stock that have not vested ($) | ||||||||||||||||||
| Peter Victor Derycz | 32,000 | - | $ | 1.25 | 2/13/2023 | - | - | |||||||||||||||||
| 16,000 | - | $ | 1.85 | 5/20/2023 | - | - | ||||||||||||||||||
| 6,000 | - | $ | 1.25 | 6/23/2021 | - | - | ||||||||||||||||||
| - | - | - | - | 1,429 | (2) | $ | 857 | (3) | ||||||||||||||||
| - | - | - | - | 4,793 | (4) | $ | 2,828 | (5) | ||||||||||||||||
| - | - | - | - | 2,333 | (6) | $ | 2,543 | (7) | ||||||||||||||||
| - | - | - | - | 7,273 | (8) | $ | 7,054 | (9) | ||||||||||||||||
| - | - | - | - | 2,778 | (10) | $ | 2,916 | (11) | ||||||||||||||||
| - | - | - | - | 5,653 | (12) | $ | 6,444 | (13) | ||||||||||||||||
| - | - | - | - | 8,136 | (14) | $ | 8,136 | (15) | ||||||||||||||||
| - | - | - | - | 62,487 | (16) | $ | 63,737 | (17) | ||||||||||||||||
| - | - | - | - | 10,975 | (18) | $ | 13,170 | (19) | ||||||||||||||||
| - | - | - | - | 12,185 | (20) | $ | 14,013 | (21) | ||||||||||||||||
| - | - | - | - | 11,315 | (22) | $ | 17,991 | (23) | ||||||||||||||||
| Alan Louis Urban | 100,000 | - | $ | 1.02 | 7/27/2020 | - | - | |||||||||||||||||
| 125,000 | - | $ | 1.30 | 3/5/2022 | - | - | ||||||||||||||||||
| 24,000 | - | $ | 1.15 | 2/6/2023 | - | - | ||||||||||||||||||
| 1,800 | - | $ | 1.25 | 6/23/2021 | - | - | ||||||||||||||||||
| - | - | - | - | 1,071 | (2) | $ | 643 | (3) | ||||||||||||||||
| - | - | - | - | 3,595 | (4) | $ | 2,121 | (5) | ||||||||||||||||
| - | - | - | - | 1,750 | (6) | $ | 1,908 | (7) | ||||||||||||||||
| - | - | - | - | 5,455 | (8) | $ | 5,291 | (9) | ||||||||||||||||
| - | - | - | - | 2,083 | (10) | $ | 2,188 | (11) | ||||||||||||||||
| - | - | - | - | 4,240 | (12) | $ | 4,833 | (13) | ||||||||||||||||
| - | - | - | - | 6,102 | (14) | $ | 6,102 | (15) | ||||||||||||||||
| - | - | - | - | 47,829 | (16) | $ | 48,786 | (17) | ||||||||||||||||
| - | - | - | - | 8,136 | (18) | $ | 9,763 | (19) | ||||||||||||||||
| - | - | - | - | 9,030 | (20) | $ | 10,385 | (21) | ||||||||||||||||
| - | - | - | - | 8,395 | (22) | $ | 13,348 | (23) | ||||||||||||||||
| Scott Ahlberg | 75,000 | - | $ | 1.00 | 5/28/2019 | - | - | |||||||||||||||||
| 20,000 | - | $ | 1.02 | 7/27/2020 | - | - | ||||||||||||||||||
| 25,600 | - | $ | 1.15 | 2/6/2023 | - | - | ||||||||||||||||||
| 1,500 | - | $ | 1.25 | 6/23/2021 | - | - | ||||||||||||||||||
| 75,000 | - | $ | 1.50 | 12/21/2022 | - | - | ||||||||||||||||||
| - | - | - | - | 1,071 | (2) | $ | 643 | (3) | ||||||||||||||||
| - | - | - | - | 3,595 | (4) | $ | 2,121 | (5) | ||||||||||||||||
| - | - | - | - | 1,750 | (6) | $ | 1,908 | (7) | ||||||||||||||||
| - | - | - | - | 5,455 | (8) | $ | 5,291 | (9) | ||||||||||||||||
| - | - | - | - | 3,472 | (10) | $ | 3,646 | (11) | ||||||||||||||||
| - | - | - | - | 4,952 | (12) | $ | 5,645 | (13) | ||||||||||||||||
| - | - | - | - | 6,099 | (14) | $ | 6,099 | (15) | ||||||||||||||||
| - | - | - | - | 42,834 | (16) | $ | 43,691 | (17) | ||||||||||||||||
| - | - | - | - | 8,136 | (18) | $ | 9,763 | (19) | ||||||||||||||||
| - | - | - | - | 9,030 | (20) | $ | 10,385 | (21) | ||||||||||||||||
| - | - | - | - | 8,395 | (22) | $ | 13,348 | (23) | ||||||||||||||||
| 48 |
| (1) | Stock options expire ten years from the grant date. | |
| (2) | The restricted stock was granted on February 8, 2016 and vest over a three year period, with a one year cliff vesting period. | |
| (3) | Based on a market closing price per share of common stock of $0.60 on February 8, 2016. | |
| (4) | The restricted stock was granted on February 25, 2016 and vest over a three year period, with a one year cliff vesting period. | |
| (5) | Based on a market closing price per share of common stock of $0.59 on February 25, 2016. | |
| (6) | The restricted stock was granted on May 24, 2016 and vest over a three year period, with a one year cliff vesting period. | |
| (7) | Based on a market closing price per share of common stock of $1.09 on May 24, 2016. | |
| (8) | The restricted stock was granted on August 23, 2016 and vest over a three year period, with a one year cliff vesting period. | |
| (9) | Based on a market closing price per share of common stock of $0.97 on August 23, 2016. | |
| (10) | The restricted stock was granted on November 21, 2016 and vest over a three year period, with a one year cliff vesting period. | |
| (11) | Based on a market closing price per share of common stock of $1.05 on November 21, 2016. | |
| (12) | The restricted stock was granted on February 16, 2017 and vest over a three year period, with a one year cliff vesting period. | |
| (13) | Based on a market closing price per share of common stock of $1.14 on February 16, 2017. | |
| (14) | The restricted stock was granted on May 11, 2017 and vest over a three year period, with a one year cliff vesting period. | |
| (15) | Based on a market closing price per share of common stock of $1.00 on May 11, 2017. | |
| (16) | The restricted stock was granted on August 22, 2017 and vest over a three year period, with a one year cliff vesting period. | |
| (17) | Based on a market closing price per share of common stock of $1.02 on August 22, 2017. | |
| (18) | The restricted stock was granted on November 21, 2017 and vest over a three year period, with a one year cliff vesting period. | |
| (19) | Based on a market closing price per share of common stock of $1.20 on November 21, 2017. | |
| (20) | The restricted stock was granted on February 8, 2018 and vest over a three year period, with a one year cliff vesting period. | |
| (21) | Based on a market closing price per share of common stock of $1.15 on February 8, 2018. | |
| (22) | The restricted stock was granted on May 10, 2018 and vest over a three year period, with a one year cliff vesting period. | |
| (23) | Based on a market closing price per share of common stock of $1.59 on May 10, 2018. |
Compensation of Directors
The following table sets forth compensation awarded or paid to our directors for the last fiscal year for the services rendered by them to the Company in all capacities.
Director Compensation for the Fiscal Years Ended June 30, 2018 and 2017
| Name | Fiscal Year | Fees earned or paid in cash ($) | Stock awards ($) | Warrant and Option Awards ($) | All other Compensation ($) | Total ($) | ||||||||||||||||
| (a) | (b) | (c) | (d) | (g) | (h) | |||||||||||||||||
| John Regazzi (3) | 2018 | 36,000 | - | 100,500 | - | 136,500 | ||||||||||||||||
| 2017 | 27,000 | - | 90,000 | - | 117,000 | |||||||||||||||||
| Gen. Merrill McPeak (4) | 2018 | 18,000 | - | 50,250 | - | 68,250 | ||||||||||||||||
| 2017 | 13,500 | - | 45,000 | - | 58,500 | |||||||||||||||||
| Chad J. Cooper (5) | 2018 | 18,000 | - | 50,250 | - | 68,250 | ||||||||||||||||
| 2017 | 13,500 | - | 45,000 | - | 58,500 | |||||||||||||||||
| Roy W. Olivier (6) | 2018 | 8,500 | - | 39,650 | - | 48,150 | ||||||||||||||||
| 2017 | - | - | - | - | - | |||||||||||||||||
| Janice Peterson | 2018 | - | - | - | 297,277 | (1) | 297,277 | |||||||||||||||
| 2017 | - | - | - | 315,412 | (2) | 315,412 | ||||||||||||||||
| (1) | Ms. Peterson received no compensation for her services as a director of the Company. Other compensation represents the following amounts paid to Ms. Peterson for her services as an employee of the Company: salary in the amount of $116,667, bonus in the amount of $19,668, grant date fair value of restricted stock of $68,933 (represents the grant date fair value of 47,829 shares of restricted stock granted on August 22, 2017, 8,136 shares of restricted stock granted on November 21, 2017, and 9,030 shares of restricted stock granted on February 18, 2018), grant date fair value of $34,850 for stock options granted on September 30, 2017 to purchase 85,000 shares of common stock at an exercise price of $1.50, grant date fair value of $56,350 for stock options granted on September 30, 2017 to purchase 115,000 shares of common stock at an exercise price of $1.15, $6,233 for the modification of stock options to purchase an aggregate of 17,600 shares of the Company’s common stock to extend the right to exercise after separation from 90 days to approximately 5 years, and other compensation in the amount of $4,400. The grant date fair value of restricted stock was estimated using the market price of the Company’s common stock at the date of grant. The restricted stock vests over a three year period, with a one year cliff vesting period, and remain subject to forfeiture if vesting conditions are not met. |
| 49 |
| (2) | Ms. Peterson received no compensation for her services as a director of the Company. Other compensation represents the following amounts paid to Ms. Peterson for her services as an employee of the Company: salary in the amount of $195,605, bonus in the amount of $73,209, grant date fair value of restricted stock of $41,249 (represents the grant date fair value of 16,364 shares of restricted stock granted on August 23, 2016, 5,000 shares of restricted stock granted on November 21, 2016, 8,479 shares of restricted stock granted on February 16, 2017, and 10,460 shares of restricted stock granted on May 11, 2017), and other compensation in the amount of $5,349. The grant date fair value of restricted stock was estimated using the market price of the Company’s common stock at the date of grant. The restricted stock vests over a three year period, with a one year cliff vesting period, and remain subject to forfeiture if vesting conditions are not met. | |
| (3) | Outstanding equity awards as of June 30, 2018 consists of options to purchase 30,000 shares of common stock at $1.10 per share, options to purchase 16,000 shares of common stock at $0.80 per share, options to purchase 150,000 shares of common stock at $0.70 per share, options to purchase 150,000 shares of common stock at an exercise price of $1.05 per share, and options to purchase 150,000 shares of common stock at an exercise price of $1.20 per share. | |
| (4) | Outstanding equity awards as of June 30, 2018 consists of shares underlying warrants to purchase 50,000 shares of common stock at an exercise price of $1.25 per share, shares underlying warrants to purchase 50,000 shares of common stock at an exercise price of $1.19 per share, options to purchase 50,000 shares of common stock at an exercise price of $1.15 per share, options to purchase 125,000 shares of common stock at an exercise price of $1.05 per share, options to purchase 75,000 shares of common stock at an exercise price of $1.10 per share, options to purchase 75,000 shares of common stock at an exercise price of $0.70 per share, and options to purchase 75,000 shares of common stock at an exercise price of $1.20 per share. | |
| (5) | Outstanding equity awards as of June 30, 2018 consists of options to purchase 43,750 shares of common stock at an exercise price of $1.09 per share, options to purchase 75,000 shares of common stock at an exercise price of $1.05 per share, and options to purchase 75,000 shares of common stock at an exercise price of $1.20 per share. | |
| (6) | Outstanding equity awards as of June 30, 2018 consists of options to purchase 65,000 shares of common stock at an exercise price of $1.15 per share. |
Item 12. Security Ownership of Certain Beneficial Owners and Management and Related Stockholder Matters
The following table sets forth certain information, as of September 14, 2018, with respect to the holdings of (1) each person who is the beneficial owner of more than five percent of our common stock, (2) each of our directors, (3) each named executive officer, and (4) all of our directors and executive officers as a group.
Beneficial ownership of the common stock is determined in accordance with the rules of the Securities and Exchange Commission and includes any shares of common stock over which a person exercises sole or shared voting or investment powers, or of which a person has a right to acquire ownership at any time within 60 days of September 14, 2018. Except as otherwise indicated, and subject to applicable community property laws, the persons named in this table have sole voting and investment power with respect to all shares of common stock held by them. The address of each director and officer is c/o Research Solutions, Inc., 15821 Ventura Blvd., Suite 165, Encino, California 91436. Applicable percentage ownership in the following table is based on 24,186,126 shares of common stock outstanding as of September 14, 2018 plus, for each person, any securities that person has the right to acquire within 60 days of September 14, 2018.
| Name and Address of Beneficial Owner | Shares Beneficially Owned | Percentage of Shares | ||||||
| Greater than 5% Shareholder: | ||||||||
| Bristol Investment Fund, Ltd. (1) 662 N. Sepulveda Blvd., Suite 300 Los Angeles, CA 90049 | 4,825,772 | 20.0 | % | |||||
| 12 West Capital Fund Ltd. (2) 90 Park Avenue, 41st Floor New York, NY 10016 | 4,445,339 | 17.8 | % | |||||
| 12 West Capital Offshore Fund LP (3) 90 Park Avenue, 41st Floor New York, NY 10016 | 3,135,661 | 12.6 | % | |||||
| Samjo Capital, LLC (4) 1345 Avenue of the Americas, 3rd Floor New York, NY 10105 | 1,442,109 | 6.0 | % | |||||
| Richard H. Witmer, Jr. 16 Fort Hills Lane Greenwich, CT 06831 | 1,207,148 | 5.0 | % | |||||
| Directors and Executive Officers: | ||||||||
| Peter Victor Derycz (5) | 3,762,144 | 15.5 | % | |||||
| Alan Louis Urban (6) | 584,809 | 2.4 | % | |||||
| Scott Ahlberg (7) | 512,982 | 2.1 | % | |||||
| Marc Nissan (8) | 789,769 | 3.2 | % | |||||
| Rogier van Erkel | - | - | % | |||||
| Yohann Georgel | - | - | % | |||||
| John Regazzi (9) | 693,500 | 2.8 | % | |||||
| Gen. Merrill McPeak (10) | 634,608 | 2.6 | % | |||||
| Chad J. Cooper (11) | 788,250 | 3.2 | % | |||||
| Roy W. Olivier (12) | 65,000 | 0.3 | % | |||||
| All Directors and Executive Officers as a group (10 persons) (13) | 7,831,062 | 29.5 | % | |||||
| 50 |
| (1) | Paul Kessler exercises voting and investment power over the shares held by Bristol Investment Fund, Ltd. and is the brother-in-law of Peter Victor Derycz. Mr. Kessler previously served as a member of our board of directors from August 18, 2014 through November 6, 2015. |
| (2) | Includes shares underlying warrants to purchase 880,500 shares of common stock at an exercise price of $1.25 per share. Joel Ramin, the General Partner of 12 West Management LP, the investment manager of 12 West Capital Fund LP, exercises voting and investment power over the shares held by 12 West Capital Fund LP but disclaims beneficial ownership of such shares except to the extent of his pecuniary interest therein. |
| (3) | Includes shares underlying warrants to purchase 619,500 shares of common stock at an exercise price of $1.25 per share. Joel Ramin, the General Partner of 12 West Management LP, the investment manager of 12 West Capital Offshore Fund LP, exercises voting and investment power over the shares held by 12 West Capital Offshore Fund LP but disclaims beneficial ownership of such shares except to the extent of his pecuniary interest therein. |
| (4) | Andrew N. Wiener, the sole managing member of Samjo Capital, LLC and Samjo Management, LLC, exercises voting and investment power over the shares held by Samjo Capital, LLC. |
| (5) | Includes shares underlying options to purchase 32,000 shares of common stock at an exercise price of $1.25 per share, options to purchase 16,000 shares of common stock at an exercise price of $1.85 per share, and warrants to purchase 6,000 shares of common stock at an exercise price of $1.25 per share, and 129,355 shares of unvested restricted stock. The restricted stock vests over a three year period, with a one year cliff vesting period, and remains subject to forfeiture if vesting conditions are not met. |
| (6) | Includes 5,000 shares owned by the wife of Mr. Urban, 5,000 shares owned by each of the three children of Mr. Urban, shares underlying options to purchase 100,000 shares of common stock at an exercise price of $1.02 per share, options to purchase 125,000 shares of common stock at an exercise price of $1.30 per share, options to purchase 24,000 shares of common stock at an exercise price of $1.15 per share, and warrants to purchase 1,800 shares of common stock at an exercise price of $1.25 per share, and 97,686 shares of unvested restricted stock. The restricted stock vests over a three year period, with a one year cliff vesting period, and remains subject to forfeiture if vesting conditions are not met. |
| (7) | Includes shares underlying options to purchase 75,000 shares of common stock at an exercise price of $1.50 per share, options to purchase 75,000 shares of common stock at an exercise price of $1.00 per share, options to purchase 20,000 shares of common stock at an exercise price of $1.02 per share, options to purchase 25,600 shares of common stock at an exercise price of $1.15 per share, and warrants to purchase 1,500 shares of common stock at an exercise price of $1.25 per share, and 94,789 shares of unvested restricted stock. The restricted stock vests over a three year period, with a one year cliff vesting period, and remains subject to forfeiture if vesting conditions are not met. |
| (8) | Includes shares underlying options to purchase 100,000 shares of common stock at an exercise price of $1.50 per share, options to purchase 100,000 shares of common stock at an exercise price of $1.00 per share, options to purchase 100,000 shares of common stock at an exercise price of $1.30 per share, options to purchase 50,000 shares of common stock at an exercise price of $1.02 per share, options to purchase 28,800 shares of common stock at an exercise price of $1.15 per share, and warrants to purchase 3,000 shares of common stock at an exercise price of $1.25 per share, and 94,789 shares of unvested restricted stock. The restricted stock vests over a three year period, with a one year cliff vesting period, and remains subject to forfeiture if vesting conditions are not met. |
| (9) | Includes shares underlying warrants to purchase 22,500 shares of common stock at an exercise price of $1.25 per share, options to purchase 30,000 shares of common stock at $1.10 per share, options to purchase 16,000 shares of common stock at $0.80 per share, options to purchase 150,000 shares of common stock at $0.70 per share, options to purchase 150,000 shares of common stock at an exercise price of $1.05 per share, and options to purchase 150,000 shares of common stock at an exercise price of $1.20 per share. |
| (10) | Includes shares underlying warrants to purchase 50,000 shares of common stock at an exercise price of $1.25 per share, warrants to purchase 50,000 shares of common stock at an exercise price of $1.19 per share, warrants to purchase 7,500 shares of common stock at an exercise price of $1.25 per share, options to purchase 50,000 shares of common stock at an exercise price of $1.15 per share, options to purchase 125,000 shares of common stock at an exercise price of $1.05 per share, options to purchase 75,000 shares of common stock at an exercise price of $1.10 per share, options to purchase 75,000 shares of common stock at an exercise price of $0.70 per share, and options to purchase 75,000 shares of common stock at an exercise price of $1.20 per share.. |
| (11) | Includes 323,000 shares of common stock held by the Cooper Family Trust Dated 8/1/2004 and 26,500 shares of common stock held by Mr. Cooper’s IRA and SEP IRA, and shares underlying warrants to purchase 195,000 shares of common stock at an exercise price of $1.25 per share, and options to purchase 43,750 shares of common stock at an exercise price of $1.09 per share, options to purchase 75,000 shares of common stock at an exercise price of $1.05 per share, and options to purchase 75,000 shares of common stock at an exercise price of $1.20 per share. Mr. Cooper exercises voting and investment power over the shares held by the Cooper Family Trust Dated 8/1/2004, and his IRA and SEP IRA. |
| (12) | Includes shares underlying options to purchase 65,000 shares of common stock at an exercise price of $1.15 per share. |
| (13) | Includes shares underlying warrants to purchase 337,300 shares of common stock, and shares underlying options to purchase 2,026,150 shares of common stock. |
| 51 |
Change of Control
To the knowledge of management, there are no present arrangements or pledges of securities of our company that may result in a change in control of our company.
Equity Compensation Plan Information
In December 2007, we established the 2007 Equity Compensation Plan (the “2007 Plan”) and in November 2017 we established the 2017 Omnibus Incentive Plan (the “2017 Plan”), collectively (the “Plans”). The Plans were approved by our board of directors and stockholders. The purpose of the Plans is to grant stock and options to purchase our common stock, and other incentive awards, to our employees, directors and key consultants. On November 10, 2016, the maximum number of shares of common stock that may be issued pursuant to awards granted under the 2007 Plan increased from 5,000,000 to 7,000,000. On November 21, 2017, the Company’s stockholders approved the adoption of the 2017 Plan (previously adopted by our board of directors on September 14, 2017), which authorized a maximum of 1,874,513 shares of common stock that may be issued pursuant to awards granted under the 2017 Plan. Upon adoption of the 2017 Plan we ceased granting incentive awards under the 2007 Plan and commenced granting incentive awards under the 2017 Plan. The shares of our common stock underlying cancelled and forfeited awards issued under the 2017 Plan may again become available for grant under the 2017 Plan. Cancelled and forfeited awards issued under the 2007 Plan that were cancelled or forfeited prior to November 21, 2017 became available for grant under the 2007 Plan. As of June 30, 2018, there were 1,424,491 shares available for grant under the 2017 Plan, and no shares were available for grant under the 2007 Plan. All incentive stock award grants prior to the adoption of the 2017 Plan on November 21, 2017 were made under the 2007 Plan, and all incentive stock award grants after the adoption of the 2017 Plan on November 21, 2017 were made under the 2017 Plan. The following table provides information as of June 30, 2018 with respect to the Plans, which are the only compensation plans under which our equity securities are, or have been, authorized for issuance.
| Plan category | Number of securities to be issued upon exercise of outstanding options, warrants and rights | Weighted average exercise price of outstanding options, warrants and rights (1) | Number of securities remaining available for future issuance under equity compensation plans (excluding securities reflected in column (a)) | |||||||||
| (a) | (b) | (c) | ||||||||||
| Equity compensation plans approved by stockholders (2007 Equity Compensation Plan, and 2017 Omnibus Incentive Plan) | 4,773,815 | (2) | $ | 1.16 | 1,424,491 | |||||||
| Equity compensation plans not approved by stockholders | 200,000 | (3) | 1.22 | - | ||||||||
| Total | 4,973,815 | 1,424,491 | ||||||||||
| (1) | The weighted average exercise price excludes restricted stock awards, which have no exercise price. |
| (2) | Shares underlying options to purchase 2,991,835 shares of common stock and 1,781,980 shares of restricted common stock. |
| (3) | Shares underlying warrants to purchase 200,000 shares of common stock. |
Item 13. Certain Relationships and Related Transactions, and Director Independence
Other than the transactions described herein, since July 1, 2016, there has not been, nor is there currently proposed, any transaction or series of similar transactions to which we were or will be a party in which the amount involved exceeds the lesser of $120,000 or one percent of the average of our total assets at year end for the last two completed fiscal years; and in which any director, executive officer, shareholder who beneficially owns 5% or more of our common stock or any member of their immediate family had or will have a direct or indirect material interest.
Director Independence
Our board of directors currently consists of five members: Messrs. Regazzi (Chairman), Derycz, McPeak, Cooper and Olivier. Our board of directors has determined that Mr. Regazzi, Gen. McPeak, Mr. Cooper and Mr. Olivier are independent directors as that term is defined in the applicable rules for companies traded on the NASDAQ Stock Market. Mr. Regazzi, Gen. McPeak, Mr. Cooper and Mr. Olivier are each members of the Audit Committee, Compensation Committee and Nominating and Governance Committee of our board of directors, and each of them meets the NASDAQ Stock Market’s independence standards for members of such committees.
| 52 |
Item 14. Principal Accounting Fees and Services
Summary of Principal Accounting Fees for Professional Services Rendered
The following table presents the aggregate fees for professional audit services and other services rendered by Weinberg & Company, P.A., our independent registered public accountants in the fiscal years ended June 30, 2018 and 2017.
Year Ended June 30, 2018 | Year Ended June 30, 2017 | |||||||
| Audit Fees | $ | 106,124 | $ | 88,140 | ||||
| Audit-Related Fees | - | - | ||||||
| Tax Fees | 23,378 | 24,198 | ||||||
| All Other Fees | - | - | ||||||
| Total | $ | 129,502 | $ | 112,338 | ||||
Audit Fees consist of amounts billed for professional services rendered for the audit of our annual consolidated financial statements included in our Annual Reports on Form 10-K, and reviews of our interim consolidated financial statements included in our Quarterly Reports on Form 10-Q and our Registration Statement on Form S-1, including amendments thereto.
Audit-Related Fees consist of fees billed for professional services that are reasonably related to the performance of the audit or review of our consolidated financial statements but are not reported under “Audit Fees.”
Tax Fees consist of fees for professional services for tax compliance activities, including the preparation of federal and state tax returns and related compliance matters.
All Other Fees consists of amounts billed for services other than those noted above.
The audit committee of our board of directors has considered whether the provision of the services described above for the fiscal years ended June 30, 2018 and 2017, is compatible with maintaining the auditor’s independence.
All audit and non-audit services that may be provided by our principal accountant to us shall require pre-approval by the audit committee of our board of directors. Further, our auditor shall not provide those services to us specifically prohibited by the SEC, including bookkeeping or other services related to the accounting records or financial statements of the audit client; financial information systems design and implementation; appraisal or valuation services, fairness opinion, or contribution-in-kind reports; actuarial services; internal audit outsourcing services; management functions; human resources; broker-dealer, investment adviser, or investment banking services; legal services and expert services unrelated to the audit; and any other service that the Public Company Accounting Oversight Board determines, by regulation, is impermissible.
Item 15. Exhibits and Financial Statements Schedules
(a)(1) Financial Statements.
The financial statements of Research Solutions, Inc. and its subsidiaries and the independent registered public accounting firm’s report dated September 20, 2018, are incorporated by reference to Item 8 of this report.
(a)(2) and (c) Financial Statement Schedules
Not required.
(a)(3) and (b) Exhibits
See the "Exhibit Index" beginning on the page immediately following the signature page hereto for the list of exhibits filed as part of this report, which list is incorporated herein by reference.
| 53 |
SIGNATURES
Pursuant to the requirements of Section 13 or 15(d) of the Securities Exchange Act of 1934, the registrant has duly caused this report to be signed on its behalf by the undersigned, thereunto duly authorized.
| RESEARCH SOLUTIONS, INC. | |||
| By: | /s/ Peter Victor Derycz | ||
| Peter Victor Derycz | |||
| Date: September 20, 2018 | Chief Executive Officer (Principal | ||
| Executive Officer) | |||
| By: | /s/ Alan Louis Urban | ||
| Alan Louis Urban | |||
| Date: September 20, 2018 | Chief Financial Officer (Principal | ||
| Financial and Accounting Officer) | |||
POWER OF ATTORNEY
KNOW ALL PERSONS BY THESE PRESENTS, that each person whose signature appears below constitutes and appoints Peter Victor Derycz and Alan Urban, and each of them, as his or her true and lawful attorneys-in-fact and agents, with full power of substitution for him or her, and in his or her name in any and all capacities, to sign any and all amendments to this Annual Report on Form 10-K, and to file the same, with exhibits thereto and other documents in connection therewith, with the Securities and Exchange Commission, granting unto said attorneys-in-fact and agents, and each of them, full power and authority to do and perform each and every act and thing requisite and necessary to be done therewith, as fully to all intents and purposes as he or she might or could do in person, hereby ratifying and confirming all that said attorneys-in-fact and agents, and any of them or his or her substitute or substitutes, may lawfully do or cause to be done by virtue hereof.
Pursuant to the requirements of the Securities Exchange Act of 1934, this report has been signed below by the following persons on behalf of the registrant and in the capacities and on the dates indicated.
| Signature | Title | Date | ||
| /s/ Peter Victor Derycz | ||||
| Peter Victor Derycz | Chief Executive Officer (Principal Executive | September 20, 2018 | ||
| Officer), President and Director | ||||
| /s/ Alan Louis Urban | ||||
| Alan Louis Urban | Chief Financial Officer (Principal Financial | September 20, 2018 | ||
| and Accounting Officer) and Secretary | ||||
| /s/ John Regazzi | ||||
| John Regazzi | Chairman of the Board | September 20, 2018 | ||
| /s/ Roy W. Olivier | ||||
| Roy W. Olivier | Director | September 20, 2018 | ||
| /s/ Merrill McPeak | ||||
| Merrill McPeak | Director | September 20, 2018 | ||
| /s/ Chad J. Cooper | ||||
| Chad J. Cooper | Director | September 20, 2018 |
| 54 |
EXHIBIT INDEX
| 55 |
| * | Furnished herewith |
| ++ | Indicates management contract or compensatory plan. |
| 56 |