Attached files
| file | filename |
|---|---|
| 8-K - 8-K - CENTERSPACE | a2018-09x18annualmeetingpr.htm |

September 2018 NYSE: IRET

Certain statements in this presentation are “forward-looking statements” within the meaning of the Private Securities Litigation Reform Act of 1995. Such statements involve known and unknown risks, uncertainties, and other factors that may cause actual results to differ materially from expected results. These statements may be identified by our use of words such as “expects,” “plans,” “estimates,” “anticipates,” “projects,” “intends,” “believes,” and similar expressions that do not relate to historical matters. Such risks, uncertainties, and other factors include, but are not limited to, changes in general and local economic and real estate market conditions, fluctuations in interest rates, the effect of government regulations, the availability and cost of capital, risks associated with our value add and redevelopment opportunities, property acquisition and disposition activities, the financial condition of our tenants, competition from other developers, our ability to attract and retain skilled personnel, our ability to maintain our tax status as a real estate investment trust (REIT), and those risks and uncertainties detailed from time to time in our filings with the Securities and Exchange Commission, including the “Management’s Discussion and Analysis of Financial Condition and Results of Operations” and “Risk Factors” contained in our Annual Report on Form 10-K for the fiscal year ended April 30, 2018, and in subsequent quarterly reports on Form 10-Q. We assume no obligation to update or supplement forward-looking statements that become untrue due to subsequent events. www.iretapartments.com Annual Meeting | September 2018 2

www.iretapartments.com Annual Meeting | September 2018 3

Jeffrey P. Caira Michael T. Dance Mark O. Decker Jr. Emily Nagel Green CHAIR Linda J. Hall Terrance P. Maxwell John A. Schissel Mary J. Twinem www.iretapartments.com Annual Meeting | September 2018 4

Now Dedicated Multifamily Company Focused Management Team Drives Operating Efficiencies Single Segment Property Specialist Engaged to Effect Improvement G&A and Operating Expenses Strong Markets and Distinct Geography Improved Capital Structure Positioned for Future Growth Combination of Core and Value-Add Properties Flexible Balance Sheet and Capital Allocation Focus Same-Store NOI www.iretapartments.com Annual Meeting | September 2018 5

Delivering on stated goals and renewed business strategy Evolution of Business Strategy – Focus and Flexibility PAST PRESENT FUTURE Multifamily Multifamily Multifamily Focus 31% Multifamily 95% (% of NOI) 100% Leverage Leverage Leverage Leverage 41% 40% (% of Book Value) 56% Unsecured Secured Secured 30% Leverage Type 40% 100% Unsecured Secured 60% 70% Multifamily Acquisition Criteria – Quality and Efficiency Twin Cities / Denver Twin Cities / Denver Primary Market Focus Small Market Bias Strong Secondary Strong Secondary >$1,200 >$1,000 <$800 Revenue / Home Homes / Community <150 >150 >200 Note: “Past” as of 4/30/12 and “Present” as 7/31/18 www.iretapartments.com Annual Meeting | September 2018 6

We are a premier multifamily company delivering exposure to strong Midwest markets Minot MT ND Grand Forks Billings Bismarck MN St. Cloud WI Rapid City SD Minneapolis Sioux Falls Rochester IA NE Omaha Denver CO Topeka KS Highlights Portfolio Evolution • 87 communities with 13,703 apartment homes % of Multifamily NOI • Proforma NOI for FY19 estimated to be 30% in 27% 36% 34% 33% 32% 29% Minneapolis and Denver; over 50% in 20% Minnesota and Colorado 26% 30% 36% 10% 42% 42% 2% • Diversified price points within the portfolio 43% 43% 31% 38% • Significant opportunity for value add and 22% 24% operational efficiencies FY14 FY15 FY16 FY17 FY18 PF FY19 MN CO ND Other www.iretapartments.com Annual Meeting | September 2018 7

Newer communities in the Midwest have shown strong performance since 2010 Rent Growth CAGR Revenue Growth CAGR For communities built since 2010 For communities built since 2010 4.1% 3.5% 3.9% 2.8% 3.1% 2.4% 2.2% 2.3% 1.6% 1.9% Midwest South West Northeast National Avg Midwest South West Northeast National Avg 36% of IRET’s FY19 NOI expected from communities built since 2010(1) Source: Axiometrics (1) Proforma FY19 NOI excludes Williston assets www.iretapartments.com Annual Meeting | September 2018 8

Targeted Geography Has Strong Market Fundamentals DENVER 2010-2017 Population CAGR 1.77% Unemployment Rate 2.9% Median Household Income $71,926 Median Home Price $462,900 TWIN CITIES Multifamily % of Housing Stock(1) 26.8% 2010-2017 Population CAGR 1.01% 2014-2017 Rent CAGR 5.38% Unemployment Rate 2.6% 2014-2017 Average Vacancy 4.82% Median Household Income $73,231 Median Home Price $280,200 Multifamily % of Housing Stock(1) 22.9% 2014-2017 Rent CAGR 3.01% 2014-2017 Average Vacancy 3.32% TOP 25 MSAs(2) 2010-2017 Population CAGR 1.17% Unemployment Rate 4.0% Median Household Income $66,564 Median Home Price $375,900 Multifamily % of Housing Stock(1) 24.5% 2014-2017 Rent CAGR 3.76% 2014-2017 Average Vacancy 4.77% Sources: US Census Bureau, Bureau of Labor Statistics, National Association of Realtors, and Axiometrics (1) 5+ units; mobile homes and RVs excluded from total stock (2) Top 25 MSAs defined as 25 highest populated metro areas as of most recent US Census Bureau data Top 25 MSA statistics are averages excluding Denver and Twin Cities www.iretapartments.com Annual Meeting | September 2018 9

These five markets plus Minneapolis and Denver are expected to make up 78% of proforma FY19 NOI Rochester, MN Omaha, NE Grand Forks, ND St. Cloud, MN Bismarck, ND Population 218,280 933,316 102,414 197,759 132,142 Median Household Income $70,078 $62,247 $48,671 $56,620 $65,527 Unemployment Rate(1) 2.3% 3.1% 2.8% 2.6% 2.4% Mayo Clinic Offutt Air Force Base University of ND CentraCare Health State of ND Major Employers IBM Union Pacific Altru Health State of Minnesota Sanford Health Number of IRET Homes 1,711 1,370 1,554 1,190 1,259 Total Multifamily Supply 11,534 74,004 14,548 16,438 11,516 Same-Store Average Revenue per Home(2) $1,261 $951 $971 $1,003 $1,011 Same-Store Average Occupancy(3) 92.9% 94.7% 92.6% 93.9% 93.9% Sources: US Census Bureau, Bureau of Labor Statistics, IRET, Axiometrics, Company Filings and Disclosures, and IRET Research (1) July 2018 Unemployment Rate (2) Q1FY19 Weighted Average Revenue per Home per Month (3) Q1FY19 Weighted Average Occupancy www.iretapartments.com Annual Meeting | September 2018 10

Our portfolio has demonstrated more volatility Year-Over-Year Same-Store Revenue % Change IRET Multifamily Multifamily Peers 7.0% 5.0% 3.0% 1.0% (1.0%) (3.0%) (5.0%) Q1 Q2 Q3 Q4 Q1 Q2 Q3 Q4 Q1 Q2 Q3 Q4 Q1 Q2 Q3 Q4 Q1 Q2 Q3 Q4 Q1 2014 2015 2016 2017 2018 2019 Sources: Company Filings, SNL Notes: 1) Multifamily Peers is average of AIV, AVB, APTS, BRG, CPT, EQR, ESS, IRT, MAA, NXRT, and UDR 2) Time periods shown are IRET’s fiscal quarters; multifamily peers results are for the time period that most closely matches IRET’s fiscal quarters www.iretapartments.com Annual Meeting | September 2018 11

North Dakota’s cycle, Minot and Williston in particular, drove volatility Year-Over-Year Same-Store Revenue % Change Minot & Williston Bismarck & Grand Forks Others 15.0% 10.0% 5.0% 0.0% (5.0%) (10.0%) (15.0%) (20.0%) (25.0%) (30.0%) (35.0%) Q1 Q2 Q3 Q4 Q1 Q2 Q3 Q4 Q1 Q2 Q3 Q4 Q1 Q2 Q3 Q4 Q1 Q2 Q3 Q4 Q1 2014 2015 2016 2017 2018 2019 www.iretapartments.com Annual Meeting | September 2018 12

We must control expense growth in the future... Year-Over-Year Same-Store Expense % Change IRET Multifamily Multifamily Peers 20.0% 16.0% 12.0% 8.0% 4.0% 0.0% (4.0%) (8.0%) Q1 Q2 Q3 Q4 Q1 Q2 Q3 Q4 Q1 Q2 Q3 Q4 Q1 Q2 Q3 Q4 Q1 Q2 Q3 Q4 Q1 2014 2015 2016 2017 2018 2019 Sources: Company Filings, SNL Notes: 1) Multifamily Peers is average of AIV, AVB, APTS, BRG, CPT, EQR, ESS, IRT, MAA, NXRT, and UDR 2) Time periods shown are IRET’s fiscal quarters; multifamily peers results are for the time period that most closely matches IRET’s fiscal quarters www.iretapartments.com Annual Meeting | September 2018 13

...to drive consistent Net Operating Income growth Year-Over-Year Same-Store Net Operating Income % Change IRET Multifamily Multifamily Peers 15.0% 10.0% 5.0% 0.0% (5.0%) (10.0%) (15.0%) Q1 Q2 Q3 Q4 Q1 Q2 Q3 Q4 Q1 Q2 Q3 Q4 Q1 Q2 Q3 Q4 Q1 Q2 Q3 Q4 Q1 2014 2015 2016 2017 2018 2019 Sources: Company Filings, SNL Notes: 1) Multifamily Peers is average of AIV, AVB, APTS, BRG, CPT, EQR, ESS, IRT, MAA, NXRT, and UDR 2) Time periods shown are IRET’s fiscal quarters; multifamily peers results are for the time period that most closely matches IRET’s fiscal quarters www.iretapartments.com Annual Meeting | September 2018 14

Westend Dylan Location: Denver, CO Location: Denver, CO Profile: Urban Core Profile: Urban Core Constructed: 2015 Constructed: 2016 Homes: 390 Homes: 274 Purchase Price: $128.7M Purchase Price: $90.6M Park Place Oxbo Location: Plymouth, MN Location: St. Paul, MN Profile: Suburban Value-Add Profile: Urban Core Constructed: 1985 Constructed: 2017 Homes: 500 Homes: 191 Purchase Price: $92.3M Retail: 11,500 sf Purchase Price: $61.5M Stabilization Date: June 2018 www.iretapartments.com Annual Meeting | September 2018 15

Total Multifamily NOI Average Revenue / Home $90M $1,774 $41M $1,061 $724 FY 2012 FY 2018 FY 2012 Current Same- Current Non Same- Store(1) Store (1) Multifamily Homes Operational Enhancements • Placing full focus on our residents and our communities 13,703 • Growing our team of operational specialists 9,161 • Shifting to dedicated multifamily IT solutions • Revenue management • Leasing optimization • Reputation management • Lead management (2) (1) FY 2012 Current • Strengthening asset management with additional resources (1) Quarter Ended 7/31/18 (2) As of 4/30/12 www.iretapartments.com Annual Meeting | September 2018 16

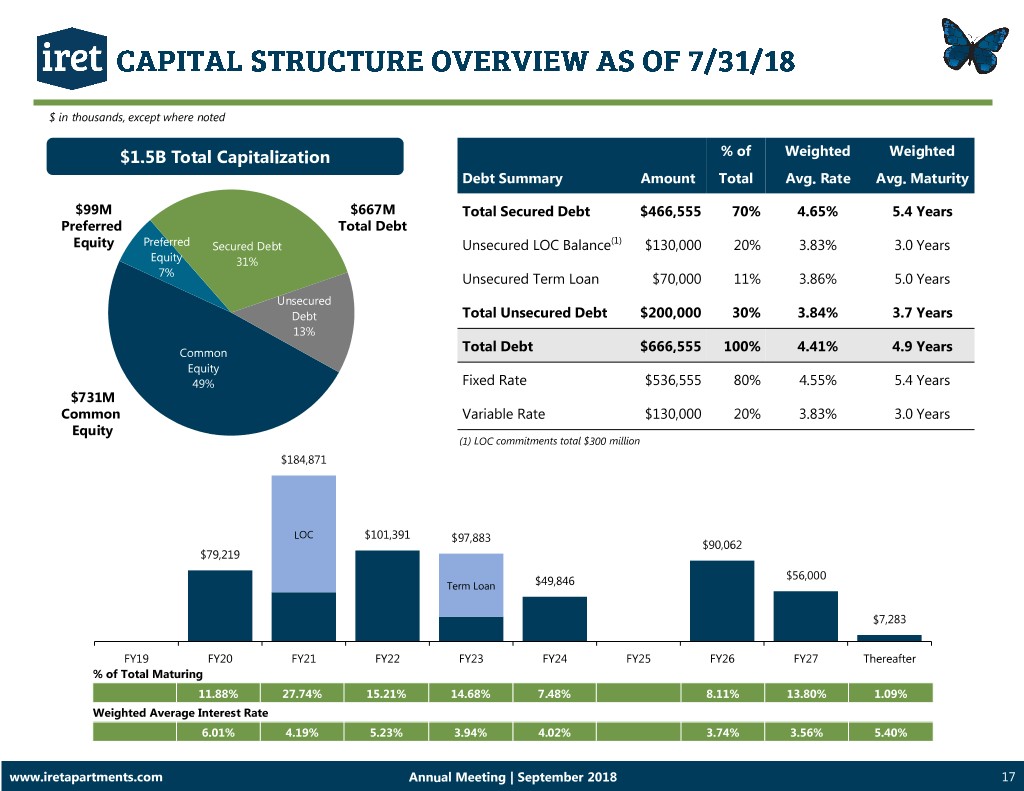
$ in thousands, except where noted $1.5B Total Capitalization % of Weighted Weighted Debt Summary Amount Total Avg. Rate Avg. Maturity $99M $667M Total Secured Debt $466,555 70% 4.65% 5.4 Years Preferred Total Debt (1) Equity Preferred Secured Debt Unsecured LOC Balance $130,000 20% 3.83% 3.0 Years Equity 31% 7% Unsecured Term Loan $70,000 11% 3.86% 5.0 Years Unsecured Debt Total Unsecured Debt $200,000 30% 3.84% 3.7 Years 13% Common Total Debt $666,555 100% 4.41% 4.9 Years Equity 49% Fixed Rate $536,555 80% 4.55% 5.4 Years $731M Common Variable Rate $130,000 20% 3.83% 3.0 Years Equity (1) LOC commitments total $300 million $184,871 LOC $101,391 $97,883 $90,062 $79,219 $56,000 Term Loan $49,846 $7,283 FY19 FY20 FY21 FY22 FY23 FY24 FY25 FY26 FY27 Thereafter % of Total Maturing 11.88% 27.74% 15.21% 14.68% 7.48% 8.11% 13.80% 1.09% Weighted Average Interest Rate 6.01% 4.19% 5.23% 3.94% 4.02% 3.74% 3.56% 5.40% www.iretapartments.com Annual Meeting | September 2018 17

Prudent capital allocation provides greater opportunities to reinvest in and grow our business Continue Disciplined Investment Strategy • Improve portfolio efficiency and quality through targeted redevelopment of existing assets and new acquisitions • Continue active portfolio management • Increase economies of scale Maintain Stronger, More Flexible Balance Sheet • Redeemed Series A ($29M, 8.25%) and Series B ($115M, 7.95%) preferred stock; issued Series C ($103M, 6.625%) preferred stock • Amended our current LOC to improve pricing, increase access to liquidity and flatten out the debt maturity schedule • Targeting debt metrics in-line with investment grade benchmarks Enhance Per-Share Metrics • Increase cash flow per share • Generate durable cash flow through higher-quality apartment portfolio • Improve dividend payout ratio www.iretapartments.com Annual Meeting | September 2018 18

Stronger Balance Sheet Stronger Markets Operational Enhancements Best in Class Governance www.iretapartments.com Annual Meeting | September 2018 19

Investor Relations Contact: Jonathan Bishop ir@iret.com 701.837.7104
