Attached files
| file | filename |
|---|---|
| 8-K - 8-K - GMS Inc. | a18-27034_18k.htm |
Safe Harbor and Basis of Presentation Forward-Looking Statement Safe Harbor - This presentation includes "forward-looking statements" within the meaning of the Private Securities Litigation Reform Act of 1995. All of these forward-looking statements are based on estimates and assumptions made by our management that, although believed by us to be reasonable, are inherently uncertain. Examples of forward-looking statements include those related to net sales, gross profit, gross margins, capital expenditures and market share growth, as well as non-GAAP financial measures such as Adjusted EBITDA, the ratio of debt-to-Adjusted EBITDA, adjusted net income and base business sales, including any management expectations or outlook for fiscal 2019 and beyond. In addition, statements regarding the markets in which the Company operates, our ability to continue to drive profitable growth while managing our business for the long-term and our ability to deliver record sales and strong earnings in fiscal 2019, demand trends and the anticipated benefits of our cost reduction plan, including future SG&A savings, the Titan acquisition, margin improvement, expected accretion and its expected contribution to the Company’s Adjusted EBITDA for the eleven months ending April 30, 2019, are forward-looking statements. Forward-looking statements involve risks and uncertainties, including, but not limited to, economic, competitive, governmental and technological factors outside of our control, that may cause our business, strategy or actual results to differ materially from the forward-looking statements. These risks and uncertainties may include, among other things: changes in the prices, margin, supply, and/or demand for products which we distribute; general economic and business conditions in the United States and Canada; the activities of competitors; changes in significant operating expenses; changes in the availability of capital and interest rates; adverse weather patterns or conditions; acts of cyber intrusion; variations in the performance of the financial markets, including the credit markets; the possibility that the expected synergies and cost savings and financial impacts from the Titan acquisition will not be realized, or will not be realized within the expected time period; the risk that the GMS and Titan businesses will not be integrated successfully; disruption from the transaction making it more difficult to maintain business and operational relationships and to accomplish other GMS objectives; the risk of customer attrition; our ability to efficiently manage and control our costs and the success of our previously announced cost reduction plan, and other factors described in the "Risk Factors" section in our Annual Report on Form 10-K for the fiscal year ended April 30, 2018, and in our other periodic reports filed with the SEC. In addition, the statements in this presentation are made as of September 6, 2018. We undertake no obligation to update any of the forward looking statements made herein, whether as a result of new information, future events, changes in expectation or otherwise. These forward-looking statements should not be relied upon as representing our views as of any date subsequent to September 6, 2018. Use of Non-GAAP and Adjusted Financial Information - To supplement GAAP financial information, we use adjusted measures of operating results which are non-GAAP measures. This non-GAAP adjusted financial information is provided as additional information for investors. These adjusted results exclude certain costs, expenses, gains and losses, and we believe their exclusion can enhance an overall understanding of our past financial performance and also our prospects for the future. These adjustments to our GAAP results are made with the intent of providing both management and investors a more complete understanding of our operating performance by excluding non-recurring, infrequent or other non-cash charges that are not believed to be material to the ongoing performance of our business. The presentation of this additional information is not meant to be considered in isolation or as a substitute for GAAP measures of net income, diluted earnings per share or net cash provided by (used in) operating activities prepared in accordance with generally accepted accounting principles in the United States. Please see the Appendix to this presentation for a further discussion on these non-GAAP measures and a reconciliation of these non-GAAP measures to the most directly comparable GAAP measures. 2
GMS at a Glance #1 North American specialty distributor Other ~29% of interior construction products - Founded in 1971 (1) Steel Framing ~15% Residential ~45% - Completed IPO on May 26, 2016 - More than 245 branches across 42 states and 5 Canadian provinces One-stop-shop for the interior contractor with broad product offering of 20,000+ SKUs Ceilings ~13% Balanced mix of commercial new construction, commercial R&R, residential new construction and residential R&R Wallboard ~43% Commercial ~55% Critical link between suppliers and highly fragmented customer base Net Sales ($ in millions, April FYE) PF Adjusted EBITDA (2) (3) ($ in millions, April FYE) National scale drives purchasing advantages over peers while local expertise enhances service capabilities $304 $2,647 $2,511 Recent Highlights - FY19 Q1 sales increased 21.2% to record $778.1 million - FY19 Q1 Adjusted EBITDA increased 42.7% to record $75.3 million - Completed two acquisitions in FY19, acquiring WSB Titan, the largest GSD in Canada, and Charles G. Hardy, Inc., a single location in Paramount, California founded in 1946 - Opened two greenfield locations in FY19 Q1 - FY19 Q1 LTM PF Adjusted Net Income per share of $3.25 Based on sales of wallboard and ceilings. FY-17 FY-18 FY-19 Q1 LTM FY-17 FY-18 FY-19 Q1 LTM (1) (2) For illustrative purpose only. Actual results may vary. Not prepared in accordance with Regulation S-X pro forma requirements. See “Forward-Looking Statement Safe Harbor” on page 2 of this presentation. (3) FY2017, FY2018, FY2019 Q1 LTM Adj. EBITDA includes approximately $10.0 million, $1.3 million and $64.3 million, respectively, from entities acquired in FY2017, FY2018 and FY2019 respectively, for the period prior to their respective dates of acquisition. FY2019 Q1 LTM PF Adj. EBITDA also includes approximately $17.9 million related to the amendment of existing GMS equipment operating leases to capital leases. However, Adj. EBITDA margin excludes the impact of the entities acquired for the period prior to their respective dates of acquisition as well as the pro forma adjustment related to the lease amendments for the period prior to the amendment date. For a reconciliation of PF Adj. EBITDA to Net Income (loss), the most directly comparable GAAP measure, see Appendix. 3 % Margin (3) 8.1%7.9%8.4% $18 $198$201 $64 $2,319 $222 $1 $199 $10 $188 PF Net Sales Breakdown (FY19 Q1 LTM) (2) GMS Overview

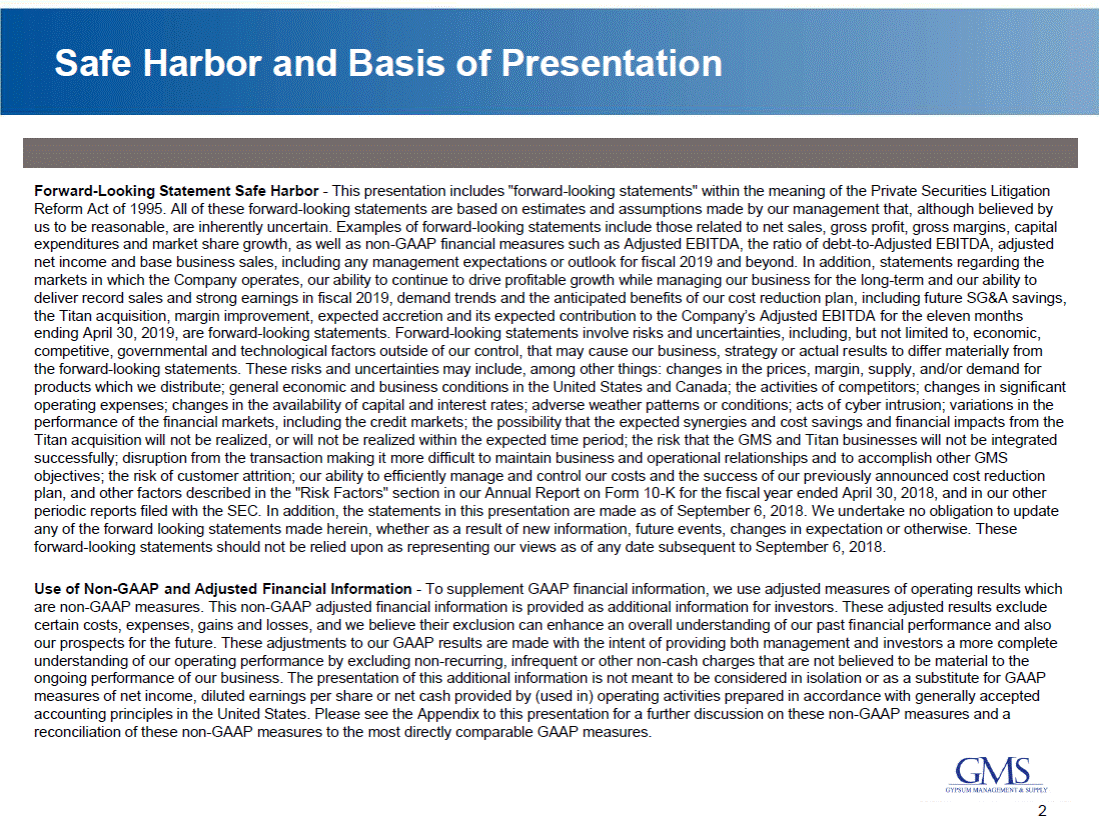
Fiscal Q1 Highlights Highlights Highlights 4 Other Successfully converted ~$23 million of existing equipment operating leases to capital leases on May 1, 2018 Implemented a strategic cost reduction plan to further improve our operational efficiency that is expected to generate annualized cost savings of approximately $20.0 million On August 7, 2018, acquired Charles G. Hardy, Inc. in Paramount, California Activity across R&R, residential and non-residential end markets remains steady Fiscal Q1 2019 We achieved record first quarter results Net sales increased 21.2% to a record $778.1 million Net sales base business growth of 6.1% Wallboard sales increased 11.6% (2.5% base) Ceiling sales increased 16.2% (8.1% base) Steel framing sales increased 23.4% (16.1% base) Other product sales increased 40.7% (4.6% base) Net income of $8.7 million, or EPS of $0.20 per diluted share Adjusted EBITDA increased 42.7% to $75.3 million Opened two greenfield locations in Philadelphia, PA and Frederick, MD on May 1, 2018 On June 1, 2018, acquired WSB Titan, establishing a 30 location footprint in Canada with LTM revenue of $485.6 million as of July 31, 2018

Fiscal Q1 2019 Performance Net Sales ($ mm) Adj. Gross Profit ($ mm) 32.0% $800 $700 $600 $500 $400 $300 $200 $100 $0 31.9% 28% $300 $250 $200 $150 $100 $50 $0 32.0% 44% 16% 31.5% 31.0% Fiscal Q1 2018 Fiscal Q1 2019 Fiscal Q1 2018 Fiscal Q1 2019 Gross Margin Gross Profit Adj. EBITDA ($ mm) Adj. SG&A ($ mm) 9.7% $174.1 $70 $60 $50 $40 $30 $20 $10 $0 $175 $150 $125 $100 $75 $50 $25 $0 Fiscal Q1 2018 SG&A% ex. Leases(2): 23.8% Fiscal Q1 2019 23.0% Fiscal Q1 2018 Margin ex. Leases(2): 8.2% Fiscal Q1 2019 9.1% -80 bps +90 bps (1) (2) For a reconciliation of Adj. Gross Profit to Gross Profit, Adj. SG&A to SG&A and Adj. EBITDA to Net Income, the most directly comparable GAAP metrics, see Appendix. Fiscal Q1 2019 includes the $4.8 million favorable impact to Adjusted SG&A and Adjusted EBITDA related to the amendment of existing GMS equipment operating leases to capital leases. We have excluded this impact for comparability. 5 $152.8 22.4% 23.8% 8.2% $75.3 $52.8 Fiscal Q1 2019 Adjusted SG&A (1) Fiscal Q1 2019 Adjusted EBITDA (1) $248.9 $205.1 24% 16% $778.1 41% 16% $642.2 Fiscal Q1 2019 Net Sales & Mix Fiscal Q1 2019 Adjusted Gross Profit & Margin (1)
Leading Specialty Distributor Poised for Continued Growth GMS has a demonstrated history of successful expansion through greenfields and acquisitions GMS has limited or no presence in just under 40% of the top 100 MSAs in the U.S. Growth opportunities in new Canadian geographies (Prairies, Quebec, Eastern Canada) and under-penetrated existing geographies (British Columbia, Alberta, Ontario) (1)GMS currently has limited or no branches in the areas identified as an MSA with limited or no GMS presence. There can be no assurance that GMS will be able to expand into any of these areas. Additionally, in the event GMS takes measures to expand into these areas, there can be no assurance that GMS will be successful, and any such expansion will be subject to several risks including those discussed within the “Risk Factors” section in our Annual Report on Form 10-K for the fiscal year ended April 30, 2018, and in our other periodic reports filed with the SEC. 6 Current GMS Branch MSA with limited or no GMS Presence(1) GMS Headquarters GMS Expansion Opportunities GMS has a significant opportunity to expand its geographic footprint in under-served and under-penetrated markets through greenfields and acquisitions

Attractive Capital Structure Post Titan transaction capital structure as of 7/31/18: Pro Forma leverage of 4.1x Net Debt / LTM Pro Forma Adj. EBITDA (1) Compares favorably to 6.0x Net Debt / LTM Pro Forma Adj. EBITDA (1) as of 4/30/14 and 4.3x pre-IPO Moody’s and Standard & Poor’s maintained current rating of B1/BB-FY19 Q1 capital structure reflects the following: The $627.0 million purchase of WSB Titan The amendment of existing GMS equipment operating leases to capital leases effective May 1, 2018 and the related increase to PP&E and debt accounts by ~$70 million ($ mm) 4/30/16 FYE 4/30/17 FYE 4/30/18 FYE 7/31/18 LTM 4.3x 4.2x Cash and cash equivalents $19 $15 $36 $37 Asset-Based Revolver First Lien Term Loan Second Lien Term Loan Capital Lease and Other $102 382 160 14 $103 478 - 14 $ - 577 - 19 $215 994 - 95 FY16 FY17 FY18 7/31/18 LTM (1) See appendix for a reconciliation of Pro Forma Adjusted EBITDA. 7 PF Adj. EBITDA (1) $150 $198 $201 $304 Total Debt / PF Adj. EBITDA 4.4x 3.0x 3.0x 4.3x Net Debt / PF Adj. EBITDA 4.3x 2.9x 2.8x 4.2x Total Debt $658 $595 $596 $1,304 2.9x2.8x Net Debt / PF Adjusted EBITDA (1) Leverage Summary Commentary

Leading Specialty Distributor Poised for Continued Growth Market Leader with Significant Scale Advantages – #1 North American Distributor of Wallboard and Ceilings Differentiated Service Model Drives Market Leadership Multiple Levers to Drive Market Leading Growth – Market Share, Greenfields, M&A, Operating Leverage Capitalizing on growth in Large, Diverse End Markets Entrepreneurial Culture with Dedicated Employees and Experienced Leadership Driving Superior Execution 8 Market Leader with Scale Advantages National Footprint Combined With Local Expertise

Appendix

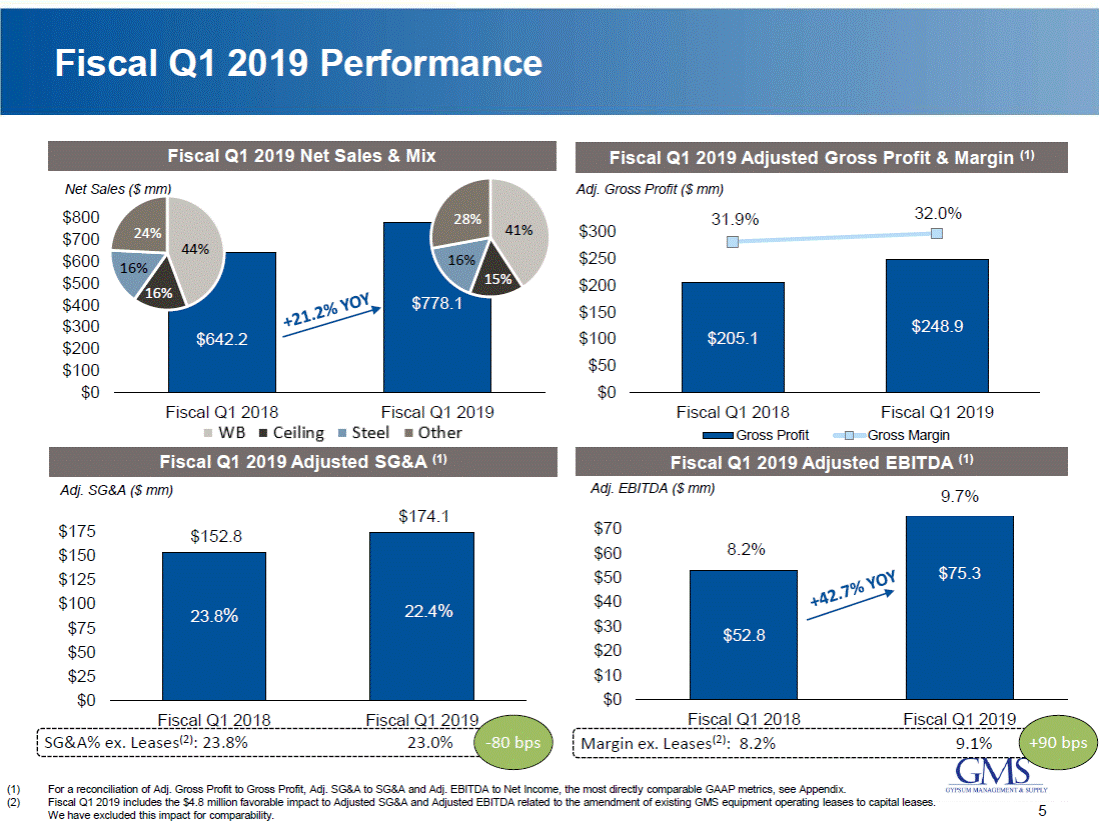
Summary Quarterly Financials 7 Note: Fiscal year end April 30. (1) Includes greenfields, which we consider extensions of “base business.” (2) FY18 acquired branches have been updated to reflect the number of acquired branches that are included within the sales from acquisitions 10 FY19 254 days (In millions, except per share data) 1Q18 2Q18 3Q18 4Q18 (Unaudited) Wallboard Volume (MSF) 914 929 826 878 Wallboard Price ($ / '000 Sq. Ft.) $ 311 $ 311 $ 312 $ 319 Wallboard $ 285 $ 288 $ 256 $ 280 Ceilings 100 102 90 96 Steel framing 105 103 97 107 Other products 153 155 142 153 Net sales 642 648 586 636 Cost of sales 437 436 390 430 Gross profit 205 212 195 206 Gross margin 31.9% 32.8% 33.4% 32.4% Operating expenses: Selling, general and administrative expenses 156 160 156 162 Depreciation and amortization 16 17 16 16 Total operating expenses 172 177 173 178 Operating income 33 36 23 28 Other (expense) income: Interest expense (8) (8) (8) (8) Change in fair value of financial instruments (0) (0) (0) (5) Write-off of discount and deferred financing costs (0) - - - Other income, net 0 1 1 1 Total other expense, net (7) (8) (7) (13) Income from continuing operations, before tax 25 28 15 15 Income tax expense (benefit) 10 10 (4) 5 Net income $ 15 $ 18 $ 20 $ 10 Business Days 64 65 62 63 Net Sales by Business Day $ 10.0 $ 10.0 $ 9.4 $ 10.1 Base Business Branches (1) (2) 206 206 207 207 Acquired Branches (2) - 4 5 7 Total Branches 206 210 212 214 FY18 1Q19 985 $ 323 $ 318 116 129 215 778 533 245 31.5% 185 26 212 33 (16) (6) - 1 (22) 11 3 $ 9 64 FY19 Business Days $ 12.2 1Q1964 days 209 2Q1965 days 37 3Q1962 days 246 4Q19 63 days 3,548 $ 313 $ 1,110 387 412 603 2,511 1,693 819 32.6% 634 66 699 119 (31) (6) (0) 2 (35) 84 21 $ 63 254 $ 9.9 207 214
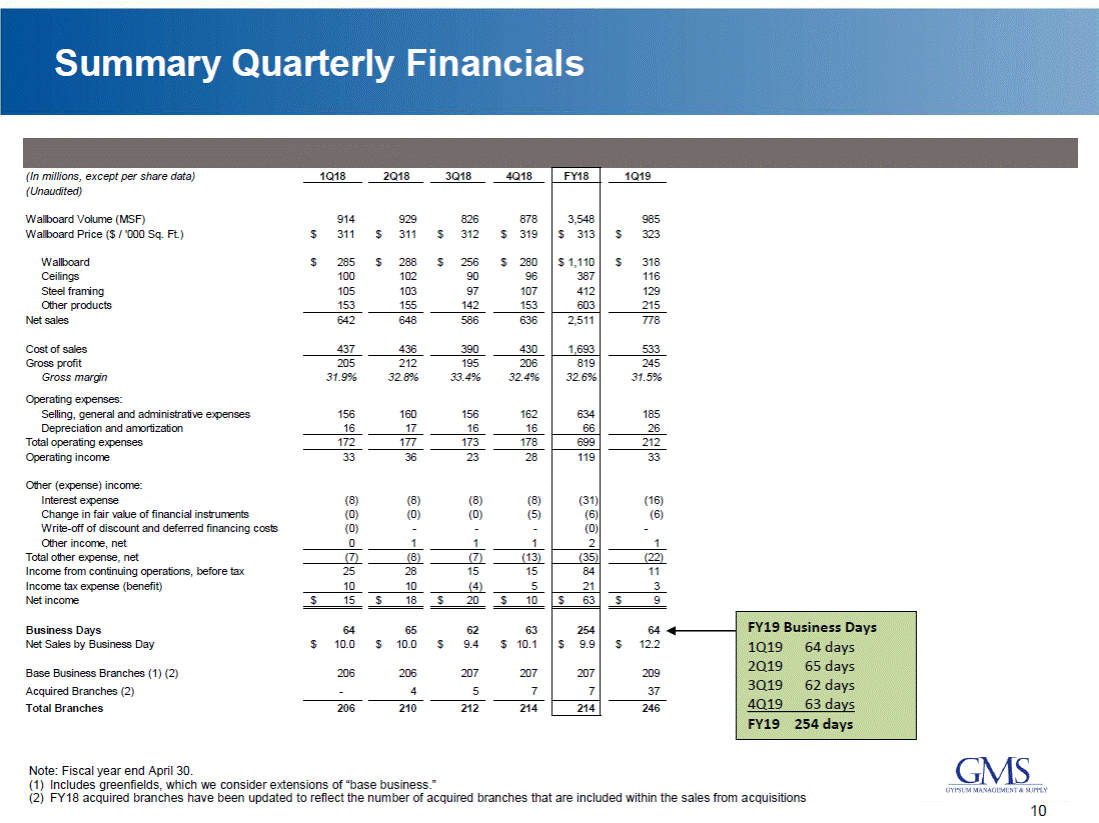
Quarterly Cash Flows ($ in millions) (Unaudited) Historical 1Q18 2Q18 3Q18 4Q18 FY18 1Q19 Net income Non-cash changes & other changes Changes in primary working capital components: Trade accounts and notes receivable Inventories Accounts payable Cash provided by (used in) operating activities $ 15.3 (0.2) $ 18.0 13.3 $ 19.7 14.9 $ 9.9 35.3 $ 63.0 63.4 $ 8.7 7.1 (12.9) (3.3) 9.5 (8.9) (4.0) 5.1 36.4 (16.3) (20.3) (26.3) (11.2) 17.1 (11.8) (34.8) 11.4 (41.0) (20.9) (1.7) 8.5 23.5 34.4 24.9 91.2 (47.8) Purchases of property and equipment Proceeds from sale of assets Acquisitions of businesses, net of cash acquired Cash (used in) investing activities (5.5) 1.4 (3.1) (2.9) 0.5 (15.3) (5.0) 0.4 (5.2) (10.3) 0.5 (4.8) (23.7) 2.9 (28.3) (3.8) 0.3 (575.5) (7.2) (17.7) (9.7) (14.6) (49.2) (579.0) Cash provided by (used in) financing activities 3.9 (5.8) (15.5) (2.8) (20.2) 627.3 Increase in cash and cash equivalents Balance, beginning of period Balance, end of period 5.2 14.6 0.0 19.7 9.2 19.8 7.5 28.9 21.8 14.6 0.4 36.3 $ 19.7 $ 19.8 $ 28.9 $ 36.4 $ 36.3 $ 36.8 Supplemental cash flow disclosures: Cash paid for income taxes Cash paid for interest $ $ 1.8 6.8 $ $ 26.7 7.3 $ $ 6.6 7.1 $ $ 3.9 7.4 $ $ 39.0 28.6 $ $ 1.0 11.0 11
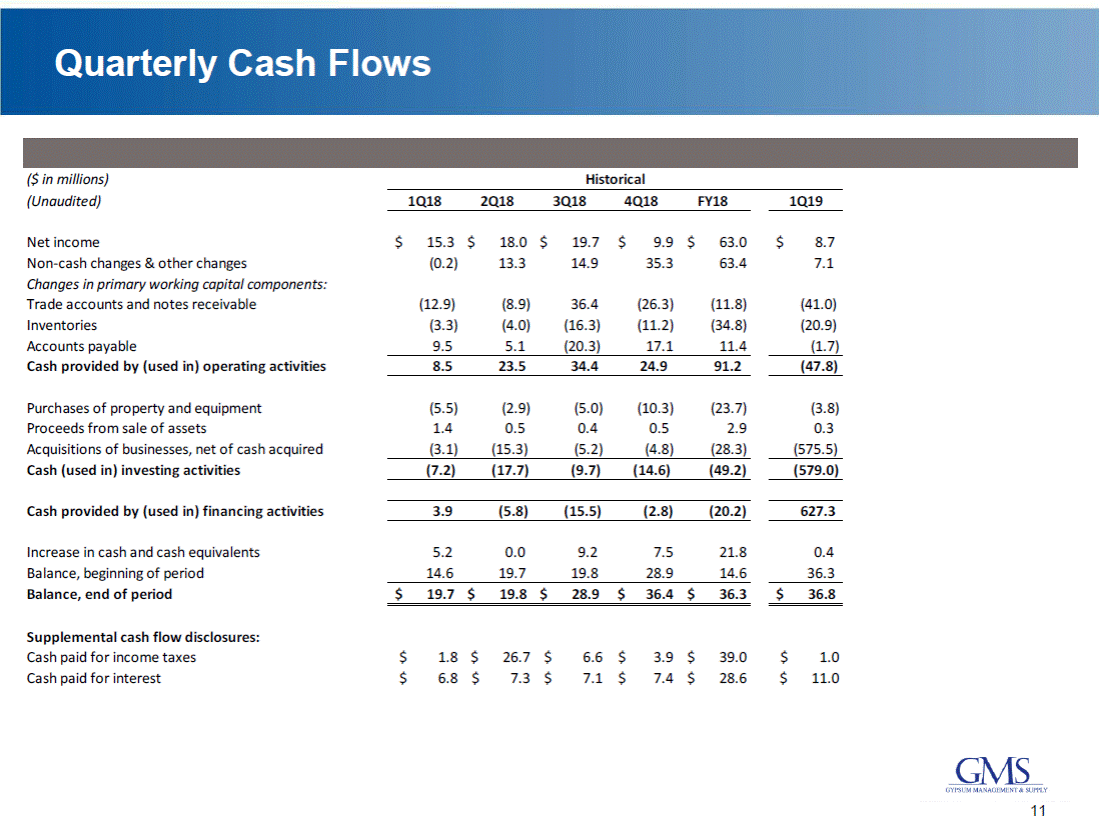
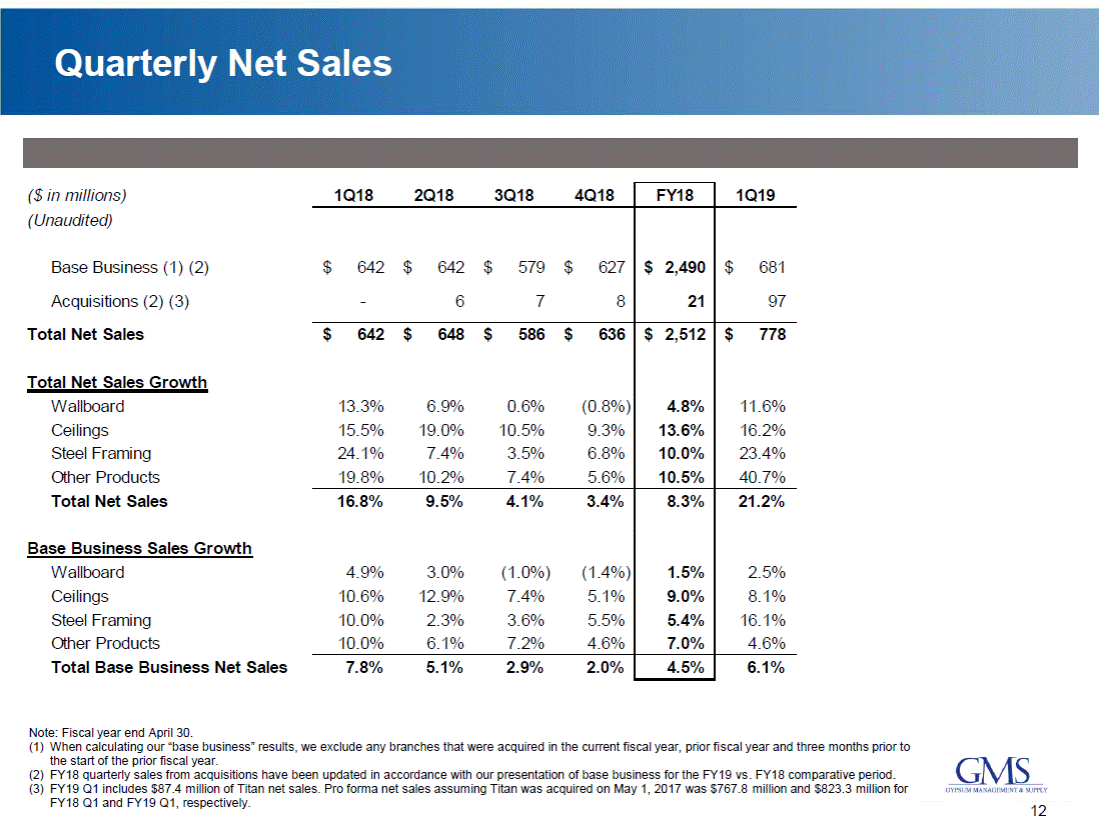
Quarterly Net Sales ($ in millions) (Unaudited) Base Business (1) (2) Acquisitions (2) (3) Total Net Sales Total Net Sales Growth Wallboard Ceilings Steel Framing Other Products Total Net Sales Base Business Sales Growth Wallboard Ceilings Steel Framing Other Products Total Base Business Net Sales Note: Fiscal year end April 30. (1) When calculating our “base business” results, we exclude any branches that were acquired in the current fiscal year, prior fiscal year and three months prior to the start of the prior fiscal year. (2) FY18 quarterly sales from acquisitions have been updated in accordance with our presentation of base business for the FY19 vs. FY18 comparative period. (3) FY19 Q1 includes $87.4 million of Titan net sales. Pro forma net sales assuming Titan was acquired on May 1, 2017 was $767.8 million and $823.3 million for FY18 Q1 and FY19 Q1, respectively. 12 1Q182Q183Q184Q18 FY18 1Q19 $642$642$579$627 -678 $ 2,490 21 $681 97 $642$648$586$636 13.3%6.9%0.6%(0.8%) 15.5%19.0%10.5%9.3% 24.1%7.4%3.5%6.8% 19.8%10.2%7.4%5.6% $ 2,512 4.8% 13.6% 10.0% 10.5% $778 11.6% 16.2% 23.4% 40.7% 16.8%9.5%4.1%3.4% 4.9%3.0%(1.0%)(1.4%) 10.6%12.9%7.4%5.1% 10.0%2.3%3.6%5.5% 10.0%6.1%7.2%4.6% 8.3% 1.5% 9.0% 5.4% 7.0% 21.2% 2.5% 8.1% 16.1% 4.6% 7.8%5.1%2.9%2.0% 4.5% 6.1%
Quarterly Net Income to Adjusted EBITDA Commentary A. Represents non-cash compensation expenses related to stock appreciation rights agreements B. Represents non-cash compensation expense related to changes in the fair values of noncontrolling interests C. Represents non-cash equity-based compensation expense related to the issuance of share-based awards D. Represents severance and other costs permitted in calculations under the ABL Facility and the First Lien Facility E. Represents one-time costs related to our initial public offering and acquisitions paid to third party advisors, including fees to financial advisors, accountants, attorneys and other professionals as well as costs related to the retirement of corporate stock appreciation rights. F. Non-cash cost of sales impact of purchase accounting adjustments to increase inventory to its estimated fair value G. Mark-to-market adjustments for certain financial instruments H. Represents costs paid to third party advisors related to the secondary public offerings of our common stock I. Represents costs paid to third party advisors related to debt refinancing activities 13 Adjusted EBITDA Reconciliation ( $ in 000s) 1Q18 2Q18 3Q18 4Q18 (Unaudited) Net Income $ 15,343 $ 18,023 $ 19,686 $ 9,919 Add: Interest Expense 7,5007,9177,8718,107 Add: Write off of debt discount and deferred financing fees 74--- Less: Interest Income (23)(26)(44) (84) Add: Income Tax Expense (Benefit) 10,0609,983(4,488)5,328 Add: Depreciation Expense 5,9906,0236,0096,054 Add: Amortization Expense 10,35510,69010,4819,928 EBITDA $ 49,299 $ 52,610 $ 39,515 $ 39,252 Adjustments Stock appreciation rights expense (A)590642631455 Redeemable noncontrolling interests (B)866164340498 Equity-based compensation (C)473375429418 Severance and other permitted costs (D)2051137256 Transaction costs (acquisition and other) (E)15988753,049 (Gain) loss on disposal of assets (390)(207)(51)139 Effects of fair value adjustments to inventory (F)-1878948 Change in fair value of financial instruments (G)1962382765,415 Secondary public offerings (H)631-894-Debt transaction costs (I)72335-527 Total Add-Backs $ 3,453 $ 1,635 $ 2,690 $ 10,805 Adjusted EBITDA (as reported) $ 52,752 $ 54,245 $ 42,205 $ 50,057 FY18 1Q19 $ 8,650 16,188 - (236) 2,836 10,610 15,712 $ 53,760 334 531 404 4,836 4,753 (121) 4,129 6,019 - 627 $ 21,512 $ 75,272 $ 62,971 31,395 74 (177) 20,883 24,075 41,455 $ 180,676 2,318 1,868 1,695 581 3,370 (509) 324 6,125 1,525 1,285 $ 18,582 $ 199,258

LTM Net Income to Pro Forma Adjusted EBITDA Commentary ( $ in 000s) (Unaudited) Net Income 1Q19 LTM 2018 2017 2016 A. Represents non-cash compensation expenses related to stock appreciation rights agreements $ 56,278 $ 62,971 $ 48,886 $ 12,564 B. Represents non-cash compensation expense related to changes in the fair values of noncontrolling interests Add: Interest Expense Add: Write off of debt discount and deferred financing fees Less: Interest Income Add: Income Tax Expense Add: Depreciation Expense Add: Amortization Expense 40,083 - (390) 13,659 28,696 46,811 31,395 74 (177) 20,883 24,075 41,455 29,360 7,103 (152) 22,654 25,565 43,675 37,418 - (928) 12,584 26,667 37,548 C. Represents non-cash equity-based compensation expense related to the issuance of share-based awards D. Represents non-recurring expenses related specifically to the AEA acquisition of GMS EBITDA $ 185,137 $ 180,676 $ 177,091 $ 125,853 E. Represents severance and other costs permitted in calculations under the ABL Facility and the First Lien Facility Adjustments Stock appreciation rights expense Redeemable noncontrolling interests Equity-based compensation AEA transaction related costs Severance and other permitted costs Transaction costs (acquisition and other) (Gain) loss on disposal of assets AEA management fee Effects of fair value adjustments to inventory Change in fair value of financial instruments Secondary public offerings Debt transaction costs Total Add-Backs (A) (B) (C) (D) (E) (F) 2,062 1,533 1,626 - 5,212 7,964 (240) - 4,453 11,948 894 1,189 2,318 1,868 1,695 - 581 3,370 (509) - 324 6,125 1,525 1,285 148 3,536 2,534 - (157) 1,988 (338) 188 946 382 1,385 526 1,988 880 2,699 - 379 3,751 (645) 2,250 1,009 - 19 - F. Represents one-time costs related to our initial public offering and acquisitions (including the Acquisition) paid to third party advisors, including fees to financial advisors, accountants, attorneys and other professionals as well as costs related to the retirement of corporate stock appreciation rights. Also included are one-time bonuses paid to certain employees in connection with the Acquisition (G) (H) (I) (J) (K) G. Represents management fees paid to AEA, which were discontinued after the IPO H. Non-cash cost of sales impact of purchase accounting adjustments to increase inventory to its estimated fair value $ 36,642 $ 18,582 $ 11,138 $ 12,330 I. J. Mark-to-market adjustments for certain financial instruments Adjusted EBITDA (as reported) $ 221,779 $ 199,258 $ 188,229 $ 138,183 12,093 Contributions from acquisitions Pro Forma Adjusted EBITDA with Acquisitions (L) 64,321 1,280 9,500 Represents costs paid to third party advisors related to the secondary public offerings of our common stock $ 286,100 $ 200,538 $ 197,729 $150,276 K. Represents costs paid to third party advisors related to debt refinancing activities Conversion of GMS Operating Leases Pro Forma Adjusted EBITDA (M) 17,926 $ 304,026 L. Pro forma impact of earnings from acquisitions from the beginning of the LTM period to the date of acquisition, including synergies M. Represents the favorable impact to Adjusted EBITDA related to the amendment of existing GMS equipment operating leases to capital leases 14 Pro Forma Adjusted EBITDA Reconciliation

Reconciliation of Gross Profit to Adjusted Gross Profit Commentary A. Non-cash cost of sales impact of purchase accounting adjustments to increase inventory to its estimated fair value (Unaudited) ($ in millions) Gross Profit - Reported 1Q18 2Q18 3Q18 4Q18 1Q19 $ 205.1 $ 212.3 $ 195.4 $ 205.8 $ 244.8 Adjustments Effects of fair value adjustments to inventory Gross Profit - Adjusted Gross Margin - Adjusted (A) - 0.2 0.1 0.0 4.1 $ 205.1 $ 212.4 $ 195.5 $ 205.8 $ 248.9 31.9% 32.8% 33.4% 32.4% 32.6% 32.0% 15 FY2018 $ 818.6 0.3 $ 818.9 GAAP Gross Profit Reconciliation

Reconciliation of SG&A to Adjusted SG&A & Organic Adjusted SG&A Commentary A. Represents non-cash compensation expenses related to stock appreciation rights agreements B. Represents non-cash compensation expense related to changes in the fair values of noncontrolling interests Represents non-cash equity-based compensation expense related to the issuance of stock options C. D. Represents severance and other costs permitted in calculations under the ABL Facility and the First Lien Facility E. Represents one-time costs related to our initial public offering and acquisitions (including the Acquisition) paid to third party advisors, including fees to financial advisors, accountants, attorneys and other professionals as well as costs related to the retirement of corporate stock appreciation rights. Represents costs paid to third party advisors related to the secondary public offerings of our common stock F. G. Represents costs paid to third party advisors related to debt refinancing activities H. Represents SG&A incurred by any branches that were acquired in the current fiscal year, prior fiscal year and three months prior to the start of the prior fiscal year 16 GAAP SG&A Reconciliation

(1) FY 2019 Q1 LTM Pro Forma Adjusted EPS Reconciliation Assuming the effects of tax reform, the acquisition of Titan and the FY19 cost reductions were effective 7/1/2017, the table below reflects the estimated impact of both on Adjusted Net Income: ($ in millions, except share and per share data) (Unaudited) Pre-Tax Income (Loss) (2) EBITDA Add-backs (3) Cost synergies (4) FY19 Cost Reductions (5) Estimated Pro-forma Interest (6) Purchase Acct-Depr & Amort - Titan Legacy Purchase Acct-Depr & Amort - GMS/Titan deal Purchase Acct-Depr & Amort - AEA/GMS deal Adjusted Pre-Tax Income (7) Adjusted Income Tax Expense (8) Adjusted Net Income Effective Tax Rate - Pro-forma (9) Weighted average shares outstanding-Diluted (10) Adjusted Net income per share-Diluted Accretion vs. FY 2019 Q1 LTM Reported +4433..9% (1) For illustrative purpose only. Not prepared in accordance with Regulation S-X pro forma requirements. Actual results may vary. See “Forward-Looking Statement Safe Harbor” on page 2 of this presentation. (2) As reported in GMS’s FY18 Q2, FY18 Q3, FY18 Q4 and FY19 Q1 earnings release statements and WSB Titan 12/31/17 audited results adjusted for January through May 2018 unaudited results. (3) Titan EBITDA Add-Backs are related to agreements Titan has with former shareholders based on the achievement of certain performance measures as well as transaction-related costs. (4) Represents the projected run-rate annual pre-tax procurement synergies associated with the combined company’s enhanced scale. (5) Relates to the strategic cost reduction announced June 28th that is expected to generate annualized cost savings of approximately $20.0 million, offset by the amount realized during FY19 Q1 (6) Estimated pro forma interest expense. (7) As reported in GMS’s FY18 Q2, FY18 Q3, FY18 Q4 and FY19 Q1 earnings release statements (8) Calculated assuming all equipment was acquired under capital leases or purchased as opposed to operating leases and were, accordingly, 100% year-one tax deductible. (9) Normalized cash tax rate determined based on our estimated taxes for fiscal 2019 excluding the impact of purchase accounting and certain other deferred tax accounts (10)Includes the effect of 1.1 million shares of equity issued in connection with the acquisition of Titan that are exchangeable for the Company’s common stock. (11)Based on financial information provided by Titan, calculated using 12/31/17 audited financial statements rolled forward for January through May 2018’s unaudited results, as well as GMS tax adjustments. 17 FY19 Q1 LTM As Reported (2) GMS PF Adjustments (11) FY19 Q1 LTM GMS PF (1) $69.937 36.643 8.525 20.178 ($19.643) 18.901 10.000 19.000 (21.889) 14.298 25.575 $50.294 55.544 10.000 19.000 (21.889) 14.298 34.100 20.178 135.283 39.621 46.241 1.222 181.524 40.843 $95.661 29.3% 42,332 $2.26 $45.020 $0.99 $140.681 22.5% 43,273 $3.25 Commentary

Q&A


