Attached files
| file | filename |
|---|---|
| 8-K - 8-K - AAR CORP | a18-20028_18k.htm |
To be the best at designing and delivering technical, operational and financial solutions to enhance the efficiency and competitiveness of our commercial aviation and government customers Our Mission
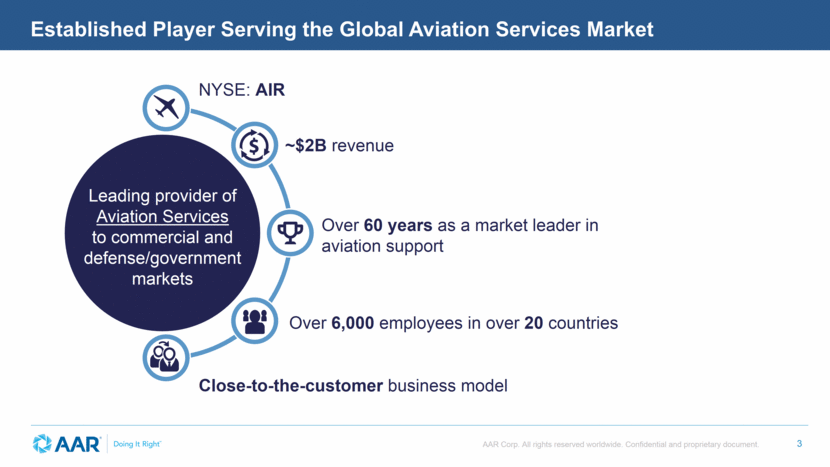
Established Player Serving the Global Aviation Services Market Leading provider of Aviation Services to commercial and defense/government markets NYSE: AIR ~$2B revenue Over 60 years as a market leader in aviation support Over 6,000 employees in over 20 countries Close-to-the-customer business model
Commitment to Strong Shareholder Returns Continued growth projected in revenue and earnings Leadership position in value-added Aviation Services markets Long-term favorable aftermarket growth trends Diverse global base of commercial and government customers Strong balance sheet with substantial available liquidity Strong growth in commercial and government programs Focus: Cash Flow Generation, Margin Improvement and ROIC Financial Highlights
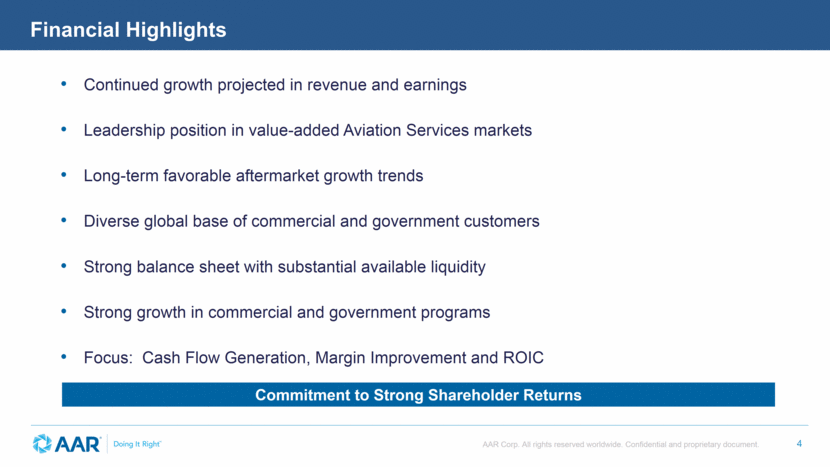
Aerial Transport Passengers & cargo Fleet management & operations GOCO Aviation Services Expeditionary Services Airframe Landing gear systems Components Engineering MRO SERVICES Trading OEM aftermarket solutions PARTS SUPPLY Commercial & government Flight hour programs Performance-based logistics (PBL) Total fleet services INTEGRATED SOLUTIONS Interior structures Flat panels Aerostructures COMPOSITES Mobile tactical shelter systems Pallets & containers Integrated command & control centers MOBILITY Company Overview
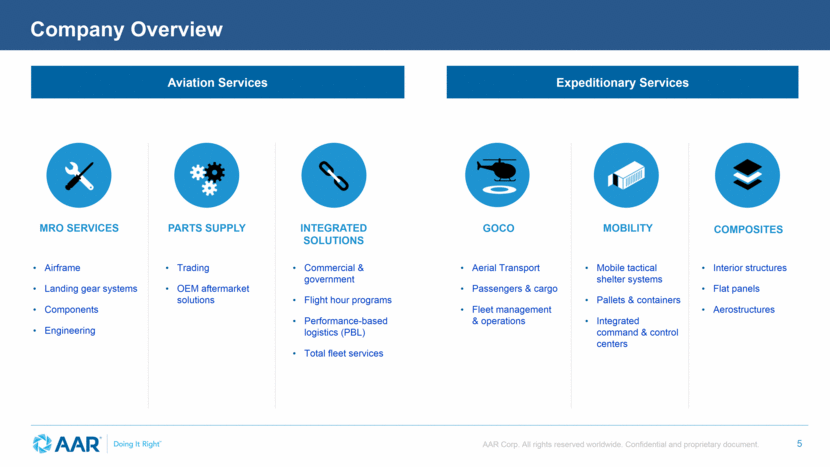
Parts Supply Inventory pooling with programs Transactional data collection Strategic relationship with OEMs MRO Strategic relationship with airlines Build technical repair knowledge and data collection Support integrated solutions with component repair Generates parts requirements Integrated Program Solutions Increase strategic relationship with airline MRO, OEMs and repair vendors through aggregated spend Fuel parts supply business Fund component repair capability development Long term contractual revenue Drive growth through best in class services within each discipline and leverage each to reinforce and grow the whole Unique Value Proposition to Drive Growth and Pricing Power Connected Businesses Strategy
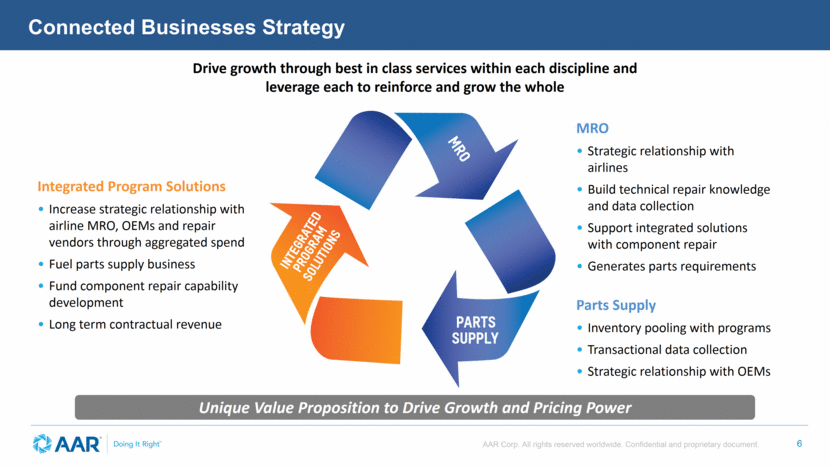
AAR Global Presence Strategically Located in Close Proximity to Key Customers Customers in over 100 Countries Over 60 Locations around the world
Strong Industry Relationships
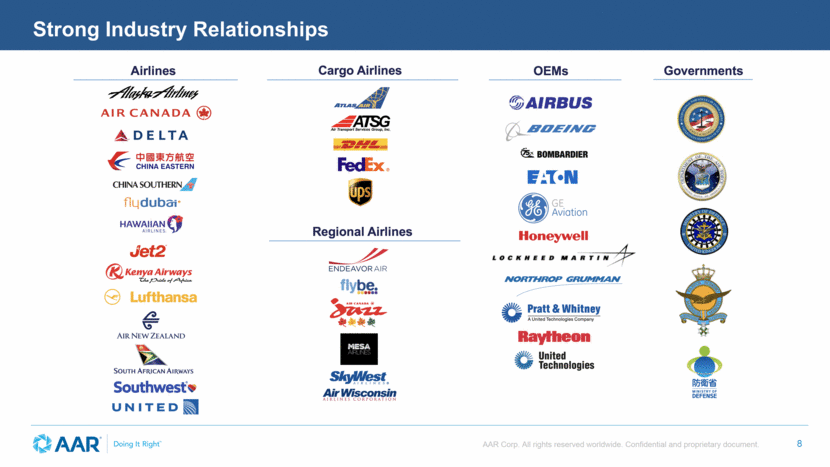
Largest trading company providing airframe and engine assets to airlines, MROs, component repair facilities, leasing companies and other parts providers Aviation Services Parts Trading and Distribution 80+ COUNTRIES PARTS SUPPLY (TRADING) Largest independent aviation distributor, serving as a commercial and government aftermarket channel multiplier under long-term agreements with component OEMs 7 STOCKING LOCATIONS 15 OEMs PARTS SUPPLY (DISTRIBUTION) 10,000 SHIPMENTS 1 MILLION PARTS 1,000 CUSTOMERS 200,000 PARTS 1,500 CUSTOMERS
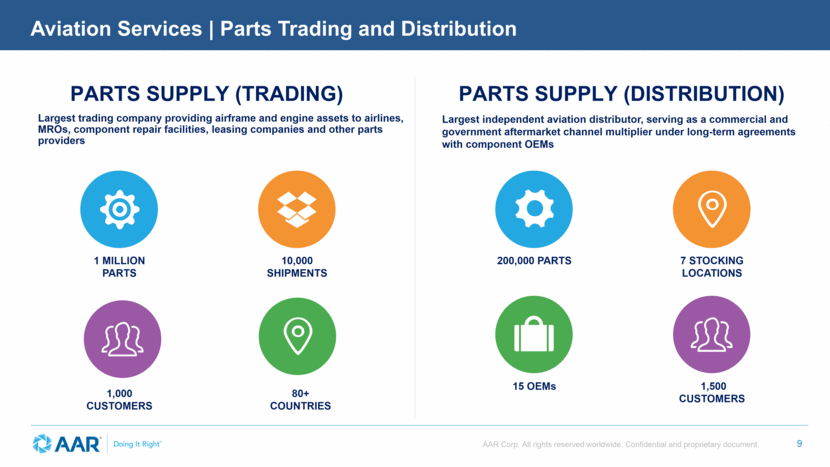
Largest independent and third largest power-by-the-hour (PBH) component repair, inventory pool access and logistics management provider in the world. Aviation Services Integrated Solutions (IS) 1,500 AIRCRAFT 41 AIRLINES 250,000 REPAIR TRANSACTIONS 24 COUNTRIES IS - COMMERCIAL Provide third party logistics, supply chain performance-based logistics (PBL) and contractor logistics support (CLS) to US Armed Services, Foreign Governments and OEMs 28 CONTRACTS 24 LOCATIONS 24 FLEETS $3B ASSETS MANAGED IS - GOVERNMENT
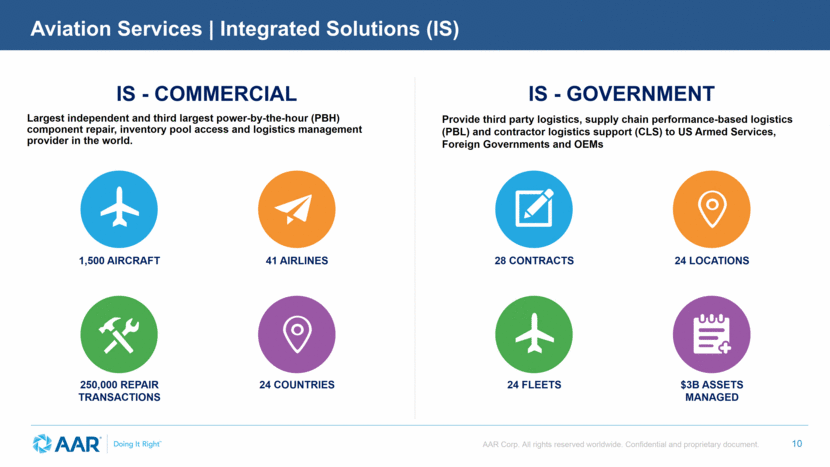
Aviation Services MRO Narrow & wide body 200,000 SF hangar ROCKFORD Narrow & wide body 226,000 SF in three hangars MIAMI OKLAHOMA CITY Regional & narrow body 300,000 SF Narrow & Wide body 143,000 SF hangar Narrow & wide body 1.1 Million SF INDIANAPOLIS Airframe Maintenance Facilities #1 MRO of the Americas >5.5M Man Hours 950+ Aircraft per year 3,000 Aircraft Maintenance Technicians 600+ Landing gears per year 24,000+ Components repaired annually Narrow-body 150,000 SF in three hangars TROIS-RIVIERES Regional & narrow body 80,000 SF DULUTH WINDSOR
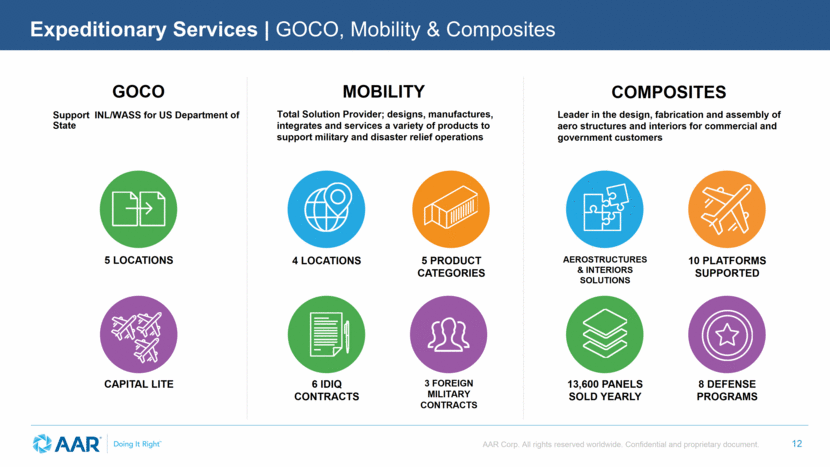
Support INL/WASS for US Department of State Expeditionary Services GOCO, Mobility & Composites 5 LOCATIONS GOCO Total Solution Provider; designs, manufactures, integrates and services a variety of products to support military and disaster relief operations 4 LOCATIONS 6 IDIQ CONTRACTS MOBILITY CAPITAL LITE 5 PRODUCT CATEGORIES 3 FOREIGN MILITARY CONTRACTS Leader in the design, fabrication and assembly of aero structures and interiors for commercial and government customers COMPOSITES 10 PLATFORMS SUPPORTED 13,600 PANELS SOLD YEARLY AEROSTRUCTURES & INTERIORS SOLUTIONS 8 DEFENSE PROGRAMS
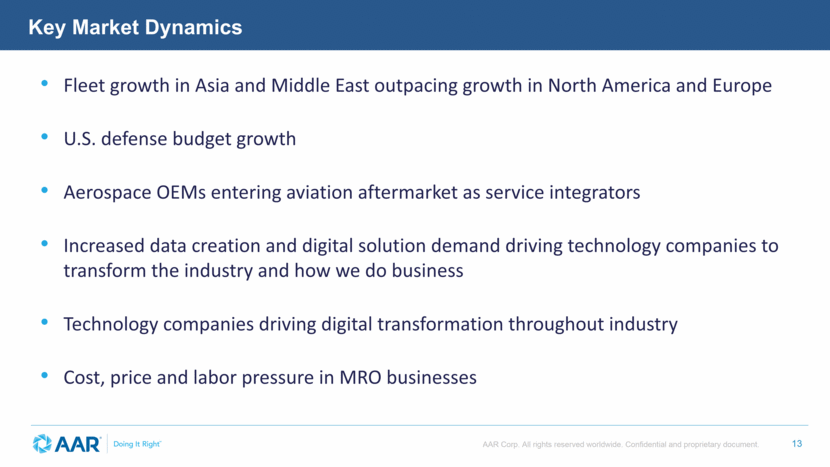
Key Market Dynamics Fleet growth in Asia and Middle East outpacing growth in North America and Europe U.S. defense budget growth Aerospace OEMs entering aviation aftermarket as service integrators Increased data creation and digital solution demand driving technology companies to transform the industry and how we do business Technology companies driving digital transformation throughout industry Cost, price and labor pressure in MRO businesses
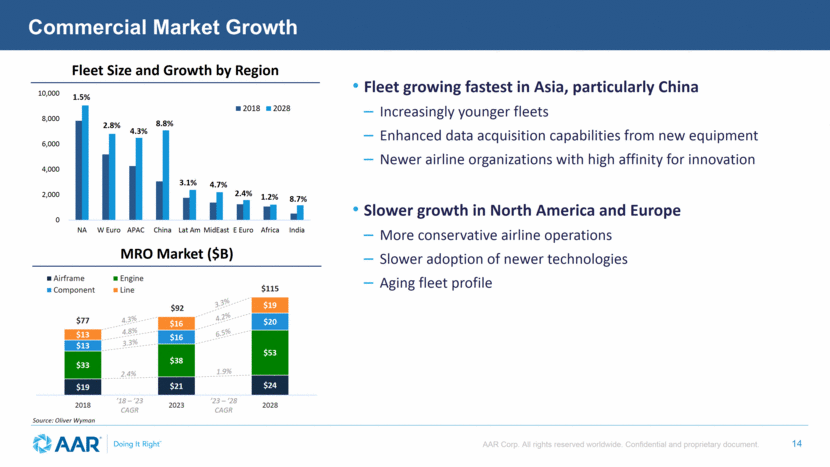
14 MRO Market ($B) Fleet Size and Growth by Region Source: Oliver Wyman Commercial Market Growth ’18 – ’23 CAGR ’23 – ’28 CAGR 2.4% 3.3% 4.8% 4.3% 1.9% 6.5% 4.2% 3.3% Fleet growing fastest in Asia, particularly China Increasingly younger fleets Enhanced data acquisition capabilities from new equipment Newer airline organizations with high affinity for innovation Slower growth in North America and Europe More conservative airline operations Slower adoption of newer technologies Aging fleet profile $19 $21 $24 $33 $38 $53 $13 $16 $20 $13 $16 $19 $77 $92 $115 2018 2023 2028 Airframe Engine Component Line 1.5% 2.8% 4.3% 8.8% 3.1% 4.7% 2.4% 1.2% 8.7% 0 2,000 4,000 6,000 8,000 10,000 NA W Euro APAC China Lat Am MidEast E Euro Africa India 2018 2028
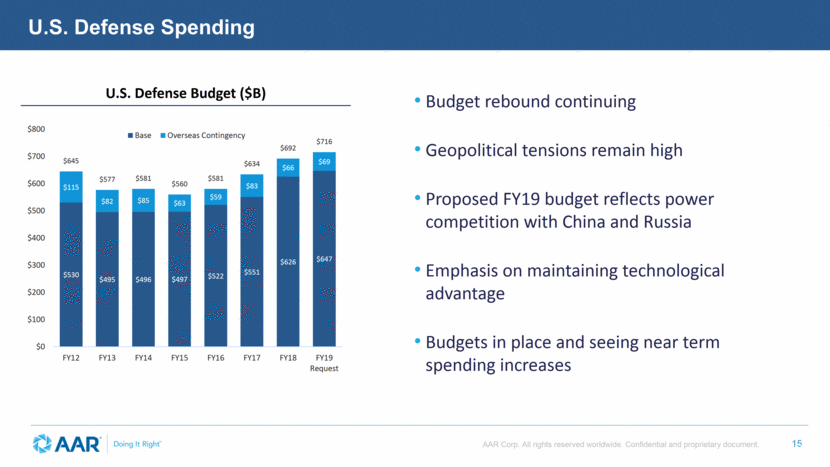
15 U.S. Defense Spending U.S. Defense Budget ($B) Budget rebound continuing Geopolitical tensions remain high Proposed FY19 budget reflects power competition with China and Russia Emphasis on maintaining technological advantage Budgets in place and seeing near term spending increases $530 $495 $496 $497 $522 $551 $626 $647 $115 $82 $85 $63 $59 $83 $66 $69 $645 $577 $581 $560 $581 $634 $692 $716 $0 $100 $200 $300 $400 $500 $600 $700 $800 FY12 FY13 FY14 FY15 FY16 FY17 FY18 FY19 Request Base Overseas Contingency
Execute through focus on customer satisfaction and cost leadership Pursue connected businesses that reinforce collective growth prospects Leverage data and digital to deliver better customer-focused solutions Expand margins through intellectual property Increase our global footprint into emerging markets Leverage our independence to provide flexible solutions Leading Independent Provider of Innovative Solutions to the Aviation Aftermarket AAR’s Strategic Imperatives
FY18 Financial Highlights Revenues were $1,748M compared to $1,591M in prior year Up $158M or 10% from the prior year AS revenues were $1,619M, up $134M or 9% over the prior year - Wind down of KC-10 contract resulted in a decrease in sales of $82M to $29M from $111M ES revenues were $129M, up $24M or 23% over the prior year Gross profit margin increased to 16.9% from 16.6% in the prior year Both AS and ES experienced increased gross profit margins in FY18 SG&A increased to $209M from $181M in the prior year Excluding severance/stock based compensation costs of $19.7M in FY18, Adjusted SG&A* as a % of sales was 10.8% compared to 10.6% in prior year Income from continuing operations of $73.7M in FY18 compared to $52.0M in the prior year Adjusted Diluted EPS* of $1.79 in FY18 which reflects a 17% increase over the $1.53 in FY17 *Reconciliations of Non-GAAP Financial Measures are included in the Appendix.
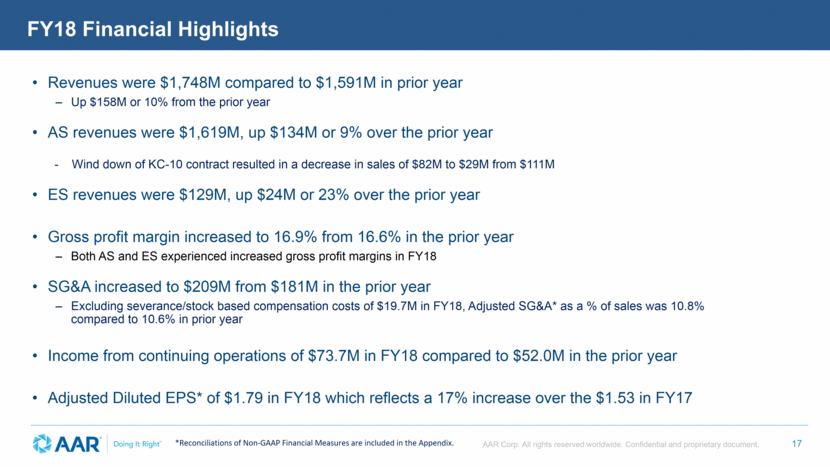
FY18 Income Statement Highlights *Reconciliations of Non-GAAP Financial Measures are included in the Appendix.
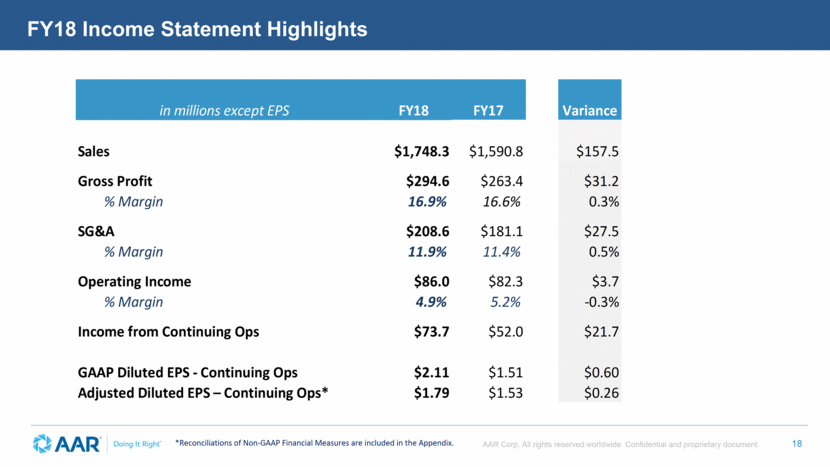
FY18 Segment Results AVIATION SERVICES in millions FY18 FY17 Variance Sales $1,618.9 $1,485.4 $133.5 Gross Profit $271.9 $246.0 $25.9 % Margin 16.8% 16.6% 0.2% EXPEDITIONARY SERVICES in millions FY18 FY17 Variance Sales $129.4 $105.4 $24.0 Gross Profit $22.7 $17.4 $5.3 % Margin 17.5% 16.5% 1.0%
in millions 5/31/18 5/31/17 Variance Accounts Receivable, net $202.0 $234.5 ($32.5) Inventories, net $460.7 $433.4 $27.3 Assets Supporting LT Programs $183.4 $159.6 $23.8 Assets of Disc Ops $125.0 $219.4 ($94.4) Total Assets $1,524.7 $1,504.1 $20.6 Net Debt* $147.8 $145.9 $1.9 Total Liabilities $588.4 $589.9 ($1.5) Total Equity $936.3 $914.2 $22.1 FY18 Capex of $22.0M; D&A of $40.5 Premier acquisition of $22.9M in Q2 Paid dividends of $2.6M Q4, $10.3M FY18 Balance Sheet solid with $442M of Availability on Credit Facility & AR Program Balance Sheet Highlights *Reconciliations of Non-GAAP Financial Measures are included in the Appendix.
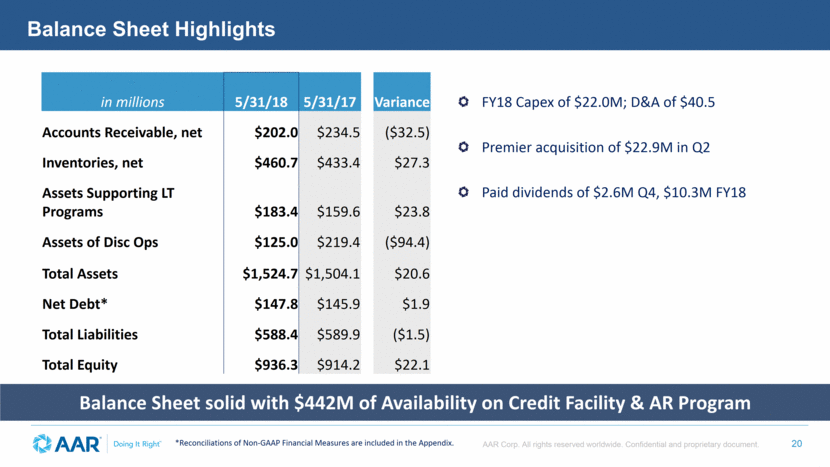
Financial Overview ADJUSTED EBITDA* ($ Millions) ADJUSTED EPS* ($ Millions) REVENUE Experiencing strong sales in our parts supply businesses while the summer in heavy maintenance is slower than expected Q1 FY19 sales growth expected to be low double digits year over year FY19 Guidance = Sales of $2.1BN to $2.2BN, Adjusted EBITDA of $180M to $190M, Adjusted EPS of $2.50 to $2.80 *Reconciliations of Non-GAAP Financial Measures are included in the Appendix. $2,100.0 - $1,590.8 $1,748.3 $2,200.0 FY17A FY18A FY19F $2.50 - $1.53 $1.79 $2.80 FY17A FY18A FY19F $180.0 - $127.2 $146.2 $190.0 FY17A FY18A FY19F
Q & A
Appendix
Adjusted diluted earnings per share from continuing operations, adjusted selling, general and administrative expenses, adjusted EBITDA, and net debt are “non-GAAP financial measures” as defined in Regulation G of the Securities Exchange Act of 1934, as amended (the “Exchange Act”). We believe these non-GAAP financial measures are relevant and useful for investors as they provide a better understanding of our actual operating performance unaffected by the impact of severance charges and other items. When reviewed in conjunction with our GAAP results and the accompanying reconciliations, we believe these non-GAAP financial measures provide additional information that is useful to gain an understanding of the factors and trends affecting our business and provide a means by which to compare our operating performance against that of other companies in the industries we compete. Adjusted EBITDA is income from continuing operations before interest expense, interest income, income taxes, depreciation and amortization, stock-based compensation and other items of an unusual nature including severance and gains on certain asset sales. Net debt represents total debt less cash and cash equivalents and we believe that the presentation of net debt provides useful information for management and investors to evaluate overall liquidity, financial flexibility, capital structure and leverage. Pursuant to the requirements of Regulation G of the Exchange Act, we are providing the following tables that reconcile the above mentioned non-GAAP financial measures to the most directly comparable GAAP financial measures: Non-GAAP Financial Measures
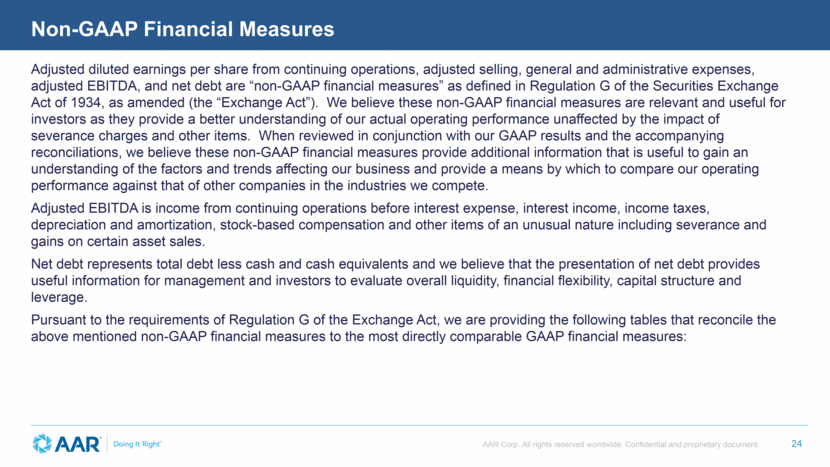
Non-GAAP Financial Measures Adjusted diluted earnings per share from continuing operations FY18 FY17
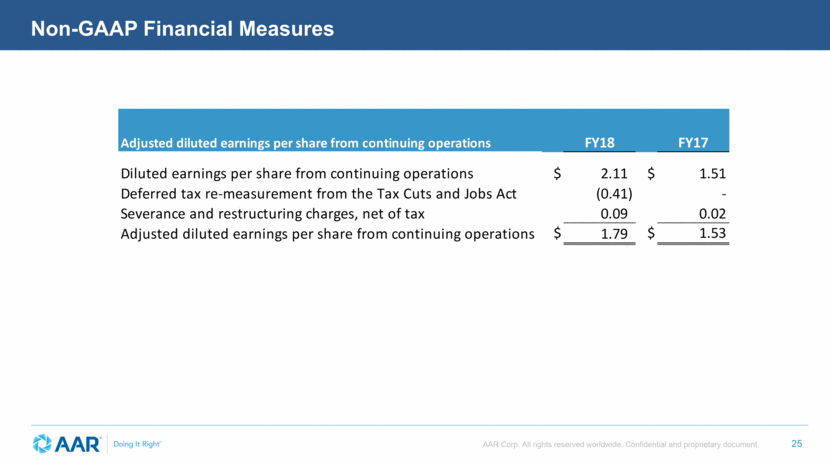
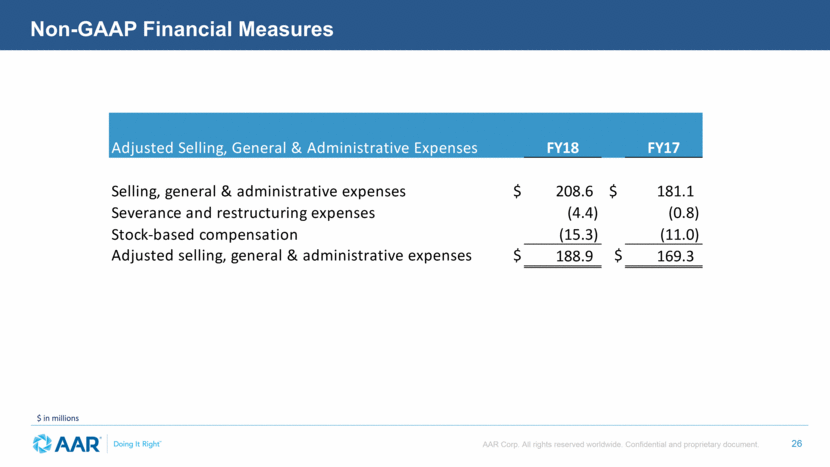
Non-GAAP Financial Measures $ in millions SIX MONTHS ENDED NOVEMBER 30, $ in millions 2017 2016 Expeditionary Services gross profit (loss) $ (38.4) $ 18.3 Impairment and other charges 51.6 - Expeditionary Services adjusted gross profit $ 13.2 $ 18.3 Consolidated gross profit (loss) $ 85.4 $ 127.7 Impairment and other charges 51.6 - Consolidated adjusted gross profit $ 137.0 $ 127.7 Selling, general and administrative expenses $ 102.8 $ 91.1 Less: Impairment and other charges 2.6 - Adjusted selling, general and administrative expenses $ 100.2 $ 91.1 Diluted earnings per share from continuing operations $ (0.35) $ 0.64 Impairment and other charges, net of tax 1.01 - Adjusted diluted earnings per share from continuing operations $ 0.66 $ 0.64 Adjusted Selling, General & Administrative Expenses FY18 FY17 Selling, general & administrative expenses $ 208.6 $ 181.1 Severance and restructuring expenses (4.4) (0.8) Stock-based compensation (15.3) (11.0) Adjusted selling, general & administrative expenses $ 188.9 $ 169.3
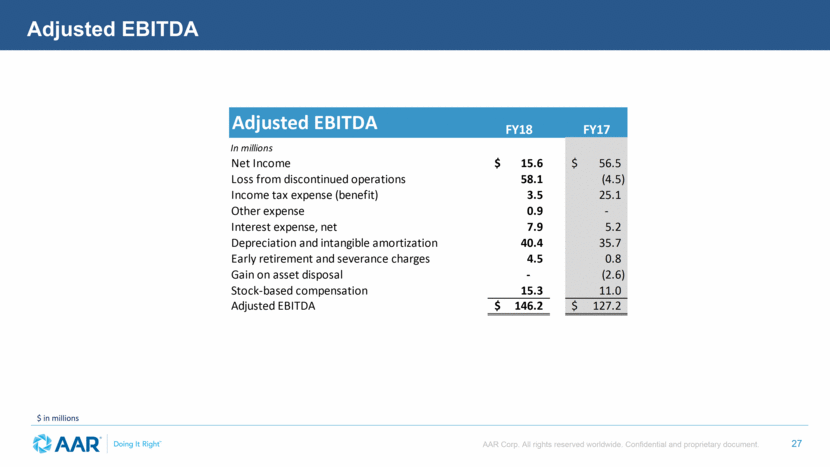
Adjusted EBITDA $ in millions Adjusted EBITDA FY18 FY17 In millions Net Income $ 15.6 $ 56.5 Loss from discontinued operations 58.1 (4.5) Income tax expense (benefit) 3.5 25.1 Other expense 0.9 - Interest expense, net 7.9 5.2 Depreciation and intangible amortization 40.4 35.7 Early retirement and severance charges 4.5 0.8 Gain on asset disposal - (2.6) Stock-based compensation 15.3 11.0 Adjusted EBITDA $ 146.2 $ 127.2
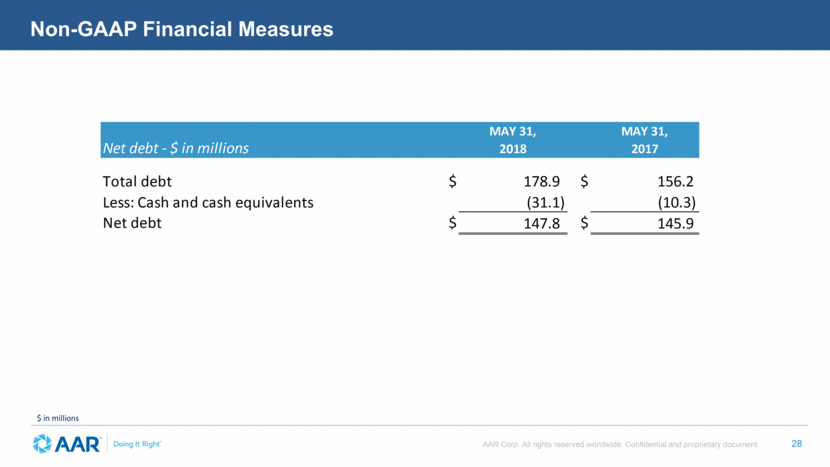
Non-GAAP Financial Measures $ in millions Net debt - $ in millions MAY 31, 2018 MAY 31, 2017 Total debt $ 178.9 $ 156.2 Less: Cash and cash equivalents (31.1) (10.3) Net debt $ 147.8 $ 145.9
