Attached files
| file | filename |
|---|---|
| 8-K - 8-K INVESTOR PRESENTATION 08 07 18 - U.S. CONCRETE, INC. | a8-kinvestorpresentation08.htm |
INVESTOR PRESENTATION August 2018
Forward-Looking Statements Certain statements and information provided in this presentation are “forward-looking statements” within the meaning of the Private Securities Litigation Reform Act of 1995. These forward-looking statements include, without limitation, statements concerning plans, objectives, goals, projections, strategies, future events or performance, and underlying assumptions and other statements, which are not statements of historical facts. These forward-looking statements are based on our current expectations and beliefs concerning future developments and their potential effect on us and do not include the impact of future acquisitions. While management believes that these forward-looking statements are reasonable as and when made, there can be no assurance that future developments affecting us will be those that we anticipate. Our forward-looking statements involve significant risks and uncertainties (some of which are beyond our control) and assumptions that could cause actual results to differ materially. The forward-looking statements speak only as of the date of this presentation. Investors are cautioned not to rely unduly upon these forward-looking statements. The Company undertakes no obligation to update these forward-looking statements, except as required by law. Important factors that could cause actual results to differ materially from those in the forward-looking statements include, but are not limited to, general economic and business conditions, which will, among other things, affect demand for new residential and commercial construction; our ability to successfully identify, manage, and integrate acquisitions; the cyclical nature of, and changes in, the real estate and construction markets, including pricing changes by our competitors; governmental requirements and initiatives, including those related to mortgage lending or mortgage financing, funding for public or infrastructure construction, land usage, and environmental, health, and safety matters; disruptions, uncertainties or volatility in the credit markets that may limit our, our suppliers' and our customers' access to capital; our ability to successfully implement our operating strategy; weather conditions; our substantial indebtedness and the restrictions imposed on us by the terms of our indebtedness; our ability to maintain favorable relationships with third parties who supply us with equipment and essential supplies; our ability to retain key personnel and maintain satisfactory labor relations; and product liability, property damage, and other claims and insurance coverage issues. For additional information regarding known material factors that could cause our actual results to differ from our projected results, please see “Risk Factors” in our Annual Report on Form 10-K and our Quarterly Reports on Form 10-Q filed with the Securities and Exchange Commission. All written and oral forward-looking statements in this presentation are expressly qualified by these “Risk Factors.” 1

U.S. Concrete, Inc. – Overview U.S. Concrete, Inc. (“USCR” or the “Company”) is a vertically Well-Structured Markets integrated national producer of ready-mixed concrete Top 3 position in each major market served1 ~1/3 of the aggregates consumed by USCR are sourced from internal production Ready-mixed concrete segment 198 standard and volumetric plants ~1,800 ready-mixed and volumetric concrete trucks 9.4 million cubic yards sold in the twelve months ending 06/30/18 Aggregates segment 19 operating facilities; 7 distribution terminals ~270 million tons of owned and leased reserves Ready-Mixed Concrete U.S. Virgin Islands Financial Overview Volumetric Concrete LTM 06/30/18 Revenue: $1,428.0 million Aggregates Facilities LTM 06/30/18 Adjusted EBITDA: $192.0 million2 Market capitalization of ~$0.8 billion and enterprise value of Recycled Aggregates Corporate Headquarters 3 ~$1.5 billion Agg Distribution Terminals Vertically Integrated Operations Revenue Mix by Region (LTM 06/30/18) Ready-Mixed Volume by End Market (LTM 06/30/18) EBITDA by Segment (LTM 06/30/18) Western / Other Ready-mixed Southern S 4% Northern Concrete Texas Commercial & Residential C Texas 76% 11% Industrial 27% 24% 55% New York / Aggregates New Jersey / DC & Aggs Related Northern Street, Highway & 35% 22% California Other Public Works 26% 18% Other 2% 1 Based on management estimates of cubic yards volume of ready-mixed concrete produced during the twelve months ended June 30, 2018 after giving pro-forma effect for acquisitions through June 30, 2018. 2 Adjusted EBITDA is a non-GAAP financial measure. See page 30 for a reconciliation to net income from continuing operations. 3 As of August 3, 2018 2

Growth of Regional Footprint Atlantic Region Financial Services/ West Region Government Technology 26 50 5 1 5 Brands 8 2011 Current 2 Acquisitions 15 113 198 5 Brands 4 Acquisitions Texas/Oklahoma 7 19 Diversified 0 7 118 ~800 ~1800 11 U.S. Virgin Islands Brands 5 4 2 13 Acquisitions 2 Brands 2 Acquisitions Ready-Mixed Concrete Aggregates Producing Facilities Operating Facilities Aggregates Distribution Terminals Note: Acquisitions of Companies Acquired Since 2014 3

Regional Market: Metro NYC New York City 17 Plants Serving five boroughs Commercial / Residential / Infrastructure Focus Complex Urban Operating Environment Significant Labor Union Position Active / Well Structured Market Ready-Mixed Concrete Operating Facilities Aggregates Producing Facilities Aggregates Distribution Terminals 4

Regional Market: Bay Area San Francisco Bay Area 26 Plants Serving the Bay Area Commercial and Residential Focus Complex Urban Operating Environment Defensible Market Position Significant Labor Union Position Ready-Mixed Concrete Operating Facilities Aggregates Distribution Terminal 5

Regional Market: Dallas / Fort Worth Dallas / Fort Worth 31 Plants Serving DFW Diversified Construction Market Population Growth Vibrant Plano / Frisco Area Standard and Volumetric Concrete Offerings Large Integrated Producer Competitors Ready-Mixed Concrete Operating Facilities Aggregates Producing Facilities Corporate Headquarters 6

Strategic Position in Attractive Markets Experienced Management Team with Long-Term Top 1,2 or 3 Position in Strategic Focus Well-Structured Vertical Integration into Markets with Attractive Aggregates Enhances Fundamentals Value Chain Top Supplier to Long-Term Diversified Commercial Projects Industry Leading Customer Base Across with High Margins Sectors and Regions Performance Successful Track Record of Acquisition Purchasing Power Due Integration and a to Size in Highly Robust Pipeline Fragmented Markets Disciplined Pricing Strong Financial Mechanics Drive Performance, Superior Margin Conservative Balance Performance Through Sheet and Solid the Cycle Returns on Capital 7

Focused Strategy Translates into Industry-Leading Returns on Capital Favorable Industry Dynamics Superior Margin Performance (Material Spread Margin)1 Favorable markets with attractive fundamentals USCR ready-mixed concrete segment U.S. ready-mixed concrete industry 2 Leading market positions Low-cost producer Attractive construction material categories 49.8% 49.2% 49.5% 47.8% 45.9% 46.6% 45.0% 45.3% 44.4% 44.0% 43.9% 44.6% Unique Business Attributes Focus on commercial projects with high margins 2012 2013 2014 2015 2016 2017 Vertically integrated value chain Industry-Leading Returns on Capital3 Sustainability leadership U.S. Concrete Publicly traded peers 3, 4 Attractive Financial Profile Improving pricing over last six years 13.0% 10.9% Accretive acquisitions 9.1% 7.6% 6.0% 5.6% 6.1% 5.7% Prudent leverage with ample liquidity 4.1% 1.7% 2.8% 2.8% Efficient capital allocation 2012 2013 2014 2015 2016 2017 1 Material spread margin defined as (revenue – raw material costs) / revenue 2 Source: National Ready Mixed Concrete Association (“NRMCA”) and management estimates 3 Return on capital defined as net operating profit after tax / average of beginning and ending debt and book equity (pro-forma for 2017 acquisitions) 4 Publicly traded peers consist of Martin Marietta Materials, Summit Materials and Vulcan Materials 8

Top Supplier to Commercial Projects with High Margins Selected precedent commercial projects Project and Location Cubic Yards Status 1. Facebook NA-4 Data Center – Fort Worth, TX 382,000 In Progress 2. LaGuardia Airport1 – Queens, NY 375,000 In Progress 3. I-35W – Ft. Worth, TX 170,000 In Progress 4. Google Bayview Campus – Mountain View, CA 125,000 In Progress 5. The Union Tower – Dallas, TX 112,000 In Progress 6. Grandscape – The Colony, TX 92,000 In Progress 7. Dallas Love Field Parking Garage – Dallas, TX 87,000 In Progress 8. Goethals Bridge – Staten Island, NY 85,000 In Progress 9. Charles Schwab Westlake Campus – Westlake, TX 80,000 In Progress 10. The Village Town Center – Dallas, TX 80,000 Backlog 11. Workday Campus – Pleasanton, CA 70,000 In Progress 12. Gotham 1 & 3 – Queens, NY 70,000 In Progress 13. Manhattan West Tower – Manhattan, NY 70,000 In Progress 14. Hudson Yards Tower E – Manhattan, NY 65,000 In Progress 15. Pioneer Natural Resources – Irving, TX 64,000 In Progress 1 Joint venture with a third-party supplier Higher Margins due to Rigorous Specifications, Complex Projects, High Customization Requirements and Significant Plant and Truck Capacity Demands 9

Growth Opportunity with Cycle Far From Peak GDP, Infrastructure catalysts for continued growth Growth Drivers 500 • U.S. Population • 1997 – 272.6 million Avg. 441 US Production • 2017 – 325.7 million • GDP • 1997 – 11.2 trillion • 2017 – 17.3 trillion 400 • Infrastructure & Highway Spending • Attractive MSA markets Avg. 339 300 457 458 432 415 391 396 406 404 372 390 200 348 352 351 343 336 325 290 300 266 Volume (in mm cubic yards (“CYDs”)) yards cubic mm (in Volume 259 257 100 0 1997 1998 1999 2000 2001 2002 2003 2004 2005 2006 2007 2008 2009 2010 2011 2012 2013 2014 2015 2016 2017 Source: NRMCA 10
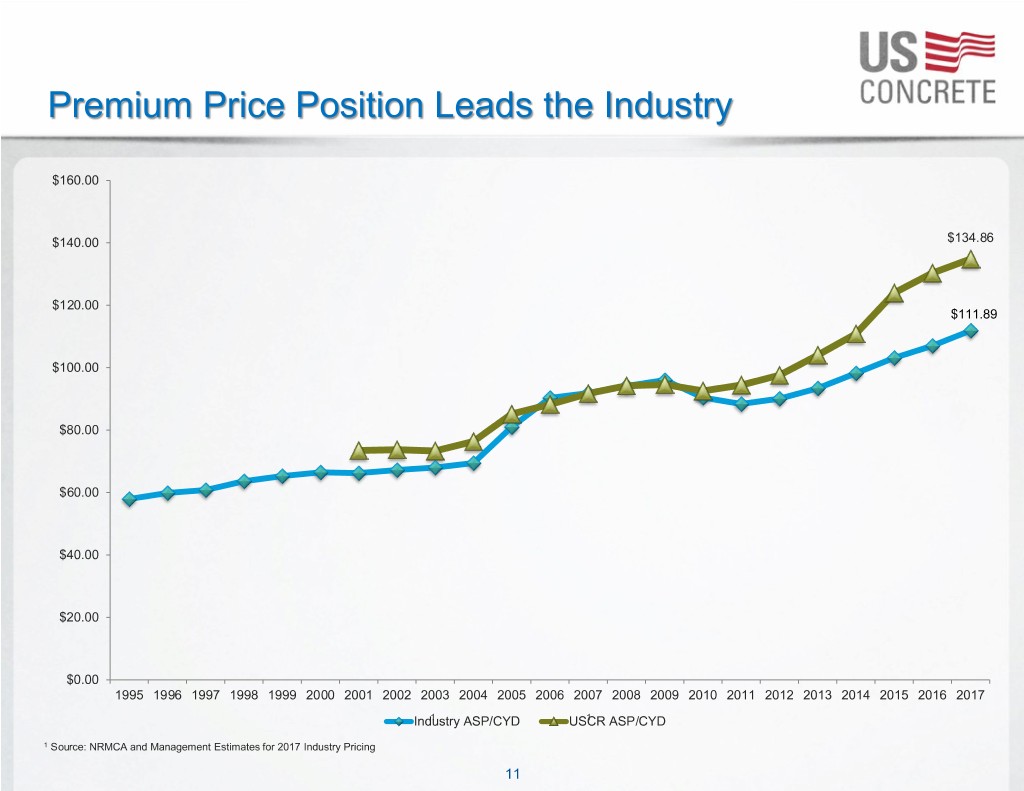
Premium Price Position Leads the Industry $160.00 $140.00 $134.86 $120.00 $111.89 $100.00 $80.00 $60.00 $40.00 $20.00 $0.00 1995 1996 1997 1998 1999 2000 2001 2002 2003 2004 2005 2006 2007 2008 2009 2010 2011 2012 2013 2014 2015 2016 2017 Industry1 ASP/CYD USCR1 ASP/CYD 1 Source: NRMCA and Management Estimates for 2017 Industry Pricing 11

Experienced Management Team Driving Sustainable Business Improvement Executive leadership focused on positioning the business for continued success Demonstrated commitment to focus on highly attractive geographies and end markets with superior margin projects Dallas, New York and San Francisco are among the strongest commercial and residential construction markets Commercial construction orientation requires greater technical expertise and product capabilities Synergistic acquisitions within existing footprint or in geographies with defensible market positions Margin results supported by achieved shift in concrete pricing and material margin spread Average price per cubic yard was ~$23 greater than industry in 2017 Average price was in line with industry in 2009 Material margin has increased from $43/cubic yard in 2009 to $66/cubic yard LTM 06/30/18 Material margin in prior downturn (2007 to 2009) increased from $40/cubic yard to $43/cubic yard Greater vertical integration of aggregates business enhances Adjusted EBITDA margins Internal requirements are ~1/3 filled from USCR quarries in markets with aggregates positions External aggregates sales for 2017 were approximately $27.9mm higher than 2009 Sales of aggregates provide Adjusted EBITDA margins greater than 20% LTM ($mm) 2007 2009 2017 06/30/18 Commentary Revenue $803.8 $534.5 $1,336.0 $1,428.0 Greater scale Adjusted EBITDA2 $75.4 $17.4 $192.3 $192.0 Higher profitability Adjusted EBITDA margin2 9.4% 3.2% 14.4% 13.4% Improved EBITDA margins Stable spreads during downturn, Material spread margin ($ / cubic yard) ~$40 ~$43 ~$67 ~$66 and better material spread margins today Steady volume, now with Ready-mixed sales volume (mm cubic yards) ~7.6 ~3.9 ~9.0 ~9.4 differentiated composition Leverage1 4.0x 17.0x 3.5x 3.8x Lower leverage 1 Defined as net debt / Adjusted EBITDA 2 2007 and 2009 reflect total consolidated results; 2017 and LTM 06/30/18 reflect results from continuing operations 12

Ready-Mixed Top-Line Drivers 10,000 $160 9,000 $140 $135.26 8,000 $120 7,000 6,000 $100 MMS / ASP $92.23 9,350 9,030 8,984 8,913 8,786 5,000 8,407 8,122 7,821 7,684 $80 7,525 Volume (in 000’s CYD) 7,038 4,000 6,523 5,999 5,719 5,696 5,575 $60 5,442 5,347 3,000 5,225 5,067 5,194 4,839 4,958 4,674 4,335 4,554 3,835 3,934 3,809 4,047 2,000 $40 Q1 Q2 Q3 Q4 Q1 Q2 Q3 Q4 Q1 Q2 Q3 Q4 Q1 Q2 Q3 Q4 Q1 Q2 Q3 Q4 Q1 Q2 Q3 Q4 Q1 Q2 Q3 Q4 Q1 Q2 '11 '11 '11 '11 '12 '12 '12 '12 '13 '13 '13 '13 '14 '14 '14 '14 '15 '15 '15 '15 '16 '16 '16 '16 '17 '17 '17 '17 '18 '18 LTM Volume (CYDs in 000's) LTM ASP (per CYD) LTM Material Margin (per CYD) 13

Vertical Integration Into Aggregates Enhances the Value Chain Aggregates primary focus is supply of U.S. Key focus of acquisition strategy Concrete’s ready-mixed concrete operations 19 aggregates producing facilities, Aggregates exposure generates higher one recycling operation, seven distribution overall consolidated margins terminals ~270 million tons of owned and leased Vertical integration enhances market reserves dynamics Provides stable supply and strategic Aggregates used in USCR’s ready-mixed concrete Pro Forma for Acquisition advantage operations, LTM 06/30/18 Improves overall purchasing power Internally Internally sourced sourced Increases precision in bidding for new 29% 40% projects Externally Externally sourced & sourced & acquisition acquisition opportunities opportunities 71% 60% USCR Becoming More Vertically Integrated 14

Significant Industry Consolidation Opportunities Exist to Enable Scaling of Ready-Mixed Business Deal opportunities remain robust Ready-Mixed Concrete Market Size for U.S. (2017) USCR is an acquirer of choice in established markets through decades long relationships amongst local and national management teams Aggregates provide additional expansion opportunities and Annual Revenue $30.0 B strengthen vertically integrated Ready-Mixed capabilities Concrete Producers 2,200 Increasing vertical integration of Ready-Mixed 6,500 cement, aggregates and concrete Concrete Plants producers represents favorable Source: NRMCA; IBISWorld market dynamic 15

Focused and Disciplined Acquisition Strategy Local Continue to expand within existing regional markets through ready-mixed Opportunity concrete bolt-ons and vertical integration into aggregates Regional Expand concentrically around existing regions Opportunity Selected larger-scale opportunities in new geographies National Strong, stable markets with promising growth profiles Opportunity Appealing market structures Defensible positions of scale with barriers to entry Successful Deal Track Record with Significant Consolidation Pipeline 16

Successful Track Record of Acquisitions with Significant Consolidation Pipeline Acquisitions continue to accelerate Adjusted EBITDA growth Adjusted EBITDA, LTM 06/30/18 Completed 34 ready-mixed concrete and aggregates acquisitions since 2014 Sourcing, executing and integrating acquisitions is a core competency of USCR Organic 55% Market position limits impact of cyclicality Acquired Since 2014 Proven ability to integrate acquired companies, vertically integrate operations, enhance 45% margins and generate attractive returns Recent Notable Acquisitions Golden Spread Redi-Mix 10 fixed ready-mixed concrete plants, 5 portable plants, 1 producing aggregates facility Amarillo, TX (Mar. 2018) Expands Ingram’s footprint further into West Texas with a vertically integrated operation Bella Trucking Corp. 1 ready-mixed concrete plant – 12 mixer trucks and 10 tri-axle dump trucks Philadelphia, PA (Mar. 2018) Expanded position in Philadelphia area On Time Ready Mix 1 ready-mixed concrete plant – 22 mixer trucks Flushing, NY (Jan. 2018) Expanded geographic coverage in New York metropolitan area, focused on servicing Queens 1 active aggregate quarry with 110 million tons of reserves (2 additional undeveloped quarries) Polaris Materials Corporation 2 aggregates distribution terminals Vancouver, BC (Nov. 2017) Enhances vertical integration and access to supply constrained West Coast markets Action Supply 2 ready-mixed concrete plants – 22 mixer trucks Philadelphia, PA (Sept. 2017) Expands East Coast footprint into Philadelphia metropolitan market Harbor Ready-Mix / A-1 Materials 2 ready-mixed concrete plants – 23 mixer trucks San Francisco, CA (Sept. 2017) Bolsters position in San Francisco's Peninsula and South Bay Corbett Aggregates 1 aggregates facility – 401 acres of land with over 35 million tons of proven reserves Quinton, NJ (Apr. 2017) Furthers vertical integration strategy supporting the New York metropolitan market Kings Ready Mix 4 ready-mixed concrete plants – 62 mixer trucks Brooklyn, NY (Aug. 2016) Strengthened position in New York metropolitan area 17
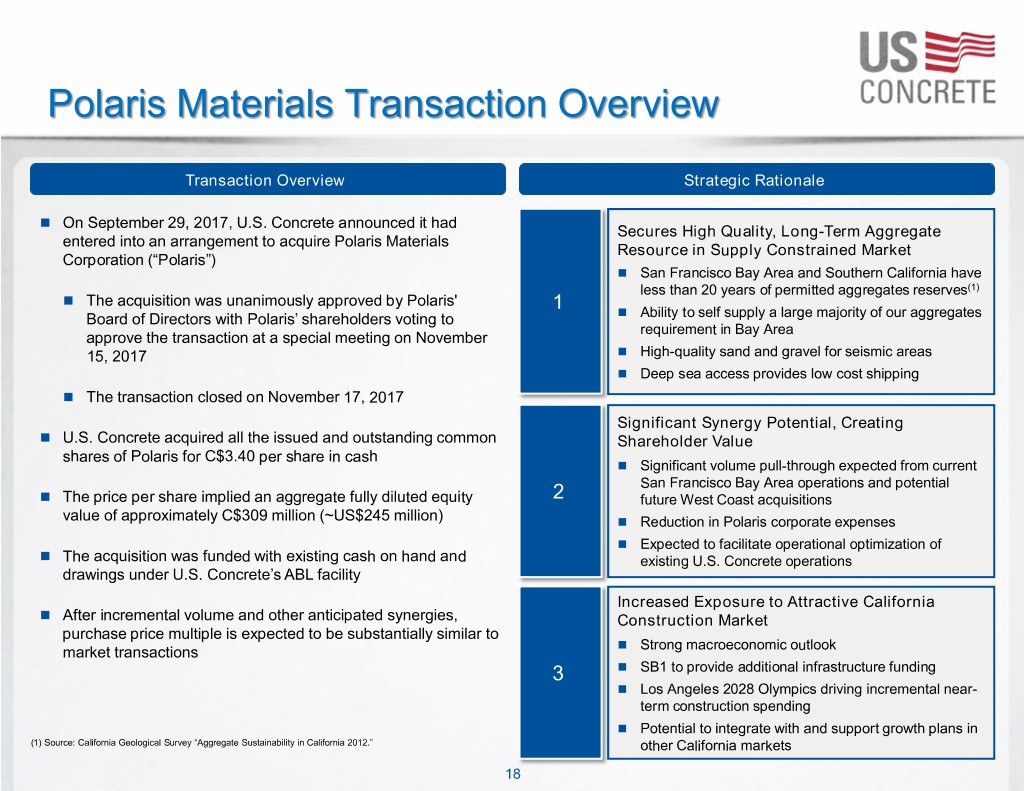
Polaris Materials Transaction Overview Transaction Overview Strategic Rationale On September 29, 2017, U.S. Concrete announced it had Secures High Quality, Long-Term Aggregate entered into an arrangement to acquire Polaris Materials Resource in Supply Constrained Market Corporation (“Polaris”) San Francisco Bay Area and Southern California have less than 20 years of permitted aggregates reserves(1) The acquisition was unanimously approved by Polaris' 1 Board of Directors with Polaris’ shareholders voting to Ability to self supply a large majority of our aggregates requirement in Bay Area approve the transaction at a special meeting on November 15, 2017 High-quality sand and gravel for seismic areas Deep sea access provides low cost shipping The transaction closed on November 17, 2017 Significant Synergy Potential, Creating U.S. Concrete acquired all the issued and outstanding common Shareholder Value shares of Polaris for C$3.40 per share in cash Significant volume pull-through expected from current San Francisco Bay Area operations and potential The price per share implied an aggregate fully diluted equity 2 future West Coast acquisitions value of approximately C$309 million (~US$245 million) Reduction in Polaris corporate expenses Expected to facilitate operational optimization of The acquisition was funded with existing cash on hand and existing U.S. Concrete operations drawings under U.S. Concrete’s ABL facility Increased Exposure to Attractive California After incremental volume and other anticipated synergies, Construction Market purchase price multiple is expected to be substantially similar to Strong macroeconomic outlook market transactions 3 SB1 to provide additional infrastructure funding Los Angeles 2028 Olympics driving incremental near- term construction spending Potential to integrate with and support growth plans in (1) Source: California Geological Survey “Aggregate Sustainability in California 2012.” other California markets 18

1 Secures High Quality, Long-Term Aggregates Resource in Supply-Constrained Market Overview Aggregates Resource Depletion(1) % of 50-Year Demand Permitted Time to San Francisco Bay and Los Angeles 50-Year Demand area current sourced aggregate Location Permitted Reserves Depletion reserves are expected to only cover the San Francisco Bay Area next 11 – 20 years of demand before (1) Northern San depletion without supplemental 521 110 11 – 20 Years material from Polaris Francisco Bay Particularly acute shortages are South San 1,381 404 11 – 20 Years expected in some of USCR’s key ready- Francisco Bay mixed concrete markets of San Jose and the West Bay, which are markets that Los Angeles / Long Beach Polaris is expected to serve economically San Fernando Valley – Saugus 476 77 <10 Years The Polaris acquisition should allow Newhall USCR to internally source the majority of San Gabriel its San Francisco Bay Area aggregates 809 322 11 – 20 Years requirements Valley USCR to move to a net long aggregates Claremont – 203 109 21 – 30 Years position on the West Coast Upland Low cost shipping via Panamax vessels should provide competitively priced San Bernardino 993 241 11 – 20 Years product to the West Coast and Hawaii High-quality sand and gravel ideal for use in high-strength seismic applications Temescal Valley 1,077 297 11 – 20 Years Permitted Aggregates 50-Year Demand Not Met By (1) Source: California Geological Survey “Aggregate Sustainability in California 2012.” Reserves Existing Permitted Reserves 19

2 Significant Synergy Potential, Creating Shareholder Value Synergies Pro Forma San Francisco Bay Area Footprint Volume Pull-Through from Current San Francisco Bay Area Operations and Potential Future Acquisitions Increased production at the Orca Quarry expected to San Pablo Bay 1 deliver meaningful operating leverage benefits Reduction of costs of third-party supplied materials Anticipated incremental volume from potential future Richmond acquisitions Terminal San Reduction in Polaris Corporate Costs Francisco Pier 92 Terminal Removal of public listing costs 2 San Francisco Bay Lower SG&A overhead costs by integrating into the USCR platform Redwood City Terminal Anticipated Operational Optimization at Polaris and Existing U.S. Concrete Operations 3 Concrete mix design improvements Logistics optimization U.S. Concrete Polaris Harbor Ready- Bridge Ready-Mixed Terminal Mix & A-1 Concrete Plant 3rd Party Materials(1) Terminal (1) Acquired in October 2017. 20

3 Increased Exposure to Attractive California Markets Strong Macroeconomic Outlook California SB 1 Los Angeles 2028 Olympics 2016 – 2020E Construction Value CAGR(1) “State Legislators Approve $52 Billion Transportation Plan to Repair 11.7% California’s Ailing Roads” 6.8% – Los Angeles Times Residential Non-Residential U.S. FAST Act expected to contribute to On April 6, 2017, Governor, Senate, and On September 13, 2017, the 9.6% growth in California’s cumulative Assembly leaders approved the Road International Olympic Committee aggregate demand during its life Repair and Accountability Act, which will awarded Los Angeles host of the 2028 While San Francisco – San Jose corridor provide $52 billion over 10 years on Summer Olympic Games after initially (“Silicon Valley”) continues to lead infrastructure spending bidding for the 2024 Games regional construction activity, north and New bill increases state funded Estimated budget of $5.3 billion with east bay markets showing signs of transportation spending by 35% above detail, including construction spend, to improvement current levels with the benefits of SB 1 be released in coming months Los Angeles seeing highest construction expected to start being realized in 2H18 International Olympic Committee has activity levels since 1920s, driving an Estimated $34 billion of the first $52 pledged $1.8 billion to the Los Angeles increased pool of potential large and high billion raised will go toward repairing organizing committee specification projects roads, bridges, highways, and culverts Current plan utilizes existing large sports venues, with construction focused on regional infrastructure and facility (1) Source: State of California Department of Finance. improvements 21

Financial Performance and Conservative Balance Sheet Sales Volume (‘000) Average Selling Price Ready-Mixed (CYDs) Aggregates (Tons) Ready-Mixed ($/CYD) Aggregates ($/ton) 8,984 9,350 8,611 8,122 6,197 $135.26 7,038 $130.35$134.86 $123.98 5,225 5,696 5,563 4,839 4,919 $110.85 4,047 4,650 $12.92 3,597 $104.03 2,741 3,407 $94.47 $97.59 $11.97 $11.95 $10.54 $8.84 $9.40 $7.46 $7.89 Revenue ($mm) Adjusted EBITDA from Continuing Operations ($mm) $1,336 $1,428 $1,168 $192 $192 $975 $160 $132 $704 $598 $428 $517 $78 $49 $12 $26 22
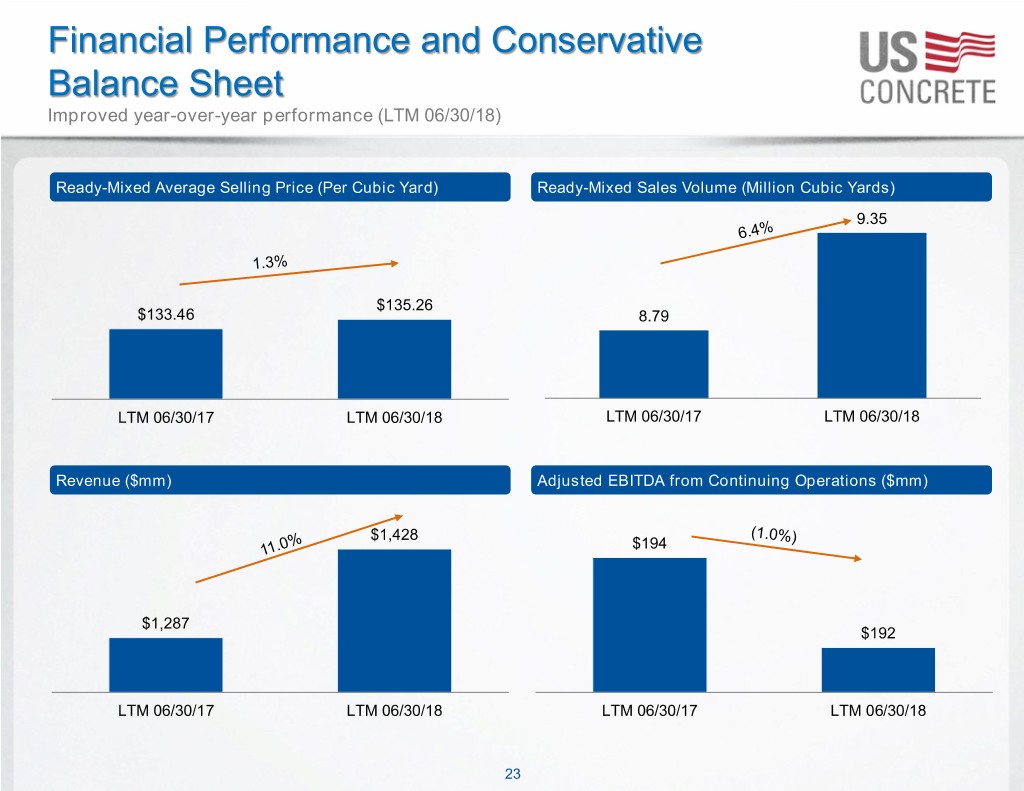
Financial Performance and Conservative Balance Sheet Improved year-over-year performance (LTM 06/30/18) Ready-Mixed Average Selling Price (Per Cubic Yard) Ready-Mixed Sales Volume (Million Cubic Yards) 9.35 $135.26 $133.46 8.79 LTM 06/30/17 LTM 06/30/18 LTM 06/30/17 LTM 06/30/18 Revenue ($mm) Adjusted EBITDA from Continuing Operations ($mm) $1,428 $194 $1,287 $192 LTM 06/30/17 LTM 06/30/18 LTM 06/30/17 LTM 06/30/18 23

Capitalization As of 06/30/2017 As of 06/30/2018 Actual xAdjusted xAdjusted ($mm) Amt. Amt. EBITDA3 EBITDA3 Cash and cash equivalents $271.7 $21.5 $350 mm ABL Revolver due 2022 (“ABL Facility”) 1 60.4 0.3x New Senior Unsecured Notes due 2024 (“2024 Unsecured Notes”) 610.7 3.1x 609.1 3.2x Other debt 63.1 0.3x 81.0 0.4x Total debt $673.8 3.4x $750.6 3.9x Net debt 402.1 2.1x 729.0 3.8x Market value of equity2 (as of 08/03/2017 or 08/03/2018) 1,241.2 6.4x 782.0 4.1x Total capitalization $1,915.0 9.8x $1,532.5 8.0x Enterprise value $1,643.3 8.5x $1,511.0 7.9x LTM 06/30/2017 or 06/30/2018 Adjusted EBITDA3 194.1 192.0 Liquidity4 504.2 195.1 1 ABL Facility balance as of 06/30/2018 2 Based on total outstanding shares as of 06/30/2017 and 06/30/2018 3 Adjusted EBITDA is a non-GAAP financial measure. See page 30 for a reconciliation to net income from continuing operations 4 Liquidity is the sum of cash and cash equivalents, and availability under existing ABL Facility 24

Appendix

Top 3 Position in Favorable Geographic Markets with Attractive Fundamentals Robust end markets expecting continued growth Total non-residential building construction ($bn) Total residential building construction ($bn) 568 614 530 548 577 593 500 503 553 472 480 522 432 446 473 392 429 348 355 360 337 358 375 329 276 254 249 253 Commercial office and retail building construction ($bn) Highway and street construction ($bn) 178 182 187 168 155 156 97 144 95 92 121 91 91 91 106 109 88 91 85 79 85 78 82 83 81 81 81 79 Source: FMI Corp. as of January 30, 2018 26
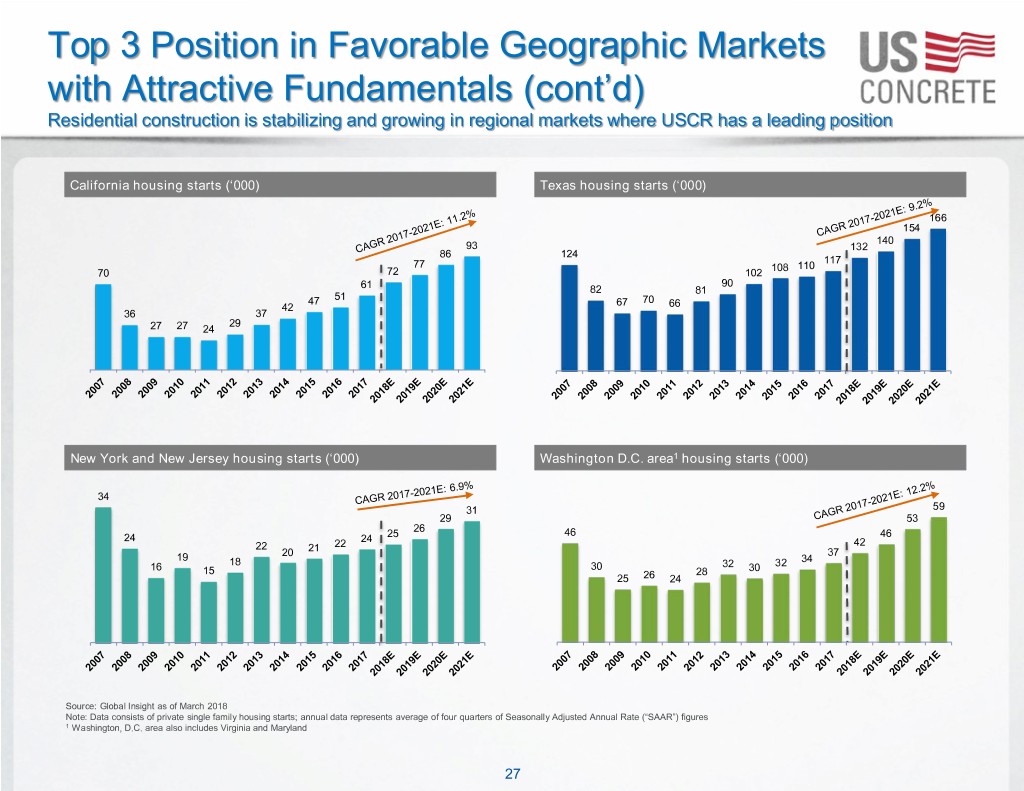
Top 3 Position in Favorable Geographic Markets with Attractive Fundamentals (cont’d) Residential construction is stabilizing and growing in regional markets where USCR has a leading position California housing starts (‘000) Texas housing starts (‘000) 166 154 140 93 132 86 124 117 77 108 110 70 72 102 61 90 82 81 51 47 67 70 42 66 36 37 29 27 27 24 New York and New Jersey housing starts (‘000) Washington D.C. area1 housing starts (‘000) 34 31 59 29 53 26 46 24 24 25 46 22 22 42 20 21 37 19 34 18 30 32 32 16 15 28 30 25 26 24 Source: Global Insight as of March 2018 Note: Data consists of private single family housing starts; annual data represents average of four quarters of Seasonally Adjusted Annual Rate (“SAAR”) figures 1 Washington, D.C. area also includes Virginia and Maryland 27

Long-Term Diversified Customer Base Across Sectors and Regions Quality, long-tenured client relationships with focused concentration in key markets Revenue by Customer (2017) Overview of Top Customer Relationships % of 2017 Customer Years End Market Location revenue Top 15, 21% 1. Customer A* 23 Commercial Northern Texas 4.1% 2. Customer B* 23 Residential Northern Texas 2.2% 51+, 63% 16-25, 6% 3. Customer C 56 Commercial Northern California 1.7% 26-35, 5% 4. Customer D 10 Residential/Commercial NY / NJ / DC 1.6% 36-50, 5% 5. Customer E 16 Residential/Commercial NY / NJ / DC 1.3% 6. Customer F 31 Commercial Northern California 1.2% Revenue Mix by Region (LTM 06/30/18) 7. Customer G 31 Commercial Northern California 1.2% Other 8. Customer H 31 Industrial NY / NJ / DC 1.1% 4% Western / Southern 9. Customer I Texas 36 Commercial Northern California 1.0% 11% Northern Texas 10. Customer J 3 Commercial Northern Texas 1.0% 24% 11. Customer K 21 Residential/Commercial NY / NJ / DC 1.0% 12. Customer L 23 Commercial Northern Texas 0.9% New York / New Jersey / DC 13. Customer M 15 Residential/Commercial NY / NJ / DC 0.9% 35% Northern 14. Customer N 30 Residential/Commercial NY / NJ / DC 0.8% California 26% 15. Customer O 10 Commercial Northern Texas 0.8% Average 24 Total 21% Source: U.S. Concrete * Denotes customers that are related to each other The Average Length of USCR’s Top 15 Customer Relationships is ~24 Years 28
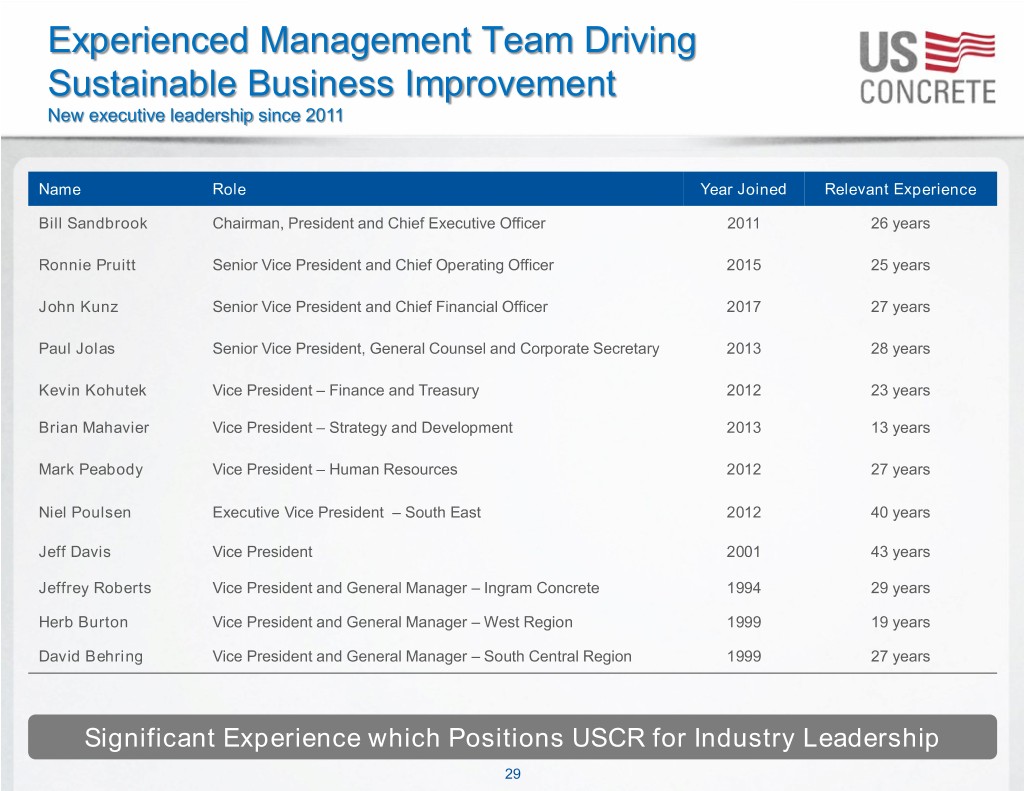
Experienced Management Team Driving Sustainable Business Improvement New executive leadership since 2011 Name Role Year Joined Relevant Experience Bill Sandbrook Chairman, President and Chief Executive Officer 2011 26 years Ronnie Pruitt Senior Vice President and Chief Operating Officer 2015 25 years John Kunz Senior Vice President and Chief Financial Officer 2017 27 years Paul Jolas Senior Vice President, General Counsel and Corporate Secretary 2013 28 years Kevin Kohutek Vice President – Finance and Treasury 2012 23 years Brian Mahavier Vice President – Strategy and Development 2013 13 years Mark Peabody Vice President – Human Resources 2012 27 years Niel Poulsen Executive Vice President – South East 2012 40 years Jeff Davis Vice President 2001 43 years Jeffrey Roberts Vice President and General Manager – Ingram Concrete 1994 29 years Herb Burton Vice President and General Manager – West Region 1999 19 years David Behring Vice President and General Manager – South Central Region 1999 27 years Significant Experience which Positions USCR for Industry Leadership 29

Reconciliation of Non-GAAP Financial Measures LTM ended Year ended December 31, Predecessor June 30, 2015 2018 2017 2016 2014 2013 2012 2011 2009 2007 (restated) Total Adjusted EBITDA Reconciliation Income (loss) from continuing operations $34.0 $26.3 $9.6 $(5.1) $21.6 $(18.3) $(24.4) $(7.9) $(78.7) $(60.8) Income tax expense (benefit) 4.7 12.4 21.1 0.8 2.2 1.2 (3.8) (0.4) (0.3) 0.0 Depreciation, depletion and amortization 78.3 67.8 55.0 43.6 23.8 18.9 15.5 18.5 23.5 23.2 Interest expense, net 44.3 42.0 27.7 21.7 20.4 11.3 11.3 11.1 25.9 27.5 Loss on extinguishment of debt 0.1 0.1 12.0 - (0.0) (1.0) 2.6 - (7.4) - Derivative loss (income) (13.1) 0.8 19.9 60.0 3.6 30.0 19.7 (13.4) - - Non-cash change in value of contingent 5.3 7.9 5.2 0.9 - - - - - - consideration Impairment of goodwill and other assets 7.5 6.2 - - - - - - - 72.9 Hurricane-related losses, net of recoveries 2.8 3.0 - - - - - - - - Quarry dredge costs for specific event 4.0 3.4 - - - - - - - - Purchase accounting adjustments for inventory 2.0 1.3 - - - - - - - - Foreign currency losses resulting from Polaris 1.9 1.9 - - - - - - - - acquisition Non-cash stock compensation expense 9.2 8.3 7.1 5.8 3.7 5.4 2.5 2.1 2.4 3.0 Acquisition-related costs 10.8 10.1 2.2 3.8 2.5 0.8 - - - - Officer transition expenses 0.2 0.8 - 0.4 - 0.2 0.1 2.1 - - Corporate headquarters relocation expense - - - - - 0.6 2.5 - - - Reorganization items - - - - - - - - 47.6 - Adjusted EBITDA $192.0 $192.3 $159.8 $131.9 $77.8 $49.1 $26.2 $11.9 $13.0 $65.9 Adjusted EBITDA margin 13.4% 14.4% 13.7% 13.5% 11.0% 8.2% 5.1% 2.8% 3.0% 10.2% Total Adjusted EBITDA and Total Adjusted EBITDA Margin are non-GAAP financial measures. We define Total Adjusted EBITDA as our income (loss) from continuing operations, excluding the impact of income tax expense (benefit), depreciation, depletion and amortization, net interest expense, loss on extinguishment of debt, derivative (income) loss, non-cash change in value of contingent consideration, impairment of assets, hurricane- related losses, net of recoveries, quarry dredge costs for specific event, purchase accounting adjustments for inventory, foreign currency losses resulting from Polaris acquisition, non-cash stock compensation expense, acquisition related costs and officer transition expenses. Acquisition-related costs consist of fees and expenses for accountants, lawyers and other professionals incurred during the negotiation and closing of strategic acquisitions and certain acquired entities' management severance costs. Acquisition-related costs do not include fees or expenses associated with post-closing integration of strategic acquisitions. We define Total Adjusted EBITDA Margin as the amount determined by dividing Total Adjusted EBITDA by total revenue. We have included Total Adjusted EBITDA and Total Adjusted EBITDA Margin herein because they are widely used by investors for valuation and comparing our financial performance with the performance of other building material companies. We also use Total Adjusted EBITDA and Total Adjusted EBITDA Margin to monitor and compare the financial performance of our operations. Total Adjusted EBITDA does not give effect to the cash we must use to service our debt or pay our income taxes and thus does not reflect the funds actually available for capital expenditures. In addition, our presentation of Total Adjusted EBITDA may not be comparable to similarly titled measures other companies report. Total Adjusted EBITDA and Total Adjusted EBITDA Margin are not intended to be used as an alternative to any measure of our performance in accordance with GAAP. The following table reconciles Total Adjusted EBITDA to the most directly comparable GAAP financial measure, which is income (loss) from continuing operations (in thousands). Non-GAAP financial measures should be viewed in addition to, and not as an alternative for, our reported operating results or cash flow from operations or any other measure of performance prepared in accordance with GAAP. 30
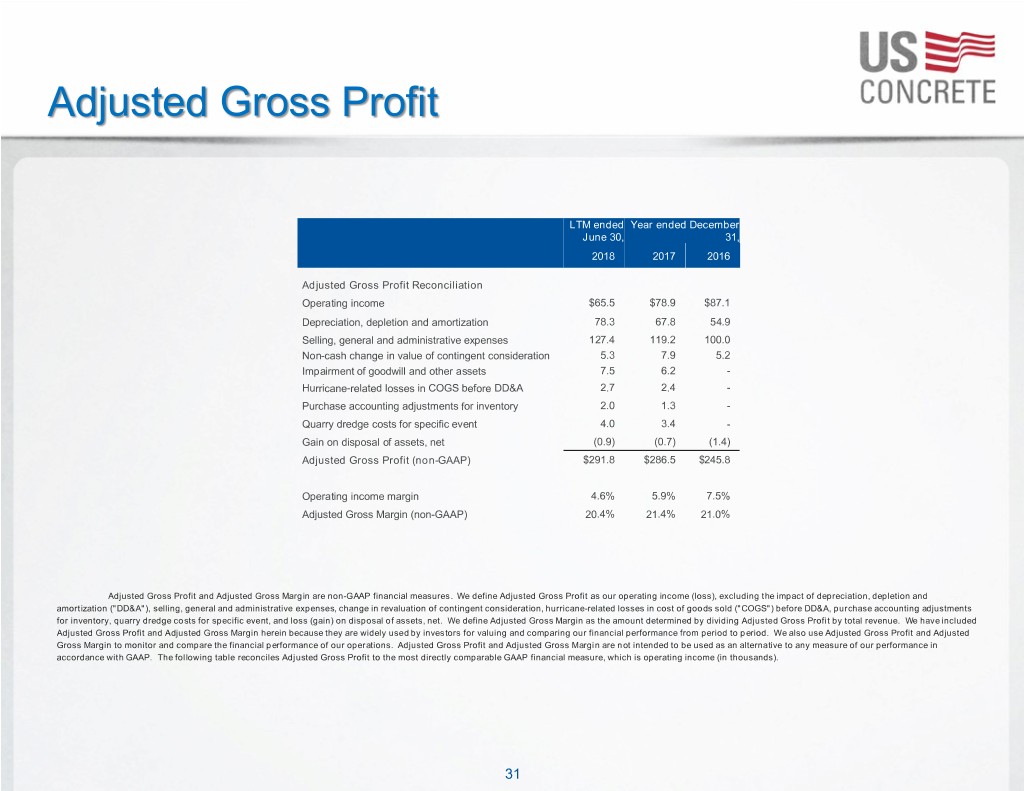
Adjusted Gross Profit LTM ended Year ended December June 30, 31, 2018 2017 2016 Adjusted Gross Profit Reconciliation Operating income $65.5 $78.9 $87.1 Depreciation, depletion and amortization 78.3 67.8 54.9 Selling, general and administrative expenses 127.4 119.2 100.0 Non-cash change in value of contingent consideration 5.3 7.9 5.2 Impairment of goodwill and other assets 7.5 6.2 - Hurricane-related losses in COGS before DD&A 2.7 2.4 - Purchase accounting adjustments for inventory 2.0 1.3 - Quarry dredge costs for specific event 4.0 3.4 - Gain on disposal of assets, net (0.9) (0.7) (1.4) Adjusted Gross Profit (non-GAAP) $291.8 $286.5 $245.8 Operating income margin 4.6% 5.9% 7.5% Adjusted Gross Margin (non-GAAP) 20.4% 21.4% 21.0% Adjusted Gross Profit and Adjusted Gross Margin are non-GAAP financial measures. We define Adjusted Gross Profit as our operating income (loss), excluding the impact of depreciation, depletion and amortization ("DD&A"), selling, general and administrative expenses, change in revaluation of contingent consideration, hurricane-related losses in cost of goods sold ("COGS") before DD&A, purchase accounting adjustments for inventory, quarry dredge costs for specific event, and loss (gain) on disposal of assets, net. We define Adjusted Gross Margin as the amount determined by dividing Adjusted Gross Profit by total revenue. We have included Adjusted Gross Profit and Adjusted Gross Margin herein because they are widely used by investors for valuing and comparing our financial performance from period to period. We also use Adjusted Gross Profit and Adjusted Gross Margin to monitor and compare the financial performance of our operations. Adjusted Gross Profit and Adjusted Gross Margin are not intended to be used as an alternative to any measure of our performance in accordance with GAAP. The following table reconciles Adjusted Gross Profit to the most directly comparable GAAP financial measure, which is operating income (in thousands). 31

