Attached files
| file | filename |
|---|---|
| EX-32.1 - EXHIBIT 32.1 - U.S. CONCRETE, INC. | exhibit32110k4q16.htm |
| EX-95.1 - EXHIBIT 95.1 - U.S. CONCRETE, INC. | exhibit951miningdisclosure.htm |
| EX-32.2 - EXHIBIT 32.2 - U.S. CONCRETE, INC. | exhibit32210k4q16.htm |
| EX-31.2 - EXHIBIT 31.2 - U.S. CONCRETE, INC. | exhibit31210k4q16.htm |
| EX-31.1 - EXHIBIT 31.1 - U.S. CONCRETE, INC. | exhibit31110k4q16.htm |
| EX-23.1 - EXHIBIT 23.1 - U.S. CONCRETE, INC. | exhibit231gtconsent4q16.htm |
| EX-21.1 - EXHIBIT 21.1 - U.S. CONCRETE, INC. | exhibit211subsidiarylist4q.htm |
| EX-12.1 - EXHIBIT 12.1 - U.S. CONCRETE, INC. | exhibit121earningstofixedc.htm |
| EX-4.6 - EXHIBIT 4.6 - U.S. CONCRETE, INC. | exhibit46-xuscrsupplemen.htm |
UNITED STATES
SECURITIES AND EXCHANGE COMMISSION
Washington, D.C. 20549
FORM 10-K
ý ANNUAL REPORT PURSUANT TO SECTION 13 OR 15(d) OF THE SECURITIES EXCHANGE
ACT OF 1934
For the fiscal year ended December 31, 2016 |
or |
o TRANSITION REPORT PURSUANT TO SECTION 13 OR 15(d) OF THE SECURITIES EXCHANGE ACT OF 1934 |
For the transition period from _________ to _________.
Commission file number 001-34530
U.S. CONCRETE, INC.
(Exact name of registrant as specified in its charter)
Delaware | 76-0586680 | |
(State or other jurisdiction of incorporation or organization) | (I.R.S. Employer Identification Number) | |
331 N. Main Street, Euless, Texas 76039
(Address of principal executive offices) (Zip code)
Registrant’s telephone number, including area code: (817) 835-4105
Securities registered pursuant to Section 12(b) of the Act:
Title of each class | Name of each exchange on which registered | |
Common Stock, par value $.001 | The Nasdaq Capital Market | |
Securities registered pursuant to Section 12(g) of the Act: None
Indicate by check mark if the registrant is a well-known seasoned issuer, as defined in Rule 405 of the Securities Act. Yes þ No o
Indicate by check mark if the registrant is not required to file reports pursuant to Section 13 or Section 15(d) of the Act. Yes o No þ
Indicate by check mark whether the registrant (1) has filed all reports required to be filed by Section 13 or 15(d) of the Securities Exchange Act of 1934 during the preceding 12 months (or for such shorter period that the registrant was required to file such reports), and (2) has been subject to such filing requirements for the past 90 days. Yes þ No o
Indicate by check mark whether the registrant has submitted electronically and posted on its corporate Web site, if any, every Interactive Data File required to be submitted and posted pursuant to Rule 405 of Regulation S-T (§ 232.405 of this chapter) during the preceding 12 months (or for such shorter period that the registrant was required to submit and post such files). Yes þ No o
Indicate by check mark if disclosure of delinquent filers pursuant to Item 405 of Regulation S-K (§ 229.405 of this chapter) is not contained herein, and will not be contained, to the best of the registrant’s knowledge, in definitive proxy or information statements incorporated by reference in Part III of this Form 10-K or any amendment to this Form 10-K. þ
Indicate by check mark whether the registrant is a large accelerated filer, an accelerated filer, a non-accelerated filer, or a smaller reporting company. See the definition of “large accelerated filer,” “accelerated filer” and “smaller reporting company” in Rule 12b-2 of the Exchange Act.
Large accelerated filer þ | Accelerated filer o | Non-accelerated filer o | Smaller reporting company o |
Indicate by check mark whether the registrant is a shell company (as defined in Rule 12b-2 of the Act.) Yes o No þ
Aggregate market value of the voting and non-voting common equity held by non-affiliates of the registrant computed by reference to the last reported sale price of $60.91 of the registrant’s common stock as of June 30, 2016, the last business day of the registrant’s most recently completed second fiscal quarter: $869,593,858. For purposes of this computation, all officers, directors and 10% beneficial owners of the registrant are deemed to be affiliates. Such determination should not be deemed an admission that such officers, directors or 10% beneficial owners are, in fact, affiliates of the registrant.
There were 15,730,115 shares of common stock, par value $.001 per share, of the registrant outstanding as of February 24, 2017.
DOCUMENTS INCORPORATED BY REFERENCE
Portions of the Proxy Statement related to the registrant's 2017 Annual Meeting of Stockholders, to be filed with the Securities and Exchange Commission pursuant to Regulation 14A under the Securities Exchange Act of 1934, as amended, are incorporated by reference into Part III of this report.
U.S. CONCRETE, INC.
FORM 10-K
For the Year Ended December 31, 2016
TABLE OF CONTENTS
Page | ||
3
Cautionary Statement Concerning Forward-Looking Statements
Certain statements and information in this Annual Report on Form 10-K may constitute “forward-looking statements” within the meaning of the Private Securities Litigation Reform Act of 1995. These forward-looking statements include, without limitation, statements concerning plans, objectives, goals, projections, strategies, future events or performance, and underlying assumptions and other statements, which are not statements of historical facts. In some cases, you can identify forward-looking statements by terminology such as “may,” “will,” “should,” “expect,” “plan,” “anticipate,” “believe,” “estimate,” “predict,” “potential” or “continue,” the negative of such terms or other comparable terminology. These forward-looking statements are based on our current expectations and beliefs concerning future developments and their potential effect on us. While management believes that these forward-looking statements are reasonable as and when made, there can be no assurance that future developments affecting us will be those that we anticipate. All comments concerning our expectations for future revenues and operating results are based on our forecasts for our existing operations and do not include the potential impact of any future acquisitions. Our forward-looking statements involve significant risks and uncertainties (some of which are beyond our control) and assumptions that could cause actual results to differ materially from our historical experience and our present expectations or projections.
Important factors that could cause actual results to differ materially from those in the forward-looking statements include, but are not limited to, those summarized below:
• | general economic and business conditions, which will, among other things, affect demand for new residential and commercial construction; |
• | our ability to successfully identify, manage, and integrate acquisitions; |
• | the cyclical nature of, and changes in, the real estate and construction markets, including pricing changes by our competitors; |
• | governmental requirements and initiatives, including those related to mortgage lending, financing or deductions, funding for public or infrastructure construction, land usage, and environmental, health, and safety matters; |
• | disruptions, uncertainties or volatility in the credit markets that may limit our, our suppliers' and our customers' access to capital; |
• | our ability to successfully implement our operating strategy; |
• | weather conditions; |
• | our substantial indebtedness and the restrictions imposed on us by the terms of our indebtedness; |
• | our ability to maintain favorable relationships with third parties who supply us with equipment and essential supplies; |
• | our ability to retain key personnel and maintain satisfactory labor relations; and |
• | product liability, property damage, results of litigation, and other claims and insurance coverage issues. |
Known material factors that could cause our actual results to differ from those in the forward-looking statements include those described in “Risk Factors” in Part I, Item 1A of this Annual Report on Form 10-K.
Readers are cautioned not to place undue reliance on forward-looking statements, which speak only as of the date hereof. We undertake no obligation to publicly update or revise any forward-looking statements after the date they are made, whether as a result of new information, future events or otherwise, except as required by federal securities laws.
4
PART I
Item 1. Business
U.S. Concrete, Inc. is a Delaware corporation which was founded and incorporated in 1997 to create a leading provider of ready-mixed concrete and related services to the construction industry in its selected markets. We began operations in 1999, which is the year we completed our initial public offering. In this report, we refer to U.S. Concrete, Inc. and its subsidiaries as "we," "us," "our," the "Company," or "U.S. Concrete," unless we specifically state otherwise or the context indicates otherwise.
General
We are a leading producer of ready-mixed concrete in select geographic markets in the United States. We operate our business through two primary segments: ready-mixed concrete and aggregate products. Ready-mixed concrete is one of the most versatile and widely used materials in construction. This important building material is used in the vast majority of commercial, residential and public works construction projects. Aggregates are granular raw materials essential in the production of ready-mixed concrete.
We serve substantially all segments of the construction industry in our select geographic markets. Our customers include contractors for commercial and industrial, residential, street and highway and other public works construction. Ready-mixed concrete product revenue by type of construction activity for the year ended December 31, 2016 was approximately 58% commercial and industrial, 26% residential and 16% street, highway and other public works.
We operate principally in Texas, New York/New Jersey, and northern California, with those markets representing approximately 38%, 31%, and 25%, respectively, of our consolidated revenue for the year ended December 31, 2016. We believe we are well positioned for strong growth in these attractive regions. According to estimates from the Portland Cement Association ("PCA"), the states in which we operate represent a total of approximately 26% of the 2016 consumption of ready-mixed concrete in the United States, which favorably positions us to capture additional market share in this fragmented industry. Total revenue from continuing operations for the year ended December 31, 2016 was $1.2 billion, of which we derived approximately 90.8% from our ready-mixed concrete segment, 3.6% from our aggregate products segment (excluding $34.7 million sold internally) and 5.6% from our other operations. For the year ended December 31, 2016, we had net income of $8.9 million and income from continuing operations of $9.6 million.
As of December 31, 2016, we operated 154 standard ready-mixed concrete plants, 16 volumetric ready-mixed concrete plants, 16 producing aggregates facilities, three aggregates distribution terminals, two lime slurry facilities, and one recycled aggregates facility. During the year ended December 31, 2016, these plants and facilities produced approximately 8.1 million cubic yards of ready-mixed concrete and 5.6 million tons of aggregates. In addition, we leased two other aggregates facilities to third parties and retained a royalty on production from those facilities. As of December 31, 2016, we operated over 1,540 drum mixer trucks and 125 volumetric mixer trucks. For additional information related to our properties, see Item 2. Properties of this report.
2016 Key Acquisitions
Our revenue over the past five years has more than doubled, due in part to our acquisitions, which we have funded through existing cash balances, debt, and equity. During 2016, we expanded our ready-mixed concrete operations in our New York metropolitan market with the acquisitions of Greco Brothers Concrete of L.I., Inc. ("Greco") and Kings Ready Mix Inc. ("Kings") located in Brooklyn, Nycon Supply Corp. ("Nycon") located in Queens, and Jenna Concrete Corp. ("Jenna") located in Bronx. These acquisitions included 10 ready-mix concrete plants and 189 mixer trucks, significantly enhancing our ability to serve construction projects in the New York metropolitan area.
Recent Developments
On January 9, 2017, we completed an offering of $200.0 million aggregate principal amount of 6.375% Senior Notes due 2024 (the “Additional Notes”) issued as additional securities pursuant to the Indenture, dated as of June 7, 2016, among the Company, certain subsidiary guarantors party thereto, and U.S. Bank National Association, as trustee (the “Trustee”), as supplemented to date (the “Indenture”). The terms of the Additional Notes are identical to the terms of our existing 6.375% Senior Notes due 2024 (collectively with the Additional Notes, the “2024 Notes”), other than the issue date, the issue price,
5
the first interest payment date, and the provisions relating to transfer restrictions and registration rights. The Additional Notes were issued at a price of 105.75% of the aggregate principal amount plus accrued interest from and including December 1, 2016. We intend to use the net proceeds of approximately $208.4 million from the offering of the Additional Notes for general corporate purposes, including funding the purchase price of future acquisitions to expand our business.
Competitive strengths
Large, high quality asset base in attractive markets with favorable construction environments. Our assets are primarily focused in the Texas / Oklahoma, New York / New Jersey / Washington, D.C. (the "Atlantic Region"), northern California, and U. S. Virgin Islands markets. Our high quality asset base is comprised of 82 ready-mixed concrete plants, 16 volumetric ready-mixed concrete plants, and 10 aggregates facilities in Texas / Oklahoma, 46 ready-mixed concrete plants, four aggregates facilities, three aggregates distribution terminals, and one recycled aggregates facility in the Atlantic Region, 22 ready-mixed concrete plants in northern California, four ready-mixed concrete plants and two aggregates facilities in the U.S. Virgin Islands; as well as operated over 1,540 drum mixer trucks and 125 volumetric mixer trucks. We believe the scale and quality of our asset base, in addition to our product differentiation, on-time deliveries, competitive all-in delivered cost, servicing and reliability differentiate us and allow us to meet the needs of both large and small jobs for a wide range of clients in multiple end-use markets.
Growth in our Texas / Oklahoma markets is largely driven by construction demand in the transportation, financial and other professional services, and manufacturing sectors; growth in our Atlantic Region markets is driven by the financial services and government sectors; and growth in our northern California market is driven largely by the technology sector. In addition, all of our markets currently exhibit healthy residential trends supported by a number of factors, including population growth, decreases in unemployment, low mortgage and other interest rates, rising home prices and increasing construction activity. We believe that our better-than-average growth is driven by key industry sectors within our markets, which generally benefit from year-round construction.
Favorable exposure to commercial projects with higher margins. We bid for and routinely win supply contracts for some of the largest, most prestigious commercial projects. Some of the larger commercial projects we have worked on include:
• | LaGuardia Airport in Queens, New York |
• | Toyota North American Headquarters in Plano, Texas |
• | The Union Tower in Dallas, Texas |
• | Facebook NA-4 Data Center in Fort Worth, Texas |
• | World Trade Center Complex in Manhattan, New York |
• | Tappan Zee Bridge, New York |
• | San Antonio Village in Mountain View, California |
• | Hudson Yards Complex in Manhattan, New York |
• | Museum of Modern Art Expansion Tower in Manhattan, New York |
These types of projects have higher margins due to rigorous specifications, increased complexity, high customization requirements, and significant volume capacity needs.
We provide alternative solutions for designers and contractors by offering value-added concrete products such as color-conditioned, fiber-reinforced, steel-reinforced, and high-performance concrete. We believe this enhances our ability to compete for and win supply contracts for large, complex commercial projects that are difficult to supply.
Long-term customer relationships. Our management and sales personnel develop and maintain successful long-term relationships with our key customers. Customer concentration in our key markets allows us to better serve our new and existing customers with expedited delivery, lower transportation costs, and scale efficiencies. Key elements of our customer-focused approach include:
• | corporate-level marketing and sales expertise; |
• | technical service expertise to develop innovative new branded products; and |
• | training programs that emphasize successful marketing and sales techniques that focus on the sale of high-margin concrete mix designs. |
We estimate that the average length of our top 15 customer relationships is approximately 25 years, including periods prior to our ownership of acquired businesses. We further estimate that approximately 89% of our top 35 customers have
6
relationships that extend past five years, with approximately 51% surpassing 20 years of loyalty. Our customer engagement model results in contractors returning year after year to us as a supplier they can trust. Despite our concentrated and loyal customer base, in 2016, no single customer or project accounted for more than 10% of our total revenue. Our broad, yet targeted, customer base enables us to develop an efficient, stable business model and tap into the market in a variety of ways. We believe that by providing high quality, reliable services and customized products and solutions, we are able to maintain important long-term relationships.
Focus on environmental sustainability. We are a leader in the sustainable concrete market, and we expect domestic and global sustainable demand to continue to grow at attractive rates. In 2008, we initiated our environmentally friendly concrete ("EF Technology") initiative which promotes green building and construction. Our EF Technology ready-mixed concrete products replace a portion of the traditional cement components with reclaimed fly ash, slag and other materials that results in lower carbon dioxide, or CO2, emissions. We believe this leads to an environmentally superior and sustainable alternative to traditional ready-mixed concrete for our customers’ consumption. We believe EF Technology reduces greenhouse gases and landfill space consumption and produces a highly durable product. Customers can also receive LEED credits for the use of this technology.
We believe our use of technology creates a competitive advantage over smaller concrete producers and larger vertically integrated aggregates and cement companies that do not focus on this as a first solution. We are positioned to take advantage of the growing demand for these products which could result in an increase in our revenue and profits and expansion of our operating margins, as these higher-priced value-added products are a lower cost alternative to cement. Today, we are a charter member of the Carbon Leadership Forum and the first ready-mixed concrete company in North America to adopt and receive verified Environmental Product Declarations for our concrete mixes, and we employ extensive sustainable operational practices across our enterprise. We are also a supporter of the National Ready Mixed Concrete Association ("NRMCA") Green-Star program, a plant-specific certification program that utilizes an environmental management system based on a model of continual improvement. Further, we participate in certain environmentally friendly governmental programs, as available. For instance, in the north Texas area, we participate in the Texas Emissions Reduction Program, in which we replace older engines of heavy-duty vehicles with newer models with more stringent federal emission standards.
Conservative balance sheet and ample liquidity. We have successfully improved our financial performance by refocusing our financial objectives over the past six years. Our management team has extensive experience in the industry as does our board of directors. Our management team has focused on reducing our cost structure while expanding our existing and acquired businesses in our core operating regions to drive strong performance. As a result, we have grown revenue, improved profit margins and increased liquidity during the past six years. In addition to cash on hand, we benefit from significant liquidity through our revolving credit facility and cash flow from operations. We believe our conservative balance sheet and liquidity will allow us to take advantage of strategic opportunities as well as provide ample cushion against general downturns in economic activity.
Experienced management team. Our senior management team consists of ten executives with an average of 26 years of industry experience and is comprised of individuals with a proven track record in the construction materials industry. Our Chief Executive Officer, William J. Sandbrook, has approximately 25 years of construction materials industry experience. Our management team’s deep market knowledge enables us to effectively assess potential new opportunities in order to solidify our leading market presence. We will continue to focus on recruiting and retaining motivated and knowledgeable professional managers to continue to develop our business and maintain our leading market position.
Company strategy
Focus on core operations. We believe the best opportunities for future growth lie within our core ready-mixed concrete and aggregates businesses. We routinely evaluate our existing assets and business units to ensure we continue to maintain a best-in-class operation. We will continue to invest in our business, both in physical plants and new technologies, and we will continue to evaluate strategic acquisition opportunities. We believe our focus on optimizing the performance of our ready-mixed concrete business will continue to differentiate us from our larger, integrated competitors that focus principally on their aggregates or cement and treat ready-mixed concrete operations as a downstream outlet for their aggregates or cement products.
Pursue growth. In addition to our general organic growth initiative, we continuously evaluate both acquisition and partnership opportunities. We are focused on both strengthening our positions in existing markets as well as identifying attractive new markets. All of our acquisitions must meet our strict criteria, including fit with our strategic plan, investment return hurdles, capital requirements and attractive market attributes. During 2016, we completed four acquisitions that expanded our footprint in the New York metropolitan market. We believe our significant experience, positive reputation and
7
strong management team will allow us to continue our successful track record of identifying opportunities, integrating acquisitions, realizing synergies and enhancing asset value and cash flow.
Manage costs. We are consistently seeking opportunities to reduce costs and to improve margins through our focus on existing operations and new technologies. Additionally, our regional acquisitions allow for synergies such as selling, general, and administrative reductions, economies of scale, variable labor savings, and purchasing power. We believe by aggressively managing our cost structure, we can best serve our clients with better pricing and continued best-in-class execution.
Business segments and products
We operate our business through two primary segments: ready-mixed concrete and aggregate products. For financial information about our operating segments, refer to the information set forth in Note 18, "Segment Information," to our consolidated financial statements included in this report. We derive all of our revenue from operations in the United States and its territories, and all of our long-lived assets are located within the United States and its territories.
Ready-mixed concrete
General
Our ready-mixed concrete business engages principally in the formulation, preparation and delivery of ready-mixed concrete to our customers’ job sites. We provide our ready-mixed concrete from our operations in Texas, New York, New Jersey, Washington, D.C., northern California, Oklahoma, and the U.S. Virgin Islands. Ready-mixed concrete is a highly versatile construction material that results from combining coarse and fine aggregates, such as gravel, crushed stone and sand, with water, various chemical admixtures, and cement. We also provide services intended to reduce our customers’ overall construction costs by lowering the installed, or “in-place,” cost of concrete. These services include the formulation of mixtures for specific design uses, on-site and lab-based product quality control, and customized delivery programs to meet our customers’ needs. We generally do not provide paving or other finishing services, which construction contractors or subcontractors typically perform.
Products and services
Our standard ready-mixed concrete products consist of proportioned mixes we produce and deliver in an unhardened plastic state for placement and shaping into designed forms at the job site. Selecting the optimum mix for a job entails determining not only the ingredients that will produce the desired permeability, strength, appearance and other properties of the concrete after it has hardened and cured, but also the ingredients necessary to achieve a workable consistency considering the weather and other conditions at the job site. We believe we can achieve product differentiation for the mixes we offer because of the variety of mixes we can produce, our volume production capacity and our scheduling, delivery and placement reliability. Additionally, we believe our EF Technology initiative, which utilizes alternative materials and mix designs that result in lower CO2 emissions, helps differentiate us from our competitors. We also believe we distinguish ourselves with our value-added service approach that emphasizes reducing our customers’ overall construction costs by reducing the in-place cost of concrete and the time required for construction.
Our volumetric concrete operations, which we acquired in 2014, expanded our ready-mixed concrete delivery and service offerings in Texas. Volumetric ready-mixed concrete trucks mix concrete to the customer's specification on the job site, better serving smaller jobs and specialized applications, and allowing flexibility for servicing remote job locations. Because of their versatility, these trucks offer the contractor multiple options for a single job without the inconvenience or added costs typically associated with standard ready-mixed trucks delivering special or short-loads to a job site. Because of their unique on-demand production capabilities, these trucks minimize the amount of wasted concrete, which improves margins and reduces environmental impact.
From a contractor’s perspective, the in-place cost of concrete includes both the amount paid to the ready-mixed concrete manufacturer and the internal costs associated with the labor and equipment the contractor provides. A contractor’s unit cost of concrete is often only a small component of the total in-place cost that takes into account all the labor and equipment costs required to build the forms for the ready-mixed concrete and place and finish the ready-mixed concrete, including the cost of additional labor and time lost as a result of substandard products or delivery delays not covered by warranty or insurance. By carefully designing proper mixes and using advances in mixing technology, we can assist our customers in reducing the amount of reinforcing steel, time and labor they will require in various applications.
8
We provide a variety of services in connection with our sale of ready-mixed concrete that can help reduce our customers’ in-place cost of concrete. These services include:
• | production of formulations and alternative product recommendations that reduce labor and materials costs; |
• | quality control, through automated production and laboratory testing, that ensures consistent results and minimizes the need to correct completed work; and |
• | automated scheduling and tracking systems that ensure timely delivery and reduce the downtime incurred by the customer’s placing and finishing crews. |
We produce ready-mixed concrete by combining the desired type of cement, other cementitious materials (described below), sand, gravel, and crushed stone with water and, typically, one or more admixtures. These admixtures, such as chemicals, minerals and fibers, determine the usefulness of the product for particular applications.
We use a variety of chemical admixtures to achieve one or more of the following five basic purposes:
• | relieve internal pressure and increase resistance to cracking; |
• | retard the hardening process to make concrete more workable in hot weather; |
• | strengthen concrete by reducing its water content; |
• | accelerate the hardening process and reduce the time required for curing; and |
• | facilitate the placement of concrete having low water content. |
We frequently use various mineral admixtures as supplements to cement, which we refer to as supplemental cementitious materials, to alter the permeability, strength and other properties of concrete. These materials include fly ash, ground granulated blast-furnace slag, silica fume and other natural pozzolans. These materials also reduce the amount of cement content used, which results in a reduction in CO2 emissions.
We also use fibers, such as steel, glass, and synthetic and carbon filaments as additives in various formulations of concrete. Fibers help control shrinkage cracking, thus reducing permeability and improving abrasion resistance. In many applications, fibers can replace welded steel wire and reinforcing bars. Relative to the other components of ready-mixed concrete, these additives generate comparatively higher margins.
Marketing and sales
Our marketing efforts primarily target concrete sub-contractors, general contractors, governmental agencies, property owners and developers, architects, engineers, and home builders whose focus extends beyond the price of ready-mixed concrete to product quality, on-time delivery and reduction of in-place costs.
General contractors typically select their suppliers of ready-mixed concrete. In large, complex projects, an engineering firm or division within a state transportation or public works department may influence the purchasing decision, particularly if the concrete has complicated design specifications. In connection with large, complex projects and in government-funded projects generally, the general contractor or project engineer usually awards supply orders on the basis of either direct negotiation or a competitive bidding process. We believe the purchasing decision for many jobs is ultimately relationship and reputation-based.
Our marketing and sales strategy emphasizes the sale of value-added products and solutions to customers more focused on reducing their in-place building material costs than on the price per cubic yard of ready-mixed concrete. Key elements of our customer-focused approach include:
• | corporate-level marketing and sales expertise; |
• | technical service expertise to develop innovative, new branded products; and |
• | training programs that emphasize successful marketing and sales techniques that focus on the sale of high-margin concrete mix designs. |
Operations
Our standard ready-mixed concrete plants consist of fixed and portable facilities that produce ready-mixed concrete in wet or dry batches. Our fixed-plant facilities produce ready-mixed concrete that we transport to job sites by drum mixer trucks. Our portable plant operations deploy our portable plant facilities to produce ready-mixed concrete at the job site that
9
we direct into place using a series of conveyor belts or drum mixer trucks. We use our portable plants to service high-volume projects or projects in remote locations. Our volumetric ready-mixed concrete plants consist of fixed and portable facilities that are used to load raw materials into our volumetric mixer trucks throughout the day. Batching occurs at the job site based on customer specifications. Several factors govern the choice of plant type, including:
• | production consistency requirements; |
• | daily production capacity requirements; |
• | job site proximity to fixed plants; and |
• | capital and financing. |
We construct both wet batch plants and dry batch plants. A wet batch plant generally has a higher initial cost and daily operating expenses, but (1) yields greater consistency with less time required for quality control in the concrete produced, and (2) generally has greater daily production capacity than a dry batch plant. We believe that construction of a wet batch plant having an hourly capacity of 250 cubic yards currently would cost approximately $1.6 million, while a dry batch plant having an hourly capacity of 150 cubic yards currently would cost approximately $0.7 million. As of December 31, 2016, we operated 26 wet batch plants and 128 dry batch plants.
We maintain two types of load facilities for our volumetric ready-mixed concrete — main load sites and reload facilities. Both types of facilities typically include blending silos, a load-out pit, and a storm water system. A main load facility typically also includes a maintenance shop. We estimate that constructing a main load site would currently cost approximately $0.7 million, while constructing a reload facility would currently cost approximately $0.1 million.
Our batch operator at a dry batch plant simultaneously loads the dry components of stone, sand, and cement with water and admixtures in a drum mixer truck that begins the mixing process during loading and continues that process en route to our customers' job sites. In a wet batch plant, the batch operator blends the dry components and water in a plant mixer from which an operator loads the mixed concrete into a drum mixer truck, which leaves for the job site promptly after loading. At a volumetric facility, our loader operator or mixer operator coordinates loading the dry components of sand, course aggregates, and cement into the bins on the truck. Water and liquid admixtures are separately loaded into the tanks on the trucks before leaving the facility for the job site.
Any future decisions we make regarding the construction of additional plants will be impacted by market factors, including:
• | the expected production demand for the plant; |
• | capital and financing; |
• | the expected types of projects the plant will service; and |
• | the desired location of the plant. |
Drum mixer trucks continuously rotate their loads en route to job sites in order to produce concrete at the desired consistency. Our drum mixer trucks typically have load capacities of 10 cubic yards, or approximately 20 tons, and a typical operating life of between ten and fifteen years, depending on total truck hours and miles. A new truck of this size currently costs between $160,000 and $225,000, depending on the geographic location and design specifications. Depending on the type of batch plant from which the drum mixer trucks generally are loaded, some components of the drum mixer trucks may require refurbishment after three to five years. As of December 31, 2016, we operated a fleet of over 1,540 owned and leased drum mixer trucks, which had an average age of approximately nine years.
Volumetric mixer trucks include individual bins and tanks, which are used to mix the raw materials at the customer's job site based on the customer's specifications. The volumetric mixing method provides only the concrete needed for the job, eliminating wasted materials and short load charges. Our volumetric mixer trucks typically have load capacities of eight cubic yards, or approximately 16 tons, and a typical operating life of between eight to twelve years, depending on total truck hours and miles. A new truck of this size currently costs between $220,000 and $250,000, depending on the design specifications. Typically the truck's mixer unit will be rebuilt after the initial truck life, extending the operating life of the truck an additional five years. As of December 31, 2016, we operated a fleet of 125 owned volumetric mixer trucks, which had an average age of approximately 10 years.
In our ready-mixed concrete operations, we emphasize quality control, pre-job planning, customer service and coordination of supplies and delivery. We obtain orders for ready-mixed concrete in advance of actual delivery. A typical order contains a contractor's specifications for the concrete. After receiving the specifications for a particular job, we use computer modeling, industry information and information from previous similar jobs to formulate a variety of mixtures of cement, aggregates,
10
water and admixtures that meet or exceed the contractor’s specifications. We perform testing to determine which mix design is most appropriate to meet the required specifications. The test results enable us to select the mixture that has the lowest cost and meets or exceeds the job specifications. The testing center creates and maintains a project file that details the mixture we will use when we produce the concrete for the job. For quality control purposes, the testing center also is responsible for maintaining batch samples of concrete we have delivered to a job site.
We use computer modeling to prepare bids for particular jobs based on the size of the job, location, desired margin, cost of raw materials and the design mixture identified in our testing process. If the job is large enough and has a projected duration beyond the supply arrangement in place at that time, we obtain quotes from our suppliers as to the cost of raw materials we use to prepare the bid. Once we obtain a quote from our suppliers, the price of the raw materials for the specified job is informally established. Several months may elapse from the time a contractor has accepted our bid until actual delivery of the ready-mixed concrete begins.
During this time, we maintain regular communication with the contractor concerning the status of the job and any changes in the job’s specifications in order to coordinate the multisourced purchases of cement and other materials we will need to fill the job order and meet the contractor’s delivery requirements. We confirm that our customers are ready to take delivery of manufactured products throughout the placement process. On any given day, one of our plants may have production orders for dozens of customers at various locations throughout its area of operation. To fill an order:
• | the customer service office coordinates the timing and delivery of the concrete to the job site; |
• | a load operator supervises and coordinates the receipt of the necessary raw materials and operates the hopper that dispenses those materials into the appropriate storage bins; |
• | a batch operator, using a computerized batch panel, prepares the specified mixture from the order and oversees loading the mixer truck with either dry ingredients and water in a dry batch plant or the premixed concrete in a wet batch plant; and |
• | the driver of the mixer truck delivers the load to the job site, discharges the load and, after washing the truck, departs at the direction of the dispatch office. |
Our central dispatch system, where available, tracks the status of each mixer truck as to whether it is:
• | loading concrete; |
• | en route to a particular job site; |
• | on the job site; |
• | discharging concrete; |
• | being rinsed down; or |
• | en route to a particular plant. |
The system is updated continuously on the trucks’ status via signals received from sensors. In this manner, the dispatcher can determine the optimal routing and timing of subsequent deliveries by each mixer truck and monitor the performance of each driver.
Our plant managers oversee the operations of each of our plants. Our operational employees also include:
• | maintenance personnel who perform routine maintenance work throughout our plants; |
• | mechanics who perform the maintenance and repair work on our rolling stock; |
• | testing center staff who prepare mixtures for particular job specifications and maintain quality control; |
• | various clerical personnel who perform administrative tasks; and |
• | sales personnel who are responsible for identifying potential customers, pricing mixes for projects, and maintaining existing customer relationships. |
We generally operate each of our plants on an extended single shift, with some overtime operation during the year. On occasion, however, we may have projects that require deliveries around the clock.
Aggregate products
Our aggregate products segment produces crushed stone, sand and gravel from 16 aggregates facilities located in New Jersey, Texas, Oklahoma, and the U.S. Virgin Islands. We sell these aggregates for use in commercial, industrial, and public works projects in the markets they serve, as well as consume them internally in the production of ready-mixed concrete in
11
those markets. We produced approximately 5.6 million tons of aggregates during the year ended December 31, 2016, with Texas / Oklahoma representing 54%, New Jersey representing 41%, and the U.S. Virgin Islands representing 5% of the total production. We believe our aggregates reserves provide us with additional raw material sourcing flexibility and supply availability. In addition, we own sand pit operations in Michigan and one quarry in west Texas, which we lease to third parties and receive a royalty based on the volumes produced and sold during the terms of the leases.
Other
Other products not associated with a reportable segment include our building materials stores, hauling operations, aggregates distribution terminals, lime slurry, ARIDUS® Rapid Drying Concrete technology, brokered product sales, a recycled aggregates operation, and concrete blocks.
Industry overview
Concrete has many attributes that make it a highly versatile construction material. In recent years, industry participants have developed various uses for concrete products, including:
• | high-strength engineered concrete to compete with steel-frame construction; |
• | concrete housing; |
• | flowable fill for backfill applications; |
• | continuous-slab rail-support systems for rapid transit and heavy-traffic rail lines; and |
• | concrete bridges, tunnels and other structures for rapid transit systems. |
Other examples of successful innovations that have opened new markets for concrete include:
• | sustainable construction; |
• | concrete paving over asphalt, or “white topping”; |
• | paved concrete shoulders to replace less permanent and increasingly costly asphalt shoulders; |
• | pervious concrete parking lots for water drainage management, as well as providing a long-lasting and aesthetically pleasing urban environment; |
• | colored pavements to mark entrance and exit ramps and lanes of expressways; and |
• | colored, stamped concrete for decorative applications. |
The U.S. ready-mixed concrete market is a large, highly competitive and fragmented market, with no one producer holding a dominant market position. The NRMCA currently estimates that the ready-mixed concrete industry generates total annual revenue of approximately $35 billion.
Based on estimates from the NRMCA, in addition to vertically integrated manufacturers of cement and aggregates, ready-mixed concrete producers currently operate approximately 5,500 plants in the United States. Larger markets generally have several producers competing for business on the basis of product quality, service, on-time delivery and price.
According to information available from the NRMCA, total volumes (measured in cubic yards) from the production and delivery of ready-mixed concrete in the United States over the past three years were as follows (in millions of cubic yards):
2016 | 2015 | 2014 | |||||||
Total ready-mixed concrete volumes | 343 | 336 | 326 | ||||||
According to recently published Dodge Construction data, the four major segments of the construction industry accounted for the following approximate percentages of the total volume of ready-mixed concrete produced in the United States in the past three years:
2016 | 2015 | 2014 | |||||||
Commercial and industrial construction | 17 | % | 18 | % | 16 | % | |||
Residential construction | 22 | % | 22 | % | 19 | % | |||
Street and highway construction and paving | 22 | % | 20 | % | 23 | % | |||
Other public works and infrastructure construction | 39 | % | 40 | % | 42 | % | |||
12
According to FMI Corp. ("FMI"), spending on total residential, non-residential, and non-building construction is projected to grow at a steady rate through 2019. FMI projects the following growth rates in 2017: residential construction of 4-5%, commercial and office construction of 4-5%, and street and highway construction of 2%. According to the PCA, annual ready-mixed concrete usage is expected to strengthen in our key markets in Texas, New York / New Jersey, and northern California with 2017 to 2020 estimated compound annual growth rates of 4.7%, 2.3%, and 4.9%, respectively. Moreover, the National Association of Home Builders and Fannie Mae predict U.S. residential construction will continue to recover with a median estimate of approximately 869,000 and 405,000 single-family and multi-family housing starts in 2017, respectively. Other industry experts agree predicting total housing starts will exceed 1.2 million per year.
During the past decade, public concerns about dust, process water runoff, noise, and heavy mixer and other truck traffic associated with the operation of ready-mixed concrete manufacturing operations and their general appearance have made obtaining the permits and licenses required for new plants more difficult. Delays in the regulatory process, coupled with the capital investment that start-up operations entail, create complexities for these start-up plants.
Cement and other raw materials
We obtain most of the materials necessary to manufacture ready-mixed concrete on a daily basis. These materials include cement, other cementitious materials (such as fly ash and blast furnace slag) and aggregates (stone, gravel and sand), in addition to certain chemical admixtures. With the exception of chemical admixtures, each plant typically maintains an inventory level of these materials sufficient to satisfy its operating needs for a few days. Our inventory levels do not decline significantly or comparatively with declines in revenue during seasonally low periods. We generally maintain inventory at specified levels to maximize purchasing efficiencies and to be able to respond quickly to customer demand.
Typically, cement, other cementitious materials and aggregates represent the highest-cost materials used in manufacturing a cubic yard of ready-mixed concrete. We purchase cement from a few suppliers in each of our major geographic markets. Chemical admixtures are generally purchased from suppliers under national purchasing agreements.
Overall, prices for cement and aggregates increased in 2016, compared to 2015, in all of our major geographic markets. Generally, we negotiate with suppliers on a company-wide basis and at the local market level to obtain the most competitive pricing available for cement and aggregates. We believe the demand for cement is increasing and will warrant scrutiny as construction activity increases. Today, in most of our markets, we believe there is an adequate supply of cement and aggregates.
We recognize the value in advocating green building and construction as part of our strategy. We initiated EF Technology, our commitment to environmentally friendly concrete technologies that significantly reduce potential CO2 emissions. Our EF Technology ready-mixed concrete products replace a portion of cement with reclaimed fly ash, blast furnace slag and other materials. We believe this results in an environmentally superior and sustainable alternative to traditional ready-mixed concrete. EF Technology reduces greenhouse gases and landfill space consumption and produces a highly durable product. Customers can also obtain LEED credits through the use of this technology. We believe our use of this technology creates a competitive advantage over smaller concrete producers and larger vertically integrated aggregate and cement companies that may not focus on this as a first solution. We are positioned to take advantage of the growing demand for these products which could expand our operating margins as they are a lower cost alternative to cement.
Customers
Of our concrete product revenue for the year ended December 31, 2016, commercial and industrial construction represented approximately 58%, residential construction represented approximately 26% and street, highway construction and other public works represented approximately 16%. For the year ended December 31, 2016, no single customer or project accounted for more than 10% of our total revenue.
We rely heavily on repeat customers. Our management and sales personnel are responsible for developing and maintaining successful long-term relationships with our key customers.
Competition
The ready-mixed concrete industry is highly competitive. Our leadership position in a market depends largely on the location and operating costs of our plants and prevailing prices in that market. Price is the primary competitive factor among suppliers for small or less complex jobs, such as residential construction. However, the ability to meet demanding specifications for strength or sustainability, timeliness of delivery and consistency of quality and service, in addition to price, are the principal
13
competitive factors among suppliers for large or complex jobs. Our competitors range from small, owner-operated private companies to subsidiaries of operating units of large, vertically integrated manufacturers of cement and aggregates. Our vertically integrated competitors generally have greater financial and marketing resources than we have, providing them with a competitive advantage. Competitors having lower operating costs than we do or having the financial resources to enable them to accept lower margins than we do will have a competitive advantage over us for jobs that are particularly price-sensitive. Competitors having greater financial resources or less financial leverage than we do may be able to invest more in new mixer trucks, ready-mixed concrete plants, and other production equipment or pay for acquisitions which could provide them a competitive advantage over us. See “Risk factors - We may lose business to competitors who underbid us, and we may be otherwise unable to compete favorably in our highly competitive industry.”
We continue to focus on developing new competitive advantages that will differentiate us from our competitors, such as our high-performing, low-CO2 concrete, and ARIDUS® Rapid Drying Concrete technology. For example, Central Concrete Supply Co., Inc. (“Central Concrete”), one of our subsidiaries, differentiated itself from its competitors to supply its high-performing, low-CO2 concrete for Levi's Stadium, home of the San Francisco 49ers. Central Concrete supplied an estimated 80,000 cubic yards of concrete for the auger cast piles and the overall stadium structure, sidewalks, and architectural concrete.
Employees
As of December 31, 2016, we had 643 salaried employees, including executive officers and management, sales, technical, administrative and clerical personnel, and 2,291 hourly personnel. The number of employees fluctuates depending on the number and size of projects ongoing at any particular time, which may be impacted by variations in weather conditions throughout the year.
As of December 31, 2016, 1,129 of our employees were represented by labor unions having collective bargaining agreements with us. Generally, these agreements have multi-year terms and expire on a staggered basis between 2017 and 2020. Under these agreements, we pay specified wages to covered employees and in most cases make payments to multi-employer pension plans and employee benefit trusts rather than administering the funds on behalf of these employees. We have not experienced any strikes or significant work stoppages in the past six years. We believe our relationships with our employees and union representatives are very good.
Training and safety
Our future success will depend, in part, on the extent to which we can attract, retain, and motivate qualified employees. We believe that our ability to do so will depend, in part, on providing a work environment that allows employees the opportunity to develop and maximize their capabilities. We require all field employees to attend periodic safety training meetings and all drivers to participate in training seminars. We employ a national safety director whose responsibilities include managing and executing a unified, company-wide safety program. Employee development and safety are criteria used in evaluating performance in our annual incentive plan for salaried employees.
Governmental regulation and environmental matters
A wide range of federal, state, and local laws, ordinances, and regulations apply to our operations, including the following matters:
• | water usage; |
• | land usage; |
• | street and highway usage; |
• | noise levels; and |
• | health, safety, and environmental matters. |
In many instances, we are required to have various certificates, permits, or licenses to conduct our business. Our failure to maintain these required authorizations or to comply with applicable laws or other governmental requirements could result in substantial fines or possible revocation of our authority to conduct some of our operations. Delays in obtaining approvals for the transfer or grant of authorizations, or failures to obtain new authorizations, could impede acquisition efforts.
Environmental laws that impact our operations include those relating to air quality, solid waste management, and water quality. These laws are complex and subject to frequent change. They impose strict liability in some cases without regard to negligence or fault. Sanctions for noncompliance may include revocation of permits, corrective action orders, administrative
14
or civil penalties, and criminal prosecution. Some environmental laws provide for joint and several strict liability for remediation of spills and releases of hazardous substances. In addition, businesses may be subject to claims alleging personal injury or property damage as a result of alleged exposure to hazardous substances, as well as damage to natural resources. These laws also may expose us to liability for the conduct of, or conditions caused by, others or for acts that complied with all applicable laws when performed.
We have conducted Phase I environmental site assessments, which are non-intrusive investigations conducted to evaluate the potential for significant on-site environmental impacts, on substantially all the real properties we own or lease and have engaged independent environmental consulting firms to complete those assessments. We have not identified any environmental concerns associated with those properties that we believe are likely to have a material adverse effect on our business, financial position, results of operations, or cash flows, but we can provide no assurance material liabilities will not occur. In addition, we can provide no assurance that our compliance with amended, new or more stringent laws, stricter interpretations of existing laws, or the future discovery of environmental conditions will not require additional, material expenditures.
We believe we have all material permits and licenses we need to conduct our operations and are in substantial compliance with applicable regulatory requirements relating to our operations. Our capital expenditures relating to environmental matters were not material in 2016.
Product warranties
Our operations involve providing ready-mixed concrete that must meet building codes or other regulatory requirements and contractual specifications for durability, stress-level capacity, weight-bearing capacity and other characteristics. If we fail or are unable to provide products meeting these requirements and specifications, material claims may arise against us and our reputation could be damaged. In the past, we have had significant claims of this kind asserted against us that we have resolved. There currently are, and we expect that in the future there may be, additional claims of this kind asserted against us. If a significant product-related claim is resolved against us in the future, that resolution may have a material adverse effect on our business, financial condition, results of operations, and cash flows.
Insurance
Our employees perform a significant portion of their work moving and storing large quantities of heavy raw materials, driving large mixer and other trucks in heavy traffic conditions, and delivering concrete at construction sites or in other areas that may be hazardous. These operating hazards can cause personal injury and loss of life, damage to or destruction of properties, and equipment and environmental damage. We maintain insurance coverage in amounts and against the risks we believe are in accordance with industry practice, but this insurance may not be adequate to cover all losses or liabilities we may incur in our operations, and we may be unable to maintain insurance of the types or at levels we deem necessary or adequate or at rates we consider reasonable.
Legal proceedings
From time to time, and currently, we are subject to various claims and litigation brought by employees, customers and other third parties for, among other matters, personal injuries, property damage, product defects, and delay damages that have, or allegedly have, resulted from the conduct of our operations as well as disputes related to prior acquisitions. As a result of these types of claims and litigation, we must periodically evaluate the probability of damages being assessed against us and the range of possible outcomes. In each reporting period, if we determine that the likelihood of damages being assessed against us is probable, and, if we believe we can estimate a range of possible outcomes, then we will record a liability. The amount of the liability will be based upon a specific estimate, if we believe a specific estimate to be likely, or it will reflect the low end of our range. Currently, there are no material legal proceedings pending against us.
In the future, we may receive funding deficiency demands related to multi-employer plans to which we contribute. We are unable to estimate the amount of any potential future funding deficiency demands, because the actions of each of the other contributing employers in the plans has an effect on each of the other contributing employers, and the development of a rehabilitation plan by the trustees and subsequent submittal to and approval by the Internal Revenue Service is not predictable. Further, the allocation of fund assets and return assumptions by trustees are variable, as are actual investment returns relative to the plan assumptions.
As of February 28, 2017, there are no material product defect claims pending against us. Accordingly, our existing accruals for claims against us do not reflect any material amounts relating to product defect claims. While our management is not
15
aware of any facts that would reasonably be expected to lead to material product defect claims against us that would have a material adverse effect on our business, financial condition, or results of operations, it is possible that claims could be asserted against us in the future. We do not maintain insurance that would cover all damages resulting from product defect claims. In particular, we generally do not maintain insurance coverage for the cost of removing and rebuilding structures. In addition, our indemnification arrangements with contractors or others, when obtained, generally provide only limited protection against product defect claims. Due to inherent uncertainties associated with estimating unasserted claims in our business, we cannot estimate the amount of any future loss that may be attributable to unasserted product defect claims related to ready-mixed concrete we have delivered prior to December 31, 2016.
We believe that the resolution of all litigation currently pending or threatened against us or any of our subsidiaries will not materially exceed our existing accruals for those matters. However, because of the inherent uncertainty of litigation, there is a risk that we may have to increase our accruals for one or more claims or proceedings to which we or any of our subsidiaries is a party as more information becomes available or proceedings progress, and any such increase in accruals could have a material adverse effect on our consolidated financial condition or results of operations. We expect in the future that we and our operating subsidiaries will, from time to time, be a party to litigation or administrative proceedings that arise in the normal course of our business.
We are subject to federal, state and local environmental laws and regulations concerning, among other matters, air emissions and wastewater discharge. Our management believes we are in substantial compliance with applicable environmental laws and regulations. From time to time, we receive claims from federal and state environmental regulatory agencies and entities asserting that we may be in violation of environmental laws and regulations. Based on experience and the information currently available, our management does not believe that these claims will materially exceed our related accruals. Despite compliance and experience, it is possible that we could be held liable for future charges, which might be material, but are not currently known to us or cannot be estimated by us. In addition, changes in federal or state laws, regulations or requirements, or discovery of currently unknown conditions, could require additional expenditures.
As permitted under Delaware law, we have agreements that provide indemnification of officers and directors for certain events or occurrences while the officer or director is or was serving at our request in such capacity. The maximum potential amount of future payments that we could be required to make under these indemnification agreements is not limited; however, we have a director and officer insurance policy that potentially limits our exposure and enables us to recover a portion of future amounts that may be paid. As a result of the insurance policy coverage, we believe the estimated fair value of these indemnification agreements is minimal. Accordingly, we have not recorded any liabilities for these agreements as of December 31, 2016.
We and our subsidiaries are parties to agreements that require us to provide indemnification in certain instances when we acquire businesses and real estate and in the ordinary course of business with our customers, suppliers, lessors, and service providers.
Available Information
Our website address is www.us-concrete.com. We make available on this website under the “Investor Relations” section, free of charge, our annual reports on Form 10-K, quarterly reports on Form 10-Q and current reports on Form 8-K, and amendments to those reports, as soon as reasonably practicable after we electronically file those materials with, or furnish them to, the SEC. Alternatively, the public may read and copy any materials we file with the SEC at the SEC’s Public Reference Room at 100 F Street, N.E., Washington, D.C. 20549. Information on the operation of the Public Reference Room may be obtained by calling the SEC at 1-800-SEC-0330. The SEC also maintains a web site that contains reports, proxy and information statements, and other information regarding issuers that file electronically with the SEC. The SEC’s website address is www.sec.gov.
Item 1A. Risk Factors
The following risk factors represent our current view of the known material risks facing our businesses and are important to understanding our business. These important factors, among others, sometimes have affected, or in the future could affect, our actual results and could cause our actual consolidated results during 2017, and beyond, to differ materially from those expressed in any forward-looking statements made by us or on our behalf. In addition, these risks and uncertainties could adversely impact our business, financial condition, results of operations, cash flows, common stock price, and the price of the 2024 Notes. Further, the risk factors described below are not the only risks we face. Our business, financial condition and results of operations may also be affected by additional risks and uncertainties that are not currently known to us, that we currently consider immaterial, or
16
that are not specific to us. This discussion includes a number of forward-looking statements. Please see “Cautionary Statement Concerning Forward-Looking Statements” preceding Item 1 of this report.
Business Risks
Our business depends on activity within the construction industry and the economic strength of our principal markets.
We serve substantially all end markets of the construction industry, and our results of operations are directly affected by the level of activity in the construction industry in the geographic markets we serve. Demand for our products, particularly in the commercial and industrial and residential construction markets, could decline if companies and consumers cannot obtain credit for construction projects or if the slow pace of economic activity results in delays or cancellations of projects. During 2016, commercial and industrial and residential construction accounted for 58% and 26% of our ready-mixed concrete revenue, respectively. In addition, federal and state budget issues may hurt the funding available for infrastructure spending, particularly street, highway, and other public works projects, which accounted for 16% of our revenue in 2016.
We operate principally in Texas, New York / New Jersey, and northern California with those markets representing approximately 38%, 31%, and 25%, respectively, of our consolidated revenue for 2016. Our earnings depend on the economic strength of these markets because of the high cost to transport our products relative to their price. Recently, the decline in the price of crude oil and natural gas has had an adverse impact on activity in the oil and natural gas industry in Texas, which has resulted in lower demand for construction services in Texas and consequently lower demand for ready-mixed concrete in Texas. If economic and construction activity diminishes in our principal markets or if lower demand persists in Texas, our results of operations and liquidity could be materially adversely affected.
There are risks related to our internal growth and operating strategy.
Our ability to generate internal growth will be affected by, among other factors, our ability to:
•attract new customers;
•differentiate ourselves in a competitive market by emphasizing new product development and value added services;
•hire and retain employees; and
•reduce operating and overhead expenses.
Our inability to achieve internal growth could materially and adversely affect our business, financial condition, results of operations, liquidity, and cash flows.
One key component of our operating strategy is to operate our businesses on a decentralized basis, with local or regional management retaining responsibility for day-to-day operations, profitability and the internal growth of the individual business. If we do not implement and maintain proper overall business controls, this decentralized operating strategy could result in inconsistent operating and financial practices and our overall profitability could be adversely affected.
Our failure to successfully identify, manage, and integrate acquisitions could reduce our earnings and slow our growth.
In the past two years, we completed 14 acquisitions. On an ongoing basis, as part of our strategy to pursue growth opportunities, we continue to evaluate strategic acquisition opportunities that have the potential to support and strengthen our business. There is intense competition for acquisition opportunities in our industry. Competition for acquisitions may increase the cost of, or cause us to refrain from, completing acquisitions. Our ability to complete acquisitions is dependent upon, among other things, the willingness of acquisition candidates we identify to sell; our ability to obtain financing or capital, if needed, on satisfactory terms; and, in some cases, regulatory approvals. The investigation of acquisition candidates and the negotiation, drafting and execution of relevant agreements, disclosure documents, and other instruments will require substantial management time and attention and substantial costs for accountants, attorneys, and others. If we fail to complete any acquisition for any reason, including events beyond our control, the costs incurred up to that point for the proposed acquisition likely would not be recoverable.
Potential acquisition targets may be in geographic regions in which we do not currently operate, which could result in unforeseen operating difficulties and difficulties in coordinating geographically dispersed operations, personnel and facilities. In addition, if
17
we enter into new geographic markets, we may be subject to additional and unfamiliar legal and regulatory requirements. Compliance with regulatory requirements may impose substantial additional obligations on us and our management, cause us to expend additional time and resources in compliance activities, and increase our exposure to penalties or fines for non-compliance with such additional legal requirements. Our recently completed acquisitions and any future acquisitions could cause us to become involved in labor, commercial, or regulatory disputes or litigation related to any new enterprises and could require us to invest further in operational, financial, and management information systems and to attract, retain, motivate, and effectively manage local or regional management and additional employees. Upon completion of an acquisition, key members of the management of the acquired company may resign, which would require us to attract and retain new management and could make it difficult to maintain customer relationships. Our inability to effectively manage the integration of our completed and future acquisitions could prevent us from realizing expected rates of return on an acquired business and could have a material and adverse effect on our business, financial condition, results of operations, liquidity, and cash flows.
Tightening of mortgage lending or mortgage financing requirements or eliminations or limitations of the home mortgage interest deduction could adversely affect the residential construction market and reduce the demand for new home construction.
Approximately 26% of our revenue for the year ended December 31, 2016 was from residential construction contractors. While mortgage lending conditions have improved and lending volumes have increased since 2010, tightening of mortgage lending or mortgage financing requirements could adversely affect the ability to obtain credit for some borrowers, or reduce the demand for new home construction, which could have a material adverse effect on our business and results of operations. In addition, the possible elimination or limitation of the home mortgage interest deduction could reduce the demand for new home construction, which could have a material adverse effect on our business and results of operations. Another downturn in new home construction could also adversely affect our customers focused in residential construction, possibly resulting in slower payments, higher default rates in our accounts receivable, and an overall increase in working capital.
Our ready-mixed concrete segment's revenue attributable to street, highway, and other public works projects could be negatively impacted by a decrease or delay in governmental spending.
During the year ended December 31, 2016, approximately 16% of our ready-mixed concrete revenue was from street, highway, and other public works projects. Construction activity on streets, highways, and other public works projects is directly related to the amount of government funding available for such projects, which is affected by budget constraints currently being experienced by federal, state, and local governments. In addition, if the U.S. government budget process results in a prolonged shutdown or reductions in government spending, we may experience delayed orders, delayed payments, and declines in revenues, profitability, and cash flows. Reduced levels of governmental funding for public works projects or delays in that funding could adversely affect our business, financial condition, results of operations, and cash flows.
Our business is seasonal and subject to adverse weather.
Since our business is primarily conducted outdoors, erratic weather patterns, seasonal changes, and other weather-related conditions affect our business. Adverse weather conditions, including hurricanes and tropical storms, cold weather, snow, and heavy or sustained rainfall, reduce construction activity, restrict the demand for our products, and impede our ability to efficiently deliver concrete. Adverse weather conditions could also increase our costs and reduce our production output as a result of power loss, needed plant and equipment repairs, delays in obtaining permits, time required to remove water from flooded operations, and similar events. In addition, severe drought conditions can restrict available water supplies and restrict production. Consequently, these events could adversely affect our business, financial condition, results of operations, liquidity, and cash flows.
Our operating results may vary significantly from one reporting period to another and may be adversely affected by the cyclical nature of the markets we serve.
The relative demand for our products is a function of the highly cyclical construction industry. As a result, our revenue may be adversely affected by declines in the construction industry generally and in our regional markets. Our results also may be materially affected by:
• | the level of commercial and residential construction in our regional markets, including reductions in the demand for new residential housing construction below current or historical levels; |
• | the availability of funds for public or infrastructure construction from local, state, and federal sources; |
18
• | unexpected events that delay or adversely affect our ability to deliver concrete according to our customers’ requirements; |
• | changes in interest rates and lending standards; |
• | changes in the mix of our customers and business, which result in periodic variations in the margins of jobs performed during any particular quarter; |
• | the timing and cost of acquisitions and difficulties or costs encountered when integrating acquisitions; |
• | the budgetary spending patterns of customers; |
• | increases in construction and design costs; |
• | power outages and other unexpected delays; |
• | our ability to control costs and maintain quality; |
• | employment levels; and |
• | regional or general economic conditions. |
As a result, our operating results in any particular quarter may not be indicative of the results that you can expect for any other quarter or for the entire year. Furthermore, negative trends in the ready-mixed concrete industry or in our geographic markets could have material adverse effects on our business, financial condition, results of operations, liquidity, and cash flows.
We may lose business to competitors who underbid us, and we may be otherwise unable to compete favorably in our highly competitive industry.
Our competitive position in a given market depends largely on the location and operating costs of our plants and prevailing prices in that market. Price is the primary competitive factor among suppliers for small or less complex jobs, principally in residential construction. However, timeliness of delivery and consistency of quality and service, as well as price, are the principal competitive factors among suppliers for large or complex jobs. Concrete manufacturers like us generally obtain customer contracts through local sales and marketing efforts directed at general contractors, developers, governmental agencies, and homebuilders. As a result, we depend on local relationships. We generally do not have long-term sales contracts with our customers.
Our competitors range from small, owner-operated private companies to subsidiaries or operating units of large, vertically integrated manufacturers of cement and aggregates. Our vertically integrated competitors generally have greater manufacturing, financial, and marketing resources than we have, providing them with competitive advantages. Competitors having lower operating costs than we do or having the financial resources to enable them to accept lower margins than we do will have competitive advantages over us for jobs that are particularly price-sensitive. Competitors having greater financial resources or less financial leverage than we do to invest in new mixer trucks, build plants in new areas, or pay for acquisitions also will have competitive advantages over us.
We depend on third parties for concrete equipment and supplies essential to operate our business.
We rely on third parties to sell or lease property, plant, and equipment to us and to provide us with supplies, including cement and other raw materials, necessary for our operations. We cannot assure you that our favorable working relationships with our suppliers will continue in the future. Also, there have historically been periods of supply shortages in the concrete industry, particularly in a strong economy.
If we are unable to purchase or lease necessary properties or equipment, our operations could be severely impacted. If we lose our supply contracts and receive insufficient supplies from third parties to meet our customers’ needs or if our suppliers experience price increases or disruptions to their business, such as labor disputes, supply shortages, or distribution problems, our business, financial condition, results of operations, liquidity, and cash flows could be materially and adversely affected.
Residential construction and related demand for ready-mixed concrete has increased between 2012 and 2016. While cement prices increased as a result of this increased demand, cement supplies were at levels that indicated a very low risk of cement shortages in most of our markets. Should demand increase substantially beyond our current expectations, we could experience shortages of cement in future periods, which could adversely affect our operating results by decreasing sales of ready-mixed concrete and increasing our costs of raw materials.
19
We use large amounts of electricity and diesel fuel that are subject to potential reliability issues, supply constraints, and significant price fluctuation, which could affect our financial position, operating results, and liquidity.
In our production and distribution processes, we consume significant amounts of electricity and diesel fuel. The availability and pricing of these resources are subject to market forces that are beyond our control. Furthermore, we are vulnerable to any reliability issues experienced by our suppliers, which also are beyond our control. Our suppliers contract separately for the purchase of such resources and our sources of supply could be interrupted should our suppliers not be able to obtain these materials due to higher demand or other factors that interrupt their availability. Variability in the supply and prices of these resources could materially affect our financial position, results of operations, and liquidity from period to period.
We are dependent on information technology to support many facets of our business.
If our information systems are breached, shutdown, destroyed or fail due to cyberattack, unauthorized access, natural disaster or equipment breakdown, by employees, malicious third parties, or other unauthorized persons, our business could be interrupted, proprietary information could be lost, stolen or destroyed, and our reputation could be damaged. We take measures to protect our information systems and data from such occurrences, but as cyberattacks become increasingly sophisticated, there can be no guarantee that our actions, efforts, and security measures adopted will always prevent them. Our business could be negatively affected by any such occurrences.
The departure of key personnel could disrupt our business.
We depend on the efforts of our officers and, in many cases, on senior management of our businesses. Our success will depend on retaining our officers and senior-level managers. We need to ensure that key personnel are compensated fairly and competitively to reduce the risk of departure of key personnel to our competitors or other industries. To the extent we are unable to attract or retain qualified management personnel, our business, financial condition, results of operations, liquidity, and cash flows could be materially and adversely affected. We do not carry key personnel life insurance on any of our employees.
Shortages of qualified employees may harm our business.
Our ability to provide high-quality products and services on a timely basis depends on our success in employing an adequate number of skilled plant managers, technicians and drivers. Like many of our competitors, we experience shortages of qualified personnel from time to time. We may not be able to maintain an adequate skilled labor force necessary to operate efficiently and to support our growth strategy, and our labor expenses may increase as a result of a shortage in the supply of skilled personnel.
Collective bargaining agreements, work stoppages, and other labor relations matters may result in increases in our operating costs, disruptions in our business, and decreases in our earnings.
As of December 31, 2016, approximately 38.5% of our employees were covered by collective bargaining agreements, which expire between 2017 and 2020. Our inability to negotiate acceptable new contracts or extensions of existing contracts with these unions could cause work stoppages by the affected employees. In addition, any new contracts or extensions could result in increased operating costs attributable to both union and nonunion employees. If any such work stoppages were to occur, or if other of our employees were to become represented by a union, we could experience a significant disruption of our operations and higher ongoing labor costs, which could materially and adversely affect our business, financial condition, results of operations, liquidity, and cash flows. Also, labor relations matters affecting our suppliers of cement and aggregates could adversely impact our business from time to time.
Participation in multi-employer defined benefit plans may impact our financial condition, results of operations, and cash flows.
We contribute to 15 multi-employer defined benefit plans, which are subject to the requirements of the Pension Protection Act of 2006 (the “PPA”). For multi-employer defined benefit plans, the PPA established new funding requirements or rehabilitation requirements, additional funding rules for plans that are in endangered or critical status, and enhanced disclosure requirements to participants regarding a plan’s funding status. The Worker, Retiree, and Employer Recovery Act of 2008 (the “WRERA”) provided some funding relief to defined benefit plan sponsors affected by recent market conditions. The WRERA allowed multi-employer plan sponsors to elect to freeze their current funded status at the same funding status as the preceding plan year (for example, a
20
calendar year plan that was not in critical or endangered status for 2008 was able to elect to retain that status for 2009), and sponsors of multi-employer plans in endangered or critical status in plan years beginning in 2008 or 2009 were allowed a three-year extension of funding improvement or rehabilitation plans (extending the timeline for these plans to achieve their goals from 10 years to 13 years, or from 15 years to 18 years for seriously endangered plans). A number of the multi-employer pension plans to which we contribute are underfunded and are currently subject to funding improvement or rehabilitation requirements. Additionally, if we were to withdraw partially or completely from any plan that is underfunded, we would be liable for a proportionate share of that plan’s unfunded vested benefits. Based on the information available from plan administrators, we believe that our portion of the contingent liability in the case of a full or partial withdrawal from or termination of several of these plans or the inability of plan sponsors to meet the funding or rehabilitation requirements would be material to our financial condition, results of operations, and cash flows.
Our overall profitability is sensitive to price changes and minor variations in sales volumes.
Generally, our customers are price-sensitive. Prices for our products are subject to changes in response to relatively minor fluctuations in supply and demand, general economic conditions, and market conditions, all of which are beyond our control. Because of the fixed-cost nature of our business, our overall profitability is sensitive to price changes and minor variations in sales volumes.
Instability in the financial and credit sectors may impact our business and financial condition in ways that we currently cannot predict.
Adverse or worsening economic trends could have a negative impact on our suppliers and our customers and their financial condition and liquidity, which could cause them to fail to meet their obligations to us and could have a material adverse effect on our revenue, income from operations, and cash flows. The uncertainty and volatility of the financial and credit sectors could have further impacts on our business and financial condition that we currently cannot predict or anticipate.
Turmoil in the global financial system could have an impact on our business and our financial condition. Accordingly, our ability to access the capital markets could be restricted or be available only on unfavorable terms. Limited access to the capital markets could adversely impact our ability to take advantage of business opportunities or react to changing economic and business conditions and could adversely impact our ability to execute our long-term growth strategy. Ultimately, we could be required to reduce our future capital expenditures substantially. Such a reduction could have a material adverse effect on our revenue, income from operations, and cash flows.
If one or more of the lenders under our asset-based revolving credit facility (the "Revolving Facility"), which provides for aggregate borrowings of up to $250.0 million, subject to the borrowing base, were to become unable or unwilling to perform their obligations under that facility, our borrowing capacity could be reduced. Our inability to borrow additional amounts under our Revolving Facility could limit our ability to fund our future operations and growth.
Governmental regulations, including environmental regulations, may result in increases in our operating costs and capital expenditures and decreases in our earnings.
A wide range of federal, state and local laws, ordinances and regulations apply to our operations, including the following matters:
•land usage;
•street and highway usage;
•noise levels; and
•health, safety and environmental matters.
In many instances, we must have various certificates, permits, or licenses in order to conduct our business. Our failure to maintain required certificates, permits, or licenses or to comply with applicable governmental requirements could result in substantial fines or possible revocation of our authority to conduct some of our operations. Delays in obtaining approvals for the transfer or grant of certificates, permits or licenses, or failure to obtain new certificates, permits or licenses, could impede the implementation of any acquisitions.
21
Governmental requirements that impact our operations include those relating to air quality, solid and hazardous waste management and cleanup, and water quality. These requirements are complex and subject to change. Certain laws, such as the U.S. law known as Superfund, can impose strict liability in some cases without regard to negligence or fault, including for the conduct of or conditions caused by others, or for our acts that complied with all applicable requirements when we performed them. Our compliance with amended, new or more stringent requirements, stricter interpretations of existing requirements, or the future discovery of environmental conditions may require us to make unanticipated material expenditures. In addition, we may fail to identify, or obtain indemnification for, environmental liabilities of acquired businesses. We generally do not maintain insurance to cover environmental liabilities.
Our operations are subject to various hazards that may cause personal injury or property damage and increase our operating costs.
Operating mixer trucks, particularly when loaded, exposes our drivers and others to traffic hazards. Our drivers are subject to the usual hazards associated with providing services on construction sites, while our plant personnel are subject to the hazards associated with moving and storing large quantities of heavy raw materials. Operating hazards can cause personal injury and loss of life, damage to or destruction of property, plant and equipment, and environmental damage. Although we conduct training programs designed to reduce these risks, we cannot eliminate these risks. We maintain insurance coverage in amounts we believe are consistent with industry practice; however, this insurance may not be adequate to cover all losses or liabilities we may incur in our operations, and we may not be able to maintain insurance of the types or at levels we deem necessary or adequate, or at rates we consider reasonable. A partially or completely uninsured claim, if successful and of sufficient magnitude, could have a material adverse effect on us.
The insurance policies we maintain are subject to varying levels of deductibles. Losses up to the deductible amounts are accrued based on our estimates of the ultimate liability for claims incurred and an estimate of claims incurred but not reported. If we were to experience insurance claims or costs above our estimates, our business, financial condition, results of operations, liquidity, and cash flows might be materially and adversely affected.
We previously identified a material weakness in our internal control over financial reporting relating to the accuracy and presentation of income taxes. This material weakness, if not corrected, could affect the reliability of our financial statements and have other adverse consequences.
Under Section 404 of the Sarbanes-Oxley Act of 2002, we are required to furnish a report by our management on internal control over financial reporting. This report must contain, among other matters, an assessment of the effectiveness of our internal control over financial reporting, including a statement as to whether or not our internal control over financial reporting is effective. This assessment must include disclosure of any material weaknesses in our internal control over financial reporting identified by our management. A material weakness is a deficiency, or a combination of deficiencies, in internal control over financial reporting, such that there is a reasonable possibility that a material misstatement of a company’s annual or interim consolidated financial statements will not be prevented or detected on a timely basis.
We previously identified and disclosed a material weakness in our internal control over financial reporting as of December 31, 2015 relating to the accuracy and presentation of the accounting for income taxes, including the income tax provision and related tax assets and liabilities. Despite our efforts to fully remediate the material weakness in our internal control over financial reporting as of December 31, 2015, we had not done so as of December 31, 2016. We intend to continue to take actions to fully remediate the material weakness and to further improve the effectiveness of our internal control over financial reporting. However, we can give no assurances that the measures we take will remediate the material weakness identified or that any additional material weaknesses will not arise in the future due to our failure to implement and maintain adequate internal control over financial reporting. In addition, even if we are successful in strengthening our controls and procedures, those controls and procedures may not be adequate to prevent or identify irregularities or ensure the fair presentation of our financial statements included in our periodic reports filed with the SEC.
Failure to have effective internal controls could lead to a misstatement of our financial statements. If, as a result of deficiencies in our internal controls, we cannot provide reliable financial statements, our business decision process may be adversely affected, our business and operating results could be harmed, investors could lose confidence in our reported financial information, the market price of our securities could decrease, and our ability to obtain additional financing, or additional financing on favorable
22
terms, could be adversely affected. In addition, failure to maintain effective internal control over financial reporting could result in investigations or sanctions by regulatory authorities.
We may incur material costs and losses as a result of claims that our products do not meet regulatory requirements or contractual specifications.
Our operations involve providing products that must meet building code or other regulatory requirements and contractual specifications for durability, stress-level capacity, weight-bearing capacity, and other characteristics. If we fail or are unable to provide products meeting these requirements and specifications, material claims may arise against us, and our reputation could be damaged. In the past, we have had significant claims of this kind asserted against us that we have resolved. There currently are claims, and we expect that in the future there will be additional claims, of this kind asserted against us. If a significant product-related claim or claims are resolved against us in the future, that resolution may have a material adverse effect on our business, financial condition, results of operations, liquidity, and cash flows.
Some of our plants are susceptible to damage from earthquakes, for which we have a limited amount of insurance.
We maintain only a limited amount of earthquake insurance and, therefore, we are not fully insured against earthquake risk. Any significant earthquake damage to our plants could materially and adversely affect our business, financial condition, results of operations, liquidity, and cash flows.
Increasing insurance claims and expenses could lower our profitability and increase our business risk.
The nature of our business subjects us to product liability, property damage, personal injury claims and workers’ compensation claims from time to time. Increased premiums charged by insurance carriers may further increase our insurance expense as coverage expires or otherwise cause us to raise our self-insured retention. If the number or severity of claims within our self- insured retention increases, we could suffer losses in excess of our reserves. An unusually large liability claim or a string of claims based on a failure repeated throughout our mass production process may exceed our insurance coverage or result in direct damages if we were unable or elected not to insure against certain hazards because of high premiums or other reasons. In addition, the availability of, and our ability to collect on, insurance coverage is often subject to factors beyond our control. Further, allegations relating to workers’ compensation violations may result in investigations by insurance regulatory or other governmental authorities, which investigations, if any, could have a direct or indirect material adverse effect on our ability to pursue certain types of business which, in turn, could have a material adverse effect on our business, financial position, results of operations, liquidity, and cash flows.
Our substantial indebtedness could adversely affect our financial condition and prevent us from fulfilling our obligations.
As of January 31, 2017, we had $600.0 million aggregate principal amount of outstanding 2024 Notes. We and certain of our subsidiaries are also parties to a Second Amended and Restated Loan and Security Agreement (the “Second A/R Loan Agreement”), with certain financial institutions named therein, as lenders (the “Lenders”), and Bank of America, N.A. as agent and sole lead arranger, that is secured by certain assets of the Company and the guarantors. The Second A/R Loan Agreement provides for aggregate borrowings of up to $250.0 million subject to a borrowing base under the Revolving Facility. As of January 31, 2017, we had no outstanding borrowings under the Revolving Facility.
The negative covenants in the Second A/R Loan Agreement and the Indenture allow us to incur additional indebtedness from other sources in certain circumstances.
As a result of our existing indebtedness and our capacity to incur additional indebtedness, we are, and anticipate continuing to be, a highly leveraged company. A significant portion of our cash flow will be required to pay interest and principal on our outstanding indebtedness, and we may be unable to generate sufficient cash flow from operations, or have future borrowings available under our Revolving Facility, to enable us to repay our indebtedness, including the 2024 Notes, or to fund other liquidity needs. This level of indebtedness could have important consequences, including the following:
• | it requires us to use a significant percentage of our cash flow from operations for debt service and the repayment of our indebtedness, including indebtedness we may incur in the future, and such cash flow may not be available for other purposes; |
• | it limits our ability to borrow money or sell stock to fund our working capital, capital expenditures, acquisitions, and debt |
23
service requirements;
• | our interest expense could increase if interest rates in general increase, because a portion of our indebtedness bears interest at floating rates; |
• | it may limit our flexibility in planning for, or reacting to, changes in our business and future business opportunities; |
• | we are more highly leveraged than some of our competitors, which may place us at a competitive disadvantage; |
• | it may make us more vulnerable to a downturn in our business or the economy; |
• | it may increase our cost of borrowing; |
• | it may restrict us from exploiting business opportunities; |
• | the debt service requirements of our indebtedness could make it more difficult for us to make payments on the 2024 Notes and our other indebtedness; and |
• | there would be a material adverse effect on our business and financial condition, if we were unable to service our indebtedness or obtain additional financing, as needed. |
We may not be able to generate sufficient cash flows to meet our debt service obligations and may be forced to take other actions to satisfy our obligations under our indebtedness, which may not be successful.
Our ability to make payments on and to refinance our indebtedness and to fund planned capital expenditures will depend on our ability to generate cash from our operations in the future. This, to a certain extent, is subject to general economic, financial, competitive, legislative, regulatory, and other factors that are beyond our control.
Our business may not generate sufficient cash flow from operations and future sources of capital under the Revolving Facility otherwise may not be available to us in an amount sufficient to enable us to pay our indebtedness or to fund our other liquidity needs. If we complete an acquisition, our debt service requirements could increase. We may need to refinance or restructure all or a portion of our indebtedness on or before maturity. We may not be able to refinance any of our indebtedness, including the Revolving Facility and the 2024 Notes, on commercially reasonable terms, or at all. If we cannot service our indebtedness, we may have to take actions such as selling assets, seeking additional equity, reducing or delaying capital expenditures, strategic acquisitions, investments and alliances or restructuring or refinancing our indebtedness. We may not be able to effect such actions, if necessary, on commercially reasonable terms, or at all.
Any refinancing of our debt could be at higher interest rates and may require us to comply with more onerous covenants. These alternative measures may not be successful and may not permit us to meet our scheduled debt service obligations. In the absence of such cash flows and resources, we could face substantial liquidity problems and might be required to sell material assets or operations to attempt to meet our debt service and other obligations. The Second A/R Loan Agreement and the Indenture restrict our ability to conduct asset sales and to use the proceeds from asset sales. We may not be able to consummate these asset sales to raise capital or sell assets at prices and on terms that we believe are fair, and any proceeds that we do receive may not be adequate to meet any debt service obligations then due. If we cannot meet our debt service obligations, the holders of our debt may accelerate our debt and, to the extent such debt is secured, foreclose on our assets. In such an event, we may not have sufficient assets to repay all of our debt.
We may still be able to incur significantly more debt, including secured debt. This could intensify already-existing risks related to our indebtedness.
The terms of the Indenture and the Second A/R Loan Agreement contain restrictions on our and the guarantors’ ability to incur additional indebtedness. However, these restrictions are subject to a number of important qualifications and exceptions, and the indebtedness incurred in compliance with these restrictions could be substantial. Accordingly, we or the guarantors could incur significant additional indebtedness in the future, much of which could constitute secured, senior, or pari passu indebtedness. As of December 31, 2016, our Revolving Facility provided for unused borrowing capacity of up to $221.3 million (after taking into account $12.6 million of undrawn letters of credit, $4.0 million of other availability reserves, and no outstanding borrowings under the Revolving Facility).
The Indenture permits us to incur certain additional secured debt, allows our non-guarantor subsidiaries to incur additional debt, and does not prevent us from incurring other liabilities that do not constitute indebtedness as defined in the Indenture.
24
The Indenture also, under certain circumstances, allows us to designate some of our restricted subsidiaries as unrestricted subsidiaries. Those unrestricted subsidiaries will not be subject to many of the restrictive covenants in the Indenture and therefore will be able to incur indebtedness beyond the limitations specified in the Indenture and engage in other activities in which restricted subsidiaries may not engage. If new debt is added to our currently anticipated debt levels, the related risks that we and the guarantors now face could intensify.
We may also consider investments in joint ventures or acquisitions, which may increase our indebtedness. Moreover, although the Second A/R Loan Agreement and the Indenture contain restrictions on our ability to make restricted payments, including the declaration and payment of dividends, we will be able to make substantial restricted payments under certain circumstances.
The amount of borrowings permitted under our Revolving Facility may fluctuate significantly, which may adversely affect our liquidity, results of operations, and financial position.
The amount of borrowings permitted at any time under our Revolving Facility is limited to a periodic borrowing base valuation of, among other things, our eligible accounts receivable, inventory, and mixer trucks, and, under certain circumstances, our machinery. As a result, our access to credit under our Revolving Facility is potentially subject to significant fluctuations depending on the value of the borrowing base eligible assets as of any measurement date, as well as certain discretionary rights of the administrative agent of our Revolving Facility in respect of the calculation of such borrowing base value. Our inability to borrow at current advance rates or at all under, or the early termination of, our Revolving Facility may adversely affect our liquidity, results of operations, and financial position.
Our variable rate indebtedness subjects us to interest rate risk, which could cause our debt service obligations to increase significantly.
Borrowings under our Revolving Facility are at variable rates of interest and expose us to interest rate risk. If interest rates increase, our debt service obligations on the variable rate indebtedness could increase even though the amount borrowed remains the same, and our net income and cash flows, including cash available for servicing our indebtedness, would correspondingly decrease.
Repayment of our debt is dependent on cash flow generated by our subsidiaries.
We are a holding company and substantially all of our tangible assets are owned by our subsidiaries. As such, repayment of our indebtedness, to a certain degree, is dependent on the generation of cash flow by our subsidiaries (including any subsidiaries that are not guarantors) and their ability to make such cash available to us, by dividend, loan, debt repayment, or otherwise. Our subsidiaries may not be able to, or be permitted to, make distributions or other payments to enable us to make payments in respect of our indebtedness. Each of our subsidiaries is a distinct legal entity and, under certain circumstances, legal, and contractual restrictions may limit our ability to obtain cash from our subsidiaries. While the terms of the Indenture and the Second A/R Loan Agreement limit the ability of certain of our subsidiaries to incur consensual restrictions on their ability to pay dividends or make other intercompany payments, these limitations are subject to important qualifications and exceptions. In the event that we do not receive distributions or other payments from our subsidiaries, we may be unable to make required payments on our indebtedness.
We may be unable to refinance our indebtedness.
We may need to refinance all or a portion of our indebtedness, including the Revolving Facility and the 2024 Notes, before maturity. We cannot assure you that we will be able to refinance any of our indebtedness on commercially reasonable terms or at all or that we will be able to obtain sufficient funds to enable us to repay or refinance our debt obligations on commercially reasonable terms, or at all.
A lowering or withdrawal of the ratings assigned to our debt securities by rating agencies may increase our future borrowing costs and reduce our access to capital.
Our debt currently has a non-investment grade rating, and any rating assigned could be lowered or withdrawn entirely by a rating agency if, in that rating agency’s judgment, future circumstances relating to the basis of the rating, such as adverse changes, so warrant. Consequently, real or anticipated changes in our credit ratings will generally affect the market value of the 2024 Notes.
25
Credit ratings are not recommendations to purchase, hold or sell the 2024 Notes. Additionally, credit ratings may not reflect the potential effect of risks relating to the structure of the 2024 Notes.
Our debt agreements may restrict our ability to operate our business and to pursue our business strategies.
The Second A/R Loan Agreement and the Indenture impose, and future financing agreements are likely to impose, operating and financial restrictions on our activities. These restrictions require us to comply with or maintain certain financial tests and limit or prohibit our ability to, among other things:
• | incur additional indebtedness or issue disqualified stock or preferred stock; |
• | pay dividends or make other distributions, repurchase or redeem our stock or subordinated indebtedness, or make certain investments; |
• | prepay, redeem, or repurchase certain debt; |
• | sell assets and issue capital stock of our restricted subsidiaries; |
• | incur liens; |
• | enter into agreements restricting our restricted subsidiaries’ ability to pay dividends, make loans to other U.S. Concrete entities or restrict the ability to provide liens; |
• | enter into transactions with affiliates; |
• | consolidate, merge, or sell all or substantially all of our assets; and |
• | with respect to the Indenture, designate our subsidiaries as unrestricted subsidiaries. |
The restrictive covenants in the Second A/R Loan Agreement also require us to maintain specified financial ratios and satisfy other financial condition tests in certain circumstances.
These restrictions on our ability to operate our business could seriously harm our business by, among other things, limiting our ability to take advantage of financing, merger and acquisition, and other corporate opportunities.
Various risks, uncertainties and events beyond our control could affect our ability to comply with these covenants and maintain these financial tests. Failure to comply with any of the covenants in our existing or future financing agreements could result in a default under those agreements and under other agreements containing cross-default provisions. A default would permit lenders to accelerate the maturity of the debt under these agreements and to foreclose upon any collateral securing the debt. Under these circumstances, we might not have sufficient funds or other resources to satisfy all of our obligations. In addition, the limitations imposed by financing agreements on our ability to incur additional debt and to take other actions might significantly impair our ability to obtain other financing. We cannot assure you that we will be granted waivers or amendments to these agreements if for any reason we are unable to comply with these agreements or that we will be able to refinance our debt on terms acceptable to us, or at all. In addition, an event of default under the Second A/R Loan Agreement would permit the Lenders to terminate all commitments to extend further credit under the Revolving Facility. Furthermore, if we were unable to repay the amounts due and payable under our Revolving Facility, those lenders could proceed against the collateral granted to them to secure that indebtedness.
As a result of these restrictions, we may be:
•limited in how we conduct our business;
•unable to raise additional debt or equity financing to operate during general economic or business downturns; or
•unable to compete effectively or to take advantage of new business opportunities.
These restrictions, along with restrictions that may be contained in agreements evidencing or governing future indebtedness, may affect our ability to grow in accordance with our growth strategy.
Our failure to comply with the covenants contained in the Second A/R Loan Agreement, the Indenture or any agreement under which we have incurred other indebtedness, including as a result of events beyond our control, could result in an event of default which could materially and adversely affect our operating results and our financial condition.
26
The Second A/R Loan Agreement contains certain covenants, including compliance with a fixed charge coverage ratio if our Availability (as defined in the Second A/R Loan Agreement) falls below a certain threshold. In addition, the Revolving Facility requires us to comply with various operational and other covenants. See Item 7 - “Management’s Discussion and Analysis of Financial Condition and Results of Operations” under the heading “Liquidity and Capital Resources” for a discussion of the financial covenants contained in the Second A/R Loan Agreement. Agreements governing our other indebtedness may also contain various covenants. If there were an event of default under any of our debt instruments that was not cured or waived, the holders of the defaulted debt could cause all amounts outstanding with respect to the debt to be due and payable immediately. Our assets and cash flow may not be sufficient to fully repay all obligations under our outstanding debt instruments, either upon maturity or if accelerated upon an event of default. If we were required to repurchase any of our debt securities upon a change of control, we may not be able to refinance or restructure the payments on those debt securities. If, as or when required, we are unable to repay, refinance or restructure our indebtedness under, or amend the covenants contained in, the Second A/R Loan Agreement, the Lenders could elect to terminate their commitments thereunder, cease making further loans and institute foreclosure proceedings against the assets securing their borrowings. Any such actions could force us into bankruptcy or liquidation.
The Second A/R Loan Agreement provides the lenders considerable discretion to impose reserves or availability blocks or reduce the advance rates used to calculate the value of our borrowing base, which could materially impair the amount of borrowings that would otherwise be available to us. There can be no assurance that the Lenders will not take such actions during the term of that facility and, further, were they to do so, the resulting impact of such actions could materially and adversely impair our ability to make interest payments on the 2024 Notes, among other matters.
Common Stock Investment Risks
We do not intend to pay dividends on our common stock.
We have not declared or paid any dividends on our common stock to date, and we do not anticipate paying any dividends on our common stock in the foreseeable future. We intend to reinvest all future earnings in the development and growth of our business. In addition, our Second A/R Loan Agreement and the Indenture prohibit us from paying dividends and future loan agreements may also prohibit the payment of dividends. Any future determination relating to our dividend policy will be at the discretion of our board of directors and will depend on our results of operations, financial condition, capital requirements, business opportunities, contractual restrictions, and other factors deemed relevant. To the extent we do not pay dividends on our common stock, investors must look solely to stock appreciation for a return on their investment in our common stock.
Our stock price may be volatile.
In recent years, the stock market has experienced significant price and volume fluctuations that are often unrelated to the operating performance of specific companies. The market price of our common stock may fluctuate based on a number of factors, including:
•our operating performance and the performance of other similar companies;
•news announcements relating to us or our competitors, the job market in general, and unemployment data;
•changes in earnings estimates or recommendations by research analysts;
•changes in general economic conditions;
•the arrival or departure of key personnel;
•acquisitions or other transactions involving us or our competitors; and
•other developments affecting us, our industry, or our competitors.
Our amended and restated certificate of incorporation, third amended and restated bylaws and Delaware law contain provisions that could discourage acquisition bids or merger proposals, which may adversely affect the market price of our common stock.
Provisions in our amended and restated certificate of incorporation, our third amended and restated bylaws and applicable provisions of the General Corporation Law of the State of Delaware may make it more difficult or expensive for a third party to acquire control of us even if a change of control would be beneficial to the interests of our stockholders. These provisions could
27
discourage potential takeover attempts and could adversely affect the market price of our common stock. In addition, Delaware law prohibits us from engaging in any business combination with any “interested stockholder,” meaning generally that a stockholder who beneficially owns more than 15% of our common stock cannot acquire us for a period of three years from the date this person became an interested stockholder, unless various conditions are met, such as approval of the transaction by our board of directors.
Item 1B. Unresolved Staff Comments
None.
Item 2. Properties
Facilities
Ready-mixed concrete
The table below lists our concrete plant facilities as of December 31, 2016. We believe these plants are sufficient for our current needs. The volumes shown are the volumes each location produced in 2016.
Owned | Leased | Volume (in thousands of cubic yards) | ||||||||||||||||
Locations | Fixed Standard | Volumetric | Portable | Fixed Standard | Total | |||||||||||||
California | 18 | — | 2 | 2 | 22 | 1,852 | ||||||||||||
New Jersey / New York / Washington, D.C. | 43 | — | — | 3 | 46 | 2,492 | ||||||||||||
Texas / Oklahoma | 75 | 16 | 7 | — | 98 | 3,702 | ||||||||||||
U.S. Virgin Islands | 3 | — | — | 1 | 4 | 76 | ||||||||||||
Total Ready-Mixed Concrete Segment | 139 | 16 | 9 | 6 | 170 | 8,122 | ||||||||||||
Aggregate products
The table below lists our aggregate facilities as of December 31, 2016. The volumes shown are the volumes each location produced in 2016.
Locations | Owned | Leased | Total | Volume (in thousands of tons) | ||||||||
New Jersey | 4 | — | 4 | 2,303 | ||||||||
Texas / Oklahoma | 4 | 6 | 10 | 3,069 | ||||||||
U.S. Virgin Islands | 2 | — | 2 | 258 | ||||||||
Total Aggregate Products Segment | 10 | 6 | 16 | 5,630 | ||||||||
We produce crushed stone aggregates, sand and gravel, from 16 aggregates facilities located in Texas, Oklahoma, New Jersey and the U.S. Virgin Islands. We also own two aggregate quarries that are leased to third parties for which we receive a royalty based on the volume of product produced and sold from the quarries during the term of the lease. We sell aggregates produced from the 16 facilities in Texas, Oklahoma, New Jersey and the U.S. Virgin Islands for use in commercial, industrial and public works projects in the markets they serve, as well as consume them internally in the production of ready-mixed concrete in those markets. We produced approximately 5.6 million tons of aggregates in 2016, with Texas / Oklahoma representing 54%, New Jersey representing 41%, and the U.S. Virgin Islands representing 5% of that total production. We believe our aggregates reserves provide us with additional raw materials sourcing flexibility and supply availability.
28
Other
We also own two lime slurry operations in Dallas / Ft. Worth, Texas and a concrete block plant in the U.S. Virgin Islands, and we lease three aggregates distribution terminals in Brooklyn, New York, an industrial waterfront property which operates as a marine terminal and sales yard in the U.S. Virgin Islands, and a recycled aggregates facility in Queens, New York.
Equipment
As of December 31, 2016, we had a fleet of over 1,540 owned and leased drum mixer trucks, 125 owned volumetric mixer trucks, and over 1,440 other rolling stock and vehicles. Our own mechanics service most of the fleet. We believe these vehicles generally are well maintained and are adequate for our operations. The average age of our owned drum mixer trucks is approximately nine years. The average age of our volumetric mixer trucks is approximately 10 years.
For additional information related to our properties, see Item 1. "Business" of this report.
Item 3. Legal Proceedings
The information set forth under the heading “Legal Proceedings” in Note 21, “Commitments and Contingencies,” to our consolidated financial statements included in this report is incorporated by reference into this Item 3.
Item 4. Mine Safety Disclosures
The information concerning mine safety violations or other regulatory matters required by Section 1503(a) of the Dodd-Frank Wall Street Reform and Consumer Protection Act and Item 104 of Regulation S-K is included in exhibit 95.1 to this annual report.
29
PART II
Item 5. Market for Registrant’s Common Equity, Related Stockholder Matters and Issuer Purchases of Equity Securities
Our common stock is traded on the Nasdaq Capital Market under the ticker symbol “USCR.”
As of February 21, 2017, we had 94 holders of record of our common stock and approximately 20,000 beneficial holders of our common stock.
The following table sets forth, for the periods indicated, the range of high and low intraday sales prices for our common stock:
2016 | 2015 | |||||||||||||||
High | Low | High | Low | |||||||||||||
First Quarter | $ | 63.67 | $ | 40.42 | $ | 34.24 | $ | 25.02 | ||||||||
Second Quarter | $ | 69.66 | $ | 54.08 | $ | 40.93 | $ | 32.58 | ||||||||
Third Quarter | $ | 67.61 | $ | 45.60 | $ | 57.57 | $ | 36.37 | ||||||||
Fourth Quarter | $ | 68.05 | $ | 42.82 | $ | 62.82 | $ | 45.03 | ||||||||
We have not declared or paid any dividends since our formation and currently do not intend to pay dividends for the foreseeable future. Additional information concerning restrictions on our payment of cash dividends may be found in “Management’s Discussion and Analysis of Financial Condition and Results of Operations—Liquidity and Capital Resources” in Item 7 of this report and Note 9, "Debt," to our consolidated financial statements included in this report, under the sub-headings "Senior Secured Credit Facility" and "Senior Unsecured Notes due 2024."
Issuer Purchases of Equity Securities
The following table provides information with respect to our purchases of shares of our common stock during the three month period ended December 31, 2016:
Total number of shares purchased(1) | Average price paid per share | Total number of shares purchased as part of publicly announced plans or programs(2) | Approximate dollar value of shares that may yet be purchased under the plans or programs (in thousands)(2) | |||||||||||
October 1, 2016 to October 31, 2016 | 452 | $ | 49.06 | — | $ | 45,176 | ||||||||
November 1, 2016 to November 30, 2016 | 144 | 48.10 | — | 45,176 | ||||||||||
December 1, 2016 to December 31, 2016 | 53 | 60.84 | — | 45,176 | ||||||||||
Total | 649 | $ | 49.81 | — | $ | 45,176 | ||||||||
(1) | The total number of shares purchased includes shares of our common stock acquired from employees who elected for us to make their required tax payments upon vesting of certain restricted shares by withholding a number of those vested shares having a value on the date of vesting equal to their tax obligations. |
(2) | Our share repurchase program was approved by our Board on May 15, 2014 and allows us to repurchase up to $50.0 million of our common stock until the earlier of March 31, 2017 or a determination by the Board to discontinue the repurchase program. The repurchase program does not obligate us to acquire any specific number of shares. |
30
Performance Graph
The following performance graph compares the cumulative total return to holders of our common stock since the last trading day of 2011 with the cumulative total returns of the Russell 2000 index and two peer groups selected by us (the "New Peer Group" and the "Old Peer Group"). The companies included in the New Peer Group are Cemex, S.A.B. de C.V., Eagle Materials Inc., Martin Marietta Materials Inc., Summit Materials, Inc., and Vulcan Materials Company, while the companies included in the Old Peer Group are Cemex, S.A.B. de C.V., Eagle Materials Inc., Martin Marietta Materials Inc., and Vulcan Materials Company (and are consistent with the Peer Group utilized in the prior year's Comparative Stock Performance disclosure). The change to the New Peer Group in 2016 was due to the availability of trading history for Summit Materials, Inc., which began trading on March 11, 2015. The graph assumes that the value of the investment in our common stock, the Russell 2000 index and each peer group was $100 on December 31, 2011 and is calculated assuming the quarterly reinvestment of dividends, as applicable.
Comparison of 5 Year Cumulative Total Return
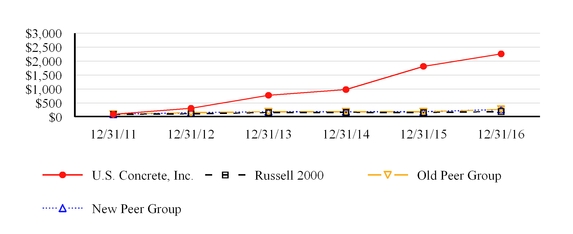
12/31/11 | 12/31/12 | 12/31/13 | 12/31/14 | 12/31/15 | 12/31/16 | ||||||||||||||||||
U.S. Concrete, Inc. | $ | 100.00 | $ | 312.07 | $ | 780.34 | $ | 981.03 | $ | 1,815.86 | $ | 2,258.62 | |||||||||||
Russell 2000 | $ | 100.00 | $ | 116.35 | $ | 161.52 | $ | 169.42 | $ | 161.94 | $ | 196.45 | |||||||||||
Old Peer Group | $ | 100.00 | $ | 158.85 | $ | 190.31 | $ | 189.87 | $ | 187.34 | $ | 277.84 | |||||||||||
New Peer Group | $ | 100.00 | $ | 158.85 | $ | 190.31 | $ | 189.87 | $ | 187.34 | $ | 274.20 | |||||||||||
The stock price performance included in this graph is not necessarily indicative of future stock price performance.
The above performance graph and related information shall not be deemed "soliciting material" or to be "filed" with the Securities and Exchange Commission, nor shall such information be incorporated by reference into any future filing under the Securities Act of 1933 or the Securities Exchange Act of 1934, each as amended, except to the extent that we specifically incorporate it by reference into such filing.
31
Item 6. Selected Financial Data
The following table provides selected consolidated financial data for the periods shown (in thousands). The data has been derived from our audited consolidated financial statements. Our historical results are not necessarily indicative of future performance or results of operations. All of the data in the table should be read in conjunction with Item 7. Management's Discussion and Analysis of Financial Condition and Results of Operations and our consolidated financial statements and related notes included in this Annual Report on Form 10-K.
2016 | 2015 | 2014 | 2013 | 2012 | ||||||||||||||||
(in thousands, except per share data) | ||||||||||||||||||||
FOR THE YEAR | ||||||||||||||||||||
Revenue | $ | 1,168,160 | $ | 974,717 | $ | 703,714 | $ | 598,155 | $ | 517,221 | ||||||||||
Income (loss) from continuing operations | $ | 9,578 | $ | (5,094 | ) | $ | 21,575 | $ | (18,273 | ) | $ | (24,351 | ) | |||||||
Loss from discontinued operations, net of taxes | $ | (717 | ) | $ | (320 | ) | $ | (993 | ) | $ | (1,856 | ) | $ | (1,388 | ) | |||||
Net income (loss) | $ | 8,861 | $ | (5,414 | ) | $ | 20,582 | $ | (20,129 | ) | $ | (25,739 | ) | |||||||
PER SHARE INFORMATION | ||||||||||||||||||||
Basic income (loss) per share: | ||||||||||||||||||||
Income (loss) from continuing operations | $ | 0.63 | $ | (0.36 | ) | $ | 1.59 | $ | (1.42 | ) | $ | (2.00 | ) | |||||||
Loss from discontinued operations, net of taxes | (0.04 | ) | (0.02 | ) | (0.07 | ) | (0.14 | ) | (0.11 | ) | ||||||||||
Net income (loss) per share - basic | $ | 0.59 | $ | (0.38 | ) | $ | 1.52 | $ | (1.56 | ) | $ | (2.11 | ) | |||||||
Diluted income (loss) per share: | ||||||||||||||||||||
Income (loss) from continuing operations | $ | 0.59 | $ | (0.36 | ) | $ | 1.55 | $ | (1.42 | ) | $ | (2.00 | ) | |||||||
Loss from discontinued operations, net of taxes | (0.04 | ) | (0.02 | ) | (0.07 | ) | (0.14 | ) | (0.11 | ) | ||||||||||
Net income (loss) per share - diluted | $ | 0.55 | $ | (0.38 | ) | $ | 1.48 | $ | (1.56 | ) | $ | (2.11 | ) | |||||||
POSITION AS OF END OF YEAR | ||||||||||||||||||||
Total assets(1) | $ | 945,402 | $ | 681,697 | $ | 453,746 | $ | 406,156 | $ | 275,054 | ||||||||||
Total debt(1) | $ | 449,298 | $ | 275,600 | $ | 213,655 | $ | 206,466 | $ | 58,854 | ||||||||||
(1) | We retrospectively adopted Accounting Standard Update 2015-03, "Simplifying the Presentation of Debt Issuance Costs," in the first quarter of 2016. As a result, we reclassified our debt issuance costs from other assets to debt on our consolidated balance sheets. For additional discussion on our debt issuance costs, see Note 1, "Organization and Summary of Significant Accounting Policies," to our consolidated financial statements included in this report. |
32
Item 7. Management’s Discussion and Analysis of Financial Condition and Results of Operations
The following discussion, which presents our results, should be read in conjunction with the accompanying consolidated financial statements and notes thereto, along with Item 1A. Risk Factors and "Cautionary Statement Concerning Forward-Looking Statements" preceding Item 1 of this report. Unless otherwise indicated, all references in this Management’s Discussion and Analysis of Financial Condition and Results of Operations related to earnings/(loss) per share ("EPS") are on a diluted basis.
Our Business
We are a leading producer of ready-mixed concrete in select geographic markets in the United States. We operate our business through two primary segments, which are ready-mixed concrete and aggregate products. The results of operations for our Pennsylvania, California, and Arizona precast operations, which were sold in prior years, have been included in discontinued operations for the periods presented.
Ready-mixed concrete. Our ready-mixed concrete segment (which represented 90.8% of our revenue for the year ended December 31, 2016) engages principally in the formulation, production, and delivery of ready-mixed concrete to our customers’ job sites. We provide our ready-mixed concrete from our operations in Texas, New Jersey, New York, Washington, D.C., northern California, Oklahoma, and the U.S. Virgin Islands. Ready-mixed concrete is a highly versatile construction material that results from combining coarse and fine aggregates, such as gravel, crushed stone and sand, with water, various chemical admixtures, and cement. We also provide services intended to reduce our customers’ overall construction costs by lowering the installed, or “in-place,” cost of concrete. These services include the formulation of mixtures for specific design uses, on-site and lab-based product quality control, and customized delivery programs to meet our customers’ needs.
Aggregate products. Our aggregate products segment (which represented 3.6% of our revenue for the year ended December 31, 2016, excluding $34.7 million of intersegment sales) produces crushed stone, sand and gravel from 16 aggregates facilities located in New Jersey, Texas, Oklahoma, and the U.S. Virgin Islands. We sell these aggregates for use in commercial, industrial and public works projects, as well as consume them internally in the production of ready-mixed concrete. We produced approximately 5.6 million tons of aggregates during the year ended December 31, 2016, with Texas / Oklahoma representing 54%, New Jersey representing 41%, and the U.S. Virgin Islands representing 5% of the total production. We consumed 51% of our aggregate production internally and sold 49% to third-party customers in 2016. We believe our aggregates reserves provide us with additional raw materials sourcing flexibility and supply availability. In addition, we own sand pit operations in Michigan and one quarry in west Texas, which we lease to third parties and receive a royalty based on the volumes produced and sold during the terms of the leases.
Overview
The geographic markets for our products are generally local, and our operating results are subject to fluctuations in the level and mix of construction activity that occur in our markets. The level of activity affects the demand for our products, while the product mix of activity among the various segments of the construction industry affects both our relative competitive strengths and our operating margins. Commercial and industrial projects generally provide more opportunities to sell value-added products that are designed to meet the high-performance requirements of those types of projects.
Our customers are generally involved in the construction industry, which is a cyclical business and is subject to general and more localized economic conditions. In addition, our business is impacted by seasonal variations in weather conditions, which vary by regional market. Accordingly, because of inclement weather, demand for our products and services during the winter months are typically lower than in other months of the year. Also, sustained periods of inclement weather and other adverse weather conditions could cause the delay of construction projects during other times of the year.
For the year ended December 31, 2016, our ready-mixed concrete sales volume increased 15.4% to 8.1 million cubic yards from 7.0 million cubic yards for the year ended December 31, 2015. Sales volume for the year ended December 31, 2016 was up in all of our major metropolitan markets, except northern California, as compared to the year ended December 31, 2015, primarily due to increased construction activity and ready-mixed segment acquisitions completed in 2016 and 2015. Northern California experienced lower volume due to certain competitive pricing pressure, delays in a limited number of project starts, and an increase in adverse weather days during the first quarter of 2016 versus the prior year period, but still recorded an overall increase in revenue in 2016 as compared to 2015.
Benefiting from our recent acquisitions and increased average selling price, total ready-mixed concrete revenue in 2016 rose year-over-year in all of our major markets, except west Texas. Our consolidated average ready-mixed concrete sales price rose 5.1% from 2015 to 2016, resulting in the 6th consecutive fiscal year of increased average selling prices. In 2016, our west Texas
33
region was adversely impacted by a change in the mix of residential and commercial customers as well as a one-time, high margin project in 2015 that did not recur. In addition, our Texas regions experienced an increase in adverse weather days during the second and third quarters of 2016 versus the prior year period. For the year ended December 31, 2016, we estimate that there was no direct impact and less than a 2.0% indirect impact on revenue in our Texas markets resulting from low West Texas Intermediate crude oil ("WTI") prices.
Higher volumes in 2016 allowed us to spread our fixed costs over more cubic yards. However, we also experienced higher cement and aggregate costs during 2016, which partially offset these improvements. We continue to closely monitor our operating costs and capital expenditures.
Basis of Presentation
We operate our business in two reportable segments: (1) ready-mixed concrete and (2) aggregate products. Our ready-mixed concrete segment produces and sells ready-mixed concrete. This segment serves the following principal markets: Texas, New York, New Jersey, Washington, D.C., northern California, Oklahoma, and the U.S. Virgin Islands. Our aggregate products segment sells crushed stone, sand and gravel products and serves north and west Texas, southern Oklahoma, New York, New Jersey, and the U.S. Virgin Islands markets in which our ready-mixed concrete segment operates.
Our chief operating decision maker evaluates segment performance and allocates resources based on Adjusted EBITDA. We define Adjusted EBITDA as income (loss) from continuing operations plus the provision (benefit) for income taxes, net interest expense, depreciation, depletion and amortization, derivative gain (loss), (gain) loss on revaluation of contingent consideration, and gain (loss) on extinguishment of debt. Additionally, we adjust Adjusted EBITDA for items similar to certain of those used in calculating the Company’s compliance with debt covenants. The additional items that are adjusted to determine our Adjusted EBITDA are:
• | non-cash stock compensation expense; |
• | corporate officer severance expense; and |
• | acquisition-related professional fees. |
We consider Adjusted EBITDA to be an indicator of the operational strength and performance of our business. We have included Adjusted EBITDA because it is a key financial measure used by our management to (1) internally measure our operating performance and (2) assess our ability to service our debt, incur additional debt and meet our capital expenditure requirements.
Adjusted EBITDA should not be construed as an alternative to, or a better indicator of, operating income or loss, is not based on accounting principles generally accepted in the United States of America ("U.S. GAAP"), and is not necessarily a measure of our cash flows or ability to fund our cash needs. Our measurement of Adjusted EBITDA may not be comparable to similarly titled measures reported by other companies, and may not be comparable to similarly titled measures used in our various agreements, including the Second A/R Loan Agreement and the Indenture. See Note 18, "Segment Information," to our consolidated financial statements included in this report for additional information regarding our segments and the reconciliation of Adjusted EBITDA to income (loss) from continuing operations.
In June 2015, we completed the sale of our remaining precast concrete operation in Pennsylvania. The results of operations for our Pennsylvania precast operations are included in discontinued operations for the periods presented.
Liquidity and Capital Resources
Overview
Our primary sources of liquidity are cash generated from operations, available cash and cash equivalents and access to our asset-based revolving credit facility (the "Revolving Facility"). During 2016, we executed the following key transactions to enhance our liquidity:
• | Issued $400.0 million aggregate principal amount of 6.375% unsecured senior notes due in 2024; |
• | Redeemed $200.0 million of our 8.5% senior secured notes due 2018 at a redemption price of $208.5 million; and |
• | Repaid $45.0 million of net borrowings under our Revolving Facility. |
We ended the year with $75.8 million of cash and cash equivalents, an increase of $71.8 million. As of the end of 2016, based on our borrowing base, we had $221.3 million available for future borrowings under the Revolving Facility, providing a total available liquidity of $297.1 million. The increase in our unused availability under the Revolving Facility to $221.3 million at year
34
end 2016 from $131.2 million at December 31, 2015 was primarily due to the repayment of all borrowings under the Revolving Facility in connection with our June 2016 offering of 6.375% unsecured notes due 2024 (the "2024 Notes") as well as an increase in the assets available to borrow against under the facility. We had no outstanding borrowings under the Revolving Facility as of December 31, 2016.
The following key financial measurements (dollars in thousands) reflect our financial condition and capital liquidity as of December 31, 2016 and 2015:
2016 | 2015 | |||||||
Cash and cash equivalents(1) | $ | 75,774 | $ | 3,925 | ||||
Working capital (deficit)(1) | $ | 71,283 | $ | (16,771 | ) | |||
Total debt(1)(2) | $ | 449,298 | $ | 275,600 | ||||
Equity | 188,829 | 134,007 | ||||||
Total capital(1) | $ | 638,127 | $ | 409,607 | ||||
Maximum capacity under our Revolving Facility | $ | 221,300 | $ | 131,200 | ||||
(1) Does not include the impact from the sale of $200.0 million aggregate principal amount of additional 2024 Notes in January 2017.
(2) Total debt includes long-term debt, net of unamortized debt issuance costs, including current maturities, capital leases, notes payable, and borrowings under the Revolving Facility.
Our primary liquidity needs over the next 12 months consist of (1) financing seasonal working capital requirements; (2) servicing our indebtedness; (3) purchasing property and equipment; and (4) payments related to strategic acquisitions. Our primary portfolio strategy includes strategic acquisitions in various regions and markets. We may seek financing for acquisitions, including additional debt or equity capital.
Our working capital needs are typically at their lowest level in the first quarter, increase in the second and third quarters to fund increases in accounts receivable and inventories during those periods, and then decrease in the fourth quarter. Availability under the Second A/R Loan Agreement is governed by a borrowing base primarily determined by our eligible accounts receivable, inventory, mixer trucks and machinery. Our borrowing base also typically declines during the first quarter due to lower accounts receivable balances as a result of normal seasonality of our business caused by weather.
Our projection of our cash needs is based upon many factors, including without limitation, our expected volume, pricing, cost of materials and capital expenditures. During 2016, we substantially exhausted our remaining operating loss carryforwards. As a result, we anticipate that our federal and state income tax payments will increase in 2017. Subsequent to year end, on January 9, 2017, we completed an offering of $200.0 million additional aggregate principal amount of 6.375% Senior Notes due 2024. Based on our projected cash needs, we believe that cash on hand, availability under the Revolving Facility, and cash generated from operations will provide us with sufficient liquidity in the ordinary course of business, not including potential acquisitions. If, however, availability under the Revolving Facility, cash on hand, and our operating cash flows are not adequate to fund our operations, we would need to obtain other equity or debt financing to provide additional liquidity, or sell assets.
The principal factors that could adversely affect the amount of our internally generated funds include:
• | deterioration of revenue, due to lower volume and/or pricing, because of weakness in the markets in which we operate; |
• | declines in gross margins due to shifts in our product mix or increases in the cost of our raw materials and fuel; |
• | any deterioration in our ability to collect our accounts receivable from customers as a result of weakening in construction demand or payment difficulties experienced by our customers; and |
• | inclement weather beyond normal patterns that could affect our sales volumes. |
The discussion that follows provides a description of our arrangements relating to our outstanding indebtedness.
Senior Secured Credit Facility
On November 18, 2015, we entered into the Second A/R Loan Agreement with Bank of America, N.A., as administrative agent, and certain financial institutions named therein, as lenders, which amended and restated the First Amended and Restated
35
Loan and Security Agreement dated October 29, 2013 and provides us with the Revolving Facility, subject to a borrowing base. The maturity date of the Revolving Facility is November 18, 2020. The Second A/R Loan Agreement also includes an accordion feature that allows for increases in the total revolving commitments by as much as $100.0 million. The Second A/R Loan Agreement is secured by a first-priority lien on substantially all of the personal property of the Company and our guarantors, subject to permitted liens and certain exceptions.
Our actual maximum credit availability under the Revolving Facility varies from time to time and is determined by calculating the value of our eligible accounts receivable, inventory, mixer trucks and machinery, minus reserves imposed by the Lenders and other adjustments, all as specified in the Second A/R Loan Agreement. The Second A/R Loan Agreement provides for swingline loans up to a $15.0 million sublimit, and letters of credit up to a $30.0 million sublimit. Loans under the Revolving Facility are in the form of either base rate loans or “LIBOR loans” denominated in U.S. dollars.
The Second A/R Loan Agreement contains usual and customary negative covenants including, but not limited to, restrictions on our ability to consolidate or merge; substantially change the nature of our business; sell, lease or otherwise transfer any of our assets; create or incur indebtedness; create liens; pay dividends or make other distributions; make loans; prepay certain indebtedness; and make investments or acquisitions. The negative covenants are subject to certain exceptions as specified in the Second A/R Loan Agreement. The Second A/R Loan Agreement also requires that we, upon the occurrence of certain events, maintain a fixed charge coverage ratio of at least 1.0 to 1.0 for each period of 12 calendar months, as determined in accordance with the Second A/R Loan Agreement. For the 12-month period ended December 31, 2016, our fixed charge coverage ratio was 2.86 to 1.0. As of December 31, 2016, we were in compliance with all covenants under the Second A/R Loan Agreement.
Senior Unsecured Notes due 2024
On June 7, 2016, we completed an offering of $400.0 million aggregate principal amount of 2024 Notes. We used a portion of the proceeds from the 2024 Notes to repay all of our outstanding borrowings on the Revolving Facility and to redeem all $200.0 million of our 8.5% senior secured notes due 2018 (the "2018 Notes"). We redeemed the 2018 Notes at a total redemption price of $208.5 million. As a result, we recorded a $12.0 million pre-tax loss on early extinguishment of debt in the second quarter of 2016, which consisted of an $8.5 million debt redemption premium and a $3.5 million write-off of unamortized deferred financing costs.
Subsequent to year end, on January 9, 2017, we sold an additional $200.0 million aggregate principal amount of 2024 Notes (the "Additional Notes") at an issue price of 105.75% of the principal amount of the notes plus accrued interest from and including December 1, 2016. The terms of the Additional Notes are identical to the terms of the existing 2024 Notes, other than the issue date, the issue price, the first interest payment date, and the provisions relating to transfer restrictions and registration rights. We intend to use the net proceeds from the offering of the Additional Notes for general corporate purposes, including funding the purchase price of future acquisitions to expand our business.
The 2024 Notes accrue interest at a rate of 6.375% per annum and interest is due on June 1 and December 1 of each year. The 2024 Notes mature on June 1, 2024 and are redeemable at our option prior to maturity at prices specified in the Indenture. The Indenture contains negative covenants that restrict our ability and our restricted subsidiaries' ability to engage in certain transactions and also contains customary events of default. The 2024 Notes are issued by U.S. Concrete, Inc., the parent company, and are guaranteed on a full and unconditional basis by each of our restricted subsidiaries that guarantees any obligations under the Revolving Facility or that guarantees certain of our other indebtedness or certain indebtedness of our restricted subsidiaries (other than foreign restricted subsidiaries that guarantee only indebtedness incurred by another foreign subsidiary). The guarantees are joint and several. U.S. Concrete, Inc. does not have any independent assets or operations, and none of its foreign subsidiaries guarantee the 2024 Notes.
The 2024 Notes and the guarantees thereof are effectively subordinated to all of our and our guarantors' existing and future secured obligations, including obligations under the Revolving Facility, to the extent of the value of the collateral securing such obligations; senior in right of payment to any of our and our guarantors' future subordinated indebtedness; pari passu in right of payment with any of our and our guarantors' existing and future senior indebtedness, including our and our guarantors' obligations under the Revolving Facility; and structurally subordinated to all existing and future indebtedness and other liabilities, including preferred stock, of any non-guarantor subsidiaries.
For additional information regarding our guarantor and non-guarantor subsidiaries, see the information set forth in Note 23, “Supplemental Condensed Consolidating Financial Information,” to our consolidated financial statements included in this report.
36
Other Debt
We have promissory notes, including those assumed from acquired businesses, with various lenders for the purchase of mixer trucks and other machinery and equipment in an aggregate principal amount of $19.9 million, with fixed annual interest rates ranging from 2.50% to 4.86%, payable monthly for a terms ranging from less than one year to five years. Also, we have lease agreements with various other lenders for the purchase of mixer trucks and other machinery and equipment for a total principal amount of $37.9 million, with fixed annual interest rates ranging from less than 0.01% to 5.24%, payable monthly for a term ranging from two to five years. The lease agreements include a one dollar buyout option at the end of the lease term. Accordingly, these financings have been classified as capital leases.
For additional information regarding our arrangements relating to outstanding indebtedness, see the information set forth in Note 9, "Debt," to our consolidated financial statements included in this report.
Fair Value of Financial Instruments
Our financial instruments consist of cash and cash equivalents, trade receivables, trade payables, long-term debt, including current maturities, other long-term obligations, and derivative liabilities. We consider the carrying values of cash and cash equivalents, trade receivables and trade payables to be representative of their respective fair values because of their short-term maturities or expected settlement dates. The carrying value of outstanding amounts under our Revolving Facility approximates fair value due to the floating interest rate. The fair value of our 2024 Notes was estimated to be $424.0 million as of December 31, 2016 based on broker/dealer quoted market prices. The fair value of our 2018 Notes, which were fully redeemed on June 7, 2016, was estimated to be $207.0 million as of December 31, 2015 based on broker / dealer quoted market prices.
The fair value of our warrants that were issued on August 31, 2010 (the "Warrants") was $57.4 million and $67.4 million at December 31, 2016 and 2015, respectively. The Warrants expire on August 31, 2017. The fair value of our contingent consideration obligations associated with acquisitions was $32.2 million at December 31, 2016 and $30.1 million at December 31, 2015. See Note 10, "Derivatives," to our consolidated financial statements included in this report for further information regarding our derivative liabilities, Note 11, "Other Long-Term Obligations and Deferred Credits," regarding our contingent consideration obligations, Note 12, "Fair Value Disclosures," regarding our fair value disclosure, and Note 14, "Warrants," regarding the Warrants.
Cash Flows
The net cash provided by or used in our operating, investing and financing activities is presented below (in thousands):
Year Ended December 31, | ||||||||||||
2016 | 2015 | 2014 | ||||||||||
Net cash provided by (used in): | ||||||||||||
Operating activities | $ | 112,124 | $ | 104,261 | $ | 50,915 | ||||||
Investing activities | (162,695 | ) | (157,835 | ) | (118,478 | ) | ||||||
Financing activities | 122,420 | 27,297 | (14,902 | ) | ||||||||
Net increase (decrease) in cash | $ | 71,849 | $ | (26,277 | ) | $ | (82,465 | ) | ||||
Net cash provided by operating activities in 2016 was $112.1 million compared to $104.3 million in 2015 and $50.9 million in 2014. Our net income in 2016 included significant charges and credits that did not impact operating cash flow, including depreciation, depletion and amortization; loss on extinguishment of debt; net loss on revaluation of contingent consideration; deferred income taxes; and loss on derivative. Overall, the generation of cash from operations in 2016, 2015 and 2014 was driven primarily by the increase in revenue and operating performance of the Company.
Our cash provided by operating activities in 2015 was $104.3 million. Our net loss in 2015 included significant charges and credits that did not impact operating cash flow, including loss on derivative; depreciation, depletion, and amortization; stock compensation expense; and a deferred income tax benefit.
Our cash provided by operating activities in 2014 was $50.9 million. Our net income in 2014 included significant charges and credits that did not impact operating cash flow, including depreciation, depletion, and amortization; stock compensation expense, and a loss on the derivative.
37
We used $162.7 million to fund investing activities in 2016, $157.8 million in 2015, and $118.5 million in 2014. During 2016, we paid $127.9 million to fund six acquisitions compared to $135.3 million paid to fund eight acquisition in 2015 and $89.6 million paid to fund nine acquisitions in 2014. In addition, we paid $40.4 million in 2016 for purchases of plant improvements, plant equipment, drum mixer trucks, and other rolling stock compared to $25.0 million in 2015 and $32.6 million in 2014. Additionally, in 2016 and 2015, we received $1.6 million and $1.2 million, respectively, related to the disposal of acquired businesses, primarily for the sale of assets in west Texas in 2015 and the sale of our remaining precast concrete operation in Pennsylvania. There were no proceeds from disposal of business units in 2014.
We expect our capital expenditures for 2017 to be approximately $60.0 million to $65.0 million, including expenditures financed through capital leases, but excluding any acquisitions. The capital expenditures will relate primarily to plant improvements, plant equipment, drum mixer trucks, and other rolling stock. In addition to financing certain of these expenditures through capital leases, we expect to fund these expenditures with cash flows from operations and existing cash and cash equivalents. Our capital expenditure budget and allocation of it to the foregoing investments are estimates and are subject to change.
Our net cash provided by financing activities was $122.4 million in 2016 and $27.3 million in 2015 compared to $14.9 million used in financing activities in 2014. Financing activities in 2016 included the proceeds from our $400.0 million 2024 Note offering, related debt issuance costs, redemption of our $200.0 million 2018 Notes including an $8.5 million redemption premium, and repayment of $45.0 million of net borrowings under our Revolving Facility. In addition, we made payments of $13.4 million related to our capital leases and other financings and paid $4.7 million for contingent and deferred consideration obligations.
Financing activities in 2015 included $45.0 million of net borrowings under our Revolving Facility to operate our business and fund acquisitions. In addition, we repaid $8.6 million of capital leases and notes used to fund capital expenditures, paid $6.3 million for the purchase of treasury shares related to our restricted stock grants, and paid $2.3 million for contingent consideration obligations.
Financing activities in 2014 included the repayment of $5.2 million of capital leases and notes used to fund capital expenditures, $4.8 million for the repurchase of our common stock under our share repurchase program, and $2.3 million related to contingent consideration obligations.
Off-Balance Sheet Arrangements
We do not currently have any off-balance sheet arrangements that have, or are reasonably likely to have, a current or future effect on our financial condition, revenue or expenses, results of operations, liquidity, capital expenditures or capital resources that is material to investors. From time to time, we may enter into noncancelable operating leases that would not be reflected on our balance sheet. For additional discussion on our operating leases, see Note 21, "Commitments and Contingencies," to our consolidated financial statements included in this report.
38
Commitments
The following are our contractual commitments associated with our indebtedness, lease obligations, and contingent consideration and deferred payment obligations related to our acquisitions as of December 31, 2016, on a pro forma basis after giving effect to our offering of the Additional Notes in January 2017 (in millions):
Contractual obligations | Total | Less Than 1 Year | 1-3 Years | 3-5 Years | More Than 5 Years | |||||||||||||||
Principal on debt | $ | 658.1 | $ | 16.7 | $ | 29.3 | $ | 12.0 | $ | 600.1 | ||||||||||
Interest on debt (1) | 286.8 | 39.5 | 78.1 | 76.8 | 92.4 | |||||||||||||||
Operating leases | 79.1 | 18.4 | 25.3 | 13.4 | 22.0 | |||||||||||||||
Contingent consideration(2) | 42.4 | 2.4 | 21.4 | 18.5 | 0.1 | |||||||||||||||
Deferred consideration payments (3) | 15.4 | 8.9 | 5.6 | 0.3 | 0.6 | |||||||||||||||
Total | $ | 1,081.8 | $ | 85.9 | $ | 159.7 | $ | 121.0 | $ | 715.2 | ||||||||||
(1) | Consists of estimated interest payments due under the 2024 Notes (including the Additional Notes), capital leases, and other borrowings. |
(2) | Consists of estimated fair value of contingent consideration obligations, including accretion, associated with acquisitions completed from 2012 through 2016. The fair value of estimated payouts is based on probability weighted assumptions related to the achievement of various contractual provisions. As more fully described in Note 12, "Fair Value Disclosures," to our consolidated financial statements, changes in the fair value of these obligations will occur prior to the final payment in 2021. |
(3) | Consists of deferred consideration obligations, including accretion, associated with acquisitions with terms ranging from one to 10 years. |
The following are our commercial commitments as of December 31, 2016 (in millions):
Other commercial commitments | Total | Less Than 1 Year | 1-3 Years | 3-5 Years | More Than 5 Years | |||||||||||||||
Standby letters of credit | $ | 12.6 | $ | 12.6 | $ | — | $ | — | $ | — | ||||||||||
Performance bonds | 40.0 | 39.7 | 0.3 | — | — | |||||||||||||||
Total | $ | 52.6 | $ | 52.3 | $ | 0.3 | $ | — | $ | — | ||||||||||
The following long-term liabilities included on the consolidated balance sheet are excluded from the table above: accrued employment costs, income tax contingencies, insurance accruals and other accruals. Due to the nature of these accruals, the estimated timing of such payments (or contributions in the case of certain accrued employment costs) for these items is not predictable. As of December 31, 2016, the total unrecognized tax benefit related to uncertain tax positions was $43.1 million. We believe it is unlikely a reduction in our uncertain tax positions will occur within the next 12 months.
Acquisitions
We completed four acquisitions for total consideration of $141.9 million in 2016 to expand our ready-mixed concrete operations in the New York metropolitan market. We also acquired two ready-mixed concrete operations in our west Texas market. For additional information on our acquisitions see Note 2, "Acquisitions and Dispositions" to our consolidated financial statements included in this report.
39
Results of Operations
Year Ended December 31, 2016 Compared to Year Ended December 31, 2015
The following table sets forth selected historical statement of operations information and that information as a percentage of revenue for each of the periods indicated, as well as the increase or decrease from the prior year in dollars and percent. Certain reclassifications have been made to prior year amounts to conform with the current year presentation.
(amounts in thousands, except selling prices) | |||||||||||||||||||||
Year Ended December 31, | Increase / (Decrease) | ||||||||||||||||||||
2016 | 2015(1) | $ | %(2) | ||||||||||||||||||
Revenue | $ | 1,168,160 | 100.0 | % | $ | 974,717 | 100.0 | % | $ | 193,443 | 19.8 | % | |||||||||
Cost of goods sold before depreciation, depletion and amortization | 922,338 | 79.0 | 768,439 | 78.8 | 153,899 | 20.0 | |||||||||||||||
Selling, general and administrative expenses | 100,019 | 8.6 | 86,873 | 8.9 | 13,146 | 15.1 | |||||||||||||||
Depreciation, depletion and amortization | 54,852 | 4.7 | 43,570 | 4.5 | 11,282 | 25.9 | |||||||||||||||
Loss on revaluation of contingent consideration, net | 5,225 | 0.4 | 932 | 0.1 | 4,293 | NM | |||||||||||||||
Gain on sale of assets, net | (1,416 | ) | (0.1 | ) | (468 | ) | — | 948 | NM | ||||||||||||
Income from operations | 87,142 | 7.5 | 75,371 | 7.7 | 11,771 | 15.6 | |||||||||||||||
Interest expense, net | (27,709 | ) | (2.4 | ) | (21,734 | ) | (2.2 | ) | 5,975 | 27.5 | |||||||||||
Derivative loss | (19,938 | ) | (1.7 | ) | (60,016 | ) | (6.2 | ) | (40,078 | ) | 66.8 | ||||||||||
Loss on early extinguishment of debt | (12,003 | ) | (1.0 | ) | — | — | 12,003 | NM | |||||||||||||
Other income, net | 3,237 | 0.3 | 2,064 | 0.2 | 1,173 | 56.8 | |||||||||||||||
Income (loss) from continuing operations before income taxes | 30,729 | 2.6 | (4,315 | ) | (0.4 | ) | 35,044 | NM | |||||||||||||
Income tax expense | 21,151 | 1.8 | 779 | 0.1 | 20,372 | NM | |||||||||||||||
Income (loss) from continuing operations | 9,578 | 0.8 | (5,094 | ) | (0.5 | ) | 14,672 | NM | |||||||||||||
Loss from discontinued operations, net of taxes | (717 | ) | (0.1 | ) | (320 | ) | — | 397 | NM | ||||||||||||
Net income (loss) | $ | 8,861 | 0.8 | % | $ | (5,414 | ) | (0.6 | )% | $ | 14,275 | 263.7 | % | ||||||||
Ready-mixed Concrete Data: | |||||||||||||||||||||
Average selling price per cubic yard | $ | 130.35 | $ | 123.98 | $ | 6.37 | 5.1 | % | |||||||||||||
Sales volume in cubic yards | 8,122 | 7,038 | 1,084 | 15.4 | % | ||||||||||||||||
Aggregates Data: | |||||||||||||||||||||
Average selling price per ton | $ | 11.97 | $ | 10.54 | $ | 1.43 | 13.6 | % | |||||||||||||
Sales volume in tons | 5,563 | 4,919 | 644 | 13.1 | % | ||||||||||||||||
(1) Certain reclassifications have been made to conform with the current year presentation.
(2) "NM" is defined as "not meaningful."
Revenue. Our 2016 total revenue grew by $193.4 million, or 19.8%, from $974.7 million in 2015 to $1.2 billion in 2016, primarily due to increased sales of ready-mixed concrete. We estimate that acquisitions completed since January 1, 2015 accounted for approximately $142.4 million, or 73.6%, of our 2016 revenue increase. Ready-mixed concrete sales rose $184.4 million, or 21.0%, from $876.6 million in 2015 to $1.1 billion in 2016, driven by a 15.4% increase in sales volume and a 5.1% increase in our average selling price. Sales of aggregate products rose to $76.3 million in 2016 from $60.4 million in 2015, an increase of $15.9 million, or 26.3%, due to a 13.6% increase in average selling price and a 13.1% increase in volume. Other product revenues
40
and eliminations, which includes our building materials, aggregate distribution, aggregate recycling, lime slurry, hauling business, concrete block, and eliminations of our intersegment sales, decreased by $6.8 million, or 18.1%, to $30.8 million in 2016 from $37.6 million in 2015, primarily due to decreased sales from our recycled aggregates business and an increase in eliminations of intercompany sales.
Cost of goods sold before depreciation, depletion and amortization ("DD&A"). Cost of goods sold increased $153.9 million, or 20.0%, from $768.4 million in 2015 to $922.3 million in 2016. Our costs increased primarily due to volume growth resulting from acquisitions in our ready-mixed concrete segment, resulting in higher material costs, delivery costs, and plant variable costs, which includes primarily labor and benefits, utilities, and repairs and maintenance. Our costs in our aggregate products segment increased primarily due to the costs from four quarries acquired in the second half of 2015 plus higher variable costs related to increased production at our existing quarries. Our fixed costs, which primarily consist of leased equipment costs, property taxes, dispatch costs, quality control, and plant management, increased over the prior year due to higher personnel and equipment costs needed to operate our facilities, as well as higher overall fixed costs to operate more locations and trucks than in 2015. As a percentage of revenue, cost of goods sold before DD&A increased marginally to 79.0% in 2016 from 78.8% in 2015.
Selling, general and administrative expenses. Selling, general and administrative, ("SG&A") expenses increased $13.1 million, or 15.1%, in 2016 from $86.9 million in 2015 to $100.0 million in 2016. Approximately $8.4 million of this increase was attributable to personnel and other general administrative costs incurred by our regional operations to support growth and acquisition infrastructure. In addition, we incurred $1.3 million in higher non-cash stock compensation expense primarily due to the increase in the fair value of awards granted in 2016. The remainder of the increase was primarily attributable to corporate-related personnel and other general expenses to support our growth initiatives. As a percentage of total revenue, SG&A expenses decreased to 8.6% in 2016 from 8.9% in 2015.
Depreciation, depletion and amortization. DD&A expense for 2016 increased $11.3 million, or 25.9%, to $54.9 million from $43.6 million in 2015, primarily reflecting depreciation on additional plants, equipment and mixer trucks purchased to service demand or acquired through recent acquisitions as well as incremental intangible amortization expense of $5.4 million related to our acquisitions.
Loss on revaluation of contingent consideration, net. We recorded a non-cash loss on revaluation of contingent consideration of $5.2 million in 2016 compared to a non-cash loss of $0.9 million in 2015. These non-cash losses are related to the fair value changes in contingent consideration associated with certain of our acquisitions. The key inputs in determining the fair value of our contingent consideration of $32.2 million at December 31, 2016 included discount rates ranging from 3.50% to 15.75% and management's estimates of future sales volumes and EBITDA. Changes in these inputs impact the valuation of our contingent consideration and result in gain or loss in each reporting period. The non-cash loss from fair value changes in contingent consideration in 2016 and 2015 was primarily due to the passage of time, changes in discount rates, and changes in the probability-weighted assumptions related to the achievement of sales volumes. The 2015 non-cash loss was partially offset by the decline in WTI prices, which reduced the amount payable under one of our arrangements.
Gain on sale of assets. We recorded a gain on sale of assets of $1.4 million in 2016 versus $0.5 million in 2015. Our gain on sale of assets in 2016 was primarily related to land sales in Texas. Our gain on sale of assets in 2016 and 2015 included sales of excess vehicles and equipment.
Income from operations. Income from operations rose $11.8 million to $87.1 million in 2016 from $75.4 million in 2015. We estimate that approximately $4.0 million, or 33.9%, of our increase in income from operations was attributable to 2016 and 2015 acquisitions. Income from operations as a percentage of revenue, which we refer to as operating margin, decreased to 7.5% for 2016 compared to 7.7% for 2015.
Interest expense, net. Net interest expense increased by $6.0 million, or 27.5%, to $27.7 million in 2016 from $21.7 million in 2015, primarily related to higher debt levels.
Derivative loss. We recorded a non-cash loss on derivatives of $19.9 million in 2016 and $60.0 million in 2015 related to fair value changes in our Warrants. Each reporting period, we determine the fair value of our derivative liabilities, and changes result in income or loss. The key inputs in determining the fair value of our derivative liabilities of $57.4 million at December 31, 2016 include our stock price, stock price volatility, and risk-free interest rates. Changes in these inputs impact the fair value of our derivative liability and result in income or loss each reporting period.
The non-cash loss from fair value changes in the Warrants for 2016 and 2015 was primarily due to an increase in the price of our common stock.
41
Loss on early extinguishment of debt. For the year ended December 31, 2016, we recorded a $12.0 million pre-tax loss on early extinguishment of debt related to the redemption of our 2018 notes. The loss consisted of a redemption premium of $8.5 million and a $3.5 million non-cash loss for the write-off of unamortized deferred financing costs.
Income tax expense. We recorded income tax expense allocated to continuing operations of approximately $21.2 million and $0.8 million for the years ended December 31, 2016 and 2015, respectively. For 2016, our effective tax rate differed substantially from the federal statutory rate primarily due to the tax impact of our Warrants, for which we recorded a non-cash $19.9 million derivative loss. The derivative loss is excluded from the calculation of our income tax provision, thus increasing our tax expense in periods when we record a derivative loss. For 2015, our effective tax rate differs substantially from the federal statutory rate primarily due to the reduction of the valuation allowance that reduced the recognized expense. Substantially offsetting our 2015 tax expense was the impact of the reversal of the Company's valuation allowance on its deferred tax assets during the fourth quarter of 2015. In addition, certain state income taxes were calculated on bases different from pre-tax income (loss), which resulted in recording income tax expense in certain states that experienced a pre-tax loss.
As of each reporting date, management considers all new evidence, both positive and negative, that could impact management's view with regard to future realization of deferred tax assets. As of December 31, 2015, we achieved a history of positive pre-tax income and anticipated significant additional future pre-tax income to be generated in part from our acquired businesses, which would result in higher U.S. Federal taxable income. For these reasons, management determined that sufficient positive evidence existed, as of December 31, 2015, to conclude that it was more likely than not that the additional deferred taxes of $21.2 million were realizable, and therefore, reversed a majority of the valuation allowance.
In accordance with U.S. GAAP, the recognized value of deferred tax assets must be reduced to the amount that is more likely than not to be realized in future periods. The ultimate realization of the benefit of deferred tax assets from deductible temporary differences or tax carryovers depends on the generation of sufficient taxable income during the periods in which those temporary differences become deductible. We considered the scheduled reversal of deferred tax liabilities, projected future taxable income, and tax planning strategies in making this assessment. Based on these considerations, we relied upon the reversal of certain deferred tax liabilities to realize a portion of our deferred tax assets and established a valuation allowance as of December 31, 2016 and 2015 for other deferred tax assets because of uncertainty regarding their ultimate realization. Our total net deferred tax liability as of December 31, 2016 was $7.7 million, and our total net deferred tax asset as of December 31, 2015 was $6.0 million.
In accordance with U.S. GAAP, intra-period tax allocation provisions require allocation of a tax expense or benefit to continuing operations due to current income (loss) from discontinued operations. We recorded income tax expense of approximately $21.2 million and $0.8 million in income from continuing operations for the years ended December 31, 2016 and 2015, respectively. We recorded a tax benefit of $0.4 million and tax expense of $0.2 million, allocated to discontinued operations for the years ended December 31, 2016 and 2015, respectively. The income tax amounts for continuing operations referred to above include the offsetting intra-period allocations. The intra-period tax allocation between the results from continuing operations and discontinued operations in the years ended December 31, 2016 and 2015 nets to $0.
Under U.S. tax law, we have elected to treat our U.S. Virgin Island subsidiaries as controlled foreign corporations. As such, we would normally consider our undistributed earnings of our U.S. Virgin Island subsidiaries, if any, to be indefinitely reinvested and, accordingly, we would normally not record incremental U.S. income taxes thereon. As of December 31, 2016, our U.S. Virgin Islands subsidiaries had no undistributed earnings, which is due to recent losses. However, we have not nor do we currently anticipate, in the foreseeable future, the need to repatriate funds to the United States to satisfy domestic liquidity needs arising in the ordinary course of business, including liquidity needs associated with our domestic debt service requirements.
Loss from discontinued operations, net of taxes. The results of operations for our sold precast units located in Pennsylvania, California, and Arizona have been included in discontinued operations for all periods presented. During 2016, we recorded a pre-tax loss of $1.2 million primarily related to real estate leases and subleases that will expire by June 30, 2018. During 2015, we recorded a pre-tax loss of $0.5 million primarily related to real estate leases and subleases and a $0.2 million loss on the sale of our Pennsylvania precast operation.
Segment information
For a discussion of our segments and segment Adjusted EBITDA, see "Basis of Presentation" under this Item 7, earlier in this report. For a discussion and reconciliation of our segment Adjusted EBITDA, see Note 18, "Segment Information," to our consolidated financial statements in this report.
42
Ready-mixed concrete
The following table sets forth key financial information for our ready-mixed concrete segment for the periods indicated:
(amounts in thousands, except selling prices) | |||||||||||||||
Year Ended December 31, | Increase / (Decrease) | ||||||||||||||
2016 | 2015 | $ or cubic yards, as applicable | % | ||||||||||||
Ready-mixed Concrete Segment: | |||||||||||||||
Revenue | $ | 1,060,991 | $ | 876,633 | $ | 184,358 | 21.0 | % | |||||||
Segment revenue as a percentage of total revenue | 90.8 | % | 89.9 | % | |||||||||||
Adjusted EBITDA | $ | 157,534 | $ | 131,940 | $ | 25,594 | 19.4 | % | |||||||
Adjusted EBITDA as a percentage of segment revenue | 14.8 | % | 15.1 | % | |||||||||||
Ready-mixed Concrete Data: | |||||||||||||||
Average selling price per cubic yard | $ | 130.35 | $ | 123.98 | $ | 6.37 | 5.1 | % | |||||||
Sales volume in cubic yards | 8,122 | 7,038 | 1,084 | 15.4 | % | ||||||||||
Revenue. Our ready-mixed concrete sales provided 90.8% and 89.9% of our total revenue in 2016 and 2015, respectively. Segment revenue for 2016 rose $184.4 million, or 21.0%, over 2015 levels. We estimate that approximately $133.7 million of this increase, or 72.5%, was due to segment acquisitions completed since January 1, 2015. The 2016 revenue increase was driven primarily by a 15.4% increase in sales volume, or 1.1 million cubic yards. Increased volume provided $134.4 million, or 72.9%, of our ready-mixed concrete revenue growth. Our sales volume was higher in our north Texas, New York / New Jersey, and Washington, D.C. markets due to increased construction activity, generally more favorable weather, and recent acquisitions. While total revenue in our northern California market increased, sales volumes decreased slightly due to an increase in adverse weather days, delays in a limited number of project starts, and some competitive pricing pressure. Our average selling price increased in all our major metropolitan markets. Total revenue was higher in all our major metropolitan markets, primarily due to higher average selling price and the impact of recent acquisitions. Sales volume and average selling price decreased in our west Texas market due to the mix of commercial and residential projects and a one-time project that was ongoing in the region in 2015.
Adjusted EBITDA. Adjusted EBITDA for our ready-mixed concrete segment rose from $131.9 million in 2015 to $157.5 million in 2016, an increase of $25.6 million, or 19.4%. We estimate that approximately $16.4 million, or 64.1%, of our 2016 Adjusted EBITDA increase resulted from acquisitions completed since January 1, 2015. Driving the growth in Adjusted EBITDA was a 15.4% increase in sales volume and a 5.1% increase in our average selling price, which resulted in $184.4 million in higher revenue. Partially offsetting the growth in revenue was the increased cost of goods sold associated with the higher volume of sales. Our variable costs, which include primarily raw material costs, labor and benefits costs, utilities, and delivery costs, were all higher primarily due to the increased volume. We also saw higher raw materials prices from our vendors during 2016, which increased our cost of goods sold for 2016. However, we were generally able to pass these price increases along to our customers. Our fixed costs, which consist primarily of property taxes, equipment rental, quality control, dispatch, and plant management costs, increased during 2016 due to higher personnel and equipment costs needed to operate our facilities, as well as higher overall fixed costs to operate more locations and trucks than in the previous year. Segment Adjusted EBITDA as a percentage of segment revenues declined slightly to 14.8% in 2016 from 15.1% in the 2015 period, primarily reflecting the geographic and project mix of our revenue and costs. Segment Adjusted EBITDA for the 2015 period was also favorably impacted by a one-time, high margin project in our west Texas market.
43
Aggregate products
The following table sets forth key financial information for our aggregate products segment for the periods indicated:
(amounts in thousands, except selling prices) | |||||||||||||||
Year Ended December 31, | Increase / (Decrease) | ||||||||||||||
2016 | 2015 | $ or tons, as applicable | % | ||||||||||||
Aggregate Products Segment: | |||||||||||||||
Revenue | $ | 76,334 | $ | 60,439 | $ | 15,895 | 26.3 | % | |||||||
Segment revenue, excluding intersegment sales, as a percentage of total revenue | 3.6 | % | 3.5 | % | |||||||||||
Adjusted EBITDA | $ | 21,731 | $ | 14,996 | $ | 6,735 | 44.9 | % | |||||||
Adjusted EBITDA as a percentage of segment revenue | 28.5 | % | 24.8 | % | |||||||||||
Aggregates Data: | |||||||||||||||
Average selling price per ton | $ | 11.97 | $ | 10.54 | $ | 1.43 | 13.6 | % | |||||||
Sales volume in tons | 5,563 | 4,919 | 644 | 13.1 | % | ||||||||||
Revenue. Sales of our aggregate products, excluding intersegment sales of $34.7 million, provided 3.6% of our total revenue in 2016, compared to 3.5%, excluding intersegment sales of $26.2 million, in 2015. Segment revenue rose $15.9 million, or 26.3%, over prior year levels. We estimate that $10.2 million, or 64.2%, of the increase was due to recent acquisitions. We sell our aggregates to external customers and also sell them internally to our ready-mixed concrete segment at a market price. Approximately 45.4% of our 2016 aggregates sales, or $34.7 million, were to our ready-mixed concrete segment, versus 43.4%, or $26.2 million, in 2015. Contributing to our overall aggregates revenue growth was an increase in our average selling price of 13.6%, which provided approximately $8.0 million, or 50.0%, of our increase in aggregates revenue. Our volume rose 0.6 million tons, which provided approximately $6.8 million, or 42.7%, of our aggregates revenue increase. Freight charges to deliver the aggregates to the external customer, as well as other charges, all of which are included in revenue, increased approximately $0.8 million providing 5.0% of our increase in aggregate revenue.
Adjusted EBITDA. Adjusted EBITDA for our aggregates segment increased to $21.7 million in 2016 from $15.0 million in 2015, primarily reflecting the higher sales volume and higher average selling price, partially offset by the related higher cost of goods sold associated with the increased volume. Our variable costs associated with cost of goods sold, which includes quarry labor and benefits, utilities, repairs and maintenance, pit costs to prepare the stone and gravel for use, and delivery costs, all rose due to the higher sales volumes. Our quarry fixed costs, which include primarily property taxes, equipment rental, and plant management costs, were higher compared to the previous year, primarily due to operating costs associated with the additional quarries acquired in the second half of 2015. Overall, our segment Adjusted EBITDA as a percentage of segment revenue increased to 28.5% in 2016 from 24.8% in 2015, primarily due to the increase in revenue and increased efficiencies.
44
Year Ended December 31, 2015 Compared to Year Ended December 31, 2014
The following table sets forth selected historical statement of operations information and that information as a percentage of revenue for each of the periods indicated, as well as the increase or decrease from the prior year in dollars and percent.
(amounts in thousands, except selling prices) | |||||||||||||||||||||
Year Ended December 31, | Increase / (Decrease) | ||||||||||||||||||||
2015(1) | 2014(1) | $ | % | ||||||||||||||||||
Revenue | $ | 974,717 | 100.0 | % | $ | 703,714 | 100.0 | % | $ | 271,003 | 38.5 | % | |||||||||
Cost of goods sold before depreciation, depletion and amortization | 768,439 | 78.8 | 573,318 | 81.5 | 195,121 | 34.0 | |||||||||||||||
Selling, general and administrative expenses | 86,873 | 8.9 | 61,268 | 8.7 | 25,605 | 41.8 | |||||||||||||||
Depreciation, depletion and amortization | 43,570 | 4.5 | 23,849 | 3.4 | 19,721 | 82.7 | |||||||||||||||
Loss on revaluation of contingent consideration, net | 932 | 0.1 | — | — | 932 | NM | |||||||||||||||
Gain on sale of assets, net | (468 | ) | — | (625 | ) | (0.1 | ) | (157 | ) | NM | |||||||||||
Income from operations | 75,371 | 7.7 | 45,904 | 6.5 | 29,467 | 64.2 | |||||||||||||||
Interest expense, net | (21,734 | ) | (2.2 | ) | (20,431 | ) | (2.9 | ) | 1,303 | 6.4 | |||||||||||
Derivative loss | (60,016 | ) | (6.2 | ) | (3,556 | ) | (0.5 | ) | 56,460 | NM | |||||||||||
Gain on early extinguishment of debt | — | — | 11 | — | (11 | ) | NM | ||||||||||||||
Other income, net | 2,064 | 0.2 | 1,803 | 0.3 | 261 | 14.5 | |||||||||||||||
(Loss) income from continuing operations before income taxes | (4,315 | ) | (0.4 | ) | 23,731 | 3.4 | (28,046 | ) | (118.2 | ) | |||||||||||
Income tax expense | 779 | 0.1 | 2,156 | 0.3 | (1,377 | ) | (63.9 | ) | |||||||||||||
(Loss) income from continuing operations | (5,094 | ) | (0.5 | ) | 21,575 | 3.1 | (26,669 | ) | (123.6 | ) | |||||||||||
Loss from discontinued operations, net of taxes | (320 | ) | — | (993 | ) | (0.1 | ) | (673 | ) | (67.8) | |||||||||||
Net (loss) income | $ | (5,414 | ) | (0.6 | )% | $ | 20,582 | 2.9 | % | $ | (25,996 | ) | (126.3 | )% | |||||||
Ready-mixed Concrete Data: | |||||||||||||||||||||
Average selling price per cubic yard | $ | 123.98 | $ | 110.85 | $ | 13.13 | 11.8 | % | |||||||||||||
Sales volume in cubic yards | 7,038 | 5,696 | 1,342 | 23.6 | % | ||||||||||||||||
Aggregates Data: | |||||||||||||||||||||
Average selling price per ton | $ | 10.54 | $ | 9.40 | $ | 1.14 | 12.1 | % | |||||||||||||
Sales volume in tons | 4,919 | 4,650 | 269 | 5.8 | % | ||||||||||||||||
(1) Certain reclassifications have been made to conform with the current year presentation.
Revenue. Our 2015 total revenue grew by $271.0 million, or 38.5%, from $703.7 million in 2014 to $974.7 million in 2015, primarily due to increased sales of ready-mixed concrete. We estimate that approximately $215.9 million, or 79.7%, of our 2015 revenue increase was the result of acquisitions completed during 2015 and 2014. Ready-mixed concrete sales rose $243.8 million, or 38.5%, from $632.8 million in 2014 to $876.6 million in 2015, driven by a 23.6% increase in volume and an 11.8% increase in our average selling price. Sales of aggregates rose to $60.4 million in 2015 from $52.6 million in 2014, an increase of $7.8 million, or 14.9%, due to a 12.1% increase in our average selling price and a 5.8% increase in volume. Other product revenues and eliminations, which includes our building materials, aggregate distribution, aggregate recycling, lime slurry, hauling business, concrete block, and eliminations of our intersegment sales, increased by $19.3 million, or 105.6%, to $37.6 million in 2015 from $18.3 million in 2014, primarily due to the addition of the aggregates distribution business in the fourth quarter of 2014.
45
Cost of goods sold before DD&A. Cost of goods sold before DD&A, increased $195.1 million, or 34.0%, from $573.3 million in 2014 to $768.4 million in 2015. Our costs were higher primarily due to volume growth in our two segments, ready-mixed concrete and aggregate products, resulting in higher material costs, delivery costs, and plant variable costs, which includes primarily labor and benefits, utilities, and repairs and maintenance. Our raw material costs also increased as a result of higher cement and aggregate prices; however, we were generally able to pass these increases on to our customers. Our plant fixed costs, which primarily consists of leased equipment costs, property taxes, dispatch costs, and plant management, increased over the prior year due to higher personnel and equipment costs needed to operate our facilities, as well as higher overall fixed costs to operate more locations and trucks than in 2014. As a percentage of revenue, cost of goods sold before DD&A decreased to 78.8% in 2015 from 81.5% in 2014, as we were able to achieve greater efficiencies from our increased sales volume.
Selling, general and administrative expenses. SG&A expenses increased $25.6 million, or 41.8%, in 2015 from $61.3 million in 2014 to $86.9 million in 2015. Approximately $16.2 million of this increase was attributable to personnel and other general administrative costs incurred by our regional operations to support growth and acquisition infrastructure. In addition, we incurred $1.2 million in higher corporate legal and professional fees related to our acquisitions and divestitures and $3.8 million in higher non-cash stock and incentive compensation expense. The increase in non-cash stock compensation expense was primarily due to the increase in the fair value of awards granted in 2015. The remainder of the increase was primarily attributable to corporate-related personnel and other general expenses to support our growth initiatives. As a percentage of total revenue, SG&A expenses increased to 8.9% in 2015 from 8.7% in 2014.
Depreciation, depletion and amortization. DD&A expense for 2015 increased $19.7 million, or 82.7%, to $43.6 million from $23.8 million in 2014, primarily reflecting depreciation on additional plants, equipment, and mixer trucks purchased to service demand and acquired through recent acquisitions as well as incremental intangible amortization expense of $9.1 million related to our acquisitions.
Loss on revaluation of contingent consideration. We recorded a non-cash loss on revaluation of contingent consideration of $0.9 million related to the fair value changes in contingent consideration associated with certain of our acquisitions in 2015. The key inputs in determining the fair value of our contingent consideration of $30.1 million in 2015 include discount rates ranging from 3.50% to 15.75%, a forecasted average of WTI prices from December 8, 2014 through December 7, 2016 from quoted sources, and management's estimates of future sales volumes and EBITDA. We had no gain or loss on revaluation of contingent consideration during 2014.
Gain on sale of assets. We recorded a gain on sale of assets of $0.5 million in 2015 versus $0.6 million in 2014. Our gain on sale of assets in 2015 and 2014 included sales of excess vehicles and equipment.
Income from operations. Income from operations rose $29.5 million to $75.4 million in 2015 from $45.9 million in 2014. Increased ready-mixed concrete revenue driven by higher volume and pricing resulted in efficiencies that led to improvements in income from operations as a percentage of revenue, which we refer to as operating margins. In addition, we estimate that approximately $12.5 million, or 42.4%, of our increase in income from operations was attributable to 2015 and 2014 acquisitions. Operating margins increased to 7.7% for 2015 compared to 6.5% for 2014.
Interest expense, net. Net interest expense increased by $1.3 million, or 6.4%, to $21.7 million in 2015 from $20.4 million in 2014, primarily related to interest on our Revolving Facility borrowings in 2015.
Derivative loss. For the 2015 period, we recorded a non-cash loss on derivatives of $60.0 million related to fair value changes in our Warrants. The non-cash loss from fair value changes in the Warrants for the 2015 period was primarily due to an increase in the price of our common stock and changes in our stock price volatility.
Income tax expense. We recorded income tax expense allocated to continuing operations of approximately $0.8 million and $2.2 million for the years ended December 31, 2015 and 2014, respectively. For 2014, our effective tax rate differs substantially from the federal statutory rate primarily due to the reduction of the valuation allowance that reduced the recognized expense. For 2015, our effective tax rate differs substantially from the federal statutory rate primarily due to the tax impact of our Warrants, for which we recorded a non-cash $60.0 million derivative loss. The derivative loss is excluded from the calculation of our income tax provision, thus increasing our tax expense in periods when we record a derivate loss. Substantially offsetting our 2015 tax expense was the impact of the reversal of the Company's valuation allowance on its deferred tax assets during the fourth quarter of 2015. In addition, certain state income taxes are calculated on bases different than pre-tax income (loss) which resulted in recording income tax expense in certain states that experience a pre-tax loss.
As of each reporting date, management considers all new evidence, both positive and negative, that could impact management's view with regard to future realization of deferred tax assets. As of December 31, 2015, we achieved a history of positive pre-tax
46
income and anticipate significant additional future pre-tax income to be generated in part from our recently acquired businesses, which will result in higher U.S. Federal taxable income. For these reasons, management determined that sufficient positive evidence existed as of December 31, 2015 to conclude that it is more likely than not that additional deferred taxes of $21.1 million are realizable, and therefore, reversed a majority of the valuation allowance accordingly.
In accordance with U.S. GAAP, the recognized value of deferred tax assets must be reduced to the amount that is more likely than not to be realized in future periods. The ultimate realization of the benefit of deferred tax assets from deductible temporary differences or tax carryovers depends on the generation of sufficient taxable income during the periods in which those temporary differences become deductible. We considered the scheduled reversal of deferred tax liabilities, projected future taxable income, and tax planning strategies in making this assessment. Based on these considerations, we relied upon the reversal of certain deferred tax liabilities to realize a portion of our deferred tax assets and established a valuation allowance as of December 31, 2015 and 2014 for other deferred tax assets because of uncertainty regarding their ultimate realization. Our total net deferred tax asset as of December 31, 2015 was $6.0 million and our total net deferred tax liability as of December 31, 2014 was $4.5 million.
In accordance with U.S. GAAP, intra-period tax allocation provisions require allocation of a tax expense or benefit to continuing operations due to current income (loss) from discontinued operations. We recorded income tax expense of approximately $0.8 million and $2.2 million in income from continuing operations for the years ended December 31, 2015 and 2014, respectively. We recorded a tax benefit of $0.2 million and tax expense of $0.2 million, allocated to discontinued operations for the years ended December 31, 2015 and 2014, respectively. The income tax amounts for continuing operations referred to above include the offsetting intra-period allocations. The intra-period tax allocation between the results from continuing operations and discontinued operations in the years ended December 31, 2015 and 2014 nets to $0.
Under U.S. tax law, we have elected to treat our U.S. Virgin Island subsidiaries as controlled foreign corporations. As such, we consider the undistributed earnings of our U.S. Virgin Island subsidiaries as of December 31, 2015 to be indefinitely reinvested and, accordingly, no U.S. income taxes have been provided thereon. As of December 31, 2015, there were no indefinitely reinvested foreign earnings. We have not, nor do we anticipate the need to, repatriate funds to the United States to satisfy domestic liquidity needs arising in the ordinary course of business, including liquidity needs associated with our domestic debt service requirements.
Loss from discontinued operations. The results of operations for our sold precast units located in Pennsylvania, California, and Arizona, have been included in discontinued operations for all periods presented. During 2015, we recorded a pre-tax loss of $0.5 million primarily related to real estate leases and subleases that will expire by June 30, 2018 and a $0.2 million loss on the sale of our Pennsylvania precast operation. During 2014, we recorded a pre-tax loss of $0.8 million primarily related to real estate leases and subleases and the completion of the sale of our remaining owned assets from our California precast operations disposed of in 2012. We sold land and a building for net proceeds of $1.5 million in cash and recorded a pre-tax gain on the transaction of $0.6 million. Also in 2014, we recorded an impairment loss on long-lived assets of $0.9 million related to our Pennsylvania precast concrete operation as the carrying value exceeded the net realizable value of the related long-lived assets.
47
Segment information
For a discussion of our segments and segment Adjusted EBITDA, see "Basis of Presentation", under this Item 7, earlier in this report. For a discussion and reconciliation of our segment Adjusted EBITDA, see Note 18, "Segment Information," to our consolidated financial statements in this report.
Ready-mixed concrete
The following table sets forth key financial information for our ready-mixed concrete segment for the periods indicated:
(amounts in thousands, except selling prices) | |||||||||||||||
Year Ended December 31, | Increase / (Decrease) | ||||||||||||||
2015 | 2014 | $ or cubic yards, as applicable | % | ||||||||||||
Ready-mixed Concrete Segment: | |||||||||||||||
Revenue | $ | 876,633 | $ | 632,787 | $ | 243,846 | 38.5 | % | |||||||
Segment revenue as a percentage of total revenue | 89.9 | % | 89.9 | % | |||||||||||
Adjusted EBITDA | $ | 131,940 | $ | 84,706 | $ | 47,234 | 55.8 | % | |||||||
Adjusted EBITDA as a percentage of segment revenue | 15.1 | % | 13.4 | % | |||||||||||
Ready-mixed Concrete Data: | |||||||||||||||
Average selling price per cubic yard | $ | 123.98 | $ | 110.85 | $ | 13.13 | 11.8 | % | |||||||
Sales volume in cubic yards | 7,038 | 5,696 | 1,342 | 23.6 | % | ||||||||||
Revenue. Our ready-mixed concrete sales provided 89.9% of our total revenue in 2015 and 2014. Segment revenue for 2015 rose $243.8 million, or 38.5%, over 2014 levels. We estimate that approximately $188.6 million of this increase, or 77.3%, was due to segment acquisitions during 2015 and 2014. The 2015 revenue increase was driven primarily by a 23.6% increase in sales volume, or 1.3 million cubic yards. Increased volume provided $148.8 million, or 61.0%, of our ready-mixed concrete revenue growth. Our sales volume was higher in all of our major markets, except west Texas, due to increased construction activity and recent acquisitions. Volume in our west Texas market decreased slightly due to the decline in WTI prices. However, total revenue was higher in all our major markets, primarily due to higher average selling price and the impact of recent acquisitions. Our ready-mixed concrete average selling price per cubic yard increased approximately 11.8% during 2015 as compared to 2014. Increased selling price contributed approximately $92.4 million, or 37.9%, of our revenue growth. Our average selling price increased in all of our markets.
Adjusted EBITDA. Adjusted EBITDA for our ready-mixed concrete segment rose from $84.7 million in 2014 to $131.9 million in 2015, an increase of $47.2 million, or 55.8%. We estimate that approximately $24.4 million, or 51.7%, of our 2015 Adjusted EBITDA increase resulted from our 2015 and 2014 segment acquisitions. Driving the growth in Adjusted EBITDA was a 23.6% increase in sales volume plus an 11.8% increase in our average selling price, which resulted in $243.8 million in higher revenue. Partially offsetting the growth in revenue was the increased cost of goods sold associated with the higher volume of sales. Our variable costs, which include primarily raw material costs, labor and benefits costs, utilities, and delivery costs, were all higher primarily due to the increased volume. We also saw higher raw materials prices from our vendors during 2015, which increased our cost of goods sold for 2015. However, we were generally able to pass these price increases along to our customers. Our fixed plant costs, which consist primarily of property taxes, equipment rental, and plant management costs, increased during 2015 due to higher personnel and equipment costs needed to operate our facilities, as well as higher overall fixed costs to operate more locations and trucks than in the previous year. Segment Adjusted EBITDA as a percentage of segment revenue rose to 15.1% in 2015 from 13.4% in the 2014 period, reflecting primarily the higher revenues and greater efficiencies.
48
Aggregate products
The following table sets forth key financial information for our aggregate products segment for the periods indicated:
(amounts in thousands, except selling prices) | |||||||||||||||
Year Ended December 31, | Increase / (Decrease) | ||||||||||||||
2015 | 2014 | $ or tons, as applicable | % | ||||||||||||
Aggregate Products Segment: | |||||||||||||||
Revenue | $ | 60,439 | $ | 52,618 | $ | 7,821 | 14.9 | % | |||||||
Segment revenue, excluding intersegment sales, as a percentage of total revenue | 3.5 | % | 4.5 | % | |||||||||||
Adjusted EBITDA | $ | 14,996 | $ | 10,549 | $ | 4,447 | 42.2 | % | |||||||
Adjusted EBITDA as a percentage of segment revenue | 24.8 | % | 20.0 | % | |||||||||||
Aggregates Data: | |||||||||||||||
Average selling price per ton | $ | 10.54 | $ | 9.40 | $ | 1.14 | 12.1 | % | |||||||
Sales volume in tons | 4,919 | 4,650 | 269 | 5.8 | % | ||||||||||
Revenue. Sales of our aggregate products, excluding intersegment sales of $26.2 million, provided 3.5% of our total revenue in 2015, compared to 4.5%, excluding intersegment sales of $21.0 million, in 2014. Segment revenue rose $7.8 million, or 14.9%, over prior year levels. We sell our aggregates to external customers and also sell them internally to our ready-mixed concrete segment at a market price. Approximately 43.4% of our 2015 aggregates sales, or $26.2 million, were to our ready-mixed concrete segment, versus 39.8%, or $21.0 million, in 2014. Contributing to our overall aggregates revenue growth was an increase in our average selling price of 12.1%, which provided approximately $5.6 million, or 71.7%, of our increase in aggregates revenue. Our volume rose 0.3 million tons, which provided approximately $2.5 million, or 32.3%, of our aggregates revenue increase. Freight charges to deliver the aggregates to the external customer, as well as other charges, all of which are included in revenue, decreased approximately $0.5 million during 2015 as compared to 2014, offsetting our aggregates revenue growth by 5.8%.
Adjusted EBITDA. Adjusted EBITDA for our aggregates segment increased to $15.0 million in the 2015 period from $10.5 million in the 2014 period, primarily reflecting the higher sales volume and higher average selling price, partially offset by the related higher cost of goods sold associated with the increased volume. Our variable costs associated with cost of goods sold, which includes quarry labor and benefits, utilities, repairs and maintenance, pit costs to prepare the stone and gravel for use, and delivery costs, all rose due to the higher sales volumes. Our quarry fixed costs, which include primarily property taxes, equipment rental, and plant management costs, were higher compared to the previous year, primarily due to operating costs associated with one quarry that commenced production during the fourth quarter of 2014 as well as three additional quarries that commenced production during 2015. Overall, our segment Adjusted EBITDA as a percentage of segment revenue increased to 24.8% in 2015 from 20.0% in 2014, primarily due to the increase in revenue and increased efficiencies.
Critical Accounting Policies and Estimates
Preparation of our financial statements requires us to make estimates and assumptions that affect the reported amounts of assets, liabilities, revenues and expenses. See Note 1, "Organization and Summary of Significant Accounting Policies," to our consolidated financial statements included in this report for more information about our significant accounting policies. We believe the most complex and sensitive judgments, because of their significance to our financial statements, result primarily from the need to make estimates about the effects of matters that are inherently uncertain. We have listed below those policies which we believe are critical and involve complex judgment in their application to our financial statements. Actual results in these areas could differ from our estimates.
49
Business Combinations
The acquisition method of accounting requires that we recognize the net assets acquired in business combinations at their acquisition date fair values. Goodwill is measured as the excess of the consideration transferred over the acquisition date net fair values of the net assets acquired and liabilities assumed. The measurement of the fair values of net assets acquired requires considerable judgment. Although independent appraisals may be used to assist in the determination of the fair values of certain assets and liabilities, the appraised values are usually based on significant estimates provided by management, such as forecasted revenue or profit.
In determining the fair value of intangible assets, we utilize the cost approach (primarily through the cost-to-recreate method), the market approach, and the income approach. The income approach may incorporate the use of a discounted cash flow method. In applying the discounted cash flow method, the estimated future cash flows and residual values for each intangible asset are discounted to a present value using a discount rate based on an estimated weighted average cost of capital for the building materials industry. These cash flow projections are based on management’s estimates of economic and market conditions including revenue growth rates, operating margins, capital expenditures and working capital requirements.
While we use our best estimates and assumptions as part of the process to value assets acquired and liabilities assumed at the acquisition date, our estimates are inherently uncertain and subject to refinement. During the measurement period, which occurs before finalization of the purchase price allocation, changes in assumptions and estimates that result in adjustments to the fair values of assets acquired and liabilities assumed are recorded in the period they are determined, with the corresponding offset to goodwill. Any adjustments subsequent to the conclusion of the measurement period will be recorded to our consolidated statements of earnings. See Note 2, "Acquisitions and Dispositions," to our consolidated financial statements included in this report for additional information about our acquisitions.
Goodwill and Goodwill Impairment
We record as goodwill the amount by which the total purchase price we pay in our acquisition transactions exceeds our estimated fair value of the identifiable net assets we acquire. We test goodwill for impairment on an annual basis, or more often if events or circumstances indicate that there may be impairment. The impairment evaluation of goodwill is a critical accounting estimate because goodwill represents 14.1% of the Company's total assets at December 31, 2016, the evaluation requires the use of significant estimates and assumptions and considerable management judgment, and an impairment charge could be material to the Company's financial condition and its results of operations. We generally test for goodwill impairment in the fourth quarter of each year using a two-step process.
The Company's reporting units, which represent the level at which goodwill is tested for impairment, are based on the geographic regions within its operating segments. The Company has identified 10 reporting units, of which nine carry goodwill. The first step of the process involves estimating the fair value of our reporting units and comparing the result to the reporting unit's carrying value. We generally estimate the fair value using an equally weighted combination of discounted cash flows and multiples of invested capital to EBITDA. The discounted cash flow model includes forecasts for revenue and cash flows discounted at our weighted-average cost of capital. Multiples of invested capital to EBITDA are calculated using a weighted average of two selected 12 month periods results by reporting unit compared to the enterprise value of the Company, which is determined based on the combination of the market value of our common stock and total outstanding debt. If the fair value exceeds the carrying value, the second step is not performed, and no impairment is recorded. If however, the fair value is below the carrying value, a second step is performed to calculate the amount of the impairment by measuring the goodwill at an implied fair value.
We completed our annual impairment assessment during the fourth quarter of 2016 for those units with goodwill as of October 1, 2016, and there was no impairment. The results of the first step of the annual impairment tests performed in the fourth quarter of 2016 indicated that the fair values of our reporting units with goodwill exceeded their carrying values. Our fair value estimates were determined using estimates and assumptions that we believed were reasonable at the time, including assumptions regarding future operating results for businesses we have recently acquired. Such estimates and assumptions are subject to inherent uncertainty. Actual results may differ materially from those estimates. Changes in those assumptions or estimates with respect to a reporting unit or its prospects, which may result from a change in market conditions, market trends, interest rates or other factors outside of our control, or significant underperformance relative to historical or projected future operating results, could significantly impact the calculated fair value of the reporting units, which could result in an impairment charge in the future. See Note 4, "Goodwill and Intangible Assets, Net," to our consolidated financial statements included in this report for additional information about our goodwill.
50
Impairment of Long-Lived Assets
We evaluate the recoverability of our long-lived assets when changes in circumstances indicate that the carrying amount of the asset may not be recoverable in accordance with authoritative accounting guidance related to the impairment or disposal of long-lived assets. We compare the carrying values of long-lived assets to our projection of future undiscounted cash flows attributable to those assets. If the carrying value of a long-lived asset exceeds the future undiscounted cash flows we project will be derived from that asset, we record an impairment loss equal to the excess of the carrying value over the fair value. Actual useful lives and future cash flows could be different from those that we estimate. These differences could have a material effect on our future operating results.
Insurance Programs
We maintain third-party insurance coverage in amounts and against the risks we believe are reasonable. We share the risk of loss with our insurance underwriters by maintaining high deductibles subject to aggregate annual loss limitations. We believe our workers’ compensation, automobile and general liability per occurrence retentions are consistent with industry practices, although there are variations among our business units. We fund these deductibles and record an expense for losses we expect under the programs. We determine the expected losses using a combination of our historical loss experience and subjective assessments of our future loss exposure. The estimated losses are subject to uncertainty from various sources, including changes in claims reporting and settlement patterns, judicial decisions, new legislation and economic conditions. Although we believe the estimated losses are reasonable, significant differences related to the items we have noted above could materially affect our insurance obligations and future expense. The amount accrued for self-insurance claims was $13.5 million as of December 31, 2016, compared to $12.0 million as of December 31, 2015, which is classified in accrued liabilities. The increase in 2016 was primarily attributable to increased loss reserves.
Income Taxes
We use the liability method of accounting for income taxes. Under this method, we record deferred income taxes based on temporary differences between the financial reporting and tax bases of assets and liabilities and use enacted tax rates and laws that we expect will be in effect when we recover those assets or settle those liabilities, as the case may be, to measure those taxes. In cases where the expiration date of tax loss carryforwards or the projected operating results indicate that realization is not likely, we provide for a valuation allowance.
We have deferred tax assets, resulting from deductible temporary differences that may reduce taxable income in future periods. A valuation allowance is required when it is more likely than not that all or a portion of a deferred tax asset will not be realized. In assessing the need for a valuation allowance, we estimate future taxable income, considering the feasibility of ongoing tax-planning strategies and the realizability of tax loss carryforwards. Valuation allowances related to deferred tax assets can be impacted by changes in tax laws, changes in statutory tax rates and future taxable income levels. If we were to determine that we would not be able to realize all or a portion of our deferred tax assets in the future, we would reduce such amounts through a charge to income in the period in which that determination is made. Conversely, if we were to determine that we would be able to realize our deferred tax assets in the future in excess of the net carrying amounts, we would decrease the recorded valuation allowance through an increase to income in the period in which that determination is made. Based on the assessment, we recorded a valuation allowance of $5.0 million at December 31, 2016 and $4.1 million at December 31, 2015. In determining the valuation allowance in 2016 and 2015, we considered such factors as (1) cumulative federal taxable losses, (2) the amount of deferred tax liabilities that we generally expect to reverse in the same period and jurisdiction that are of the same character as the temporary differences giving rise to our deferred tax assets and (3) certain tax contingencies under authoritative accounting guidance related to accounting for uncertainty in income taxes which, should they materialize, would be offset by our net operating loss generated in 2008 through 2013. We provided a valuation allowance in 2016 and 2015 related to certain state income tax attributes we did not believe we could utilize within the tax loss carryforward periods.
In the ordinary course of business, there is inherent uncertainty in quantifying our income tax positions. We assess our income tax positions and record tax benefits for all years subject to examination based upon management’s evaluation of the facts, circumstances and information available at the reporting date. For those tax positions where it is more likely than not that a tax benefit will be sustained, we have recorded the highest amount of tax benefit with a greater than 50% likelihood of being realized upon ultimate settlement with a taxing authority that has full knowledge of all relevant information. For those income tax positions where it is not more likely than not that a tax benefit will be sustained, no tax benefit has been recognized in the financial statements. See Note 15, "Income Taxes," to our consolidated financial statements included in this report for further discussion.
51
Derivative Instruments
We are required to account for derivative instruments as a result of the issuance of the Warrants. Our warrant derivatives do not manage business risk nor are they executed for speculative purposes. All derivatives are required to be recorded on the balance sheet at their fair value. Each quarter, we determine the fair value of our derivative liabilities, and changes result in gain or loss. Fair value is estimated using a Black-Scholes model for the Warrants. The key inputs in determining fair value of our derivative liabilities of $57.4 million and $67.4 million at December 31, 2016 and 2015, respectively, include our stock price, stock price volatility, and risk-free interest rates. Changes in these inputs will impact the valuation of our derivatives and result in gain or loss each quarterly period. A 5% increase in the stock price, volatility and risk free interest rates would increase the value of our Warrant derivative liability by approximately $4.6 million, resulting in a loss in the same amount. A 5% decrease would result in a decrease in the Warrant derivative liability of approximately $4.6 million, and a gain of the same amount. See Note 10, "Derivatives," to our consolidated financial statements included in this report for additional information about our derivatives.
Contingent Consideration
We record an estimate of the fair value of contingent consideration within accrued liabilities and other long-term obligations. On a quarterly basis, we revalue the liability and record increases or decreases in the fair value as an adjustment to earnings. Changes to the contingent consideration liability can result from adjustments to the discount rate, accretion of interest expense due to the passage of time, or changes in the assumptions regarding probabilities of successful achievement of related milestones and the estimated timing in which the milestones are achieved. The assumptions used in estimating fair value require significant judgment. The use of different assumptions and judgments could result in a materially different estimate of fair value. The key inputs in determining fair value of our contingent consideration obligations of $32.2 million and $30.1 million at December 31, 2016 and 2015, respectively, include discount rates ranging from 3.50% to 15.75%, a forecasted average of WTI prices from December 8, 2014 through December 7, 2016 from quoted sources, and management's estimates of future sales volumes and EBITDA. For further information, see Note 12, "Fair Value Disclosures," to our consolidated financial statements included in this report for additional information about our contingent consideration obligations.
Other
We record accruals for legal and other contingencies when estimated future expenditures associated with those contingencies become probable and the amounts can be reasonably estimated. However, new information may become available, or circumstances (such as applicable laws and regulations) may change, thereby resulting in an increase or decrease in the amount required to be accrued for such matters (and, therefore, a decrease or increase in reported net income in the period of such change).
Recent Accounting Pronouncements
For a discussion of recently issued accounting guidance that may affect our financial statements, see Note 1, "Organization and Summary of Significant Accounting Policies," to our consolidated financial statements included in this report.
52
Item 7A. Quantitative and Qualitative Disclosures About Market Risk
We do not use derivative instruments to hedge risks relating to our ongoing business operations or for speculative purposes. However, we are required to account for our Warrants as derivative instruments.
All derivatives are required to be recorded on the balance sheet at their fair values. Each quarter, we determine the fair value of our derivative liabilities. The key inputs in determining fair value of our derivative liabilities of $57.4 million and $67.4 million at December 31, 2016 and December 31, 2015, respectively, include our stock price, stock price volatility, and risk free interest rates. Changes in these inputs impact the valuation of our derivatives and result in gain or loss each quarterly period. A 5% increase in the stock price, volatility and risk free interest rates would increase the value of our Warrant derivative liability by approximately $4.6 million, resulting in a loss in the same amount. A 5% decrease would result in a decrease in the Warrant derivative liability of approximately $4.6 million, and a gain of the same amount. During the year ended December 31, 2016, we recorded a non-cash loss from fair value changes in our Warrants of approximately $19.9 million, due primarily to an increase in the price of our common stock.
Borrowings under our Revolving Facility expose us to certain market risks. Interest on amounts drawn varies based on the floating rates under the Second A/R Loan Agreement. We had no outstanding borrowings under the Revolving Facility as of December 31, 2016.
Our operations are subject to factors affecting the overall strength of the U.S. economy and economic conditions impacting financial institutions, including the level of interest rates, availability of funds for construction and level of general construction activity. A significant decrease in the level of general construction activity in any of our market areas may have a material adverse effect on our consolidated revenues and earnings.
53
Item 8. Financial Statements and Supplementary Data
INDEX TO CONSOLIDATED FINANCIAL STATEMENTS
54
Report of Independent Registered Public Accounting Firm
Board of Directors and Shareholders
U.S. Concrete, Inc.
We have audited the accompanying consolidated balance sheets of U.S. Concrete, Inc. (a Delaware corporation) and subsidiaries (the “Company”) as of December 31, 2016 and 2015, and the related consolidated statements of operations, changes in equity, and cash flows for each of the three years in the period ended December 31, 2016. These financial statements are the responsibility of the Company’s management. Our responsibility is to express an opinion on these financial statements based on our audits.
We conducted our audits in accordance with the standards of the Public Company Accounting Oversight Board (United States). Those standards require that we plan and perform the audit to obtain reasonable assurance about whether the financial statements are free of material misstatement. An audit includes examining, on a test basis, evidence supporting the amounts and disclosures in the financial statements. An audit also includes assessing the accounting principles used and significant estimates made by management, as well as evaluating the overall financial statement presentation. We believe that our audits provide a reasonable basis for our opinion.
In our opinion, the consolidated financial statements referred to above present fairly, in all material respects, the financial position of U.S. Concrete, Inc. and subsidiaries as of December 31, 2016 and 2015, and the results of their operations and their cash flows for each of the three years in the period ended December 31, 2016 in conformity with accounting principles generally accepted in the United States of America.
We also have audited, in accordance with the standards of the Public Company Accounting Oversight Board (United States), the Company’s internal control over financial reporting as of December 31, 2016, based on criteria established in the 2013 Internal Control-Integrated Framework issued by the Committee of Sponsoring Organizations of the Treadway Commission (COSO), and our report dated February 28, 2017 expressed an adverse opinion thereon.
/s/ GRANT THORNTON LLP
Dallas, Texas
February 28, 2017
55
U.S. CONCRETE, INC. AND SUBSIDARIES
CONSOLIDATED BALANCE SHEETS
(in thousands, including share amounts but excluding per share amounts)
December 31, | ||||||||
2016 | 2015 | |||||||
ASSETS | ||||||||
Current assets: | ||||||||
Cash and cash equivalents | $ | 75,774 | $ | 3,925 | ||||
Trade accounts receivable, net | 207,292 | 171,256 | ||||||
Inventories | 41,979 | 36,726 | ||||||
Prepaid expenses | 5,534 | 4,243 | ||||||
Other receivables | 8,691 | 7,765 | ||||||
Other current assets | 2,019 | 2,374 | ||||||
Total current assets | 341,289 | 226,289 | ||||||
Property, plant and equipment, net | 337,412 | 248,123 | ||||||
Goodwill | 133,271 | 100,204 | ||||||
Intangible assets, net | 130,973 | 95,754 | ||||||
Deferred income taxes | — | 6,026 | ||||||
Other assets | 2,457 | 5,301 | ||||||
Total assets | $ | 945,402 | $ | 681,697 | ||||
LIABILITIES AND EQUITY | ||||||||
Current liabilities: | ||||||||
Accounts payable | $ | 110,694 | $ | 80,419 | ||||
Accrued liabilities | 85,243 | 85,854 | ||||||
Current maturities of long-term debt | 16,654 | 9,386 | ||||||
Derivative liabilities | 57,415 | 67,401 | ||||||
Total current liabilities | 270,006 | 243,060 | ||||||
Long-term debt, net of current maturities | 432,644 | 266,214 | ||||||
Other long-term obligations and deferred credits | 46,267 | 38,416 | ||||||
Deferred income taxes | 7,656 | — | ||||||
Total liabilities | 756,573 | 547,690 | ||||||
Commitments and contingencies (Note 21) | ||||||||
Equity: | ||||||||
Preferred stock, $0.001 par value per share (10,000 shares authorized; none issued) | — | — | ||||||
Common stock, $0.001 par value per share (100,000 shares authorized; 16,584 and 15,713 shares issued, respectively; and 15,696 and 14,871 shares outstanding, respectively) | 17 | 16 | ||||||
Additional paid-in capital | 249,832 | 201,015 | ||||||
Accumulated deficit | (39,296 | ) | (48,157 | ) | ||||
Treasury stock, at cost (888 and 842 common shares, respectively) | (21,724 | ) | (18,867 | ) | ||||
Total equity | 188,829 | 134,007 | ||||||
Total liabilities and equity | $ | 945,402 | $ | 681,697 | ||||
The accompanying notes are an integral part of these consolidated financial statements.
56
U.S. CONCRETE, INC. AND SUBSIDARIES
CONSOLIDATED STATEMENTS OF OPERATIONS
(in thousands, except per share amounts)
Year Ended December 31, | ||||||||||||
2016 | 2015 | 2014 | ||||||||||
Revenue | $ | 1,168,160 | $ | 974,717 | $ | 703,714 | ||||||
Cost of goods sold before depreciation, depletion and amortization | 922,338 | 768,439 | 573,318 | |||||||||
Selling, general and administrative expenses | 100,019 | 86,873 | 61,268 | |||||||||
Depreciation, depletion and amortization | 54,852 | 43,570 | 23,849 | |||||||||
Loss on revaluation of contingent consideration, net | 5,225 | 932 | — | |||||||||
Gain on sale of assets, net | (1,416 | ) | (468 | ) | (625 | ) | ||||||
Income from operations | 87,142 | 75,371 | 45,904 | |||||||||
Interest expense, net | (27,709 | ) | (21,734 | ) | (20,431 | ) | ||||||
Derivative loss | (19,938 | ) | (60,016 | ) | (3,556 | ) | ||||||
(Loss) gain on early extinguishment of debt | (12,003 | ) | — | 11 | ||||||||
Other income, net | 3,237 | 2,064 | 1,803 | |||||||||
Income (loss) from continuing operations before income taxes | 30,729 | (4,315 | ) | 23,731 | ||||||||
Income tax expense | 21,151 | 779 | 2,156 | |||||||||
Income (loss) from continuing operations | 9,578 | (5,094 | ) | 21,575 | ||||||||
Loss from discontinued operations, net of taxes | (717 | ) | (320 | ) | (993 | ) | ||||||
Net income (loss) | $ | 8,861 | $ | (5,414 | ) | $ | 20,582 | |||||
Basic income (loss) per share: | ||||||||||||
Income (loss) from continuing operations | $ | 0.63 | $ | (0.36 | ) | $ | 1.59 | |||||
Loss from discontinued operations, net of income tax | (0.04 | ) | (0.02 | ) | (0.07 | ) | ||||||
Net income (loss) per share - basic | $ | 0.59 | $ | (0.38 | ) | $ | 1.52 | |||||
Diluted income (loss) per share: | ||||||||||||
Income (loss) from continuing operations | $ | 0.59 | $ | (0.36 | ) | $ | 1.55 | |||||
Loss from discontinued operations, net of taxes | (0.04 | ) | (0.02 | ) | (0.07 | ) | ||||||
Net income (loss) per share - diluted | $ | 0.55 | $ | (0.38 | ) | $ | 1.48 | |||||
Weighted average shares outstanding: | ||||||||||||
Basic | 15,098 | 14,080 | 13,541 | |||||||||
Diluted | 16,226 | 14,080 | 13,898 | |||||||||
The accompanying notes are an integral part of these consolidated financial statements.
57
U.S. CONCRETE, INC. AND SUBSIDARIES
CONSOLIDATED STATEMENTS OF CHANGES IN EQUITY
(in thousands)
Common Stock | |||||||||||||||||||||||
# of Shares | Par Value | Additional Paid-In Capital | Accumulated Deficit | Treasury Stock | Total Equity (Deficit) | ||||||||||||||||||
BALANCE, December 31, 2013 | 14,036 | $ | 14 | $ | 152,695 | $ | (63,325 | ) | $ | (5,657 | ) | $ | 83,727 | ||||||||||
Stock-based compensation | — | — | 3,655 | — | — | 3,655 | |||||||||||||||||
Restricted stock vesting | 28 | — | — | — | — | — | |||||||||||||||||
Restricted stock grants, net of cancellations | 169 | 1 | — | — | — | 1 | |||||||||||||||||
Stock options exercised | 27 | — | 377 | — | — | 377 | |||||||||||||||||
Warrants exercised | 1 | — | 18 | — | — | 18 | |||||||||||||||||
Share repurchase program | (200 | ) | — | — | — | (4,824 | ) | (4,824 | ) | ||||||||||||||
Other treasury share purchases | (83 | ) | — | — | — | (2,056 | ) | (2,056 | ) | ||||||||||||||
Net income | — | — | — | 20,582 | — | 20,582 | |||||||||||||||||
BALANCE, December 31, 2014 | 13,978 | $ | 15 | $ | 156,745 | $ | (42,743 | ) | $ | (12,537 | ) | $ | 101,480 | ||||||||||
Stock-based compensation | — | — | 5,824 | — | — | 5,824 | |||||||||||||||||
Excess tax benefits from share-based compensation | — | — | 4,952 | — | — | 4,952 | |||||||||||||||||
Restricted stock vesting | 22 | — | — | — | — | — | |||||||||||||||||
Restricted stock grants, net of cancellations | 200 | — | — | — | — | — | |||||||||||||||||
Stock options exercised | 15 | — | 315 | — | — | 315 | |||||||||||||||||
Warrants exercised | 359 | — | 18,091 | — | — | 18,091 | |||||||||||||||||
Share repurchase program | — | — | — | — | — | — | |||||||||||||||||
Other treasury share purchases | (145 | ) | — | — | — | (6,330 | ) | (6,330 | ) | ||||||||||||||
Common stock issuance | 442 | 1 | 15,088 | — | — | 15,089 | |||||||||||||||||
Net loss | — | — | — | (5,414 | ) | — | (5,414 | ) | |||||||||||||||
BALANCE, December 31, 2015 | 14,871 | $ | 16 | $ | 201,015 | $ | (48,157 | ) | $ | (18,867 | ) | $ | 134,007 | ||||||||||
Stock-based compensation | — | — | 7,099 | — | — | 7,099 | |||||||||||||||||
Excess tax benefits from share-based compensation | — | — | 3,787 | — | — | 3,787 | |||||||||||||||||
Restricted stock vesting | 16 | — | — | — | — | — | |||||||||||||||||
Restricted stock grants, net of cancellations | 157 | — | — | — | — | — | |||||||||||||||||
Stock options exercised | 6 | — | 105 | — | — | 105 | |||||||||||||||||
Warrants exercised | 556 | 1 | 30,166 | — | — | 30,167 | |||||||||||||||||
Other treasury share purchases | (46 | ) | — | — | — | (2,857 | ) | (2,857 | ) | ||||||||||||||
Common stock issuance | 136 | — | 7,660 | — | — | 7,660 | |||||||||||||||||
Net income | — | — | — | 8,861 | — | 8,861 | |||||||||||||||||
BALANCE, December 31, 2016 | 15,696 | $ | 17 | $ | 249,832 | $ | (39,296 | ) | $ | (21,724 | ) | $ | 188,829 | ||||||||||
The accompanying notes are an integral part of these consolidated financial statements.
58
U.S. CONCRETE, INC. AND SUBSIDARIES
CONSOLIDATED STATEMENTS OF CASH FLOWS
(in thousands)
Year Ended December 31, | ||||||||||||
2016 | 2015 | 2014 | ||||||||||
CASH FLOWS FROM OPERATING ACTIVITIES: | ||||||||||||
Net income (loss) | $ | 8,861 | $ | (5,414 | ) | $ | 20,582 | |||||
Adjustments to reconcile net income (loss) to net cash provided by operating activities: | ||||||||||||
Depreciation, depletion and amortization | 54,852 | 43,570 | 23,849 | |||||||||
Debt issuance cost amortization | 1,845 | 1,795 | 1,679 | |||||||||
Loss (gain) on extinguishment of debt | 12,003 | — | (11 | ) | ||||||||
Amortization of discount on long-term incentive plan and other accrued interest | 593 | 427 | 425 | |||||||||
Net loss on derivative | 19,938 | 60,016 | 3,556 | |||||||||
Net loss on revaluation of contingent consideration | 5,225 | 932 | — | |||||||||
Impairment of long-lived assets | — | — | 900 | |||||||||
Net gain on sale of assets | (1,416 | ) | (275 | ) | (1,265 | ) | ||||||
Excess tax benefits from stock-based compensation | (3,787 | ) | — | — | ||||||||
Deferred income taxes | 16,786 | (12,579 | ) | 864 | ||||||||
Provision for doubtful accounts and customer disputes | 2,966 | 4,198 | 1,533 | |||||||||
Stock-based compensation | 7,099 | 5,824 | 3,655 | |||||||||
Changes in assets and liabilities, excluding effects of acquisitions: | ||||||||||||
Accounts receivable | (25,588 | ) | (37,766 | ) | (13,466 | ) | ||||||
Inventories | (3,749 | ) | (383 | ) | (2,534 | ) | ||||||
Prepaid expenses and other current assets | (2,342 | ) | (886 | ) | 217 | |||||||
Other assets and liabilities, net | 2,171 | (1,341 | ) | (380 | ) | |||||||
Accounts payable and accrued liabilities | 16,667 | 46,143 | 11,311 | |||||||||
Net cash provided by operating activities | 112,124 | 104,261 | 50,915 | |||||||||
CASH FLOWS FROM INVESTING ACTIVITIES: | ||||||||||||
Purchases of property, plant and equipment | (40,425 | ) | (24,977 | ) | (32,584 | ) | ||||||
Payments for acquisitions, net of cash acquired | (127,927 | ) | (135,347 | ) | (89,602 | ) | ||||||
Proceeds from disposals of property, plant and equipment | 2,744 | 1,312 | 3,708 | |||||||||
Proceeds from disposals of acquired businesses | 1,565 | 1,177 | — | |||||||||
Insurance proceeds from property loss claim | 1,348 | — | — | |||||||||
Net cash used in investing activities | (162,695 | ) | (157,835 | ) | (118,478 | ) | ||||||
CASH FLOWS FROM FINANCING ACTIVITIES: | ||||||||||||
Proceeds from revolver borrowings | 128,904 | 206,809 | 213 | |||||||||
Repayments of revolver borrowings | (173,904 | ) | (161,809 | ) | (213 | ) | ||||||
Proceeds from issuance of debt | 400,000 | — | — | |||||||||
Repayments of debt | (200,000 | ) | (117 | ) | — | |||||||
Premium paid on early retirement of debt | (8,500 | ) | — | — | ||||||||
Proceeds from exercise of stock options and warrants | 348 | 546 | 396 | |||||||||
Payments of other long-term obligations | (4,679 | ) | (2,298 | ) | (2,250 | ) | ||||||
Payments for other financing | (13,433 | ) | (8,611 | ) | (5,194 | ) | ||||||
Excess tax benefits from stock-based compensation | 3,787 | — | — | |||||||||
Debt issuance costs | (7,824 | ) | (893 | ) | (974 | ) | ||||||
Payments for share repurchases | — | — | (4,824 | ) | ||||||||
Other treasury share purchases | (2,857 | ) | (6,330 | ) | (2,056 | ) | ||||||
Other proceeds | 578 | — | — | |||||||||
Net cash provided by (used in) financing activities | 122,420 | 27,297 | (14,902 | ) | ||||||||
NET INCREASE (DECREASE) IN CASH AND CASH EQUIVALENTS | 71,849 | (26,277 | ) | (82,465 | ) | |||||||
CASH AND CASH EQUIVALENTS AT BEGINNING OF PERIOD | 3,925 | 30,202 | 112,667 | |||||||||
CASH AND CASH EQUIVALENTS AT END OF PERIOD | $ | 75,774 | $ | 3,925 | $ | 30,202 | ||||||
59
U.S. CONCRETE, INC. AND SUBSIDARIES
CONSOLIDATED STATEMENTS OF CASH FLOWS (continued)
(in thousands)
Year Ended December 31, | ||||||||||||
2016 | 2015 | 2014 | ||||||||||
Supplemental Disclosure of Cash Flow Information: | ||||||||||||
Cash paid for interest | $ | 24,535 | $ | 19,503 | $ | 18,636 | ||||||
Cash paid for income taxes | $ | 6,735 | $ | 1,949 | $ | 1,464 | ||||||
Supplemental Disclosure of Non-cash Investing and Financing Activities: | ||||||||||||
Capital expenditures funded by capital leases and promissory notes | $ | 30,698 | $ | 23,450 | $ | 11,161 | ||||||
Acquisitions funded by stock issuance, contingent consideration and deferred payments | $ | 7,500 | $ | 50,805 | $ | — | ||||||
Dispositions funded through promissory note and deferred payments | $ | — | $ | 3,380 | $ | — | ||||||
The accompanying notes are an integral part of these consolidated financial statements.
60
1. ORGANIZATION AND SUMMARY OF SIGNIFICANT ACCOUNTING POLICIES
Nature of Operations
U.S. Concrete, Inc., a Delaware corporation, provides ready-mixed concrete, aggregates and concrete-related products and services to the construction industry in several major markets in the United States. U.S. Concrete, Inc. is a holding company and conducts its businesses through its consolidated subsidiaries. In these notes to the consolidated financial statements (these "Notes"), we refer to U.S. Concrete, Inc. and its subsidiaries as "we," "us," "our", the "Company," or "U.S. Concrete" unless we specifically state otherwise, or the context indicates otherwise.
Basis of Presentation
The consolidated financial statements consist of the accounts of U.S. Concrete, Inc. and its majority or wholly owned subsidiaries. All significant intercompany account balances and transactions have been eliminated.
During 2016, we completed six acquisitions consisting of 10 standard ready-mixed concrete plants and related assets and liabilities (see Note 2). All of the assets acquired and liabilities assumed were recorded at their respective fair value as of the date of the acquisition, and the results of operations are included in the consolidated financial statements from the respective date of acquisition.
During 2015, we completed eight acquisitions consisting of 22 standard ready-mixed concrete plants, five quarries (one of which we had operated under a lease agreement since October 2014), and related assets and liabilities (see Note 2). All of the assets acquired and liabilities assumed were recorded at their respective fair value as of the date of the acquisition, and the results of operations are included in the consolidated financial statements from the respective date of acquisition.
On June 2, 2015, we completed the sale of our remaining precast operation in Pennsylvania. This sale represented the final divestiture of the Company's owned assets related to precast operations. The results of operations for this unit have been included in discontinued operations for the periods presented.
During 2014, we completed nine acquisitions consisting of seven standard ready-mixed concrete plants and related assets, 16 volumetric ready-mixed concrete facilities, 109 volumetric ready-mixed concrete trucks and related assets, and leases to operate two aggregate distribution terminals in New York and related assets and liabilities (see Note 2). All of the assets acquired and liabilities assumed were recorded at their respective fair value as of the date of the acquisition, and the results of operations are included in the consolidated financial statements from the respective date of acquisition.
Reclassifications
Certain reclassifications have been made to prior year amounts to conform with the current year presentation.
Business Combinations
We evaluate acquisitions of assets and other similar transactions to assess whether or not the transaction should be accounted for as a business combination by assessing whether or not we have acquired inputs and processes that have the ability to create outputs. If determined to be a business combination, we account for a business acquisition under the acquisition method of accounting. The accounting rules governing business combinations require the acquiring entity in a business combination to recognize the fair value of all assets acquired and liabilities assumed and establishes the acquisition date as the fair value measurement point. Accordingly, we recognize assets acquired and liabilities assumed in a business combination, including contingent liabilities and deferred payment obligations, based on the fair value estimates as of the date of acquisition. Goodwill is measured as the excess of the fair value of the consideration paid over the fair value of the identified net assets, including intangible assets, acquired.
The fair value measurement of the identified net assets requires the significant use of estimates and is based on information that was available to management at the time these consolidated financial statements were prepared. We utilized recognized valuation techniques, including the income approach, sales approach, and cost approach to value the net assets acquired. Final
61
U.S. CONCRETE, INC. AND SUBSIDIARIES
NOTES TO CONSOLIDATED FINANCIAL STATEMENTS – (Continued)
valuations of assets and liabilities are obtained and recorded within one year from the date of the acquisition. See Note 12 for additional information regarding valuation of contingent consideration.
Cash and Cash Equivalents
We record as cash equivalents all highly liquid investments having maturities of three months or less at the original date of purchase. Our cash equivalents may include money market accounts, certificates of deposit, and commercial paper of highly rated corporate or government issuers. We classify our cash equivalents as held-to-maturity. Cash equivalents are stated at cost plus accrued interest, which approximates fair value. The maximum amount placed in any one financial institution is limited in order to reduce risk. At times, our cash and investments may be in excess of amounts insured by the Federal Deposit Insurance Corporation. We have not experienced any losses on these accounts. Cash held as collateral or escrowed for contingent liabilities is included in other current and noncurrent assets based on the expected release date of the underlying obligation.
Accounts Receivable
Accounts receivable are reported net of allowance for doubtful accounts and customer disputes. We maintain an allowance for accounts receivable that we believe may not be collected in full. A provision for bad debt expense recorded to selling, general and administrative expenses increases the allowance. A provision for customer disputes recorded as a reduction to revenue also increases the allowance. Accounts receivable are written off when we determine the receivable will not be collected and are reflected as a reduction to the allowance. We determine the amount of bad debt expense and customer dispute losses each period and the resulting adequacy of the allowance at the end of each period by using a combination of historical loss experience, a customer-by-customer analysis of our accounts receivable balances each period, and subjective assessments of our loss exposure.
Inventories
Inventories consist primarily of cement and other raw materials, aggregates at our pits and quarries, and building materials that we hold for sale or use in the ordinary course of business. Inventories are stated at the lower of cost or fair market value using the average cost and first-in, first-out ("FIFO") methods. We reduce the carrying value of our inventories for estimated excess and obsolete inventories equal to the difference between the cost of inventory and its estimated realizable value based upon assumptions about future product demand and market conditions. Once the new cost basis is established, the value is not increased with any changes in circumstances that would indicate an increase after the remeasurement. If actual product demand or market conditions are less favorable than those projected by management, inventory write-downs may be required that could result in a material change to our consolidated results of operations or financial position.
Prepaid Expenses
Prepaid expenses primarily include amounts we have paid for insurance, licenses, taxes, rent, and maintenance contracts. We expense or amortize all prepaid amounts as used or over the period of benefit, as applicable.
Property, Plant and Equipment, Net
We state property, plant and equipment at cost and use the straight-line method to compute depreciation of these assets other than mineral deposits over the following estimated useful lives: buildings and land improvements, from 10 to 40 years; machinery and equipment, from 10 to 30 years; mixers, trucks and other vehicles, from one to 12 years; and other, from three to 10 years. We capitalize leasehold improvements on properties held under operating leases and amortize those costs over the lesser of their estimated useful lives or the applicable lease term. We compute depletion of mineral deposits as such deposits are extracted utilizing the unit-of-production method. We expense maintenance and repair costs when incurred and capitalize and depreciate expenditures for major renewals and betterments that extend the useful lives of our existing assets. When we retire or dispose of property, plant or equipment, we remove the related cost and accumulated depreciation from our accounts and reflect any resulting gain or loss in our consolidated statements of operations.
62
U.S. CONCRETE, INC. AND SUBSIDIARIES
NOTES TO CONSOLIDATED FINANCIAL STATEMENTS – (Continued)
Impairment of Long-lived assets
We evaluate our long-lived assets for impairment whenever events or changes in circumstances indicate that the carrying amount of an asset may not be recoverable. Recoverability of assets is measured by comparing the carrying amount of an asset to future undiscounted net cash flows expected to be generated by the asset. Such evaluations for impairment are significantly impacted by estimates of future prices for our products, capital needs, economic trends in the applicable construction sector and other factors. If we consider such assets to be impaired, the impairment we recognize is measured by the amount by which the carrying amount of the assets exceeds their fair value. Assets to be disposed of by sale are reflected at the lower of their carrying amounts or fair values, less cost to sell. We test for impairment using a multi-tiered approach that incorporates an equal weighting to a multiple of earnings and to undiscounted estimated future cash flows.
Goodwill
Goodwill represents the excess of the fair value of consideration given over the fair value of the net tangible and identifiable intangible assets of businesses acquired. The acquisition of assets and liabilities and the resulting goodwill is allocated to the respective reporting unit. We do not amortize goodwill but instead evaluate it for impairment within the reporting unit on an annual basis, or more frequently if events or circumstances indicate that assets might be impaired. The impairment test consists of a two-step process. The annual test for impairment is generally performed in the fourth quarter of each year, because this period gives us the best visibility of the reporting units’ operating performance for the current year (seasonally, April through October are our highest revenue and production months), and our outlook for the upcoming year, because much of our customer base is finalizing operating and capital budgets during the fourth quarter. The impairment test we use involves estimating the fair value of our reporting units and comparing the result to the reporting unit's carrying value. We generally estimate fair value using an equally weighted combination of discounted cash flows and multiples of invested capital to EBITDA. The discounted cash flow model includes forecasts for revenue and cash flows discounted at our weighted average cost of capital. Multiples of invested capital to EBITDA are calculated using a weighted average of two selected 12 month periods results by reporting unit compared to the enterprise value of the Company, which is determined based on the combination of the market value of our capital stock and total outstanding debt. If the fair value exceeds the carrying value, the second step is not performed and no impairment is recorded. If, however, the fair value is less than the carrying value, a second step is performed to calculate the amount of the impairment by measuring the goodwill at an implied fair value. Based on our annual impairment test, our goodwill was not impaired as of December 31, 2016. See Note 4 for further discussion.
Intangible Assets
Our definite-lived intangible assets consist of identifiable trade names, customer relationships, non-compete agreements, leasehold interests, a favorable contract, and backlog of businesses acquired. We amortize these intangible assets over their estimated useful lives, which range from one to 25 years, using a straight-line approach. Our indefinite-lived intangible assets consist of land rights acquired in a 2014 acquisition that will be reclassified to property, plant and equipment upon the completion of certain settlement activities. For the land rights, we performed a qualitative assessment under the accounting rules for intangible assets, to determine that this indefinite-lived intangible asset was not impaired as of December 31, 2016. See Note 4 for further discussion of our intangible assets.
Debt Issuance Costs
Debt issuance costs are amortized as interest expense over the scheduled maturity period of the debt. The costs related to our line-of-credit arrangement are amortized over the term of the arrangement, regardless of whether there are any outstanding borrowings.
In April 2015, the Financial Accounting Standards Board ("FASB") issued an amendment that requires debt issuance costs to be presented in the balance sheet as a direct reduction from the carrying value of the debt, similar to the presentation of debt discounts. We adopted this standard effective with the quarter ended March 31, 2016, and include unamortized debt issuance costs in long-term debt, net of current maturities. We also elected to present debt issuance costs related to line-of-credit arrangements as a reduction of the carrying value of debt. Adoption of this standard resulted in a reclassification of our unamortized debt issuance costs of $6.1 million from other assets to long-term debt, net of current maturities, in our consolidated balance sheet as of December 31, 2015. See Note 9 for additional information regarding our debt, and Note 25 for debt issued subsequent to year end.
63
U.S. CONCRETE, INC. AND SUBSIDIARIES
NOTES TO CONSOLIDATED FINANCIAL STATEMENTS – (Continued)
Revenue
We derive substantially all of our revenue from the production and delivery of ready-mixed concrete, aggregates, and related building materials. We recognize revenue, net of sales tax, when products are delivered, selling price is fixed or determinable, persuasive evidence of an arrangement exists, and collection is reasonably assured. Amounts billed to customers for delivery costs are classified as a component of total revenues.
Cost of Goods Sold
Cost of goods sold consists primarily of product costs and operating expenses, excluding depreciation, depletion and amortization, which is reported separately. Operating expenses consist primarily of wages, benefits, insurance, and other expenses attributable to plant operations, repairs and maintenance, and delivery costs.
Selling, General and Administrative Expenses
Selling expenses consist primarily of sales commissions, salaries of sales managers, travel and entertainment expenses, and trade show expenses. General and administrative expenses consist primarily of executive and administrative compensation and benefits, office rent, utilities, communication and technology expenses, provision for doubtful accounts, and legal and professional fees.
Deferred Rent
We recognize escalating lease payments on a straight-line basis over the term of each respective lease, with the difference between cash rent payments and recognized rent expense being recorded as deferred rent in accrued liabilities on our consolidated balance sheets.
Insurance Programs
We maintain third-party insurance coverage against certain workers’ compensation, automobile and general liability risks. Under our insurance programs, we share the risk of loss with our insurance underwriters by maintaining high deductibles subject to aggregate annual loss limitations. In connection with these automobile, general liability and workers’ compensation insurance programs, we have entered into standby letters of credit agreements totaling $12.6 million and $11.3 million as of December 31, 2016 and 2015, respectively. We fund our deductibles and record an expense for losses we expect under the programs. We determine expected losses using a combination of our historical loss experience and subjective assessments of our future loss exposure. The estimated losses are subject to uncertainty, including changes in claim reporting patterns, claim settlement patterns, judicial decisions, legislation, and economic conditions. The amounts accrued for self-insured claims were $13.5 million and $12.0 million as of December 31, 2016 and 2015, respectively. We include these accruals in accrued liabilities on our consolidated balance sheets.
Income Taxes
In accordance with ASC 740 - Income Taxes, we use the liability method of accounting for income taxes. Under this method, we record deferred income taxes based on temporary differences between the financial reporting and tax bases of assets and liabilities and use enacted tax rates and laws that we expect will be in effect when we recover those assets or settle those liabilities, as the case may be, to measure those taxes. We record a valuation allowance to reduce the deferred tax assets to the amount that is more likely than not to be realized. We recognize interest and penalties related to uncertain tax positions in income tax expense.
We had a valuation allowance of $5.0 million and $4.1 million as of December 31, 2016 and 2015, respectively. In 2016 and 2015, we netted the majority of our uncertain tax positions against our net operating loss carryforwards and the deferred tax asset associated with the Warrants (as defined herein).
Contingent Consideration
We record an estimate of the fair value of contingent consideration within accrued liabilities and other long-term obligations on our consolidated balance sheets. On a quarterly basis, we revalue the liability and record increases or decreases in the fair value as an adjustment to earnings. Changes to the contingent consideration liability can result from adjustments to the discount rate,
64
U.S. CONCRETE, INC. AND SUBSIDIARIES
NOTES TO CONSOLIDATED FINANCIAL STATEMENTS – (Continued)
accretion of interest expense due to the passage of time, or changes in the assumptions regarding probabilities of successful achievement of related milestones and the estimated timing in which the milestones are achieved. The assumptions used in estimating fair value require significant judgment. The use of different assumptions and judgments could result in a materially different estimate of fair value. For further information, see Note 12 regarding our fair value disclosures.
Fair Value of Financial Instruments
Our financial instruments consist of cash and cash equivalents, trade receivables, trade payables, long-term debt (including current maturities), other long-term obligations, and derivative liabilities. We consider the carrying values of cash and cash equivalents, trade receivables and trade payables to be representative of their respective fair values because of their short-term maturities or expected settlement dates. The fair value of our 2024 Notes, estimated based on broker / dealer quoted market prices, was $424.0 million as of December 31, 2016. The fair value of our 2018 Notes, estimated based on broker / dealer quoted market prices, was $207.0 million as of December 31, 2015. The carrying value of outstanding amounts under our Revolving Facility approximates fair value. The fair value of issued Warrants (as defined herein) was $57.4 million and $67.4 million at December 31, 2016 and 2015, respectively. The fair value of our contingent consideration obligations associated with acquisitions was $32.2 million at December 31, 2016 and $30.1 million at December 31, 2015. For further information, see Note 10 regarding our derivative liabilities, Note 11 regarding our other long-term obligations, and Note 12 regarding our fair value disclosures.
Use of Estimates
The preparation of financial statements in conformity with accounting principles generally accepted in the United States of America ("U.S. GAAP") requires the use of estimates and assumptions by management in determining the reported amounts of assets and liabilities and disclosure of contingent assets and liabilities as of the date of the financial statements and the reported amounts of revenues and expenses during the reporting period. Actual results could differ from those estimates. Estimates and assumptions that we consider significant in the preparation of our financial statements include those related to our allowance for doubtful accounts, business combinations, goodwill, intangibles, valuation of derivatives, valuation of contingent consideration, accruals for self-insurance, income taxes, the valuation of inventory and the valuation and useful lives of property, plant and equipment.
Stripping Costs
We include post-production stripping costs in the cost of inventory produced during the period these costs are incurred. Post-production stripping costs represent stripping costs incurred after the first salable minerals are extracted from the mine.
Earnings (Loss) Per Share
Basic earnings (loss) per share is computed by dividing net income (loss) by the weighted average number of common shares outstanding during the period. Diluted earnings (loss) per share is computed by dividing net income (loss) by the weighted average number of common shares outstanding during the period after giving effect to all potentially dilutive securities outstanding during the period. See Note 17 for additional information regarding our earnings (loss) per share.
Comprehensive Income (Loss)
Comprehensive income (loss) represents all changes in equity of an entity during the reporting period, except those resulting from investments by and distributions to stockholders. For the years ended December 31, 2016, 2015 and 2014, no differences existed between our consolidated net income (loss) and our consolidated comprehensive income (loss).
Stock-based Compensation
Stock-based employee compensation cost is measured at the grant date based on the calculated fair value of the award. We recognize expense over the employee’s requisite service period, generally the vesting period of the award, or in the case of performance-based awards, over the life of the derived service period. The related excess tax benefit received upon exercise of stock options or vesting of restricted stock, if any, is reflected in the statement of cash flows as a financing activity rather than an operating activity. See Note 16 for additional information regarding our stock-based compensation plans.
65
U.S. CONCRETE, INC. AND SUBSIDIARIES
NOTES TO CONSOLIDATED FINANCIAL STATEMENTS – (Continued)
Recent Accounting Pronouncements
In January 2017, the FASB issued new guidance to simplify the accounting for goodwill impairment. The guidance removes the second step of the goodwill impairment test, which requires a hypothetical purchase price allocation. A goodwill impairment will now be the amount by which a reporting unit’s carrying value exceeds its fair value, not to exceed the carrying amount of goodwill. All other goodwill impairment guidance will remain largely unchanged. Entities will continue to have the option to perform a qualitative assessment to determine if a quantitative impairment test is necessary. The same one-step impairment test will be applied to goodwill at all reporting units, even those with zero or negative carrying amounts. Entities will be required to disclose the amount of goodwill at reporting units with zero or negative carrying amounts. This guidance is effective in 2020, but early adoption is permitted for any impairment tests performed after January 1, 2017. We are currently evaluating the impact that this guidance will have on our financial condition and results of operations.
In January 2017, the FASB issued an update under business combinations in an effort to clarify the definition of a business with the objective of adding guidance to assist entities with evaluating whether transactions should be accounted for as acquisitions (or disposals) of assets or businesses. This guidance is effective for fiscal years beginning after December 15, 2017, and interim periods within those fiscal years. We are currently evaluating the impact that this standard will have on our financial condition, results of operations, and cash flows.
In August 2016, the FASB issued guidance to reduce diversity in practice in how certain cash receipts and cash payments are presented and classified in the statement of cash flows. The new amendment is effective for financial statements issued for fiscal years beginning after December 15, 2017 and interim periods within those periods, with early adoption permitted. We are currently evaluating the impact that this standard will have on our statement of cash flows.
In March 2016, the FASB issued an amendment related to share-based payments to employees. The new guidance requires that excess tax benefits (which represent the excess of actual tax benefits received at the date of vesting or settlement over the benefits recognized over the vesting period or upon issuance of share-based payments) and tax deficiencies (which represent the amount by which actual tax benefits received at the date of vesting or settlement is lower than the benefits recognized over the vesting period or upon issuance of share-based payments) be recorded in the income statement as a reduction or increase of income taxes when the awards vest. The new guidance also requires excess tax benefits to be classified as an operating activity in the statement of cash flows rather than a financing activity. The amendment also simplifies other aspects of share-based payment transactions, including classification of awards that permit repurchases to satisfy statutory tax withholding requirements and classification of tax payments on behalf of employees on the statement of cash flows. The guidance is effective for annual periods beginning after December 15, 2016 and interim periods within those periods, with early adoption permitted. We will adopt this guidance in the first quarter of 2017. Application of this guidance may create volatility in our effective tax rate and diluted earnings per share due to the tax effects being recorded to the income statement. The volatility in future periods will depend primarily on our stock price at the vesting dates and the number of awards that vest each period. As permitted by the guidance, we will elect to recognize forfeitures as they occur, rather than estimating forfeitures as previously required.
In February 2016, the FASB issued an amendment related to leases. The new guidance requires the recognition of lease assets and lease liabilities by lessees for all leases greater than one year in duration and classified as operating leases under previous guidance. The new standard is effective for annual periods beginning after December 15, 2018 and interim periods within those periods, with early adoption permitted. This new guidance must be adopted using a modified retrospective transition and requires application of the new guidance at the beginning of the earliest comparative period presented. As of December 31, 2016 and 2015, the Company's undiscounted minimum contractual commitments under long-term operating leases, which were not recorded on the consolidated balance sheets, were $79.1 million and $65.6 million, respectively, which is an estimate of the effect to total assets and total liabilities that the new accounting standard would have as of those dates. We are currently evaluating the impact that this standard will have on our financial condition, results of operations, and cash flows.
In July 2015, the FASB issued guidance requiring inventory to be measured at the lower of cost or net realizable value, which is the estimated selling price in the ordinary course of business, less reasonably predictable costs of completion, disposal and transportation. This guidance is effective prospectively for annual reporting periods beginning after December 15, 2016, and interim reporting periods within those annual reporting periods. Early adoption is permitted. We will adopt this standard as of and for the interim period ending March 31, 2017. We are currently evaluating the impact that this standard will have on our financial condition, results of operations, and cash flows.
66
U.S. CONCRETE, INC. AND SUBSIDIARIES
NOTES TO CONSOLIDATED FINANCIAL STATEMENTS – (Continued)
In May 2014, the FASB issued guidance (the effective date of which was later delayed) that outlines a single comprehensive model for accounting for revenue arising from contracts with customers, which supersedes most of the existing revenue recognition guidance. This guidance requires an entity to recognize revenue when it transfers promised goods or services to customers in an amount that reflects the consideration to which the entity expects to be entitled in exchange for those goods or services and also requires certain additional disclosures. The guidance is effective for interim and annual reporting periods that begin after December 15, 2017. Early adoption of the standard is permitted, but not before the original effective date of December 15, 2016. During the second quarter of 2016, the FASB issued additional revenue recognition guidance that clarifies how an entity identifies performance obligations related to customer contracts as well as the objectives of collectibility, sales and other taxes, non-cash consideration, contract modifications at transition, and technical corrections. The guidance is effective beginning in the first quarter of 2018, and we do not currently plan to early adopt the guidance. The guidance permits two methods of adoption, retrospectively to each prior reporting period presented (full retrospective method), or retrospectively with the cumulative effect of initially applying the guidance recognized at the date of initial application (modified retrospective method). We have not yet selected a transition method, and we continue to evaluate the effect that the updated standard will have on our consolidated financial condition, results of operations and cash flows; however, we do not expect adoption of the guidance to have a material impact on our financial results. We primarily earn our revenue by producing and delivering ready-mixed concrete, aggregates, and related building materials, as requested by our customers primarily through purchase orders. We generally do not have significant customer contracts and do not provide post-delivery services, such as paving or finishing. As such, adoption of the new guidance should not result in significant changes in the amount of revenue recognized or the timing of when such revenue is recognized.
2. ACQUISITIONS AND DISPOSITIONS
2016 Acquisitions
During the year, we completed four acquisitions that expanded our ready-mixed concrete operations in the New York Metropolitan market for total consideration of $141.9 million. The combined assets acquired through these acquisitions included land, 10 ready-mixed concrete plants, and a fleet of 189 mixer trucks. On February 26, 2016, we completed the acquisition of all of the assets of Greco Brothers Concrete of L.I., Inc. ("Greco"), located in Brooklyn, New York. On June 24, 2016, we completed the acquisition of the assets of Nycon Supply Corp. ("Nycon"), located in Queens, New York. On August 10, 2016, we completed the acquisition of the assets of Jenna Concrete Corp. ("Jenna"), located in Bronx, New York. On August 22, 2016, we completed the acquisition of the assets of Kings Ready Mix Inc. ("Kings"), located in Brooklyn, New York.
In addition, on March 31, 2016 and September 13, 2016, we acquired two individually immaterial ready-mixed concrete operations in our west Texas market for total consideration of $3.5 million.
The consideration for these six acquisitions was satisfied by $125.0 million in cash, $6.1 million in payments deferred over a three-year period, $5.8 million for the estimated fair value of the working capital true up payable over a year to the former owners, the issuance of $1.0 million of credits applied against existing trade accounts receivable, plus 136,215 shares of our common stock, calculated in accordance with the terms of the purchase agreement, and valued at approximately $7.5 million on the date of issuance. We funded the cash portion of these acquisitions through a combination of cash on hand and borrowings under our Revolving Facility.
We made changes to the preliminary purchase price allocations for the 2016 acquisitions during the year ended December 31, 2016, primarily related to valuation of identifiable intangible assets; valuation of property, plant and equipment; and working capital adjustments. The recording of the Greco business combination is final. The recording of the Nycon, Jenna, and Kings business combinations is preliminary, and we expect to record adjustments as we accumulate information needed to estimate the fair value of the assets acquired and liabilities assumed. We expect adjustments including, but not limited to, working capital and the fair value of identifiable intangible assets and property, plant, and equipment.
67
U.S. CONCRETE, INC. AND SUBSIDIARIES
NOTES TO CONSOLIDATED FINANCIAL STATEMENTS – (Continued)
The following table presents the total consideration for the 2016 acquisitions and the provisional amounts related to the assets acquired and liabilities assumed based on the estimated fair values as of the respective acquisition date (in thousands):
2016 Acquisitions | |||
Cash | $ | 9 | |
Accounts receivable (1) | 12,314 | ||
Inventory | 1,249 | ||
Other current assets | 68 | ||
Property, plant and equipment | 34,918 | ||
Definite-lived intangible assets | 47,012 | ||
Total assets acquired | 95,570 | ||
Current liabilities | 7,831 | ||
Other long-term liabilities | 3,165 | ||
Total liabilities assumed | 10,996 | ||
Goodwill | 60,034 | ||
Total consideration (fair value) (2) | $ | 144,608 | |
(1) | The aggregate fair value of the acquired accounts receivable approximate the aggregate gross contractual amount as of the respective acquisition dates. |
(2) | Deferred payments included at fair value. |
2015 Acquisitions
We completed eight acquisitions of ready-mixed concrete and aggregate products operations in 2015. Total consideration was $163.0 million, and potential contingent consideration was $41.9 million based on the achievement of certain volume and EBITDA thresholds. The purchase price was comprised of $139.2 million in cash, $9.9 million in payments deferred over one to 10 years, and 442,225 shares of our common stock, valued at approximately $15.1 million on the date of issuance, less a working capital receivable of $1.2 million. We funded the cash portion of the acquisitions through a combination of cash on hand and borrowings under our Revolving Facility. The combined assets acquired through these acquisitions included 22 ready-mixed concrete plants, 261 mixer trucks, a fleet of transfer trucks to transport cement and aggregates, five quarries, and a leased industrial waterfront property in the U.S. Virgin Islands to be used as a marine terminal and sales yard. See Note 12 for additional information related to contingent consideration obligations.
On February 23, 2015, we acquired the equity of Right Away Redy Mix, Inc. ("Right Away"), located in Oakland, California. On April 1, 2015, we acquired the equity of Ferrara Bros. Building Materials Corp. ("Ferrara Bros."), located in New York, New York. On May 21, 2015, we acquired the equity of Colonial Concrete Co. ("Colonial"), located in Newark, New Jersey. On May 29, 2015, we acquired the assets of DuBrook Concrete, Inc. ("DuBrook"), located in Chantilly, Virginia, part of the greater Washington, D.C. metropolitan area. On September 24, 2015, we acquired the Wantage Stone (“Wantage”) reserves, a site development quarry including an 80-acre quarry along with mining rights to an additional 77 acres of land located in Hamburg, New Jersey, from Bicsak Brothers Realty, LLC and Wantage Stone, LLC. On October 27, 2015, we acquired the equity of Heavy Materials, LLC ("Heavy"), a vertically integrated ready-mixed concrete producer located in the U.S. Virgin Islands. Also included in the eight acquisitions for the year were two individually immaterial acquisitions (the "2015 Other Acquisitions") that were comprised of sand and gravel operations in our west Texas market and a ready-mixed concrete operation in the U.S. Virgin Islands.
We finalized our valuations for the 2015 acquisitions during the year ended December 31, 2016. The fair values of the assets acquired and liabilities assumed in the following 2015 Acquisitions table are final. Changes from initial measurements of fair value primarily related to valuation of property, plant, and equipment; adjustments related to determination of the conclusion of tax attributes as of the acquisition date; working capital adjustments; total consideration; valuation of identifiable intangible assets; and valuation of unfavorable lease intangibles. See Note 4 for additional information regarding the measurement period adjustments. The following table summarizes the total consideration for the 2015 acquisitions and presents the allocation of these amounts to the net tangible and intangible assets acquired and liabilities assumed based on the estimated fair values as of the respective acquisition date (in thousands).
68
U.S. CONCRETE, INC. AND SUBSIDIARIES
NOTES TO CONSOLIDATED FINANCIAL STATEMENTS – (Continued)
2015 Acquisitions | |||
Cash | $ | 2,036 | |
Accounts receivable (1) | 22,552 | ||
Inventory | 4,881 | ||
Other current assets | 1,006 | ||
Property, plant and equipment | 76,817 | ||
Definite-lived intangible assets | 71,456 | ||
Other long-term assets | 200 | ||
Total assets acquired | 178,948 | ||
Current liabilities | $ | 18,630 | |
Long-term deferred income tax | 5,546 | ||
Other long-term liabilities | 1,346 | ||
Total liabilities assumed | 25,522 | ||
Goodwill | 33,079 | ||
Total consideration (fair value) (2) | $ | 186,505 | |
(1) | The aggregate fair value of the acquired accounts receivable was $22.6 million, with an aggregate gross contractual amount of $27.1 million, as of the respective acquisition dates. Amounts not expected to be collected were $4.5 million of the acquired accounts receivable, as of the respective acquisition dates. |
(2) | Deferred payments, potential earn-outs, and potential incentive awards included at fair value. (See Note 12) |
Acquired Intangible Assets and Goodwill
Intangible assets acquired in 2016 and 2015 totaling $118.5 million consisted of customer relationships, trade names, non-compete agreements, leasehold interests, a favorable contract, and backlog. The amortization period of these intangible assets range from one year to 25 years. The major classes of intangible assets acquired in the 2016 and 2015 acquisitions were as follows (in thousands):
Weighted Average Amortization Period (In Years) | Fair Value At Acquisition Date | ||||
Customer relationships | 6.80 | $ | 56,119 | ||
Trade names | 22.56 | $ | 39,726 | ||
Non-competes | 5.35 | 8,235 | |||
Leasehold interests | 8.45 | 9,098 | |||
Favorable contract | 3.50 | 3,650 | |||
Backlog | 1.00 | 1,640 | |||
Total | $ | 118,468 | |||
69
U.S. CONCRETE, INC. AND SUBSIDIARIES
NOTES TO CONSOLIDATED FINANCIAL STATEMENTS – (Continued)
As of December 31, 2016, the estimated future aggregate amortization expense of definite-lived intangible assets from the 2016 and 2015 acquisitions was as follows (in thousands):
Year Ending December 31, | |||
2017 | $ | 15,201 | |
2018 | 14,646 | ||
2019 | 13,203 | ||
2020 | 12,432 | ||
2021 | 11,276 | ||
Thereafter | 34,899 | ||
Total | $ | 101,657 | |
Unfavorable lease intangibles with a gross carrying amount of $1.5 million and a net carrying amount of $1.3 million as of December 31, 2016 are included in other non-current liabilities in the accompanying condensed consolidated balance sheets. These unfavorable lease intangibles are amortized over their remaining lease terms at the time of acquisition ranging from 4.75 to 10 years. These unfavorable lease intangibles have a weighted average remaining life of 5.73 years.
During the year ended December 31, 2016, we recorded $10.9 million of amortization expense related to these intangible assets and unfavorable lease intangibles. During the year ended December 31, 2016, we recognized $0.1 million of amortization expense that related to previous periods but had not been recorded, since the fair value of certain intangible assets had not yet been determined and the fair values of others were not final.
The goodwill ascribed to our acquisitions is related to the synergies we expect to achieve with expansion in the markets in which we already operate as well as entry into new metropolitan areas of our existing geographic markets. The goodwill relates primarily to our ready-mixed concrete reportable segment. See Note 4 for the allocation of goodwill from our 2016 and 2015 acquisitions to our segments. We generally expect all but $10.7 million of the goodwill from the 2016 and 2015 acquisitions to be deductible for tax purposes. See Note 15 for additional information regarding income taxes.
Actual and Pro Forma Impact of Acquisitions
We recorded approximately $274.2 million of revenue and $11.5 million of income from operations in our consolidated results of operations for the year ended December 31, 2016 related to the 2016 and 2015 acquisitions following their respective dates of acquisition. We recorded approximately $131.9 million of revenue and $7.5 million of income from operations in our consolidated results of operations for the year ended December 31, 2015 related to the 2015 acquisitions following their respective dates of acquisition.
The unaudited pro forma information presented below reflects the combined financial results for all of the acquisitions completed during 2016 and 2015, excluding one of the 2015 Other Acquisitions and the two 2016 individually immaterial acquisitions in west Texas described above, as historical financial results for these operations were not material and were impractical to obtain from the former owners. All other acquisitions have been included and represent our estimate of the results of operations for the years ended December 31, 2016 and 2015 as if the 2015 acquisitions had been completed on January 1, 2014 and the 2016 acquisitions had been completed on January 1, 2015 (in thousands, except per share information):
For the Year Ended December 31, | |||||||
(unaudited) | |||||||
2016 | 2015 | ||||||
Revenue from continuing operations | $ | 1,258,912 | $ | 1,190,088 | |||
Net income (loss) | $ | 23,853 | $ | (1,128 | ) | ||
Income (loss) per share, basic | $ | 1.58 | $ | (0.08 | ) | ||
Income (loss) per share, diluted | $ | 1.47 | $ | (0.08 | ) | ||
70
U.S. CONCRETE, INC. AND SUBSIDIARIES
NOTES TO CONSOLIDATED FINANCIAL STATEMENTS – (Continued)
The above pro forma results are unaudited and were prepared based on the historical U.S. GAAP results of the Company and the historical results of the 11 acquired companies for which financial information was available, based on data provided by the former owners. These results are not necessarily indicative of what the Company's actual results would have been had the 2016 acquisitions occurred on January 1, 2015 and the 2015 acquisitions occurred on January 1, 2014.
The unaudited pro forma net income (loss) and net income (loss) per share amounts above reflect the following adjustments:
Year Ended December 31, | |||||||
2016 | 2015 | ||||||
Increase in intangible amortization expense | $ | (3,835 | ) | $ | (9,552 | ) | |
Decrease in depreciation expense | — | 231 | |||||
Exclusion of buyer transaction costs | 1,791 | 1,161 | |||||
Exclusion of seller transaction costs | — | 46 | |||||
Exclusion of pension expense for pension plan acquired | — | 212 | |||||
Exclusion of segment results for segment not acquired | — | (99 | ) | ||||
Increase in interest expense | (163 | ) | (770 | ) | |||
Decrease in income tax expense | 5,405 | 439 | |||||
The unaudited pro forma results do not reflect any operational efficiencies or potential cost savings that may occur as a result of consolidation of the operations.
Sale of Pennsylvania Precast Operations
On June 2, 2015, we sold the fixed assets and inventory and assigned all open contracts associated with our remaining precast concrete operation in Pennsylvania, to Architectural Precast Innovations, Inc. for net proceeds of $0.3 million in cash and a $1.2 million promissory note, net of a $0.1 million discount. Note repayments are due quarterly for a term of two years with an effective interest rate of 3.19%. This sale represented the final divestiture of the Company's owned assets related to precast concrete operations.
3. DISCONTINUED OPERATIONS
As disclosed in Note 2, in June 2015, we completed the sale of substantially all of the assets associated with our remaining precast concrete operation in Pennsylvania. We sold the operation's fixed assets and inventory for net proceeds of $0.3 million in cash and a promissory note of $1.2 million, net of a $0.1 million discount, and recorded a pre-tax loss on the transaction of $0.2 million. The pre-tax loss was included in discontinued operations in our consolidated statements of operations for 2015.
During 2014, we completed the sale of our remaining owned assets related to our California precast operations disposed of in 2012. We sold land and a building for net proceeds of $1.5 million in cash and recorded a pre-tax gain on the transaction of $0.6 million. Also in 2014, we recorded an impairment loss on long-lived assets of $0.9 million related to our Pennsylvania precast concrete operation as the carrying value exceeded the net realizable value of the related long-lived assets. The pre-tax gain on disposal of assets and the loss on impairment of long-lived assets were included in discontinued operations for the year ended December 31, 2014.
We have presented the results of operations for these units for all periods as discontinued operations in our consolidated statements of operations.
71
U.S. CONCRETE, INC. AND SUBSIDIARIES
NOTES TO CONSOLIDATED FINANCIAL STATEMENTS – (Continued)
The results of these discontinued operations were as follows (in thousands):
Year Ended December 31, | ||||||||||||
2016 | 2015 | 2014 | ||||||||||
Revenue | $ | 48 | $ | 5,523 | $ | 8,920 | ||||||
Operating expenses, excluding DD&A, and other income | (1,200 | ) | (5,830 | ) | (9,481 | ) | ||||||
Loss from discontinued operations | (1,152 | ) | (307 | ) | (561 | ) | ||||||
(Loss) gain on disposal of assets | — | (193 | ) | 640 | ||||||||
Loss on impairment of long-lived assets | — | — | (900 | ) | ||||||||
Loss from discontinued operations, before income taxes | (1,152 | ) | (500 | ) | (821 | ) | ||||||
Income tax (benefit) expense | (435 | ) | (180 | ) | 172 | |||||||
Loss from discontinued operations | $ | (717 | ) | $ | (320 | ) | $ | (993 | ) | |||
Cash flows from operating activities included operating cash flows used in discontinued operations of $0.5 million, $0.4 million, and $1.5 million for the years ended December 31, 2016, 2015, and 2014, respectively. Cash flows from investing activities included investing cash flows provided by discontinued operations of $0.5 million, $0.4 million, and $1.5 million, for the years ended December 31, 2016, 2015, and 2014, respectively.
4. GOODWILL AND INTANGIBLE ASSETS, NET
Goodwill
We completed our annual assessment of goodwill impairment during the fourth quarter of 2016 for those units with goodwill as of October 1, 2016, and there was no impairment. The results of the first step of the annual impairment tests indicated that the fair values of our operating reporting units with goodwill exceeded their carrying values. Our fair value estimates were determined using estimates and assumptions that we believed were reasonable at the time, including assumptions regarding future operating results for businesses that we have recently acquired. Such estimates and assumptions are subject to inherent uncertainty. Actual results may differ materially from those estimates. Changes in the assumptions or estimates used in the impairment test with respect to a reporting unit or its prospects, which may result from a change in market conditions, market trends, interest rates or other factors outside of our control, or significant underperformance relative to historical or projected future operating results, could significantly impact the calculated fair value of the reporting units, which could result in an impairment charge in the future.
The changes in goodwill by reportable segment from December 31, 2014 to December 31, 2016 were as follows (in thousands):
Ready-mixed Concrete Segment | Aggregate Products Segment | Other Non-Reportable Segments | Total | |||||||||||||
Balance at December 31, 2014 | $ | 47,757 | $ | — | $ | 3,000 | $ | 50,757 | ||||||||
2015 acquisitions | 46,062 | 13,984 | — | 60,046 | ||||||||||||
Measurement period adjustments for prior year business combinations (1) | (10,861 | ) | — | 262 | (10,599 | ) | ||||||||||
Balance at December 31, 2015 | 82,958 | 13,984 | 3,262 | 100,204 | ||||||||||||
2016 acquisitions (2) | 60,034 | — | — | 60,034 | ||||||||||||
Measurement period adjustments for prior year business combinations (3) | (15,477 | ) | (11,490 | ) | — | (26,967 | ) | |||||||||
Balance at December 31, 2016 | $ | 127,515 | $ | 2,494 | $ | 3,262 | $ | 133,271 | ||||||||
(1) | The measurement period adjustments were primarily related to $4.3 million of property, plant, and equipment and $8.7 million of definite-lived and indefinite-lived intangible assets for the 2014 acquisitions. |
(2) | The measurement period adjustments for 2016 acquisitions recorded during the year primarily included $23.4 million of definite-lived intangible assets and $16.6 million of property, plant, and equipment. (See Note 2) |
(3) | The measurement period adjustments to our valuations of the 2015 acquisitions as of December 31, 2015 were primarily $21.3 million of property, plant, and equipment and $5.0 million definite-lived intangible assets offset by $1.2 million of unfavorable lease intangibles. (See Note 2) |
72
U.S. CONCRETE, INC. AND SUBSIDIARIES
NOTES TO CONSOLIDATED FINANCIAL STATEMENTS – (Continued)
Intangible Assets
Our purchased intangible assets were as follows (in thousands) as of December 31, 2016 and 2015:
December 31, 2016 | ||||||||||||||
Gross | Accumulated Amortization | Net | Weighted Average Remaining Life (in years) | |||||||||||
Definite-lived intangible assets | ||||||||||||||
Customer relationships | $ | 82,174 | $ | (16,414 | ) | $ | 65,760 | 5.97 | ||||||
Trade names | 44,456 | (4,948 | ) | 39,508 | 20.20 | |||||||||
Non-competes | 16,862 | (5,160 | ) | 11,702 | 3.81 | |||||||||
Leasehold interests | 12,480 | (1,693 | ) | 10,787 | 7.46 | |||||||||
Favorable contract | 3,650 | (1,912 | ) | 1,738 | 1.67 | |||||||||
Backlog | 1,640 | (1,640 | ) | — | 0.00 | |||||||||
Total definite-lived intangible assets | 161,262 | (31,767 | ) | 129,495 | 10.19 | |||||||||
Indefinite-lived intangible assets | ||||||||||||||
Land rights(1) | 1,478 | — | 1,478 | |||||||||||
Total purchased intangible assets | $ | 162,740 | $ | (31,767 | ) | $ | 130,973 | |||||||
(1) Land rights acquired in the Custom-Crete acquisition will be reclassified to property, plant and equipment upon the division of certain shared properties and settlement of the associated deferred payment.
December 31, 2015 | ||||||||||||||
Gross | Accumulated Amortization | Net | Weighted Average Remaining Life (in years) | |||||||||||
Definite-lived intangible assets | ||||||||||||||
Customer relationships | $ | 45,969 | $ | (7,939 | ) | $ | 38,030 | 7.34 | ||||||
Trade names | 40,302 | (2,060 | ) | 38,242 | 22.04 | |||||||||
Non-competes | 10,167 | (2,211 | ) | 7,956 | 3.87 | |||||||||
Leasehold interests | 7,525 | (668 | ) | 6,857 | 10.49 | |||||||||
Favorable contract | 3,650 | (869 | ) | 2,781 | 2.67 | |||||||||
Backlog | 1,640 | (1,230 | ) | 410 | 0.25 | |||||||||
Total definite-lived intangible assets | 109,253 | (14,977 | ) | 94,276 | 13.07 | |||||||||
Indefinite-lived intangible assets | ||||||||||||||
Land rights(1) | 1,478 | — | 1,478 | |||||||||||
Total purchased intangible assets | $ | 110,731 | $ | (14,977 | ) | $ | 95,754 | |||||||
(1) Land rights acquired in the Custom-Crete acquisition will be reclassified to property, plant and equipment upon the division of certain shared properties and settlement of the associated deferred payment.
73
U.S. CONCRETE, INC. AND SUBSIDIARIES
NOTES TO CONSOLIDATED FINANCIAL STATEMENTS – (Continued)
As of December 31, 2016, the estimated remaining amortization of our definite-lived intangible assets was as follows (in thousands):
Year Ending December 31, | ||||
2017 | $ | 20,697 | ||
2018 | 20,114 | |||
2019 | 18,272 | |||
2020 | 16,080 | |||
2021 | 14,658 | |||
Thereafter | 39,674 | |||
Total | $ | 129,495 | ||
Also included in other non-current liabilities in our balance sheet were unfavorable lease intangibles with a gross carrying amount of $1.5 million and a net carrying amount of $1.3 million as of December 31, 2016. These unfavorable lease intangibles are amortized over their remaining lease terms at the time of acquisition ranging from 4.75 to 10 years. These unfavorable lease intangibles have a weighted average life of 5.73 years.
We recorded $16.5 million, $11.2 million and $2.1 million of amortization expense for our definite-lived intangible assets and unfavorable lease intangible for the years ended December 31, 2016, 2015 and 2014, respectively, in our consolidated statements of operations.
5. INVENTORIES
Inventory as of December 31, 2016 and 2015 consisted of the following (in thousands):
December 31, | ||||||||
2016 | 2015 | |||||||
Raw materials | $ | 38,752 | $ | 33,792 | ||||
Building materials for resale | 1,923 | 1,736 | ||||||
Other | 1,304 | 1,198 | ||||||
$ | 41,979 | $ | 36,726 | |||||
6. PROPERTY, PLANT AND EQUIPMENT
Property, plant and equipment, net as of December 31, 2016 and 2015 consisted of the following (in thousands):
December 31, | ||||||||
2016 | 2015 | |||||||
Land and mineral deposits | $ | 93,302 | $ | 69,265 | ||||
Buildings and improvements | 25,932 | 17,198 | ||||||
Machinery and equipment | 167,804 | 131,209 | ||||||
Mixers, trucks and other vehicles | 168,747 | 117,448 | ||||||
Other | 1,322 | 227 | ||||||
Construction in progress | 17,934 | 15,255 | ||||||
475,041 | 350,602 | |||||||
Less: accumulated depreciation and depletion | (137,629 | ) | (102,479 | ) | ||||
$ | 337,412 | $ | 248,123 | |||||
As of December 31, 2016 and 2015, the net carrying amounts of mineral deposits were $35.2 million and $28.1 million, respectively. As of December 31, 2016 and 2015, gross assets recorded under capital leases, consisting primarily of drum mixer trucks, were $49.5 million and $20.5 million, respectively, and accumulated amortization was $4.2 million and $1.3 million, respectively. We recorded $38.3 million, $32.4 million and $21.8 million of depreciation and depletion expense on our property,
74
U.S. CONCRETE, INC. AND SUBSIDIARIES
NOTES TO CONSOLIDATED FINANCIAL STATEMENTS – (Continued)
plant and equipment for the years ended December 31, 2016, 2015 and 2014, respectively, which is included in our consolidated statements of operations.
7. ALLOWANCE FOR DOUBTFUL ACCOUNTS AND CUSTOMER DISPUTES
Activity in our allowance for doubtful accounts and customer disputes consisted of the following (in thousands):
December 31, | ||||||||
2016 | 2015 | |||||||
Balance, beginning of period | $ | 6,125 | $ | 3,726 | ||||
Provision for doubtful accounts and customer disputes | 2,966 | 4,198 | ||||||
Uncollectible receivables written off, net of recoveries | (3,131 | ) | (1,799 | ) | ||||
Balance, end of period | $ | 5,960 | $ | 6,125 | ||||
8. ACCRUED LIABILITIES
Our accrued liabilities were as follows (in thousands):
December 31, | ||||||||
2016 | 2015 | |||||||
Accrued materials | $ | 20,349 | $ | 22,428 | ||||
Accrued compensation and benefits | 16,553 | 15,024 | ||||||
Accrued insurance reserves | 15,206 | 15,341 | ||||||
Accrued property, sales and other taxes | 11,829 | 14,916 | ||||||
Deferred consideration | 9,227 | 4,774 | ||||||
Contingent consideration, current portion | 2,418 | 2,635 | ||||||
Accrued interest | 2,217 | 1,500 | ||||||
Deferred rent | 2,232 | 1,838 | ||||||
Other | 5,212 | 7,398 | ||||||
$ | 85,243 | $ | 85,854 | |||||
9. DEBT
A summary of the outstanding amounts of our debt and capital leases as of December 31, 2016 and 2015 was as follows (in thousands):
December 31, | ||||||||
2016 | 2015 | |||||||
6.375% Senior unsecured notes due 2024(1) | $ | 400,000 | $ | — | ||||
8.5% Senior secured notes due 2018 | — | 200,000 | ||||||
Senior secured credit facility | — | 45,000 | ||||||
Capital leases | 37,860 | 16,555 | ||||||
Other financing | 20,248 | 20,194 | ||||||
Debt issuance costs | (8,810 | ) | (6,149 | ) | ||||
Total debt | 449,298 | 275,600 | ||||||
Less: current maturities | (16,654 | ) | (9,386 | ) | ||||
Long-term debt, net of current maturities | $ | 432,644 | $ | 266,214 | ||||
(1) | The effective interest rate for these notes as of December 31, 2016 was 6.62%. |
75
U.S. CONCRETE, INC. AND SUBSIDIARIES
NOTES TO CONSOLIDATED FINANCIAL STATEMENTS – (Continued)
As of December 31, 2016, the principal amounts due under our debt agreements for the next five years and thereafter were as follows (in thousands):
Year Ending December 31, | ||||
2017 | $ | 16,654 | ||
2018 | 16,131 | |||
2019 | 13,229 | |||
2020 | 9,251 | |||
2021 | 2,768 | |||
Thereafter | 400,075 | |||
$ | 458,108 | |||
Senior Unsecured Notes due 2024
On June 7, 2016, we completed an offering of $400.0 million aggregate principal amount of 6.375% senior unsecured notes due 2024 (the "2024 Notes"). We used a portion of the net proceeds from the 2024 Notes to repay all of our outstanding borrowings under the Revolving Facility and to redeem all $200.0 million of our outstanding 8.5% senior secured notes due 2018 (the "2018 Notes"). In connection with issuing the 2024 Notes, we incurred $7.7 million of debt issuance costs.
The 2024 Notes are governed by an indenture (the “Indenture”) dated as of June 7, 2016, by and among U.S. Concrete, Inc., as issuer, the subsidiary guarantors party thereto, and U.S. Bank National Association, as trustee. The 2024 Notes accrue interest at a rate of 6.375% per annum. We pay interest on the 2024 Notes on June 1 and December 1 of each year. The 2024 Notes mature on June 1, 2024, and are redeemable at our option prior to maturity at prices specified in the Indenture. The Indenture contains negative covenants that restrict our ability and our restricted subsidiaries' ability to engage in certain transactions, as described below, and also contains customary events of default.
The Indenture contains covenants that, among other things, limit our ability and the ability of our restricted subsidiaries to:
• | incur additional debt or issue disqualified stock or preferred stock; |
• | pay dividends or make other distributions, repurchase or redeem our stock or subordinated indebtedness or make certain investments; |
• | sell assets and issue capital stock of our restricted subsidiaries; |
• | incur liens; |
• | allow to exist certain restrictions on the ability of our restricted subsidiaries to pay dividends or make other payments to us; |
• | enter into transactions with affiliates; |
• | consolidate, merge or sell all or substantially all of our assets; and |
• | designate our subsidiaries as unrestricted subsidiaries. |
The 2024 Notes are issued by U.S. Concrete, Inc. (the "Parent"). Our obligations under the 2024 Notes are jointly and severally and fully and unconditionally guaranteed on a senior unsecured basis by each of our restricted subsidiaries that guarantees any obligations under the Revolving Facility or that guarantees certain of our other indebtedness or certain indebtedness of our restricted subsidiaries (other than foreign restricted subsidiaries that guarantee only indebtedness incurred by another foreign subsidiary).
U.S. Concrete, Inc. does not have any independent assets or operations, and none of its foreign subsidiaries guarantee the 2024 Notes. There are no significant restrictions on the ability of the Parent or any guarantor to obtain funds from its subsidiaries
76
U.S. CONCRETE, INC. AND SUBSIDIARIES
NOTES TO CONSOLIDATED FINANCIAL STATEMENTS – (Continued)
by dividend or loan. For additional information regarding our guarantor and non-guarantor subsidiaries, see the information set forth in Note 23.
The 2024 Notes and the guarantees thereof are effectively subordinated to all of our and our guarantors' existing and future secured obligations, including obligations under the Revolving Facility, to the extent of the value of the collateral securing such obligations; senior in right of payment to any of our and our guarantors' future subordinated indebtedness; pari passu in right of payment with any of our and our guarantors' existing and future senior indebtedness, including our and our guarantors' obligations under the Revolving Facility; and structurally subordinated to all existing and future indebtedness and other liabilities, including preferred stock, of any non-guarantor subsidiaries.
Senior Secured Notes due 2018
In June 2016, we redeemed all $200.0 million of the 2018 Notes at a redemption price of 104.25% of the principal amount thereof, plus accrued interest of $0.7 million. We recorded a $12.0 million pre-tax loss on extinguishment of debt in our consolidated statements of operations associated with the redemption of the 2018 Notes. This loss consisted of an $8.5 million redemption premium and a $3.5 million write-off of unamortized debt issuance costs.
Senior Secured Credit Facility
On November 18, 2015, we entered into the Second Amended and Restated Loan and Security Agreement (the “Second A/R Loan Agreement”) with Bank of America, N.A., as administrative agent, and certain financial institutions named therein, as lenders (the "Lenders"), which amended and restated the First Amended and Restated Loan and Security Agreement dated October 29, 2013 (the "2013 Loan Agreement"). The Second A/R Loan Agreement provides us with the Revolving Facility of up to $250.0 million. The Second A/R Loan Agreement also includes an accordion feature that allows for increases in the total revolving commitments by as much as $100.0 million. The maturity date of the Revolving Facility is November 18, 2020. As of December 31, 2016, we had no outstanding borrowings on the Second A/R Loan Agreement and we had $12.6 million of undrawn standby letters of credit under the Revolving Facility.
Our actual maximum credit availability under the Revolving Facility varies from time to time and is determined by calculating the value of our eligible accounts receivable, inventory, mixer trucks and machinery, minus reserves imposed by the Lenders and other adjustments, all as specified in the Second A/R Loan Agreement and discussed further below. Our availability under the Revolving Facility at December 31, 2016 increased to $221.3 million from $131.2 million at December 31, 2015. The Second A/R Loan Agreement also contains a provision for over-advances and protective advances by Lenders, in each case, of up to $25.0 million in excess of borrowing base levels. The Second A/R Loan Agreement provides for swingline loans, up to a $15.0 million sublimit, and letters of credit, up to a $30.0 million sublimit.
Up to $30.0 million of the Revolving Facility is available for the issuance of letters of credit, and any such issuance of letters of credit will reduce the amount available for loans under the Revolving Facility. Loans under the Revolving Facility are limited by a borrowing base which is equal to the lesser of (a) the aggregate amount of Revolver Commitments minus each of the LC Reserve and the Tax Amount, all as defined in the Second A/R Loan Agreement, and (b) (i) 90% of the face amount of eligible accounts receivable (reduced to 85% under certain circumstances), plus (ii) the lesser of (x) 70% of the value of eligible inventory or (y) 90% of the product of (A) the net orderly liquidation value of inventory divided by the value of the inventory and (B) multiplied by the value of eligible inventory, plus (iii) (w) 85% of the net orderly liquidation value (as determined by the most recent appraisal) of eligible trucks, plus (x) 80% of the cost of eligible trucks that have been acquired since the date of the latest appraisal of eligible trucks minus (y) 85% of the net orderly liquidation value of eligible trucks that have been sold since the date of the latest appraisal, minus (z) 85% of the depreciation amount applicable to eligible trucks, plus (iv) (x) 85% of the net orderly liquidation value (as determined by the most recent appraisal) of eligible machinery minus (y) 85% of the net orderly liquidation value of eligible machinery that have been sold since the date of the latest appraisal, minus (z) 85% of the depreciation amount applicable to eligible machinery, minus (v) the Availability Reserve and minus (vi) the Tax Amount, each as defined in the Second A/R Loan Agreement; provided that, notwithstanding anything herein to the contrary, in determining the borrowing base pursuant to this clause (b), the borrowing base attributable to the eligible trucks and eligible machinery set forth in clauses (b) (iii) and (iv) above shall not exceed 30% of the borrowing base as of such date of determination. The administrative agent may, in its permitted discretion, reduce the advance rates set forth above, adjust reserves or reduce one or more of the other elements used in computing the borrowing base.
77
U.S. CONCRETE, INC. AND SUBSIDIARIES
NOTES TO CONSOLIDATED FINANCIAL STATEMENTS – (Continued)
The Second A/R Loan Agreement also requires that we, upon the occurrence of certain events, maintain a fixed charge coverage ratio of at least 1.0 to 1.0 for each period of 12 calendar months, as determined in accordance with the Second A/R Loan Agreement. For the trailing 12-month period ended December 31, 2016, our fixed charge coverage ratio was 2.86 to 1.0. As of December 31, 2016, we were in compliance with all covenants under the Second A/R Loan Agreement.
The Second A/R Loan Agreement is secured by a first priority lien on substantially all of the personal property of the Company and our guarantors, subject to permitted liens and certain exceptions.
Capital Leases and Other Financing
We have a series of promissory notes with various lenders for the purchase of mixer trucks and other machinery and equipment in an aggregate principal amount of $19.9 million, with fixed annual interest rates ranging from 2.50% to 4.86%, payable monthly for terms ranging from less than one to five years.
We have leasing agreements with various other lenders for the purchase of mixer trucks and other machinery and equipment for a total principal amount of $37.9 million, with fixed annual interest rates ranging from less than 0.01% to 5.24%, payable monthly for terms ranging from two to five years. The lease terms include one dollar buyout options at the end of the lease terms. Accordingly, these financings have been classified as capital leases. The current portion of capital leases included in current maturities of long-term debt was $9.8 million and $4.0 million as of December 31, 2016 and 2015, respectively.
The weighted average interest rate of our capital leases and other financings was 3.11% as of December 31, 2016 and 3.07% as of December 31, 2015.
10. DERIVATIVES
General
On August 31, 2010 (the "Effective Date"), we issued warrants to acquire common stock in two tranches: Class A Warrants to purchase an aggregate of approximately 1.5 million shares of common stock at an exercise price of $22.69 per share, and Class B Warrants to purchase an aggregate of approximately 1.5 million shares of common stock at an exercise price of $26.68 per share (collectively, the "Warrants"). In accordance with ASC 815 - Derivatives and Hedging ("ASC 815"), we are required to account for the Warrants as derivative instruments. None of our derivative contracts manage business risk or are executed for speculative purposes.
The following table presents the fair value of our derivative instruments (in thousands) as of December 31, 2016 and 2015:
Fair Value | ||||||||||
December 31, | ||||||||||
Derivative Instruments Not Designated as Hedging Instruments under ASC 815 | Balance Sheet Location | 2016 | 2015 | |||||||
Warrants | Derivative liabilities | $ | 57,415 | $ | 67,401 | |||||
78
U.S. CONCRETE, INC. AND SUBSIDIARIES
NOTES TO CONSOLIDATED FINANCIAL STATEMENTS – (Continued)
The following table presents the effect of derivative instruments (in thousands) on our consolidated statements of operations for the years ended December 31, 2016, 2015, and 2014, excluding income tax effects:
Year Ended December 31, | ||||||||||||||
Derivative Instruments Not Designated as Hedging Instruments under ASC 815 | Location of Loss Recognized | 2016 | 2015 | 2014 | ||||||||||
Warrants | Derivative loss | $ | (19,938 | ) | $ | (60,016 | ) | $ | (3,556 | ) | ||||
Warrant volume positions are presented as the number of shares underlying the instruments. The table below presents our volume positions (in thousands) as of December 31, 2016, 2015, and 2014:
Number of Shares | |||||||||
December 31, | |||||||||
Derivative Instruments Not Designated as Hedging Instruments under ASC 815 | 2016 | 2015 | 2014 | ||||||
Warrants | 1,395 | 2,361 | 2,999 | ||||||
We do not have any derivative instruments with credit features requiring the posting of collateral in the event of a credit downgrade or similar credit event.
11. OTHER LONG-TERM OBLIGATIONS AND DEFERRED CREDITS
Other long-term obligations and deferred credits are comprised primarily of contingent consideration obligations entered into with the former owners of acquired companies from 2012 through 2016 with initial terms ranging from two to six years, ending in 2021. Our contingent consideration obligations are tied to varying thresholds of pre-determined sales volumes, West Texas Intermediate crude oil ("WTI") prices for the applicable year, and EBITDA and are recorded at their fair value (see Note 12). As of December 31, 2016 and 2015, our long-term contingent consideration obligations were $29.9 million and $27.5 million, respectively, and reflect the portion we expect to pay beyond one year of the balance sheet date.
Our long-term deferred payment arrangements with the former owners of acquired companies ranged in initial terms from one to ten years, ending in 2025. As of December 31, 2016 and 2015, our long-term deferred payment obligations were $7.8 million and $5.3 million, respectively, and reflect the portion we expect to pay beyond one year of the balance sheet date.
The remaining other long-term obligations and deferred credits balances consist primarily of our unrecognized tax benefits and related accrued interest and penalties (see Note 15).
12. FAIR VALUE DISCLOSURES
Fair value is defined as the exit price, or the amount that would be received to sell an asset or paid to transfer a liability in an orderly transaction between market participants as of the measurement date. Accounting guidance establishes a hierarchy for inputs used in measuring fair value that maximizes the use of observable inputs and minimizes the use of unobservable inputs by requiring that the most observable inputs be used when available. Observable inputs are inputs market participants would use in valuing the asset or liability and are developed based on market data obtained from independent sources. Unobservable inputs are inputs that reflect our assumptions about the factors market participants would use in valuing the asset or liability. The guidance establishes three levels of inputs that may be used to measure fair value:
Level 1—Quoted prices in active markets for identical assets or liabilities.
Level 2—Inputs other than Level 1 that are observable, either directly or indirectly, such as quoted prices for similar assets or liabilities; quoted prices in markets that are not active; or other inputs that are observable or can be corroborated by observable market data for substantially the full term of the assets or liabilities.
Level 3—Unobservable inputs that are supported by little or no market activity and that are significant to the fair value of the assets or liabilities.
79
U.S. CONCRETE, INC. AND SUBSIDIARIES
NOTES TO CONSOLIDATED FINANCIAL STATEMENTS – (Continued)
Assets and liabilities are classified in their entirety based on the lowest level of input that is significant to the fair value measurements. We review the fair value hierarchy classification on a quarterly basis. Changes in the observability of valuation inputs may result in a reclassification of levels for certain assets and liabilities within the fair value hierarchy.
The following tables present our fair value hierarchy for liabilities measured at fair value on a recurring basis as of December 31, 2016 and 2015 (in thousands):
As of December 31, 2016 | ||||||||||||||||
Total | Level 1 | Level 2 | Level 3 | |||||||||||||
Derivative – Warrants | $ | 57,415 | $ | — | $ | 57,415 | $ | — | ||||||||
Contingent consideration, including current portion(1) (2) (3) (4) (5) | 32,212 | — | — | 32,212 | ||||||||||||
$ | 89,627 | $ | — | $ | 57,415 | $ | 32,212 | |||||||||
As of December 31, 2015 | ||||||||||||||||
Total | Level 1 | Level 2 | Level 3 | |||||||||||||
Derivative – Warrants | $ | 67,401 | $ | — | $ | 67,401 | $ | — | ||||||||
Contingent consideration, including current portion(1) (2) (3) (4) (5) | 30,119 | — | — | 30,119 | ||||||||||||
$ | 97,520 | $ | — | $ | 67,401 | $ | 30,119 | |||||||||
(1) | The current portion of contingent consideration is included in accrued liabilities in our consolidated balance sheets. The long-term portion of contingent consideration is included in other long-term obligations and deferred credits in our consolidated balance sheets. |
(2) | Includes the fair value of the earn-out payments associated with the 2012 acquisition of Bode Gravel Co. and Bode Concrete LLC ("Bode Earn-out"). The fair value was determined based on expected payouts that will be due to the former owners based on the achievement of certain incremental sales volume milestones, using a contractual discount rate of 7.0%. These payments were capped at a fair value of $1.4 million as of December 31, 2016 and $3.5 million as of December 31, 2015. |
(3) | Includes the fair value of the earn-out payments associated with the 2015 acquisition of Right Away (the "Right Away Earn-out"). The fair value was determined based on expected payouts that will be due to the former owners based on probability-weighted assumptions related to the achievement of annual sales volume milestones, using a discount rate of 8.50%. The fair value of the Right Away Earn-out was $3.9 million and $4.7 million as of December 31, 2016 and December 31, 2015, respectively. The remaining Right Away Earn-out payments were capped at $5.0 million and $6.0 million as of December 31, 2016 and December 31, 2015, respectively. |
(4) | Includes the fair value of the contingent consideration associated with the 2015 acquisition of Ferrara Bros. ("Ferrara Bros. Contingent Consideration"). The fair value was determined based on the expected vesting of incentive awards granted to the former owners at acquisition based on probability-weighted assumptions related to the achievement of certain annual EBITDA thresholds, using a discount rate of 8.75% and 10.53% as of December 31, 2016 and December 31, 2015, respectively. The fair value of the Ferrara Bros. Contingent Consideration was $26.3 million and $21.2 million as of December 31, 2016 and December 31, 2015, respectively. The Ferrara Bros. Contingent Consideration payments were capped at $35.0 million as of both December 31, 2016 and 2015. |
(5) | Includes the fair value of the earn-out payments associated with the 2015 acquisition of DuBrook ("DuBrook Earn-out"). The fair value was determined based on the expected payouts that will be due to the former owners based on probability-weighted assumptions related to the achievement of sales volume milestones, using a discount rate of 15.75% as both December 31, 2016 and December 31, 2015. The fair value of the DuBrook Earn-out was $0.6 million and $0.7 million as of December 31, 2016 and December 31, 2015, respectively. The DuBrook Earn-out payments are not capped; however, we do not expect total payments to be in excess of $0.7 million and $1.0 million as of December 31, 2016 and December 31, 2015, respectively. |
The liability for the Warrants was valued utilizing a Black-Scholes-Merton model. Inputs into the model were based upon observable market data where possible. The key inputs in determining our derivative liabilities include our stock price, stock price volatility, and risk-free interest rates. As of December 31, 2016, observable market data existed for all of the key inputs in determining the fair value of our Warrants.
80
U.S. CONCRETE, INC. AND SUBSIDIARIES
NOTES TO CONSOLIDATED FINANCIAL STATEMENTS – (Continued)
A reconciliation of the changes in Level 3 fair value measurements is as follows for December 31, 2016 and 2015 (in thousands):
Warrants | Contingent Consideration | |||||||
Balance at December 31, 2014 | $ | 25,246 | $ | 5,344 | ||||
Acquisitions (1) | — | 25,707 | ||||||
Total losses included in earnings (2) | 19,551 | 932 | ||||||
Payment on contingent consideration | — | (1,864 | ) | |||||
Write-off of derivative on exercised Warrants (3) | (4 | ) | — | |||||
Issuances of equity, net of cash proceeds (4) | (56 | ) | — | |||||
Transfer out (5) | (44,737 | ) | — | |||||
Balance at December 31, 2015 | — | 30,119 | ||||||
Acquisitions (1) (6) | — | 15 | ||||||
Total losses included in earnings (2) | — | 5,225 | ||||||
Payment on contingent consideration | — | (3,147 | ) | |||||
Balance at December 31, 2016 | $ | — | $ | 32,212 | ||||
(1) | The liabilities for the Right Away Earn-out and the Ferrara Bros. Contingent Consideration were valued using Monte Carlo simulations which incorporated probability-weighted assumptions related to the achievement of specific milestones mentioned above. The liabilities for the Bode Earn-out, the DuBrook Earn-out, and the contingent consideration associated with one of the 2015 Other Acquisitions were valued using a discounted cash flow technique. Inputs into the models were based upon observable market data where possible. Where observable market data did not exist, we modeled inputs based upon similar observable inputs. The key inputs included discount rates ranging from 3.50% to 15.75%, a forecasted average of WTI prices from December 8, 2014 through December 7, 2016 from quoted sources, and management's estimates of future sales volumes and EBITDA. |
(2) | Represents the loss on revaluation of Warrants from January 1, 2015 through June 30, 2015, which is included in derivative loss in our consolidated statements of operations, and the net loss on revaluation of contingent consideration, which is included in loss on revaluation of contingent consideration in our consolidated statements of operations. We recorded a net loss on revaluation of contingent consideration of $5.2 million in the year ended December 31, 2016, as a result of the accretion of interest for the passage of time, change in the discount rates, as well as changes in the probability-weighted assumptions related to the achievement of sales volumes and certain EBITDA thresholds. We recognized a net loss on revaluation of contingent consideration of $0.9 million in the year ended December 31, 2015. |
(3) | Represents the pro rata portion of the derivative liability associated with exercised Warrants from January 1, 2015 through June 30, 2015 and measured at the date of share issuance, which is included in derivative loss in our consolidated statements of operations. |
(4) | Represents the pro rata portion of the derivative liability associated with exercised Warrants from January 1, 2015 through June 30, 2015 and measured at the date of share issuance, which is included in additional paid-in capital in our consolidated balance sheets. |
(5) | Transfer out of Level 3 financial liabilities was due to changes in the observability of market inputs used in the valuation of our Warrants. The transfer was measured as of June 30, 2015, the end of the period in which the transfer occurred. |
(6) | Represents the fair value of the contingent consideration associated with one of the 2015 Other Acquisitions. |
13. STOCKHOLDERS’ EQUITY
Common Stock and Preferred Stock
The following table presents information regarding U.S. Concrete’s common stock (in thousands):
December 31, | ||||||
2016 | 2015 | |||||
Shares authorized | 100,000 | 100,000 | ||||
Shares outstanding at end of period | 15,696 | 14,871 | ||||
Shares held in treasury | 888 | 842 | ||||
There was no preferred stock issued or outstanding as of December 31, 2016 and 2015.
81
U.S. CONCRETE, INC. AND SUBSIDIARIES
NOTES TO CONSOLIDATED FINANCIAL STATEMENTS – (Continued)
Common Stock Issuance
During the third quarter of 2016, we issued 136,215 shares of common stock valued at approximately $7.5 million on the date of issuance as part of the consideration for one of the 2016 acquisitions (see Note 2). During the second quarter of 2015, we issued 442,225 shares of common stock valued at approximately $15.1 million on the date of issuance as part of the consideration for one of the 2015 acquisitions (see Note 2).
Share Repurchase Program
In May 2014, our Board authorized a program to repurchase up to $50.0 million of our outstanding common stock (the "Share Repurchase Program") until the earlier of March 31, 2017, or a determination by the Board to discontinue the repurchase program. We made no repurchases of our common stock during the year ended December 31, 2016 and 2015 under the Share Repurchase Program.
Treasury Stock
Employees may elect to satisfy their tax obligations on the vesting of their equity awards by having the required tax payments withheld based on a number of vested shares having an aggregate value on the date of vesting equal to the tax obligation. As a result of such employee elections, we withheld approximately 46,000 shares during the year ended December 31, 2016, at a total value of approximately $2.9 million, and approximately 145,000 shares during the year ended December 31, 2015, at a total value of approximately $6.3 million. We accounted for the withholding of these shares as treasury stock.
14. WARRANTS
The Warrants were issued to holders of our predecessor common stock pro rata based on a holder’s stock ownership as of the Effective Date as defined in Note 10. The Warrants may be exercised on a cash or net issuance basis. The Warrants are included in derivative liabilities on the consolidated balance sheets (see Note 10) and are recorded at their fair value (see Note 12). The Warrants are also included in the potentially dilutive securities included in the calculation of diluted earnings (loss) per share as shares of our common stock would be issued if the Warrants were exercised (see Note 17). The Warrants are classified as a current liability on the consolidated balance sheets as they can be exercised by the holders at any time. As of December 31, 2016, there were 0.8 million of Class A Warrants and 0.6 million of Class B Warrants outstanding. The Warrants expire on August 31, 2017.
15. INCOME TAXES
Our consolidated federal and state income tax returns include the results of operations of acquired businesses from their dates of acquisition.
82
U.S. CONCRETE, INC. AND SUBSIDIARIES
NOTES TO CONSOLIDATED FINANCIAL STATEMENTS – (Continued)
A reconciliation of our effective income tax rate to the amounts calculated by applying the federal statutory corporate tax rate of 35% is as follows (in thousands):
Year Ended December 31, | |||||||||||||||||||||
2016 | 2015 | 2014 | |||||||||||||||||||
Tax expense (benefit) at statutory rate | $ | 10,755 | 35.0 | % | $ | (1,510 | ) | 35.0 | % | $ | 8,306 | 35.0 | % | ||||||||
Add (deduct): | |||||||||||||||||||||
Rates different from statutory | 621 | 2.0 | (165 | ) | 3.8 | — | — | ||||||||||||||
State income taxes | 1,429 | 4.6 | (2,322 | ) | 53.8 | 2,792 | 11.8 | ||||||||||||||
Nondeductible items | 496 | 1.6 | 511 | (11.8 | ) | 1,304 | 5.5 | ||||||||||||||
Unrecognized tax benefit relating to Warrants | 7,534 | 24.5 | 21,006 | (486.8 | ) | 1,245 | 5.2 | ||||||||||||||
Valuation allowance | 852 | 2.8 | (21,057 | ) | 487.9 | (10,992 | ) | (46.3 | ) | ||||||||||||
Unrecognized tax benefit | — | — | 390 | (9.0 | ) | 369 | 1.5 | ||||||||||||||
Derivatives and note discount | — | — | — | — | (911 | ) | (3.8 | ) | |||||||||||||
Capital loss carryforward expiration | — | — | 3,485 | (80.8 | ) | — | — | ||||||||||||||
Depletion | — | — | (47 | ) | 1.1 | — | — | ||||||||||||||
Other | (536 | ) | (1.7 | ) | 488 | (11.3 | ) | 43 | 0.2 | ||||||||||||
Income tax expense from continuing operations | $ | 21,151 | 68.8 | % | $ | 779 | (18.1 | )% | $ | 2,156 | 9.1 | % | |||||||||
The amounts of our consolidated federal and state income tax expense (benefit) from continuing operations were as follows (in thousands):
Year Ended December 31, | ||||||||||||
2016 | 2015 | 2014 | ||||||||||
Current: | ||||||||||||
U.S. Federal | $ | 1,987 | $ | 10,685 | $ | 487 | ||||||
U.S. State | 2,352 | 2,716 | 1,674 | |||||||||
Non-U.S. | 26 | (43 | ) | — | ||||||||
4,365 | 13,358 | 2,161 | ||||||||||
Deferred: | ||||||||||||
U.S. Federal | $ | 15,464 | $ | (8,031 | ) | $ | (5 | ) | ||||
U.S. State | 1,946 | (4,611 | ) | — | ||||||||
Non-U.S. | (624 | ) | 63 | — | ||||||||
16,786 | (12,579 | ) | (5 | ) | ||||||||
Income tax expense from continuing operations | $ | 21,151 | $ | 779 | $ | 2,156 | ||||||
Income tax expense (benefit) was allocated between continuing operations and discontinued operations as follows (in thousands):
Year Ended December 31, | |||||||||||
2016 | 2015 | 2014 | |||||||||
Continuing operations | $ | 21,151 | $ | 779 | $ | 2,156 | |||||
Discontinued operations | (435 | ) | (180 | ) | 172 | ||||||
Income tax expense | $ | 20,716 | $ | 599 | $ | 2,328 | |||||
83
U.S. CONCRETE, INC. AND SUBSIDIARIES
NOTES TO CONSOLIDATED FINANCIAL STATEMENTS – (Continued)
Deferred income tax provisions result from temporary differences in the recognition of expenses for financial reporting purposes and for tax reporting purposes. We present the effects of those differences as deferred income tax liabilities and assets, as follows (in thousands):
December 31, | ||||||||
2016 | 2015 | |||||||
Deferred tax assets: | ||||||||
Goodwill and other intangibles | $ | 5,748 | $ | 4,165 | ||||
Receivables | 1,559 | 1,705 | ||||||
Inventory | 4,303 | 4,114 | ||||||
Accrued insurance | 5,872 | 5,170 | ||||||
Depletion | — | 366 | ||||||
Deferred revenue | 4 | 358 | ||||||
Stock compensation | 1,626 | 769 | ||||||
Charitable contribution carryover | — | — | ||||||
Other accrued expenses | 7,288 | 7,465 | ||||||
Capital loss carryforward expiration | — | — | ||||||
Net operating loss carryforwards | 5,914 | 5,699 | ||||||
Other | 3,595 | 2,024 | ||||||
Total gross deferred tax assets | 35,909 | 31,835 | ||||||
Valuation allowance | (4,983 | ) | (4,131 | ) | ||||
Net deferred tax assets | 30,926 | 27,704 | ||||||
Deferred income tax liabilities: | ||||||||
Property, plant and equipment, net | (38,544 | ) | (21,678 | ) | ||||
Depletion | (38 | ) | — | |||||
Total gross deferred tax (liabilities) | (38,582 | ) | (21,678 | ) | ||||
Net deferred tax (liability) asset | $ | (7,656 | ) | $ | 6,026 | |||
The allocation of deferred taxes between current and long-term as of December 31, 2016 and 2015 was as follows (in thousands):
December 31, | ||||||||
2016 | 2015 | |||||||
Long-term deferred tax asset, net | $ | — | $ | 6,026 | ||||
Long-term deferred tax liability, net | (7,656 | ) | — | |||||
Net deferred tax (liability) asset | $ | (7,656 | ) | $ | 6,026 | |||
In accordance with U.S. GAAP, the recognized value of deferred tax assets must be reduced to the amount that is more likely than not to be realized in future periods. The ultimate realization of the benefit of deferred tax assets from deductible temporary differences or tax carryovers depends on the generation of sufficient taxable income during the periods in which those temporary differences become deductible. We considered the scheduled reversal of deferred tax liabilities, projected future taxable income, and tax planning strategies in making this assessment. Based on these considerations, we relied upon the reversal of certain deferred tax liabilities to realize a portion of our deferred tax assets and established valuation allowances as of December 31, 2016 and 2015 in the amount of $5.0 million and $4.1 million, respectively, for other deferred tax assets because of uncertainty regarding their ultimate realization. Our total net deferred tax liability as of December 31, 2016 was $7.7 million and our total net deferred tax asset as of December 31, 2015 was $6.0 million, respectively.
We record changes in the fair value of our Warrant derivative each quarterly period in accordance with U.S. GAAP, which results in non-cash income or loss each period. We do not recognize this income or loss for purposes of calculating our tax provision; instead it is treated as an unrecognized tax benefit. Further, exercises of the Warrants are treated as an unrecognized tax benefit for purposes of calculating our tax provision. For the years ended December 31, 2016 and 2015, our tax provision excluded $7.5
84
U.S. CONCRETE, INC. AND SUBSIDIARIES
NOTES TO CONSOLIDATED FINANCIAL STATEMENTS – (Continued)
million and $22.5 million, respectively, related to this unrecognized tax benefit for federal and state tax purposes. There was no tax effect to our tax provision in 2014 related to the Warrants due to a full valuation allowance on our deferred tax assets through the third quarter of 2015.
As of each reporting date, management considers all new evidence, both positive and negative, that could impact management's view with regard to future realization of deferred tax assets. As of December 31, 2015, we achieved a history of positive pre-tax income and anticipated significant additional future pre-tax income to be generated, in part from our acquired businesses, which would result in higher U.S. Federal taxable income. For these reasons, management determined that sufficient positive evidence existed as of December 31, 2015 to conclude that it was more likely than not that additional deferred taxes of $21.1 million were realizable, and therefore, reversed a majority of the valuation allowance accordingly.
Under U.S. tax law, we have elected to treat our U.S. Virgin Island subsidiaries as controlled foreign corporations. As such, we would normally consider the undistributed earnings of our U.S. Virgin Island subsidiaries, if any, to be indefinitely reinvested and, accordingly, we would not record incremental U.S. income taxes thereon. As of December 31, 2016, our U.S. Virgin Islands subsidiaries had no undistributed earnings due to recent losses. However, we have not nor do we currently anticipate, in the foreseeable future, the need to repatriate funds to the United States to satisfy domestic liquidity needs arising in the ordinary course of business, including liquidity needs associated with our domestic debt service requirements.
At December 31, 2016, we had unrecognized tax benefits of $43.1 million which, if recognized, would impact the effective tax rate. It is unlikely a reduction of unrecognized tax benefits will occur within the next 12 months. The unrecognized tax benefits relating to amounts taken or expected to be taken in 2016 and prior tax returns are included as a component of other long-term obligations. During the years ended December 31, 2016, 2015 and 2014, we recorded interest and penalties related to unrecognized tax benefits of $0.1 million, $0.1 million and less than $0.1 million, respectively, which are included in income tax expense in our consolidated statement of operations. Total accrued penalties and interest at December 31, 2016 and 2015 was approximately $0.5 million and $0.3 million, respectively.
A reconciliation of the beginning and ending amount of unrecognized tax benefits is as follows (in thousands):
Year Ended December 31, | ||||||||||||
2016 | 2015 | 2014 | ||||||||||
Unrecognized tax benefits at January 1 | $ | 35,014 | $ | 12,098 | $ | 10,711 | ||||||
Additions for tax positions related to current year | 8,088 | 22,916 | 1,715 | |||||||||
Additions for tax positions related to prior years | — | — | 100 | |||||||||
Reductions due to lapse of statute of limitations | — | — | (63 | ) | ||||||||
Settlements | — | — | (365 | ) | ||||||||
Unrecognized tax benefits at December 31 | $ | 43,102 | $ | 35,014 | $ | 12,098 | ||||||
We recorded an unrecognized tax position in 2016 and 2015 of $7.5 million and $22.5 million, respectively, related to the Warrants, due to uncertainty about their deductibility for federal and state income tax purposes. Approximately $39.8 million and $30.9 million, respectively, of our unrecognized tax benefits as of December 31, 2016 and 2015 relate to the Warrants.
We conduct business domestically and, as a result, U.S. Concrete, Inc. or one or more of our subsidiaries file income tax returns in the U.S. federal jurisdiction and various state and local jurisdictions. In the normal course of business, we are subject to examination in the U.S. federal jurisdiction, and generally in state jurisdictions. With few exceptions, we are no longer subject to U.S. federal, state and local tax examinations for years before 2013.
16. STOCK-BASED COMPENSATION
We grant stock-based compensation awards to management, employees and non-employee directors under the U.S. Concrete, Inc. Long Term Incentive Plan (the "LTI Plan"). As of December 31, 2016, there were 0.7 million shares remaining for future issuance under the LTI Plan. Stock-based compensation may include stock options, stock appreciation rights, restricted stock awards, restricted stock units, cash-settled equity awards, and performance awards.
85
U.S. CONCRETE, INC. AND SUBSIDIARIES
NOTES TO CONSOLIDATED FINANCIAL STATEMENTS – (Continued)
Stock-Based Compensation Cost
Stock-based compensation cost is measured at the grant date based on the calculated fair value of the award. The expense is recognized on a straight-line basis over the employee’s requisite service period, generally the vesting period of the award or, for performance-based awards, over the derived service period. We have elected to use the long-form method of determining our pool of windfall tax benefits as prescribed under authoritative accounting guidance.
For the years ended December 31, 2016, 2015, and 2014, we recognized stock-based compensation expense related to restricted stock, restricted stock units and stock options of $7.1 million, $5.8 million, and $3.7 million, respectively, with a net tax-effected excess tax benefit recognized in 2016 and 2015 in the amount of $3.8 million and $5.0 million, respectively. There was no related excess tax benefit recognized in 2014. Stock-based compensation expense is reflected in selling, general and administrative expenses in our consolidated statements of operations.
As of December 31, 2016, we had approximately $6.3 million of unrecognized stock-based compensation expense, which we expect to recognize over a weighted-average period of approximately 0.9 years.
Restricted Stock Units
Restricted stock units generally vest over a one to three year period on a quarterly basis. Restricted stock units are subject to restrictions on transfer and certain conditions to vesting. These restricted stock units are not considered outstanding shares of our common stock.
Restricted stock unit activity for the year ended December 31, 2016 was as follows (units in thousands):
Number of Units | Weighted- Average Grant Date Fair Value Per Share | ||||||
Unvested restricted stock units outstanding at beginning of period | 16 | $ | 50.11 | ||||
Granted | 17 | 46.07 | |||||
Vested | (16 | ) | 50.11 | ||||
Forfeited | — | — | |||||
Unvested restricted stock units outstanding at end of period | 17 | $ | 46.07 | ||||
During 2016, 2015, and 2014, the weighted-average grant date fair value of restricted stock units granted was $46.07, $50.11 and $25.57 per share, respectively. The fair value was determined based upon the closing price of our common stock on the Nasdaq Capital Market on the date of grant.
During 2016, 2015, and 2014, the total fair value of restricted stock units vested was $0.8 million, $0.6 million and $0.6 million, respectively.
Compensation expense associated with awards of restricted stock units was $0.8 million, $0.6 million and $0.6 million for the years ended December 31, 2016, 2015, and 2014, respectively.
Restricted Stock Awards
Restricted stock awards are subject to restrictions on transfer and certain conditions to vesting. The restricted stock awards issued to date consist of a 60% time-vested component and a 40% stock performance hurdle component. The time-vested component vests annually over a two or three year period. The stock performance hurdle component triggers vesting upon our stock price reaching certain thresholds. During the restriction period, the holders of restricted stock are entitled to vote and receive dividends, thus these awards are included in our outstanding shares of common stock.
86
U.S. CONCRETE, INC. AND SUBSIDIARIES
NOTES TO CONSOLIDATED FINANCIAL STATEMENTS – (Continued)
Restricted stock award activity for the year ended December 31, 2016 was as follows (shares in thousands):
Number of Shares | Weighted- Average Grant Date Fair Value Per Share | ||||||
Unvested restricted stock awards outstanding at beginning of period | 216 | $ | 28.75 | ||||
Granted | 181 | 47.59 | |||||
Vested | (137 | ) | 29.34 | ||||
Forfeited | (24 | ) | 42.19 | ||||
Unvested restricted stock awards outstanding at end of period | 236 | $ | 41.51 | ||||
During 2016, 2015, and 2014, the weighted-average grant date fair value of restricted stock awards granted was $47.59, $30.50 and $21.11 per share, respectively. The fair value of restricted stock awards subject only to time-vesting restrictions was determined based upon the closing price of our common stock on the date of grant. The fair value of restricted stock awards subject to market performance hurdles was determined utilizing a Monte Carlo financial valuation model. Compensation expense determined utilizing the Monte Carlo simulation is recognized regardless of whether the common stock reaches the defined thresholds. The range of assumptions used to estimate the fair value of performance-based restricted stock awards granted during the years ended December 31, 2016, 2015, and 2014 were as follows:
Year Ended December 31, | ||||||
2016 | 2015 | 2014 | ||||
Expected term (years) | 0.50 - 0.80 | 0.70 - 1.00 | 0.08 - 1.08 | |||
Expected volatility | 36.9% | 36.7% | 38.6% - 42.6% | |||
Risk-free interest rate | 1.09% | 0.93% | 0.87% - 1.17% | |||
Vesting Price(1) | $64.00 - $71.25 | $43.00 - $48.00 | $29.43 - $35.60 | |||
Weighted-average grant date fair value per share | $36.64 - $41.85 | $21.47 - $24.94 | $14.18 - $26.42 | |||
(1) | The vesting price is the average of the daily volume-weighted average share price of U.S. Concrete's common stock over any period of 20 consecutive trading days within the three-year period beginning on the date of grant. |
During 2016, 2015, and 2014, the total fair value of restricted stock awards vested was $4.0 million, $5.9 million and $1.5 million, respectively.
Compensation expense associated with restricted stock awards under our incentive compensation plan was $6.3 million, $5.2 million and $3.1 million for the years ended December 31, 2016, 2015, and 2014, respectively. During 2015, we modified the terms of certain of our restricted stock awards issued during 2015, 2014, and 2013, resulting in the accelerated vesting of the time-vested component. The incremental compensation expense associated with the modification of these restricted stock awards was $0.2 million for 2015.
Stock Options
Proceeds from the exercise of stock options are credited to common stock at par value, and the excess is credited to additional paid-in capital. We estimated the fair value of each of our stock option awards on the date of grant using a Black-Scholes option pricing model. We determined the expected volatility using the historical and implied volatilities of a peer group of companies given the limited trading history of our common stock at the time. For each option awarded, the risk-free interest rate was based on the U.S. Treasury yield in effect at the time of grant for periods corresponding with the expected life of the option. The expected life of an option represents the weighted average period of time that an option grant is expected to be outstanding, giving consideration to its vesting schedule and historical exercise patterns. There were no stock option grants in 2016, 2015 or 2014. Options outstanding at December 31, 2016 relate to grants prior to 2013.
87
U.S. CONCRETE, INC. AND SUBSIDIARIES
NOTES TO CONSOLIDATED FINANCIAL STATEMENTS – (Continued)
Compensation expense related to stock options was less than $0.1 million during the year ended December 31, 2014. There was no compensation expense related to stock options for the years ended December 31, 2016 and 2015. Stock option activity for the year ended December 31, 2016 was as follows (shares in thousands):
Number of Shares Underlying Options | Weighted- Average Exercise Price Per Share | ||||||
Options outstanding at beginning of year | 31 | $ | 17.32 | ||||
Granted | — | — | |||||
Exercised | (6 | ) | 17.70 | ||||
Forfeited and expired | — | — | |||||
Options outstanding at end of year | 25 | $ | 17.23 | ||||
Options exercisable at end of year | 25 | $ | 17.23 | ||||
The total intrinsic value of stock options exercised during the years ended December 31, 2016, 2015, and 2014 was $0.3 million, $0.5 million, and $0.2 million, respectively.
The following table summarizes information about stock options outstanding as of December 31, 2016 (shares in thousands):
Options Outstanding | Options Exercisable | |||||||||||||||
Range of exercise prices | Number of Shares Outstanding | Weighted Average Remaining Contractual Life | Weighted Average Exercise Price Per Share | Number of Shares Outstanding | Weighted Average Exercise Price Per Share | |||||||||||
$12.00 - $12.00 | 9 | 3.75 | $ | 12.00 | 9 | $ | 12.00 | |||||||||
$15.00 - $15.00 | 8 | 3.75 | 15.00 | 8 | 15.00 | |||||||||||
$22.69 - $22.69 | 4 | 3.75 | 22.69 | 4 | 22.69 | |||||||||||
$26.68 - $26.68 | 4 | 3.75 | 26.68 | 4 | 26.68 | |||||||||||
$12.00 - $26.68 | 25 | 3.75 | $ | 17.23 | 25 | $ | 17.23 | |||||||||
The aggregate intrinsic value of outstanding and exercisable stock options was $1.2 million, $1.1 million, and $0.5 million at December 31, 2016, 2015, and 2014, respectively.
17. NET EARNINGS (LOSS) PER SHARE
Basic earnings (loss) per share is computed by dividing net earnings (loss) by the weighted average number of common shares outstanding during the period. Diluted earnings (loss) per share is computed by dividing net earnings (loss) by the weighted average number of common shares outstanding during the period after giving effect to all potentially dilutive securities outstanding during the period.
88
U.S. CONCRETE, INC. AND SUBSIDIARIES
NOTES TO CONSOLIDATED FINANCIAL STATEMENTS – (Continued)
The following is a reconciliation of the components of the basic and diluted earnings per share calculations for the years ended December 31, 2016, 2015, and 2014, in thousands:
Year Ended December 31, | |||||||||||
2016 | 2015 (1) | 2014 | |||||||||
Numerator: | |||||||||||
Income (loss) from continuing operations | $ | 9,578 | $ | (5,094 | ) | $ | 21,575 | ||||
Loss from discontinued operations, net of taxes | (717 | ) | (320 | ) | (993 | ) | |||||
Numerator for basic and diluted earnings per share | $ | 8,861 | $ | (5,414 | ) | $ | 20,582 | ||||
Denominator: | |||||||||||
Basic weighted average common shares outstanding | 15,098 | 14,080 | 13,541 | ||||||||
Restricted stock and restricted stock units | 84 | — | 210 | ||||||||
Warrants | 1,032 | — | 136 | ||||||||
Stock options | 12 | — | 11 | ||||||||
Denominator for diluted earnings per share | 16,226 | 14,080 | 13,898 | ||||||||
(1) | We reported losses from continuing and discontinued operations for the year ended December 31, 2015, and thus the share count used in the basic and diluted earnings per share calculation is the same. |
For the years ended December 31, 2016, 2015, and 2014, our potentially dilutive shares excluded from the calculation of diluted earnings (loss) per share included shares underlying our restricted stock awards, restricted stock units, stock options, and Warrants. The following table shows the type and number (in thousands) of potentially dilutive shares excluded from the diluted earnings (loss) per share calculations for the periods presented as their effect would have been anti-dilutive or they have not met their performance target:
Year Ended December 31, | |||||||||
2016 | 2015 | 2014 | |||||||
Potentially dilutive shares: | |||||||||
Unvested restricted stock awards and restricted stock units | 36 | 232 | 84 | ||||||
Stock options | — | 31 | 14 | ||||||
Warrants | — | 2,361 | 1,500 | ||||||
Total potentially dilutive shares | 36 | 2,624 | 1,598 | ||||||
18. SEGMENT INFORMATION
Our two reportable segments consist of ready-mixed concrete and aggregate products, as described below.
Our ready-mixed concrete segment produces and sells ready-mixed concrete. This segment serves the following principal markets: Texas, New York, New Jersey, Washington, D.C., northern California, Oklahoma, and the U.S. Virgin Islands. Our aggregate products segment includes crushed stone, sand, and gravel products and serves the north and west Texas, New York, New Jersey, southern Oklahoma, and U.S. Virgin Islands markets in which our ready-mixed concrete segment operates. Other products not associated with a reportable segment include our building materials stores, hauling operations, lime slurry, ARIDUS® Rapid Drying Concrete technology, brokered product sales, a recycled aggregates operation, an aggregates distribution operation, and an industrial waterfront marine terminal and sales yard. The financial results of the acquisitions completed in 2016, 2015, and 2014 were included in their respective reportable segment or in other products as of their respective acquisition dates.
Our customers are generally involved in the construction industry, which is a cyclical business and is subject to general and more localized economic conditions. In addition, our business is impacted by seasonal variations in weather conditions, which vary by regional market. Accordingly, demand for our products and services during the winter months are typically lower than in
89
U.S. CONCRETE, INC. AND SUBSIDIARIES
NOTES TO CONSOLIDATED FINANCIAL STATEMENTS – (Continued)
other months of the year because of inclement weather. Also, sustained periods of inclement weather and other adverse weather conditions could cause the delay of construction projects during other times of the year.
Our chief operating decision maker evaluates segment performance and allocates resources based on Adjusted EBITDA. We define Adjusted EBITDA as income (loss) from continuing operations plus the provision (benefit) for income taxes, net interest expense, depreciation, depletion and amortization, derivative gain (loss), gain (loss) on revaluation of contingent consideration, and gain (loss) on extinguishment of debt. Additionally, we adjust Adjusted EBITDA for items similar to certain of those used in calculating the Company’s compliance with debt covenants. The additional items that are adjusted to determine our Adjusted EBITDA are:
• | non-cash stock compensation expense; |
• | acquisition-related professional fees; and |
• | corporate officer severance expense. |
We consider Adjusted EBITDA to be an indicator of the operational strength and performance of our business. We have included Adjusted EBITDA because it is a key financial measure used by our management to (1) internally measure our operating performance and (2) assess our ability to service our debt, incur additional debt and meet our capital expenditure requirements.
Adjusted EBITDA should not be construed as an alternative to, or a better indicator of, operating income or loss, is not based on U.S. GAAP, and is not necessarily a measure of our cash flows or ability to fund our cash needs. Our measurement of Adjusted EBITDA may not be comparable to similarly titled measures reported by other companies, and may not be comparable to similarly titled measures used in our various agreements, including the Second A/R Loan Agreement and the Indenture.
We account for inter-segment sales at market prices. Corporate includes executive, administrative, financial, legal, human resources, business development and risk management activities which are not allocated to reportable segments and are excluded from segment Adjusted EBITDA. Eliminations include transactions to account for intercompany activity.
90
U.S. CONCRETE, INC. AND SUBSIDIARIES
NOTES TO CONSOLIDATED FINANCIAL STATEMENTS – (Continued)
The following tables set forth certain financial information relating to our continuing operations by reportable segment (in thousands):
Year Ended December 31, | ||||||||||||
2016 | 2015 | 2014 | ||||||||||
Revenue: | ||||||||||||
Ready-mixed concrete | ||||||||||||
Sales to external customers | $ | 1,060,991 | $ | 876,633 | $ | 632,787 | ||||||
Aggregate products | ||||||||||||
Sales to external customers | 41,665 | 34,191 | 31,662 | |||||||||
Intersegment sales | 34,669 | 26,248 | 20,956 | |||||||||
Total aggregate products | 76,334 | 60,439 | 52,618 | |||||||||
Total reportable segment revenue | 1,137,325 | 937,072 | 685,405 | |||||||||
Other products and eliminations | 30,835 | 37,645 | 18,309 | |||||||||
Total revenue | $ | 1,168,160 | $ | 974,717 | $ | 703,714 | ||||||
Reportable Segment Adjusted EBITDA: | ||||||||||||
Ready-mixed concrete | $ | 157,534 | $ | 131,940 | $ | 84,706 | ||||||
Aggregate products | 21,731 | 14,996 | 10,549 | |||||||||
Total reportable segment Adjusted EBITDA | $ | 179,265 | $ | 146,936 | $ | 95,255 | ||||||
Reconciliation of Total Reportable Segment Adjusted EBITDA to Income (Loss) From Continuing Operations: | ||||||||||||
Total reportable segment Adjusted EBITDA | $ | 179,265 | $ | 146,936 | $ | 95,255 | ||||||
Other products and eliminations income from operations | 9,874 | 8,704 | 3,082 | |||||||||
Corporate overhead | (43,483 | ) | (39,012 | ) | (30,870 | ) | ||||||
Depreciation, depletion and amortization for reportable segments | (50,618 | ) | (38,767 | ) | (20,362 | ) | ||||||
Interest expense, net | (27,709 | ) | (21,734 | ) | (20,431 | ) | ||||||
Corporate (loss) gain on early extinguishment of debt | (12,003 | ) | — | 11 | ||||||||
Corporate derivative loss | (19,938 | ) | (60,016 | ) | (3,556 | ) | ||||||
Loss on revaluation of contingent consideration for reportable segments | (5,225 | ) | (932 | ) | — | |||||||
Corporate, other products and eliminations other income, net | 566 | 506 | 602 | |||||||||
Income (loss) from continuing operations before income taxes | 30,729 | (4,315 | ) | 23,731 | ||||||||
Income tax expense | 21,151 | 779 | 2,156 | |||||||||
Income (loss) from continuing operations | $ | 9,578 | $ | (5,094 | ) | $ | 21,575 | |||||
Capital Expenditures: | ||||||||||||
Ready-mixed concrete | $ | 25,343 | $ | 12,321 | $ | 21,754 | ||||||
Aggregate products | 11,238 | 7,859 | 9,128 | |||||||||
Other products and corporate | 3,844 | 4,797 | 1,685 | |||||||||
Total capital expenditures | $ | 40,425 | $ | 24,977 | $ | 32,567 | ||||||
91
U.S. CONCRETE, INC. AND SUBSIDIARIES
NOTES TO CONSOLIDATED FINANCIAL STATEMENTS – (Continued)
Year Ended December 31, | ||||||||||||
2016 | 2015 | 2014 | ||||||||||
Revenue by Product: | ||||||||||||
Ready-mixed concrete | $ | 1,060,991 | $ | 876,633 | $ | 632,787 | ||||||
Aggregate products | 41,665 | 34,191 | 31,662 | |||||||||
Aggregate distribution | 25,464 | 25,438 | 4,856 | |||||||||
Building materials | 19,865 | 17,533 | 15,410 | |||||||||
Lime | 11,062 | 9,250 | 10,459 | |||||||||
Hauling | 5,395 | 5,425 | 4,221 | |||||||||
Other | 3,718 | 6,247 | 4,319 | |||||||||
Total revenue | $ | 1,168,160 | $ | 974,717 | $ | 703,714 | ||||||
As of December 31, | ||||||||||||
2016 | 2015 | 2014 | ||||||||||
Identifiable Property, Plant and Equipment Assets: | ||||||||||||
Ready-mixed concrete | $ | 229,077 | $ | 166,837 | $ | 126,141 | ||||||
Aggregate products | 87,064 | 65,937 | 40,878 | |||||||||
Other products and corporate | 21,271 | 15,349 | 9,505 | |||||||||
Total identifiable assets | $ | 337,412 | $ | 248,123 | $ | 176,524 | ||||||
19. RISK CONCENTRATION
We grant credit, generally without collateral, to our customers, which include general contractors, municipalities and commercial companies located primarily in Texas, New Jersey, New York, Washington, D.C., northern California, Oklahoma, and the U.S. Virgin Islands. Consequently, we are subject to potential credit risk related to changes in business and economic factors in those states and territories. We generally have lien rights in the work we perform, and concentrations of credit risk are limited because of the diversity of our customer base. Further, our management believes that our contract acceptance, billing and collection policies are adequate to limit potential credit risk.
Several of our subsidiaries are parties to various collective bargaining agreements with labor unions having multi-year terms. As of December 31, 2016, approximately 1,129 of our employees, or 38.5% of our workforce, were represented by labor unions having collective bargaining agreements with us. Generally, these agreements have multi-year terms and expire on a staggered basis between 2017 and 2020. As of December 31, 2015, approximately 976 of our employees, or 36.1% of our workforce, were represented by agreements that expire on a staggered basis between 2016 and 2019.
20. SIGNIFICANT CUSTOMERS AND SUPPLIERS
We did not have any customers that accounted for more than 10% of our revenues or any suppliers that accounted for more than 10% of our cost of goods sold in 2016, 2015 or 2014. We did not have any customers that accounted for more than 10% of our accounts receivable as of December 31, 2016 or December 31, 2015.
21. COMMITMENTS AND CONTINGENCIES
Legal Proceedings
From time to time, and currently, we are subject to various claims and litigation brought by employees, customers and other third parties for, among other matters, personal injuries, property damages, product defects and delay damages that have, or allegedly have, resulted from the conduct of our operations. As a result of these types of claims and litigation, we must periodically evaluate the probability of damages being assessed against us and the range of possible outcomes. In each reporting period, if we determine that the likelihood of damages being assessed against us is probable, and, if we believe we can estimate a range of possible outcomes, then we will record a liability. The amount of the liability will be based upon a specific estimate, if we believe
92
U.S. CONCRETE, INC. AND SUBSIDIARIES
NOTES TO CONSOLIDATED FINANCIAL STATEMENTS – (Continued)
a specific estimate to be likely, or it will reflect the low end of our range. Currently, there are no material legal proceedings pending against us.
In the future, we may receive funding deficiency demands related to multi-employer pension plans to which we contribute. We are unable to estimate the amount of any potential future funding deficiency demands because the actions of each of the other contributing employers in the plans has an effect on each of the other contributing employers, and the development of a rehabilitation plan by the trustees and subsequent submittal to and approval by the Internal Revenue Service is not predictable. Further, the allocation of fund assets and return assumptions by trustees are variable, as are actual investment returns relative to the plan assumptions.
As of February 28, 2017, there are no material product defect claims pending against us. Accordingly, our existing accruals for claims against us do not reflect any material amounts relating to product defect claims. While our management is not aware of any facts that would reasonably be expected to lead to material product defect claims against us that would have a material adverse effect on our business, financial condition or results of operations, it is possible that claims could be asserted against us in the future. We do not maintain insurance that would cover all damages resulting from product defect claims. In particular, we generally do not maintain insurance coverage for the cost of removing and rebuilding structures. In addition, our indemnification arrangements with contractors or others, when obtained, generally provide only limited protection against product defect claims. Due to inherent uncertainties associated with estimating unasserted claims in our business, we cannot estimate the amount of any future loss that may be attributable to unasserted product defect claims related to ready-mixed concrete we have delivered prior to December 31, 2016.
We believe that the resolution of all litigation currently pending or threatened against us or any of our subsidiaries will not materially exceed our existing accruals for those matters. However, because of the inherent uncertainty of litigation, there is a risk that we may have to increase our accruals for one or more claims or proceedings to which we or any of our subsidiaries is a party as more information becomes available or proceedings progress, and any such increase in accruals could have a material adverse effect on our consolidated financial condition or results of operations. We expect in the future that we and our operating subsidiaries will, from time to time, be a party to litigation or administrative proceedings that arise in the normal course of our business.
We are subject to federal, state and local environmental laws and regulations concerning, among other matters, air emissions and wastewater discharge. Our management believes we are in substantial compliance with applicable environmental laws and regulations. From time to time, we receive claims from federal and state environmental regulatory agencies and entities asserting that we may be in violation of environmental laws and regulations. Based on experience and the information currently available, our management does not believe that these claims will materially exceed our related accruals. Despite compliance and experience, it is possible that we could be held liable for future charges, which might be material, but are not currently known to us or cannot be estimated by us. In addition, changes in federal or state laws, regulations or requirements, or discovery of currently unknown conditions, could require additional expenditures.
As permitted under Delaware law, we have agreements that provide indemnification of officers and directors for certain events or occurrences while the officer or director is or was serving at our request in such capacity. The maximum potential amount of future payments that we could be required to make under these indemnification agreements is not limited; however, we have a director and officer insurance policy that potentially limits our exposure and enables us to recover a portion of future amounts that may be paid. As a result of the insurance policy coverage, we believe the estimated fair value of these indemnification agreements is minimal. Accordingly, we have not recorded any liabilities for these agreements as of December 31, 2016.
We and our subsidiaries are parties to agreements that require us to provide indemnification in certain instances when we acquire businesses and real estate and in the ordinary course of business with our customers, suppliers, lessors and service providers.
Lease Payments
We lease certain mobile and other equipment, land, facilities, office space and other items which, in the normal course of business, are renewed or replaced by subsequent leases. Total consolidated expense for such operating leases amounted to $18.5 million in 2016, $17.4 million in 2015, and $11.9 million in 2014.
93
U.S. CONCRETE, INC. AND SUBSIDIARIES
NOTES TO CONSOLIDATED FINANCIAL STATEMENTS – (Continued)
Future minimum rental payments with respect to our operating lease obligations as of December 31, 2016, are as follows (in thousands):
Year Ending December 31, | ||||
2017 | $ | 18,400 | ||
2018 | 14,747 | |||
2019 | 10,605 | |||
2020 | 7,480 | |||
2021 | 5,885 | |||
Thereafter | 21,980 | |||
$ | 79,097 | |||
Our annual lease expense differs from our future minimum rental payments as a result of month to month equipment leases to support our operations.
Insurance Programs
We maintain third-party insurance coverage against certain workers’ compensation, automobile and general liability risks. Under certain components of our insurance program, we share the risk of loss with our insurance underwriters by maintaining high deductibles subject to aggregate annual loss limitations. Generally, our deductible retentions per occurrence for auto, workers’ compensation and general liability insurance programs are $1.0 million, although certain of our operations are self-insured for workers’ compensation. We fund these deductibles and record an expense for expected losses under the programs. The expected losses are determined using a combination of our historical loss experience and subjective assessments of our future loss exposure. The estimated losses are subject to uncertainty, including changes in claims reporting patterns, claims settlement patterns, judicial decisions, legislation and economic conditions. Although we believe that the estimated losses we have recorded are reasonable, significant differences related to the items noted above could materially affect our insurance obligations and future expense. The amount accrued for self-insurance claims was $13.5 million as of December 31, 2016, compared to $12.0 million as of December 31, 2015, which is recorded in accrued liabilities.
Performance Bonds
In the normal course of business, we and our subsidiaries are contingently liable for performance under $40.0 million in performance bonds that various contractors, states and municipalities have required as of December 31, 2016. The bonds principally relate to construction contracts, reclamation obligations and licensing and permitting. We and our subsidiaries have indemnified the underwriting insurance company against any exposure under the performance bonds. No material claims have been made against these bonds.
22. EMPLOYEE BENEFIT PLANS AND MULTI-EMPLOYER PENSION PLANS
Defined Contribution 401(k) Plan
We maintain a defined contribution 401(k) profit sharing plan for employees meeting various employment requirements. Eligible employees may contribute amounts up to the lesser of 60% of their annual compensation or the maximum amount Internal Revenue Service ("IRS") regulations permit. During 2016, we matched 100% of the first 5% of employee contributions. During 2015, we matched 100% of the first 4% of employee contributions. During 2014, we matched 100% of the first 1% of employee contributions and 50% of the next 5% of employee contributions. We paid matching contributions of $4.2 million in 2016, $2.9 million in 2015, and $1.5 million in 2014.
Multi-Employer Pension Plans
Several of our subsidiaries are parties to various collective bargaining agreements with labor unions having multi-year terms that expire on a staggered basis. Under these agreements, our applicable subsidiaries pay specified wages to covered employees, observe designated workplace rules and make payments to multi-employer pension plans and employee benefit trusts rather than administering the funds on behalf of these employees. The risks of participating in these multi-employer pension plans are different
94
U.S. CONCRETE, INC. AND SUBSIDIARIES
NOTES TO CONSOLIDATED FINANCIAL STATEMENTS – (Continued)
from single-employer plans. Assets contributed to the multi-employer plan by one employer may be used to provide benefits to employees of other participating employers. If a participating employer stops contributing to the plan, the unfunded obligations of the plan may be borne by the remaining participating employers. If we choose to stop participating in some of these multi-employer plans, we may be required to pay those plans an amount based on the underfunded status of the plan, referred to as a withdrawal liability. We were not required to record a liability in fiscal 2016 or 2015 for full and partial withdrawals from any multi-employer pension plans. For additional information regarding our potential future obligations, see Note 21.
The required disclosures and our participation in significant multi-employer pension plans are presented in the table below. The EIN / Pension Plan Number column provides the Employer Identification Number (“EIN”) and the three-digit plan number, if applicable. The Pension Protection Act zone status is based on information available from the plan or the plan’s public filings. Among other factors, plans in the red zone are generally less than 65% funded, plans in the orange or yellow zones are less than 80% funded, and plans in the green zone are at least 80% funded. The FIP / RP Status Pending / Implemented column indicates plans for which a financial improvement plan (“FIP”) or a rehabilitation plan (“RP”) is either pending or has been implemented. The final column lists the expiration date(s) of the collective-bargaining agreements to which the plans are subject.
Pension Fund | EIN / PPN | Pension Protection Act Zone Status | FIP / RP Status Pending / Implemented | Contributions (in Thousands) | Surcharge Imposed | Expiration Date of Collective Bargaining Agreement | ||||||||||||||||||
2016 | 2014 and 2015 | 2016 | 2015 | 2014 | ||||||||||||||||||||
Western Conference of Teamsters Pension Plan | 91-6145047/001 | Green | Green | No | $ | 4,820 | $ | 4,357 | $ | 3,568 | No | 8/27/2017 to 7/31/2020 | ||||||||||||
Local 282 Pension Trust Fund | 11-6245313/001 | Green | Green | No | 3,896 | 829 | 819 | No | 6/30/2019 | |||||||||||||||
Operating Engineers Pension Trust Fund | 94-6090764/001 | Red | Orange | No | 1,121 | 1,173 | 933 | No | 7/1/2017 | |||||||||||||||
Trucking Employees of North Jersey Pension Fund | 22-6063702/001 | Red | Red | Yes | 665 | 615 | 559 | No | 4/30/2018 | |||||||||||||||
Teamsters Local 641 | 22-6220288/001 | Red | Red | Yes | 300 | 111 | 88 | No | 4/30/2018 | |||||||||||||||
Other | Various | Various | Various | Various | 1,420 | 973 | 976 | Various | 6/30/2017 to 7/31/19 | |||||||||||||||
$ | 12,222 | $ | 8,058 | $ | 6,943 | |||||||||||||||||||
Contributions to the Local 282 Pension Trust fund increased from 2015 to 2016 primarily due to the impact of employees added as part of the Nycon, Jenna, and Kings acquisitions. Contributions to the Western Conference of Teamsters Pension Plan increased from 2014 to 2015 due primarily to the impact of employees added as part of the Right Away acquisition during 2015. At the date that these consolidated financial statements were issued, Forms 5500 were generally not available for the plan year ending in 2016. Based on the most recent Forms 5500 available for each multi-employer pension plan, our contributions did not represent more than 5% of total contributions to any of the significant plans shown above.
95
U.S. CONCRETE, INC. AND SUBSIDIARIES
NOTES TO CONSOLIDATED FINANCIAL STATEMENTS – (Continued)
23. SUPPLEMENTAL CONDENSED CONSOLIDATING FINANCIAL INFORMATION
The 2024 Notes are fully and unconditionally and jointly and severally guaranteed on a senior unsecured basis by each direct and indirect domestic subsidiary of the Company, each a guarantor subsidiary. Each guarantor subsidiary is directly or indirectly 100% owned by the Company. The 2024 Notes are not guaranteed by any direct or indirect foreign subsidiaries of the Company, each a non-guarantor subsidiary. Consequently, we are required to provide condensed consolidating financial information in accordance with Rule 3-10 of Regulation S-X.
The following condensed consolidating financial information present, in separate columns, financial information for (1) the Parent on a parent only basis, (2) the guarantor subsidiaries on a combined basis, (3) the non-guarantor subsidiaries on a combined basis, (4) the eliminations and reclassifications necessary to arrive at the information for the Company on a consolidated basis, and (5) the Company on a consolidated basis.
The following condensed consolidating financial information of U.S. Concrete, Inc. and its subsidiaries present investments in consolidated subsidiaries using the equity method of accounting. The principal elimination entries eliminate investments in subsidiaries and intercompany balances and transactions.
96
U.S. CONCRETE, INC. AND SUBSIDIARIES
NOTES TO CONSOLIDATED FINANCIAL STATEMENTS – (Continued)
U.S. CONCRETE, INC. AND SUBSIDARIES
CONDENSED CONSOLIDATING BALANCE SHEET
DECEMBER 31, 2016
(in thousands)
Parent | Guarantor Subsidiaries | Non-Guarantor Subsidiaries | Eliminations and Reclassifications | U.S. Concrete Consolidated | ||||||||||||||||
ASSETS | ||||||||||||||||||||
Current assets: | ||||||||||||||||||||
Cash and cash equivalents | $ | — | $ | 75,576 | $ | 198 | $ | — | $ | 75,774 | ||||||||||
Trade accounts receivable, net | — | 206,426 | 866 | — | 207,292 | |||||||||||||||
Inventories | — | 38,856 | 3,123 | — | 41,979 | |||||||||||||||
Prepaid expenses | — | 5,516 | 18 | — | 5,534 | |||||||||||||||
Other receivables | 1,200 | 7,491 | — | — | 8,691 | |||||||||||||||
Other current assets | 39,239 | 2,004 | 15 | (39,239 | ) | 2,019 | ||||||||||||||
Total current assets | 40,439 | 335,869 | 4,220 | (39,239 | ) | 341,289 | ||||||||||||||
Property, plant and equipment, net | — | 314,332 | 23,080 | — | 337,412 | |||||||||||||||
Goodwill | — | 127,518 | 5,753 | — | 133,271 | |||||||||||||||
Intangible assets, net | — | 127,798 | 3,175 | — | 130,973 | |||||||||||||||
Deferred income taxes | — | — | 561 | (561 | ) | — | ||||||||||||||
Investment in subsidiaries | 368,726 | — | — | (368,726 | ) | — | ||||||||||||||
Intercompany receivables | 239,776 | — | — | (239,776 | ) | — | ||||||||||||||
Other assets | — | 2,410 | 47 | — | 2,457 | |||||||||||||||
Total assets | $ | 648,941 | $ | 907,927 | $ | 36,836 | $ | (648,302 | ) | $ | 945,402 | |||||||||
LIABILITIES AND EQUITY | ||||||||||||||||||||
Current liabilities: | ||||||||||||||||||||
Accounts payable | $ | 458 | $ | 108,803 | $ | 1,433 | $ | — | $ | 110,694 | ||||||||||
Accrued liabilities | 5,365 | 117,104 | 2,013 | (39,239 | ) | 85,243 | ||||||||||||||
Current maturities of long-term debt | — | 16,654 | — | — | 16,654 | |||||||||||||||
Derivative liabilities | 57,415 | — | — | — | 57,415 | |||||||||||||||
Total current liabilities | 63,238 | 242,561 | 3,446 | (39,239 | ) | 270,006 | ||||||||||||||
Long-term debt, net of current maturities | 391,190 | 41,454 | — | — | 432,644 | |||||||||||||||
Other long-term obligations and deferred credits | 5,684 | 39,613 | 970 | — | 46,267 | |||||||||||||||
Deferred income taxes | — | 8,217 | — | (561 | ) | 7,656 | ||||||||||||||
Intercompany payables | — | 233,319 | 6,457 | (239,776 | ) | — | ||||||||||||||
Total liabilities | 460,112 | 565,164 | 10,873 | (279,576 | ) | 756,573 | ||||||||||||||
Total equity | 188,829 | 342,763 | 25,963 | (368,726 | ) | 188,829 | ||||||||||||||
Total liabilities and equity | $ | 648,941 | $ | 907,927 | $ | 36,836 | $ | (648,302 | ) | $ | 945,402 | |||||||||
97
U.S. CONCRETE, INC. AND SUBSIDIARIES
NOTES TO CONSOLIDATED FINANCIAL STATEMENTS – (Continued)
U.S. CONCRETE, INC. AND SUBSIDARIES
CONDENSED CONSOLIDATING BALANCE SHEET
DECEMBER 31, 2015
(in thousands)
Parent | Guarantor Subsidiaries | Non-Guarantor Subsidiaries | Eliminations and Reclassifications | U.S. Concrete Consolidated | ||||||||||||||||
ASSETS | ||||||||||||||||||||
Current assets: | ||||||||||||||||||||
Cash and cash equivalents | $ | — | $ | 3,854 | $ | 71 | $ | — | $ | 3,925 | ||||||||||
Trade accounts receivable, net | — | 170,133 | 1,123 | — | 171,256 | |||||||||||||||
Inventories | — | 34,149 | 2,577 | — | 36,726 | |||||||||||||||
Prepaid expenses | — | 4,091 | 152 | — | 4,243 | |||||||||||||||
Other receivables | — | 7,736 | 29 | — | 7,765 | |||||||||||||||
Other current assets | 24,152 | 2,371 | 44 | (24,193 | ) | 2,374 | ||||||||||||||
Total current assets | 24,152 | 222,334 | 3,996 | (24,193 | ) | 226,289 | ||||||||||||||
Property, plant and equipment, net | — | 242,048 | 6,075 | — | 248,123 | |||||||||||||||
Goodwill | — | 73,638 | 26,566 | — | 100,204 | |||||||||||||||
Intangible assets, net | — | 95,754 | — | — | 95,754 | |||||||||||||||
Deferred income taxes | — | 6,089 | — | (63 | ) | 6,026 | ||||||||||||||
Investment in subsidiaries | 308,346 | — | — | (308,346 | ) | — | ||||||||||||||
Intercompany receivables | 119,070 | — | — | (119,070 | ) | — | ||||||||||||||
Other assets | — | 5,254 | 47 | — | 5,301 | |||||||||||||||
Total assets | $ | 451,568 | $ | 645,117 | $ | 36,684 | $ | (451,672 | ) | $ | 681,697 | |||||||||
LIABILITIES AND EQUITY | ||||||||||||||||||||
Current liabilities: | ||||||||||||||||||||
Accounts payable | $ | 274 | $ | 78,902 | $ | 1,243 | $ | — | $ | 80,419 | ||||||||||
Accrued liabilities | 4,507 | 103,247 | 2,293 | (24,193 | ) | 85,854 | ||||||||||||||
Current maturities of long-term debt | — | 9,386 | — | — | 9,386 | |||||||||||||||
Derivative liabilities | 67,401 | — | — | — | 67,401 | |||||||||||||||
Total current liabilities | 72,182 | 191,535 | 3,536 | (24,193 | ) | 243,060 | ||||||||||||||
Long-term debt, net of current maturities | 238,850 | 27,364 | — | — | 266,214 | |||||||||||||||
Other long-term obligations and deferred credits | 6,529 | 31,887 | — | — | 38,416 | |||||||||||||||
Deferred income taxes | — | — | 63 | (63 | ) | — | ||||||||||||||
Intercompany payables | — | 112,164 | 6,906 | (119,070 | ) | — | ||||||||||||||
Total liabilities | 317,561 | 362,950 | 10,505 | (143,326 | ) | 547,690 | ||||||||||||||
Total equity | 134,007 | 282,167 | 26,179 | (308,346 | ) | 134,007 | ||||||||||||||
Total liabilities and equity | $ | 451,568 | $ | 645,117 | $ | 36,684 | $ | (451,672 | ) | $ | 681,697 | |||||||||
98
U.S. CONCRETE, INC. AND SUBSIDIARIES
NOTES TO CONSOLIDATED FINANCIAL STATEMENTS – (Continued)
U.S. CONCRETE, INC. AND SUBSIDARIES
CONDENSED CONSOLIDATING STATEMENT OF OPERATIONS
YEAR ENDED DECEMBER 31, 2016
(in thousands)
Parent | Guarantor Subsidiaries | Non-Guarantor Subsidiaries | Eliminations and Reclassifications | U.S. Concrete Consolidated | ||||||||||||||||
Revenue | $ | — | $ | 1,147,539 | $ | 20,621 | $ | — | $ | 1,168,160 | ||||||||||
Cost of goods sold before depreciation, depletion and amortization | — | 904,608 | 17,730 | — | 922,338 | |||||||||||||||
Selling, general and administrative expenses | — | 97,318 | 2,701 | — | 100,019 | |||||||||||||||
Depreciation, depletion and amortization | — | 52,795 | 2,057 | — | 54,852 | |||||||||||||||
Loss on remeasurement of contingent consideration | 180 | 5,045 | — | — | 5,225 | |||||||||||||||
Gain on sale of assets, net | — | (1,416 | ) | — | — | (1,416 | ) | |||||||||||||
(Loss) income from operations | (180 | ) | 89,189 | (1,867 | ) | — | 87,142 | |||||||||||||
Interest expense, net | (25,922 | ) | (1,774 | ) | (13 | ) | — | (27,709 | ) | |||||||||||
Derivative loss | (19,938 | ) | — | — | — | (19,938 | ) | |||||||||||||
Loss on extinguishment of debt | (12,003 | ) | — | — | — | (12,003 | ) | |||||||||||||
Other income, net | — | 3,231 | 6 | — | 3,237 | |||||||||||||||
(Loss) income from continuing operations before income taxes and equity in earnings of subsidiaries | (58,043 | ) | 90,646 | (1,874 | ) | — | 30,729 | |||||||||||||
Income tax (benefit) expense | (15,087 | ) | 36,830 | (592 | ) | — | 21,151 | |||||||||||||
Net (loss) income from continuing operations before equity in earnings of subsidiaries | (42,956 | ) | 53,816 | (1,282 | ) | — | 9,578 | |||||||||||||
Loss from discontinued operations, net of taxes and before equity in earnings of subsidiaries | — | (717 | ) | — | — | (717 | ) | |||||||||||||
Net (loss) income before equity in earnings of subsidiaries | (42,956 | ) | 53,099 | (1,282 | ) | — | 8,861 | |||||||||||||
Equity in earnings of subsidiaries | 51,817 | — | — | (51,817 | ) | — | ||||||||||||||
Net income (loss) | $ | 8,861 | $ | 53,099 | $ | (1,282 | ) | $ | (51,817 | ) | $ | 8,861 | ||||||||
99
U.S. CONCRETE, INC. AND SUBSIDIARIES
NOTES TO CONSOLIDATED FINANCIAL STATEMENTS – (Continued)
U.S. CONCRETE, INC. AND SUBSIDARIES
CONDENSED CONSOLIDATING STATEMENT OF OPERATIONS
YEAR ENDED DECEMBER 31, 2015
(in thousands)
Parent | Guarantor Subsidiaries | Non-Guarantor Subsidiaries | Eliminations and Reclassifications | U.S. Concrete Consolidated | ||||||||||||||||
Revenue | $ | — | $ | 970,701 | $ | 4,016 | $ | — | $ | 974,717 | ||||||||||
Cost of goods sold before depreciation, depletion and amortization | — | 765,314 | 3,125 | — | 768,439 | |||||||||||||||
Selling, general and administrative expenses | — | 86,569 | 304 | — | 86,873 | |||||||||||||||
Depreciation, depletion and amortization | — | 43,545 | 25 | — | 43,570 | |||||||||||||||
Loss on remeasurement of contingent consideration | 871 | 61 | — | — | 932 | |||||||||||||||
Gain on sale of assets, net | — | (468 | ) | — | — | (468 | ) | |||||||||||||
(Loss) income from operations | (871 | ) | 75,680 | 562 | — | 75,371 | ||||||||||||||
Interest expense, net | (20,452 | ) | (1,280 | ) | (2 | ) | — | (21,734 | ) | |||||||||||
Derivative loss | (60,016 | ) | — | — | — | (60,016 | ) | |||||||||||||
Other income (expense), net | — | 2,075 | (11 | ) | — | 2,064 | ||||||||||||||
(Loss) income from continuing operations before income taxes and equity in earnings of subsidiaries | (81,339 | ) | 76,475 | 549 | — | (4,315 | ) | |||||||||||||
Income tax (benefit) expense | (7,823 | ) | 8,581 | 21 | — | 779 | ||||||||||||||
Net (loss) income from continuing operations before equity in earnings of subsidiaries | (73,516 | ) | 67,894 | 528 | — | (5,094 | ) | |||||||||||||
Loss from discontinued operations, net of taxes and before equity in earnings of subsidiaries | — | (320 | ) | — | — | (320 | ) | |||||||||||||
Net (loss) income before equity in earnings of subsidiaries | (73,516 | ) | 67,574 | 528 | — | (5,414 | ) | |||||||||||||
Equity in earnings of subsidiaries | 68,102 | — | — | (68,102 | ) | — | ||||||||||||||
Net (loss) income | $ | (5,414 | ) | $ | 67,574 | $ | 528 | $ | (68,102 | ) | $ | (5,414 | ) | |||||||
100
U.S. CONCRETE, INC. AND SUBSIDIARIES
NOTES TO CONSOLIDATED FINANCIAL STATEMENTS – (Continued)
U.S. CONCRETE, INC. AND SUBSIDARIES
CONDENSED CONSOLIDATING STATEMENT OF CASH FLOWS
YEAR ENDED DECEMBER 31, 2016
(in thousands)
Parent | Guarantor Subsidiaries | Non-Guarantor Subsidiaries | Eliminations | U.S. Concrete Consolidated | ||||||||||||||||
Net cash (used in) provided by operating activities | $ | (23,585 | ) | $ | 134,685 | $ | 1,024 | $ | — | $ | 112,124 | |||||||||
Cash flows from investing activities: | ||||||||||||||||||||
Purchases of property, plant and equipment | — | (37,501 | ) | (2,924 | ) | — | (40,425 | ) | ||||||||||||
Payments for acquisitions, net of cash acquired | — | (127,927 | ) | — | — | (127,927 | ) | |||||||||||||
Proceeds from disposals of property, plant and equipment | — | 2,744 | — | — | 2,744 | |||||||||||||||
Proceeds from disposals of acquired businesses | — | 1,565 | — | — | 1,565 | |||||||||||||||
Insurance proceeds from property loss claim | — | 1,348 | — | — | 1,348 | |||||||||||||||
Investment in subsidiaries | (1,480 | ) | — | — | 1,480 | — | ||||||||||||||
Net cash used in investing activities | (1,480 | ) | (159,771 | ) | (2,924 | ) | 1,480 | (162,695 | ) | |||||||||||
Cash flows from financing activities: | ||||||||||||||||||||
Proceeds from revolver borrowings | 128,904 | — | — | — | 128,904 | |||||||||||||||
Repayments of revolver borrowings | (173,904 | ) | — | — | — | (173,904 | ) | |||||||||||||
Proceeds from issuance of debt | 400,000 | 400,000 | ||||||||||||||||||
Repayments of debt | (200,000 | ) | — | — | — | (200,000 | ) | |||||||||||||
Premium paid on early retirement of debt | (8,500 | ) | — | — | — | (8,500 | ) | |||||||||||||
Proceeds from exercise of stock options and warrants | 348 | — | — | — | 348 | |||||||||||||||
Payments of other long-term obligations | (657 | ) | (4,022 | ) | — | — | (4,679 | ) | ||||||||||||
Payments for other financing | 160 | (13,593 | ) | — | — | (13,433 | ) | |||||||||||||
Excess tax benefits from stock-based compensation | 3,787 | — | — | — | 3,787 | |||||||||||||||
Debt issuance costs | (7,824 | ) | — | — | — | (7,824 | ) | |||||||||||||
Other treasury share purchases | (2,857 | ) | — | — | — | (2,857 | ) | |||||||||||||
Other proceeds | — | 578 | — | — | 578 | |||||||||||||||
Intercompany funding | (114,392 | ) | 113,845 | 2,027 | (1,480 | ) | — | |||||||||||||
Net cash provided by financing activities | 25,065 | 96,808 | 2,027 | (1,480 | ) | 122,420 | ||||||||||||||
Net increase in cash and cash equivalents | — | 71,722 | 127 | — | 71,849 | |||||||||||||||
Cash and cash equivalents at beginning of period | — | 3,854 | 71 | — | 3,925 | |||||||||||||||
Cash and cash equivalents at end of period | $ | — | $ | 75,576 | $ | 198 | $ | — | $ | 75,774 | ||||||||||
101
U.S. CONCRETE, INC. AND SUBSIDIARIES
NOTES TO CONSOLIDATED FINANCIAL STATEMENTS – (Continued)
U.S. CONCRETE, INC. AND SUBSIDARIES
CONDENSED CONSOLIDATING STATEMENT OF CASH FLOWS
YEAR ENDED DECEMBER 31, 2015
(in thousands)
Parent | Guarantor Subsidiaries | Non-Guarantor Subsidiaries | Eliminations | U.S. Concrete Consolidated | ||||||||||||||||
Net cash (used in) provided by operating activities | $ | (17,619 | ) | $ | 122,658 | $ | (778 | ) | $ | — | $ | 104,261 | ||||||||
Cash flows from investing activities: | ||||||||||||||||||||
Purchases of property, plant and equipment | — | (24,977 | ) | — | — | (24,977 | ) | |||||||||||||
Payments for acquisitions, net of cash acquired | (39,858 | ) | (89,411 | ) | (6,078 | ) | — | (135,347 | ) | |||||||||||
Proceeds from disposals of property, plant and equipment | — | 1,312 | — | — | 1,312 | |||||||||||||||
Proceeds from disposals of business units | — | 1,177 | — | — | 1,177 | |||||||||||||||
Investment in subsidiaries | (785 | ) | — | — | 785 | — | ||||||||||||||
Net cash used in investing activities | (40,643 | ) | (111,899 | ) | (6,078 | ) | 785 | (157,835 | ) | |||||||||||
Cash flows from financing activities: | ||||||||||||||||||||
Proceeds from revolver borrowings | 206,809 | — | — | — | 206,809 | |||||||||||||||
Repayments of revolver borrowings | (161,809 | ) | — | — | — | (161,809 | ) | |||||||||||||
Repayments of debt | (117 | ) | — | — | — | (117 | ) | |||||||||||||
Proceeds from exercise of stock options and warrants | 546 | — | — | — | 546 | |||||||||||||||
Payments of other long-term obligations | (1,000 | ) | (1,298 | ) | — | — | (2,298 | ) | ||||||||||||
Payments for other financing | — | (8,611 | ) | — | — | (8,611 | ) | |||||||||||||
Debt issuance costs | (893 | ) | — | — | — | (893 | ) | |||||||||||||
Other treasury share purchases | (6,330 | ) | — | — | — | (6,330 | ) | |||||||||||||
Intercompany funding | 21,056 | (27,198 | ) | 6,927 | (785 | ) | — | |||||||||||||
Net cash provided by (used in) financing activities | 58,262 | (37,107 | ) | 6,927 | (785 | ) | 27,297 | |||||||||||||
Net (decrease) increase in cash and cash equivalents | — | (26,348 | ) | 71 | — | (26,277 | ) | |||||||||||||
Cash and cash equivalents at beginning of period | — | 30,202 | — | 30,202 | ||||||||||||||||
Cash and cash equivalents at end of period | $ | — | $ | 3,854 | $ | 71 | $ | — | $ | 3,925 | ||||||||||
102
U.S. CONCRETE, INC. AND SUBSIDIARIES
NOTES TO CONSOLIDATED FINANCIAL STATEMENTS – (Continued)
24. QUARTERLY SUMMARY (unaudited)
Year Ended December 31, 2016 | ||||||||||||||||
(in thousands, except per share data) | ||||||||||||||||
First Quarter | Second Quarter | Third Quarter | Fourth Quarter | |||||||||||||
Revenue - continuing operations | $ | 245,045 | $ | 275,750 | $ | 328,588 | $ | 318,777 | ||||||||
Net (loss) income | $ | (10,027 | ) | $ | (3,477 | ) | $ | 37,956 | $ | (15,591 | ) | |||||
Net (loss) income per share-basic | $ | (0.68 | ) | $ | (0.23 | ) | $ | 2.49 | $ | (1.01 | ) | |||||
Net (loss) income per share-diluted | $ | (0.68 | ) | $ | (0.23 | ) | $ | 2.34 | $ | (1.01 | ) | |||||
Year Ended December 31, 2015 | ||||||||||||||||
(in thousands, except per share data) | ||||||||||||||||
First Quarter | Second Quarter | Third Quarter | Fourth Quarter | |||||||||||||
Revenue - continuing operations | $ | 171,338 | $ | 244,695 | $ | 295,111 | $ | 263,573 | ||||||||
Net (loss) income | $ | (10,484 | ) | $ | 9,703 | $ | 1,619 | $ | (6,252 | ) | ||||||
Net (loss) income per share-basic | $ | (0.77 | ) | $ | 0.69 | $ | 0.11 | $ | (0.43 | ) | ||||||
Net (loss) income per share-diluted | $ | (0.77 | ) | $ | 0.64 | $ | 0.10 | $ | (0.43 | ) | ||||||
Our customers are generally involved in the construction industry, which is a cyclical business and is subject to general and more localized economic conditions. In addition, our business is impacted by seasonal variations in weather conditions, which vary by regional market. Accordingly, demand for our products and services during the winter months are typically lower than in other months of the year because of inclement weather. Also, sustained periods of inclement weather and other adverse weather conditions could cause the delay of construction projects during other times of the year.
During the second quarter of 2016, we incurred a pre-tax loss on the early extinguishment of debt and other related costs of $12.0 million. See Note 9 for additional information.
25. SUBSEQUENT EVENT
On January 9, 2017, we completed an offering of $200.0 million aggregate principal amount of additional 2024 Notes (the "Additional Notes") at an issue price of 105.75%. The terms of the Additional Notes are identical to the terms of the 2024 Notes, other than the issue date, the issue price, the first interest payment date and the provisions relating to transfer restrictions and registration rights. We intend to use the net proceeds from the offering of the Additional Notes, which were approximately $208.4 million, for general corporate purposes, including funding the purchase price of future acquisitions to expand our business.
103
U.S. CONCRETE, INC. AND SUBSIDIARIES
NOTES TO CONSOLIDATED FINANCIAL STATEMENTS – (Continued)
Item 9. Changes in and Disagreements with Accountants on Accounting and Financial Disclosure
None.
Item 9A. Controls and Procedures
On June 24, 2016, August 10, 2016, and August 22, 2016, we acquired the assets of Nycon, Jenna and Kings, respectively (collectively, the “2016 New York Acquisitions”). We are in the process of integrating each of the 2016 New York Acquisitions. The 2016 New York Acquisitions collectively represented 16.5% of our consolidated total assets and 5.8% of our consolidated revenue included in our consolidated financial statements as of and for the year ended December 31, 2016. In reliance on interpretive guidance issued by the SEC staff, management’s evaluation and conclusion as to the effectiveness of the Company’s disclosure controls and procedures and internal control over financial reporting as of the end of the period covered by this Annual Report on Form 10-K excludes any evaluation of the internal control over financial reporting of each of the 2016 New York Acquisitions. Management will include each of the 2016 New York Acquisitions in its 2017 assessment of internal control over financial reporting.
Disclosure Controls and Procedures
As of December 31, 2016, our management, with the participation of our principal executive officer and our principal financial officer, evaluated the effectiveness of our disclosure controls and procedures (as defined in Rule 13a-15(e) of the Securities Exchange Act of 1934, as amended (the “Exchange Act”)), which are designed to provide reasonable assurance that the information required to be disclosed in the reports that we file or submit under the Exchange Act is recorded, processed, summarized and reported within the time periods specified in the Securities and Exchange Commission's rules and forms. Disclosure controls and procedures include controls and procedures that are designed to provide reasonable assurance that information required to be disclosed in the reports that we file or submit under the Exchange Act is accumulated and communicated to management, including our principal executive officer and principal financial officer, as appropriate, to allow timely decisions regarding required disclosure.
Based on that evaluation and due to the material weakness in our internal control over financial reporting discussed below, our principal executive officer and principal financial officer have concluded that the Company’s disclosure controls and procedures were not effective at the reasonable assurance level as of December 31, 2016.
Management’s Report on Internal Control over Financial Reporting
Our management is responsible for establishing and maintaining adequate internal control over financial reporting (as that term is defined in Rules 13a-15(f) and 15d-15(f) under the Exchange Act). Our internal control over financial reporting is a process designed to provide reasonable assurance regarding the reliability of financial reporting and the preparation of financial statements for external reporting purposes in accordance with generally accepted accounting principles.
Under the supervision and with the participation of our management, including our principal executive, financial and accounting officers, we have conducted an evaluation of the effectiveness of our internal control over financial reporting (excluding the 2016 New York Acquisitions as described above) based on the framework in “Internal Control - Integrated Framework (2013)” issued by the Committee of Sponsoring Organizations of the Treadway Commission. Based on that evaluation, our management has concluded that our internal control over financial reporting as of December 31, 2016 was not effective because of the identification of the material weakness described below.
A material weakness is a deficiency, or combination of deficiencies, in internal control over financial reporting such that there is a reasonable possibility that a material misstatement in our annual or interim financial statements will not be prevented or detected on a timely basis. During the course of our assessment, management concluded that a material weakness previously identified and disclosed, relating to the accuracy and presentation of the accounting for income taxes, had not been fully remediated. Management concluded that a material weakness in its internal control over financial reporting existed as of December 31, 2016 relating to management review controls associated with the completeness and accuracy of computations relating to income tax accounts and disclosures.
104
Grant Thornton LLP, the Company's independent registered public accounting firm, has audited our consolidated financial statements included in this report and has issued an attestation report on the Company's internal control over financial reporting, which is included herein.
Notwithstanding our material weakness, we have concluded that the financial statements and other financial information included in this Annual Report on Form 10-K fairly present in all material respects our financial condition, results of operations and cash flows as of, and for, the periods presented.
Remediation Efforts
Our management previously identified and disclosed that we had a material weakness in our internal control over financial reporting relating to the accuracy and presentation of the accounting for income taxes, including the income tax provision and related tax assets and liabilities as of December 31, 2015. Since that time, with the oversight of our audit committee, we have aggressively pursued several avenues to remediate the previously identified material weakness and to strengthen our internal control over financial reporting in the area of tax accounting. The following steps to strengthen our internal controls related to tax accounting were implemented and performed during 2016:
• | the hiring of a senior tax director experienced in income tax accounting under U.S. GAAP and taxation of multinational corporations; |
• | implementation of additional supervisory and review processes; |
• | development and use of tax item checklists and research tools to assist in compliance with U.S. GAAP regarding complex tax accounting issues, including non-routine transactions; |
• | review of the tax accounting process to identity and implement enhanced tax accounting processes and related internal control procedures; |
• | enhancement of our process and internal controls for the accounting for income taxes, including preparation of tax accounting position papers documenting our analysis and conclusions for all technical tax accounting matters; and |
• | increased third-party tax advisory services to validate tax positions and disclosures. |
During 2017, we will continue to take actions to address and remediate the material weakness referred to above. Specifically, we intend to retain additional staffing for our internal tax accounting department, which experienced turnover during the quarter ended December 31, 2016 and which we supplemented with third party tax advisory service providers, and to implement enhanced documentation policies and procedures to be followed by our tax accounting department and third-party tax advisory service providers.
The successful remediation of this material weakness will require review and evidence of the effectiveness of the related internal controls as part of our next annual assessment of our internal control over financial reporting as of December 31, 2017.
Changes in Internal Control over Financial Reporting
Except as described above, during the quarter ended December 31, 2016, there were no other changes to our internal control over financial reporting that have materially affected, or are reasonably likely to materially affect, our internal control over financial reporting.
105
REPORT OF INDEPENDENT REGISTERED PUBLIC ACCOUNTING FIRM
Board of Directors and Shareholders
U.S. Concrete, Inc.
We have audited the internal control over financial reporting of U.S. Concrete, Inc. (a Delaware corporation) and subsidiaries (the Company) as of December 31, 2016, based on criteria established in the 2013 Internal Control-Integrated Framework issued by the Committee of Sponsoring Organizations of the Treadway Commission (COSO). The Company’s management is responsible for maintaining effective internal control over financial reporting and for its assessment of the effectiveness of internal control over financial reporting, included in the accompanying Management’s Report on Internal Control over Financial Reporting (Management’s Report). Our responsibility is to express an opinion on the Company’s internal control over financial reporting based on our audit. Our audit of, and opinion on, the Company’s internal control over financial reporting does not include the internal control over financial reporting of Kings Ready Mix Inc., Jenna Concrete Corp, and NYCON Supply Corp., whose financial statements reflect total assets and revenues constituting 16.5 and 5.8 percent, respectively, of the related consolidated financial statement amounts as of and for the year ended December 31, 2016. As indicated in Management’s Report, Kings Ready Mix Inc., Jenna Concrete Corp, and NYCON Supply Corp. were acquired during 2016. Management’s assertion on the effectiveness of the Company’s internal control over financial reporting excluded internal control over financial reporting of Kings Ready Mix Inc., Jenna Concrete Corp, and NYCON Supply Corp.
We conducted our audit in accordance with the standards of the Public Company Accounting Oversight Board (United States). Those standards require that we plan and perform the audit to obtain reasonable assurance about whether effective internal control over financial reporting was maintained in all material respects. Our audit included obtaining an understanding of internal control over financial reporting, assessing the risk that a material weakness exists, testing and evaluating the design and operating effectiveness of internal control based on the assessed risk, and performing such other procedures as we considered necessary in the circumstances. We believe that our audit provides a reasonable basis for our opinion.
A company’s internal control over financial reporting is a process designed to provide reasonable assurance regarding the reliability of financial reporting and the preparation of financial statements for external purposes in accordance with generally accepted accounting principles. A company’s internal control over financial reporting includes those policies and procedures that (1) pertain to the maintenance of records that, in reasonable detail, accurately and fairly reflect the transactions and dispositions of the assets of the company; (2) provide reasonable assurance that transactions are recorded as necessary to permit preparation of financial
statements in accordance with generally accepted accounting principles, and that receipts and expenditures of the company are being made only in accordance with authorizations of management and directors of the company; and (3) provide reasonable assurance regarding prevention or timely detection of unauthorized acquisition, use, or disposition of the company’s assets that could have a material effect on the financial statements.
Because of its inherent limitations, internal control over financial reporting may not prevent or detect misstatements. Also, projections of any evaluation of effectiveness to future periods are subject to the risk that controls may become inadequate because of changes in conditions, or that the degree of compliance with the policies or procedures may deteriorate.
A material weakness is a deficiency, or combination of control deficiencies, in internal control over financial reporting, such that there is a reasonable possibility that a material misstatement of the company’s annual or interim financial statements will not be prevented or detected on a timely basis. The following material weakness has been identified and included in management’s assessment.
Management concluded that a material weakness in its internal control over financial reporting existed as of December 31, 2016 relating to management review controls associated with the completeness and accuracy of computations relating to income tax accounts and disclosures.
In our opinion, because of the effect of the material weakness described above on the achievement of the objectives of the control criteria, the Company has not maintained effective internal control over financial reporting as of December 31, 2016, based on criteria established in the 2013 Internal Control-Integrated Framework issued by COSO.
106
We also have audited, in accordance with the standards of the Public Company Accounting Oversight Board (United States), the consolidated financial statements of the Company as of and for the year ended December 31, 2016. The material weakness identified above was considered in determining the nature, timing, and extent of audit tests applied in our audit of the 2016 consolidated financial statements, and this report does not affect our report dated February 28, 2017, which expressed an unqualified opinion on those financial statements.
/s/ GRANT THORNTON LLP
Dallas, Texas
February 28, 2017
107
Item 9B. Other Information
Not applicable.
108
PART III
Except as otherwise indicated in Items 10, 11, 12, 13 and 14 below, pursuant to the General Instructions to Form 10-K, we intend to incorporate by reference the information we refer to in those Items from the definitive proxy statement for our 2017 Annual Meeting of Stockholders (our "2017 Proxy Statement"). We intend to file our 2017 Proxy Statement with the Securities and Exchange Commission on or about March 27, 2017 but in any event within 120 days after the year ended December 31, 2016.
Item 10. Directors, Executive Officers and Corporate Governance
For the information this Item requires, please see the information under the headings “Proposal No. 1—Election of Directors,” “Executive Officers,” “Information Concerning the Board of Directors and Committees,” and “Section 16(a) Beneficial Ownership Reporting Compliance” in the 2017 Proxy Statement, which is incorporated in this Item by this reference.
We have a code of ethics applicable to all our employees and directors. In addition, our principal executive, financial, and accounting officers are subject to the provisions of the Code of Ethics of U.S. Concrete, Inc. for chief executive officer and senior financial officers, a copy of which is available on our website at www.us-concrete.com. In the event that we amend or waive any of the provisions of these codes of ethics applicable to our principal executive, financial, and accounting officers, we intend to disclose that action on our website, as required by applicable law.
Item 11. Executive Compensation
For the information this Item requires, please see the information under the headings “Compensation Discussion and Analysis,” “Director Compensation,” “Executive Compensation,” “Compensation Program and Risk Management,” “Compensation Committee Interlocks and Insider Participation,” and “Compensation Committee Report” in the 2017 Proxy Statement, which is incorporated in this Item by this reference.
Item 12. Security Ownership of Certain Beneficial Owners and Management and Related Stockholder Matters
Except as set forth below, for the information this Item requires, please see the information under the heading “Security Ownership of Certain Beneficial Owners and Management and Related Stockholder Matters" in the 2017 Proxy Statement, which is incorporated in this Item by this reference.
Equity Compensation Plan Information
All shares of common stock issuable under our compensation plans are subject to adjustment to reflect any increase or decrease in the number of shares outstanding as a result of stock splits, combination of shares, recapitalizations, mergers, or consolidations.
The following table summarizes, as of December 31, 2016, the indicated information regarding equity compensation to our employees, officers, directors, and other persons under our equity compensation plans (in thousands). These plans use or are based on shares of our common stock. We do not have any equity compensation plans not approved by security holders.
Plan Category | Number of Securities to Be Issued Upon Exercise of Outstanding Stock Options | Weighted Average Exercise Price of Outstanding Stock Options | Number of Securities Remaining Available for Future Issuance Under Equity Compensation Plans (Excluding Securities Reflected in First Column) | |||||||
Equity compensation plans approved by security holders(1) | 25 | $ | 17.23 | 748 | ||||||
(1) | We adopted a management equity incentive plan (the "2010 Plan"), effective as of August 31, 2010, under which 9.5% of the equity of the Company authorized pursuant to our Plan of Reorganization, on a fully-diluted basis, is reserved for issuance as equity-based awards to management and employees, and 0.5% of such equity, on a fully-diluted basis, is reserved for issuance to directors of the Company. On January 23, 2013, we adopted, and on May 15, 2013, the Company’s stockholders approved the U.S. Concrete, Inc. Long Term Incentive Plan (the “2013 Plan”), which allows, among other things, for approximately 0.5 million shares of common stock to be reserved for grant as equity-based awards to our management, employees, and directors. The 2013 Plan enables us to grant stock options, stock appreciation rights, restricted stock awards, restricted stock units, cash-settled equity awards, and performance awards. We reserved 2.7 million shares |
109
of common stock for issuance in connection with the 2010 and 2013 Plans, and, as of December 31, 2016, there were 0.7 million shares remaining for future issuance.
Item 13. Certain Relationships and Related Transactions, and Director Independence
For the information this Item requires, please see the information under the headings “Certain Relationships and Related Transactions” and "Director Independence" in the 2017 Proxy Statement, which is incorporated in this Item by this reference.
Item 14. Principal Accountant Fees and Services
For the information this Item requires, please see the information appearing under the heading “Fees Incurred for Services by the Principal Accountant” in the 2017 Proxy Statement, which is incorporated in this Item by this reference.
PART IV
Item 15. Exhibits and Financial Statement Schedules
(a)(1) Financial Statements.
For the information this item requires, please see Index to Consolidated Financial Statements on page 54 of this report.
(2) Financial Statement Schedules.
All financial statement schedules are omitted because they are not required or the required information is shown in our consolidated financial statements or the notes thereto.
(3) Exhibits.
The information on exhibits required by this Item 15 is set forth in the Index to Exhibits appearing on pages 112-114 of this Report and is incorporated by reference herein.
110
SIGNATURES
Pursuant to the requirements of Section 13 or 15(d) of the Securities Exchange Act of 1934, the registrant has duly caused this report to be signed on its behalf by the undersigned, thereunto duly authorized.
U.S. CONCRETE, INC. | |||
Date: | February 28, 2017 | By: | /s/ William J. Sandbrook |
William J. Sandbrook | |||
President and Chief Executive Officer | |||
Pursuant to the requirements of the Securities Exchange Act of 1934, this report has been signed below by the following persons on behalf of the Registrant and in the capacities indicated on February 28, 2017.
Signature | Title | |
/s/ William J. Sandbrook | President and Chief Executive Officer and Director (Principal Executive Officer) | |
William J. Sandbrook | ||
/s/ Joseph C. Tusa, Jr. | Senior Vice President and Chief Financial Officer (Principal Accounting and Financial Officer) | |
Joseph C. Tusa, Jr. | ||
/s/ Kurt M. Cellar | Director | |
Kurt M. Cellar | ||
/s/ Eugene I. Davis | Director | |
Eugene I. Davis | ||
/s/ Michael D. Lundin | Director | |
Michael D. Lundin | ||
/s/ Robert M. Rayner | Director | |
Robert M. Rayner | ||
/s/ Theodore P. Rossi | Director | |
Theodore P. Rossi | ||
/s/ Colin M. Sutherland | Director | |
Colin M. Sutherland | ||
111
INDEX TO EXHIBITS
Exhibit Number | Description | |
2.1* | —Share Purchase Agreement, dated as of April 1, 2015, by and among USCF&B AcquisitionCo LLC, Ferrara Bros. Building Materials Corp., Ferrara Family Holdings, Inc. and Joseph J. Ferrara, in his capacity as Seller's Representative. (incorporated by reference to Exhibit 2.1 to the Company's Current Report on Form 8-K filed on April 2, 2015 (File No. 001-34530)). | |
3.1* | —Amended and Restated Certificate of Incorporation of U.S. Concrete, Inc. (incorporated by reference to Exhibit 1 to the Company’s Registration Statement on Form 8-A filed on August 31, 2010 (File No. 000-26025)). | |
3.2* | —Third Amended and Restated By-Laws of U.S. Concrete, Inc. (incorporated by reference to Exhibit 2 to the Company’s Registration Statement on Form 8-A filed on August 31, 2010 (File No. 000-26025)). | |
3.3* | —Amendment No. 1 to Third Amended and Restated Bylaws of U.S. Concrete, Inc (incorporated by reference to Exhibit 3.1 to the Company’s Current Report on Form 8-K filed on November 18, 2015 (File No. 001-34530)). | |
4.1* | —Form of common stock certificate (incorporated by reference to Exhibit 3 to the Company’s Registration Statement on Form 8-A filed August 31, 2010 (File No. 000-26025)). | |
4.2* | —Class A Warrant Agreement, dated as of August 31, 2010, by and among U.S. Concrete, Inc., subsidiaries named therein, and U.S. Bank National Association, as noteholder collateral agent (incorporated by reference to Exhibit 4 to the Company’s Registration Statement on Form 8-A filed on August 31, 2010 (File No. 000-26025)). | |
4.3* | —Class B Warrant Agreement, dated as of August 31, 2010, by and among U.S. Concrete, Inc., subsidiaries named therein, and U.S. Bank National Association, as noteholder collateral agent (incorporated by reference to Exhibit 5 to the Company’s Registration Statement on Form 8-A filed on August 31, 2010 (File No. 000-26025)). | |
4.4* | —Indenture, dated as of June 7, 2016, by and among U.S. Concrete, Inc., the subsidiary guarantors party thereto, and U.S. Bank National Association, as trustee and noteholder collateral agent (incorporated by reference to Exhibit 4.1 to the Company’s Current Report on Form 8-K dated June 7, 2016 (File No. 001-34530)). | |
4.5* | —Supplemental Indenture No. 1, dated as of October 12, 2016, by and among U.S. Concrete, Inc., the subsidiary guarantors party thereto, and U.S. Bank National Association, as trustee (incorporated by reference to Exhibit 4.2 to the Company’s Current Report on Form 8-K dated January 9, 2017 (File No. 001-34530)). | |
4.6 | —Supplemental Indenture No. 2, dated as of January 9, 2017, by and among U.S. Concrete, Inc., the subsidiary guarantors party thereto, and U.S. Bank National Association, as trustee. | |
4.7* | —Registration Rights Agreement, dated as of January 9, 2017, by and among U.S. Concrete, Inc., the subsidiary guarantors party thereto, and J.P. Morgan Securities LLC (incorporated by reference to Exhibit 4.4 to the Company’s Current Report on Form 8-K dated January 9, 2017 (File No. 001-34530)). | |
10.1*† | —U.S. Concrete, Inc. Non-Qualified Stock Option Award Agreement (incorporated by reference to Exhibit 10.5 to the Company’s Current Report on Form 8-K filed on September 2, 2010 (File No. 000-26025)). | |
10.2*† | —U.S. Concrete, Inc. Restricted Stock Unit Award Agreement (incorporated by reference to Exhibit 10.6 to the Company’s Current Report on Form 8-K filed on September 2, 2010 (File No. 000-26025)). | |
10.3*† | —Form of Indemnification Agreement (incorporated by reference to Exhibit 10.7 to the Company’s Current Report on Form 8-K filed on September 2, 2010 (File No. 000-26025)). | |
10.4*† | —Executive Severance Agreement, effective as of August 22, 2011 between U.S. Concrete, Inc. and William J. Sandbrook (incorporated by reference to Exhibit 10.1 to the Company’s Current Report on Form 8-K filed on August 22, 2011 (File No. 001-34530)). | |
10.5*† | —Indemnification Agreement, effective as of August 22, 2011 between U.S. Concrete, Inc. and William J. Sandbrook (incorporated by reference to Exhibit 10.2 to the Company’s Current Report on Form 8-K filed on August 22, 2011 (File No. 001-34530)). | |
10.6*† | —Executive Severance Agreement dated January 23, 2013 by and between U.S. Concrete, Inc. and Niel L. Poulsen (incorporated by reference to Exhibit 10.37 to the Company’s Annual Report on Form 10-K dated March 8, 2013 (File No. 001-34530)). | |
10.7*† | —Form of Restricted Stock Award Agreement (incorporated by reference to Exhibit 10.1 to the Company's Current Report on Form 8-K filed on March 6, 2013 (File No. 0001-34530)). | |
10.8*† | —U.S. Concrete, Inc. Deferred Compensation Plan (incorporated by reference to Exhibit 10.1 to the Company’s Current Report on Form 8-K dated April 17, 2013 (File No. 001-34530)). | |
10.9*† | —U.S. Concrete, Inc. Deferred Compensation Plan Adoption Agreement (incorporated by reference to Exhibit 10.2 to the Company’s Current Report on Form 8-K dated April 17, 2013 (File No. 001-34530)). | |
10.10*† | —U.S. Concrete, Inc. Long Term Incentive Plan (incorporated by reference to Exhibit 10.1 to the Company’s Current Report on Form 8-K dated May 15, 2013 (File No. 001-34530)). | |
112
10.11*† | —Form of Restricted Stock Agreement (Employee Form) (incorporated by reference to Exhibit 10.1 to the Company’s Current Report on Form 8-K dated July 1, 2013 (File No. 001-34530)). | |
10.12*† | —U.S. Concrete, Inc. Management Equity Incentive Plan effective January 1, 2013 (incorporated by reference to Exhibit 10.23 to the Company’s Annual Report on Form 10-K dated March 7, 2014 (File No. 001-34530)). | |
10.13*† | —Executive Severance Agreement dated August 1, 2013 by and between U.S. Concrete, Inc. and Paul M. Jolas (incorporated by reference to Exhibit 10.24 to the Company’s Annual Report on Form 10-K dated March 7, 2014 (File No. 001-34530)). | |
10.14* | —Subscription Agreement, dated as of April 1, 2015, by and among U.S. Concrete Inc., Ferrara Family Holdings, Inc. and the beneficial owners of Ferrara Family Holdings, Inc. named therein. (incorporated by reference to Exhibit 10.1 to the Company's Current Report on Form 8-K filed on April 2, 2015 (File No. 001-34530). | |
10.15* | —Amended and Restated Limited Liability Company Agreement of Ferrara Bros., LLC, effective as of April 9, 2015 (incorporated by reference to Exhibit 10.1 to the Company’s Quarterly Report on Form 10-Q dated August 6, 2015 (File No. 001-34530)). | |
10.16*+ | —Ferrara Bros., LLC Class B Incentive Interests Award Agreement, effective as of April 11, 2015, between Ferrara Bros., LLC and 2G FB LLC (incorporated by reference to Exhibit 10.2 to the Company’s Quarterly Report on Form 10-Q dated August 6, 2015 (File No. 001-34530)). | |
10.17*† | —Offer Letter to Ronnie Pruitt, dated October 6, 2015 (incorporated by reference to Exhibit 10.1 to the Company’s Current Report on Form 8-K dated October 23, 2015 (File No. 001-34530)). | |
10.18* | —Executive Severance Agreement, by and between U.S. Concrete, Inc. and Ronnie Pruitt, dated October 26, 2015 (incorporated by reference to Exhibit 10.2 to the Company’s Current Report on Form 8-K dated October 23, 2015 (File No. 001-34530)). | |
10.19*† | —Indemnification Agreement, by and between U.S. Concrete, Inc. and Ronnie Pruitt, dated October 26, 2015 (incorporated by reference to Exhibit 10.3 to the Company’s Current Report on Form 8-K dated October 23, 2015 (File No. 001-34530)). | |
10.20* | —Second Amended and Restated Loan and Security Agreement, dated as of November 18, 2015, by and among U.S. Concrete, Inc., certain of its subsidiaries parties thereto, certain lender parties thereto, and Bank of America, N.A., as agent for the lenders (incorporated by reference to Exhibit 10.1 to the Company’s Current Report on Form 8-K dated November 18, 2015 (File No. 001-34530)). | |
10.21*† | —Offer Letter to Joseph Tusa, dated January 8, 2016 (incorporated by reference to Exhibit 10.1 to the Company’s Current Report on Form 8-K dated January 14, 2016 (File No. 001-34530)). | |
10.22*† | —Executive Severance Agreement, by and between U.S. Concrete, Inc. and Joseph C. Tusa, Jr., dated February 1, 2016 (incorporated by reference to Exhibit 10.1 to the Company’s Current Report on Form 8-K dated February 1, 2016 (File No. 001-34530)). | |
10.23*† | —Indemnification Agreement, dated February 1, 2016, by and between U.S. Concrete, Inc. and Joseph C. Tusa, Jr. (incorporated by reference to Exhibit 10.2 to the Company’s Current Report on Form 8-K dated February 1, 2016 (File No. 001-34530)). | |
10.24*† | —U.S. Concrete, Inc. and Subsidiaries 2016 Annual Incentive Plan (incorporated by reference to Exhibit 10.28 to the Company's Annual Report on From 10-K dated March 4, 2016 (File No. 001-34530)). | |
12.1 | —Ratio of Earnings to Fixed Charges. | |
21.1 | —Subsidiaries. | |
23.1 | —Consent of Grant Thornton LLP, independent registered public accounting firm. | |
31.1 | —Rule 13a-14(a)/15d-14(a) Certification of William J. Sandbrook. | |
31.2 | —Rule 13a-14(a)/15d-14(a) Certification of Joseph C. Tusa, Jr. | |
32.1 | —Section 1350 Certification of William J. Sandbrook. | |
32.2 | —Section 1350 Certification of Joseph C. Tusa, Jr. | |
95.1 | —Mine Safety Disclosure. | |
101.INS | —Instance Document | |
101.SCH | —XBRL Taxonomy Extension Schema Document | |
101.CAL | —XBRL Taxonomy Extension Calculation Linkbase Document | |
101.DEF | —XBRL Taxonomy Extension Definition Linkbase Document | |
101.LAB | —XBRL Taxonomy Extension Label Linkbase Document | |
101.PRE | —XBRL Taxonomy Extension Presentation Linkbase Document | |
113
* Incorporated by reference to the filing indicated.
† Management contract or compensatory plan or arrangement.
+ Portions of this exhibit have been omitted pursuant to a request for confidential treatment with the SEC.
114