Attached files
| file | filename |
|---|---|
| 8-K - 8-K - GMS Inc. | a18-18417_18k.htm |
Safe Harbor and Basis of Presentation Forward-Looking Statement Safe Harbor - This presentation includes "forward-looking statements" within the meaning of the Private Securities Litigation Reform Act of 1995. All of these forward-looking statements are based on estimates and assumptions made by our management that, although believed by us to be reasonable, are inherently uncertain. Examples of forward-looking statements include those related to net sales, gross profit, gross margins, capital expenditures and market share growth, as well as non-GAAP financial measures such as Adjusted EBITDA, the ratio of debt-to-Adjusted EBITDA, adjusted net income and base business sales, including any management expectations or outlook for fiscal 2019 and beyond. In addition, statements regarding potential acquisitions and future greenfield locations and statements regarding the impact of the recent tax legislation, fiscal 2018 and 2019 effective tax rates and the expected use of tax savings are forward-looking statements, as well as statements regarding the markets in which the Company or Titan operates, product expansion opportunities and the potential for growth in the commercial, residential and repair and remodeling, or R&R, markets. In addition, statements relating to the Titan acquisition, including the combination of best practices, statements regarding expected synergies, cost savings, margin improvement, expected accretion and its expected contribution to the Company’s Adjusted EBITDA for the eleven months ending April 30, 2019, are forward-looking statements. Forward-looking statements involve risks and uncertainties, including, but not limited to, economic, competitive, governmental and technological factors outside of our control, that may cause our business, strategy or actual results to differ materially from the forward-looking statements. These risks and uncertainties may include, among other things: changes in the prices, margin, supply, and/or demand for products which we distribute; general economic and business conditions in the United States and Canada; the activities of competitors; changes in significant operating expenses; changes in the availability of capital and interest rates; adverse weather patterns or conditions; acts of cyber intrusion; variations in the performance of the financial markets, including the credit markets; the possibility that the expected synergies and cost savings and financial impacts from the Titan acquisition will not be realized, or will not be realized within the expected time period; the risk that the GMS and Titan businesses will not be integrated successfully; disruption from the transaction making it more difficult to maintain business and operational relationships and to accomplish other GMS objectives; the risk of customer attrition; and other factors described in the "Risk Factors" section in our Annual Report on Form 10-K for the fiscal year ended April 30, 2018, and in our other periodic reports filed with the SEC. In addition, the statements in this presentation are made as of August 8, 2018. We undertake no obligation to update any of the forward looking statements made herein, whether as a result of new information, future events, changes in expectation or otherwise. These forward-looking statements should not be relied upon as representing our views as of any date subsequent to August 8, 2018. Use of Non-GAAP and Adjusted Financial Information - To supplement GAAP financial information, we use adjusted measures of operating results which are non-GAAP measures. This non-GAAP adjusted financial information is provided as additional information for investors. These adjusted results exclude certain costs, expenses, gains and losses, and we believe their exclusion can enhance an overall understanding of our past financial performance and also our prospects for the future. These adjustments to our GAAP results are made with the intent of providing both management and investors a more complete understanding of our operating performance by excluding non-recurring, infrequent or other non-cash charges that are not believed to be material to the ongoing performance of our business. The presentation of this additional information is not meant to be considered in isolation or as a substitute for GAAP measures of net income, diluted earnings per share or net cash provided by (used in) operating activities prepared in accordance with generally accepted accounting principles in the United States. Financial information related to Titan’s performance in periods prior to the acquisition included in this release were provided by Titan and are unaudited. 2
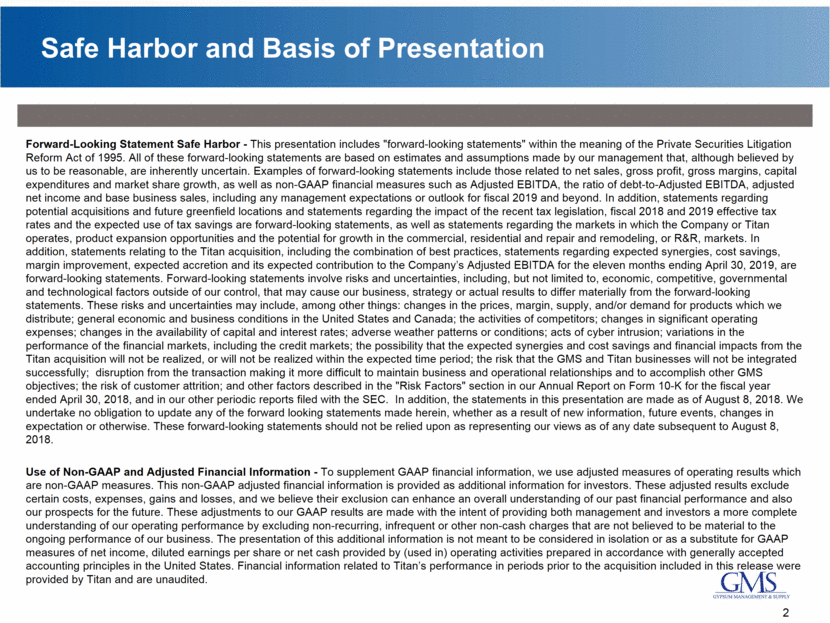
GMS at a Glance GMS Overview PF Net Sales Breakdown (FY18) (2) Wallboard ~43% Ceilings ~13% Steel Framing ~15% Other ~29% ($ in millions, April FYE) #1 North American specialty distributor of interior construction products (1) Founded in 1971 Completed IPO on May 26, 2016 More than 245 branches across 42 states and 5 Canadian provinces Balanced mix of commercial new construction, commercial R&R, residential new construction and residential R&R Critical link between suppliers and highly fragmented customer base National scale drives purchasing advantages over peers while local expertise enhances service capabilities One-stop-shop for the interior contractor with broad product offering of 20,000+ SKUs Recent Highlights FY18 sales increased 8.3% to record $2.5 billion FY18 Adjusted EBITDA increased 5.9% to record $199 million Closed 5 acquisitions and opened 3 greenfields in FY18 Acquired WSB Titan, the largest GSD in Canada, on June 1, 2018 Based on sales of wallboard and ceilings. For illustrative purpose only. Actual results may vary. Not prepared in accordance with Regulation S-X pro forma requirements. See “Forward-Looking Statement Safe Harbor” on page 2 of this presentation. FY2017 and FY2018 Adj. EBITDA includes approximately $10.0 million and $1.3 million, respectively, from entities acquired in FY2017 and FY2018 respectively, for the period prior to their respective dates of acquisition. FY18 PF Adj. EBITDA includes approximately $23 million related to the conversion of existing GMS equipment operating leases to capital leases, $20 million related to the cost reductions announced June 28th, $68 million of Titan Adj. EBITDA for LTM 4/30/18 unaudited earnings and $10 million of purchasing synergies related to the acquisition of Titan. For a reconciliation of PF Adj. EBITDA to Net Income (loss), the most directly comparable GAAP measure, see Appendix. PF Adjusted EBITDA (2) (3) 3 PF Net Sales (2) ($ in millions, April FYE) Margin % 8.1% 7.9% 10.7% Incremental Margin % 10.9% 5.7% 16.5% Titan Residential ~45% Commercial ~55% $2,319 $2,511 $2,511 $478 $2,989 FY-17 FY-18 FY-18 PF $188 $199 $201 $10 $1 $23 $20 $68 $10 $198 $201 $322 FY-17 FY-18 FY-18 PF
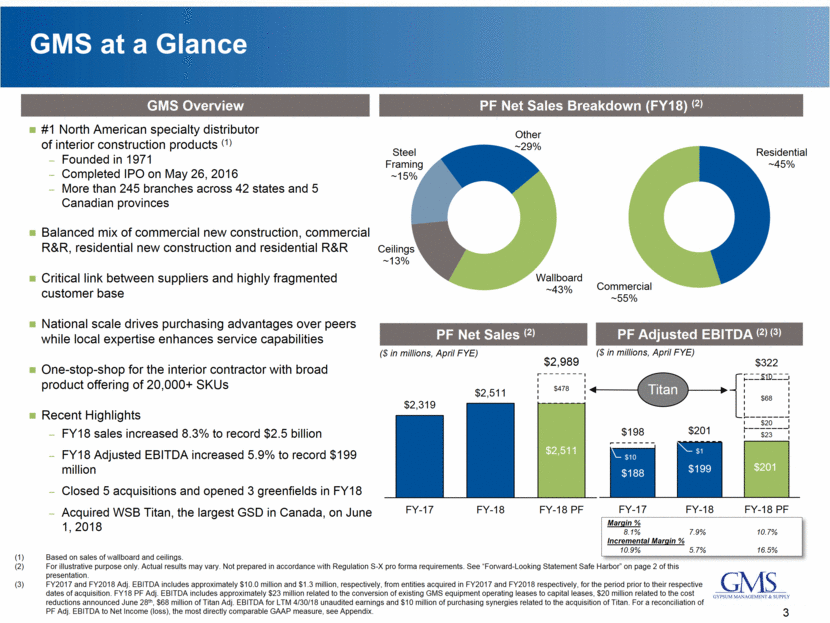
Leading Specialty Distributor Poised for Continued Growth 4 GMS has a demonstrated history of successful expansion through greenfields and acquisitions GMS has limited or no presence in just under 40% of the top 100 MSAs in the U.S. Growth opportunities in new Canadian geographies (Prairies, Quebec, Eastern Canada) and underpenetrated existing geographies (British Columbia, Alberta, Ontario) GMS has a significant opportunity to expand its geographic footprint in under-served and under-penetrated markets through greenfields and acquisitions Current GMS Branch MSA with limited or no GMS Presence(1) GMS Headquarters GMS currently has limited or no branches in the areas identified as an MSA with limited or no GMS presence. There can be no assurance that GMS will be able to expand into any of these areas. Additionally, in the event GMS takes measures to expand into these areas, there can be no assurance that GMS will be successful, and any such expansion will be subject to several risks including those discussed under the heading “Risk Factors” in the Registration Statement that the Company has filed with the SEC for the offering to which this presentation relates. GMS Expansion Opportunities
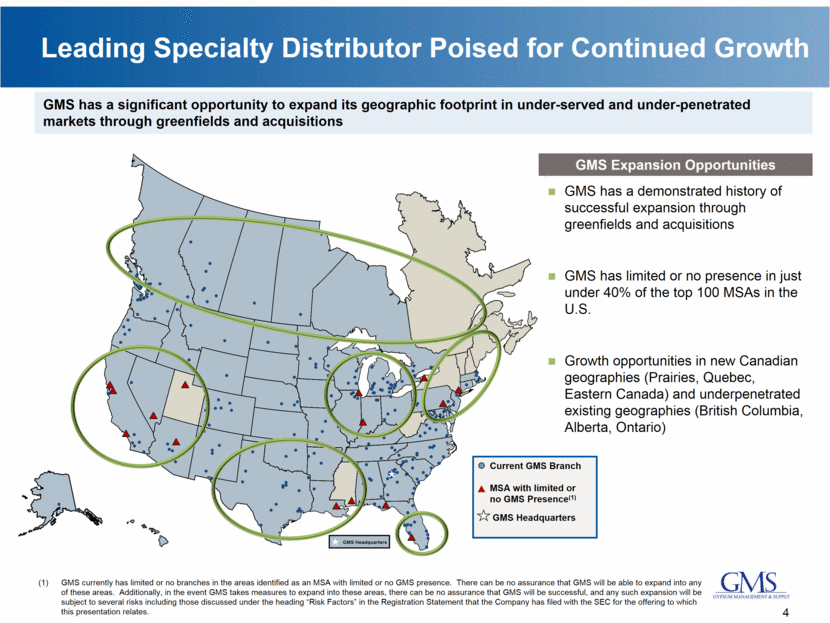
Titan Acquisition Creates Well-Balanced Platform Built for Growth in the United States and Canada Sales by Product (LTM) End Market Mix (LTM) Combined (2) Revenue (LTM) $2.5 billion $0.5 billion $3.0 billion Distribution Branches 216 30 246 Number of Employees 4,600 1,200 5,800 Based on financial information provided by Titan, calculated using 12/31/17 audited financial statements rolled forward for January through April 2018’s unaudited results. For illustrative purpose only. Actual results may vary. Not prepared in accordance with Regulation S-X pro forma requirements. See “Forward-Looking Statement Safe Harbor” on page 2 of this presentation. (US$ in millions) 5 (1) (LTM as of April 30, 2018) Wallboard ~44% Steel ~ 16% Ceilings ~ 15% Insulation ~ 4% Other ~20% Wallboard , 43% Steel , 15% Ceilings , 13% Insulation , 7% Other , 23% Residential ~40% Commercial ~60% Residential ~45% Commercial ~55% Residential 61% Commercial / Industrial 27% Two - Step Distribution 12% Wallboard 32% Steel 6% Ceilings , 3% Insulation 19% Other 40%
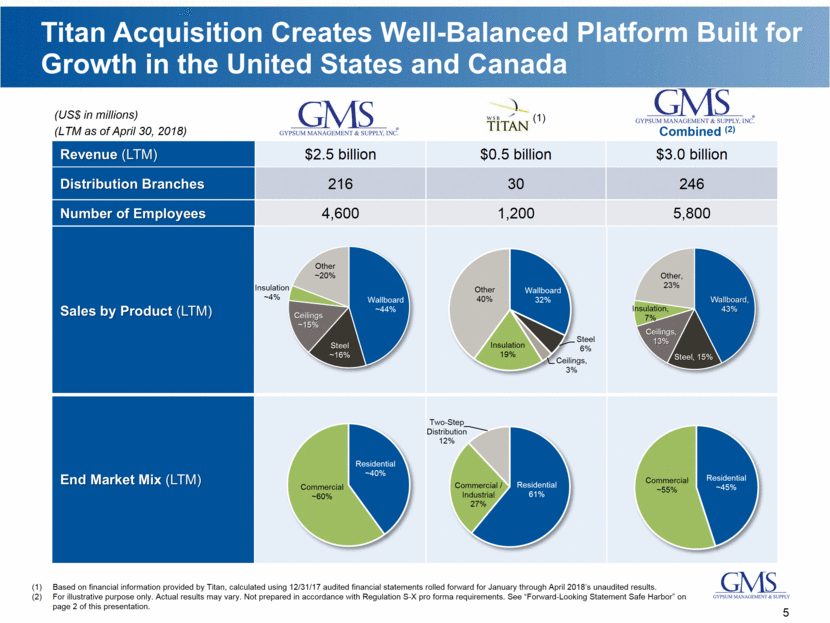
Fiscal 2018 Pro Forma Summary 6 ($ in millions, April FYE) Pro Forma Adjusted EBITDA (1) (2) (3) (4) Pro Forma Net Sales (1) ($ in millions, April FYE) Margin % 6.4% 6.7% 7.4% 8.1% 7.9% 10.7% Incremental Margin % 15.5% 8.7% 11.2% 10.9% 5.7% 16.5% For illustrative purpose only. Actual results may vary. Not prepared in accordance with Regulation S-X pro forma requirements. See “Forward-Looking Statement Safe Harbor” on page 2 of this presentation. Based on financial information provided by Titan, calculated using 12/31/17 audited financial statements rolled forward for January through April 2018’s unaudited results, plus $10 million in annual purchasing synergies. FY2015, FY2016, FY2017 and FY2018 PF Adj. EBITDA includes approximately $8.1 million, $12.1 million, $9.5 million and $1.3 million, respectively, from entities acquired in FY2015, FY2016, FY2017 and FY2018 respectively, for the period prior to their respective dates of acquisitionFY18 PF Adj. EBITDA includes approximately $23 million related to the conversion of existing GMS equipment operating leases to capital leases, $20 million related to the cost reductions announced June 28th, $68 million of Titan Adj. EBITDA for LTM 4/30/18 unaudited earnings and $10 million of purchasing synergies related to the acquisition of Titan. For a reconciliation of PF Adj. EBITDA to Net Income (loss), the most directly comparable GAAP measure, see Appendix. FY18 PF incremental margin % excludes $23 million related to the conversion of existing GMS equipment operating leases to capital leases. +61% since May 2016 IPO $106 $138 $188 $199 $201 $8 $12 $10 $1 $121 $87 $114 $150 $198 $201 $322 FY-14 FY-15 FY-16 FY-17 FY-18 FY-18 PF $1,353 $1,570 $1,858 $2,319 $2,511 $2,511 $478 $2,989 FY-14 FY-15 FY-16 FY-17 FY-18 FY-18 PF $ in millions FY18 GMS Actual Lease Impact Cost Reduction FY18 GMS PF Titan + Synergies (2) FY18 GMS Combined PF (1) Net Sales $2,511.5 $2,511.5 $478.4 $2,989.9 Adjusted EBITDA (1) $200.5 $23.0 $20.0 $243.5 $78.4 $321.9 Adjusted EBITDA Margin (1) 7.9% 9.6% 10.7% Improvement vs. Actual +170bps +280bps
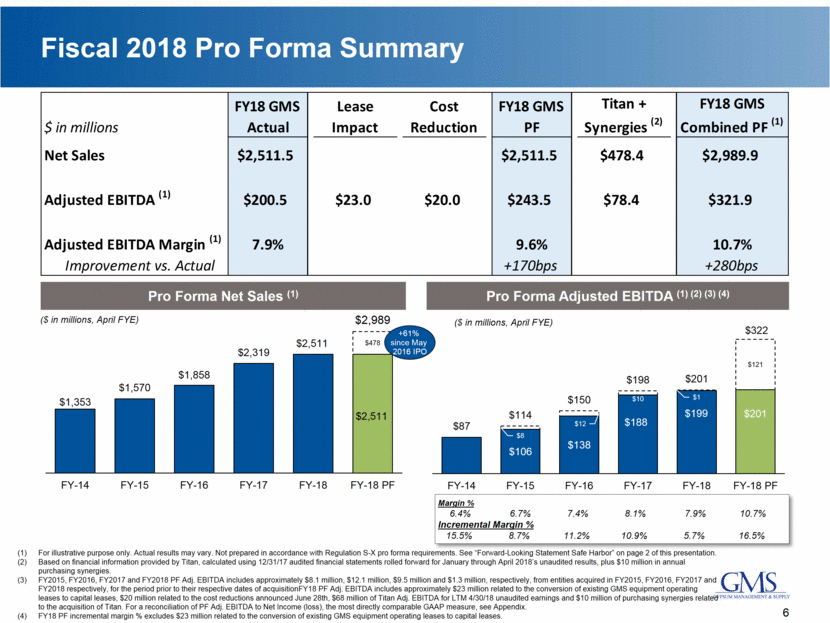
Capital Structure Pre and Post Titan Transaction Pre Titan transaction capital structure as of 4/30/18: Leverage of 2.8x Net Debt / LTM Pro Forma Adj. EBITDA Post Titan transaction capital structure as of 4/30/18: Pro Forma leverage of 4.1x Net Debt / LTM Pro Forma Adj. EBITDA Compares favorably to 6.0x Net Debt / LTM Pro Forma Adj. EBITDA as of 4/30/14 and 4.3x pre-IPO Moody’s and Standard & Poor’s maintained current rating of B1/BB- FY18 PF capital structure reflects the conversion of existing GMS equipment operating leases to capital leases effective May 1, 2018 and the expected increase to PP&E and debt accounts by ~$75 million. Commentary Leverage Summary Net Debt / PF Adjusted EBITDA FY18 PF capital structure reflects the conversion of existing GMS equipment operating leases to capital leases effective May 1, 2018 and the expected increase to PP&E and debt accounts by ~$75 million. FY18 PF Adjusted EBITDA reflects the favorable impact to Adjusted EBITDA of ~$23 million related to the conversion of existing equipment operating leases to capital leases and $78 million of PF Adjusted EBITDA, including synergies, from the Titan acquisition. For illustrative purposes only. Actual results may vary. Not prepared in accordance with Regulation S-X pro forma requirements. See “Forward-Looking Statement Safe Harbor” on page 2 of this presentation. 7 (3) (3) 4.3x 2.9x 2.8x 4.1x FY16 FY17 FY18 FY18 PF (US$ in millions) FY16 FY17 FY18 FY18 PF Cash and cash equivalents $19 $15 $36 $12 Asset-Based Revolver 102 103 - 143 Term Debt 542 478 573 998 Assumed Liability for Prior Ownership - - - 15 Capital Lease and Other (1) 14 14 23 99 Total Debt $658 $595 $596 $1,255 PF Adj. EBITDA (2) $150 $198 $201 $302 Total Debt / PF Adj. EBITDA 4.4x 3.0x 3.0x 4.2x Net Debt / PF Adj. EBITDA 4.3x 2.9x 2.8x 4.1x
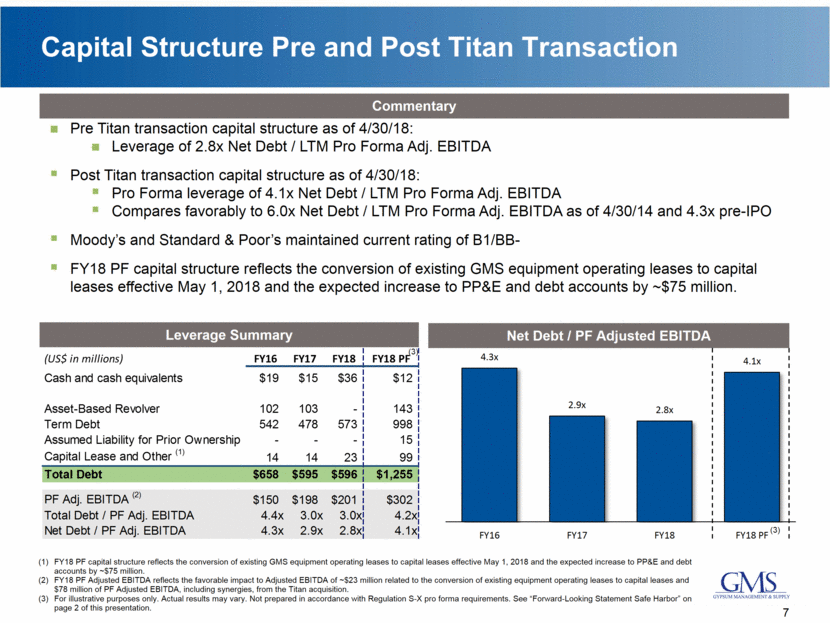
Leading Specialty Distributor Poised for Continued Growth 8 Market Leader with Significant Scale Advantages – #1 North American Distributor of Wallboard and Ceilings Differentiated Service Model Drives Market Leadership Multiple Levers to Drive Market Leading Growth – Market Share, Greenfields, M&A, Operating Leverage Capitalizing on growth in Large, Diverse End Markets Entrepreneurial Culture with Dedicated Employees and Experienced Leadership Driving Superior Execution National Footprint Combined With Local Expertise Market Leader with Scale Advantages
Appendix
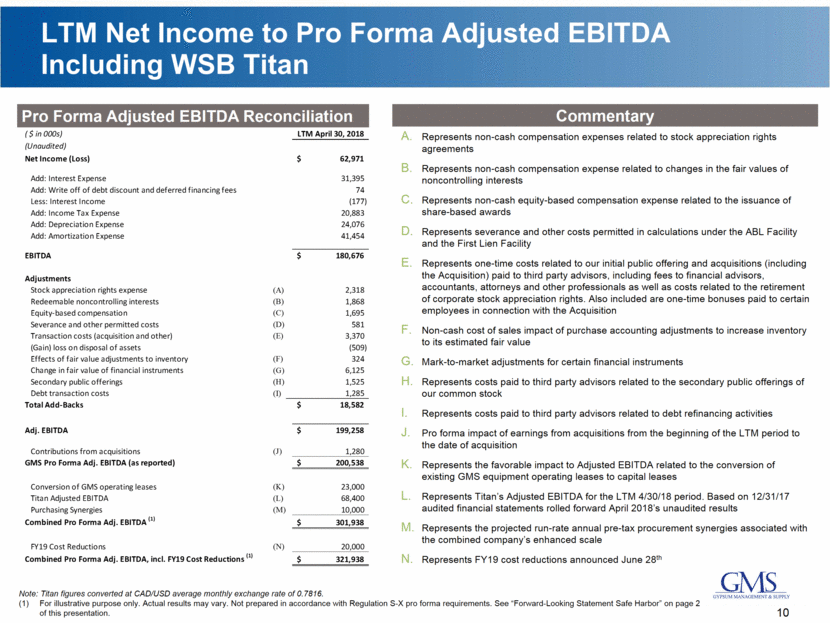
LTM Net Income to Pro Forma Adjusted EBITDA Including WSB Titan Pro Forma Adjusted EBITDA Reconciliation Commentary 10 Note: Titan figures converted at CAD/USD average monthly exchange rate of 0.7816. For illustrative purpose only. Actual results may vary. Not prepared in accordance with Regulation S-X pro forma requirements. See “Forward-Looking Statement Safe Harbor” on page 2 of this presentation. Represents non-cash compensation expenses related to stock appreciation rights agreements Represents non-cash compensation expense related to changes in the fair values of noncontrolling interests Represents non-cash equity-based compensation expense related to the issuance of share-based awards Represents severance and other costs permitted in calculations under the ABL Facility and the First Lien Facility Represents one-time costs related to our initial public offering and acquisitions (including the Acquisition) paid to third party advisors, including fees to financial advisors, accountants, attorneys and other professionals as well as costs related to the retirement of corporate stock appreciation rights. Also included are one-time bonuses paid to certain employees in connection with the Acquisition Non-cash cost of sales impact of purchase accounting adjustments to increase inventory to its estimated fair value Mark-to-market adjustments for certain financial instruments Represents costs paid to third party advisors related to the secondary public offerings of our common stock Represents costs paid to third party advisors related to debt refinancing activities Pro forma impact of earnings from acquisitions from the beginning of the LTM period to the date of acquisition Represents the favorable impact to Adjusted EBITDA related to the conversion of existing GMS equipment operating leases to capital leases Represents Titan’s Adjusted EBITDA for the LTM 4/30/18 period. Based on 12/31/17 audited financial statements rolled forward April 2018’s unaudited results Represents the projected run-rate annual pre-tax procurement synergies associated with the combined company’s enhanced scale Represents FY19 cost reductions announced June 28th ( $ in 000s) LTM April 30, 2018 (Unaudited) Net Income (Loss) 62,971 $ Add: Interest Expense 31,395 Add: Write off of debt discount and deferred financing fees 74 Less: Interest Income (177) Add: Income Tax Expense 20,883 Add: Depreciation Expense 24,076 Add: Amortization Expense 41,454 EBITDA 180,676 $ Adjustments Stock appreciation rights expense (A) 2,318 Redeemable noncontrolling interests (B) 1,868 Equity-based compensation (C) 1,695 Severance and other permitted costs (D) 581 Transaction costs (acquisition and other) (E) 3,370 (Gain) loss on disposal of assets (509) Effects of fair value adjustments to inventory (F) 324 Change in fair value of financial instruments (G) 6,125 Secondary public offerings (H) 1,525 Debt transaction costs (I) 1,285 Total Add-Backs 18,582 $ Adj. EBITDA 199,258 $ Contributions from acquisitions (J) 1,280 GMS Pro Forma Adj. EBITDA (as reported) 200,538 $ Conversion of GMS operating leases (K) 23,000 Titan Adjusted EBITDA (L) 68,400 Purchasing Synergies (M) 10,000 Combined Pro Forma Adj. EBITDA (1) 301,938 $ FY19 Cost Reductions (N) 20,000 Combined Pro Forma Adj. EBITDA, incl. FY19 Cost Reductions (1) 321,938 $
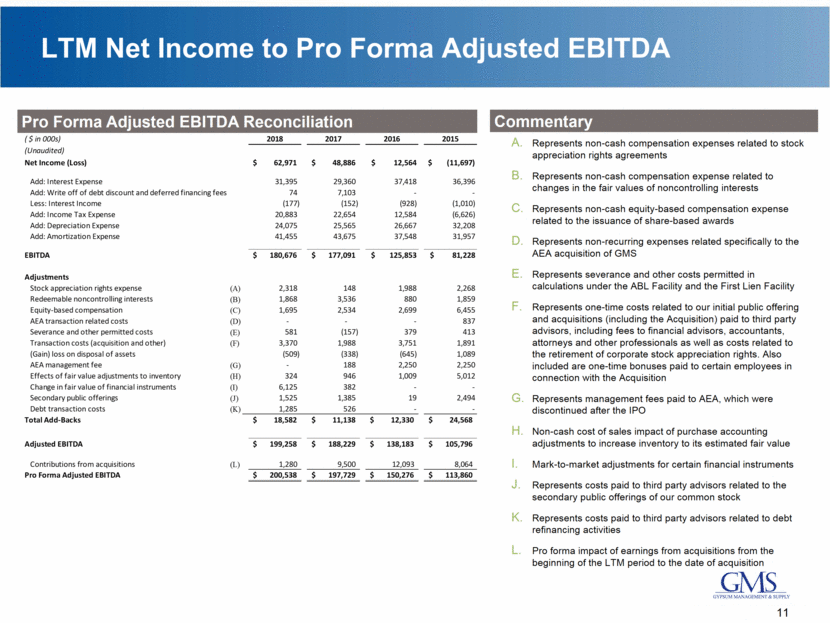
LTM Net Income to Pro Forma Adjusted EBITDA Pro Forma Adjusted EBITDA Reconciliation Commentary 11 Represents non-cash compensation expenses related to stock appreciation rights agreements Represents non-cash compensation expense related to changes in the fair values of noncontrolling interests Represents non-cash equity-based compensation expense related to the issuance of share-based awards Represents non-recurring expenses related specifically to the AEA acquisition of GMS Represents severance and other costs permitted in calculations under the ABL Facility and the First Lien Facility Represents one-time costs related to our initial public offering and acquisitions (including the Acquisition) paid to third party advisors, including fees to financial advisors, accountants, attorneys and other professionals as well as costs related to the retirement of corporate stock appreciation rights. Also included are one-time bonuses paid to certain employees in connection with the Acquisition Represents management fees paid to AEA, which were discontinued after the IPO Non-cash cost of sales impact of purchase accounting adjustments to increase inventory to its estimated fair value Mark-to-market adjustments for certain financial instruments Represents costs paid to third party advisors related to the secondary public offerings of our common stock Represents costs paid to third party advisors related to debt refinancing activities Pro forma impact of earnings from acquisitions from the beginning of the LTM period to the date of acquisition ( $ in 000s) 2018 2017 2016 2015 (Unaudited) Net Income (Loss) 62,971 $ 48,886 $ $ 12,564 $ (11,697) Add: Interest Expense 31,395 29,360 37,418 36,396 Add: Write off of debt discount and deferred financing fees 74 7,103 - - Less: Interest Income (177) (152) (928) (1,010) Add: Income Tax Expense 20,883 22,654 12,584 (6,626) Add: Depreciation Expense 24,075 25,565 26,667 32,208 Add: Amortization Expense 41,455 43,675 37,548 31,957 EBITDA 180,676 $ 177,091 $ $ 125,853 $ 81,228 Adjustments Stock appreciation rights expense (A) 2,318 148 1,988 2,268 Redeemable noncontrolling interests (B) 1,868 3,536 880 1,859 Equity-based compensation (C) 1,695 2,534 2,699 6,455 AEA transaction related costs (D) - - - 837 Severance and other permitted costs (E) 581 (157) 379 413 Transaction costs (acquisition and other) (F) 3,370 1,988 3,751 1,891 (Gain) loss on disposal of assets (509) (338) (645) 1,089 AEA management fee (G) - 188 2,250 2,250 Effects of fair value adjustments to inventory (H) 324 946 1,009 5,012 Change in fair value of financial instruments (I) 6,125 382 - - Secondary public offerings (J) 1,525 1,385 19 2,494 Debt transaction costs (K) 1,285 526 - - Total Add-Backs 18,582 $ 11,138 $ 12,330 $ 24,568 $ Adjusted EBITDA 199,258 $ 188,229 $ 138,183 $ 105,796 $ Contributions from acquisitions (L) 1,280 9,500 12,093 8,064 Pro Forma Adjusted EBITDA 200,538 $ 197,729 $ 150,276 $ 113,860 $
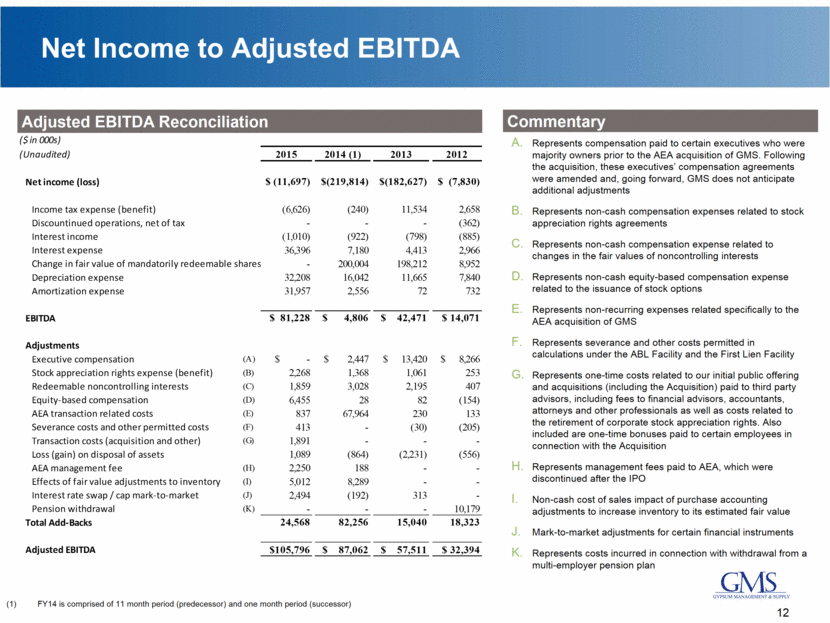
Net Income to Adjusted EBITDA Adjusted EBITDA Reconciliation Commentary Represents compensation paid to certain executives who were majority owners prior to the AEA acquisition of GMS. Following the acquisition, these executives’ compensation agreements were amended and, going forward, GMS does not anticipate additional adjustments Represents non-cash compensation expenses related to stock appreciation rights agreements Represents non-cash compensation expense related to changes in the fair values of noncontrolling interests Represents non-cash equity-based compensation expense related to the issuance of stock options Represents non-recurring expenses related specifically to the AEA acquisition of GMS Represents severance and other costs permitted in calculations under the ABL Facility and the First Lien Facility Represents one-time costs related to our initial public offering and acquisitions (including the Acquisition) paid to third party advisors, including fees to financial advisors, accountants, attorneys and other professionals as well as costs related to the retirement of corporate stock appreciation rights. Also included are one-time bonuses paid to certain employees in connection with the Acquisition Represents management fees paid to AEA, which were discontinued after the IPO Non-cash cost of sales impact of purchase accounting adjustments to increase inventory to its estimated fair value Mark-to-market adjustments for certain financial instruments Represents costs incurred in connection with withdrawal from a multi-employer pension plan 12 FY14 is comprised of 11 month period (predecessor) and one month period (successor) ($ in 000s) (Unaudited) 2015 2014 (1) 2013 2012 Net income (loss) $ (11,697) $(219,814) $(182,627) $ (7,830) Income tax expense (benefit) (6,626) (240) 11,534 2,658 Discountinued operations, net of tax - - - (362) Interest income (1,010) (922) (798) (885) Interest expense 36,396 7,180 4,413 2,966 Change in fair value of mandatorily redeemable shares - 200,004 198,212 8,952 Depreciation expense 32,208 16,042 11,665 7,840 Amortization expense 31,957 2,556 72 732 EBITDA $ 81,228 $ 4,806 $ 42,471 $ 14,071 Adjustments Executive compensation (A) $ - $ 2,447 $ 13,420 $ 8,266 Stock appreciation rights expense (benefit) (B) 2,268 1,368 1,061 253 Redeemable noncontrolling interests (C) 1,859 3,028 2,195 407 Equity-based compensation (D) 6,455 28 82 (154) AEA transaction related costs (E) 837 67,964 230 133 Severance costs and other permitted costs (F) 413 - (30) (205) Transaction costs (acquisition and other) (G) 1,891 - - - Loss (gain) on disposal of assets 1,089 (864) (2,231) (556) AEA management fee (H) 2,250 188 - - Effects of fair value adjustments to inventory (I) 5,012 8,289 - - Interest rate swap / cap mark-to-market (J) 2,494 (192) 313 - Pension withdrawal (K) - - - 10,179 Total Add-Backs 24,568 82,256 15,040 18,323 Adjusted EBITDA $105,796 $ 87,062 $ 57,511 $ 32,394
Q&A
