Attached files
| file | filename |
|---|---|
| 8-K - 8-K 2Q18 EARNINGS RELEASE - U.S. CONCRETE, INC. | a8-k2q18earningsrelease.htm |

Exhibit 99.1 U.S. CONCRETE ANNOUNCES SECOND QUARTER 2018 RESULTS EULESS, TEXAS – August 7, 2018 – U.S. Concrete, Inc. (NASDAQ: USCR), a leading producer of construction materials in select major markets across the United States, today reported results for the quarter ended June 30, 2018. SECOND QUARTER 2018 HIGHLIGHTS COMPARED TO SECOND QUARTER 2017 • Consolidated revenue increased 18.6% to $404.2 million, an all-time quarterly high • Ready-mixed concrete revenue increased 12.9% to $350.0 million, an all-time quarterly high • Ready-mixed concrete organic volume grew by 5% • Aggregate products revenue increased 113.1% to $48.5 million, an all-time quarterly high • Polaris recorded revenue and volume of $22.5 million and 1.3 million tons, respectively, both all-time quarterly highs • Income from continuing operations was $16.3 million, an increase of $18.5 million • Total Adjusted EBITDA increased 8.9% to $57.7 million1, an all-time quarterly high • Net income per diluted share of $0.99 compares to a net loss per diluted share of $0.15 • Ready-mixed concrete backlog increased 9.8% to an all-time high of 8.3 million cubic yards 1 Total Adjusted EBITDA is a non-GAAP financial measure. Please refer to the reconciliation and other information at the end of this press release. William J. Sandbrook, Chairman, President and Chief Executive Officer of U.S. Concrete stated, “We are very pleased to report record results for the second quarter, including all-time quarterly highs in volumes, revenue, Adjusted EBITDA and backlog. We believe our second quarter results reflect favorably on the underlying demand environment in each of our markets. “We continue to be excited about the opportunities available to us for growth and margin expansion as we fully integrate our recent acquisitions, improve operational efficiencies and capitalize on operating leverage provided by higher volumes. Our Polaris Materials acquisition is generating significant returns and facilitating the vertical integration of our Northern California operations through just two full quarters under our ownership. Polaris’s operational and financial results have exceeded our initial expectations. With Polaris and other recent acquisitions, we have more than doubled our aggregate revenue and volumes during the past 15 months. Our year-to-date total aggregate products revenue, including internally managed hauling and distribution operations, now represents more than 15% of total revenue and should represent close to 1
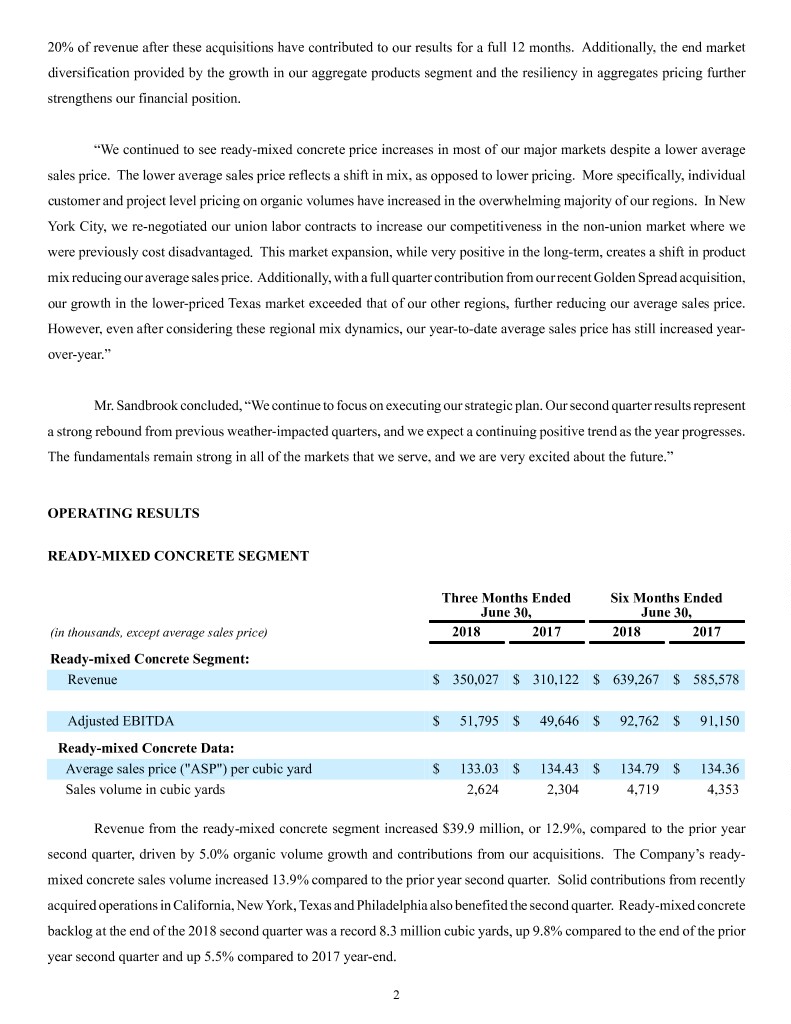
20% of revenue after these acquisitions have contributed to our results for a full 12 months. Additionally, the end market diversification provided by the growth in our aggregate products segment and the resiliency in aggregates pricing further strengthens our financial position. “We continued to see ready-mixed concrete price increases in most of our major markets despite a lower average sales price. The lower average sales price reflects a shift in mix, as opposed to lower pricing. More specifically, individual customer and project level pricing on organic volumes have increased in the overwhelming majority of our regions. In New York City, we re-negotiated our union labor contracts to increase our competitiveness in the non-union market where we were previously cost disadvantaged. This market expansion, while very positive in the long-term, creates a shift in product mix reducing our average sales price. Additionally, with a full quarter contribution from our recent Golden Spread acquisition, our growth in the lower-priced Texas market exceeded that of our other regions, further reducing our average sales price. However, even after considering these regional mix dynamics, our year-to-date average sales price has still increased year- over-year.” Mr. Sandbrook concluded, “We continue to focus on executing our strategic plan. Our second quarter results represent a strong rebound from previous weather-impacted quarters, and we expect a continuing positive trend as the year progresses. The fundamentals remain strong in all of the markets that we serve, and we are very excited about the future.” OPERATING RESULTS READY-MIXED CONCRETE SEGMENT Three Months Ended Six Months Ended June 30, June 30, (in thousands, except average sales price) 2018 2017 2018 2017 Ready-mixed Concrete Segment: Revenue $ 350,027 $ 310,122 $ 639,267 $ 585,578 Adjusted EBITDA $ 51,795 $ 49,646 $ 92,762 $ 91,150 Ready-mixed Concrete Data: Average sales price ("ASP") per cubic yard $ 133.03 $ 134.43 $ 134.79 $ 134.36 Sales volume in cubic yards 2,624 2,304 4,719 4,353 Revenue from the ready-mixed concrete segment increased $39.9 million, or 12.9%, compared to the prior year second quarter, driven by 5.0% organic volume growth and contributions from our acquisitions. The Company’s ready- mixed concrete sales volume increased 13.9% compared to the prior year second quarter. Solid contributions from recently acquired operations in California, New York, Texas and Philadelphia also benefited the second quarter. Ready-mixed concrete backlog at the end of the 2018 second quarter was a record 8.3 million cubic yards, up 9.8% compared to the end of the prior year second quarter and up 5.5% compared to 2017 year-end. 2
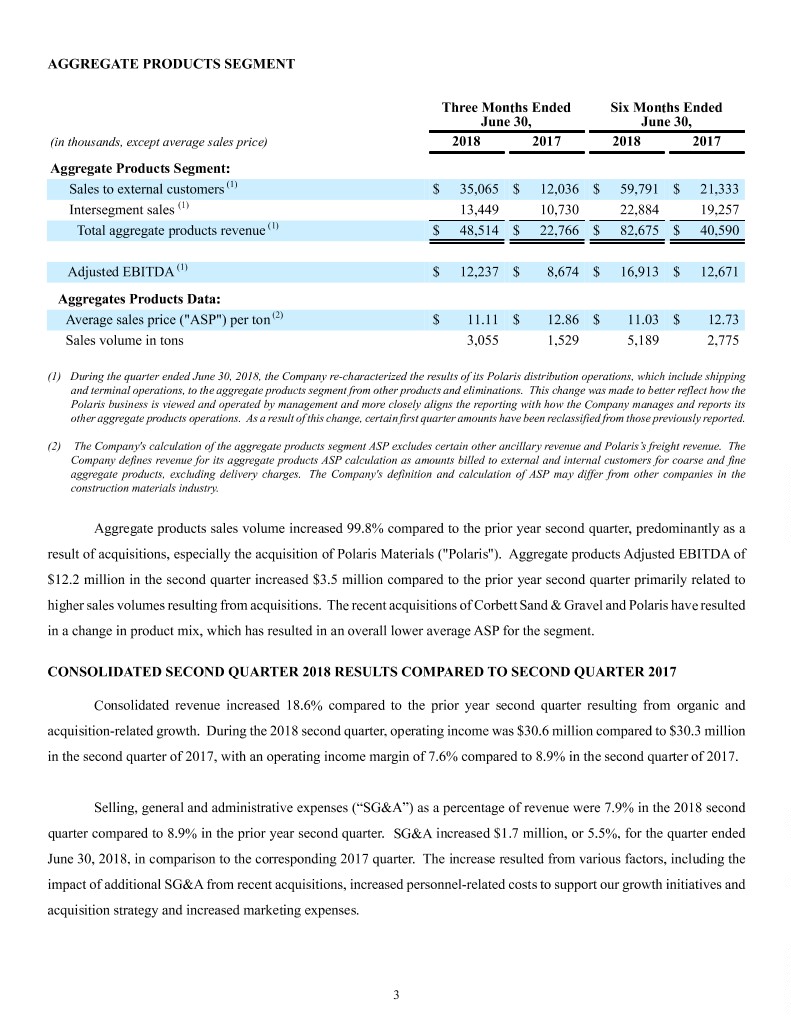
AGGREGATE PRODUCTS SEGMENT Three Months Ended Six Months Ended June 30, June 30, (in thousands, except average sales price) 2018 2017 2018 2017 Aggregate Products Segment: Sales to external customers (1) $ 35,065 $ 12,036 $ 59,791 $ 21,333 Intersegment sales (1) 13,449 10,730 22,884 19,257 Total aggregate products revenue (1) $ 48,514 $ 22,766 $ 82,675 $ 40,590 Adjusted EBITDA (1) $ 12,237 $ 8,674 $ 16,913 $ 12,671 Aggregates Products Data: Average sales price ("ASP") per ton (2) $ 11.11 $ 12.86 $ 11.03 $ 12.73 Sales volume in tons 3,055 1,529 5,189 2,775 (1) During the quarter ended June 30, 2018, the Company re-characterized the results of its Polaris distribution operations, which include shipping and terminal operations, to the aggregate products segment from other products and eliminations. This change was made to better reflect how the Polaris business is viewed and operated by management and more closely aligns the reporting with how the Company manages and reports its other aggregate products operations. As a result of this change, certain first quarter amounts have been reclassified from those previously reported. (2) The Company's calculation of the aggregate products segment ASP excludes certain other ancillary revenue and Polaris’s freight revenue. The Company defines revenue for its aggregate products ASP calculation as amounts billed to external and internal customers for coarse and fine aggregate products, excluding delivery charges. The Company's definition and calculation of ASP may differ from other companies in the construction materials industry. Aggregate products sales volume increased 99.8% compared to the prior year second quarter, predominantly as a result of acquisitions, especially the acquisition of Polaris Materials ("Polaris"). Aggregate products Adjusted EBITDA of $12.2 million in the second quarter increased $3.5 million compared to the prior year second quarter primarily related to higher sales volumes resulting from acquisitions. The recent acquisitions of Corbett Sand & Gravel and Polaris have resulted in a change in product mix, which has resulted in an overall lower average ASP for the segment. CONSOLIDATED SECOND QUARTER 2018 RESULTS COMPARED TO SECOND QUARTER 2017 Consolidated revenue increased 18.6% compared to the prior year second quarter resulting from organic and acquisition-related growth. During the 2018 second quarter, operating income was $30.6 million compared to $30.3 million in the second quarter of 2017, with an operating income margin of 7.6% compared to 8.9% in the second quarter of 2017. Selling, general and administrative expenses (“SG&A”) as a percentage of revenue were 7.9% in the 2018 second quarter compared to 8.9% in the prior year second quarter. SG&A increased $1.7 million, or 5.5%, for the quarter ended June 30, 2018, in comparison to the corresponding 2017 quarter. The increase resulted from various factors, including the impact of additional SG&A from recent acquisitions, increased personnel-related costs to support our growth initiatives and acquisition strategy and increased marketing expenses. 3
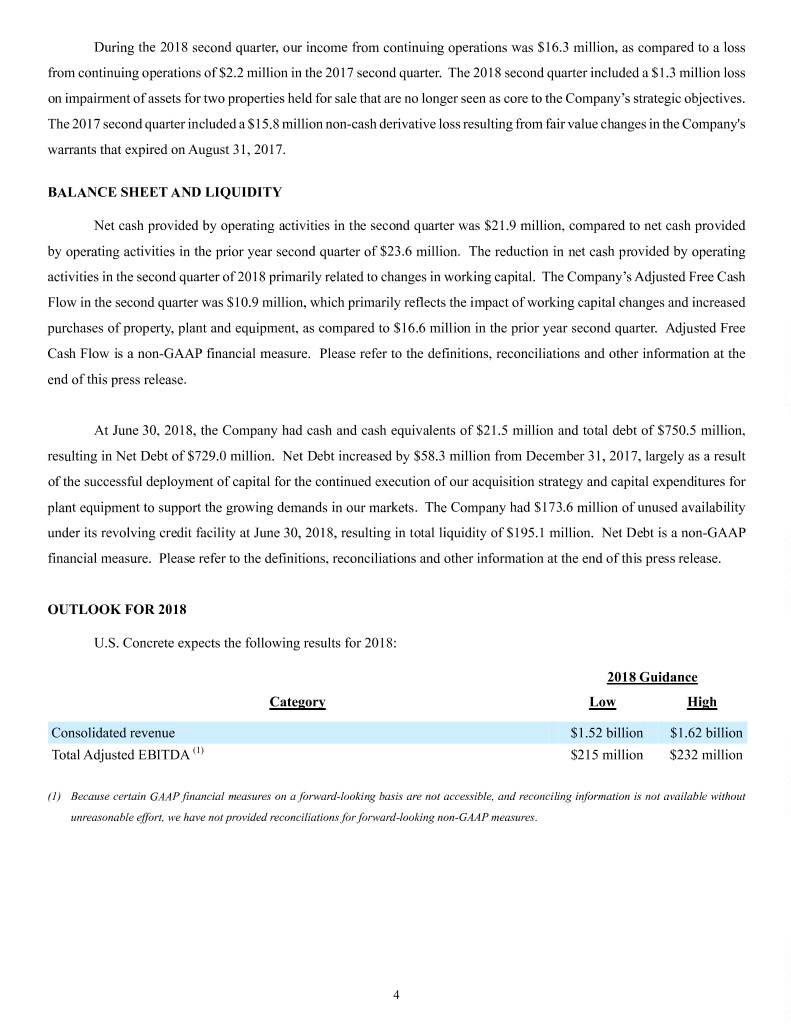
During the 2018 second quarter, our income from continuing operations was $16.3 million, as compared to a loss from continuing operations of $2.2 million in the 2017 second quarter. The 2018 second quarter included a $1.3 million loss on impairment of assets for two properties held for sale that are no longer seen as core to the Company’s strategic objectives. The 2017 second quarter included a $15.8 million non-cash derivative loss resulting from fair value changes in the Company's warrants that expired on August 31, 2017. BALANCE SHEET AND LIQUIDITY Net cash provided by operating activities in the second quarter was $21.9 million, compared to net cash provided by operating activities in the prior year second quarter of $23.6 million. The reduction in net cash provided by operating activities in the second quarter of 2018 primarily related to changes in working capital. The Company’s Adjusted Free Cash Flow in the second quarter was $10.9 million, which primarily reflects the impact of working capital changes and increased purchases of property, plant and equipment, as compared to $16.6 million in the prior year second quarter. Adjusted Free Cash Flow is a non-GAAP financial measure. Please refer to the definitions, reconciliations and other information at the end of this press release. At June 30, 2018, the Company had cash and cash equivalents of $21.5 million and total debt of $750.5 million, resulting in Net Debt of $729.0 million. Net Debt increased by $58.3 million from December 31, 2017, largely as a result of the successful deployment of capital for the continued execution of our acquisition strategy and capital expenditures for plant equipment to support the growing demands in our markets. The Company had $173.6 million of unused availability under its revolving credit facility at June 30, 2018, resulting in total liquidity of $195.1 million. Net Debt is a non-GAAP financial measure. Please refer to the definitions, reconciliations and other information at the end of this press release. OUTLOOK FOR 2018 U.S. Concrete expects the following results for 2018: 2018 Guidance Category Low High Consolidated revenue $1.52 billion $1.62 billion Total Adjusted EBITDA (1) $215 million $232 million (1) Because certain GAAP financial measures on a forward-looking basis are not accessible, and reconciling information is not available without unreasonable effort, we have not provided reconciliations for forward-looking non-GAAP measures. 4

CONFERENCE CALL AND WEBCAST DETAILS U.S. Concrete will host a conference call on Tuesday, August 7, 2018 at 10:00 a.m. Eastern Time (9:00 a.m. Central Time), to review its second quarter 2018 results. To participate in the call, please dial (877) 312-8806 – Conference ID: 5599344 at least ten minutes before the conference call begins and ask for the U.S. Concrete conference call. A live webcast will be available on the Investor Relations section of the Company's website at www.us-concrete.com. Please visit the website at least 15 minutes before the call begins to register, download and install any necessary audio software. A replay of the conference call and archive of the webcast will be available shortly after the call on the Investor Relations section of the Company’s website at www.us-concrete.com. ABOUT U.S. CONCRETE U.S. Concrete, Inc. (NASDAQ: USCR) is a leading supplier of concrete and aggregates for large-scale commercial, residential and infrastructure projects across the country. The Company holds leading market positions in the high growth metropolitan markets of New York, San Francisco, Dallas-Fort Worth and Washington, D.C, and its materials have been used in some of the most complex and highly specialized construction projects of the last decade. U.S. Concrete has continued to grow organically and through a series of strategic acquisitions of independent producers in our target markets. For more information on U.S. Concrete, visit www.us-concrete.com. 5
CAUTIONARY STATEMENT REGARDING FORWARD-LOOKING STATEMENTS Certain statements and information provided in this press release are “forward-looking statements” within the meaning of Section 27A of the Securities Act of 1933 and Section 21E of the Securities Exchange Act of 1934. These forward-looking statements include, without limitation, statements concerning plans, objectives, goals, projections, outlook, strategies, future events or performance, and underlying assumptions and other statements, which are not statements of historical facts. In some cases, you can identify forward-looking statements by terminology such as “may,” “will,” “intend,” “should,” “expect,” “plan,” “anticipate,” “believe,” “estimate,” “outlook,” “predict,” “potential” or “continue,” the negative of such terms or other comparable terminology. These forward-looking statements, which are subject to risks, uncertainties and assumptions about us, may include projections of our future financial performance, our anticipated growth strategies and anticipated trends in our business. These statements are predictions based on our current expectations and projections about future events which we believe are reasonable. Actual events or results may differ materially. By their nature, forward-looking statements involve risks and uncertainties because they relate to events and depend on circumstances that may or may not occur in the future. We believe that these risks and uncertainties include, but are not limited to: general economic and business conditions, which will, among other things, affect demand for new residential and commercial construction; our ability to successfully identify, manage, and integrate acquisitions; the cyclical nature of, and changes in, the real estate and construction markets, including pricing changes by our competitors; governmental requirements and initiatives, including those related to mortgage lending, financing or deductions, funding for public or infrastructure construction, land usage, and environmental, health, and safety matters; disruptions, uncertainties or volatility in the credit markets that may limit our, our suppliers’ and our customers’ access to capital; our ability to successfully implement our operating strategy; weather conditions; our substantial indebtedness and the restrictions imposed on us by the terms of our indebtedness; the effects of currency fluctuations on our results of operations and financial condition; our ability to maintain favorable relationships with third parties who supply us with equipment and essential supplies; our ability to retain key personnel and maintain satisfactory labor relations; and product liability, property damage, results of litigation and other claims and insurance coverage issues. Although we believe that the expectations reflected in the forward-looking statements are reasonable, we cannot guarantee future results, levels of activity, performance or achievements. Moreover, neither we nor any other person assumes responsibility for the accuracy and completeness of the forward-looking statements. All written and oral forward-looking statements made in connection with this press release that are attributable to us or persons acting on our behalf are expressly qualified in their entirety by the “Risk Factors” in our Annual Report on Form 10-K and our Quarterly Reports on Form 10-Q filed with the Securities and Exchange Commission. We are under no duty to update any of the forward-looking statements after the date of this press release to conform such statements to actual results or to changes in our expectations, except as required by federal securities laws. There can be no assurance that other factors will not affect the accuracy of these forward-looking statements or that our actual results will not differ materially from the results anticipated in such forward-looking statements. Unpredictable or unknown factors we have not discussed in this press release also could have material effects on actual results or matters that are the subject of our forward-looking statements. We undertake no obligation to, and do not intend to, update our description of important factors each time a potential important factor arises. Non-GAAP Financial Measures Included in this press release are certain non-GAAP financial measures that we believe are useful for investors. These non-GAAP financial measures may not be comparable to similarly titled measures other companies report and are not intended to be used as an alternative to any measure of our performance in accordance with GAAP. Reconciliations and definitions of the non-GAAP measures used in this press release are included at the end of this press release. Because certain GAAP financial measures on a forward-looking basis are not accessible, and reconciling information is not available without unreasonable effort, we have not provided reconciliations for forward-looking non-GAAP measures. (Tables Follow) 6
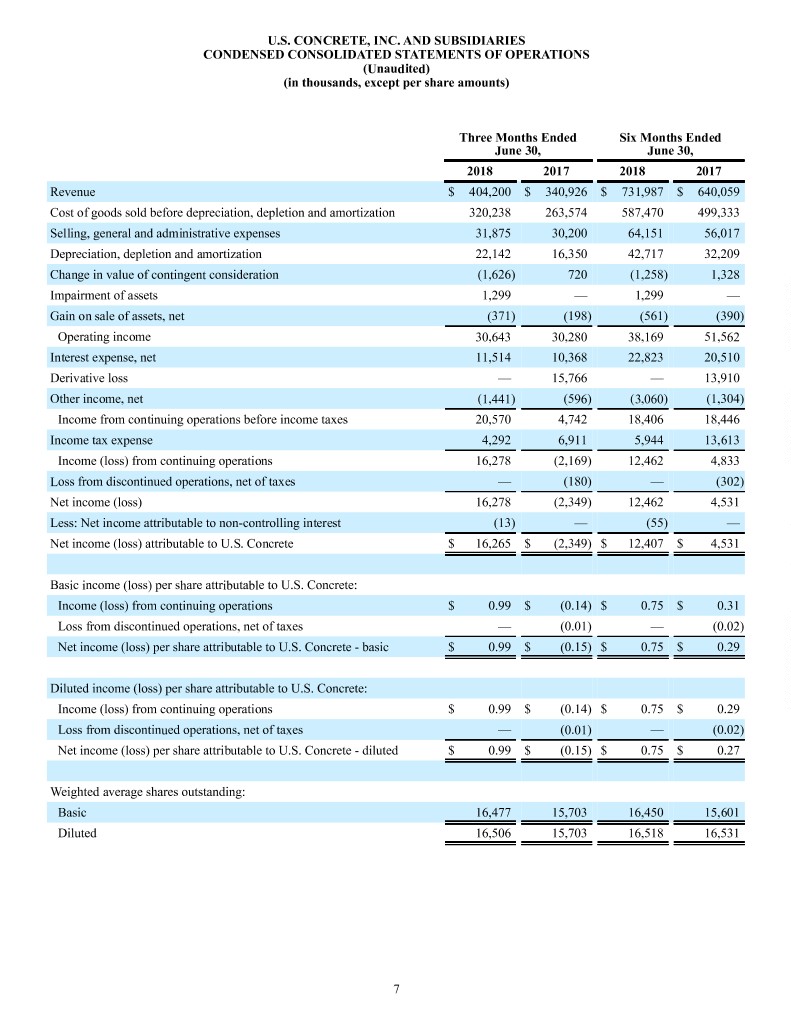
U.S. CONCRETE, INC. AND SUBSIDIARIES CONDENSED CONSOLIDATED STATEMENTS OF OPERATIONS (Unaudited) (in thousands, except per share amounts) Three Months Ended Six Months Ended June 30, June 30, 2018 2017 2018 2017 Revenue $ 404,200 $ 340,926 $ 731,987 $ 640,059 Cost of goods sold before depreciation, depletion and amortization 320,238 263,574 587,470 499,333 Selling, general and administrative expenses 31,875 30,200 64,151 56,017 Depreciation, depletion and amortization 22,142 16,350 42,717 32,209 Change in value of contingent consideration (1,626) 720 (1,258) 1,328 Impairment of assets 1,299 — 1,299 — Gain on sale of assets, net (371) (198) (561) (390) Operating income 30,643 30,280 38,169 51,562 Interest expense, net 11,514 10,368 22,823 20,510 Derivative loss — 15,766 — 13,910 Other income, net (1,441) (596) (3,060) (1,304) Income from continuing operations before income taxes 20,570 4,742 18,406 18,446 Income tax expense 4,292 6,911 5,944 13,613 Income (loss) from continuing operations 16,278 (2,169) 12,462 4,833 Loss from discontinued operations, net of taxes — (180) — (302) Net income (loss) 16,278 (2,349) 12,462 4,531 Less: Net income attributable to non-controlling interest (13) — (55) — Net income (loss) attributable to U.S. Concrete $ 16,265 $ (2,349) $ 12,407 $ 4,531 Basic income (loss) per share attributable to U.S. Concrete: Income (loss) from continuing operations $ 0.99 $ (0.14) $ 0.75 $ 0.31 Loss from discontinued operations, net of taxes — (0.01) — (0.02) Net income (loss) per share attributable to U.S. Concrete - basic $ 0.99 $ (0.15) $ 0.75 $ 0.29 Diluted income (loss) per share attributable to U.S. Concrete: Income (loss) from continuing operations $ 0.99 $ (0.14) $ 0.75 $ 0.29 Loss from discontinued operations, net of taxes — (0.01) — (0.02) Net income (loss) per share attributable to U.S. Concrete - diluted $ 0.99 $ (0.15) $ 0.75 $ 0.27 Weighted average shares outstanding: Basic 16,477 15,703 16,450 15,601 Diluted 16,506 15,703 16,518 16,531 7
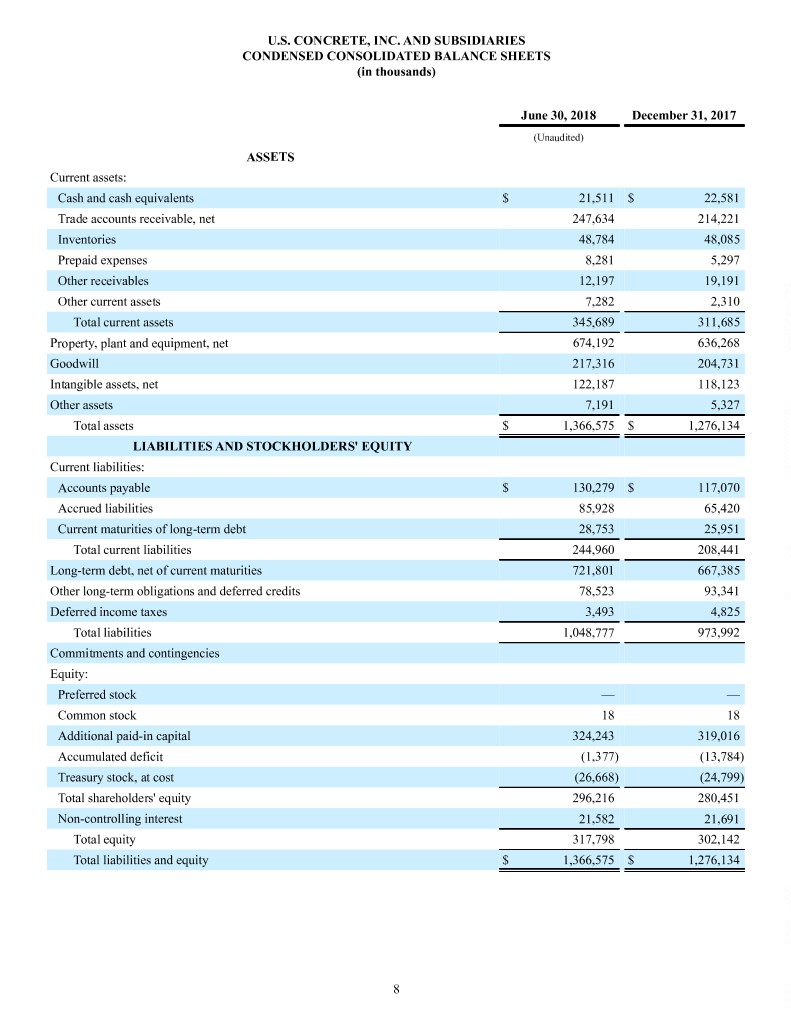
U.S. CONCRETE, INC. AND SUBSIDIARIES CONDENSED CONSOLIDATED BALANCE SHEETS (in thousands) June 30, 2018 December 31, 2017 (Unaudited) ASSETS Current assets: Cash and cash equivalents $ 21,511 $ 22,581 Trade accounts receivable, net 247,634 214,221 Inventories 48,784 48,085 Prepaid expenses 8,281 5,297 Other receivables 12,197 19,191 Other current assets 7,282 2,310 Total current assets 345,689 311,685 Property, plant and equipment, net 674,192 636,268 Goodwill 217,316 204,731 Intangible assets, net 122,187 118,123 Other assets 7,191 5,327 Total assets $ 1,366,575 $ 1,276,134 LIABILITIES AND STOCKHOLDERS' EQUITY Current liabilities: Accounts payable $ 130,279 $ 117,070 Accrued liabilities 85,928 65,420 Current maturities of long-term debt 28,753 25,951 Total current liabilities 244,960 208,441 Long-term debt, net of current maturities 721,801 667,385 Other long-term obligations and deferred credits 78,523 93,341 Deferred income taxes 3,493 4,825 Total liabilities 1,048,777 973,992 Commitments and contingencies Equity: Preferred stock — — Common stock 18 18 Additional paid-in capital 324,243 319,016 Accumulated deficit (1,377) (13,784) Treasury stock, at cost (26,668) (24,799) Total shareholders' equity 296,216 280,451 Non-controlling interest 21,582 21,691 Total equity 317,798 302,142 Total liabilities and equity $ 1,366,575 $ 1,276,134 8
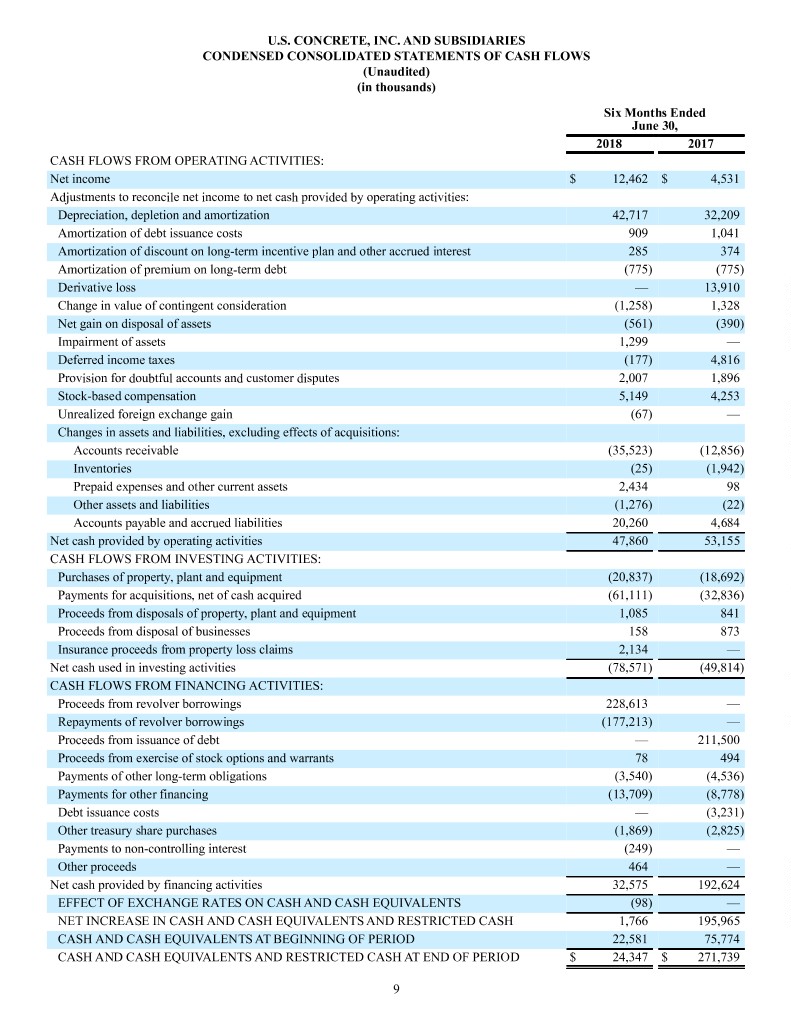
U.S. CONCRETE, INC. AND SUBSIDIARIES CONDENSED CONSOLIDATED STATEMENTS OF CASH FLOWS (Unaudited) (in thousands) Six Months Ended June 30, 2018 2017 CASH FLOWS FROM OPERATING ACTIVITIES: Net income $ 12,462 $ 4,531 Adjustments to reconcile net income to net cash provided by operating activities: Depreciation, depletion and amortization 42,717 32,209 Amortization of debt issuance costs 909 1,041 Amortization of discount on long-term incentive plan and other accrued interest 285 374 Amortization of premium on long-term debt (775) (775) Derivative loss — 13,910 Change in value of contingent consideration (1,258) 1,328 Net gain on disposal of assets (561) (390) Impairment of assets 1,299 — Deferred income taxes (177) 4,816 Provision for doubtful accounts and customer disputes 2,007 1,896 Stock-based compensation 5,149 4,253 Unrealized foreign exchange gain (67) — Changes in assets and liabilities, excluding effects of acquisitions: Accounts receivable (35,523) (12,856) Inventories (25) (1,942) Prepaid expenses and other current assets 2,434 98 Other assets and liabilities (1,276) (22) Accounts payable and accrued liabilities 20,260 4,684 Net cash provided by operating activities 47,860 53,155 CASH FLOWS FROM INVESTING ACTIVITIES: Purchases of property, plant and equipment (20,837) (18,692) Payments for acquisitions, net of cash acquired (61,111) (32,836) Proceeds from disposals of property, plant and equipment 1,085 841 Proceeds from disposal of businesses 158 873 Insurance proceeds from property loss claims 2,134 — Net cash used in investing activities (78,571) (49,814) CASH FLOWS FROM FINANCING ACTIVITIES: Proceeds from revolver borrowings 228,613 — Repayments of revolver borrowings (177,213) — Proceeds from issuance of debt — 211,500 Proceeds from exercise of stock options and warrants 78 494 Payments of other long-term obligations (3,540) (4,536) Payments for other financing (13,709) (8,778) Debt issuance costs — (3,231) Other treasury share purchases (1,869) (2,825) Payments to non-controlling interest (249) — Other proceeds 464 — Net cash provided by financing activities 32,575 192,624 EFFECT OF EXCHANGE RATES ON CASH AND CASH EQUIVALENTS (98) — NET INCREASE IN CASH AND CASH EQUIVALENTS AND RESTRICTED CASH 1,766 195,965 CASH AND CASH EQUIVALENTS AT BEGINNING OF PERIOD 22,581 75,774 CASH AND CASH EQUIVALENTS AND RESTRICTED CASH AT END OF PERIOD $ 24,347 $ 271,739 9
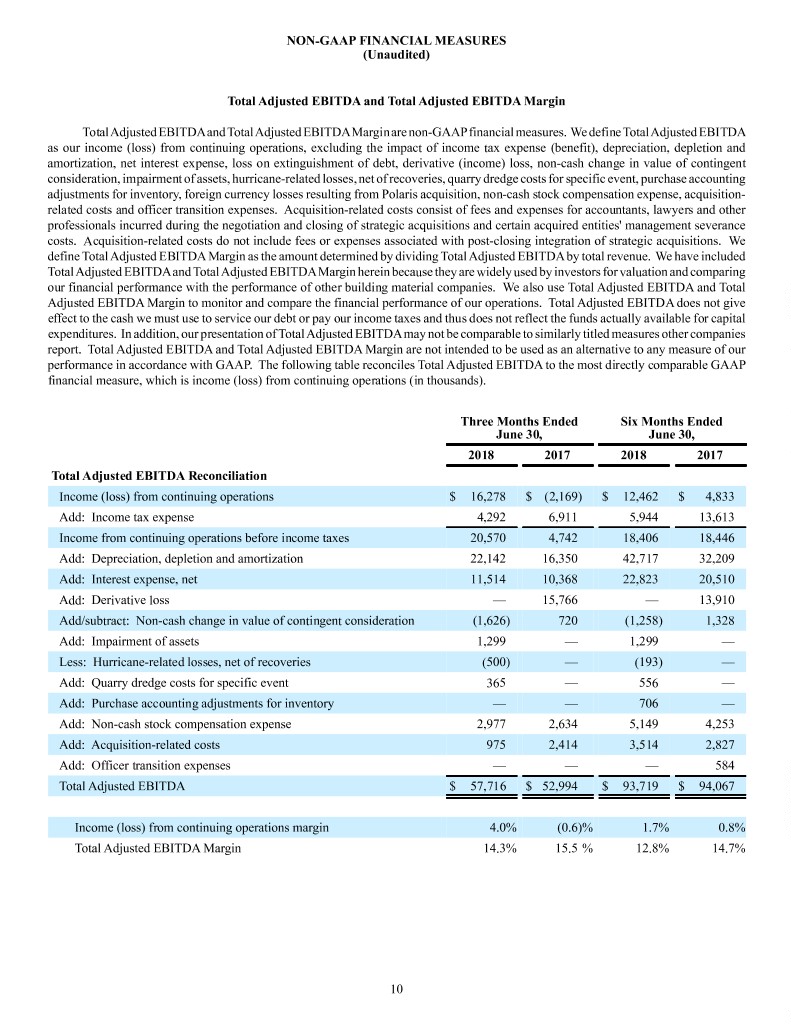
NON-GAAP FINANCIAL MEASURES (Unaudited) Total Adjusted EBITDA and Total Adjusted EBITDA Margin Total Adjusted EBITDA and Total Adjusted EBITDA Margin are non-GAAP financial measures. We define Total Adjusted EBITDA as our income (loss) from continuing operations, excluding the impact of income tax expense (benefit), depreciation, depletion and amortization, net interest expense, loss on extinguishment of debt, derivative (income) loss, non-cash change in value of contingent consideration, impairment of assets, hurricane-related losses, net of recoveries, quarry dredge costs for specific event, purchase accounting adjustments for inventory, foreign currency losses resulting from Polaris acquisition, non-cash stock compensation expense, acquisition- related costs and officer transition expenses. Acquisition-related costs consist of fees and expenses for accountants, lawyers and other professionals incurred during the negotiation and closing of strategic acquisitions and certain acquired entities' management severance costs. Acquisition-related costs do not include fees or expenses associated with post-closing integration of strategic acquisitions. We define Total Adjusted EBITDA Margin as the amount determined by dividing Total Adjusted EBITDA by total revenue. We have included Total Adjusted EBITDA and Total Adjusted EBITDA Margin herein because they are widely used by investors for valuation and comparing our financial performance with the performance of other building material companies. We also use Total Adjusted EBITDA and Total Adjusted EBITDA Margin to monitor and compare the financial performance of our operations. Total Adjusted EBITDA does not give effect to the cash we must use to service our debt or pay our income taxes and thus does not reflect the funds actually available for capital expenditures. In addition, our presentation of Total Adjusted EBITDA may not be comparable to similarly titled measures other companies report. Total Adjusted EBITDA and Total Adjusted EBITDA Margin are not intended to be used as an alternative to any measure of our performance in accordance with GAAP. The following table reconciles Total Adjusted EBITDA to the most directly comparable GAAP financial measure, which is income (loss) from continuing operations (in thousands). Three Months Ended Six Months Ended June 30, June 30, 2018 2017 2018 2017 Total Adjusted EBITDA Reconciliation Income (loss) from continuing operations $ 16,278 $ (2,169) $ 12,462 $ 4,833 Add: Income tax expense 4,292 6,911 5,944 13,613 Income from continuing operations before income taxes 20,570 4,742 18,406 18,446 Add: Depreciation, depletion and amortization 22,142 16,350 42,717 32,209 Add: Interest expense, net 11,514 10,368 22,823 20,510 Add: Derivative loss — 15,766 — 13,910 Add/subtract: Non-cash change in value of contingent consideration (1,626) 720 (1,258) 1,328 Add: Impairment of assets 1,299 — 1,299 — Less: Hurricane-related losses, net of recoveries (500) — (193) — Add: Quarry dredge costs for specific event 365 — 556 — Add: Purchase accounting adjustments for inventory — — 706 — Add: Non-cash stock compensation expense 2,977 2,634 5,149 4,253 Add: Acquisition-related costs 975 2,414 3,514 2,827 Add: Officer transition expenses — — — 584 Total Adjusted EBITDA $ 57,716 $ 52,994 $ 93,719 $ 94,067 Income (loss) from continuing operations margin 4.0% (0.6)% 1.7% 0.8% Total Adjusted EBITDA Margin 14.3% 15.5 % 12.8% 14.7% 10
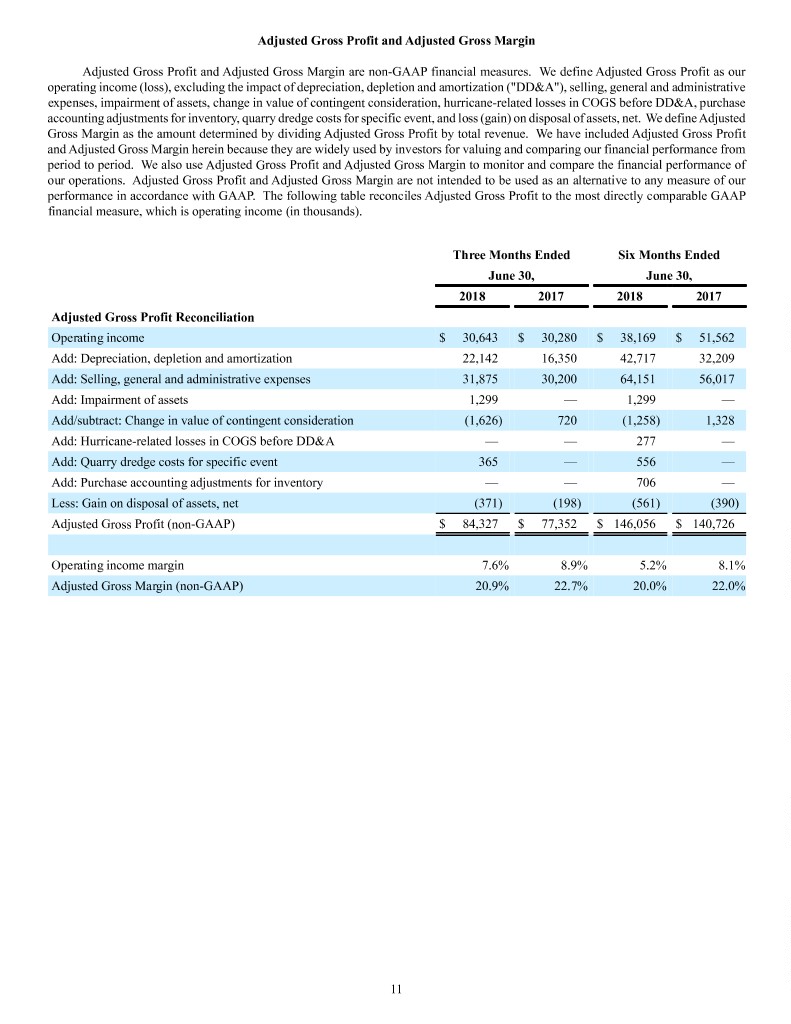
Adjusted Gross Profit and Adjusted Gross Margin Adjusted Gross Profit and Adjusted Gross Margin are non-GAAP financial measures. We define Adjusted Gross Profit as our operating income (loss), excluding the impact of depreciation, depletion and amortization ("DD&A"), selling, general and administrative expenses, impairment of assets, change in value of contingent consideration, hurricane-related losses in COGS before DD&A, purchase accounting adjustments for inventory, quarry dredge costs for specific event, and loss (gain) on disposal of assets, net. We define Adjusted Gross Margin as the amount determined by dividing Adjusted Gross Profit by total revenue. We have included Adjusted Gross Profit and Adjusted Gross Margin herein because they are widely used by investors for valuing and comparing our financial performance from period to period. We also use Adjusted Gross Profit and Adjusted Gross Margin to monitor and compare the financial performance of our operations. Adjusted Gross Profit and Adjusted Gross Margin are not intended to be used as an alternative to any measure of our performance in accordance with GAAP. The following table reconciles Adjusted Gross Profit to the most directly comparable GAAP financial measure, which is operating income (in thousands). Three Months Ended Six Months Ended June 30, June 30, 2018 2017 2018 2017 Adjusted Gross Profit Reconciliation Operating income $ 30,643 $ 30,280 $ 38,169 $ 51,562 Add: Depreciation, depletion and amortization 22,142 16,350 42,717 32,209 Add: Selling, general and administrative expenses 31,875 30,200 64,151 56,017 Add: Impairment of assets 1,299 — 1,299 — Add/subtract: Change in value of contingent consideration (1,626) 720 (1,258) 1,328 Add: Hurricane-related losses in COGS before DD&A — — 277 — Add: Quarry dredge costs for specific event 365 — 556 — Add: Purchase accounting adjustments for inventory — — 706 — Less: Gain on disposal of assets, net (371) (198) (561) (390) Adjusted Gross Profit (non-GAAP) $ 84,327 $ 77,352 $ 146,056 $ 140,726 Operating income margin 7.6% 8.9% 5.2% 8.1% Adjusted Gross Margin (non-GAAP) 20.9% 22.7% 20.0% 22.0% 11
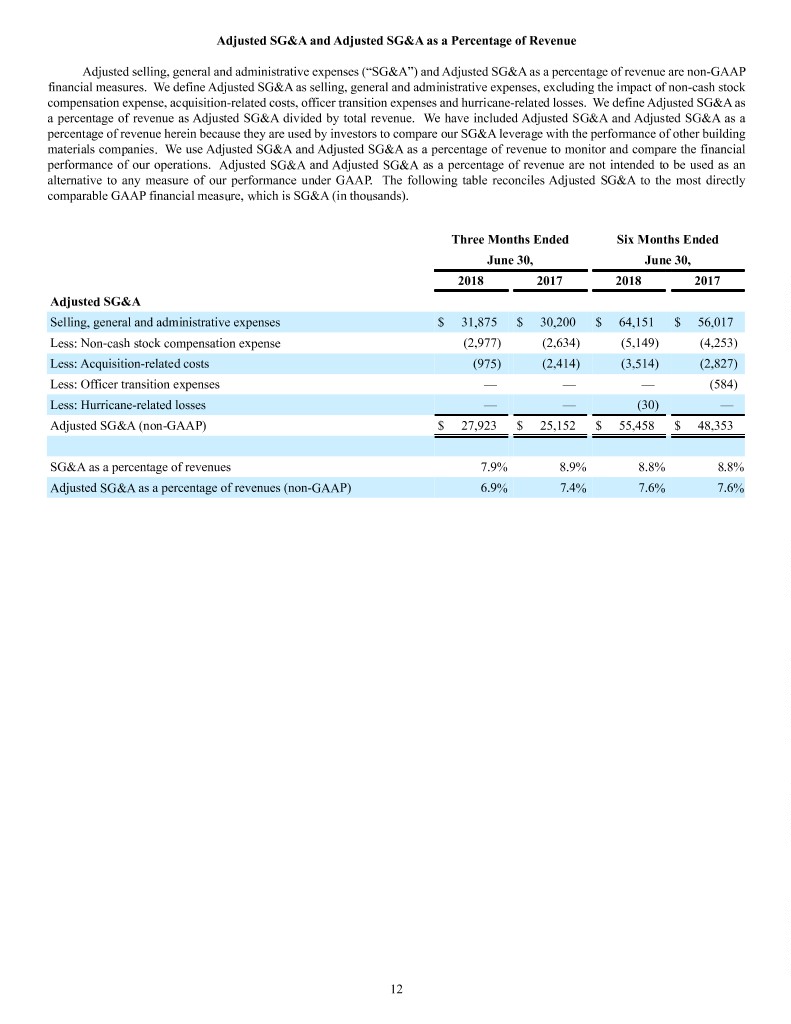
Adjusted SG&A and Adjusted SG&A as a Percentage of Revenue Adjusted selling, general and administrative expenses (“SG&A”) and Adjusted SG&A as a percentage of revenue are non-GAAP financial measures. We define Adjusted SG&A as selling, general and administrative expenses, excluding the impact of non-cash stock compensation expense, acquisition-related costs, officer transition expenses and hurricane-related losses. We define Adjusted SG&A as a percentage of revenue as Adjusted SG&A divided by total revenue. We have included Adjusted SG&A and Adjusted SG&A as a percentage of revenue herein because they are used by investors to compare our SG&A leverage with the performance of other building materials companies. We use Adjusted SG&A and Adjusted SG&A as a percentage of revenue to monitor and compare the financial performance of our operations. Adjusted SG&A and Adjusted SG&A as a percentage of revenue are not intended to be used as an alternative to any measure of our performance under GAAP. The following table reconciles Adjusted SG&A to the most directly comparable GAAP financial measure, which is SG&A (in thousands). Three Months Ended Six Months Ended June 30, June 30, 2018 2017 2018 2017 Adjusted SG&A Selling, general and administrative expenses $ 31,875 $ 30,200 $ 64,151 $ 56,017 Less: Non-cash stock compensation expense (2,977) (2,634) (5,149) (4,253) Less: Acquisition-related costs (975) (2,414) (3,514) (2,827) Less: Officer transition expenses — — — (584) Less: Hurricane-related losses — — (30) — Adjusted SG&A (non-GAAP) $ 27,923 $ 25,152 $ 55,458 $ 48,353 SG&A as a percentage of revenues 7.9% 8.9% 8.8% 8.8% Adjusted SG&A as a percentage of revenues (non-GAAP) 6.9% 7.4% 7.6% 7.6% 12
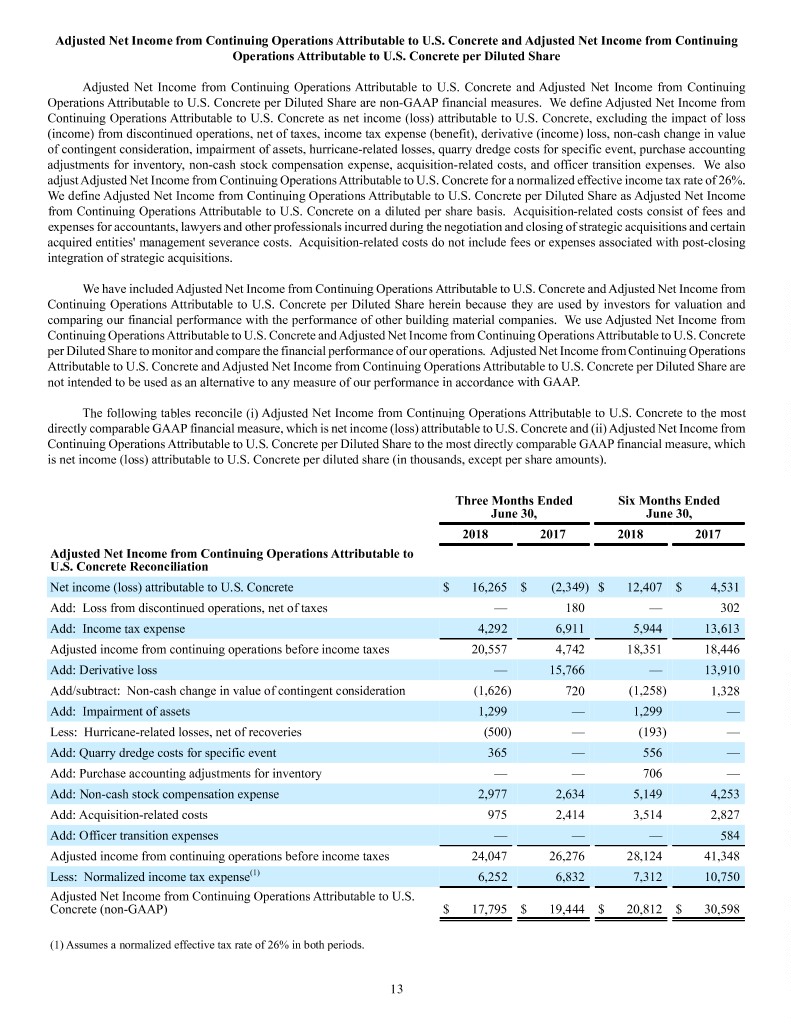
Adjusted Net Income from Continuing Operations Attributable to U.S. Concrete and Adjusted Net Income from Continuing Operations Attributable to U.S. Concrete per Diluted Share Adjusted Net Income from Continuing Operations Attributable to U.S. Concrete and Adjusted Net Income from Continuing Operations Attributable to U.S. Concrete per Diluted Share are non-GAAP financial measures. We define Adjusted Net Income from Continuing Operations Attributable to U.S. Concrete as net income (loss) attributable to U.S. Concrete, excluding the impact of loss (income) from discontinued operations, net of taxes, income tax expense (benefit), derivative (income) loss, non-cash change in value of contingent consideration, impairment of assets, hurricane-related losses, quarry dredge costs for specific event, purchase accounting adjustments for inventory, non-cash stock compensation expense, acquisition-related costs, and officer transition expenses. We also adjust Adjusted Net Income from Continuing Operations Attributable to U.S. Concrete for a normalized effective income tax rate of 26%. We define Adjusted Net Income from Continuing Operations Attributable to U.S. Concrete per Diluted Share as Adjusted Net Income from Continuing Operations Attributable to U.S. Concrete on a diluted per share basis. Acquisition-related costs consist of fees and expenses for accountants, lawyers and other professionals incurred during the negotiation and closing of strategic acquisitions and certain acquired entities' management severance costs. Acquisition-related costs do not include fees or expenses associated with post-closing integration of strategic acquisitions. We have included Adjusted Net Income from Continuing Operations Attributable to U.S. Concrete and Adjusted Net Income from Continuing Operations Attributable to U.S. Concrete per Diluted Share herein because they are used by investors for valuation and comparing our financial performance with the performance of other building material companies. We use Adjusted Net Income from Continuing Operations Attributable to U.S. Concrete and Adjusted Net Income from Continuing Operations Attributable to U.S. Concrete per Diluted Share to monitor and compare the financial performance of our operations. Adjusted Net Income from Continuing Operations Attributable to U.S. Concrete and Adjusted Net Income from Continuing Operations Attributable to U.S. Concrete per Diluted Share are not intended to be used as an alternative to any measure of our performance in accordance with GAAP. The following tables reconcile (i) Adjusted Net Income from Continuing Operations Attributable to U.S. Concrete to the most directly comparable GAAP financial measure, which is net income (loss) attributable to U.S. Concrete and (ii) Adjusted Net Income from Continuing Operations Attributable to U.S. Concrete per Diluted Share to the most directly comparable GAAP financial measure, which is net income (loss) attributable to U.S. Concrete per diluted share (in thousands, except per share amounts). Three Months Ended Six Months Ended June 30, June 30, 2018 2017 2018 2017 Adjusted Net Income from Continuing Operations Attributable to U.S. Concrete Reconciliation Net income (loss) attributable to U.S. Concrete $ 16,265 $ (2,349) $ 12,407 $ 4,531 Add: Loss from discontinued operations, net of taxes — 180 — 302 Add: Income tax expense 4,292 6,911 5,944 13,613 Adjusted income from continuing operations before income taxes 20,557 4,742 18,351 18,446 Add: Derivative loss — 15,766 — 13,910 Add/subtract: Non-cash change in value of contingent consideration (1,626) 720 (1,258) 1,328 Add: Impairment of assets 1,299 — 1,299 — Less: Hurricane-related losses, net of recoveries (500) — (193) — Add: Quarry dredge costs for specific event 365 — 556 — Add: Purchase accounting adjustments for inventory — — 706 — Add: Non-cash stock compensation expense 2,977 2,634 5,149 4,253 Add: Acquisition-related costs 975 2,414 3,514 2,827 Add: Officer transition expenses — — — 584 Adjusted income from continuing operations before income taxes 24,047 26,276 28,124 41,348 Less: Normalized income tax expense(1) 6,252 6,832 7,312 10,750 Adjusted Net Income from Continuing Operations Attributable to U.S. Concrete (non-GAAP) $ 17,795 $ 19,444 $ 20,812 $ 30,598 (1) Assumes a normalized effective tax rate of 26% in both periods. 13
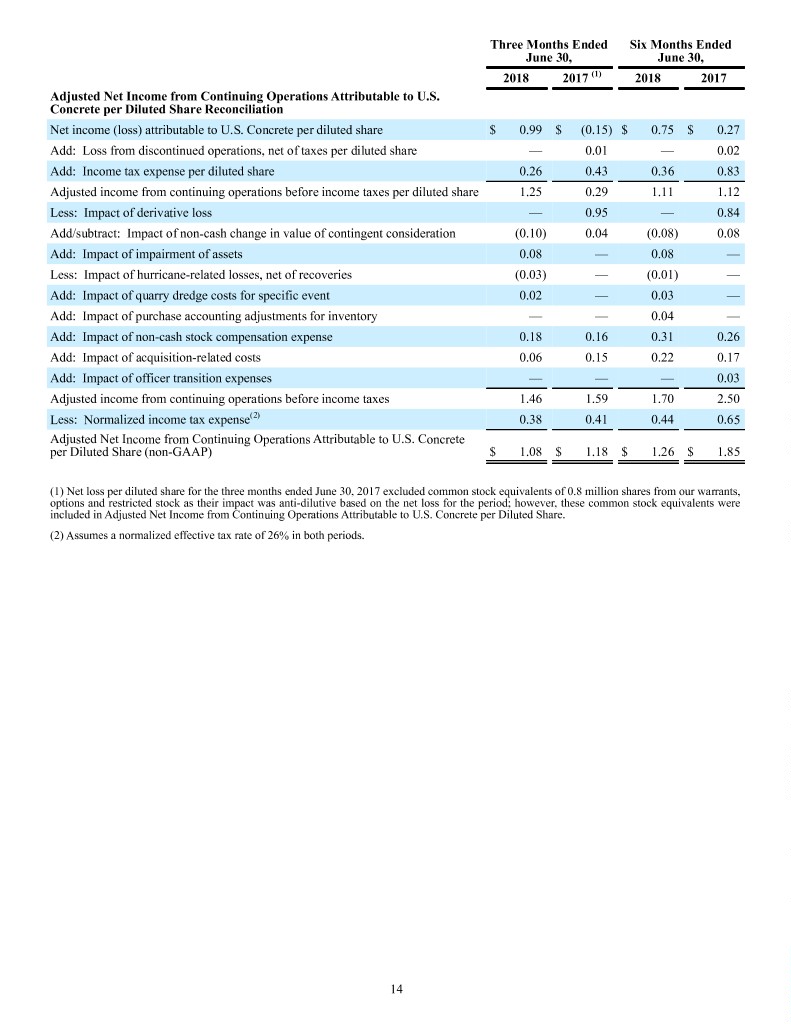
Three Months Ended Six Months Ended June 30, June 30, 2018 2017 (1) 2018 2017 Adjusted Net Income from Continuing Operations Attributable to U.S. Concrete per Diluted Share Reconciliation Net income (loss) attributable to U.S. Concrete per diluted share $ 0.99 $ (0.15) $ 0.75 $ 0.27 Add: Loss from discontinued operations, net of taxes per diluted share — 0.01 — 0.02 Add: Income tax expense per diluted share 0.26 0.43 0.36 0.83 Adjusted income from continuing operations before income taxes per diluted share 1.25 0.29 1.11 1.12 Less: Impact of derivative loss — 0.95 — 0.84 Add/subtract: Impact of non-cash change in value of contingent consideration (0.10) 0.04 (0.08) 0.08 Add: Impact of impairment of assets 0.08 — 0.08 — Less: Impact of hurricane-related losses, net of recoveries (0.03) — (0.01) — Add: Impact of quarry dredge costs for specific event 0.02 — 0.03 — Add: Impact of purchase accounting adjustments for inventory — — 0.04 — Add: Impact of non-cash stock compensation expense 0.18 0.16 0.31 0.26 Add: Impact of acquisition-related costs 0.06 0.15 0.22 0.17 Add: Impact of officer transition expenses — — — 0.03 Adjusted income from continuing operations before income taxes 1.46 1.59 1.70 2.50 Less: Normalized income tax expense(2) 0.38 0.41 0.44 0.65 Adjusted Net Income from Continuing Operations Attributable to U.S. Concrete per Diluted Share (non-GAAP) $ 1.08 $ 1.18 $ 1.26 $ 1.85 (1) Net loss per diluted share for the three months ended June 30, 2017 excluded common stock equivalents of 0.8 million shares from our warrants, options and restricted stock as their impact was anti-dilutive based on the net loss for the period; however, these common stock equivalents were included in Adjusted Net Income from Continuing Operations Attributable to U.S. Concrete per Diluted Share. (2) Assumes a normalized effective tax rate of 26% in both periods. 14

Adjusted Free Cash Flow Adjusted Free Cash Flow is a non-GAAP financial measure. We define Adjusted Free Cash Flow as net cash provided by operating activities less purchases of property, plant and equipment, plus proceeds from the disposals of property, plant and equipment, proceeds from disposal of businesses and insurance proceeds from property loss claims. We consider Adjusted Free Cash Flow to be an important indicator of our ability to service our debt and generate cash for acquisitions and other strategic investments. However, Adjusted Free Cash Flow is not intended to be used as an alternative to any measure of our liquidity in accordance with GAAP. The following table reconciles Adjusted Free Cash Flow to the most directly comparable GAAP financial measure, which is net cash provided by operating activities (in thousands). Three Months Ended Six Months Ended June 30, June 30, 2018 2017 2018 2017 Adjusted Free Cash Flow Reconciliation Net cash provided by operating activities $ 21,924 $ 23,611 $ 47,860 $ 53,155 Less: Purchases of property, plant and equipment (12,462) (7,974) (20,837) (18,692) Add: Proceeds from the disposals of property, plant and equipment 823 356 1,085 841 Add: Proceeds from disposal of businesses 86 579 158 873 Add: Insurance proceeds from property loss claims 500 — 2,134 — Adjusted Free Cash Flow (non-GAAP) $ 10,871 $ 16,572 $ 30,400 $ 36,177 Net Debt Net Debt is a non-GAAP financial measure. We define Net Debt as total debt, including current maturities and capital lease obligations, less cash and cash equivalents. We believe that Net Debt is useful to investors as a measure of our financial position. We use Net Debt to monitor and compare our financial position from period to period. However, Net Debt is not intended to be used as an alternative to any measure of our financial position in accordance with GAAP. The following table reconciles Net Debt to the most directly comparable GAAP financial measure, which is total debt, including current maturities and capital lease obligations (in thousands). As of As of June 30, 2018 December 31, 2017 Net Debt Reconciliation Total debt, including current maturities and capital lease obligations $ 750,554 $ 693,336 Less: cash and cash equivalents 21,511 22,581 Net Debt (non-GAAP) $ 729,043 $ 670,755 15

Net Debt to Total Adjusted EBITDA Net Debt to Total Adjusted EBITDA is a non-GAAP financial measure. We define Net Debt to Total Adjusted EBITDA as Net Debt divided by Total Adjusted EBITDA for the applicable last twelve-month period. We define Total Adjusted EBITDA as our income (loss) from continuing operations, excluding the impact of income tax expense (benefit), depreciation, depletion and amortization, net interest expense, loss on extinguishment of debt, derivative (income) loss, non-cash change in value of contingent consideration, impairment of assets, hurricane-related losses, quarry dredge costs for specific event, purchase accounting adjustments for inventory, foreign currency losses resulting from Polaris acquisition, non-cash stock compensation expense, acquisition-related costs and officer transition expenses. We believe that Net Debt to Total Adjusted EBITDA is useful to investors as a measure of our financial position. We use this measure to monitor and compare our financial position from period to period. However, Net Debt to Total Adjusted EBITDA is not intended to be used as an alternative to any measure of our financial position in accordance with GAAP. The following table presents our calculation of Net Debt to Total Adjusted EBITDA and the most directly comparable GAAP ratio, which is total debt to last twelve months ("LTM") income from continuing operations (in thousands). Twelve Month Period July 1, 2017 to June 30, 2018 Total Adjusted EBITDA Reconciliation Income from continuing operations $ 33,895 Add: Income tax expense 4,767 Income from continuing operations before income taxes 38,662 Add: Depreciation, depletion and amortization 78,306 Add: Interest expense, net 44,270 Add: Loss on extinguishment of debt 60 Less: Derivative income (13,119) Add: Non-cash change in value of contingent consideration 5,324 Add: Impairment of goodwill and other assets 7,537 Add: Hurricane-related losses, net of recoveries 2,845 Add: Quarry dredge costs for specific event 3,946 Add: Purchase accounting adjustments for inventory 1,993 Add: Foreign currency losses resulting from Polaris acquisition 1,949 Add: Non-cash stock compensation expense 9,181 Add: Acquisition-related costs 10,819 Add: Officer transition expenses 200 Total Adjusted EBITDA $ 191,973 Net Debt $ 729,043 Total debt to LTM income from continuing operations 22.14x Net Debt to Total Adjusted EBITDA as of June 30, 2018 (non-GAAP) 3.8x Contact: U.S. Concrete, Inc. Investor Relations 844-828-4774 IR@us-concrete.com 16
