Attached files
| file | filename |
|---|---|
| EX-99.1 - EX-99.1 - Ready Capital Corp | ex-99d1.htm |
| 8-K - 8-K - Ready Capital Corp | f8-k.htm |
Exhibit 99.2
|
|
Supplemental Financial Data Second Quarter 2018 |
|
|
Disclaimer This presentation contains statements that constitute "forward-looking statements," as such term is defined in Section 27A of the Securities Act of 1933, as amended, and Section 21E of the Securities Exchange Act of 1934, as amended, and such statements are intended to be covered by the safe harbor provided by the same. These statements are based on management's current expectations and beliefs and are subject to a number of trends and uncertainties that could cause actual results to differ materially from those described in the forward-looking statements; Sutherland Asset Management Corporation (the "Company") can give no assurance that its expectations will be attained. Factors that could cause actual results to differ materially from the Company's expectations include those set forth in the Risk Factors section of the most recent Annual Report on Form 10-K filed with the SEC and other reports filed by the Company with the SEC, copies of which are available on the SEC's website, www.sec.gov. The Company undertakes no obligation to update these statements for revisions or changes after the date of this release, except as required by law. This presentation includes certain non-GAAP financial measures, including Core Earnings. These non-GAAP financial measures should be considered only as supplemental to, and not as superior to, financial measures in accordance with GAAP. Please refer to Appendix A for the most recent GAAP information. This presentation also contains market statistics and industry data which are subject to uncertainty and are not necessarily reflective of market conditions. These have been derived from third party sources and have not been independently verified by the Company or its affiliates. All material presented is compiled from sources believed to be reliable and current, but accuracy cannot be guaranteed. All data is as of June 30, 2018, unless otherwise noted. 1 |
|
|
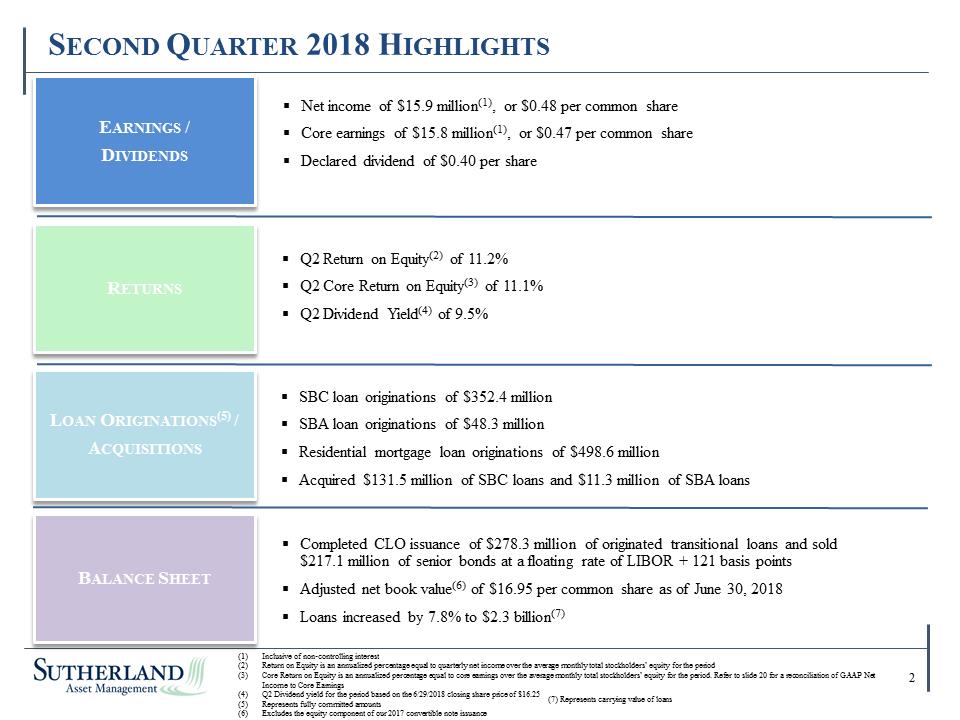
Net income of $15.9 million(1), or $0.48 per common share Core earnings of $15.8 million(1), or $0.47 per common share Declared dividend of $0.40 per share Earnings / Dividends Q2 Return on Equity(2) of 11.2% Q2 Core Return on Equity(3) of 11.1% Q2 Dividend Yield(4) of 9.5% Returns SBC loan originations of $352.4 million SBA loan originations of $48.3 million Residential mortgage loan originations of $498.6 million Acquired $131.5 million of SBC loans and $11.3 million of SBA loans Loan Originations(5) / Acquisitions Completed CLO issuance of $278.3 million of originated transitional loans and sold $217.1 million of senior bonds at a floating rate of LIBOR + 121 basis points Adjusted net book value(6) of $16.95 per common share as of June 30, 2018 Loans increased by 7.8% to $2.3 billion(7) Balance Sheet Second Quarter 2018 Highlights Inclusive of non-controlling interest Return on Equity is an annualized percentage equal to quarterly net income over the average monthly total stockholders’ equity for the period Core Return on Equity is an annualized percentage equal to core earnings over the average monthly total stockholders’ equity for the period. Refer to slide 20 for a reconciliation of GAAP Net Income to Core Earnings Q2 Dividend yield for the period based on the 6/29/2018 closing share price of $16.25 Represents fully committed amounts Excludes the equity component of our 2017 convertible note issuance 2 Check: Page #s (7) Represents carrying value of loans |
|
|
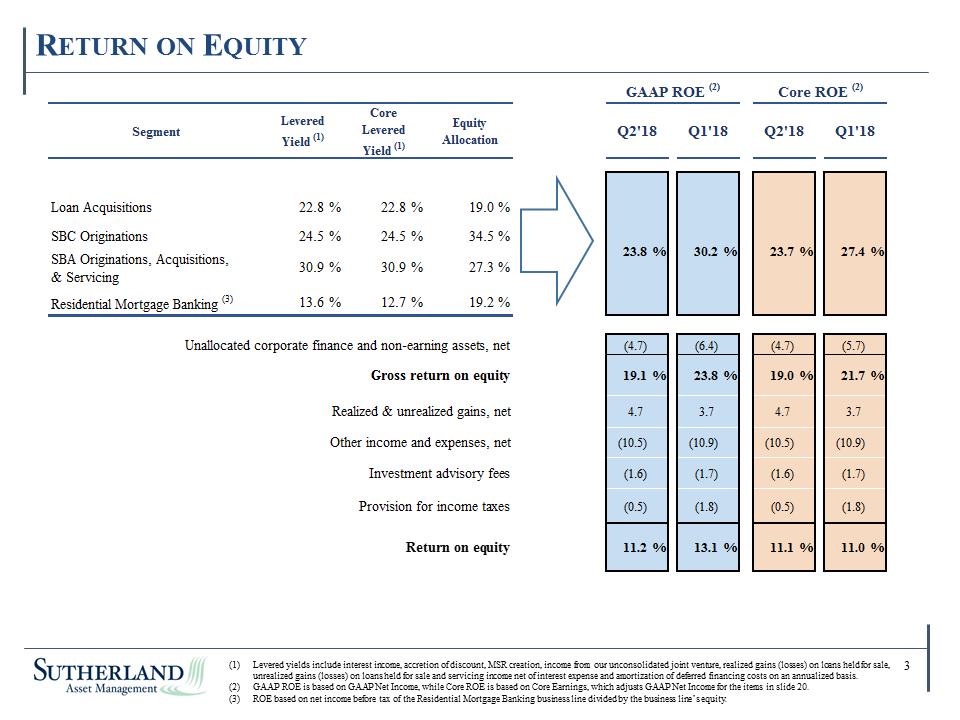
RETURN ON EQUITY (1) Levered yields include interest income, accretion of discount, MSR creation, income from our unconsolidated joint venture, realized gains (losses) on loans held for sale, 3 unrealized gains (losses) on loans held for sale and servicing income net of interest expense and amortization of deferred financing costs on an annualized basis. (2) GAAP ROE is based on GAAP Net Income, while Core ROE is based on Core Earnings, which adjusts GAAP Net Income for the items in slide 20. (3) ROE based on net income before tax of the Residential Mortgage Banking business line divided by the business line’s equity. Segment Loan Acquisitions 22.8 % 22.8 % 19.0 % SBC Originations 24.5 % 24.5 % 34.5 % SBA Originations, Acquisitions, & Servicing 30.9 % 30.9 % 27.3 % Residential Mortgage Banking (3) 13.6 % 12.7 % 19.2 % (4.7) (6.4) (4.7) (5.7) 19.1 % 23.8 % 19.0 % 21.7 % 4.7 3.7 4.7 3.7 (10.5) (10.9) (10.5) (10.9) (1.6) (1.7) (1.6) (1.7) (0.5) (1.8) (0.5) (1.8) 11.2 % 13.1 % 11.1 % 11.0 % 30.2 % Core ROE (2) Q2'18 Q1'18 23.7 % 27.4 % Return on equity Q2'18 GAAP ROE (2) Q1'18 Levered Yield (1) Core Levered Yield (1) Equity Allocation 23.8 % Gross return on equity Realized & unrealized gains, net Other income and expenses, net Investment advisory fees Provision for income taxes Unallocated corporate finance and non-earning assets, net |
|
|
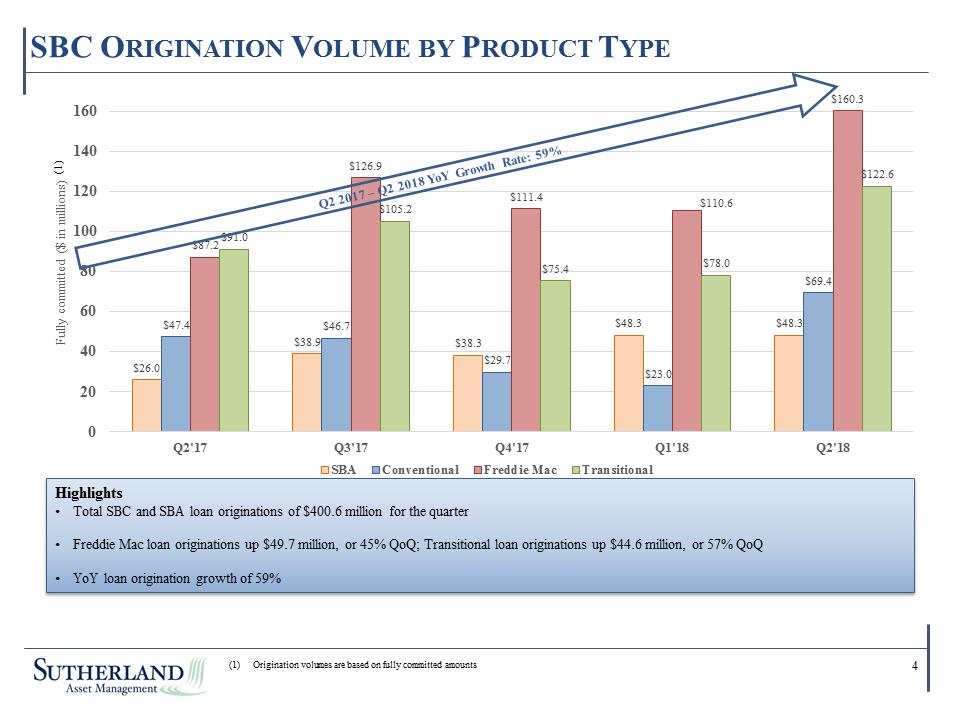
L SBC Origination Volume by Product Type 4 Q2 2017 – Q2 2018 YoY Growth Rate: 59%% Origination volumes are based on fully committed amounts Highlights Total SBC and SBA loan originations of $400.6 million for the quarter Freddie Mac loan originations up $49.7 million, or 45% QoQ; Transitional loan originations up $44.6 million, or 57% QoQ YoY loan origination growth of 59% Check: Page #s (1) SBA Conventional Freddie Mac Transitional Q2'17 25.973 47.39 87.241 90.98 Q3'17 38.861 46.693 126.869 105.238 Q4'17 38.348 29.719 111.383 75.352 Q1'18 48.254 22.983 110.619 77.996 Q2'18 48.33 69.439 160.308 122.604 |
|
|
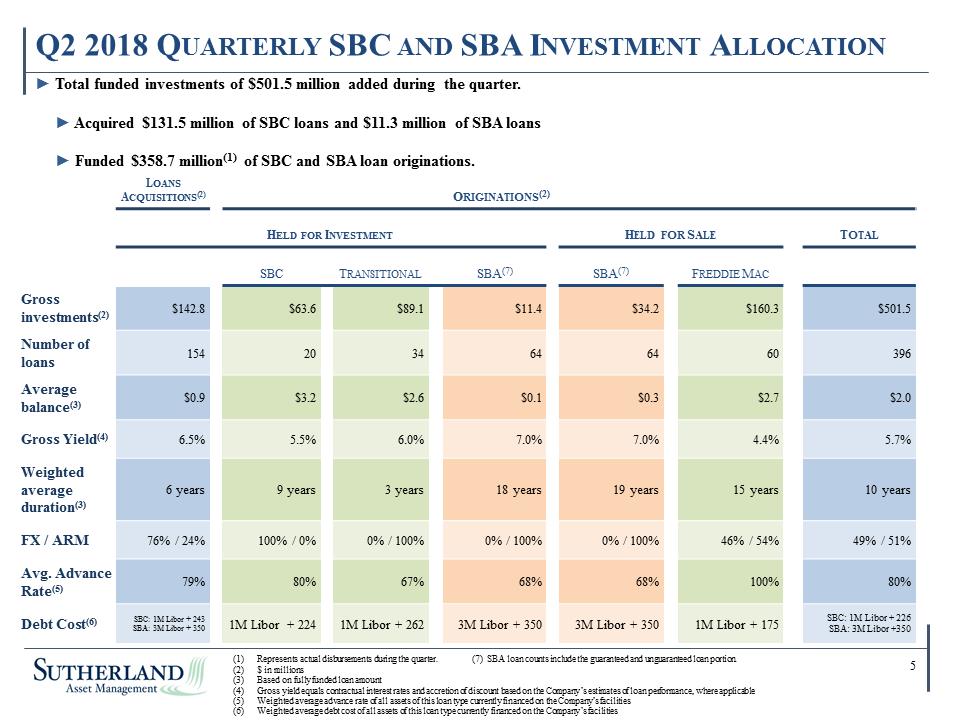
Q2 2018 Quarterly SBC and SBA Investment Allocation Loans Acquisitions(2) Originations(2) Held for Investment Held for Sale Total SBC Transitional SBA(7) SBA(7) Freddie Mac Gross investments(2) $142.8 $63.6 $89.1 $11.4 $34.2 $160.3 $501.5 Number of loans 154 20 34 64 64 60 396 Average balance(3) $0.9 $3.2 $2.6 $0.1 $0.3 $2.7 $2.0 Gross Yield(4) 6.5% 5.5% 6.0% 7.0% 7.0% 4.4% 5.7% Weighted average duration(3) 6 years 9 years 3 years 18 years 19 years 15 years 10 years FX / ARM 76% / 24% 100% / 0% 0% / 100% 0% / 100% 0% / 100% 46% / 54% 49% / 51% Avg. Advance Rate(5) 79% 80% 67% 68% 68% 100% 80% Debt Cost(6) SBC: 1M Libor + 243 SBA: 3M Libor + 350 1M Libor + 224 1M Libor + 262 3M Libor + 350 3M Libor + 350 1M Libor + 175 SBC: 1M Libor + 226 SBA: 3M Libor +350 $ in millions Represents actual disbursements during the quarter. Based on fully funded loan amount Gross yield equals contractual interest rates and accretion of discount based on the Company’s estimates of loan performance, where applicable Weighted average advance rate of all assets of this loan type currently financed on the Company’s facilities Weighted average debt cost of all assets of this loan type currently financed on the Company’s facilities 5 Check: Page #s Total funded investments of $501.5 million added during the quarter. Acquired $131.5 million of SBC loans and $11.3 million of SBA loans Funded $358.7 million(1) of SBC and SBA loan originations. Represents actual disbursements during the quarter. $ in millions Based on fully funded loan amount Gross yield equals contractual interest rates and accretion of discount based on the Company’s estimates of loan performance, where applicable Weighted average advance rate of all assets of this loan type currently financed on the Company’s facilities Weighted average debt cost of all assets of this loan type currently financed on the Company’s facilities (7) SBA loan counts include the guaranteed and unguaranteed loan portion. |
|
|
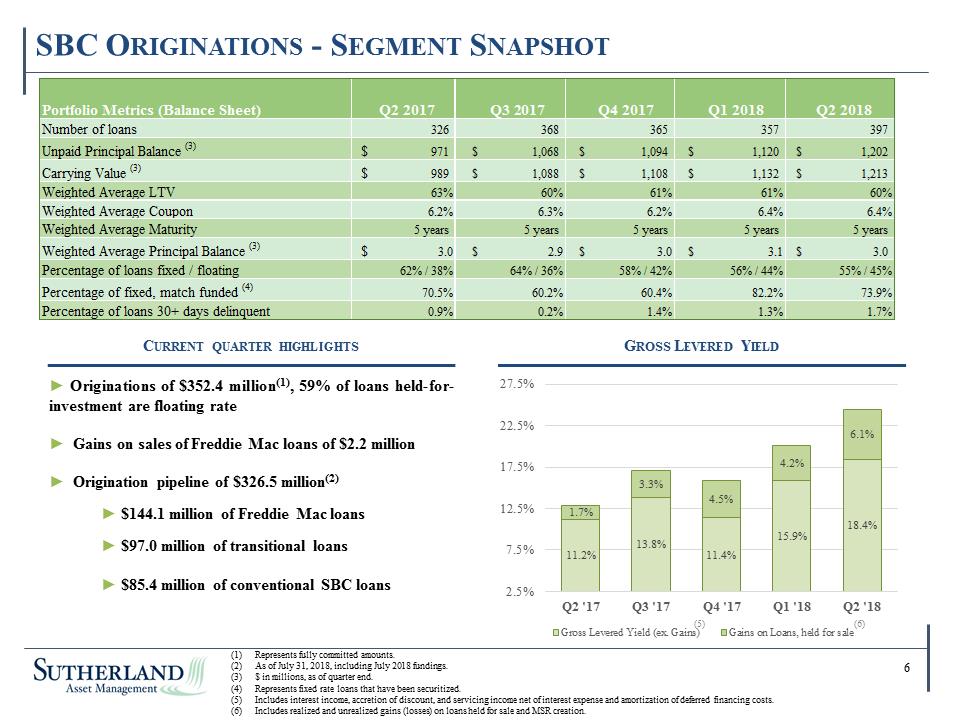
SBC ORIGINATIONS - SEGMENT SNAPSHOT Portfolio Metrics (Balance Sheet) Number of loans 326 368 365 357 397 Unpaid Principal Balance (3) $ 971 $ 1,068 $ 1,094 $ 1,120 $ 1,202 Carrying Value (3) $ 989 $ 1,088 $ 1,108 $ 1,132 $ 1,213 Weighted Average LTV 63% 60% 61% 61% 60% Weighted Average Coupon 6.2% 6.3% 6.2% 6.4% 6.4% Weighted Average Maturity 5 years 5 years 5 years 5 years 5 years Weighted Average Principal Balance (3) $ 3.0 $ 2.9 $ 3.0 $ 3.1 $ 3.0 Percentage of loans fixed / floating 62% / 38% 64% / 36% 58% / 42% 56% / 44% 55% / 45% Percentage of fixed, match funded (4) 70.5% 60.2% 60.4% 82.2% 73.9% Percentage of loans 30+ days delinquent 0.9% 0.2% 1.4% 1.3% 1.7% Q2 2017 Q3 2017 Q4 2017 Q1 2018 Q2 2018 CURRENT QUARTER HIGHLIGHTS GROSS LEVERED YIELD Originations of $352.4 million(1), 59% of loans held-forinvestment are floating rate Gains on sales of Freddie Mac loans of $2.2 million Origination pipeline of $326.5 million(2) $144.1 million of Freddie Mac loans $97.0 million of transitional loans $85.4 million of conventional SBC loans 11.2% 13.8% 11.4% 15.9% 18.4% 1.7% 3.3% 4.5% 4.2% 6.1% 2.5% 7.5% 12.5% 17.5% 22.5% 27.5% Q2 '17 Q3 '17 Q4 '17 Q1 '18 Q2 '18 Gross Levered Yield (ex. Gains)(5) Gains on Loans, held for sale(6) (1) Represents fully committed amounts. (2) As of July 31, 2018, including July 2018 fundings. (3) $ in millions, as of quarter end. (4) Represents fixed rate loans that have been securitized. (5) Includes interest income, accretion of discount, and servicing income net of interest expense and amortization of deferred financing costs. (6) Includes realized and unrealized gains (losses) on loans held for sale and MSR creation. 6 |
|
|
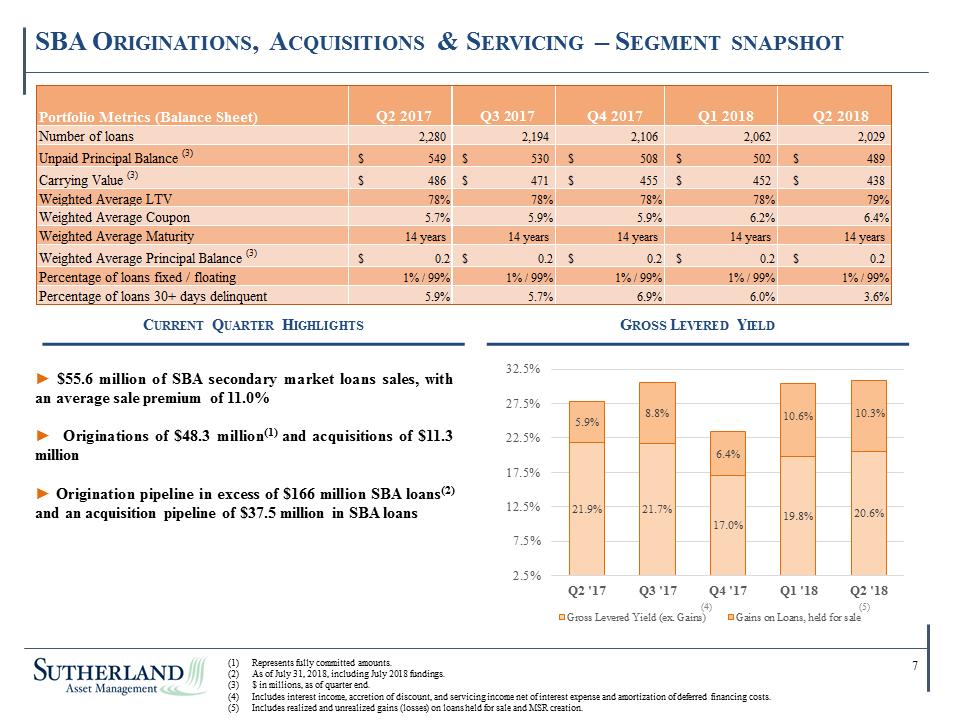
SBA Originations, Acquisitions & Servicing – Segment snapshot Current Quarter Highlights Gross Levered Yield Represents fully committed amounts. As of July 31, 2018, including July 2018 fundings. $ in millions, as of quarter end. Includes interest income, accretion of discount, and servicing income net of interest expense and amortization of deferred financing costs. Includes realized and unrealized gains (losses) on loans held for sale and MSR creation. $55.6 million of SBA secondary market loans sales, with an average sale premium of 11.0% Originations of $48.3 million(1) and acquisitions of $11.3 million Origination pipeline in excess of $166 million SBA loans(2) and an acquisition pipeline of $37.5 million in SBA loans Check: Page #s 7 (5) (4) 21.9% 21.7% 17.0% 19.8% 20.6% 5.9% 8.8% 6.4% 10.6% 10.3% 2.5% 7.5% 12.5% 17.5% 22.5% 27.5% 32.5% Q2 '17 Q3 '17 Q4 '17 Q1 '18 Q2 '18 Gross Levered Yield (ex. Gains) Gains on Loans, held for sale Portfolio Metrics (Balance Sheet)Number of loans2,280 2,194 2,106 2,062 2,029 Unpaid Principal Balance (3)$549 $530 $508 $502 $489 Carrying Value (3)$486 $471 $455 $452 $438 Weighted Average LTV78%78%78%78%79%Weighted Average Coupon5.7%5.9%5.9%6.2%6.4%Weighted Average Maturity14 years14 years14 years14 years14 yearsWeighted Average Principal Balance (3)$0.2$0.2$0.2$0.2$0.2 Percentage of loans fixed / floating1% / 99%1% / 99%1% / 99%1% / 99%1% / 99%Percentage of loans 30+ days delinquent5.9%5.7%6.9%6.0%3.6%Q2 2017Q3 2017Q4 2017Q1 2018Q2 2018 |
|
|
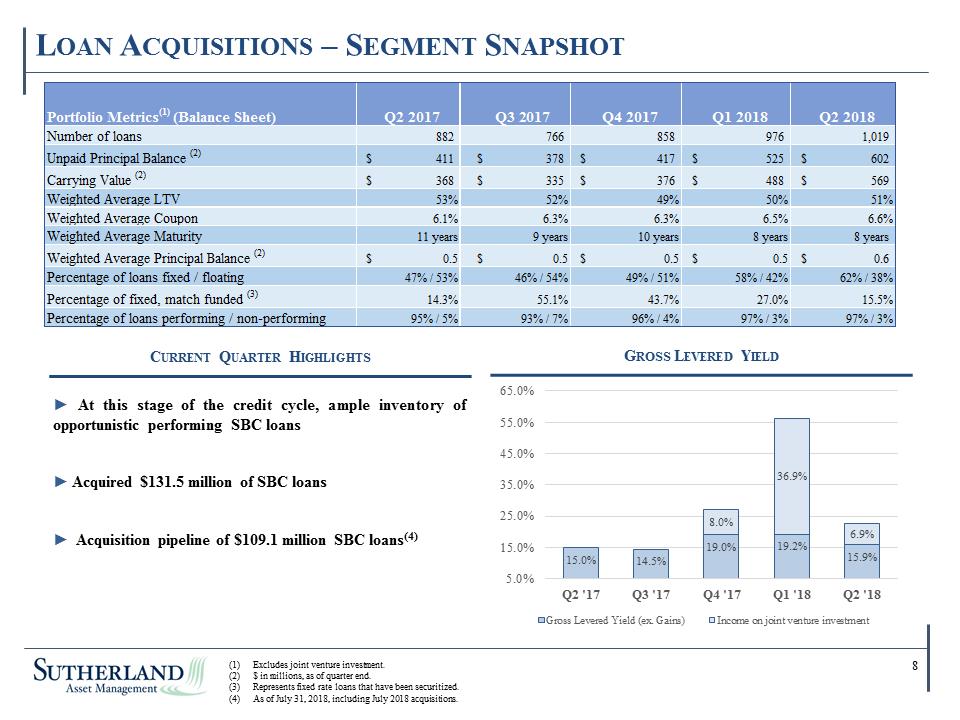
LOAN ACQUISITIONS – SEGMENT SNAPSHOT Portfolio Metrics(1) (Balance Sheet) Number of loans 882 766 858 976 1,019 Unpaid Principal Balance (2) $ 411 $ 378 $ 417 $ 525 $ 602 Carrying Value (2) $ 368 $ 335 $ 376 $ 488 $ 569 Weighted Average LTV 53% 52% 49% 50% 51% Weighted Average Coupon 6.1% 6.3% 6.3% 6.5% 6.6% Weighted Average Maturity 11 years 9 years 10 years 8 years 8 years Weighted Average Principal Balance (2) $ 0.5 $ 0.5 $ 0.5 $ 0.5 $ 0.6 Percentage of loans fixed / floating 47% / 53% 46% / 54% 49% / 51% 58% / 42% 62% / 38% Percentage of fixed, match funded (3) 14.3% 55.1% 43.7% 27.0% 15.5% Percentage of loans performing / non-performing 95% / 5% 93% / 7% 96% / 4% 97% / 3% 97% / 3% Q2 2017 Q3 2017 Q4 2017 Q1 2018 Q2 2018 CURRENT QUARTER HIGHLIGHTS GROSS LEVERED YIELD 15.0% 14.5% 19.0% 19.2% 15.9% 8.0% 36.9% 6.9% 5.0% 15.0% 25.0% 35.0% 45.0% 55.0% 65.0% Q2 '17 Q3 '17 Q4 '17 Q1 '18 Q2 '18 Gross Levered Yield (ex. Gains) Income on joint venture investment At this stage of the credit cycle, ample inventory of opportunistic performing SBC loans Acquired $131.5 million of SBC loans Acquisition pipeline of $109.1 million SBC loans(4) (1) Excludes joint venture investment. (2) $ in millions, as of quarter end. (3) Represents fixed rate loans that have been securitized. (4) As of July 31, 2018, including July 2018 acquisitions. 8 |
|
|
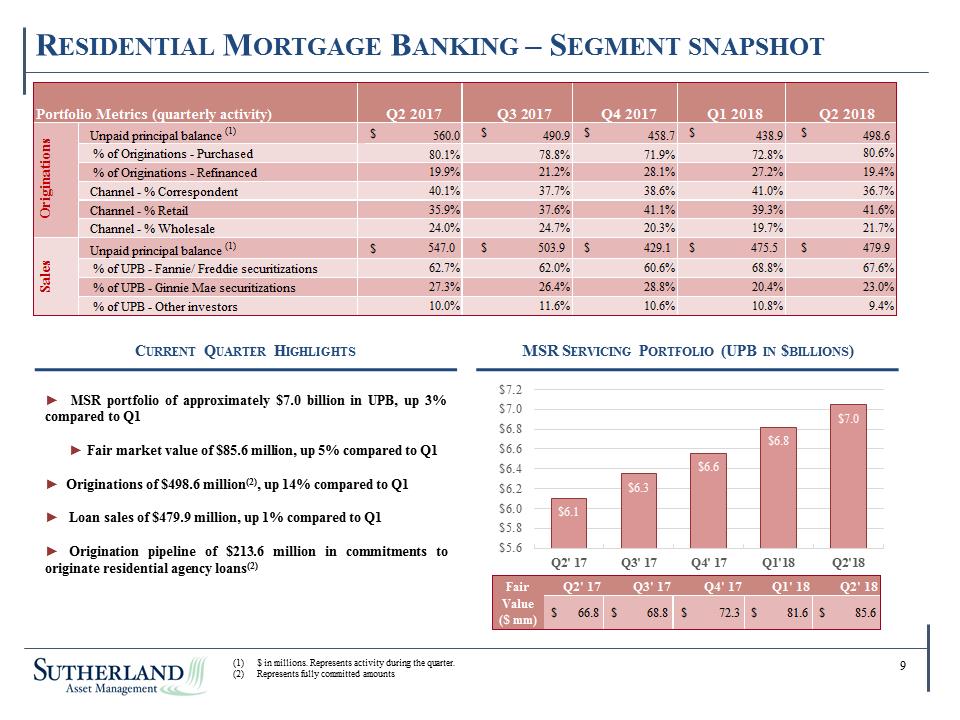
Residential Mortgage Banking – Segment snapshot Current Quarter Highlights MSR Servicing Portfolio (UPB in $billions) MSR portfolio of approximately $7.0 billion in UPB, up 3% compared to Q1 Fair market value of $85.6 million, up 5% compared to Q1 Originations of $498.6 million(2), up 14% compared to Q1 Loan sales of $479.9 million, up 1% compared to Q1 Origination pipeline of $213.6 million in commitments to originate residential agency loans(2) $ in millions. Represents activity during the quarter. Represents fully committed amounts Check: Page #s 9 $6.1 $6.3 $6.6 $6.8 $7.0 $5.6 $5.8 $6.0 $6.2 $6.4 $6.6 $6.8 $7.0 $7.2 Q2' 17 Q3' 17 Q4' 17 Q1'18 Q2'18 Portfolio Metrics (quarterly activity) Unpaid principal balance (1) $ 560.0 $ 490.9 $ 458.7 $ 438.9 $ 498.6 % of Originations - Purchased 80.1% 78.8% 71.9% 72.8% 80.6% % of Originations - Refinanced 19.9% 21.2% 28.1% 27.2% 19.4% Channel - % Correspondent 40.1% 37.7% 38.6% 41.0% 36.7% Channel - % Retail 35.9% 37.6% 41.1% 39.3% 41.6% Channel - % Wholesale 24.0% 24.7% 20.3% 19.7% 21.7% Unpaid principal balance (1) $ 547.0 $ 503.9 $ 429.1 $ 475.5 $ 479.9 % of UPB - Fannie/ Freddie securitizations 62.7% 62.0% 60.6% 68.8% 67.6% % of UPB - Ginnie Mae securitizations 27.3% 26.4% 28.8% 20.4% 23.0% % of UPB - Other investors 10.0% 11.6% 10.6% 10.8% 9.4% Sales Originations Q2 2017 Q3 2017 Q4 2017 Q1 2018 Q2 2018 |
|
|
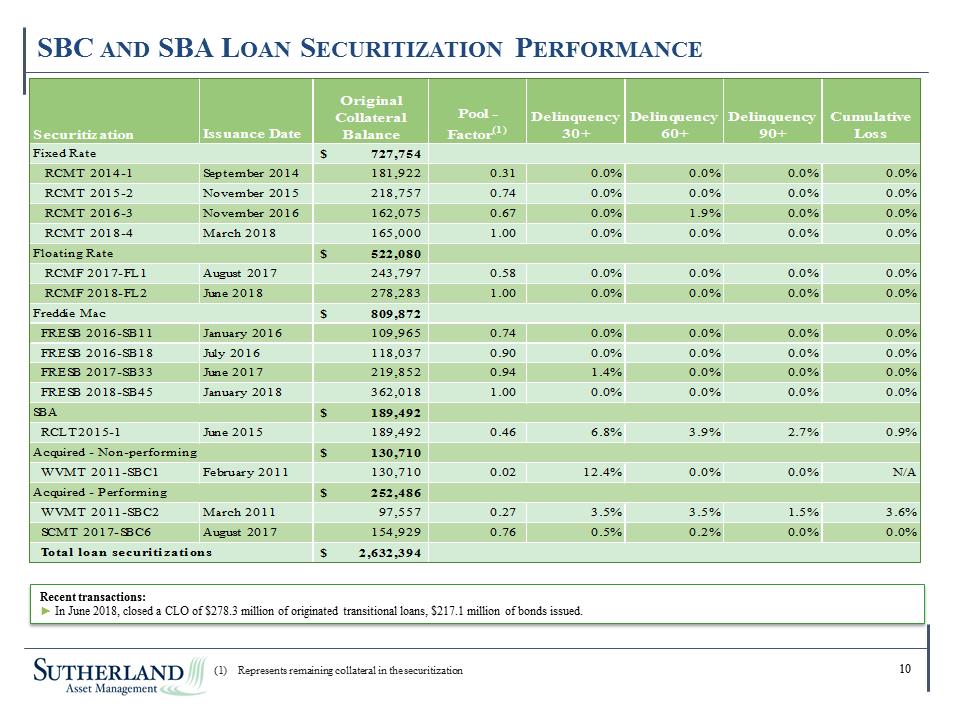
P SBC and SBA Loan Securitization Performance Recent transactions: In June 2018, closed a CLO of $278.3 million of originated transitional loans, $217.1 million of bonds issued. 10 Represents remaining collateral in the securitization CumulativeLossFixed Rate $ 727,754 RCMT 2014-1September 2014 181,922 0.31 0.0%0.0%0.0%0.0% RCMT 2015-2November 2015 218,757 0.74 0.0%0.0%0.0%0.0% RCMT 2016-3November 2016 162,075 0.67 0.0%1.9%0.0%0.0% RCMT 2018-4March 2018 165,000 1.00 0.0%0.0%0.0%0.0% $ 522,080 RCMF 2017-FL1August 2017 243,797 0.58 0.0%0.0%0.0%0.0% RCMF 2018-FL2June 2018 278,283 1.00 0.0%0.0%0.0%0.0%Freddie Mac $ 809,872 FRESB 2016-SB11January 2016 109,965 0.74 0.0%0.0%0.0%0.0% FRESB 2016-SB18July 2016 118,037 0.90 0.0%0.0%0.0%0.0% FRESB 2017-SB33June 2017 219,852 0.94 1.4%0.0%0.0%0.0% FRESB 2018-SB45January 2018 362,018 1.00 0.0%0.0%0.0%0.0% $ 189,492 RCLT2015-1June 2015 189,492 0.46 6.8%3.9%2.7%0.9% $ 130,710 WVMT 2011-SBC1February 2011 130,710 0.02 12.4%0.0%0.0%N/A $ 252,486 WVMT 2011-SBC2March 2011 97,557 0.27 3.5%3.5%1.5%3.6% SCMT 2017-SBC6August 2017 154,929 0.76 0.5%0.2%0.0%0.0% $ 2,632,394 Total loan securitizations Securitization Original Collateral BalancePool - Factor(1)Floating RateSBAAcquired - Non-performingAcquired Issuance DateDelinquency 30+Delinquency 60+Delinquency 90+ |
|
|
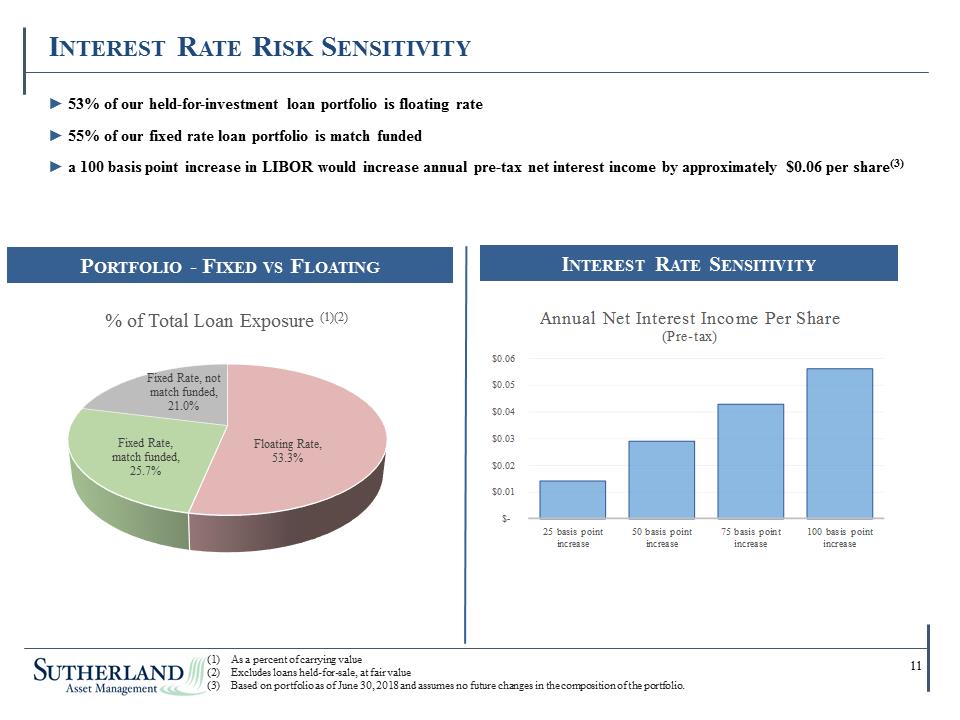
53% of our held-for-investment loan portfolio is floating rate 55% of our fixed rate loan portfolio is match funded a 100 basis point increase in LIBOR would increase annual pre-tax net interest income by approximately $0.06 per share(3) As a percent of carrying value Excludes loans held-for-sale, at fair value Based on portfolio as of June 30, 2018 and assumes no future changes in the composition of the portfolio. Interest Rate Risk Sensitivity Interest Rate Sensitivity Portfolio - Fixed vs Floating 11 Floating Rate , 53.3% Fixed Rate, match funded , 25.7% Fixed Rate, not match funded , 21.0% % of Total Loan Exposure (1)(2) |
|
|
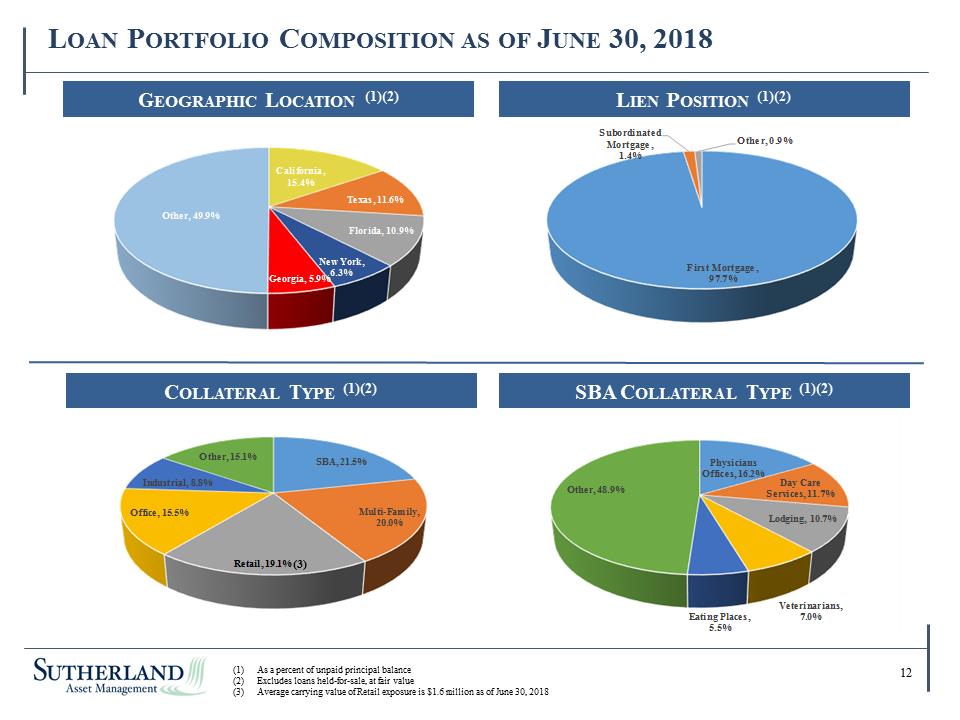
Loan Portfolio Composition as of June 30, 2018 Geographic Location (1)(2) Collateral Type (1)(2) SBA Collateral Type (1)(2) As a percent of unpaid principal balance Excludes loans held-for-sale, at fair value Average carrying value of Retail exposure is $1.6 million as of June 30, 2018 Lien Position (1)(2) (3) 12 Check: Page #s (3) California, 15.4% Texas, 11.6% Florida, 10.9% New York, 6.3% Georgia, 5.9% Other, 49.9% Subordinated Mortgage, 1.4% Other, 0.9% First Mortgage, 97.7% GEOGRAPHIC LOCATION (1)(2) LIEN POSITION (1)(2) COLLATERAL TYPE (1)(2) SBA COLLATERAL TYPE (1)(2) BA, 21.5% Multi-Family, 20.0% Retail, 19.1% Office, 15.5% Industrial, 8.8% Other, 15.1% Physicians Offices, 16.2% Day Care Services, 11.7% Lodging, 10.7% Other, 48.9% Veterinarians, Eating Places, 7.0% 5.5% |
|
|
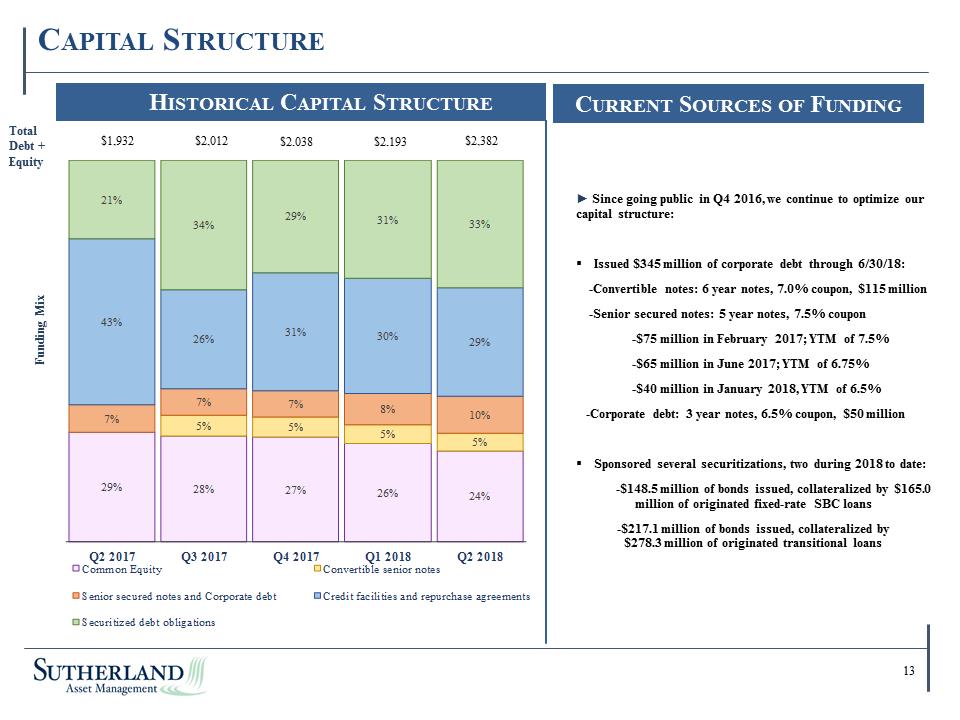
CAPITAL STRUCTURE HISTORICAL CAPITAL STRUCTURE Total Debt + Equity $1,932 $2,012 $2,038 $2,193 $2,382 21% 34% 29% 31% 33% 43% 26% 31% 30% 29% 7% 7% 7% 8% 10% 5% 5% 5% 5% Since going public in Q4 2016, we continue to optimize our capital structure: Issued $345 million of corporate debt through 6/30/18: -Convertible notes: 6 year notes, 7.0% coupon, $115 million -Senior secured notes: 5 year notes, 7.5% coupon -$75 million in February 2017; YTM of 7.5% -$65 million in June 2017; YTM of 6.75% -$40 million in January 2018, YTM of 6.5% -Corporate debt: 3 year notes, 6.5% coupon, $50 million Sponsored several securitizations, two during 2018 to date: -$148.5 million of bonds issued, collateralized by $165.0 million of originated fixed-rate SBC loans -$217.1 million of bonds issued, collateralized by $278.3 million of originated transitional loans CURRENT SOURCES OF FUNDING $1,932 $2,012 $2,038 $2,193 $2,382 Total Debt + Equity Funding Mix 29% 28% 27% 26% 24% Q2 2017 Q3 2017 Q4 2017 Q1 2018 Q2 2018 Common Equity Convertible senior notes Senior secured notes and Corporate debt Credit facilities and repurchase agreements Securitized debt obligations 13 |
|
|
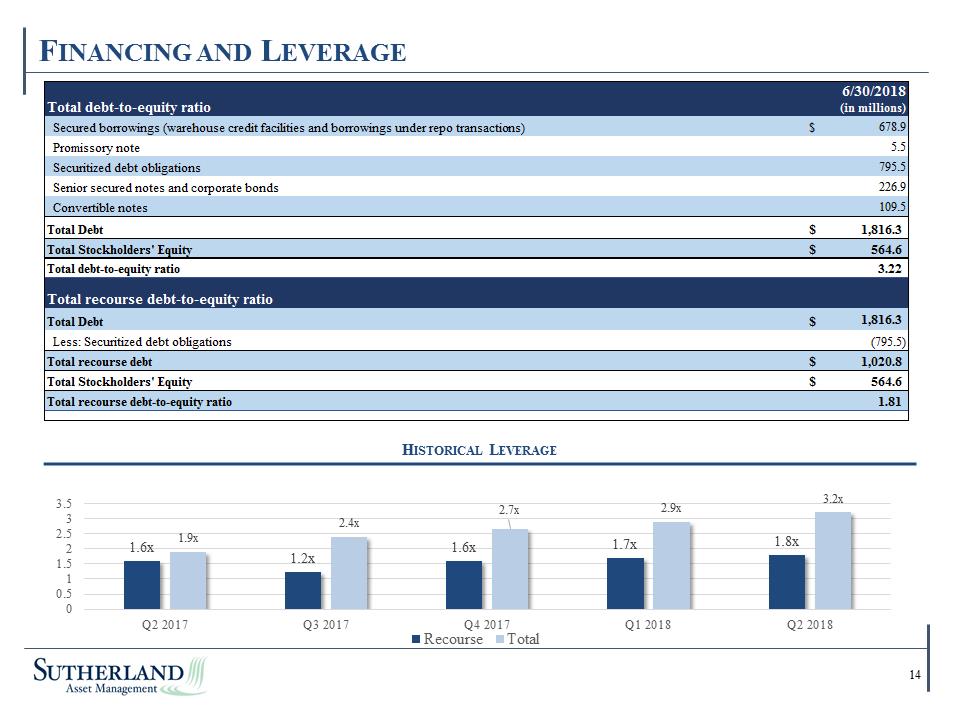
Financing and Leverage Historical Leverage 14 Check: Page #s 1.6x 1.2x 1.6x 1.7x 1.8x 1.9x 2.4x 2.7x 2.9x 3.2x 0 0.5 1 1.5 2 2.5 3 3.5 Q2 2017 Q3 2017 Q4 2017 Q1 2018 Q2 2018 Recourse Total Total debt-to-equity ratio Secured borrowings (warehouse credit facilities and borrowings under repo transactions)$678.9 Promissory note5.5 Securitized debt obligations795.5 Senior secured notes and corporate bonds226.9 Convertible notes109.5Total Debt$1,816.3 Total Stockholders' Equity$564.6 Total debt-to-equity ratio3.22 Total recourse debt-to-equity ratioTotal Debt$1,816.3 Less: Securitized debt obligations(795.5)Total recourse debt$1,020.8 Total Stockholders' Equity$564.6 Total recourse debt-to-equity ratio1.81 6/30/2018(in millions) |
|
|
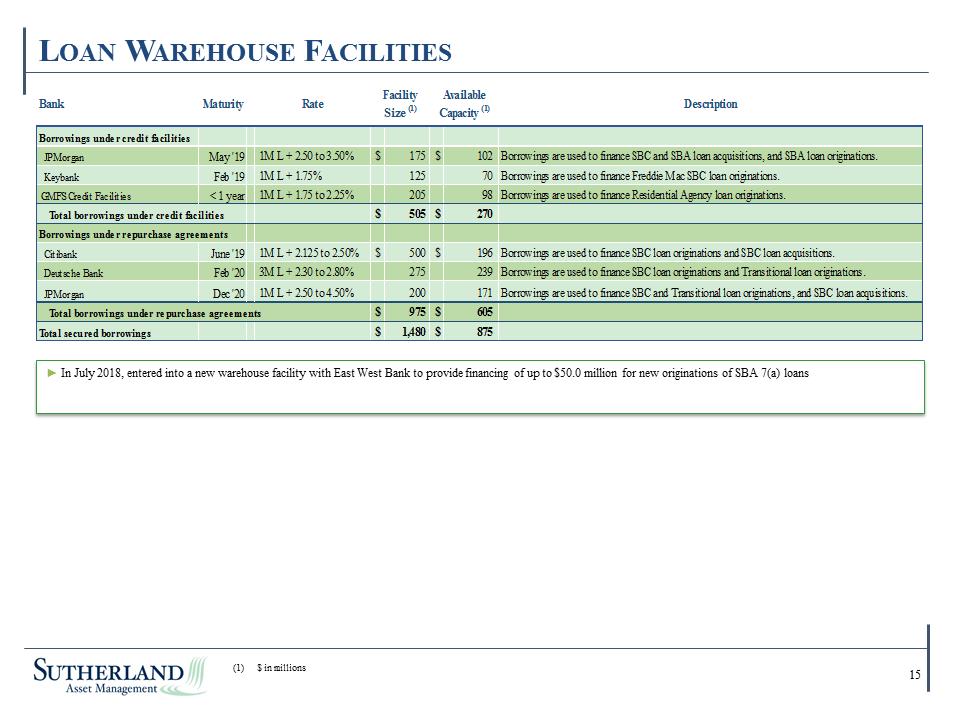
Loan Warehouse Facilities 15 Check: Page #s $ in millions In July 2018, entered into a new warehouse facility with East West Bank to provide financing of up to $50.0 million for new originations of SBA 7(a) loans Bank Maturity Rate Description Borrowings under credi t faci l i ties JPMorgan May '19 1M L + 2.50 to 3.50% $ 175 $ 102 Borrowings are used to finance SBC and SBA loan acquisitions, and SBA loan originations. Keybank Feb '19 1M L + 1.75% 125 70 Borrowings are used to finance Freddie Mac SBC loan originations. GMFS Credit Facilities < 1 year 1M L + 1.75 to 2.25% 205 98 Borrowings are used to finance Residential Agency loan originations. Total borrowings under credi t faci l i ties $ 505 $ 270 Borrowings under repurchase agreements Citibank June '19 1M L + 2.125 to 2.50% $ 500 $ 196 Borrowings are used to finance SBC loan originations and SBC loan acquisitions. Deutsche Bank Feb '20 3M L + 2.30 to 2.80% 275 239 Borrowings are used to finance SBC loan originations and Transitional loan originations. JPMorgan Dec '20 1M L + 2.50 to 4.50% 200 171 Borrowings are used to finance SBC and Transitional loan originations, and SBC loan acquisitions. Total borrowings under repurchase agreements $ 975 $ 605 Total secured borrowings $ 1,480 $ 875 Available Capacity (1) Facility Size (1) In July 2018, entered into a new warehouse facility with East West Bank to provide financing of up to $50.0 million for new originations of SBA 7(a) loans |
|
|
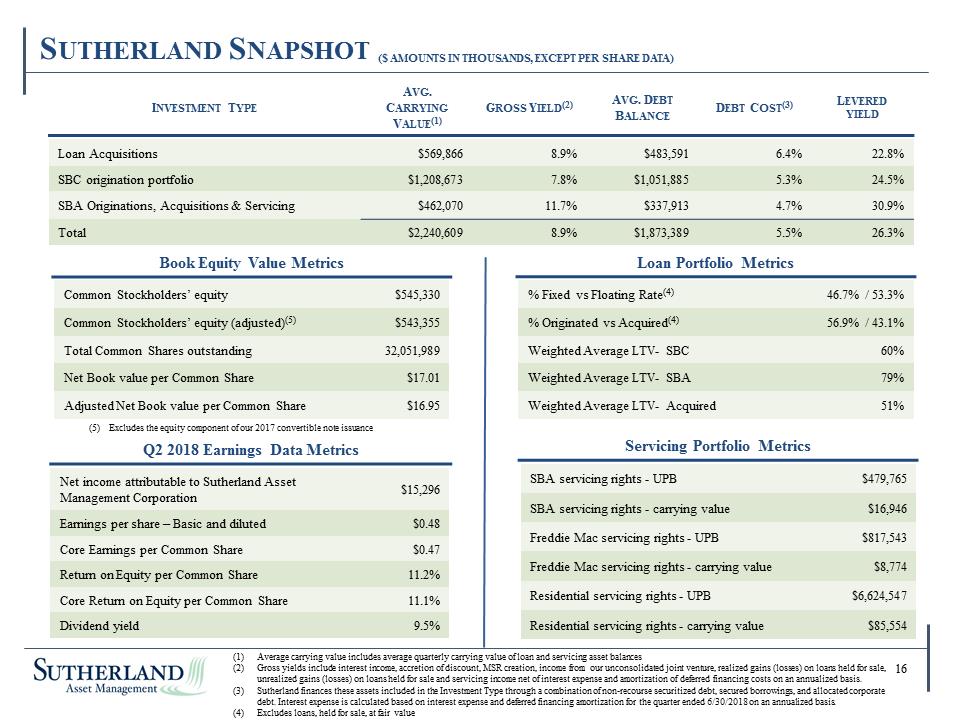
SUTHERLAND SNAPSHOT ($ AMOUNTS IN THOUSANDS, EXCEPT PER SHARE DATA) INVESTMENT TYPE AVG. CARRYING VALUE(1) GROSS YIELD(2) AVG. DEBT BALANCE DEBT COST(3) LEVERED YIELD Loan Acquisitions $569,866 8.9% $483,591 6.4% 22.8% SBC origination portfolio $1,208,673 7.8% $1,051,885 5.3% 24.5% SBA Originations, Acquisitions & Servicing $462,070 11.7% $337,913 4.7% 30.9% Total $2,240,609 8.9% $1,873,389 5.5% 26.3% Book Equity Value Metrics Q2 2018 Earnings Data Metrics (1) Average carrying value includes average quarterly carrying value of loan and servicing asset balances (2) Gross yields include interest income, accretion of discount, MSR creation, income from our unconsolidated joint venture, realized gains (losses) on loans held for sale, unrealized gains (losses) on loans held for sale and servicing income net of interest expense and amortization of deferred financing costs on an annualized basis. (3) Sutherland finances these assets included in the Investment Type through a combination of non-recourse securitized debt, secured borrowings, and allocated corporate debt. Interest expense is calculated based on interest expense and deferred financing amortization for the quarter ended 6/30/2018 on an annualized basis. (4) Excludes loans, held for sale, at fair value Common Stockholders’ equity $545,330 Common Stockholders’ equity (adjusted)(5) $543,355 Total Common Shares outstanding 32,051,989 Net Book value per Common Share $17.01 Adjusted Net Book value per Common Share $16.95 (5) Excludes the equity component of our 2017 convertible note issuance Net income attributable to Sutherland Asset Management Corporation $15,296 Earnings per share – Basic and diluted $0.48 Core Earnings per Common Share $0.47 Return on Equity per Common Share 11.2% Core Return on Equity per Common Share 11.1% Dividend yield 9.5% Loan Portfolio Metrics % Fixed vs Floating Rate(4) 46.7% / 53.3% % Originated vs Acquired(4) 56.9% / 43.1% Weighted Average LTV- SBC 60% Weighted Average LTV- SBA 79% Weighted Average LTV- Acquired 51% Servicing Portfolio Metrics SBA servicing rights - UPB $479,765 SBA servicing rights - carrying value $16,946 Freddie Mac servicing rights - UPB $817,543 Freddie Mac servicing rights - carrying value $8,774 Residential servicing rights - UPB $6,624,547 Residential servicing rights - carrying value $85,554 16 |
|
|
Appendix |
|
|
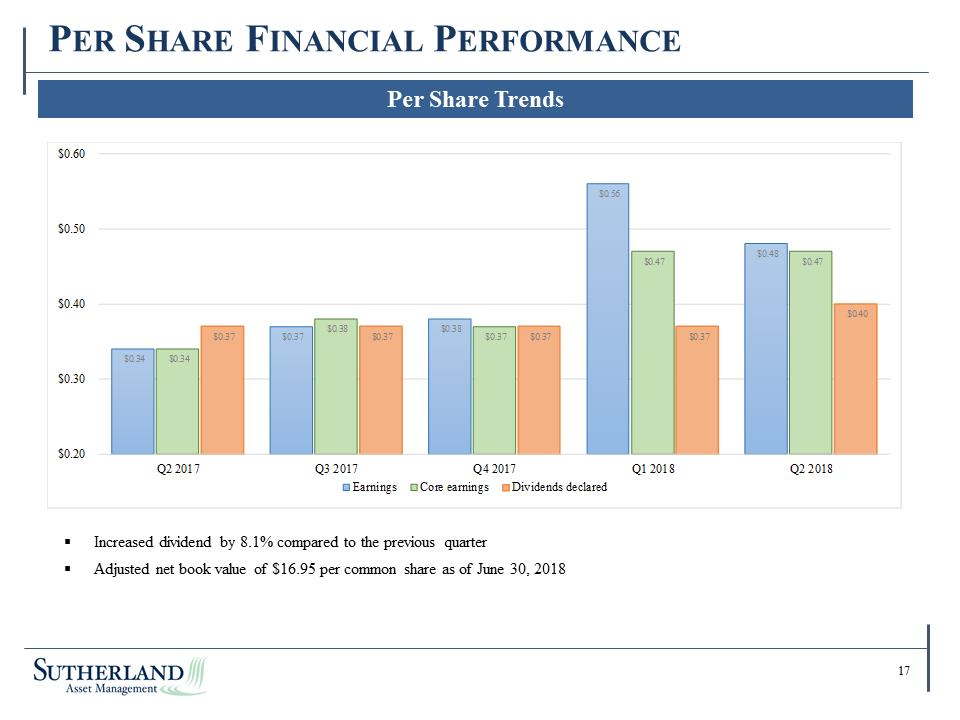
Per Share Financial Performance Per Share Trends Increased dividend by 8.1% compared to the previous quarter Adjusted net book value of $16.95 per common share as of June 30, 2018 17 Check: Page #s $0.34 $0.37 $0.38 $0.56 $0.48 $0.34 $0.38 $0.37 $0.47 $0.47 $0.37 $0.37 $0.37 $0.37 $0.40 0.60Q2 2017Q3 2017Q4 2017Q1 2018Q2 2018EarningsCore earningsDividends declared $0.20 $0.30 $0.40 $0.50 Increased dividend by 8.1% compared to the previous quarter Adjusted net book value of $16.95 per common share as of June 30, 2018 |
|
|
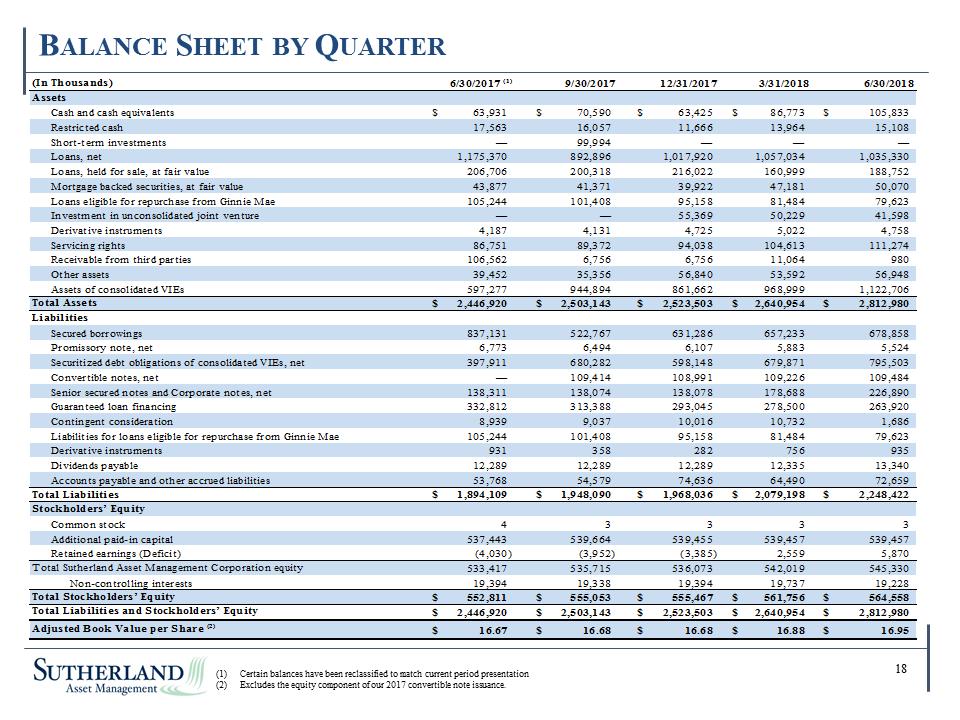
Balance Sheet by Quarter Certain balances have been reclassified to match current period presentation Excludes the equity component of our 2017 convertible note issuance. 18 Check: Page #s (In Thousands)AssetsCash and cash equivalents$63,931 $70,590 $63,425 $86,773 $105,833 Restricted cash 17,563 16,057 11,666 13,964 15,108 Short-term investments — 99,994 — — — Loans, net 1,175,370 892,896 1,017,920 1,057,034 1,035,330 Loans, held for sale, at fair value 206,706 200,318 216,022 160,999 188,752 Mortgage backed securities, at fair value 43,877 41,371 39,922 47,181 50,070 Loans eligible for repurchase from Ginnie Mae105,244 101,408 95,158 81,484 79,623 Investment in unconsolidated joint venture— — 55,369 50,229 41,598 Derivative instruments 4,187 4,131 4,725 5,022 4,758 Servicing rights 86,751 89,372 94,038 104,613 111,274 Receivable from third parties 106,562 6,756 6,756 11,064 980 Other assets 39,452 35,356 56,840 53,592 56,948 Assets of consolidated VIEs597,277 944,894 861,662 968,999 1,122,706 Total Assets$2,446,920 $2,503,143 $2,523,503 $2,640,954 $2,812,980 LiabilitiesSecured borrowings 837,131 522,767 631,286 657,233 678,858 Promissory note, net6,773 6,494 6,107 5,883 5,524 Securitized debt obligations of consolidated VIEs, net 397,911 680,282 598,148 679,871 795,503 Convertible notes, net— 109,414 108,991 109,226 109,484 Senior secured notes and Corporate notes, net 138,311 138,074 138,078 178,688 226,890 Guaranteed loan financing 332,812 313,388 293,045 278,500 263,920 Contingent consideration8,939 9,037 10,016 10,732 1,686 Liabilities for loans eligible for repurchase from Ginnie Mae105,244 101,408 95,158 81,484 79,623 Derivative instruments 931 358 282 756 935 Dividends payable 12,289 12,289 12,289 12,335 13,340 Accounts payable and other accrued liabilities 53,768 54,579 74,636 64,490 72,659 Total Liabilities$1,894,109 $1,948,090 $1,968,036 $2,079,198 $2,248,422 Stockholders’ EquityCommon stock 4 3 3 3 3 Additional paid-in capital 537,443 539,664 539,455 539,457 539,457 Retained earnings (Deficit) (4,030) (3,952) (3,385) 2,559 5,870 Total Sutherland Asset Management Corporation equity 533,417 535,715 536,073 542,019 545,330 Non-controlling interests 19,394 19,338 19,394 19,737 19,228 Total Stockholders’ Equity$552,811 $555,053 $555,467 $561,756 $564,558 Total Liabilities and Stockholders’ Equity$2,446,920 $2,503,143 $2,523,503 $2,640,954 $2,812,980 Adjusted Book Value per Share (2)$16.67 $16.68 $16.68 $16.88 $16.95 6/30/2017 (1)9/30/201712/31/20173/31/2018 6/30/2018 |
|
|
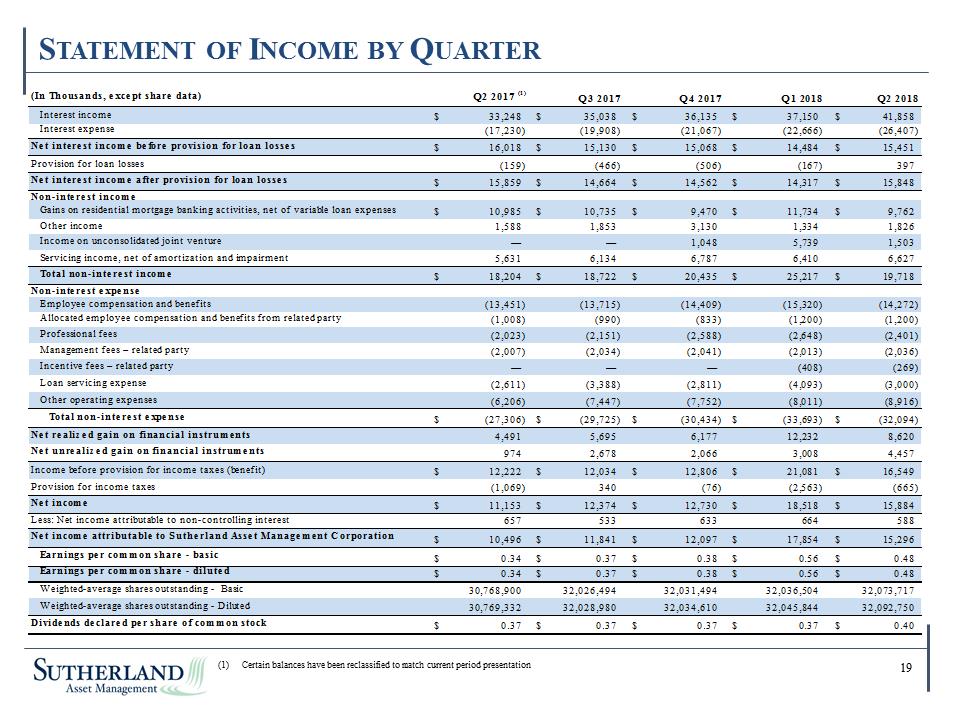
Statement of Income by Quarter Certain balances have been reclassified to match current period presentation 19 Check: Page #s (In Thousands, except share data)Interest income$33,248 $35,038 $36,135 $37,150 $41,858 Interest expense (17,230) (19,908) (21,067) (22,666) (26,407) Net interest income before provision for loan losses$16,018 $15,130 $15,068 $14,484 $15,451 Provision for loan losses (159) (466) (506) (167) 397 Net interest income after provision for loan losses$15,859 $14,664 $14,562 $14,317 $15,848 Non-interest incomeGains on residential mortgage banking activities, net of variable loan expenses$10,985 $10,735 $9,470 $11,734 $9,762 Other income 1,588 1,853 3,130 1,334 1,826 Income on unconsolidated joint venture— — 1,048 5,739 1,503 Servicing income, net of amortization and impairment 5,631 6,134 6,787 6,410 6,627 Total non-interest income$18,204 $18,722 $20,435 $25,217 $19,718 Non-interest expenseEmployee compensation and benefits (13,451) (13,715) (14,409) (15,320) (14,272) Allocated employee compensation and benefits from related party (1,008) (990) (833) (1,200) (1,200) Professional fees (2,023) (2,151) (2,588) (2,648) (2,401) Management fees – related party (2,007) (2,034) (2,041) (2,013) (2,036) Incentive fees – related party — — — (408) (269) Loan servicing expense (2,611) (3,388) (2,811) (4,093) (3,000) Other operating expenses (6,206) (7,447) (7,752) (8,011) (8,916) Total non-interest expense$(27,306) $(29,725) $(30,434) $(33,693) $(32,094) Net realized gain on financial instruments4,491 5,695 6,177 12,232 8,620 Net unrealized gain on financial instruments974 2,678 2,066 3,008 4,457 Income before provision for income taxes (benefit)$12,222 $12,034 $12,806 $21,081 $16,549 Provision for income taxes (1,069) 340 (76) (2,563) (665) Net income $11,153 $12,374 $12,730 $18,518 $15,884 Less: Net income attributable to non-controlling interest 657 533 633 664 588 Net income attributable to Sutherland Asset Management Corporation$10,496 $11,841 $12,097 $17,854 $15,296 Earnings per common share - basic$0.34 $0.37 $0.38 $0.56 $0.48 Earnings per common share - diluted$0.34 $0.37 $0.38 $0.56 $0.48 Weighted-average shares outstanding - Basic30,768,900 32,026,494 32,031,494 32,036,504 32,073,717 Weighted-average shares outstanding - Diluted30,769,332 32,028,980 32,034,610 32,045,844 32,092,750 Dividends declared per share of common stock$0.37 $0.37 $0.37 $0.37 $0.40 Q2 2017 (1)Q3 2017Q4 2017Q1 2018Q2 2018 |
|
|
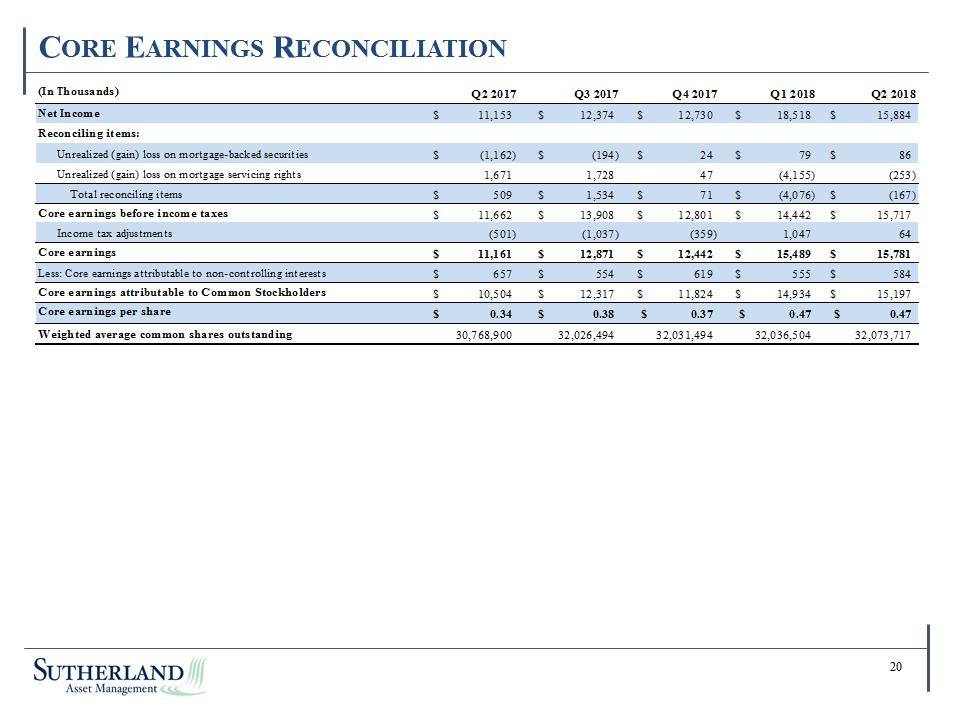
Core Earnings Reconciliation 20 Check: Page #s (In Thousands)Net Income$11,153 $12,374 $12,730 $18,518 $15,884 Reconciling items:Unrealized (gain) loss on mortgage-backed securities$(1,162) $(194) $24 $79 $86 Unrealized (gain) loss on mortgage servicing rights 1,671 1,728 47 (4,155) (253) Total reconciling items$509 $1,534 $71 $(4,076) $(167) Core earnings before income taxes$11,662 $13,908 $12,801 $14,442 $15,717 Income tax adjustments (501) (1,037) (359) 1,047 64 Core earnings$11,161 $12,871 $12,442 $15,489 $15,781 Less: Core earnings attributable to non-controlling interests$657 $554 $619 $555 $584 Core earnings attributable to Common Stockholders$10,504 $12,317 $11,824 $14,934 $15,197 Core earnings per share$0.34 $0.38 $0.37 $0.47 $0.47 Weighted average common shares outstanding30,768,900 32,026,494 32,031,494 32,036,504 32,073,717 Q2 2017Q3 2017Q4 2017Q1 2018Q2 2018 |