Attached files
| file | filename |
|---|---|
| EX-31.1 - EXHIBIT 31.1 - EZCORP INC | a2018-q310qex311_6302018.htm |
| EX-32.1 - EXHIBIT 32.1 - EZCORP INC | a2018-q310qex321_6302018.htm |
| EX-31.2 - EXHIBIT 31.2 - EZCORP INC | a2018-q310qex312_6302018.htm |
UNITED STATES
SECURITIES AND EXCHANGE COMMISSION
WASHINGTON, DC 20549
FORM 10-Q
x | QUARTERLY REPORT PURSUANT TO SECTION 13 OR 15(d) OF THE SECURITIES EXCHANGE ACT OF 1934 |
For the quarterly period ended June 30, 2018
or
¨ | TRANSITION REPORT PURSUANT TO SECTION 13 OR 15(d) OF THE SECURITIES EXCHANGE ACT OF 1934 |
For the transition period from to
Commission File No. 0-19424

EZCORP, INC.
(Exact name of registrant as specified in its charter)
Delaware | 74-2540145 |
(State or other jurisdiction of incorporation or organization) | (I.R.S. Employer Identification No.) |
2500 Bee Cave Road, Bldg One, Suite 200, Rollingwood, Texas | 78746 |
(Address of principal executive offices) | (Zip Code) |
Registrant’s telephone number, including area code: (512) 314-3400
Indicate by check mark whether the registrant (1) has filed all reports required to be filed by Section 13 or 15(d) of the Securities Exchange Act of 1934 during the preceding 12 months (or for such shorter period that the registrant was required to file such reports), and (2) has been subject to such filing requirements for the past 90 days. Yes x No ¨
Indicate by check mark whether the registrant has submitted electronically and posted on its corporate Web site, if any, every Interactive Data File required to be submitted and posted pursuant to Rule 405 of Regulation S-T (§232.405 of this chapter) during the preceding 12 months (or for such shorter period that the registrant was required to submit and post such files). Yes x No ¨
Indicate by check mark whether the registrant is a large accelerated filer, an accelerated filer, a non-accelerated filer, smaller reporting company, or an emerging growth company. See definition of “large accelerated filer,” “accelerated filer,” “smaller reporting company,” and "emerging growth company" in Rule 12b-2 of the Exchange Act.
Large accelerated filer | ¨ | Accelerated filer | x |
Non-accelerated filer | ¨ | (Do not check if a smaller reporting company) | |
Smaller reporting company | ¨ | ||
Emerging growth company | ¨ | ||
If an emerging growth company, indicate by check mark if the registrant has elected not to use the extended transition period for complying with any new or revised financial accounting standards provided pursuant to Section 13(a) of the Exchange Act. ¨
Indicate by check mark whether the registrant is a shell company (as defined in Rule 12b-2 of the Exchange Act). Yes ¨ No x
APPLICABLE ONLY TO CORPORATE ISSUERS:
The only class of voting securities of the registrant issued and outstanding is the Class B Voting Common Stock, par value $.01 per share, all of which is owned by an affiliate of the registrant. There is no trading market for the Class B Voting Common Stock.
As of July 24, 2018, 51,494,246 shares of the registrant’s Class A Non-voting Common Stock ("Class A Common Stock"), par value $.01 per share, and 2,970,171 shares of the registrant’s Class B Voting Common Stock, par value $.01 per share, were outstanding.
EZCORP, Inc.
INDEX TO FORM 10-Q
PART I — FINANCIAL INFORMATION
ITEM 1. FINANCIAL STATEMENTS
EZCORP, Inc. CONDENSED CONSOLIDATED BALANCE SHEETS (in thousands, except share and per share amounts) | |||||||||||
June 30, 2018 | June 30, 2017 | September 30, 2017 | |||||||||
(Unaudited) | |||||||||||
Assets: | |||||||||||
Current assets: | |||||||||||
Cash and cash equivalents | $ | 285,031 | $ | 113,729 | $ | 164,393 | |||||
Pawn loans | 183,054 | 168,262 | 169,242 | ||||||||
Pawn service charges receivable, net | 33,388 | 30,585 | 31,548 | ||||||||
Inventory, net | 151,145 | 135,053 | 154,411 | ||||||||
Notes receivable, net | 37,906 | 22,024 | 32,598 | ||||||||
Prepaid expenses and other current assets | 43,448 | 31,993 | 28,765 | ||||||||
Total current assets | 733,972 | 501,646 | 580,957 | ||||||||
Investment in unconsolidated affiliate | 61,056 | 41,725 | 43,319 | ||||||||
Property and equipment, net | 71,587 | 53,022 | 57,959 | ||||||||
Goodwill | 292,544 | 254,469 | 254,760 | ||||||||
Intangible assets, net | 59,678 | 32,551 | 32,420 | ||||||||
Non-current notes receivable, net | 13,432 | 41,253 | 28,377 | ||||||||
Deferred tax asset, net | 4,269 | 36,506 | 16,856 | ||||||||
Other assets, net | 3,575 | 9,145 | 9,715 | ||||||||
Total assets | $ | 1,240,113 | $ | 970,317 | $ | 1,024,363 | |||||
Liabilities and equity: | |||||||||||
Current liabilities: | |||||||||||
Current maturities of long-term debt, net | $ | 195,796 | $ | — | $ | — | |||||
Accounts payable, accrued expenses and other current liabilities | 61,813 | 64,830 | 61,543 | ||||||||
Customer layaway deposits | 11,938 | 11,091 | 11,032 | ||||||||
Total current liabilities | 269,547 | 75,921 | 72,575 | ||||||||
Long-term debt, net | 222,897 | 260,414 | 284,807 | ||||||||
Other long-term liabilities | 11,111 | 9,680 | 7,055 | ||||||||
Total liabilities | 503,555 | 346,015 | 364,437 | ||||||||
Commitments and contingencies (Note 8) | |||||||||||
Stockholders’ equity: | |||||||||||
Class A Non-voting Common Stock, par value $.01 per share; shares authorized: 100 million; issued and outstanding: 51,494,246 as of June 30, 2018; 51,326,582 as of June 30, 2017; and 51,427,832 as of September 30, 2017 | 515 | 513 | 514 | ||||||||
Class B Voting Common Stock, convertible, par value $.01 per share; shares authorized: 3 million; issued and outstanding: 2,970,171 | 30 | 30 | 30 | ||||||||
Additional paid-in capital | 395,428 | 322,559 | 348,532 | ||||||||
Retained earnings | 392,315 | 340,256 | 351,666 | ||||||||
Accumulated other comprehensive loss | (48,040 | ) | (37,921 | ) | (38,367 | ) | |||||
EZCORP, Inc. stockholders’ equity | 740,248 | 625,437 | 662,375 | ||||||||
Noncontrolling interest | (3,690 | ) | (1,135 | ) | (2,449 | ) | |||||
Total equity | 736,558 | 624,302 | 659,926 | ||||||||
Total liabilities and equity | $ | 1,240,113 | $ | 970,317 | $ | 1,024,363 | |||||
See accompanying notes to unaudited interim condensed consolidated financial statements.
1
EZCORP, Inc. CONDENSED CONSOLIDATED STATEMENTS OF OPERATIONS | |||||||||||||||
Three Months Ended June 30, | Nine Months Ended June 30, | ||||||||||||||
2018 | 2017 | 2018 | 2017 | ||||||||||||
(Unaudited) | |||||||||||||||
(in thousands, except per share amounts) | |||||||||||||||
Revenues: | |||||||||||||||
Merchandise sales | $ | 104,737 | $ | 97,921 | $ | 333,270 | $ | 319,672 | |||||||
Jewelry scrapping sales | 20,428 | 17,641 | 44,166 | 37,658 | |||||||||||
Pawn service charges | 72,874 | 65,878 | 223,601 | 201,983 | |||||||||||
Other revenues | 1,903 | 2,193 | 6,147 | 6,572 | |||||||||||
Total revenues | 199,942 | 183,633 | 607,184 | 565,885 | |||||||||||
Merchandise cost of goods sold | 66,896 | 62,615 | 210,283 | 204,840 | |||||||||||
Jewelry scrapping cost of goods sold | 17,625 | 15,010 | 37,536 | 32,195 | |||||||||||
Other cost of revenues | 349 | 453 | 1,273 | 1,433 | |||||||||||
Net revenues | 115,072 | 105,555 | 358,092 | 327,417 | |||||||||||
Operating expenses: | |||||||||||||||
Operations | 83,032 | 74,246 | 248,802 | 226,352 | |||||||||||
Administrative | 13,268 | 14,095 | 39,927 | 41,305 | |||||||||||
Depreciation and amortization | 6,124 | 5,843 | 18,298 | 18,246 | |||||||||||
Loss on sale or disposal of assets | 314 | 17 | 453 | 11 | |||||||||||
Total operating expenses | 102,738 | 94,201 | 307,480 | 285,914 | |||||||||||
Operating income | 12,334 | 11,354 | 50,612 | 41,503 | |||||||||||
Interest expense | 7,394 | 5,654 | 19,070 | 16,847 | |||||||||||
Interest income | (4,358 | ) | (2,053 | ) | (12,896 | ) | (6,909 | ) | |||||||
Equity in net income of unconsolidated affiliate | (1,151 | ) | (1,047 | ) | (3,477 | ) | (3,768 | ) | |||||||
Other income | (5,287 | ) | (99 | ) | (5,473 | ) | (294 | ) | |||||||
Income from continuing operations before income taxes | 15,736 | 8,899 | 53,388 | 35,627 | |||||||||||
Income tax expense | 1,553 | 3,432 | 14,911 | 13,663 | |||||||||||
Income from continuing operations, net of tax | 14,183 | 5,467 | 38,477 | 21,964 | |||||||||||
Income (loss) from discontinued operations, net of tax | 91 | (265 | ) | (631 | ) | (1,868 | ) | ||||||||
Net income | 14,274 | 5,202 | 37,846 | 20,096 | |||||||||||
Net loss attributable to noncontrolling interest | (359 | ) | (58 | ) | (1,348 | ) | (352 | ) | |||||||
Net income attributable to EZCORP, Inc. | $ | 14,633 | $ | 5,260 | $ | 39,194 | $ | 20,448 | |||||||
Basic earnings per share attributable to EZCORP, Inc. — continuing operations | $ | 0.27 | $ | 0.10 | $ | 0.73 | $ | 0.41 | |||||||
Diluted earnings per share attributable to EZCORP, Inc. — continuing operations | $ | 0.25 | $ | 0.10 | $ | 0.70 | $ | 0.41 | |||||||
Weighted-average basic shares outstanding | 54,464 | 54,295 | 54,453 | 54,247 | |||||||||||
Weighted-average diluted shares outstanding | 57,954 | 54,367 | 57,080 | 54,310 | |||||||||||
See accompanying notes to unaudited interim condensed consolidated financial statements.
2
EZCORP, Inc. CONDENSED CONSOLIDATED STATEMENTS OF COMPREHENSIVE INCOME | |||||||||||||||
Three Months Ended June 30, | Nine Months Ended June 30, | ||||||||||||||
2018 | 2017 | 2018 | 2017 | ||||||||||||
(Unaudited) | |||||||||||||||
(in thousands) | |||||||||||||||
Net income | $ | 14,274 | $ | 5,202 | $ | 37,846 | $ | 20,096 | |||||||
Other comprehensive gain (loss): | |||||||||||||||
Foreign currency translation gain (loss), net of income tax benefit (expense) from our unconsolidated affiliate of $135 and ($76) for the three and nine months ended June 30, 2018 respectively, and ($820) and ($290) for the three and nine months ended June 30, 2017, respectively. | (7,576 | ) | 4,608 | (8,111 | ) | 6,163 | |||||||||
Other comprehensive gain (loss), net of tax | (7,576 | ) | 4,608 | (8,111 | ) | 6,163 | |||||||||
Comprehensive income | 6,698 | 9,810 | 29,735 | 26,259 | |||||||||||
Comprehensive loss attributable to noncontrolling interest | (358 | ) | (73 | ) | (1,241 | ) | (357 | ) | |||||||
Comprehensive income attributable to EZCORP, Inc. | $ | 7,056 | $ | 9,883 | $ | 30,976 | $ | 26,616 | |||||||
See accompanying notes to unaudited interim condensed consolidated financial statements.
EZCORP, Inc. CONDENSED CONSOLIDATED STATEMENTS OF STOCKHOLDERS' EQUITY | ||||||||||||||||||||||||||
Common Stock | Additional Paid-in Capital | Retained Earnings | Accumulated Other Comprehensive (Loss) Income | Noncontrolling Interest | Total Equity | |||||||||||||||||||||
Shares | Par Value | |||||||||||||||||||||||||
(Unaudited, except balances as of September 30, 2016) | ||||||||||||||||||||||||||
(in thousands) | ||||||||||||||||||||||||||
Balances as of September 30, 2016 | 54,099 | $ | 541 | $ | 318,723 | $ | 319,808 | $ | (44,089 | ) | $ | (778 | ) | $ | 594,205 | |||||||||||
Stock compensation | — | — | 5,126 | — | — | — | 5,126 | |||||||||||||||||||
Release of restricted stock | 198 | 2 | — | — | — | — | 2 | |||||||||||||||||||
Taxes paid related to net share settlement of equity awards | — | — | (767 | ) | — | — | — | (767 | ) | |||||||||||||||||
Reclassification of Cash Convertible Notes Warrants to liabilities | — | — | (523 | ) | — | — | — | (523 | ) | |||||||||||||||||
Foreign currency translation adjustment | — | — | — | — | 6,168 | (5 | ) | 6,163 | ||||||||||||||||||
Net income (loss) | — | — | — | 20,448 | — | (352 | ) | 20,096 | ||||||||||||||||||
Balances as of June 30, 2017 | 54,297 | $ | 543 | $ | 322,559 | $ | 340,256 | $ | (37,921 | ) | $ | (1,135 | ) | $ | 624,302 | |||||||||||
Common Stock | Additional Paid-in Capital | Retained Earnings | Accumulated Other Comprehensive Loss | Noncontrolling Interest | Total Equity | |||||||||||||||||||||
Shares | Par Value | |||||||||||||||||||||||||
(Unaudited, except balances as of September 30, 2017) | ||||||||||||||||||||||||||
(in thousands) | ||||||||||||||||||||||||||
Balances as of September 30, 2017 | 54,398 | $ | 544 | $ | 348,532 | $ | 351,666 | $ | (38,367 | ) | $ | (2,449 | ) | $ | 659,926 | |||||||||||
Stock compensation | — | — | 8,150 | — | — | — | 8,150 | |||||||||||||||||||
Release of restricted stock | 66 | 1 | — | — | — | — | 1 | |||||||||||||||||||
Taxes paid related to net share settlement of equity awards | — | — | (311 | ) | — | — | — | (311 | ) | |||||||||||||||||
Reclassification of stranded tax effects resulting from the Tax Cuts and Jobs Act | — | — | — | 1,455 | (1,455 | ) | — | — | ||||||||||||||||||
Foreign currency translation adjustment | — | — | — | — | (8,218 | ) | 107 | (8,111 | ) | |||||||||||||||||
Equity classified conversion feature of 2025 Convertible Notes, net of tax | — | — | 39,057 | — | — | — | 39,057 | |||||||||||||||||||
Net income (loss) | — | — | — | 39,194 | — | (1,348 | ) | 37,846 | ||||||||||||||||||
Balances as of June 30, 2018 | 54,464 | $ | 545 | $ | 395,428 | $ | 392,315 | $ | (48,040 | ) | $ | (3,690 | ) | $ | 736,558 | |||||||||||
See accompanying notes to unaudited interim condensed consolidated financial statements.
3
EZCORP, Inc. CONDENSED CONSOLIDATED STATEMENTS OF CASH FLOWS | |||||||
Nine Months Ended June 30, | |||||||
2018 | 2017 | ||||||
(Unaudited) | |||||||
(in thousands) | |||||||
Operating activities: | |||||||
Net income | $ | 37,846 | $ | 20,096 | |||
Adjustments to reconcile net income to net cash flows from operating activities: | |||||||
Depreciation and amortization | 18,298 | 18,246 | |||||
Amortization of debt discount and deferred financing costs | 12,126 | 8,595 | |||||
Accretion of notes receivable discount and deferred compensation fee | (7,222 | ) | (2,898 | ) | |||
Deferred income taxes | 3,135 | (871 | ) | ||||
Other adjustments | 1,948 | 1,397 | |||||
Stock compensation expense | 8,216 | 5,145 | |||||
Income from investment in unconsolidated affiliate | (3,477 | ) | (3,768 | ) | |||
Changes in operating assets and liabilities, net of business acquisitions: | |||||||
Service charges and fees receivable | 1,601 | 604 | |||||
Inventory | 988 | 1,470 | |||||
Prepaid expenses, other current assets and other assets | (3,617 | ) | 6,808 | ||||
Accounts payable, accrued expenses and other liabilities | (4,313 | ) | (29,464 | ) | |||
Customer layaway deposits | 935 | 288 | |||||
Income taxes, net of excess tax benefit from stock compensation | 2,586 | 9,873 | |||||
Net cash provided by operating activities | 69,050 | 35,521 | |||||
Investing activities: | |||||||
Loans made | (512,914 | ) | (472,676 | ) | |||
Loans repaid | 318,636 | 288,833 | |||||
Recovery of pawn loan principal through sale of forfeited collateral | 202,078 | 187,819 | |||||
Additions to property and equipment and capitalized labor, net | (33,917 | ) | (14,887 | ) | |||
Acquisitions, net of cash acquired | (93,165 | ) | — | ||||
Investment in unconsolidated affiliate | (14,036 | ) | — | ||||
Principal collections on notes receivable | 16,210 | 23,336 | |||||
Net cash (used in) provided by investing activities | (117,108 | ) | 12,425 | ||||
Financing activities: | |||||||
Taxes paid related to net share settlement of equity awards | (311 | ) | (767 | ) | |||
Proceeds from borrowings, net of issuance costs and other | 170,468 | — | |||||
Net cash provided by (used in) financing activities | 170,157 | (767 | ) | ||||
Effect of exchange rate changes on cash and cash equivalents | (1,461 | ) | 813 | ||||
Net increase in cash and cash equivalents | 120,638 | 47,992 | |||||
Cash and cash equivalents at beginning of period | 164,393 | 65,737 | |||||
Cash and cash equivalents at end of period | $ | 285,031 | $ | 113,729 | |||
Non-cash investing and financing activities: | |||||||
Pawn loans forfeited and transferred to inventory | $ | 197,163 | $ | 182,682 | |||
Dividend reinvestment acquisition of additional ownership in unconsolidated affiliate | — | 1,153 | |||||
Deferred acquisition consideration | 1,143 | — | |||||
See accompanying notes to unaudited interim condensed consolidated financial statements.
4
EZCORP, Inc.
Notes to Interim Condensed Consolidated Financial Statements (Unaudited)
June 30, 2018
NOTE 1: ORGANIZATION AND SUMMARY OF SIGNIFICANT ACCOUNTING POLICIES
Description of Business
When used in this report, the terms “we,” “us,” “our,” “EZCORP” and the “Company” mean EZCORP, Inc. and its consolidated subsidiaries, collectively.
We are a leading provider of pawn loans in the United States and Latin America. Pawn loans are non-recourse loans collateralized by tangible property. We also sell merchandise, primarily collateral forfeited from pawn lending operations and used merchandise purchased from customers, and operate a small number of financial services stores in Canada.
Basis of Presentation
The accompanying unaudited interim condensed consolidated financial statements have been prepared in accordance with accounting principles generally accepted in the United States (“GAAP”) for interim financial information and with the instructions to Form 10-Q and Article 10 of Regulation S-X. Accordingly, they do not include all the information and footnotes required by generally accepted accounting principles for complete financial statements. Our management has included all adjustments it considers necessary for a fair presentation which are of a normal, recurring nature. All intercompany accounts and transactions have been eliminated in consolidation.
The accompanying financial statements should be read in conjunction with the consolidated financial statements and notes included in our Annual Report on Form 10-K for the year ended September 30, 2017. The balance sheet as of September 30, 2017 has been derived from the audited financial statements at that date but does not include all of the information and footnotes required by GAAP for complete financial statements.
Our business is subject to seasonal variations, and operating results for the three and nine months ended June 30, 2018 and 2017 (the "current quarter" and "current nine-months" and "prior-year quarter" and "prior-year nine-months," respectively) are not necessarily indicative of the results of operations for the full fiscal year.
There have been no changes in significant accounting policies as described in our Annual Report on Form 10-K for the year ended September 30, 2017.
Reclassifications to Prior Period Financial Statements
We have reclassified certain capitalized labor expenditures in the previous period on our condensed consolidated statements of cash flows from "Prepaid expenses, other current assets and other assets" in operating cash flows to "Additions to property and equipment and capitalized labor, net" in investing cash flows. Additionally, we have reclassified certain information included in Note 10 to conform to the current period presentation. These reclassifications do not have a material impact to prior periods presented.
Use of Estimates and Assumptions
The preparation of these financial statements requires us to make estimates and assumptions that affect the reported amounts of assets, liabilities, revenues and expenses and related disclosure of contingent assets and liabilities. On an ongoing basis, we evaluate our estimates and judgments, including those related to revenue recognition, inventories, loan loss allowances, long-lived and intangible assets, share-based compensation, income taxes, contingencies and litigation. We base our estimates on historical experience, observable trends and various other assumptions that we believe are reasonable under the circumstances. We use this information to make judgments about the carrying values of assets and liabilities that are not readily apparent from other sources. Actual results may differ materially from these estimates under different assumptions or conditions.
Income Taxes
On December 22, 2017, the Tax Cuts and Jobs Act of 2017 (the "Act") was signed into law. Among other things, the Act reduces the U.S. federal corporate tax rate from 35% to 21%, requires companies to pay a one-time transition tax on earnings of certain foreign subsidiaries that were previously tax deferred and creates new taxes on certain foreign sourced earnings. The corporate tax rate reduction was effective as of January 1, 2018 and, accordingly, reduced our current fiscal year federal statutory rate to a blended rate of 24.5%, and will further reduce it to 21% beginning in fiscal 2019. As of June 30, 2018, while we are able to make reasonable estimates of the impact of the reduction in the corporate rate and the deemed repatriation
5
transition tax, the final impact of the Act may differ from these estimates, due to, among other things, changes in our interpretations and assumptions, additional guidance that may be issued by the Internal Revenue Service and actions we may take. We are continuing to gather additional information to determine the final impact of the Act. We recognized $2.8 million during the quarter ended December 31, 2017, as discussed below, for the revaluation of our deferred tax assets and liabilities upon enactment of the Act, which is included as a component of "Income tax expense" in our condensed consolidated statements of operations.
Provisional amounts
• | Deferred tax assets and liabilities: We remeasured certain deferred tax assets and liabilities based on the rates at which they are expected to reverse in the future, which is generally either 24.5% or 21%, depending on whether they are expected to reverse in fiscal 2018 or in future fiscal years. We also recorded a valuation allowance against certain foreign tax credit carryforwards which management does not believe will be realized based on changes in the taxation of dividends of foreign subsidiaries in the Act. The amount recorded related to the remeasurement of our deferred tax balances was $2.8 million. This amount was recorded in the quarter ended December 31, 2017 with no further adjustment. |
• | Foreign tax effects: The one-time transition tax is based on our total post-1986 earnings and profits ("E&P") for which we have previously deferred U.S. income taxes. We do not believe that we will owe any transition tax as we have foreign tax credits sufficient to cover the tax that we estimate will be due on the deferred earnings of our foreign subsidiaries. No additional income taxes have been provided for any remaining undistributed foreign earnings not subject to the transition tax and any additional outside basis differences inherent in these entities as these amounts continue to be indefinitely reinvested in foreign operations. |
Recently Adopted Accounting Policies
• | In March 2018, the Financial Accounting Standards Board ("FASB") issued Accounting Standards Update ("ASU") 2018-05, Income Taxes — (Topic 740): Amendments to SEC (U.S. Securities and Exchange Commission) Paragraphs Pursuant to SEC Staff Accounting Bulletin No. 118. This ASU adds various paragraphs to the accounting standards codification from SEC Staff Accounting Bulletin No. 118. The provisions of this ASU were effective immediately. The discussion above of the impacts of the Act have incorporated the provisions of this ASU and SEC Staff Accounting Bulletin No. 118. |
• | In February 2018, the FASB issued ASU 2018-02, Income Statement — Reporting Comprehensive Income (Topic 220): Reclassification of Certain Tax Effects from Accumulated Other Comprehensive Income. This ASU allows entities to reclassify from accumulated other comprehensive income to retained earnings the stranded tax effects resulting from the Act. The provisions of this ASU are effective for fiscal years, and interim periods within those fiscal years, beginning after December 15, 2018. As allowed, we early adopted ASU 2018-02 on a prospective basis as of January 1, 2018 and reclassified $1.5 million of accumulated foreign currency translation associated with our unconsolidated affiliate Cash Converters International Limited (“Cash Converters International”), resulting from the stranded tax effects from the reduction of our effective tax rate, from accumulated other comprehensive loss to retained earnings. |
Recently Issued Accounting Pronouncements and Significant Accounting Policies
• | In June 2016, the FASB issued ASU 2016-13, Financial Instruments — Credit Losses (Topic 326): Measurement of Credit Losses on Financial Instruments. This ASU requires financial assets (or groups of financial assets) measured at amortized cost basis to be presented at the net amount expected to be collected, among other provisions. The provisions of this ASU are effective for fiscal years, and interim periods within those fiscal years, beginning after December 15, 2019. Early adoption is permitted for fiscal years beginning after December 15, 2018, including interim periods within those fiscal years. A reporting entity should generally apply the amendment on a modified retrospective basis through a cumulative-effect adjustment to retained earnings as of the beginning of the first reporting periods in which the amendment is effective. We have not identified any impacts to our financial statements that we believe will be material as a result of the adoption of the ASU, although we continue to evaluate the impact of adoption. We believe we are following an appropriate timeline to allow for proper recognition, presentation and disclosure upon adoption of the ASU which is effective for our fiscal 2021. |
• | In February 2016, the FASB issued ASU 2016-02, Leases (Topic 842). This ASU requires companies to generally recognize on the balance sheet operating and financing lease liabilities and corresponding right-of-use assets. The provisions of this ASU are effective for fiscal years beginning after December 15, 2018, and interim periods within |
6
those fiscal years. Early adoption is permitted based upon guidance issued within the ASU. We are in the process of evaluating the impact of adopting ASU 2016-02 on our consolidated financial position, results of operations and cash flows, and anticipate a material impact on our consolidated financial position. Additionally, we are evaluating the disclosure requirements under this ASU and are identifying and preparing to implement changes to our accounting policies, practices and controls to support adoption of the ASU and have completed upgrades to our third party software solution to support adoption. We will complete our implementation to allow for proper recognition, presentation and disclosure upon adoption of the ASU which is effective for our fiscal 2020.
• | In May 2014, the FASB issued ASU 2014-09, Revenue from Contracts with Customers (Topic 606). In August 2015, the FASB issued ASU 2015-14, Revenue from Contracts with Customers (Topic 606) to defer the effective date to December 15, 2017 for annual reporting periods beginning after that date, with early adoption permitted, but not before the original effective date of December 15, 2016. The core principle of ASU 2014-09, and the subsequently issued ASUs modifying or clarifying ASU 2014-09, is that an entity should recognize revenue to depict the transfer of goods or services to customers in an amount that reflects the consideration to which the entity expects to be entitled in exchange for those goods or services. To achieve this core principle, the guidance provides that an entity should apply the following steps: (1) identify the contract(s) with a customer; (2) identify the performance obligations in the contract; (3) determine the transaction price; (4) allocate the transaction price to the performance obligations in the contract; and (5) recognize revenue when, or as, the entity satisfies a performance obligation. The new standard allows for two methods of adoption: (a) full retrospective adoption, meaning the standard is applied to all periods presented, or (b) modified retrospective adoption, meaning the cumulative effect of applying the new standard is recognized as an adjustment to the opening retained earnings balance. |
We are evaluating the impact that will result from adopting ASU 2014-09 on our consolidated financial position, results of operations, cash flows and disclosure requirements. We currently anticipate adopting the ASU using the modified retrospective method. We do not believe the adoption will have an impact on our pawn service charges recognition as we do not believe such charges are within the scope of the ASU. Further, we have not identified any impacts to our financial statements that we believe will be material as a result of the adoption of the ASU for other revenue streams, although we continue to evaluate the impact of adoption. We believe we are following an appropriate timeline to allow for proper recognition, presentation and disclosure upon adoption of the ASU which is effective for our fiscal 2019.
Please refer to Note 1, Summary of Significant Accounting Policies, of Notes to Consolidated Financial Statements included in "Part II, Item 8 — Financial Statements and Supplementary Data" of our Annual Report on Form 10-K for the year ended September 30, 2017 for discussion of our significant accounting policies and other accounting pronouncements issued but not yet adopted.
NOTE 2: ACQUISITIONS
Camira Administration Corp. and subsidiaries (“GPMX”)
On October 6, 2017, we completed the acquisition of 100% of the outstanding stock of Camira Administration Corp. and subsidiaries (“GPMX”), a business that owns and operates 112 stores located in Guatemala, El Salvador, Honduras and Peru. The GPMX acquisition significantly expands our store base into Latin American countries outside of Mexico and provides us with a platform for further growth in the region. Under the terms of the stock purchase agreement ("SPA"), we paid $53.4 million in cash upon closing and, subsequent to the closing, paid $6.7 million to satisfy the acquired company's indebtedness to members of the seller’s affiliated group. The SPA specified a further $2.25 million to be paid contingent upon performance of GPMX’s business during a period up to 24 months following the closing date, and the business achieved the specified performance goal during the first quarter of fiscal 2018. Consequently, we made a final payment of $1.6 million in January 2018 in satisfaction of the contingent purchase price obligation, after reduction for certain adjustments under the SPA, yielding a total purchase price of $61.7 million.
All Other
On June 25, 2018, we acquired 40 pawn stores operating under the name "Montepio San Patricio” in and around Mexico City, the largest market in Mexico. The acquisition of these stores is our largest acquisition in Mexico to date and significantly strengthens our competitive position in the strategically important Mexico City metropolitan area. The physical space in these stores is substantially larger than our average store in Mexico, giving us the capacity to increase their focus on general merchandise pawn loan and retail activities.
On June 11, 2018, we acquired 23 pawn stores operating under the name "Presta Dinero," giving us a presence in a number of cities within seven central-Mexico states in which we already have Empeño Fácil stores. These stores complement our existing
7
stores, allowing us to achieve synergies in management and administration while giving us a presence in new cities and neighborhoods.
On December 4, 2017, we acquired 21 pawn stores located in the Mexican state of Sinaloa and operating under the name "Bazareño." The Bazareño stores make up the largest chain of pawn stores in Culiacan, the capital city of Sinaloa, giving EZCORP the number one position in that market with more than double the store count of the nearest competitor and an important strategic presence in the northwest region of Mexico.
The purchase prices of the above acquisitions were paid in cash. These acquisitions, collectively referred to as "All Other" below, were individually immaterial and we have therefore omitted or aggregated certain disclosures.
Other Information
With the completion of the GPMX acquisition, we have combined the results of that business with the results of our Mexico pawn business, and that reporting segment is now referred to as "Latin America Pawn." See Note 9, Segment Information, below. The acquisitions described above were all attributable to our Latin America Pawn segment. The allocation of the consideration for the net acquired assets from these business combinations was as follows:
GPMX | All Other | |||||||
(in thousands) | ||||||||
Cash and cash equivalents | $ | 2,560 | $ | — | ||||
Earning assets | 17,247 | 7,980 | ||||||
Other assets | 3,450 | 4,272 | ||||||
Property and equipment, intangible assets and other assets, net* | 11,671 | 18,868 | ||||||
Goodwill | 34,022 | 4,192 | ||||||
Accounts payable, deferred taxes and other liabilities | (7,234 | ) | (159 | ) | ||||
Total consideration | $ | 61,716 | $ | 35,153 | ||||
* | Intangible assets consist primarily of $9.8 million and $14.0 million in trade names acquired with indefinite useful lives, for GPMX and All Other, respectively. |
The factors contributing to the recognition of goodwill, which is recorded in our Latin America Pawn segment, were based on several strategic and synergistic benefits we expect to realize from the acquisitions, including expansion of our store base as well as the ability to further leverage our pawn expertise, investments in information technology and other back office and support functions of our existing Mexico pawn business. We expect none of the goodwill resulting from these business combinations will be deductible for tax purposes. As the acquisition of Montepio San Patricio and Presta Dinero were consummated near the end of the current quarter, we may include certain revisions to the initial purchase accounting in subsequent quarters.
The results of the acquired businesses have been included in our condensed consolidated financial statements beginning after the acquisition dates as indicated above in our Latin America Pawn segment with revenue and net income amounts as presented below. Such net income does not include acquisition-related costs of approximately $0.2 million and $0.6 million during the three and nine months ended June 30, 2018, respectively, which were expensed as incurred and primarily included under “Administrative” expense in our condensed consolidated statements of operations. It is impracticable to provide historical supplemental pro forma financial information for GPMX and All Other acquisitions due to a variety of factors, including complexity of restructured entities acquired and access to historical information, such as information necessary to eliminate intercompany transactions.
Three Months Ended June 30, 2018 | Nine Months Ended June 30, 2018 | ||||||||||||||
Revenue | Net Income | Revenue | Net Income | ||||||||||||
(in millions) | |||||||||||||||
GPMX | $ | 11.3 | $ | 2.2 | $ | 34.6 | $ | 6.0 | |||||||
All Other | 1.5 | 0.4 | 2.7 | 0.5 | |||||||||||
8
NOTE 3: EARNINGS PER SHARE
Components of basic and diluted earnings per share and excluded antidilutive potential common shares are as follows:
Three Months Ended June 30, | Nine Months Ended June 30, | ||||||||||||||
2018 | 2017 | 2018 | 2017 | ||||||||||||
(in thousands, except per share amounts) | |||||||||||||||
Net income from continuing operations attributable to EZCORP (A) | $ | 14,542 | $ | 5,525 | $ | 39,825 | $ | 22,316 | |||||||
Income (loss) from discontinued operations, net of tax (B) | 91 | (265 | ) | (631 | ) | (1,868 | ) | ||||||||
Net income attributable to EZCORP (C) | $ | 14,633 | $ | 5,260 | $ | 39,194 | $ | 20,448 | |||||||
Weighted-average outstanding shares of common stock (D) | 54,464 | 54,295 | 54,453 | 54,247 | |||||||||||
Dilutive effect of restricted stock and 2024 Convertible Notes* | 3,490 | 72 | 2,627 | 63 | |||||||||||
Weighted-average common stock and common stock equivalents (E) | 57,954 | 54,367 | 57,080 | 54,310 | |||||||||||
Basic earnings per share attributable to EZCORP: | |||||||||||||||
Continuing operations (A / D) | $ | 0.27 | $ | 0.10 | $ | 0.73 | $ | 0.41 | |||||||
Discontinued operations (B / D) | — | — | (0.01 | ) | (0.03 | ) | |||||||||
Basic earnings per share (C / D) | $ | 0.27 | $ | 0.10 | $ | 0.72 | $ | 0.38 | |||||||
Diluted earnings per share attributable to EZCORP: | |||||||||||||||
Continuing operations (A / E) | $ | 0.25 | $ | 0.10 | $ | 0.70 | $ | 0.41 | |||||||
Discontinued operations (B / E) | — | — | (0.01 | ) | (0.03 | ) | |||||||||
Diluted earnings per share (C / E) | $ | 0.25 | $ | 0.10 | $ | 0.69 | $ | 0.38 | |||||||
Potential common shares excluded from the calculation of diluted earnings per share above, exclusive of the additional potential impact of the 2019 Convertible Notes Warrants, 2024 Convertible Notes and 2025 Convertible Notes*: | |||||||||||||||
Restricted stock** | 3,569 | 2,418 | 3,375 | 2,435 | |||||||||||
* | See Note 6 for discussion of the terms and conditions of these potential common shares and dilutive impact thereon. |
** | Includes antidilutive share-based awards as well as performance-based and market conditioned share-based awards that are contingently issuable, but for which the condition for issuance has not been met as of the end of the reporting period. |
9
NOTE 4: STRATEGIC INVESTMENTS
As of June 30, 2018, we owned 214,183,714 shares, or approximately 34.75%, of our unconsolidated affiliate Cash Converters International Limited. We acquired 57,631,230 shares in June 2018 for $14.0 million (increasing our ownership by three percentage points) in connection with an underwritten placement of approximately 123.3 million shares by Cash Converters International for AUD 39.5 million, excluding costs. Cash Converters International stated it will use the proceeds from the offering to reduce outstanding indebtedness and provide additional capital to pursue growth opportunities while maintaining sufficient working capital. Our participation in this offering, including our incremental equity ownership, does not change our conclusion to account for our investment in Cash Converters International under the equity method. The following tables present summary financial information for Cash Converters International’s most recently reported results as of June 30, 2018 after translation to U.S. dollars:
December 31, | |||||||
2017 | 2016 | ||||||
(in thousands) | |||||||
Current assets | $ | 203,664 | $ | 158,235 | |||
Non-current assets | 151,189 | 141,218 | |||||
Total assets | $ | 354,853 | $ | 299,453 | |||
Current liabilities | $ | 128,731 | $ | 70,468 | |||
Non-current liabilities | 14,559 | 48,181 | |||||
Shareholders’ equity | 211,563 | 180,804 | |||||
Total liabilities and shareholders’ equity | $ | 354,853 | $ | 299,453 | |||
Half-Year Ended December 31, | |||||||
2017 | 2016 | ||||||
(in thousands) | |||||||
Gross revenues* | $ | 95,784 | $ | 105,816 | |||
Gross profit* | 32,572 | 38,533 | |||||
Net profit | 7,292 | 8,633 | |||||
* | Certain reclassifications of prior period amounts have been made. These reclassifications were made to conform to the current period presentation included in the report of Cash Converters International for the half year ended December 31, 2016. |
NOTE 5: FAIR VALUE MEASUREMENTS
Our assets and liabilities discussed below are classified in one of the following three categories based on the inputs used to develop their fair values: Level 1 — Quoted market prices in active markets for identical assets or liabilities; Level 2 — Other observable market-based inputs or unobservable inputs that are corroborated by market data; and Level 3 — Unobservable inputs that are not corroborated by market data.
Recurring Fair Value Measurements
The tables below present our financial assets (liabilities) that were carried and measured at fair value on a recurring basis:
Financial Assets (Liabilities) | Balance Sheet Location | June 30, 2018 | June 30, 2017 | September 30, 2017 | ||||||||||
(in thousands) | ||||||||||||||
2019 Convertible Notes Hedges — Level 2 | Prepaid expenses and other current assets | $ | 7,491 | $ | — | $ | — | |||||||
2019 Convertible Notes Hedges — Level 2 | Other assets, net | — | 5,900 | 6,591 | ||||||||||
2019 Convertible Notes Embedded Derivative — Level 2 | Current maturities of long-term debt, net | (7,491 | ) | — | — | |||||||||
2019 Convertible Notes Embedded Derivative — Level 2 | Long-term debt, net | — | (5,900 | ) | (6,591 | ) | ||||||||
We measured the fair value of the cash-settled call options pertaining to the 2.125% Cash Convertible Senior Notes Due 2019 (the “2019 Convertible Notes Hedges”) and the 2019 Convertible Notes derivative instrument (the “2019 Convertible Notes
10
Embedded Derivative”) using the Black-Scholes-Merton model based on observable Level 1 and Level 2 inputs such as conversion price of underlying shares, current share price, implied volatility, risk free interest rate and other factors. The volatility input used as of June 30, 2018 was 36% based on observed market inputs. As an estimate of the sensitivity of the fair values of the 2019 Convertible Notes Hedges and 2019 Convertible Notes Embedded Derivative, were volatility inputs of 30% and 45% used, the fair values would have ranged from $4.9 million to $12.2 million.
There were no transfers in or out of Level 1, Level 2 or Level 3 for financial assets or liabilities measured at fair value on a recurring basis during the periods presented.
Financial Assets and Liabilities Not Measured at Fair Value
The tables below present our financial assets and liabilities that were not measured at fair value on a recurring basis:
Carrying Value | Estimated Fair Value | |||||||||||||||||||
June 30, 2018 | June 30, 2018 | Fair Value Measurement Using | ||||||||||||||||||
Level 1 | Level 2 | Level 3 | ||||||||||||||||||
(in thousands) | ||||||||||||||||||||
Financial assets: | ||||||||||||||||||||
Notes receivable, net | $ | 51,338 | $ | 57,116 | $ | — | $ | — | $ | 57,116 | ||||||||||
Investment in unconsolidated affiliate | 61,056 | 49,205 | 49,205 | — | — | |||||||||||||||
Financial liabilities: | ||||||||||||||||||||
2019 Convertible Notes | $ | 184,823 | $ | 197,925 | $ | — | $ | 197,925 | $ | — | ||||||||||
2024 Convertible Notes | 104,562 | 195,974 | — | 195,974 | — | |||||||||||||||
2025 Convertible Notes | 118,335 | 168,464 | — | 168,464 | — | |||||||||||||||
Carrying Value | Estimated Fair Value | |||||||||||||||||||
June 30, 2017 | June 30, 2017 | Fair Value Measurement Using | ||||||||||||||||||
Level 1 | Level 2 | Level 3 | ||||||||||||||||||
(in thousands) | ||||||||||||||||||||
Financial assets: | ||||||||||||||||||||
Notes receivable, net | $ | 63,277 | $ | 65,570 | $ | — | $ | — | $ | 65,570 | ||||||||||
Investment in unconsolidated affiliate | 41,725 | 37,306 | 37,306 | — | — | |||||||||||||||
Financial liabilities: | ||||||||||||||||||||
2019 Convertible Notes | $ | 206,279 | $ | 218,500 | $ | — | $ | 218,500 | $ | — | ||||||||||
Term loan facility | 48,235 | 48,159 | — | — | 48,159 | |||||||||||||||
Carrying Value | Estimated Fair Value | |||||||||||||||||||
September 30, 2017 | September 30, 2017 | Fair Value Measurement Using | ||||||||||||||||||
Level 1 | Level 2 | Level 3 | ||||||||||||||||||
(in thousands) | ||||||||||||||||||||
Financial assets: | ||||||||||||||||||||
Notes receivable, net | $ | 60,975 | $ | 74,262 | $ | — | $ | — | $ | 74,262 | ||||||||||
Investment in unconsolidated affiliate | 43,319 | 49,057 | 49,057 | — | — | |||||||||||||||
Financial liabilities: | ||||||||||||||||||||
2019 Convertible Notes | $ | 177,346 | $ | 193,811 | $ | — | $ | 193,811 | $ | — | ||||||||||
2024 Convertible Notes | 100,870 | 175,016 | — | 175,016 | — | |||||||||||||||
Based on the short-term nature of cash and cash equivalents, pawn loans, pawn service charges receivable, current consumer loans, fees and interest receivable and other debt, we estimate that their carrying value approximates fair value. We consider our cash and cash equivalents to be measured using Level 1 inputs and our pawn loans, pawn service charges receivable, consumer loans, fees and interest receivable and other debt to be measured using Level 3 inputs. Significant increases or
11
decreases in the underlying assumptions used to value pawn loans, pawn service charges receivable, consumer loans, fees and interest receivable and other debt could significantly increase or decrease these fair value estimates.
Subsequent to the sale of Prestaciones Finmart, S.A.P.I. de C.V., SOFOM, E.N.R. ("Grupo Finmart") to Alpha Holding, S.A. de C.V. (“AlphaCredit”) in September 2016, we determined that we retained a variable interest in Grupo Finmart including notes receivable. We determined that we are not the primary beneficiary of Grupo Finmart subsequent to its disposition as we lack a controlling financial interest in Grupo Finmart. We measured the fair value of the notes receivable as of June 30, 2018 under a discounted cash flow approach considering the estimated credit ratings for Grupo Finmart and AlphaCredit and as determined with external consultation, with discount rates ranging from 7% to 13%. Certain of the significant inputs used for the valuation were not observable in the market. Included in the fair value of the notes receivable is the estimated fair value of the deferred compensation fee negotiated in September 2017, of which the ultimate amount to be received is dependent upon the timing of payment of the notes receivable. Significant increases or decreases in the underlying assumptions used to value the notes receivable could significantly increase or decrease these fair value estimates.
The inputs used to generate the fair value of the investment in unconsolidated affiliate Cash Converters International were considered Level 1 inputs. These inputs are comprised of (a) the quoted stock price on the Australian Stock Exchange multiplied by (b) the number of shares we owned multiplied by (c) the applicable foreign currency exchange rate as of the end of our reporting period. We included no control premium for owning a large percentage of outstanding shares.
We measured the fair value of the 2019 Convertible Notes, 2024 Convertible Notes and 2025 Convertible Notes using quoted price inputs. The 2019 Convertible Notes, 2024 Convertible Notes and 2025 Convertible Notes are not actively traded, and thus the price inputs represent a Level 2 measurement. As the quoted price inputs are highly variable from day to day, the fair value estimates disclosed above could significantly increase or decrease.
NOTE 6: DEBT
The following tables present our debt instruments outstanding, contractual maturities and interest expense:
June 30, 2018 | June 30, 2017 | September 30, 2017 | |||||||||||||||||||||||||||||||||
Gross Amount | Debt Discount and Issuance Costs | Carrying Amount | Gross Amount | Debt Discount and Issuance Costs | Carrying Amount | Gross Amount | Debt Discount and Issuance Costs | Carrying Amount | |||||||||||||||||||||||||||
(in thousands) | |||||||||||||||||||||||||||||||||||
2019 Convertible Notes | $ | 195,000 | $ | (10,177 | ) | $ | 184,823 | $ | 230,000 | $ | (23,721 | ) | $ | 206,279 | $ | 195,000 | $ | (17,654 | ) | $ | 177,346 | ||||||||||||||
2019 Convertible Notes Embedded Derivative | 7,491 | — | 7,491 | 5,900 | — | 5,900 | 6,591 | — | 6,591 | ||||||||||||||||||||||||||
2024 Convertible Notes | 143,750 | (39,188 | ) | 104,562 | — | — | — | 143,750 | (42,880 | ) | 100,870 | ||||||||||||||||||||||||
2025 Convertible Notes | 172,500 | (54,165 | ) | 118,335 | — | — | — | — | — | — | |||||||||||||||||||||||||
Other debt* | 3,482 | — | 3,482 | — | — | — | — | — | — | ||||||||||||||||||||||||||
Term loan facility | — | — | — | 50,000 | (1,765 | ) | 48,235 | — | — | — | |||||||||||||||||||||||||
Total | $ | 522,223 | $ | (103,530 | ) | $ | 418,693 | $ | 285,900 | $ | (25,486 | ) | $ | 260,414 | $ | 345,341 | $ | (60,534 | ) | $ | 284,807 | ||||||||||||||
Less current portion | (205,973 | ) | 10,177 | (195,796 | ) | — | — | — | — | — | — | ||||||||||||||||||||||||
Total long-term debt | $ | 316,250 | $ | (93,353 | ) | $ | 222,897 | $ | 285,900 | $ | (25,486 | ) | $ | 260,414 | $ | 345,341 | $ | (60,534 | ) | $ | 284,807 | ||||||||||||||
* | Purchase money financing; debt classified as current as collateral was destroyed. Insurance proceeds are expected to cover the entire loss. |
12
Schedule of Contractual Maturities | |||||||||||||||||||
Total | Less Than 1 Year | 1 - 3 Years | 3 - 5 Years | More Than 5 Years | |||||||||||||||
(in thousands) | |||||||||||||||||||
2019 Convertible Notes* | $ | 195,000 | $ | 195,000 | $ | — | $ | — | $ | — | |||||||||
2024 Convertible Notes* | 143,750 | — | — | — | 143,750 | ||||||||||||||
2025 Convertible Notes* | 172,500 | — | — | — | 172,500 | ||||||||||||||
Other debt | 3,482 | 3,482 | — | — | — | ||||||||||||||
$ | 514,732 | $ | 198,482 | $ | — | $ | — | $ | 316,250 | ||||||||||
* | Excludes the potential impact of embedded derivatives. |
Three Months Ended June 30, | Nine Months Ended June 30, | ||||||||||||||
2018 | 2017 | 2018 | 2017 | ||||||||||||
(in millions) | |||||||||||||||
2019 Convertible Notes: | |||||||||||||||
Contractual interest expense | $ | 1.1 | $ | 1.3 | $ | 3.2 | $ | 3.8 | |||||||
Amortization of debt discount and deferred financing costs | 2.5 | 2.8 | 7.5 | 8.3 | |||||||||||
Total interest expense | $ | 3.6 | $ | 4.1 | $ | 10.7 | $ | 12.1 | |||||||
2024 Convertible Notes: | |||||||||||||||
Contractual interest expense | $ | 1.1 | $ | — | $ | 3.1 | $ | — | |||||||
Amortization of debt discount and deferred financing costs | 1.3 | — | 3.8 | — | |||||||||||
Total interest expense | $ | 2.4 | $ | — | $ | 6.9 | $ | — | |||||||
2025 Convertible Notes: | |||||||||||||||
Contractual interest expense | $ | 0.5 | $ | — | $ | 0.5 | $ | — | |||||||
Amortization of debt discount and deferred financing costs | 0.8 | — | 0.8 | — | |||||||||||
Total interest expense | $ | 1.3 | $ | — | $ | 1.3 | $ | — | |||||||
2.375% Convertible Senior Notes Due 2025
In May 2018, we issued $172.5 million aggregate principal amount of 2.375% Convertible Senior Notes Due 2025 (the “2025 Convertible Notes”). The 2025 Convertible Notes were issued pursuant to an indenture dated May 14, 2018 (the "2018 Indenture") by and between us and Wells Fargo Bank, National Association, as the trustee. The 2025 Convertible Notes were issued in a private offering under Rule 144A under the Securities Act of 1933. The 2025 Convertible Notes pay interest semi-annually in arrears at a rate of 2.375% per annum on May 1 and November 1 of each year, commencing November 1, 2018, and mature on May 1, 2025 (the "2025 Maturity Date"), unless converted, redeemed or repurchased in accordance with their terms prior to such date.
We measured the fair value of the liability component of the 2025 Convertible Notes under a discounted cash flow approach considering our synthetic credit rating, as determined with external consultation, including inputs that are not observable in the market. The fair value of the liability component was estimated by calculating the present value of the cash flows using a discount rate of 8% for a similarly structured liability with no conversion feature, maturing in seven years. Our estimate resulted in an initial carrying value of the liability component of the 2025 Convertible Notes of $121.3 million with an associated original issue discount of $51.2 million, exclusive of deferred financing costs. The carrying amount of the 2025 Convertible Notes as a separate equity-classified instrument (the “2025 Convertible Notes Embedded Derivative”) as initially calculated and is currently included under “Additional paid-in capital” in our condensed consolidated balance sheets of June 30, 2018 was $49.6 million ($39.1 million, net of tax). The 2025 Convertible Notes Embedded Derivative is expected to remain recorded in equity in our condensed consolidated balance sheets as long as it continues to meet the criteria as an equity-classified instrument in subsequent reporting periods. We incurred transaction costs of $5.5 million related to the issuance of the 2025 Convertible Notes, which we recorded as deferred financing costs and are included under “Long-term debt, net” and “Additional paid-in capital” in our condensed consolidated balance sheets. The effective interest rate for the three and nine months ended June 30, 2018 was approximately 9%. As of June 30, 2018, the remaining unamortized debt discount and issuance costs will be amortized through the 2025 Maturity Date assuming no early conversion.
13
The 2025 Convertible Notes are convertible into cash or shares of Class A Non-Voting Common Stock ("Class A Common Stock"), or any combination thereof, at our option subject to satisfaction of certain conditions and during the periods described in the 2018 Indenture, based on an initial conversion rate of 62.8931 shares of Class A Common Stock per $1,000 principal amount of 2025 Convertible Notes (equivalent to an initial conversion price of $15.90 per share of our Class A Common Stock). We account for the Class A Common Stock issuable upon conversion under the treasury stock method. To the extent our average share price is over $15.90 per share for any fiscal quarter, we are required to recognize incremental dilution of our earnings per share.
Prior to November 1, 2024, the 2025 Convertible Notes will be convertible only under the following circumstances: (1) during any fiscal quarter commencing after the fiscal quarter ended on June 30, 2018 (and only during such fiscal quarter), if the last reported sale price of our Class A Common Stock for at least 20 trading days (whether or not consecutive) during a period of 30 consecutive trading days ending on the last trading day of the immediately preceding fiscal quarter is greater than or equal to 130% of the conversion price on each applicable trading day; (2) during the five business day period after any five consecutive trading day period (the “measurement period”) in which the trading price, as defined in the 2018 Indenture, per $1,000 principal amount of notes for each trading day of the measurement period was less than 98% of the product of the last reported sale price of our Class A Common Stock and the conversion rate on such trading day; (3) if we call any or all of the 2025 Convertible Notes for redemption, at any time prior to the close of business on the business day immediately preceding the redemption date; or (4) upon the occurrence of specified corporate events, as defined in the 2018 Indenture. On or after November 1, 2024 until the close of business on the business day immediately preceding the 2025 Maturity Date, holders of 2025 Convertible Notes may, at their option, convert their 2025 Convertible Notes at any time, regardless of the foregoing circumstances.
We may not redeem the 2025 Convertible Notes prior to May 1, 2022. At our option, we may redeem for cash all or any portion of the 2025 Convertible Notes on or after May 1, 2022, if the last reported sale price of the Class A Common Stock has been at least 130% of the conversion price then in effect for at least 20 trading days (whether or not consecutive), including the trading day immediately preceding the date on which we provide notice of redemption, during any 30 consecutive trading day period ending on, and including, the trading day immediately preceding the date on which the Company provides notice of redemption. The redemption price will be equal to 100% of the principal amount of the 2025 Convertible Notes to be redeemed, plus accrued and unpaid interest to, but excluding, the redemption date.
If, among other triggers described in the 2018 Indenture, the market price of our Class A Common Stock meets the threshold based on at least 20 of the final 30 trading days of the quarter for the 2025 Convertible Notes to become convertible at the option of the holders during the subsequent quarter, we may be required to classify the 2025 Convertible Notes as current on our condensed consolidated balance sheets for each quarter in which such triggers are met. The stock trading price condition and other triggers are measured on a quarter-by-quarter basis and were not met as of June 30, 2018. As of June 30, 2018, the if-converted value of the 2025 Convertible Notes did not exceed the principal amount.
2.875% Convertible Senior Notes Due 2024
In July 2017, we issued $143.75 million aggregate principal amount of 2.875% Convertible Senior Notes Due 2024 (the “2024 Convertible Notes”). All of the 2024 Convertible Notes were issued pursuant to an indenture dated July 5, 2017 (the "2017 Indenture") by and between us and Wells Fargo Bank, National Association, as the trustee. The 2024 Convertible Notes were issued in a private offering under Rule 144A under the Securities Act of 1933. The 2024 Convertible Notes pay interest semi-annually in arrears at a rate of 2.875% per annum on January 1 and July 1 of each year, commencing January 1, 2018, and mature on July 1, 2024 (the "2024 Maturity Date"), unless converted, redeemed or repurchased in accordance with their terms prior to such date. The carrying amount of the 2024 Convertible Notes as a separate equity-classified instrument (the “2024 Convertible Notes Embedded Derivative”) included under “Additional paid-in capital” in our condensed consolidated balance sheets of June 30, 2018 was $25.3 million. The effective interest rate for the three and nine months ended June 30, 2018 was approximately 9%. As of June 30, 2018, the remaining unamortized debt discount and issuance costs will be amortized through the 2024 Maturity Date assuming no early conversion.
The 2024 Convertible Notes are convertible into cash or shares of Class A Common Stock, or any combination thereof, at our option subject to satisfaction of certain conditions and during the periods described in the 2017 Indenture, based on an initial conversion rate of 100 shares of Class A Common Stock per $1,000 principal amount of 2024 Convertible Notes (equivalent to an initial conversion price of $10.00 per share of our Class A Common Stock). We account for the Class A Common Stock issuable upon conversion under the treasury stock method. To the extent our average share price is over $10.00 per share for any fiscal quarter, we are required to recognize incremental dilution of our earnings per share.
If, among other triggers described in the 2017 Indenture, the market price of our Class A Common Stock meets the threshold based on at least 20 of the final 30 trading days of a quarter for the 2024 Convertible Notes to become convertible at the option
14
of the holders during the subsequent quarter, we may be required to classify the 2024 Convertible Notes as current on our condensed consolidated balance sheets for each quarter in which such triggers are met. The stock trading price condition and other triggers are measured on a quarter-by-quarter basis and were not met as of June 30, 2018, and therefore, the 2024 Convertible notes are not classified as current as of June 30, 2018. Though not currently convertible, we estimate that the if-converted value of the 2024 Convertible Notes exceeded the principal amount by $39.6 million as of June 30, 2018.
2.125% Cash Convertible Senior Notes Due 2019
In June 2014, we issued $200 million aggregate principal amount of 2.125% Cash Convertible Senior Notes Due 2019 (the "2019 Convertible Notes"), with an additional $30 million principal amount of 2019 Convertible Notes issued in July 2014. In July 2017, we used $34.4 million of net proceeds from the 2024 Convertible Notes offering to repurchase and retire $35.0 million aggregate principal amount of 2019 Convertible Notes. The 2019 Convertible Notes were issued pursuant to an indenture dated June 23, 2014 (the "2014 Indenture") by and between us and Wells Fargo Bank, National Association, as the trustee. The 2019 Convertible Notes were issued in a private offering and resold under Rule 144A under the Securities Act of 1933. The 2019 Convertible Notes pay interest semi-annually in arrears at a rate of 2.125% per annum on June 15 and December 15 of each year and mature on June 15, 2019 (the "2019 Maturity Date"), unless converted, redeemed or repurchased in accordance with their terms prior to such date. The effective interest rate for the three and nine months ended June 30, 2018 and 2017 was approximately 8%. As of June 30, 2018, the remaining unamortized debt discount and issuance costs will be amortized through the 2019 Maturity Date assuming no early conversion.
The 2019 Convertible Notes are convertible into cash, subject to satisfaction of certain conditions and during the periods described in the 2014 Indenture, based on an initial conversion rate of 62.2471 shares of Class A Common Stock per $1,000 principal amount of 2019 Convertible Notes (equivalent to an initial conversion price of approximately $16.065 per share of our Class A Common Stock). As of June 30, 2018, the if-converted value of the 2019 Convertible Notes did not exceed the principal amount.
2019 Convertible Notes Hedges
In connection with the issuance of the 2019 Convertible Notes, we purchased cash-settled call options (the “2019 Convertible Notes Hedges”) in privately negotiated transactions with certain of the initial purchasers or their affiliates (in this capacity, the “Option Counterparties”). The 2019 Convertible Notes Hedges provide us with the option to acquire, on a net settlement basis, approximately 12.1 million shares of our Class A Common Stock at a strike price of $16.065, which is equal to the number of shares of our Class A Common Stock that notionally underlie the 2019 Convertible Notes and corresponds to the conversion price of the 2019 Convertible Notes. If we exercise the 2019 Convertible Notes Hedges, the aggregate amount of cash we will receive from the Option Counterparties will cover the aggregate amount of cash that we would be required to pay to the holders of the converted 2019 Convertible Notes, less the principal amount thereof.
2019 Convertible Notes Warrants
In connection with the issuance of the 2019 Convertible Notes, we also sold net-share-settled warrants (the “2019 Convertible Notes Warrants”) in privately negotiated transactions with the Option Counterparties. Subsequent to repurchase and retirement of $35.0 million aggregate principal amount of 2019 Convertible Notes in July 2017, the 2019 Convertible Notes Warrants allow for the purchase of up to approximately 9.4 million shares of our Class A Common Stock at a strike price of $20.83 per share. We account for the Class A Common Stock issuable upon exercise under the treasury stock method. As a result of the 2019 Convertible Notes Warrants and related transactions, we are required to recognize incremental dilution of our earnings per share to the extent our average share price is over $20.83 for any fiscal quarter. The 2019 Convertible Notes Warrants expire on various dates from September 2019 through February 2020 and must be settled in net shares of our Class A Common Stock.
NOTE 7: STOCK COMPENSATION
On May 1, 2010 our Board of Directors approved the adoption of the EZCORP, Inc. 2010 Long-Term Incentive Plan (the “2010 Plan”). As of September 30, 2017, the 2010 Plan permitted grants of options, restricted stock awards and stock appreciation rights covering up to 3,985,649 shares of our Class A Common Stock. In December 2017, the Board of Directors and the voting stockholder approved the addition of 1,100,000 shares to the 2010 Plan.
In December 2017, we granted 1,308,533 restricted stock unit awards to employees and 84,250 restricted stock awards to non-employee directors with a grant date fair value of primarily $9.75 per share. Our long-term incentive awards are generally granted based on our share price as of October 1 each year, which was $9.50 for these fiscal 2018 awards. For the awards granted to employees, 190,725 vest on September 30, 2018 and 1,117,808 vest on September 30, 2020, subject to the achievement of certain earnings before interest, taxes, depreciation and amortization ("EBITDA") performance targets. As of
15
June 30, 2018, we considered the achievement of these performance targets probable. The awards granted to non-employee directors vest on September 30, 2018 and are subject only to service conditions.
NOTE 8: CONTINGENCIES
We are involved in various claims, suits, investigations and legal proceedings, including those described below. We are unable to determine the ultimate outcome of any current litigation or regulatory actions. An unfavorable outcome could have a material adverse effect on our financial condition, results of operations or liquidity. Except as noted below, we have not recorded a liability for any of these matters as of June 30, 2018 because we do not believe at this time that any loss is probable or that the amount of any probable loss can be reasonably estimated. The following is a description of significant proceedings.
Shareholder derivative litigation — On July 28, 2014, Lawrence Treppel, a purported holder of Class A Common Stock, filed a derivative action in the Court of Chancery of the State of Delaware styled Treppel v. Cohen, et al. (C.A. No. 9962-VCP). The complaint, as originally filed and as amended on September 23, 2014, named as defendants Phillip E. Cohen, the beneficial owner of all of our outstanding Class B Voting Common Stock; several current and former members of our Board of Directors; three entities controlled by Mr. Cohen (MS Pawn Limited Partnership, the record holder of our Class B Voting Common Stock; MS Pawn Corporation, the general partner of MS Pawn Limited Partnership; and Madison Park LLC); and EZCORP, Inc., as nominal defendant. The amended complaint asserted the following claims:
• | Claims against the current and former Board members for breach of fiduciary duties and waste of corporate assets in connection with the Board’s decision to enter into advisory services agreements with Madison Park from October 2004 to June 2014 (Counts I and II, respectively); |
• | Claims against Mr. Cohen and MS Pawn Limited Partnership for aiding and abetting the breaches of fiduciary duties relating to the advisory services agreements with Madison Park (Count III); and |
• | Claims against Mr. Cohen and Madison Park for unjust enrichment for payments under the advisory services agreements (Count IV). |
The plaintiff sought (a) recovery for the Company in the amount of the damages the Company has sustained as a result of the alleged breach of fiduciary duties, waste of corporate assets and aiding and abetting, (b) disgorgement by Mr. Cohen and Madison Park of the benefits they received as a result of the related party transactions and (c) reimbursement of costs and expenses, including reasonable attorney’s fees.
Following briefing and a hearing on the defendants' motions to dismiss, the Court, on January 25, 2016, issued an opinion granting in part and denying in part those motions. Specifically, the Court granted the motion to dismiss Count IV (unjust enrichment) for failure to state a claim. The Court also dismissed Count III (aiding and abetting) as to Mr. Cohen, but interpreted Count I (breach of fiduciary duty) to state a claim against Mr. Cohen and MS Pawn, as well as Thomas C. Roberts (the sole remaining director defendant). The Court otherwise denied the motions to dismiss, including the motion to dismiss Count III (aiding and abetting) against MS Pawn. On March 4, 2016, following the resolution of additional procedural motions, the plaintiff filed a Second Amended Derivative Complaint against Mr. Roberts, Mr. Cohen, Madison Park, MS Pawn Corporation and MS Pawn Limited Partnership with EZCORP, Inc., as nominal defendant.
On August 23, 2017, the parties agreed to a mediated settlement of all remaining claims and entered into a Memorandum of Understanding regarding that settlement. After the completion of confirmatory discovery, the parties agreed to a Stipulation and Agreement of Settlement, Compromise and Release and other settlement papers, which were filed with the Court on January 11, 2018. On April 3, 2018, following a settlement fairness hearing, the Court approved the proposed settlement as presented, as well as a fee award of $1.3 million to the plaintiff’s attorneys, and entered a final and binding judgment to that effect, dismissing the action with prejudice.
Under the terms of the agreed and approved settlement, a total of $6.5 million was paid into a settlement fund. Of such amount, $5.5 million was funded by the Company’s insurance carriers and $1.0 million was funded by Madison Park LLC. After payment of the approved fee to the plaintiff's attorneys, the remaining $5.2 million of the settlement fund was paid to the Company because, as a derivative action, the lawsuit was brought on behalf of the Company. We recorded that amount in "Other income" in our condensed consolidated statements of operations for the third quarter of fiscal 2018.
Federal Securities Litigation (WDT) — On July 20, 2015, Wu Winfred Huang, a purported holder of Class A Common Stock, for himself and on behalf of other similarly situated holders of Class A Common Stock, filed a lawsuit in the United States District Court for the Western District of Texas styled Huang v. EZCORP, Inc., et al. (Case No. 1:15-cv-00608-SS). The complaint names as defendants EZCORP, Inc., Stuart I. Grimshaw (our chief executive officer) and Mark E. Kuchenrither (our former chief financial officer) and asserts violations of Sections 10(b) and 20(a) of the Securities Exchange Act of 1934 and
16
Rule 10b-5 promulgated thereunder. The original complaint related to the Company’s announcement on July 17, 2015 that it will restate the financial statements for fiscal 2014 and the first quarter of fiscal 2015, and alleged generally that the Company issued materially false or misleading statements concerning the Company, its finances, business operations and prospects and that the Company misrepresented the financial performance of the Grupo Finmart business.
On August 14, 2015, a substantially identical lawsuit, styled Rooney v. EZCORP, Inc., et al. (Case No. 1:15-cv-00700-SS) was also filed in the United States District Court for the Western District of Texas. On September 28, 2015, the plaintiffs in these two lawsuits filed an agreed stipulation to be appointed co-lead plaintiffs and agreed that their two actions should be consolidated. On November 3, 2015, the Court entered an order consolidating the two actions under the caption In re EZCORP, Inc. Securities Litigation (Master File No. 1:15-cv-00608-SS), and appointed the two plaintiffs as co-lead plaintiffs, with their respective counsel appointed as co-lead counsel.
On January 11, 2016, the plaintiffs filed an Amended Class Action Complaint (the "Amended Complaint"). In the Amended Complaint, the plaintiffs seek to represent a class of purchasers of our Class A Common Stock between November 6, 2012 and October 20, 2015. The Amended Complaint asserts that the Company and Mr. Kuchenrither violated Section 10(b) of the Securities Exchange Act and Rule 10b-5, issued materially false or misleading statements throughout the proposed class period concerning the Company and its internal controls, specifically regarding the financial performance of Grupo Finmart. The plaintiffs also allege that Mr. Kuchenrither, as a controlling person of the Company, violated Section 20(a) of the Securities Exchange Act. The Amended Complaint does not assert any claims against Mr. Grimshaw. On February 25, 2016, defendants filed a motion to dismiss the lawsuit. The plaintiff filed an opposition to the motion to dismiss on April 11, 2016, and the defendants filed their reply on May 11, 2016. The Court held a hearing on the motion to dismiss on June 22, 2016.
On October 18, 2016, the Court granted the defendants’ motion to dismiss and dismissed the Amended Complaint without prejudice. The Court gave the plaintiffs 20 days (until November 7, 2016) to file a further amended complaint. On November 4, 2016, the plaintiffs filed a Second Amended Consolidated Class Action Complaint (“Second Amended Complaint”). The Second Amended Complaint raises the same claims dismissed by the Court on October 18, 2016, except plaintiffs now seek to represent a class of purchasers of EZCORP’s Class A Common Stock between November 7, 2013 and October 20, 2015 (instead of between November 6, 2012 and October 20, 2015). On December 5, 2016, defendants filed a motion to dismiss the Second Amended Compliant. The plaintiffs filed their opposition to the motion to dismiss on January 6, 2017, and the defendants filed their reply brief on January 20, 2017.
On May 8, 2017, the Court granted the defendants’ motion to dismiss with regard to claims related to accounting errors relating to Grupo Finmart’s bad debt reserve calculations for “nonperforming” loans, but denied the motion to dismiss with regard to claims relating to accounting errors related to certain sales of loan portfolios to third parties.
Following discovery on the surviving claims, the plaintiff filed a Motion for Leave to File a Third Amended Complaint, seeking to revive the "nonperforming" loan claims that the Court previously dismissed. We opposed that motion, and on May 14, 2018, the Court heard oral arguments on the motion, as well as plaintiff's Motion for Class Certification and Appointment of Class Representative and Class Counsel, which was also pending.
On July 26, 2018, the Court granted the plaintiff's motion for leave to amend, thus accepting the Third Amended Consolidated Class Action Complaint, and gave the defendants until August 3, 2018 to file their amended answer. The Court also dismissed the motion for class certification and gave plaintiff until August 31, 2018 to amend and refile such motion.
We cannot predict the outcome of the litigation, but we intend to continue to defend vigorously against all allegations and claims.
SEC Investigation — On October 23, 2014, we received a notice from the Fort Worth Regional Office of the SEC that it was conducting an investigation into certain matters involving EZCORP, Inc. The notice was accompanied by a subpoena, directing us to produce a variety of documents, including all minutes and materials related to Board of Directors and Board committee meetings since January 1, 2009 and all documents and communications relating to our historical advisory services relationship with Madison Park (the business advisory firm owned by Mr. Cohen) and LPG Limited (a business advisory firm owned by Lachlan P. Given, our current Executive Chairman of the Board). The SEC has also issued subpoenas to current and former members of our Board of Directors requesting production of similar documents, as well as to certain third parties, and has conducted interviews with certain individuals. We continue to cooperate fully with the SEC in its investigation.
17
NOTE 9: SEGMENT INFORMATION
Following the acquisition of GPMX during the first quarter of fiscal 2018 (see Note 2), we have retitled our Mexico Pawn segment to "Latin America Pawn" and have combined the results of GPMX with the results of our Mexico pawn business, as we expect the financial performance and economic characteristics of those businesses to be similar over the long-term. Segment information is prepared on the same basis that our chief operating decision maker reviews financial information for operational decision-making purposes. As a result, we currently report our segments as follows: U.S. Pawn — all pawn activities in the United States; Latin America Pawn — all pawn activities in Mexico and other parts of Latin America; and Other International — primarily our equity interest in the net income of Cash Converters International and consumer finance activities in Canada. There are no inter-segment revenues, and the amounts below were determined in accordance with the same accounting principles used in our consolidated financial statements.
Three Months Ended June 30, 2018 | |||||||||||||||||||||||
U.S. Pawn | Latin America Pawn | Other International | Total Segments | Corporate Items | Consolidated | ||||||||||||||||||
(in thousands) | |||||||||||||||||||||||
Revenues: | |||||||||||||||||||||||
Merchandise sales | $ | 83,898 | $ | 20,839 | $ | — | $ | 104,737 | $ | — | $ | 104,737 | |||||||||||
Jewelry scrapping sales | 17,813 | 2,615 | — | 20,428 | — | 20,428 | |||||||||||||||||
Pawn service charges | 55,620 | 17,254 | — | 72,874 | — | 72,874 | |||||||||||||||||
Other revenues | 55 | 245 | 1,603 | 1,903 | — | 1,903 | |||||||||||||||||
Total revenues | 157,386 | 40,953 | 1,603 | 199,942 | — | 199,942 | |||||||||||||||||
Merchandise cost of goods sold | 52,340 | 14,556 | — | 66,896 | — | 66,896 | |||||||||||||||||
Jewelry scrapping cost of goods sold | 15,329 | 2,296 | — | 17,625 | — | 17,625 | |||||||||||||||||
Other cost of revenues | — | — | 349 | 349 | — | 349 | |||||||||||||||||
Net revenues | 89,717 | 24,101 | 1,254 | 115,072 | — | 115,072 | |||||||||||||||||
Segment and corporate expenses (income): | |||||||||||||||||||||||
Operations | 65,257 | 15,097 | 2,678 | 83,032 | — | 83,032 | |||||||||||||||||
Administrative | — | — | — | — | 13,268 | 13,268 | |||||||||||||||||
Depreciation and amortization | 3,010 | 951 | 48 | 4,009 | 2,115 | 6,124 | |||||||||||||||||
Loss on sale or disposal of assets | 74 | 26 | — | 100 | 214 | 314 | |||||||||||||||||
Interest expense | — | 3 | — | 3 | 7,391 | 7,394 | |||||||||||||||||
Interest income | — | (672 | ) | — | (672 | ) | (3,686 | ) | (4,358 | ) | |||||||||||||
Equity in net income of unconsolidated affiliate | — | — | (1,151 | ) | (1,151 | ) | — | (1,151 | ) | ||||||||||||||
Other income | — | (103 | ) | — | (103 | ) | (5,184 | ) | (5,287 | ) | |||||||||||||
Segment contribution (loss) | $ | 21,376 | $ | 8,799 | $ | (321 | ) | $ | 29,854 | ||||||||||||||
Income from continuing operations before income taxes | $ | 29,854 | $ | (14,118 | ) | $ | 15,736 | ||||||||||||||||
18
Three Months Ended June 30, 2017 | |||||||||||||||||||||||
U.S. Pawn | Latin America Pawn | Other International | Total Segments | Corporate Items | Consolidated | ||||||||||||||||||
(in thousands) | |||||||||||||||||||||||
Revenues: | |||||||||||||||||||||||
Merchandise sales | $ | 82,714 | $ | 15,207 | $ | — | $ | 97,921 | $ | — | $ | 97,921 | |||||||||||
Jewelry scrapping sales | 17,257 | 384 | — | 17,641 | — | 17,641 | |||||||||||||||||
Pawn service charges | 56,774 | 9,104 | — | 65,878 | — | 65,878 | |||||||||||||||||
Other revenues | 50 | 179 | 1,964 | 2,193 | — | 2,193 | |||||||||||||||||
Total revenues | 156,795 | 24,874 | 1,964 | 183,633 | — | 183,633 | |||||||||||||||||
Merchandise cost of goods sold | 52,488 | 10,127 | — | 62,615 | — | 62,615 | |||||||||||||||||
Jewelry scrapping cost of goods sold | 14,674 | 336 | — | 15,010 | — | 15,010 | |||||||||||||||||
Other cost of revenues | — | — | 453 | 453 | — | 453 | |||||||||||||||||
Net revenues | 89,633 | 14,411 | 1,511 | 105,555 | — | 105,555 | |||||||||||||||||
Segment and corporate expenses (income): | |||||||||||||||||||||||
Operations | 63,593 | 8,898 | 1,755 | 74,246 | — | 74,246 | |||||||||||||||||
Administrative | — | — | — | — | 14,095 | 14,095 | |||||||||||||||||
Depreciation and amortization | 2,210 | 619 | 44 | 2,873 | 2,970 | 5,843 | |||||||||||||||||
Loss (gain) on sale or disposal of assets | 20 | (3 | ) | — | 17 | — | 17 | ||||||||||||||||
Interest expense | — | 2 | — | 2 | 5,652 | 5,654 | |||||||||||||||||
Interest income | — | (480 | ) | — | (480 | ) | (1,573 | ) | (2,053 | ) | |||||||||||||
Equity in net income of unconsolidated affiliate | — | — | (1,047 | ) | (1,047 | ) | — | (1,047 | ) | ||||||||||||||
Other income | (5 | ) | (24 | ) | (68 | ) | (97 | ) | (2 | ) | (99 | ) | |||||||||||
Segment contribution | $ | 23,815 | $ | 5,399 | $ | 827 | $ | 30,041 | |||||||||||||||
Income from continuing operations before income taxes | $ | 30,041 | $ | (21,142 | ) | $ | 8,899 | ||||||||||||||||
19
Nine Months Ended June 30, 2018 | |||||||||||||||||||||||
U.S. Pawn | Latin America Pawn | Other International | Total Segments | Corporate Items | Consolidated | ||||||||||||||||||
(in thousands) | |||||||||||||||||||||||
Revenues: | |||||||||||||||||||||||
Merchandise sales | $ | 270,145 | $ | 63,125 | $ | — | $ | 333,270 | $ | — | $ | 333,270 | |||||||||||
Jewelry scrapping sales | 34,515 | 9,651 | — | 44,166 | — | 44,166 | |||||||||||||||||
Pawn service charges | 174,439 | 49,162 | — | 223,601 | — | 223,601 | |||||||||||||||||
Other revenues | 205 | 588 | 5,354 | 6,147 | — | 6,147 | |||||||||||||||||
Total revenues | 479,304 | 122,526 | 5,354 | 607,184 | — | 607,184 | |||||||||||||||||
Merchandise cost of goods sold | 166,965 | 43,318 | — | 210,283 | — | 210,283 | |||||||||||||||||
Jewelry scrapping cost of goods sold | 28,683 | 8,853 | — | 37,536 | — | 37,536 | |||||||||||||||||
Other cost of revenues | — | — | 1,273 | 1,273 | — | 1,273 | |||||||||||||||||
Net revenues | 283,656 | 70,355 | 4,081 | 358,092 | — | 358,092 | |||||||||||||||||
Segment and corporate expenses (income): | |||||||||||||||||||||||
Operations | 196,748 | 44,778 | 7,276 | 248,802 | — | 248,802 | |||||||||||||||||
Administrative | — | — | — | — | 39,927 | 39,927 | |||||||||||||||||
Depreciation and amortization | 9,340 | 2,712 | 142 | 12,194 | 6,104 | 18,298 | |||||||||||||||||
Loss on sale or disposal of assets | 197 | 31 | — | 228 | 225 | 453 | |||||||||||||||||
Interest expense | — | 6 | — | 6 | 19,064 | 19,070 | |||||||||||||||||
Interest income | — | (2,072 | ) | — | (2,072 | ) | (10,824 | ) | (12,896 | ) | |||||||||||||
Equity in net income of unconsolidated affiliate | — | — | (3,477 | ) | (3,477 | ) | — | (3,477 | ) | ||||||||||||||
Other (income) expense | (3 | ) | 11 | (118 | ) | (110 | ) | (5,363 | ) | (5,473 | ) | ||||||||||||
Segment contribution | $ | 77,374 | $ | 24,889 | $ | 258 | $ | 102,521 | |||||||||||||||
Income from continuing operations before income taxes | $ | 102,521 | $ | (49,133 | ) | $ | 53,388 | ||||||||||||||||
20
Nine Months Ended June 30, 2017 | |||||||||||||||||||||||
U.S. Pawn | Latin America Pawn | Other International | Total Segments | Corporate Items | Consolidated | ||||||||||||||||||
(in thousands) | |||||||||||||||||||||||
Revenues: | |||||||||||||||||||||||
Merchandise sales | $ | 273,125 | $ | 46,547 | $ | — | $ | 319,672 | $ | — | $ | 319,672 | |||||||||||
Jewelry scrapping sales | 35,158 | 2,500 | — | 37,658 | — | 37,658 | |||||||||||||||||
Pawn service charges | 177,480 | 24,503 | — | 201,983 | — | 201,983 | |||||||||||||||||
Other revenues | 157 | 457 | 5,958 | 6,572 | — | 6,572 | |||||||||||||||||
Total revenues | 485,920 | 74,007 | 5,958 | 565,885 | — | 565,885 | |||||||||||||||||
Merchandise cost of goods sold | 173,235 | 31,605 | — | 204,840 | — | 204,840 | |||||||||||||||||
Jewelry scrapping cost of goods sold | 30,114 | 2,081 | — | 32,195 | — | 32,195 | |||||||||||||||||
Other cost of revenues | — | — | 1,433 | 1,433 | — | 1,433 | |||||||||||||||||
Net revenues | 282,571 | 40,321 | 4,525 | 327,417 | — | 327,417 | |||||||||||||||||
Segment and corporate expenses (income): | |||||||||||||||||||||||
Operations | 194,499 | 26,439 | 5,414 | 226,352 | — | 226,352 | |||||||||||||||||
Administrative | — | — | — | — | 41,305 | 41,305 | |||||||||||||||||
Depreciation and amortization | 7,487 | 1,910 | 144 | 9,541 | 8,705 | 18,246 | |||||||||||||||||
Loss (gain) on sale or disposal of assets | (54 | ) | 65 | — | 11 | — | 11 | ||||||||||||||||
Interest expense | — | 7 | — | 7 | 16,840 | 16,847 | |||||||||||||||||
Interest income | — | (889 | ) | — | (889 | ) | (6,020 | ) | (6,909 | ) | |||||||||||||
Equity in net income of unconsolidated affiliate | — | — | (3,768 | ) | (3,768 | ) | — | (3,768 | ) | ||||||||||||||
Other income | (14 | ) | (61 | ) | (28 | ) | (103 | ) | (191 | ) | (294 | ) | |||||||||||
Segment contribution | $ | 80,653 | $ | 12,850 | $ | 2,763 | $ | 96,266 | |||||||||||||||
Income from continuing operations before income taxes | $ | 96,266 | $ | (60,639 | ) | $ | 35,627 | ||||||||||||||||
21
NOTE 10: SUPPLEMENTAL CONSOLIDATED FINANCIAL INFORMATION
The following table provides supplemental information on net amounts included in our condensed consolidated balance sheets:
June 30, 2018 | June 30, 2017 | September 30, 2017 | |||||||||
(in thousands) | |||||||||||
Gross pawn service charges receivable | $ | 44,522 | $ | 41,533 | $ | 42,117 | |||||
Allowance for uncollectible pawn service charges receivable | (11,134 | ) | (10,948 | ) | (10,569 | ) | |||||
Pawn service charges receivable, net | $ | 33,388 | $ | 30,585 | $ | 31,548 | |||||
Gross inventory | $ | 160,159 | $ | 141,510 | $ | 161,212 | |||||
Inventory reserves | (9,014 | ) | (6,457 | ) | (6,801 | ) | |||||
Inventory, net | $ | 151,145 | $ | 135,053 | $ | 154,411 | |||||
Prepaid expenses and other | $ | 10,545 | $ | 10,421 | $ | 9,250 | |||||
Accounts receivable and other | 25,160 | 17,483 | 19,515 | ||||||||
Restricted cash | 252 | 4,089 | — | ||||||||
2019 Convertible Notes Hedges | 7,491 | — | — | ||||||||
Prepaid expenses and other current assets | $ | 43,448 | $ | 31,993 | $ | 28,765 | |||||
Property and equipment, gross | $ | 248,880 | $ | 215,823 | $ | 224,240 | |||||
Accumulated depreciation | (177,293 | ) | (162,801 | ) | (166,281 | ) | |||||
Property and equipment, net | $ | 71,587 | $ | 53,022 | $ | 57,959 | |||||
Accounts payable | $ | 12,381 | $ | 10,673 | $ | 13,064 | |||||
Accrued expenses and other | 49,432 | 54,157 | 48,479 | ||||||||
Accounts payable, accrued expenses and other current liabilities | $ | 61,813 | $ | 64,830 | $ | 61,543 | |||||
ITEM 2. MANAGEMENT'S DISCUSSION AND ANALYSIS OF FINANCIAL CONDITION AND RESULTS OF OPERATIONS
The discussion in this section contains forward-looking statements that are based on our current expectations. Actual results could differ materially from those expressed or implied by the forward-looking statements due to a number of risks, uncertainties and other factors, including those identified in "Part I, Item 1A — Risk Factors" of our Annual Report on Form 10-K for the year ended September 30, 2017, as supplemented by the information set forth in “Part I, Item 3 — Quantitative and Qualitative Disclosures about Market Risk” and "Part II, Item 1 — Legal Proceedings" of this Quarterly Report.
Overview and Financial Highlights
EZCORP is a Delaware corporation headquartered in Austin, Texas. We are a leading provider of pawn loans in the United States and Latin America.
Our vision is to be the leader internationally in responsibly and respectfully meeting our customers' desire for access to cash whenever they want it. That vision is supported by four key imperatives:
• | Market Leading Customer Satisfaction; |
• | Exceptional Staff Engagement; |
• | Most Efficient Provider of Cash; and |
• | Attractive Shareholder Returns. |
At our pawn stores, we offer pawn loans, which are non-recourse loans collateralized by tangible personal property, and sell merchandise to customers looking for good value. The merchandise we sell consists of second-hand collateral forfeited from our pawn lending activities or purchased from customers.
22
We remain focused on growing our balance of pawn loans outstanding (“PLO”) and generating higher pawn service charges (“PSC”). The following charts present sources of net revenues, including PSC, merchandise sales gross profit ("Merchandise sales GP") and jewelry scrapping gross profit ("Jewelry scrapping GP"):
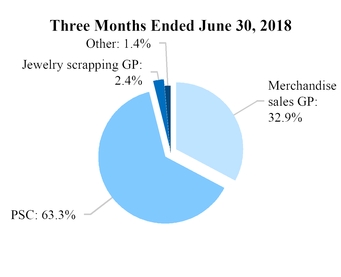
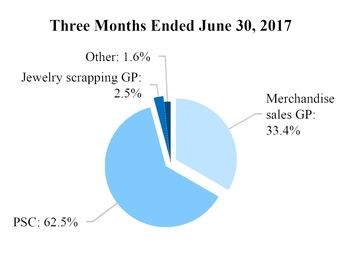
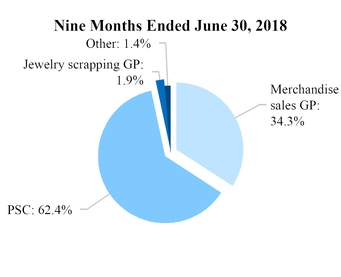
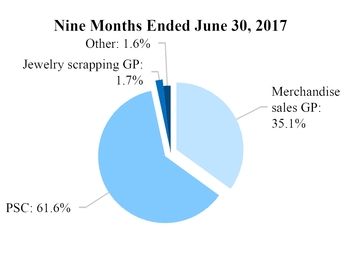
23
The following charts present sources of net revenues by geographic disbursement:
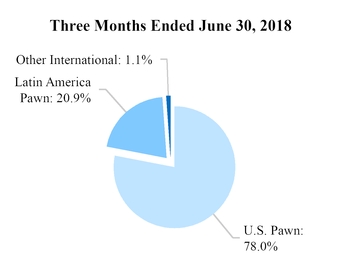
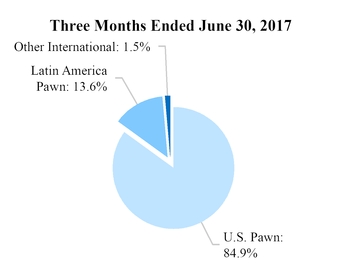
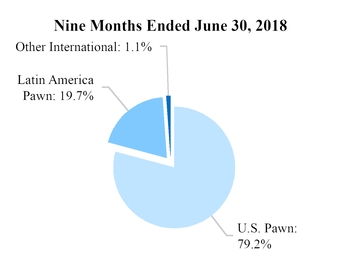
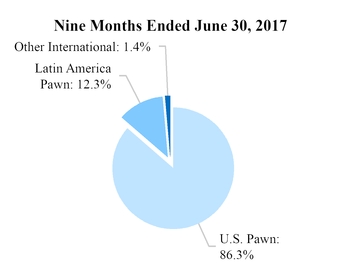
The following charts present store counts by geographic disbursement:
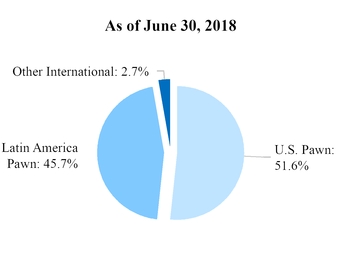
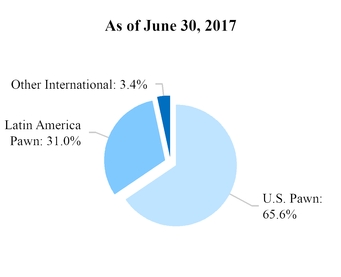
24
Pawn Activities
At our pawn stores, we offer pawn loans, which are typically small, non-recourse loans collateralized by tangible personal property. We earn pawn service charges on our pawn loans, which varies by state and loan size. Collateral for our pawn loans consists of tangible personal property, generally jewelry, consumer electronics, tools, sporting goods and musical instruments. Security for our pawn loans is provided via the estimated resale value of the collateral and the perceived probability of the loan’s redemption.
Our ability to offer quality second-hand goods at prices significantly lower than original retail prices attracts value-conscious customers. The gross profit on sales of inventory depends primarily on our assessment of the loan or purchase value at the time the property is either accepted as loan collateral or purchased. As a significant portion of our inventory and sales involve gold and jewelry, our results can be heavily influenced by the market price of gold.
Growth and Expansion
We plan to expand the number of locations we operate through opening new (“de novo”) locations and through acquisitions. We believe there are growth opportunities with de novo stores in Latin America and pawn store acquisitions in both Latin America and in the U.S. Our ability to add new stores is dependent on several variables, such as the availability of acceptable sites or acquisition candidates and the alignment of acquirer/seller price expectations, the regulatory environment, local zoning ordinances, access to capital, availability of qualified personnel and projected financial results meeting our investment hurdles.
Our Latin America Pawn business continues to grow rapidly. In the nine months ended June 30, 2018, we opened 10 de novo stores and acquired 196 stores: 112 located in Guatemala, El Salvador, Honduras and Peru; and 84 located in Mexico. We see opportunity for further expansion in Latin America through de novo openings and acquisitions, and plan to open several additional de novo stores in Latin America during the remainder of fiscal 2018. We have provided same store net revenue information in our discussion of our Latin America Pawn segment. Operating and other expenses in our Latin America Pawn segment increased primarily as a result of costs associated with these acquisitions and de novo stores. For further description of acquisitions consummated during the current nine-months, see Note 2 of Notes to Interim Condensed Consolidated Financial Statements included in "Part I, Item 1 — Financial Statements."
Seasonality and Quarterly Results
Historically, pawn service charges are highest in our fourth fiscal quarter (July through September) due to a higher average loan balance during the summer lending season. Loan balances are generally lower in our second fiscal quarter (January through March). Merchandise sales are highest in our first and second fiscal quarters (October through March) due to the holiday season, jewelry sales surrounding Valentine’s Day and the availability of tax refunds in the United States. As a net effect of these factors, our earnings generally are lowest during our third fiscal quarter (April through June).
Store Data by Segment
Three Months Ended June 30, 2018 | |||||||||||
U.S. Pawn | Latin America Pawn | Other International | Consolidated | ||||||||
As of March 31, 2018 | 510 | 387 | 27 | 924 | |||||||
New locations opened | — | 2 | — | 2 | |||||||
Locations acquired | — | 63 | — | 63 | |||||||
Locations sold, combined or closed | — | (1 | ) | — | (1 | ) | |||||
As of June 30, 2018 | 510 | 451 | 27 | 988 | |||||||
Three Months Ended June 30, 2017 | |||||||||||
U.S. Pawn | Latin America Pawn | Other International | Consolidated | ||||||||
As of March 31, 2017 | 517 | 240 | 27 | 784 | |||||||
New locations opened | — | 4 | — | 4 | |||||||
Locations sold, combined or closed | (2 | ) | — | — | (2 | ) | |||||
As of June 30, 2017 | 515 | 244 | 27 | 786 | |||||||
25
Nine Months Ended June 30, 2018 | |||||||||||
U.S. Pawn | Latin America Pawn | Other International | Consolidated | ||||||||
As of September 30, 2017 | 513 | 246 | 27 | 786 | |||||||
New locations opened | — | 10 | — | 10 | |||||||
Locations acquired | — | 196 | — | 196 | |||||||
Locations sold, combined or closed | (3 | ) | (1 | ) | — | (4 | ) | ||||
As of June 30, 2018 | 510 | 451 | 27 | 988 | |||||||
Nine Months Ended June 30, 2017 | |||||||||||
U.S. Pawn | Latin America Pawn | Other International | Consolidated | ||||||||
As of September 30, 2016 | 520 | 239 | 27 | 786 | |||||||
New locations opened | — | 6 | — | 6 | |||||||
Locations sold, combined or closed | (5 | ) | (1 | ) | — | (6 | ) | ||||
As of June 30, 2017 | 515 | 244 | 27 | 786 | |||||||
26
Results of Operations
Three Months Ended June 30, 2018 vs. Three Months Ended June 30, 2017
These tables, as well as the discussion that follows, should be read with the accompanying condensed consolidated financial statements and related notes. All comparisons, unless otherwise noted, are to the prior-year quarter.
U.S. Pawn
The following table presents selected summary financial data from continuing operations for the U.S. Pawn segment:
Three Months Ended June 30, | Change | ||||||||
2018 | 2017 | ||||||||
(in thousands) | |||||||||
Net revenues: | |||||||||
Pawn service charges | $ | 55,620 | $ | 56,774 | (2)% | ||||
Merchandise sales | 83,898 | 82,714 | 1% | ||||||
Merchandise sales gross profit | 31,558 | 30,226 | 4% | ||||||
Gross margin on merchandise sales | 38 | % | 37 | % | 100bps | ||||
Jewelry scrapping sales | 17,813 | 17,257 | 3% | ||||||
Jewelry scrapping sales gross profit | 2,484 | 2,583 | (4)% | ||||||
Gross margin on jewelry scrapping sales | 14 | % | 15 | % | (100)bps | ||||
Other revenues | 55 | 50 | 10% | ||||||
Net revenues | 89,717 | 89,633 | —% | ||||||
Segment operating expenses: | |||||||||
Operations | 65,257 | 63,593 | 3% | ||||||
Depreciation and amortization | 3,010 | 2,210 | 36% | ||||||
Segment operating contribution | 21,450 | 23,830 | (10)% | ||||||
Other segment expenses | 74 | 15 | 393% | ||||||
Segment contribution | $ | 21,376 | $ | 23,815 | (10)% | ||||
Other data: | |||||||||
Net earning assets — continuing operations (a) | $ | 267,104 | $ | 264,042 | 1% | ||||
Inventory turnover | 2.1 | 2.3 | (9)% | ||||||
Average pawn loan balance per store (b) | $ | 270 | $ | 273 | (1)% | ||||
Monthly average yield on pawn loans outstanding | 14 | % | 14 | % | — | ||||
Pawn loan redemption rate (c) | 86 | % | 85 | % | 100bps | ||||
(a) | Balance includes pawn loans and inventory. |
(b) | Balance is calculated based upon the average of the monthly ending balances during the applicable period. |
(c) | Our pawn loan redemption rate represents the percentage of loans made that are repaid, renewed or extended at a point in time as opposed to the life of the loan. |
27
Net revenue increased $0.1 million, primarily due to higher gross margins from our merchandise sales, offset by a decrease in pawn service charges. The change in net revenue attributable to same stores and new stores added/closed since the prior-year quarter is summarized as follows:
Change in Net Revenue | |||||||||||
Pawn Service Charges | Merchandise Sales Gross Profit | Total | |||||||||
(in millions) | |||||||||||
Same stores | $ | (1.0 | ) | $ | 1.5 | $ | 0.5 | ||||
New stores and other* | (0.2 | ) | (0.2 | ) | (0.4 | ) | |||||
Total | $ | (1.2 | ) | $ | 1.3 | $ | 0.1 | ||||
Change in jewelry scrapping sales gross profit and other revenues | — | ||||||||||
Total change in net revenue | $ | 0.1 | |||||||||
* | Balances are comprised of two new stores and seven closed stores. |
Pawn service charges decreased 2% due to a similar decrease in average PLO balances during the current quarter, with yield unchanged. The lower average PLO balance continues to reflect the negative effect on our pawn loan portfolio of Hurricanes Harvey and Irma in the fourth quarter of fiscal 2017.
Merchandise sales increased 1% with gross margin on merchandise sales of 38%, a 100 basis point improvement over the prior-year quarter. As a result, merchandise sales gross profit increased 4% to $31.6 million. The increase in merchandise sales gross profit is due to enhanced discipline in pricing and discounting. We expect sales gross margin for the full fiscal year to be within our target range of 35-38% as we expect to accept a slightly lower margin in order to sell through a greater amount of inventory.
Jewelry scrapping sales gross profit remained relatively flat at 3% of current quarter net revenues, in-line with our strategy to sell rather than scrap merchandise, with a 100 basis point decrease in gross margin to 14%.
Segment contribution decreased 10% due to a 3% increase in operations expenses, comprised primarily of labor, and a 36% increase in depreciation and amortization due to additional capital expenditures associated with our store refresh initiatives.
Non-GAAP Financial Information
In addition to the financial information prepared in conformity with generally accepted accounting principles in the United States of America ("GAAP"), we provide certain other non-GAAP financial information on a constant currency basis ("constant currency"). We use constant currency results to evaluate our Latin America Pawn operations, which are denominated primarily in Mexican pesos and other Latin American currencies. As GPMX was not acquired until fiscal 2018, such results included on a constant currency basis reflect the actual exchange rates in effect during the three and nine months ended June 30, 2018 without adjustment. We believe that presentation of constant currency results is meaningful and useful in understanding the activities and business metrics of our Latin America Pawn operations and reflect an additional way of viewing aspects of our business that, when viewed with GAAP results, provide a more complete understanding of factors and trends affecting our business. We provide non-GAAP financial information for informational purposes and to enhance understanding of our GAAP consolidated financial statements. We use this non-GAAP financial information to evaluate and compare operating results across accounting periods. Readers should consider the information in addition to, but not instead of or superior to, our financial statements prepared in accordance with GAAP. This non-GAAP financial information may be determined or calculated differently by other companies, limiting the usefulness of those measures for comparative purposes.
Constant currency results reported herein are calculated by translating consolidated balance sheet and consolidated statement of operations items denominated in Mexican pesos to U.S. dollars using the exchange rate from the prior-year comparable period, as opposed to the current period, in order to exclude the effects of foreign currency rate fluctuations. We used the end-of-period rate for balance sheet items and the average closing daily exchange rate on a monthly basis during the appropriate period for statement of operations items. The end-of-period Mexican peso to U.S. dollar exchange rate as of June 30, 2018 and 2017 was 19.9 to 1 and 18.0 to 1, respectively. The approximate average Mexican peso to U.S. dollar exchange rate for the three months ended June 30, 2018 and 2017 was 19.4 to 1 and 18.6 to 1, respectively. The approximate average Mexican peso to U.S. dollar exchange rate for the nine months ended June 30, 2018 and 2017 was 19.0 to 1 and 19.5 to 1, respectively.
Our statement of operations constant currency results reflect the monthly exchange rate fluctuations and so are not directly calculable from the above rates. Constant currency results, where presented, also exclude the foreign currency gain or loss. We
28
have experienced a prolonged weakening of the Mexican peso to the U.S. dollar and may continue to experience further weakening in future reporting periods, which may adversely impact our future operating results when stated on a GAAP basis.
29
Latin America Pawn
The following table presents selected summary financial data from continuing operations for the Latin America Pawn segment, including constant currency results, after translation to U.S. dollars from its functional currencies of the Mexican peso, Guatemalan quetzal, Honduran lempira and Peruvian sol. See “Results of Operations — Non-GAAP Financial Information” above.
Three Months Ended June 30, | |||||||||||||||
2018 (GAAP) | 2017 (GAAP) | Change (GAAP) | 2018 (Constant Currency) | Change (Constant Currency) | |||||||||||
(in USD thousands) | (in USD thousands) | ||||||||||||||
Net revenues: | |||||||||||||||
Pawn service charges | $ | 17,254 | $ | 9,104 | 90% | $ | 17,758 | 95% | |||||||
Merchandise sales | 20,839 | 15,207 | 37% | 21,642 | 42% | ||||||||||
Merchandise sales gross profit | 6,283 | 5,080 | 24% | 6,522 | 28% | ||||||||||
Gross margin on merchandise sales | 30 | % | 33 | % | (300)bps | 30 | % | (300)bps | |||||||
Jewelry scrapping sales | 2,615 | 384 | 581% | 2,684 | 599% | ||||||||||
Jewelry scrapping sales gross profit | 319 | 48 | 565% | 326 | 579% | ||||||||||
Gross margin on jewelry scrapping sales | 12 | % | 13 | % | (100)bps | 12 | % | (100)bps | |||||||
Other revenues | 245 | 179 | 37% | 256 | 43% | ||||||||||
Net revenues | 24,101 | 14,411 | 67% | 24,862 | 73% | ||||||||||
Segment operating expenses: | |||||||||||||||
Operations | 15,097 | 8,898 | 70% | 15,584 | 75% | ||||||||||
Depreciation and amortization | 951 | 619 | 54% | 989 | 60% | ||||||||||
Segment operating contribution | 8,053 | 4,894 | 65% | 8,289 | 69% | ||||||||||
Other segment income (a) | (746 | ) | (505 | ) | 48% | (684 | ) | 35% | |||||||
Segment contribution | $ | 8,799 | $ | 5,399 | 63% | $ | 8,973 | 66% | |||||||
Other data: | |||||||||||||||
Net earning assets — continuing operations (b) | $ | 67,090 | $ | 39,246 | 71% | $ | 71,927 | 83% | |||||||
Inventory turnover | 2.5 | 2.3 | 9% | 2.6 | 13% | ||||||||||
Average pawn loan balance per store (c) | $ | 90 | $ | 78 | 15% | $ | 93 | 19% | |||||||
Monthly average yield on pawn loans outstanding | 16 | % | 16 | % | — | 16 | % | — | |||||||
Pawn loan redemption rate (d) | 79 | % | 78 | % | 100bps | 79 | % | 100bps | |||||||
(a) | The three months ended June 30, 2018 constant currency balance excludes $0.1 million in net GAAP basis foreign currency transaction gains resulting from movement in exchange rates. The net foreign currency transaction gains for the three months ended June 30, 2017 were nominal and are not excluded from the above results. |
(b) | Balance includes pawn loans and inventory. |
(c) | Balance is calculated based upon the average of the monthly ending balances during the applicable period. |
(d) | Our pawn loan redemption rate represents the percentage of loans made that are repaid, renewed or extended at a point in time as opposed to the life of the loan. |
We acquired 63 pawn stores located in Mexico and opened two de novo stores in the current quarter. We see opportunity for further expansion in Latin America through de novo openings and acquisitions, and plan to open several additional de novo stores in Latin America during the remainder of fiscal 2018.
30
Net revenue increased $9.7 million, or 67% ($10.5 million, or 73%, on a constant currency basis). The increase in net revenue attributable to same stores and new stores added/closed since the prior-year quarter is summarized as follows:
Change in Net Revenue | |||||||||||
Pawn Service Charges | Merchandise Sales Gross Profit | Total | |||||||||
(in millions) | |||||||||||
Same stores | $ | 0.4 | $ | (0.2 | ) | $ | 0.2 | ||||
New stores and other* | 7.8 | 1.4 | 9.2 | ||||||||
Total | $ | 8.2 | $ | 1.2 | $ | 9.4 | |||||
Change in jewelry scrapping sales gross profit and other revenues | 0.3 | ||||||||||
Total change in net revenue | $ | 9.7 | |||||||||
Change in Net Revenue (Constant Currency) | |||||||||||
Pawn Service Charges | Merchandise Sales Gross Profit | Total | |||||||||
(in millions) | |||||||||||
Same stores | $ | 0.8 | $ | 0.1 | $ | 0.9 | |||||
New stores and other* | 7.9 | 1.3 | 9.2 | ||||||||
Total | $ | 8.7 | $ | 1.4 | $ | 10.1 | |||||
Change in jewelry scrapping sales gross profit and other revenues | 0.4 | ||||||||||
Total change in net revenue | $ | 10.5 | |||||||||
* | Balances are comprised of 210 new stores and three closed stores. |
Pawn service charges increased 90% (95% on a constant currency basis) primarily due to the acquisition of stores discussed above. The average PLO balance per store during the current quarter increased 15% to approximately $90,000 (up 19% on a constant currency basis), including additions to store count from acquisitions discussed above and de novo stores, in addition to foreign currency impacts.
Merchandise sales increased 37% (42% on a constant currency basis), with gross margin on merchandise sales of 30%, below the prior-year quarter including the margin impact from the acquisition of stores discussed above. As a result of the combination of these effects and acquisition of stores discussed above, offset by foreign currency impacts, merchandise sales gross profit was up 24% to $6.3 million (28% to $6.5 million on a constant currency basis).
Jewelry scrapping sales increased 581% (599% on a constant currency basis) with a 100 basis point decline in margin, primarily due to the acquisition of stores discussed above.
Segment operating expenses increased primarily as a result of the acquisition of stores discussed above. After a $0.2 million improvement in other segment income, primarily interest income from our notes receivable, segment contribution increased 63% (66% on a constant currency basis).
31
Other International
The following table presents selected financial data from continuing operations for the Other International segment after translation to U.S. dollars from its functional currency of primarily Australian and Canadian dollars:
Three Months Ended June 30, | Percentage Change | ||||||||
2018 | 2017 | ||||||||
(in thousands) | |||||||||
Net revenues: | |||||||||
Consumer loan fees, interest and other | $ | 1,603 | $ | 1,964 | (18)% | ||||
Consumer loan bad debt | (349 | ) | (453 | ) | (23)% | ||||
Net revenues | 1,254 | 1,511 | (17)% | ||||||
Segment operating expenses (income): | |||||||||
Operating expenses | 2,726 | 1,799 | 52% | ||||||
Equity in net income of unconsolidated affiliate | (1,151 | ) | (1,047 | ) | 10% | ||||
Segment operating (loss) contribution | (321 | ) | 759 | * | |||||
Other segment income | — | (68 | ) | * | |||||
Segment (loss) contribution | $ | (321 | ) | $ | 827 | * | |||
* | Represents an increase or decrease that is not meaningful. |
Segment loss was $0.3 million, primarily due to a $0.9 million increase in operating expenses from further investment in the development of a digital IT platform to drive future revenue enhancement. We now offer installment loans in all of our Canada stores due to regulatory changes impacting the economic returns of our payday lending model, which took effect January 1, 2018.
As of June 30, 2018, the carrying value of our investment in unconsolidated affiliate was $11.9 million above its fair value, which we believe is temporary. We have taken impairment charges on our investment in unconsolidated affiliate in prior periods and continue to monitor the fair value of our investment for other-than-temporary impairments. We may record a further impairment charge should the fair value of our investment fall below its carrying value for an extended period of time.
32
Other Items
The following table reconciles our consolidated segment contribution discussed above to net income attributable to EZCORP, Inc., including items that affect our consolidated financial results but are not allocated among segments:
Three Months Ended June 30, | Percentage Change | ||||||||
2018 | 2017 | ||||||||
(in thousands) | |||||||||
Segment contribution | $ | 29,854 | $ | 30,041 | (1)% | ||||
Corporate expenses (income): | |||||||||
Administrative | 13,268 | 14,095 | (6)% | ||||||
Depreciation and amortization | 2,115 | 2,970 | (29)% | ||||||
Gain on sale or disposal of assets | 214 | — | * | ||||||
Interest expense | 7,391 | 5,652 | 31% | ||||||
Interest income | (3,686 | ) | (1,573 | ) | 134% | ||||
Other income | (5,184 | ) | (2 | ) | * | ||||
Income from continuing operations before income taxes | 15,736 | 8,899 | 77% | ||||||
Income tax expense | 1,553 | 3,432 | (55)% | ||||||
Income from continuing operations, net of tax | 14,183 | 5,467 | 159% | ||||||
Income (loss) from discontinued operations, net of tax | 91 | (265 | ) | * | |||||
Net income | 14,274 | 5,202 | 174% | ||||||
Net loss attributable to noncontrolling interest | (359 | ) | (58 | ) | 519% | ||||
Net income attributable to EZCORP, Inc. | $ | 14,633 | $ | 5,260 | 178% | ||||
* | Represents an increase or decrease that is not meaningful. |
Administrative expenses were down 6% in the current quarter, including a reduction in variable compensation, as we continue to focus on controlling administrative expenditures despite the growth of the business.
Depreciation and amortization expense decreased $0.7 million, or 29%, primarily due to acceleration of depreciation in the prior year for certain assets resulting from a decrease in useful life estimates.
Interest expense increased $1.7 million, or 31%, primarily due to our 2025 Convertible Notes issued in May 2018, including accruals of interest and amortization of associated discounts and deferred financings costs.
Interest income increased $1.7 million, or 134%, as a result of our notes receivable from the sale of Prestaciones Finmart, S.A.P.I. de C.V., SOFOM, E.N.R. ("Grupo Finmart") which were restructured in September 2017, including ordinary accruals of interest in addition to accretion of associated deferred compensation amounts. Grupo Finmart has continued to make timely monthly principal and interest payments on the notes following the restructuring.
Other income was comprised primarily of $5.2 million in net recoveries pertaining to a legal settlement as further described "Shareholder derivative litigation" in Note 8 of Notes to Interim Condensed Consolidated Financial Statements included in "Part I, Item 1 — Financial Statements."
Income tax expense decreased $1.9 million, or 55%, due primarily to lower tax rates dictated by the Act and a $3.3 million benefit associated with the expiration of a statute of limitations on uncertain tax positions. This was partially offset by an increase in tax expense associated with the impacts of a $6.8 million, or 77%, increase in income from continuing operations before income taxes. Income tax expense includes other items that do not necessarily correspond to pre-tax earnings and create volatility in our effective tax rate. These items include the net effect of state taxes, non-deductible items and changes in valuation allowances for certain foreign operations.
33
Results of Operations
Nine Months Ended June 30, 2018 vs. Nine Months Ended June 30, 2017
These tables, as well as the discussion that follows, should be read with the accompanying condensed consolidated financial statements and related notes. All comparisons, unless otherwise noted, are to the prior-year nine-months.
U.S. Pawn
The following table presents selected summary financial data from continuing operations for the U.S. Pawn segment:
Nine Months Ended June 30, | Change | ||||||||
2018 | 2017 | ||||||||
(in thousands) | |||||||||
Net revenues: | |||||||||
Pawn service charges | $ | 174,439 | $ | 177,480 | (2)% | ||||
Merchandise sales | 270,145 | 273,125 | (1)% | ||||||
Merchandise sales gross profit | 103,180 | 99,890 | 3% | ||||||
Gross margin on merchandise sales | 38 | % | 37 | % | 100bps | ||||
Jewelry scrapping sales | 34,515 | 35,158 | (2)% | ||||||
Jewelry scrapping sales gross profit | 5,832 | 5,044 | 16% | ||||||
Gross margin on jewelry scrapping sales | 17 | % | 14 | % | 300bps | ||||
Other revenues | 205 | 157 | 31% | ||||||
Net revenues | 283,656 | 282,571 | —% | ||||||
Segment operating expenses: | |||||||||
Operations | 196,748 | 194,499 | 1% | ||||||
Depreciation and amortization | 9,340 | 7,487 | 25% | ||||||
Segment operating contribution | 77,568 | 80,585 | (4)% | ||||||
Other segment expenses (income) | 194 | (68 | ) | * | |||||
Segment contribution | $ | 77,374 | $ | 80,653 | (4)% | ||||
Other data: | |||||||||
Average pawn loan balance per store (b) | $ | 272 | $ | 274 | (1)% | ||||
Monthly average yield on pawn loans outstanding | 14 | % | 14 | % | — | ||||
Pawn loan redemption rate (c) | 85 | % | 84 | % | 100bps | ||||
* | Represents an increase or decrease that is not meaningful. |
(a) | Balance includes pawn loans and inventory. |
(b) | Balance is calculated based upon the average of the monthly ending balances during the applicable period. |
(c) | Our pawn loan redemption rate represents the percentage of loans made that are repaid, renewed or extended at a point in time as opposed to the life of the loan. |
34
Net revenue increased $1.1 million, primarily due to higher gross margins from our merchandise sales offset by the impacts of the hurricanes affecting the Texas Gulf Coast and Florida in the fourth quarter of fiscal 2017, as previously disclosed. The change in net revenue attributable to same stores and new stores added/closed since the prior-year nine-months is summarized as follows:
Change in Net Revenue | |||||||||||
Pawn Service Charges | Merchandise Sales Gross Profit | Total | |||||||||
(in millions) | |||||||||||
Same stores | $ | (2.5 | ) | $ | 3.7 | $ | 1.2 | ||||
New stores and other* | (0.5 | ) | (0.4 | ) | (0.9 | ) | |||||
Total | $ | (3.0 | ) | $ | 3.3 | $ | 0.3 | ||||
Change in jewelry scrapping sales gross profit and other revenues | 0.8 | ||||||||||
Total change in net revenue | $ | 1.1 | |||||||||
* | Balances are comprised of two new stores and seven closed stores. |
Pawn service charges decreased 2% due to a similar decrease in average PLO balances during the current nine-months, with yield unchanged. The lower average PLO balance was primarily a result of the longer recovery to rebuild the loan portfolio for locations impacted by the hurricanes.
Merchandise sales decreased 1% with gross margin on merchandise sales of 38%, a 100 basis point improvement over the prior-year nine-months. As a net result, merchandise sales gross profit increased 3% to $103.2 million. The increase in merchandise sales gross profit is due to enhanced discipline in pricing and discounting. We expect sales gross margin for the full fiscal year to be within our target range of 35-38% as we expect to accept a slightly lower margin in order to sell through a greater amount of inventory.
Jewelry scrapping sales gross profit remained relatively flat at 2% of current nine-month net revenues, in-line with our strategy to sell rather than scrap merchandise, with a 300 basis point increase in gross margin to 17% due primarily to improvements in lending practices and gold prices.
Segment contribution decreased 4% primarily due to a 1% increase in operations expenses, comprised primarily of labor, and a 25% increase in depreciation and amortization, including additional capital expenditures associated with our store refresh initiatives and a one-time charge of $0.5 million for the retirement of certain assets.
35
Latin America Pawn
The following table presents selected summary financial data from continuing operations for the Latin America Pawn segment, including constant currency results, after translation to U.S. dollars from its functional currencies of the Mexican peso, Guatemalan quetzal, Honduran lempira and Peruvian sol. See “Results of Operations — Non-GAAP Financial Information” above.
Nine Months Ended June 30, | |||||||||||||||
2018 (GAAP) | 2017 (GAAP) | Change (GAAP) | 2018 (Constant Currency) | Change (Constant Currency) | |||||||||||
(in USD thousands) | (in USD thousands) | ||||||||||||||
Net revenues: | |||||||||||||||
Pawn service charges | $ | 49,162 | $ | 24,503 | 101% | $ | 48,538 | 98% | |||||||
Merchandise sales | 63,125 | 46,547 | 36% | 61,689 | 33% | ||||||||||
Merchandise sales gross profit | 19,807 | 14,942 | 33% | 19,310 | 29% | ||||||||||
Gross margin on merchandise sales | 31 | % | 32 | % | (100)bps | 31 | % | (100)bps | |||||||
Jewelry scrapping sales | 9,651 | 2,500 | 286% | 9,531 | 281% | ||||||||||
Jewelry scrapping sales gross profit | 798 | 419 | 90% | 778 | 86% | ||||||||||
Gross margin on jewelry scrapping sales | 8 | % | 17 | % | (900)bps | 8 | % | (900)bps | |||||||
Other revenues | 588 | 457 | 29% | 578 | 26% | ||||||||||
Net revenues | 70,355 | 40,321 | 74% | 69,204 | 72% | ||||||||||
Segment operating expenses: | |||||||||||||||
Operations | 44,778 | 26,439 | 69% | 43,981 | 66% | ||||||||||
Depreciation and amortization | 2,712 | 1,910 | 42% | 2,656 | 39% | ||||||||||
Segment operating contribution | 22,865 | 11,972 | 91% | 22,567 | 88% | ||||||||||
Other segment income (a) | (2,024 | ) | (878 | ) | 131% | (1,832 | ) | 109% | |||||||
Segment contribution | $ | 24,889 | $ | 12,850 | 94% | $ | 24,399 | 90% | |||||||
Other data: | |||||||||||||||
Average pawn loan balance per store (c) | $ | 90 | $ | 71 | 27% | $ | 89 | 25% | |||||||
Monthly average yield on pawn loans outstanding | 16 | % | 16 | % | — | 16 | % | — | |||||||
Pawn loan redemption rate (d) | 79 | % | 78 | % | 100bps | 79 | % | 100bps | |||||||
(a) | The nine months ended June 30, 2018 constant currency balance excludes $0.1 million in net GAAP basis foreign currency transaction gains resulting from movement in exchange rates. The net foreign currency transaction gains for the nine months ended June 30, 2017 were $0.1 million and are not excluded from the above results. |
(b) | Balance includes pawn loans and inventory. |
(c) | Balance is calculated based upon the average of the monthly ending balances during the applicable period. |
(d) | Our pawn loan redemption rate represents the percentage of loans made that are repaid, renewed or extended at a point in time as opposed to the life of the loan. |
Our Latin America business continues to grow rapidly. In the current nine-months, we acquired 112 pawn stores located in Guatemala, El Salvador, Honduras and Peru, we acquired 84 pawn stores located in Mexico and we opened ten de novo stores.
36
Net revenue increased $30.0 million, or 74% ($28.9 million, or 72%, on a constant currency basis). The increase in net revenue attributable to same stores and new stores added/closed since the prior-year nine-months is summarized as follows:
Change in Net Revenue | |||||||||||
Pawn Service Charges | Merchandise Sales Gross Profit | Total | |||||||||
(in millions) | |||||||||||
Same stores | $ | 3.3 | $ | 1.2 | $ | 4.5 | |||||
New stores and other* | 21.4 | 3.7 | 25.1 | ||||||||
Total | $ | 24.7 | $ | 4.9 | $ | 29.6 | |||||
Change in jewelry scrapping sales gross profit and other revenues | 0.4 | ||||||||||
Total change in net revenue | $ | 30.0 | |||||||||
Change in Net Revenue (Constant Currency) | |||||||||||
Pawn Service Charges | Merchandise Sales Gross Profit | Total | |||||||||
(in millions) | |||||||||||
Same stores | $ | 2.6 | $ | 0.7 | $ | 3.3 | |||||
New stores and other* | 21.4 | 3.7 | 25.1 | ||||||||
Total | $ | 24.0 | $ | 4.4 | $ | 28.4 | |||||
Change in jewelry scrapping sales gross profit and other revenues | 0.5 | ||||||||||
Total change in net revenue | $ | 28.9 | |||||||||
* | Balances are comprised of 210 new stores and three closed stores. |
Pawn service charges increased 101% (98% on a constant currency basis) primarily due to the acquisition of stores discussed above and same store growth. The average PLO balance during the current nine-months increased 27% (25% on a constant currency basis), including additions to store count from acquisitions discussed above and de novo stores, offset by foreign currency impacts.
Merchandise sales increased 36% (33% on a constant currency basis), with gross margin on merchandise sales of 31%, 100 basis points below the prior-year nine-months including the margin impact from the acquisition of stores discussed above. As a result of the combination of these effects, offset by foreign currency impacts, merchandise sales gross profit was up 33% to $19.8 million (up 29% to $19.3 million on a constant currency basis).
Jewelry scrapping sales increased 286% (281% on a constant currency basis) with a 900 basis point decline in margin, primarily due to the acquisition of stores discussed above.
We leveraged a 74% increase in net revenue (72% on a constant currency basis) into a 91% increase in segment operating contribution (88% on a constant currency basis) due to focused expense management in addition to greater operational leverage from the acquisition of stores discussed above, resulting in only a 69% increase (66% increase on a constant currency basis) in operations expenses. After a $1.1 million improvement in other segment income, primarily interest income from our notes receivable, segment contribution increased 94% (90% on a constant currency basis).
37
Other International
The following table presents selected financial data from continuing operations for the Other International segment after translation to U.S. dollars from its functional currency of primarily Australian and Canadian dollars:
Nine Months Ended June 30, | Percentage Change | ||||||||
2018 | 2017 | ||||||||
(in thousands) | |||||||||
Net revenues: | |||||||||
Consumer loan fees, interest and other | $ | 5,354 | $ | 5,958 | (10)% | ||||
Consumer loan bad debt | (1,273 | ) | (1,433 | ) | (11)% | ||||
Net revenues | 4,081 | 4,525 | (10)% | ||||||
Segment operating expenses (income): | |||||||||
Operating expenses | 7,418 | 5,558 | 33% | ||||||
Equity in net income of unconsolidated affiliate | (3,477 | ) | (3,768 | ) | (8)% | ||||
Segment operating contribution | 140 | 2,735 | (95)% | ||||||
Other segment income | (118 | ) | (28 | ) | 321% | ||||
Segment contribution | $ | 258 | $ | 2,763 | (91)% | ||||
Segment contribution was $0.3 million, a decrease of 91% from the prior-year nine-months, primarily due to a $1.9 million increase in operating expenses from further investment in the development of a digital IT to drive future revenue enhancement. We now offer installment loans in all of our Canada stores due to regulatory changes impacting the economic returns of our payday lending model, which took effect January 1, 2018.
As of June 30, 2018, the carrying value of our investment in unconsolidated affiliate was $11.9 million above its fair value, which we believe is temporary. We have taken impairment charges on our investment in unconsolidated affiliate in prior periods and continue to monitor the fair value of our investment for other-than-temporary impairments. We may record a further impairment charge should the fair value of our investment fall below its carrying value for an extended period of time.
38
Other Items
The following table reconciles our consolidated segment contribution discussed above to net income attributable to EZCORP, Inc., including items that affect our consolidated financial results but are not allocated among segments:
Nine Months Ended June 30, | Percentage Change | ||||||||
2018 | 2017 | ||||||||
(in thousands) | |||||||||
Segment contribution | $ | 102,521 | $ | 96,266 | 6% | ||||
Corporate expenses (income): | |||||||||
Administrative | 39,927 | 41,305 | (3)% | ||||||
Depreciation and amortization | 6,104 | 8,705 | (30)% | ||||||
Loss on sale or disposal of assets | 225 | — | * | ||||||
Interest expense | 19,064 | 16,840 | 13% | ||||||
Interest income | (10,824 | ) | (6,020 | ) | 80% | ||||
Other income | (5,363 | ) | (191 | ) | 2,708% | ||||
Income from continuing operations before income taxes | 53,388 | 35,627 | 50% | ||||||
Income tax expense | 14,911 | 13,663 | 9% | ||||||
Income from continuing operations, net of tax | 38,477 | 21,964 | 75% | ||||||
Loss from discontinued operations, net of tax | (631 | ) | (1,868 | ) | (66)% | ||||
Net income | 37,846 | 20,096 | 88% | ||||||
Net loss attributable to noncontrolling interest | (1,348 | ) | (352 | ) | 283% | ||||
Net income attributable to EZCORP, Inc. | $ | 39,194 | $ | 20,448 | 92% | ||||
* | Represents an increase or decrease that is not meaningful. |
Administrative expenses decreased $1.4 million, or 3%, including the impact of $0.5 million of acquisition-related expenses in the current nine-months and a reduction in variable compensation, as we continue to focus on controlling administrative expenditures despite the growth of the business.
Depreciation and amortization expense decreased $2.6 million, or 30%, primarily due to acceleration of depreciation in the prior-year nine-months for certain assets resulting from a decrease in useful life estimates.
Interest expense increased $2.2 million, or 13%, primarily due to our 2025 Convertible Notes issued in May 2018, including accruals of interest and amortization of associated discounts and deferred financings costs.
Interest income increased $4.8 million, or 80%, as a result of our note receivable from the sale of Grupo Finmart which was restructured in September 2017, including ordinary accruals of interest in addition to accretion of associated deferred compensation amounts. Grupo Finmart has continued to make timely monthly principal and interest payments on the notes following the restructuring.
Other income was comprised primarily of $5.2 million in net recoveries pertaining to a legal settlement as further described in "Shareholder derivative litigation" in Note 8 of Notes to Interim Condensed Consolidated Financial Statements included in "Part I, Item 1 — Financial Statements."
Income tax expense increased $1.2 million, or 9%, due primarily to the impacts of a $17.8 million, or 50%, increase in income from continuing operations before income taxes, offset by the lower rates dictated by the Act and a $4.9 million benefit associated with the expiration of a statute of limitations on uncertain tax positions. Income tax expense includes other items that do not necessarily correspond to pre-tax earnings and create volatility in our effective tax rate. These items include the net effect of state taxes, non-deductible items and changes in valuation allowances for certain foreign operations.
On December 22, 2017, the Tax Cuts and Jobs Act of 2017 (the "Act") was signed into law. Among other things, the Act reduces the U.S. federal corporate tax rate from 35% to 21%, requires companies to pay a one-time transition tax on earnings of certain foreign subsidiaries that were previously tax deferred and creates new taxes on certain foreign sourced earnings. The corporate tax rate reduction was effective as of January 1, 2018 and, accordingly, reduced our current fiscal year federal statutory rate to a blended rate of 24.5%, and will further reduce it to 21% beginning in fiscal 2019. As of June 30, 2018, while we are able to make reasonable estimates of the impact of the reduction in the corporate rate and the deemed repatriation
39
transition tax, the final impact of the Act may differ from these estimates, due to, among other things, changes in our interpretations and assumptions, additional guidance that may be issued by the Internal Revenue Service, and actions we may take. We are continuing to gather additional information to determine the final impact of the Act. We recognized $2.8 million for the revaluation of our deferred tax assets and liabilities upon enactment of the Act, which is included as a component of "Income tax expense" in our condensed consolidated statements of operations in the current nine-months. We anticipate recording another charge of approximately $2.0 million in the fiscal quarter ending September 30, 2018 as we have balances related to our short-term deferred tax assets and liabilities that arose during the current fiscal year when the tax rate was 24.5% that will reverse in subsequent periods when the rate will be 21%. We believe we have adequate foreign tax credit carryforwards to fully offset any transition tax on the total post-1986 foreign earnings and profit of our foreign subsidiaries as required under the Act.
Loss from discontinued operations was primarily comprised of the write-off of balances from a discontinued business which we previously anticipated to collect.
Liquidity and Capital Resources
Cash Flows
The table and discussion below present a summary of the selected sources and uses of our cash:
Nine Months Ended June 30, | Percentage Change | ||||||||
2018 | 2017 | ||||||||
(in thousands) | |||||||||
Cash flows from operating activities | $ | 69,050 | $ | 35,521 | 94% | ||||
Cash flows from investing activities | (117,108 | ) | 12,425 | * | |||||
Cash flows from financing activities | 170,157 | (767 | ) | * | |||||
Effect of exchange rate changes on cash and cash equivalents | (1,461 | ) | 813 | * | |||||
Net increase in cash and cash equivalents | $ | 120,638 | $ | 47,992 | 151% | ||||
* | Represents an increase or decrease that is not meaningful. |
Change in Cash and Cash Equivalents for the Nine Months Ended June 30, 2018 vs. Nine Months Ended June 30, 2017
The increase in cash flows from operating activities year-over-year was due to an $8.6 million increase in the changes in operating assets and liabilities and a $24.9 million increase in net income exclusive of non-cash items due to improved operational results, stores acquired in the current nine-months and $5.2 million in net recoveries pertaining to a legal settlement. The increase from changes in operating assets and liabilities was primarily driven by $10.1 million in additional accrued incentive compensation paid out during the three months ended December 31, 2016 as compared to the three months ended December 31, 2017.
The decrease in cash flows from investing activities year-over-year was due to $93.2 million in cash paid for acquisitions, $14.0 million in cash paid to maintain ownership and including a 3% increase in our investment in unconsolidated affiliate, a $19.0 million increase in net additions to property and equipment and capitalized labor as we continue our store refresh program and a $7.1 million decrease in principal collections on notes receivable due to contractual amortization schedules, offset by a $3.8 million net increase in proceeds related to loan activities (net loans repaid and recovery of pawn loan principal through sale of forfeited collateral).
The increase in cash flows from financing activities year-over-year was primarily due to $170.5 million in proceeds from borrowings, principally $172.5 million aggregate principal amount of 2.375% Convertible Senior Notes Due 2025 issued in May 2018, net of fees.
The net effect of these and other smaller items was a $120.6 million increase in cash on hand during the current nine-months, resulting in a $285.0 million ending cash balance compared to $113.7 million as of June 30, 2017. Of the ending cash balance as of June 30, 2018, $12.7 million was not available to fund domestic operations as we intend to permanently reinvest those earnings in our foreign operations.
Sources and Uses of Cash
We anticipate that cash flow from operations and cash on hand will be adequate to fund our contractual obligations, planned de novo store growth, capital expenditures and working capital requirements through fiscal 2019, exclusive of any future material
40
acquisition activity. Our ability to repay our longer-term debt obligations may require us to refinance those obligations through the issuance of new debt securities, equity securities, convertible securities or through new credit facilities.
Acquisitions
For a description of acquisitions consummated during the current nine-months, see Note 2 of Notes to Interim Condensed Consolidated Financial Statements included in "Part I, Item 1 — Financial Statements."
2.375% Convertible Senior Notes Due 2025, 2.875% Convertible Senior Notes Due 2024 and 2.125% Cash Convertible Senior Notes Due 2019
For a description of the terms of the 2.375% Convertible Senior Notes Due 2025, 2.875% Convertible Senior Notes Due 2024 and 2.125% Cash Convertible Senior Notes Due 2019, see Note 6 of Notes to Interim Condensed Consolidated Financial Statements included in "Part I, Item 1 — Financial Statements" and Note 8 to Consolidated Financial Statements included in "Part II, Item 8 — Financial Statements and Supplementary Data" of our Annual Report on Form 10-K for the year ended September 30, 2017.
Contractual Obligations
In "Part II, Item 7 — Management's Discussion and Analysis of Financial Condition and Results of Operations" of our Annual Report on Form 10-K for the year ended September 30, 2017, we reported that we had $631.0 million in total contractual obligations as of September 30, 2017. There have been no material changes to this total obligation since September 30, 2017 other than those described above.
We are responsible for the maintenance, property taxes and insurance at most of our locations. In the fiscal year ended September 30, 2017, these collectively amounted to $21.4 million.
Recently Adopted Accounting Policies and Recently Issued Accounting Pronouncements
We do not expect any material impacts of adopting Financial Accounting Standards Board ("FASB") Accounting Standards Updates ("ASU") included in Note 1 of Notes to Interim Condensed Consolidated Financial Statements included in "Part I, Item 1 — Financial Statements" on our results of operations, however expect ASU 2016-02 regarding lease accounting to have a material impact on our consolidation financial position upon adoption. Please refer to Note 1, Summary of Significant Accounting Policies, of Notes to Consolidated Financial Statements included in "Part II, Item 8 — Financial Statements and Supplementary Data" of our Annual Report on Form 10-K for the year ended September 30, 2017 for discussion of our critical accounting policies and estimates including discussions of variability where applicable. Additional information around our timeline of adoption including the currently known impacts of FASB ASU 2016-13, 2016-02 and 2014-09 is included in Note 1 of Notes to Interim Condensed Consolidated Financial Statements included in "Part I, Item 1 — Financial Statements."
Cautionary Statement Regarding Risks and Uncertainties that May Affect Future Results
This Quarterly Report on Form 10-Q, including Management’s Discussion and Analysis of Financial Condition and Results of Operations, includes "forward-looking statements" within the meaning of Section 27A of the Securities Act of 1933 and Section 21E of the Securities Exchange Act of 1934. We intend that all forward-looking statements be subject to the safe harbors created by these laws. All statements, other than statements of historical facts, regarding our strategy, future operations, financial position, future revenues, projected costs, prospects, plans and objectives are forward-looking statements. These statements are often, but not always, made with words or phrases like "may," "should," "could," "will," "predict," "anticipate," "believe," "estimate," "expect," "intend," "plan," "projection" and similar expressions. Such statements are only predictions of the outcome and timing of future events based on our current expectations and currently available information and, accordingly, are subject to substantial risks, uncertainties and assumptions. Actual results could differ materially from those expressed in the forward-looking statements due to a number of risks and uncertainties, many of which are beyond our control. In addition, we cannot predict all of the risks and uncertainties that could cause our actual results to differ from those expressed in the forward-looking statements. Accordingly, you should not regard any forward-looking statements as a representation that the expected results will be achieved. Important risk factors that could cause results or events to differ from current expectations are identified and described in "Part I, Item 1A — Risk Factors" of our Annual Report on Form 10-K for the year ended September 30, 2017, supplemented by those described in "Part II, Item 1A — Risk Factors" of this Quarterly Report.
We specifically disclaim any responsibility to publicly update any information contained in a forward-looking statement except as required by law. All forward-looking statements attributable to us are expressly qualified in their entirety by this cautionary statement.
41
ITEM 3. QUANTITATIVE AND QUALITATIVE DISCLOSURES ABOUT MARKET RISK
Market risks relating to our operations result primarily from changes in interest rates, gold values and foreign currency exchange rates, and are described in detail in "Part II, Item 7A — Quantitative and Qualitative Disclosures about Market Risk" of our Annual Report on Form 10-K for the year ended September 30, 2017. There have been no material changes to our exposure to market risks since September 30, 2017.
ITEM 4. CONTROLS AND PROCEDURES
This report includes the certifications of our Chief Executive Officer and Chief Financial Officer required by Rule 13a-14 of the Securities Exchange Act of 1934 (the "Exchange Act"). See Exhibits 31.1 and 31.2. This Item 4 includes information concerning the controls and control evaluations referred to in those certifications.
Evaluation of Disclosure Controls and Procedures
Disclosure controls and procedures (as defined in Rules 13a-15(e) and 15d-15(e) under the Securities Exchange Act of 1934) are designed to ensure that information required to be disclosed in the reports we file or submit under the Securities Exchange Act is recorded, processed, summarized and reported within the time periods specified in SEC rules and forms and that such information is accumulated and communicated to our management, including our Chief Executive Officer and Chief Financial Officer, to allow timely decisions regarding required disclosures. Under the supervision and with the participation of our Chief Executive Officer and Chief Financial Officer, our management evaluated the effectiveness of the design and operation of our disclosure controls and procedures as of June 30, 2018. Based on that evaluation, our Chief Executive Officer and Chief Financial Officer concluded that our disclosure controls and procedures were effective as of June 30, 2018.
Changes in Internal Control over Financial Reporting
There were no changes in our internal control over financial reporting during the quarter ended June 30, 2018 that have materially affected or are reasonably likely to materially affect our internal control over financial reporting.
Inherent Limitations on Internal Controls
Notwithstanding the foregoing, management does not expect that our disclosure controls and procedures or our internal control over financial reporting will prevent or detect all errors and all fraud. A control system, no matter how well designed and operated, can provide only reasonable, not absolute, assurance that the objectives of the control system will be met. Limitations inherent in any control system include the following:
• | Judgments in decision-making can be faulty, and control and process breakdowns can occur because of simple errors or mistakes. |
• | Controls can be circumvented by individuals, acting alone or in collusion with others, or by management override. |
• | The design of any system of controls is based in part on certain assumptions about the likelihood of future events, and there can be no assurance that any design will succeed in achieving its stated goals under all potential future conditions. |
• | Over time, controls may become inadequate because of changes in conditions or deterioration in the degree of compliance with associated policies or procedures. |
• | The design of a control system must reflect the fact that resources are constrained, and the benefits of controls must be considered relative to their costs. |
Because of the inherent limitations in all control systems, no evaluation of controls can provide absolute assurance that all control issues and instances of fraud, if any, have been detected.
PART II — OTHER INFORMATION
ITEM 1. LEGAL PROCEEDINGS
See Note 8 of Notes to Interim Condensed Consolidated Financial Statements included in "Part I, Item 1 — Financial Statements."
42
ITEM 1A. RISK FACTORS
Important risk factors that could affect our operations and financial performance, or that could cause results or events to differ from current expectations, are described in "Part I, Item 1A — Risk Factors" of our Annual Report on Form 10-K for the year ended September 30, 2017.
We have a limited number of unreserved shares available for future issuance, which may limit our ability to conduct future financings and other transactions.
Our certificate of incorporation currently authorizes us to issue up to 100 million shares of Class A Non-voting Common Stock (“Class A Common Stock”). Taking into consideration the shares that are issued and outstanding, as well as the shares that have been reserved for issuance pursuant to convertible notes, warrants and outstanding equity incentive compensation awards and the conversion of the Class B Voting Common Stock, we had approximately 700,000 shares of authorized Class A Common Stock that are available for other uses as of July 24, 2018. Therefore, our ability to issue shares of Class A Common Stock (other than pursuant to the existing reserved-for commitments), or securities or instruments that are convertible into or exchangeable for shares of Class A Common Stock, will be limited until such time as additional authorized, unissued and unreserved shares become available. During this time, for example, our ability to complete equity or equity-linked financings or other transactions (including strategic acquisitions) that involve the issuance or potential issuance of Class A Common Stock will be limited.
ITEM 6. EXHIBITS
The following exhibits are filed with, or incorporated by reference into, this report.
Exhibit No. | Description of Exhibit | |
101.INS††† | XBRL Instance Document | |
101.SCH††† | XBRL Taxonomy Extension Schema Document | |
101.CAL††† | XBRL Taxonomy Extension Calculation Linkbase Document | |
101.LAB††† | XBRL Taxonomy Label Linkbase Document | |
101.DEF††† | XBRL Taxonomy Extension Definition Linkbase Document | |
101.PRE††† | XBRL Taxonomy Extension Presentation Linkbase Document | |
† | Filed herewith. |
†† | Furnished herewith. |
††† | Filed herewith as Exhibit 101 to this report are the following formatted in XBRL (Extensible Business Reporting Language): (i) Condensed Consolidated Balance Sheets as of June 30, 2018, June 30, 2017 and September 30, 2017; (ii) Condensed Consolidated Statements of Operations for the three and nine months ended June 30, 2018 and June 30, 2017; (iii) Condensed Consolidated Statements of Comprehensive Income for the three and nine months ended June 30, 2018 and June 30, 2017; (iv) Condensed Consolidated Statements of Stockholders' Equity for the nine months ended June 30, 2018 and June 30, 2017; (v) Condensed Consolidated Statements of Cash Flows for the nine months ended June 30, 2018 and June 30, 2017; and (vi) Notes to Interim Condensed Consolidated Financial Statements. |
43
SIGNATURES
Pursuant to the requirements of the Securities Exchange Act of 1934, the registrant has duly caused this report to be signed on its behalf by the undersigned thereunto duly authorized.
EZCORP, INC. | |||
Date: | August 1, 2018 | /s/ David McGuire | |
David McGuire, Deputy Chief Financial Officer and Chief Accounting Officer (principal accounting officer) | |||
44