Attached files
| file | filename |
|---|---|
| EX-99.1 - EX-99.1 - MCDERMOTT INTERNATIONAL INC | d594615dex991.htm |
| 8-K - 8-K - MCDERMOTT INTERNATIONAL INC | d594615d8k.htm |
Exhibit 99.2
|
Q2 2018 SUPPLEMENTAL INFORMATION July 31, 2018
|
FORWARD LOOKING STATEMENTS In accordance with the Safe Harbor provisions of the Private Securities Litigation Reform Act of 1995, McDermott cautions that statements in this presentation which are forward-looking, and provide other than historical information, involve risks, contingencies and uncertainties that may impact actual results of operations of McDermott. These forward-looking statements include, among other things, statements about 2018 focus areas, second half 2018 guidance, project milestones and percentage of completion and expected timetables, increased opportunities in the market, backlog, bids and change orders outstanding, target projects and revenue opportunity pipeline, to the extent these may be viewed as indicators of future revenues or profitability, anticipated future intangibles amortization, the expected impacts of CPI and progress toward achieving anticipated CPI targets, our expectations regarding working capital balances, expected covenant compliance, our expectations with respect to the Amazon vessel, our beliefs with respect to the combination with CB&I, integration progress and long-term prospects, expectations on future contract structure, our planned reduction in total debt and our plans and expectations with respect to the Ras Al Khair fabrication yard. Although we believe that the expectations reflected in those forward-looking statements are reasonable, we can give no assurance that those expectations will prove to have been correct. Those statements are made by using various underlying assumptions and are subject to numerous risks, contingencies and uncertainties, including, among others: the possibility that the expected CPI savings from the recently completed combination will not be realized, or will not be realized within the expected time period; difficulties related to the integration of the two companies; disruption from the combination making it more difficult to maintain relationships with customers, employees, regulators or suppliers; the diversion of management time and attention to integration matters; adverse changes in the markets in which McDermott operates or credit markets; the inability of McDermott to execute on contracts in backlog successfully; changes in project design or schedules; the availability of qualified personnel; changes in the terms, scope or timing of contracts; contract cancellations; change orders and other modifications and actions by customers and other business counterparties of McDermott; changes in industry norms; and adverse outcomes in legal or other dispute resolution proceedings. If one or more of these risks materialize, or if underlying assumptions prove incorrect, actual results may vary materially from those expected. You should not place undue reliance on forward-looking statements. For a more complete discussion of these and other risk factors, please see each of McDermott’s annual and quarterly filings with the U.S. Securities and Exchange Commission, including its annual report on Form 10-K for the year ended December 31, 2017 and subsequent quarterly reports on Form 10-Q. This presentation reflects the views of McDermott’s management as of the date hereof. Except to the extent required by applicable law, McDermott undertakes no obligation to update or revise any forward-looking statement. NON-GAAP DISCLOSURES This presentation includes several “non-GAAP” financial measures as defined under Regulation G of the U.S. Securities Exchange Act of 1934, as amended. McDermott reports its financial results in accordance with U.S. generally accepted accounting principles, but the company believes that certain non-GAAP financial measures provide useful supplemental information to investors regarding the underlying business trends and performance of its ongoing operations and are useful for period-over-period comparisons of those operations. The non-GAAP measures in this presentation include Backlog, Adjusted Operating Income and Margin, Adjusted Net Income, Adjusted Diluted Earnings Per Share (“EPS”), EBITDA, Adjusted EBITDA, Free Cash Flow, and Adjusted Free Cash Flow. These non-GAAP financial measures should be considered as supplemental to, and not as a substitute for or superior to, the financial measures prepared in accordance with GAAP. Reconciliations of these non-GAAP financial measures to the most comparable GAAP measures are provided on pages 32, 33, 34 and 35 of this presentation. 2
|
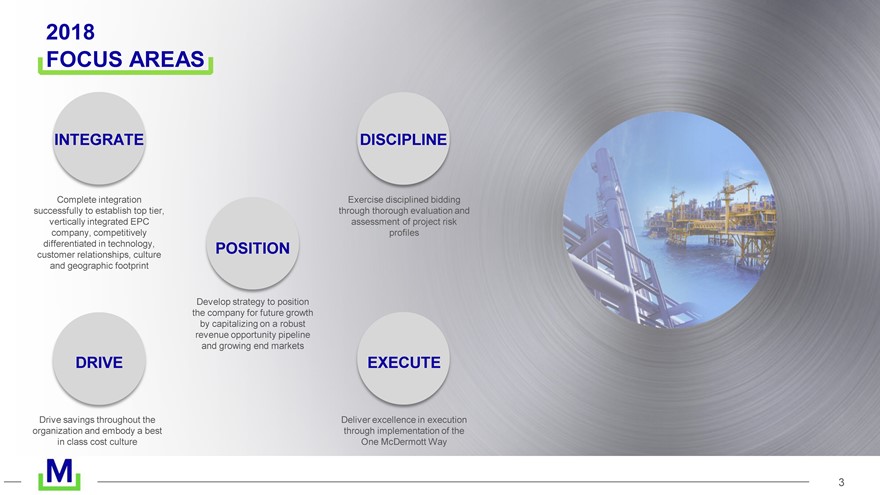
2018 FOCUS AREAS INTEGRATE Complete integration successfully to establish top tier, vertically integrated EPC company, competitively differentiated in technology, customer relationships, culture and geographic footprint DISCIPLINE Exercise disciplined bidding through thorough evaluation and assessment of project risk profiles EXECUTE Deliver excellence in execution through implementation of the One McDermott Way POSITION Develop strategy to position the company for future growth by capitalizing on a robust revenue opportunity pipeline and growing end markets DRIVE Drive savings throughout the organization and embody a best in class cost culture 3
|
QUARTERLY RESULTS
|
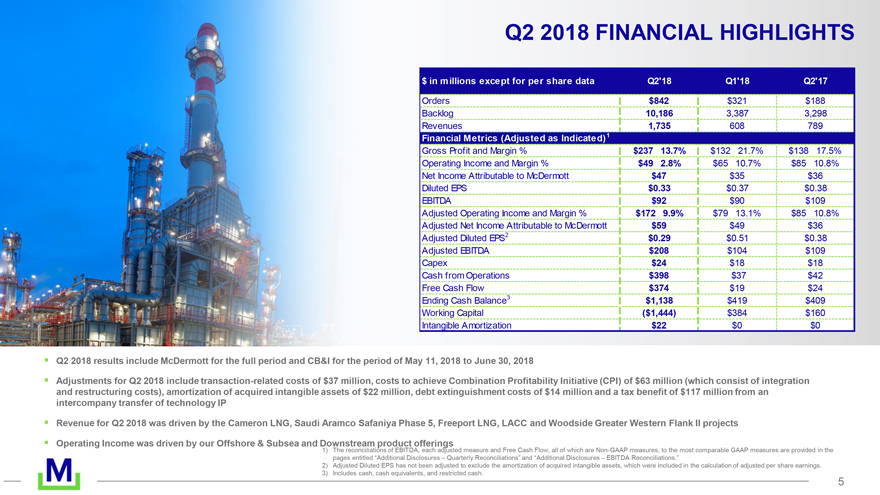
Q2 2018 FINANCIAL HIGHLIGHTS $ in millions except for per share data Q2’18 Q1’18 Q2’17 Orders $842 $321 $188 Backlog 10,186 3,387 3,298 Revenues 1,735 608 789 Financial Metrics (Adjusted as Indicated)1 Gross Profit and Margin % $237 13.7% $132 21.7% $138 17.5% Operating Income and Margin % $49 2.8% $65 10.7% $85 10.8% Net Income Attributable to McDermott $47 $35 $36 Diluted EPS $0.33 $0.37 $0.38 EBITDA $92 $90 $109 Adjusted Operating Income and Margin % $172 9.9% $79 13.1% $85 10.8% Adjusted Net Income Attributable to McDermott $59 $49 $36 Adjusted Diluted EPS2 $0.29 $0.51 $0.38 Adjusted EBITDA $208 $104 $109 Capex $24 $18 $18 Cash from Operations $398 $37 $42 Free Cash Flow $374 $19 $24 Ending Cash Balance3 $1,138 $419 $409 Working Capital ($1,444) $384 $160 Intangible Amortization $22 $0 $0 Q2 2018 results include McDermott for the full period and CB&I for the period of May 11, 2018 to June 30, 2018 Adjustments for Q2 2018 include transaction-related costs of $37 million, costs to achieve Combination Profitability Initiative (CPI) of $63 million (which consist of integration and restructuring costs), amortization of acquired intangible assets of $22 million, debt extinguishment costs of $14 million and a tax benefit of $117 million from an intercompany transfer of technology IP Revenue for Q2 2018 was driven by the Cameron LNG, Saudi Aramco Safaniya Phase 5, Freeport LNG, LACC and Woodside Greater Western Flank II projects Operating Income was driven by our Offshore & Subsea and Downstream 1) The reconciliations product of EBITDA, offerings each adjusted measure and Free Cash Flow, all of which are Non-GAAP measures, to the most comparable GAAP measures are provided in the pages entitled “Additional Disclosures – Quarterly Reconciliations” and “Additional Disclosures – EBITDA Reconciliations.” 2) Adjusted Diluted EPS has not been adjusted to exclude the amortization of acquired intangible assets, which were included in the calculation of adjusted per share earnings. 3) Includes cash, cash equivalents, and restricted cash. 5
|
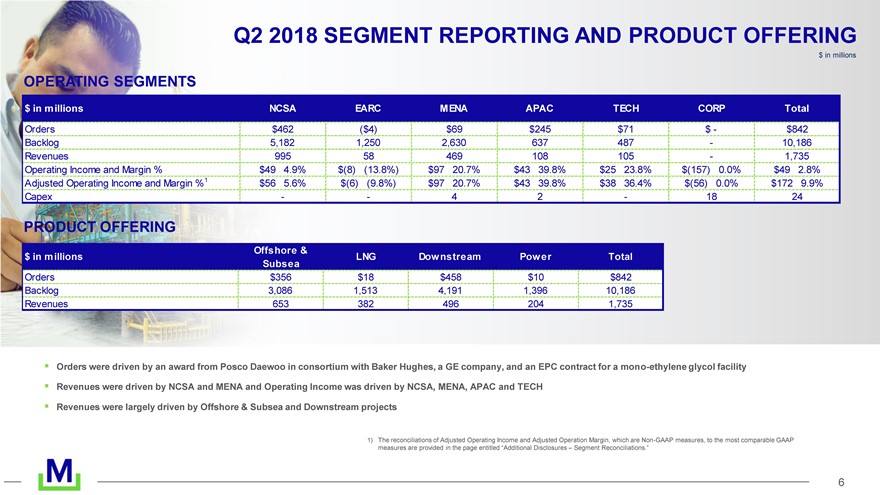
Q2 2018 SEGMENT REPORTING AND PRODUCT OFFERING $ in millions OPERATING SEGMENTS $ in millions NCSA EARC MENA APAC TECH CORP Total Orders $462 ($4) $69 $245 $71 $ - $842 Backlog 5,182 1,250 2,630 637 487 - 10,186 Revenues 995 58 469 108 105 - 1,735 Operating Income and Margin % $49 4.9% $(8) (13.8%) $97 20.7% $43 39.8% $25 23.8% $(157) 0.0% $49 2.8% Adjusted Operating Income and Margin %1 $56 5.6% $(6) (9.8%) $97 20.7% $43 39.8% $38 36.4% $(56) 0.0% $172 9.9% Capex - - 4 2 - 18 24 PRODUCT OFFERING Offshore & $ in millions LNG Dow nstream Pow er Total Subsea Orders $356 $18 $458 $10 $842 Backlog 3,086 1,513 4,191 1,396 10,186 Revenues 653 382 496 204 1,735 Orders were driven by an award from Posco Daewoo in consortium with Baker Hughes, a GE company, and an EPC contract for a mono-ethylene glycol facility Revenues were driven by NCSA and MENA and Operating Income was driven by NCSA, MENA, APAC and TECH Revenues were largely driven by Offshore & Subsea and Downstream projects 1) The reconciliations of Adjusted Operating Income and Adjusted Operation Margin, which are Non-GAAP measures, to the most comparable GAAP measures are provided in the page entitled ?Additional Disclosures ? Segment Reconciliations.? 6
|
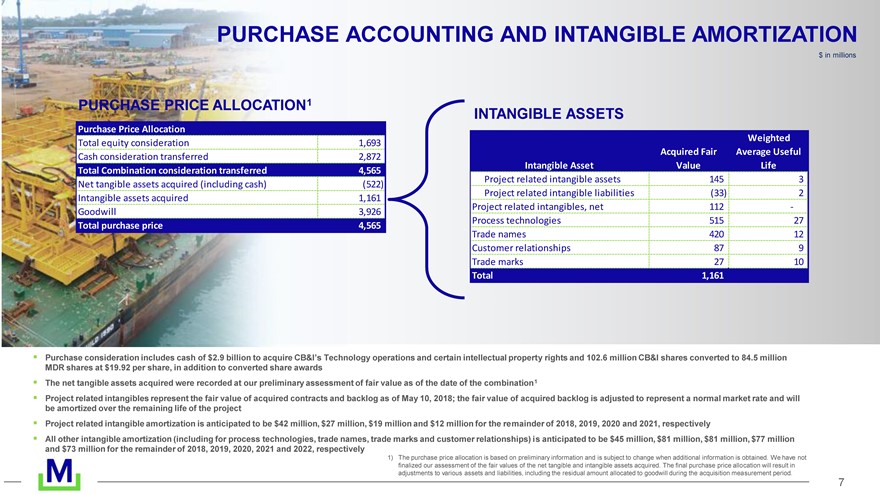
PURCHASE ACCOUNTING AND INTANGIBLE AMORTIZATION $ in millions PURCHASE PRICE ALLOCATION1 Purchase Price Allocation Total equity consideration 1,693 Cash consideration transferred 2,872 Total Combination consideration transferred 4,565 Net tangible assets acquired (including cash) (522) Intangible assets acquired 1,161 Goodwill 3,926 Total purchase price 4,565 INTANGIBLE ASSETS Weighted Acquired Fair Average Useful Intangible Asset Value Life Project related intangible assets 145 3 Project related intangible liabilities (33) 2 Project related intangibles, net 112 - Process technologies 515 27 Trade names 420 12 Customer relationships 87 9 Trade marks 27 10 Total 1,161 7
|
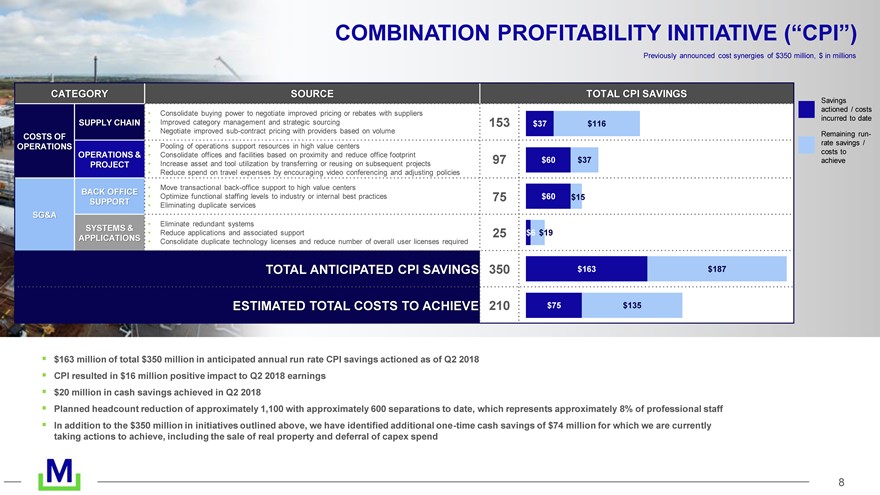
COMBINATION PROFITABILITY INITIATIVE (?CPI?) Previously announced cost synergies of $350 million, $ in millions CATEGORY SOURCE TOTAL CPI SAVINGS Savings actioned / costs Consolidate buying power to negotiate improved pricing or rebates with suppliers incurred to date SUPPLY CHAIN Improved category management and strategic sourcing 153 $37 $116 Negotiate improved sub-contract pricing with providers based on volume Remaining run- COSTS OF rate savings / OPERATIONS Pooling of operations support resources in high value centers costs to OPERATIONS & Consolidate offices and facilities based on proximity and reduce office footprint 97 $60 $37 achieve PROJECT Increase asset and tool utilization by transferring or reusing on subsequent projects Reduce spend on travel expenses by encouraging video conferencing and adjusting policies Move transactional back-office support to high value centers BACK OFFICE Optimize functional staffing levels to industry or internal best practices 75 $60 $15 SUPPORT Eliminating duplicate services SG&A Eliminate redundant systems SYSTEMS & Reduce applications and associated support 25 $6 $19 APPLICATIONS Consolidate duplicate technology licenses and reduce number of overall user licenses required TOTAL ANTICIPATED CPI SAVINGS 350 $163 $187 ESTIMATED TOTAL COSTS TO ACHIEVE 210 $75 $135 $163 million of total $350 million in anticipated annual run rate CPI savings actioned as of Q2 2018 CPI resulted in $16 million positive impact to Q2 2018 earnings $20 million in cash savings achieved in Q2 2018 Planned headcount reduction of approximately 1,100 with approximately 600 separations to date, which represents approximately 8% of professional staff In addition to the $350 million in initiatives outlined above, we have identified additional one-time cash savings of $74 million for which we are currently taking actions to achieve, including the sale of real property and deferral of capex spend 8
|
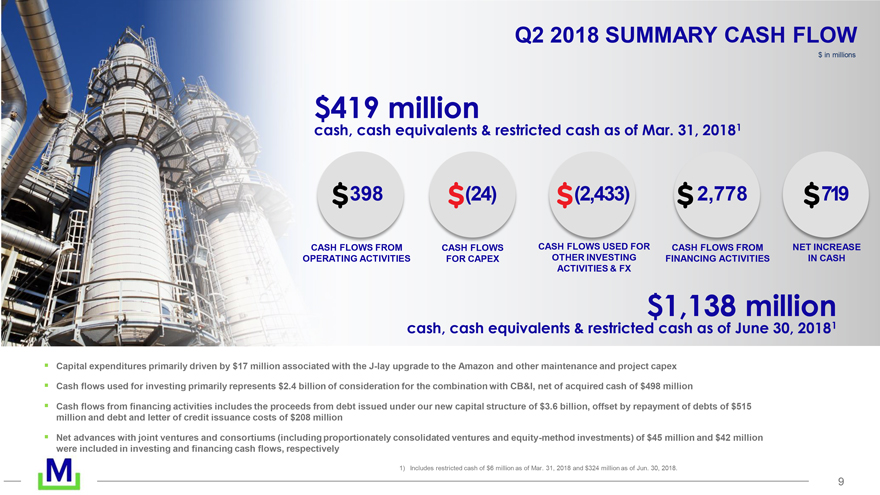
Q2 2018 SUMMARY CASH FLOW $ in millions $419 million cash, cash equivalents & restricted cash as of Mar. 31, 20181 398 (24) (2,433) 2,778 719 CASH FLOWS FROM CASH FLOWS CASH FLOWS USED FOR CASH FLOWS FROM NET INCREASE OPERATING ACTIVITIES FOR CAPEX OTHER INVESTING FINANCING ACTIVITIES IN CASH ACTIVITIES & FX $1,138 million cash, cash equivalents & restricted cash as of June 30, 20181 Capital expenditures primarily driven by $17 million associated with the J-lay upgrade to the Amazon and other maintenance and project capex Cash flows used for investing primarily represents $2.4 billion of consideration for the combination with CB&I, net of acquired cash of $498 million Cash flows from financing activities includes the proceeds from debt issued under our new capital structure of $3.6 billion, offset by repayment of debts of $515 million and debt and letter of credit issuance costs of $208 million Net advances with joint ventures and consortiums (including proportionately consolidated ventures and equity-method investments) of $45 million and $42 million were included in investing and financing cash flows, respectively 1) Includes restricted cash of $6 million as of Mar. 31, 2018 and $324 million as of Jun. 30, 2018. 9
|
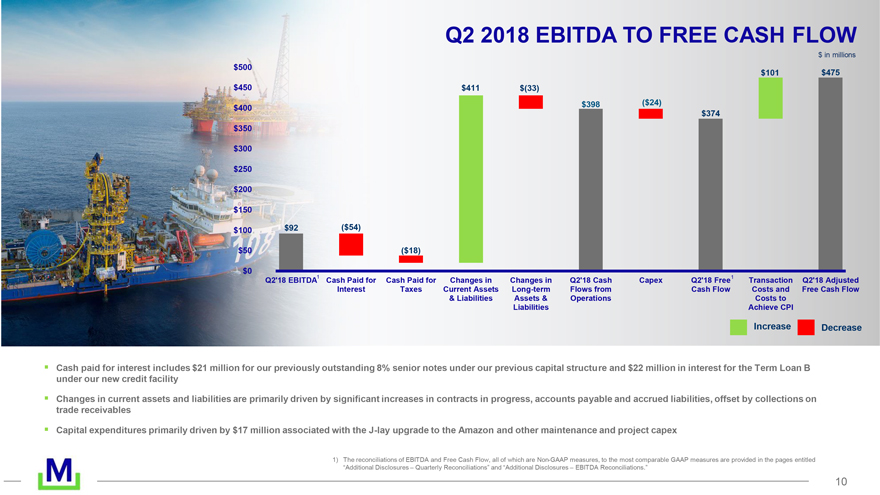
Q2 2018 EBITDA TO FREE CASH FLOW $ in millions $500 $101 $475 $450 $411 $(33) $398 ($24) $400 $374 $350 $300 $250 $200 $150 $100 $92 ($54) $50 ($18) $0 1 Q2’18 EBITDA Cash Paid for Cash Paid for Changes in Changes in Q2’18 Cash Capex Q2’18 Free1 Transaction Q2’18 Adjusted Interest Taxes Current Assets Long-term Flows from Cash Flow Costs and Free Cash Flow & Liabilities Assets & Operations Costs to Liabilities Achieve CPI Increase Decrease Cash paid for interest includes $21 million for our previously outstanding 8% senior notes under our previous capital structure and $22 million in interest for the Term Loan B under our new credit facility Changes in current assets and liabilities are primarily driven by significant increases in contracts in progress, accounts payable and accrued liabilities, offset by collections on trade receivables Capital expenditures primarily driven by $17 million associated with the J-lay upgrade to the Amazon and other maintenance and project capex 1) The reconciliations of EBITDA and Free Cash Flow, all of which are Non-GAAP measures, to the most comparable GAAP measures are provided in the pages entitled “Additional Disclosures – Quarterly Reconciliations” and “Additional Disclosures – EBITDA Reconciliations.” 10
|
|
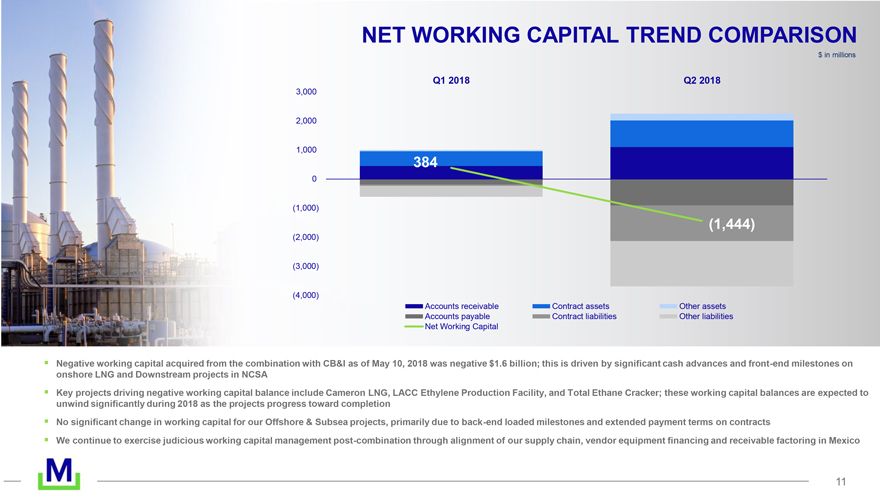
NET WORKING CAPITAL TREND COMPARISON $ in millions Q1 2018 Q2 2018 3,000 2,000 1,000 384 0 (1,000) (1,444) (2,000) (3,000) (4,000) Accounts receivable Contract assets Other assets Accounts payable Contract liabilities Other liabilities Net Working Capital Negative working capital acquired from the combination with CB&I as of May 10, 2018 was negative $1.6 billion; this is driven by significant cash advances and front-end milestones on onshore LNG and Downstream projects in NCSA Key projects driving negative working capital balance include Cameron LNG, LACC Ethylene Production Facility, and Total Ethane Cracker; these working capital balances are expected to unwind significantly during 2018 as the projects progress toward completion No significant change in working capital for our Offshore & Subsea projects, primarily due to back-end loaded milestones and extended payment terms on contracts We continue to exercise judicious working capital management post-combination through alignment of our supply chain, vendor equipment financing and receivable factoring in Mexico 11
|
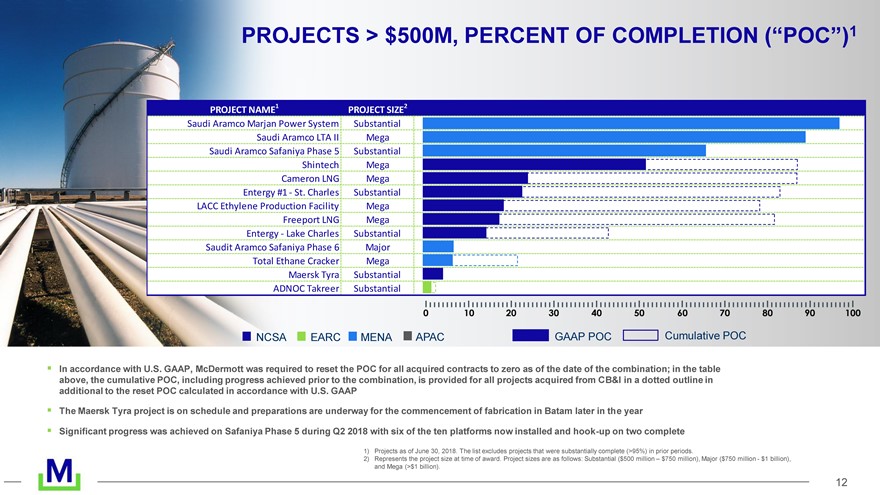
PROJECTS > $500M, PERCENT OF COMPLETION (?POC?)1 PROJECT NAME1 PROJECT SIZE2 Saudi Aramco Marjan Power System Substantial Saudi Aramco LTA II Mega Saudi Aramco Safaniya Phase 5 Substantial Shintech Mega Cameron LNG Mega Entergy #1 - St. Charles Substantial LACC Ethylene Production Facility Mega Freeport LNG Mega Entergy - Lake Charles Substantial Saudit Aramco Safaniya Phase 6 Major Total Ethane Cracker Mega Maersk Tyra Substantial ADNOC Takreer Substantial NCSA EARC MENA APAC GAAP POC Cumulative POC In accordance with U.S. GAAP, McDermott was required to reset the POC for all acquired contracts to zero as of the date of the combination; in the table above, the cumulative POC, including progress achieved prior to the combination, is provided for all projects acquired from CB&I in a dotted outline in additional to the reset POC calculated in accordance with U.S. GAAP The Maersk Tyra project is on schedule and preparations are underway for the commencement of fabrication in Batam later in the year Significant progress was achieved on Safaniya Phase 5 during Q2 2018 with six of the ten platforms now installed and hook-up on two complete 1) Projects as of June 30, 2018. The list excludes projects that were substantially complete (>95%) in prior periods. 2) Represents the project size at time of award. Project sizes are as follows: Substantial ($500 million ? $750 million), Major ($750 million - $1 billion), and Mega (>$1 billion). 12
|
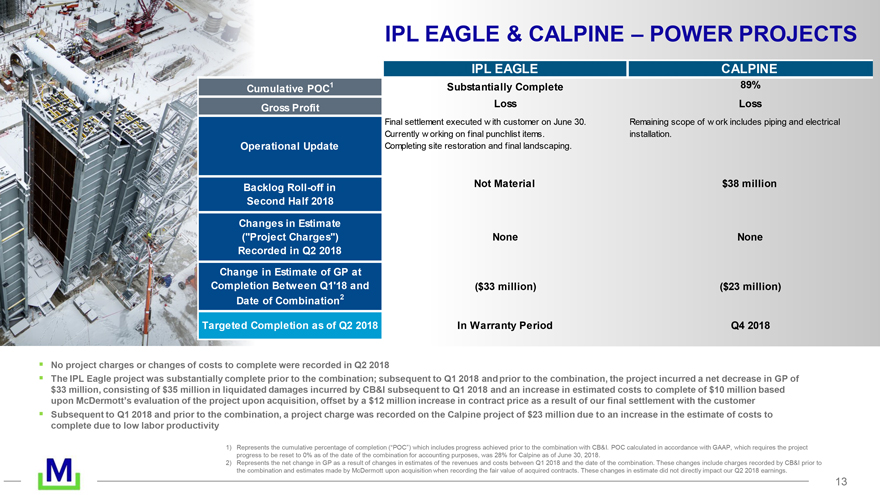
IPL EAGLE & CALPINE – POWER PROJECTS IPL EAGLE CALPINE Cumulative POC1 Substantially Complete 89% Gross Profit Loss Loss Final settlement executed w ith customer on June 30. Remaining scope of w ork includes piping and electrical Currently w orking on final punchlist items. installation. Operational Update Completing site restoration and final landscaping. Backlog Roll-off in Not Material $38 million Second Half 2018 Changes in Estimate (“Project Charges”) None None Recorded in Q2 2018 Change in Estimate of GP at Completion Between Q1’18 and ($33 million) ($23 million) Date of Combination2 Targeted Completion as of Q2 2018 In Warranty Period Q4 2018 No project charges or changes of costs to complete were recorded in Q2 2018 The IPL Eagle project was substantially complete prior to the combination; subsequent to Q1 2018 and prior to the combination, the project incurred a net decrease in GP of $33 million, consisting of $35 million in liquidated damages incurred by CB&I subsequent to Q1 2018 and an increase in estimated costs to complete of $10 million based upon McDermott’s evaluation of the project upon acquisition, offset by a $12 million increase in contract price as a result of our final settlement with the customer Subsequent to Q1 2018 and prior to the combination, a project charge was recorded on the Calpine project of $23 million due to an increase in the estimate of costs to complete due to low labor productivity 1) Represents the cumulative percentage of completion (“POC”) which includes progress achieved prior to the combination with CB&I. POC calculated in accordance with GAAP, which requires the project progress to be reset to 0% as of the date of the combination for accounting purposes, was 28% for Calpine as of June 30, 2018. 2) Represents the net change in GP as a result of changes in estimates of the revenues and costs between Q1 2018 and the date of the combination. These changes include charges recorded by CB&I prior to the combination and estimates made by McDermott upon acquisition when recording the fair value of acquired contracts. These changes in estimate did not directly impact our Q2 2018 earnings. 13
|
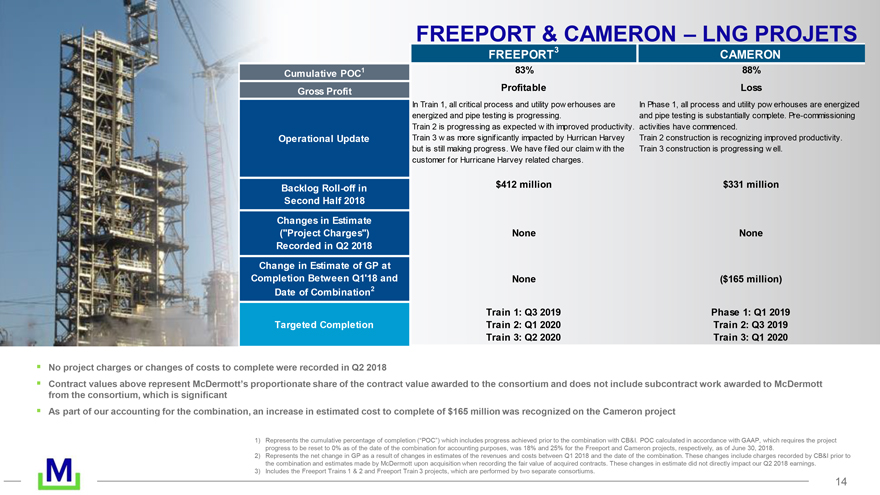
FREEPORT & CAMERON – LNG PROJETS FREEPORT3 CAMERON Cumulative POC1 83% 88% Gross Profit Profitable Loss In Train 1, all critical process and utility pow erhouses are In Phase 1, all process and utility pow erhouses are energized energized and pipe testing is progressing. and pipe testing is substantially complete. Pre-commissioning Train 2 is progressing as expected w ith improved productivity. activities have commenced. Operational Update Train 3 w as more significantly impacted by Hurrican Harvey Train 2 construction is recognizing improved productivity. but is still making progress. We have filed our claim w ith the Train 3 construction is progressing w ell. customer for Hurricane Harvey related charges. Backlog Roll-off in $412 million $331 million Second Half 2018 Changes in Estimate (“Project Charges”) None None Recorded in Q2 2018 Change in Estimate of GP at Completion Between Q1’18 and None ($165 million) Date of Combination2 Train 1: Q3 2019 Phase 1: Q1 2019 Targeted Completion Train 2: Q1 2020 Train 2: Q3 2019 Train 3: Q2 2020 Train 3: Q1 2020 No project charges or changes of costs to complete were recorded in Q2 2018 Contract values above represent McDermott’s proportionate share of the contract value awarded to the consortium and does not include subcontract work awarded to McDermott from the consortium, which is significant As part of our accounting for the combination, an increase in estimated cost to complete of $165 million was recognized on the Cameron project 1) Represents the cumulative percentage of completion (“POC”) which includes progress achieved prior to the combination with CB&I. POC calculated in accordance with GAAP, which requires the project progress to be reset to 0% as of the date of the combination for accounting purposes, was 18% and 25% for the Freeport and Cameron projects, respectively, as of June 30, 2018. 2) Represents the net change in GP as a result of changes in estimates of the revenues and costs between Q1 2018 and the date of the combination. These changes include charges recorded by CB&I prior to the combination and estimates made by McDermott upon acquisition when recording the fair value of acquired contracts. These changes in estimate did not directly impact our Q2 2018 earnings. 3) Includes the Freeport Trains 1 & 2 and Freeport Train 3 projects, which are performed by two separate consortiums. 14
|
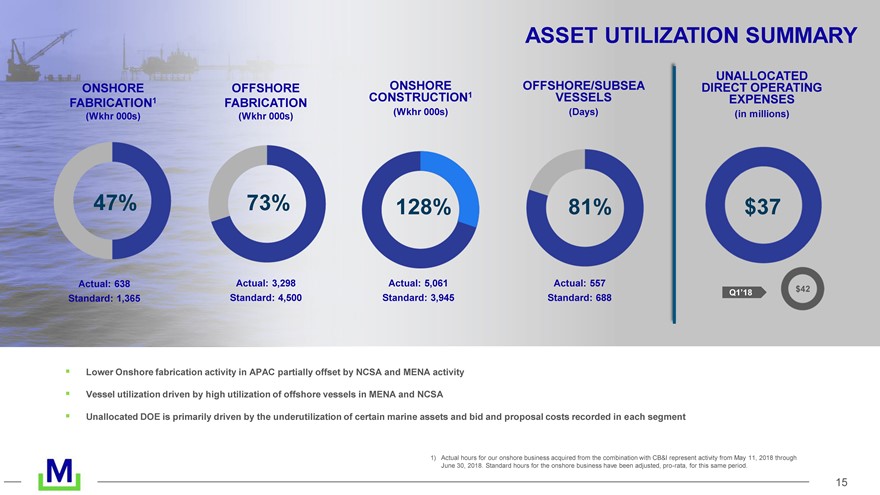
ASSET UTILIZATION SUMMARY UNALLOCATED ONSHORE OFFSHORE ONSHORE OFFSHORE/SUBSEA DIRECT OPERATING CONSTRUCTION1 VESSELS FABRICATION1 FABRICATION EXPENSES (Wkhr 000s) (Days) (in millions) (Wkhr 000s) (Wkhr 000s) 47% 73% 128% 81% $37 Actual: 638 Actual: 3,298 Actual: 5,061 Actual: 557 Q1?18 $42 Standard: 1,365 Standard: 4,500 Standard: 3,945 Standard: 688 Lower Onshore fabrication activity in APAC partially offset by NCSA and MENA activity Vessel utilization driven by high utilization of offshore vessels in MENA and NCSA Unallocated DOE is primarily driven by the underutilization of certain marine assets and bid and proposal costs recorded in each segment 1) Actual hours for our onshore business acquired from the combination with CB&I represent activity from May 11, 2018 through June 30, 2018. Standard hours for the onshore business have been adjusted, pro-rata, for this same period. 15
|
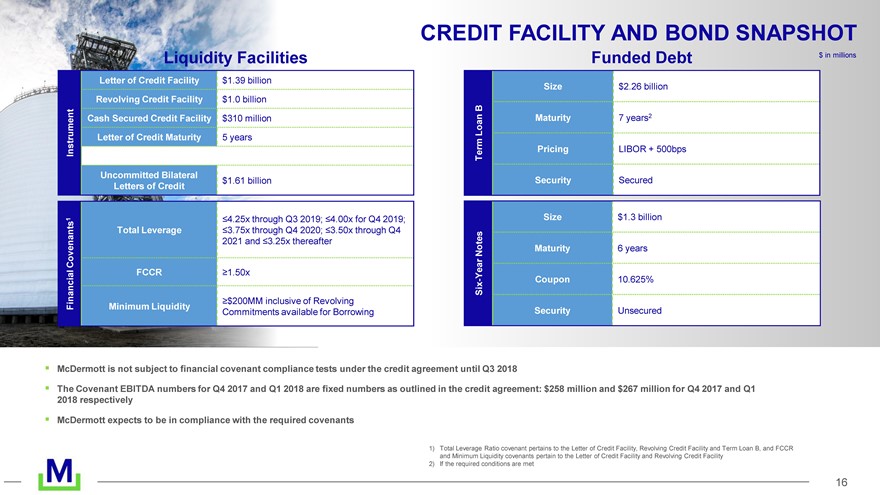
CREDIT FACILITY AND BOND SNAPSHOT Funded Debt $ in millions Size $2.26 billion B Loan Maturity 7 years2 Term Pricing LIBOR + 500bps Security Secured Size $1.3 billion Notes Maturity 6 years Year Six - Coupon 10.625% Security Unsecured Liquidity Facilities Letter of Credit Facility $1.39 billion Revolving Credit Facility $1.0 billion ment Cash Secured Credit Facility $310 million Instru Letter of Credit Maturity 5 years Uncommitted Bilateral $1.61 billion Letters of Credit 1 ?4.25x through Q3 2019; ?4.00x for Q4 2019; Total Leverage ?3.75x through Q4 2020; ?3.50x through Q4 Covenants 2021 and ?3.25x thereafter cial FCCR ?1.50x ?$200MM inclusive of Revolving Finan Minimum Liquidity Commitments available for Borrowing McDermott is not subject to financial covenant compliance tests under the credit agreement until Q3 2018 The Covenant EBITDA numbers for Q4 2017 and Q1 2018 are fixed numbers as outlined in the credit agreement: $258 million and $267 million for Q4 2017 and Q1 2018 respectively McDermott expects to be in compliance with the required covenants 1) Total Leverage Ratio covenant pertains to the Letter of Credit Facility, Revolving Credit Facility and Term Loan B, and FCCR and Minimum Liquidity covenants pertain to the Letter of Credit Facility and Revolving Credit Facility 2) If the required conditions are met 16
|
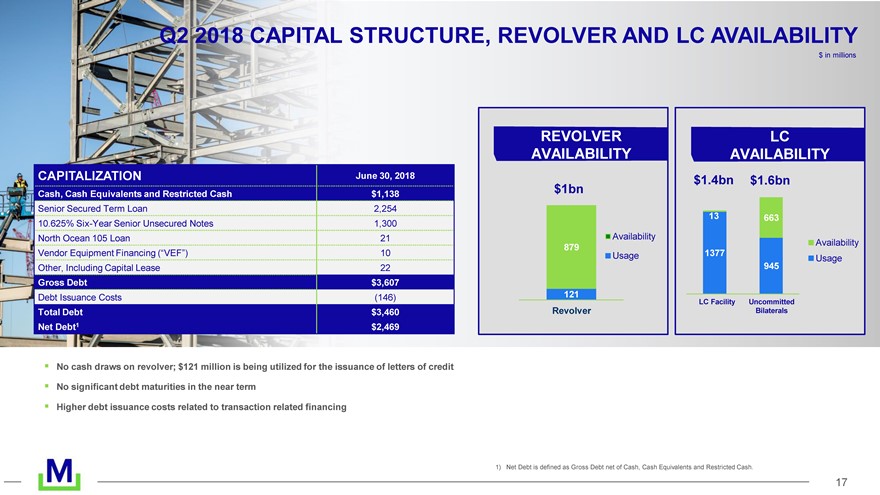
Q2 2018 CAPITAL STRUCTURE, REVOLVER AND LC AVAILABILITY $ in millions CAPITALIZATION June 30, 2018 Cash, Cash Equivalents and Restricted Cash $1,138 Senior Secured Term Loan 2,254 10.625% Six-Year Senior Unsecured Notes 1,300 North Ocean 105 Loan 21 Vendor Equipment Financing (?VEF?) 10 Other, Including Capital Lease 22 Gross Debt $3,607 Debt Issuance Costs (146) Total Debt $3,460 Net Debt1 $2,469 REVOLVER LC AVAILABILITY AVAILABILITY $1.4bn $1.6bn $1bn 13 663 Availability Availability 879 Usage 1377 945 Usage 121 LC Facility Uncommitted Revolver Bilaterals No cash draws on revolver; $121 million is being utilized for the issuance of letters of credit No significant debt maturities in the near term Higher debt issuance costs related to transaction related financing 1) Net Debt is defined as Gross Debt net of Cash, Cash Equivalents and Restricted Cash. 17
|
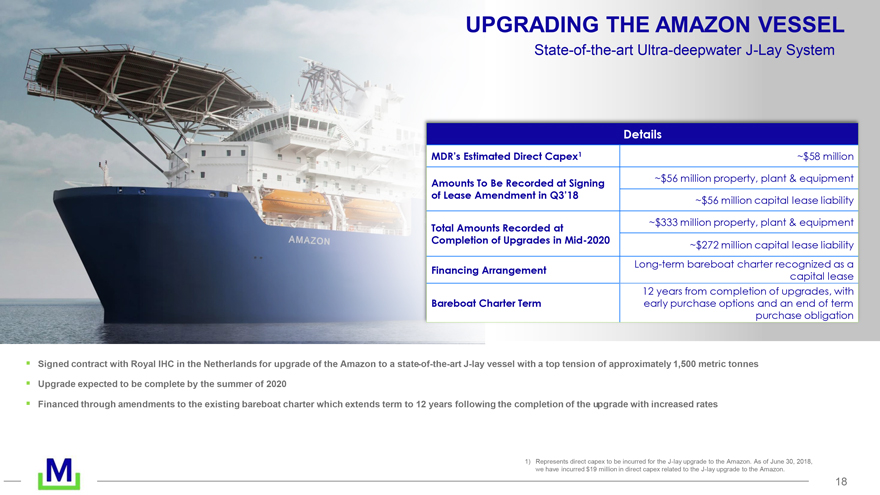
UPGRADING THE AMAZON VESSEL State-of-the-art Ultra-deepwater J-Lay System Details MDR’s Estimated Direct Capex1 ~$58 million Amounts To Be Recorded at Signing ~$56 million property, plant & equipment of Lease Amendment in Q3’18 ~$56 million capital lease liability ~$333 million property, plant & equipment Total Amounts Recorded at Completion of Upgrades in Mid-2020 ~$272 million capital lease liability Long-term bareboat charter recognized as a Financing Arrangement capital lease 12 years from completion of upgrades, with Bareboat Charter Term early purchase options and an end of term purchase obligation Signed contract with Royal IHC in the Netherlands for upgrade of the Amazon to a state-of-the-art J-lay vessel with a top tension of approximately 1,500 metric tonnes Upgrade expected to be complete by the summer of 2020 Financed through amendments to the existing bareboat charter which extends term to 12 years following the completion of the upgrade with increased rates 1) Represents direct capex to be incurred for the J-lay upgrade to the Amazon. As of June 30, 2018, we have incurred $19 million in direct capex related to the J-lay upgrade to the Amazon. 18
|
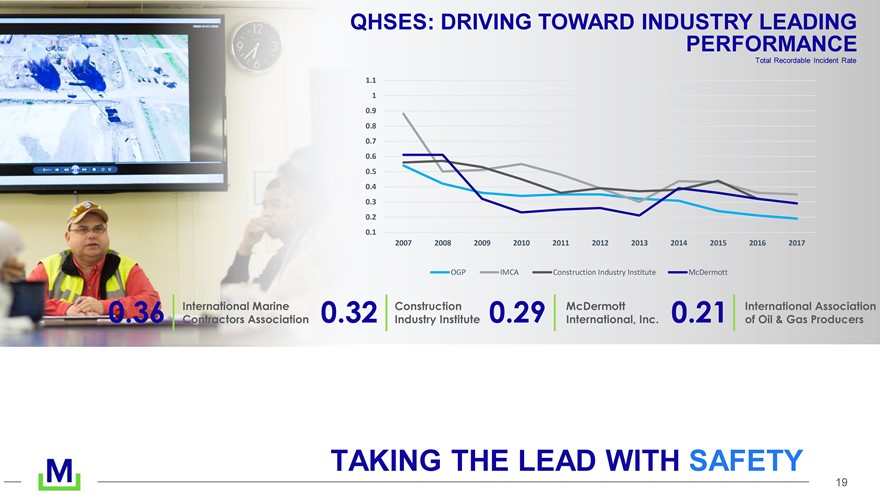
QHSES: DRIVING TOWARD INDUSTRY LEADING PERFORMANCE Total Recordable Incident Rate 1.1 1 0.9 0.8 0.7 0.6 0.5 0.4 0.3 0.2 0.1 2007 2008 2009 2010 2011 2012 2013 2014 2015 2016 2017 OGP IMCA Construction Industry Institute McDermott 0.36 International Marine 0.32 Construction 0.29 McDermott 0.21 International Association Contractors Association Industry Institute International, Inc. of Oil & Gas Producers TAKING THE LEAD WITH SAFETY 19
|
ORDER INTAKE, BACKLOG & BID PIPELINE 20
|
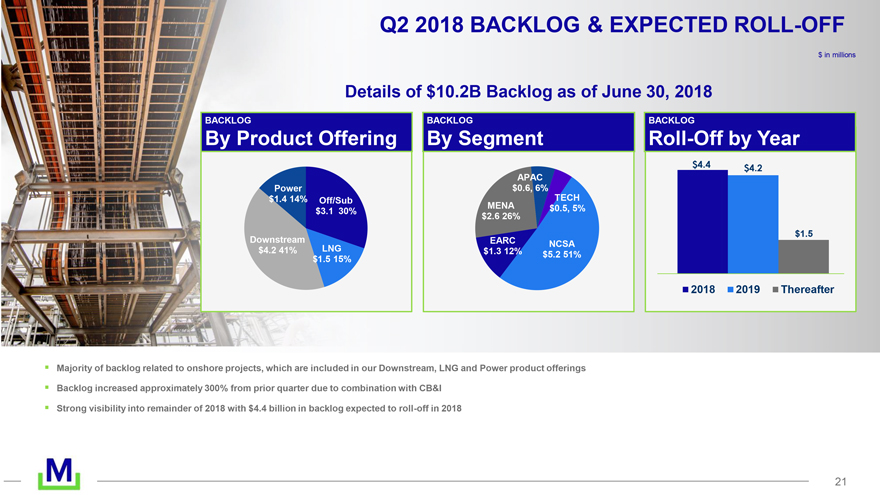
Q2 2018 BACKLOG & EXPECTED ROLL-OFF $ in millions Details of $10.2B Backlog as of June 30, 2018 BACKLOG BACKLOG BACKLOG By Product Offering By Segment Roll-Off by Year $4.4 $4.2 APAC Power $0.6, 6% $1.4 14% Off/Sub MENA TECH $3.1 30% $2.6 26% $0.5, 5% $1.5 Downstream EARC NCSA $4.2 41% LNG $1.3 12% $5.2 51% $1.5 15% 2018 2019 Thereafter Majority of backlog related to onshore projects, which are included in our Downstream, LNG and Power product offerings Backlog increased approximately 300% from prior quarter due to combination with CB&I Strong visibility into remainder of 2018 with $4.4 billion in backlog expected to roll-off in 2018 21
|
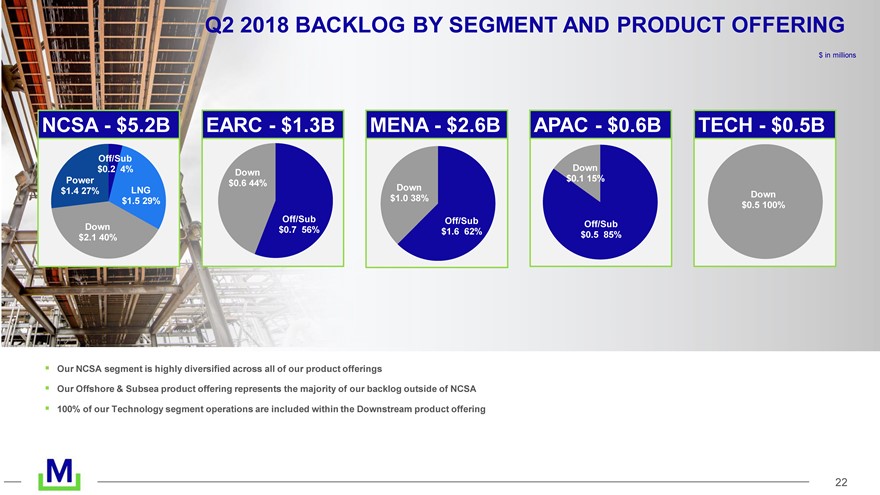
Q2 2018 BACKLOG BY SEGMENT AND PRODUCT OFFERING $ in millions NCSA - $5.2B EARC - $1.3B MENA - $2.6B APAC - $0.6B TECH - $0.5B Off/Sub $0.2 4% Down Down Power $0.1 15% $0.6 44% $1.4 27% LNG Down $1.0 38% Down $1.5 29% $0.5 100% Off/Sub Off/Sub Down Off/Sub $0.7 56% $1.6 62% $2.1 40% $0.5 85% Our NCSA segment is highly diversified across all of our product offerings Our Offshore & Subsea product offering represents the majority of our backlog outside of NCSA 100% of our Technology segment operations are included within the Downstream product offering 22
|
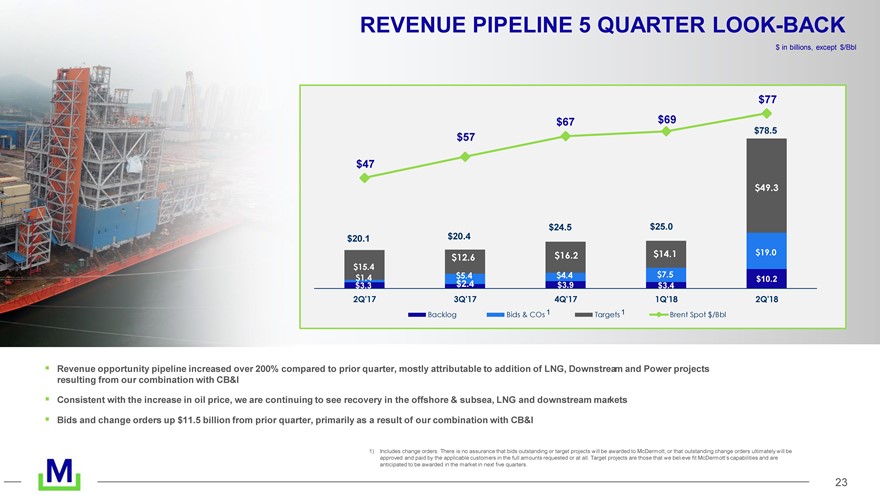
REVENUE PIPELINE 5 QUARTER LOOK-BACK $ in billions, except $/Bbl $77 $67 $69 $78.5 $57 $47 $49.3 $24.5 $25.0 $20.1 $20.4 $16.2 $14.1 $19.0 $12.6 $15.4 $1.4 $5.4 $4.4 $7.5 $10.2 $3.3 $2.4 $3.9 $3.4 2Q’17 3Q’17 4Q’17 1Q’18 2Q’18 Backlog Bids & COs 1 Targets 1 Brent Spot $/Bbl Revenue opportunity pipeline increased over 200% compared to prior quarter, mostly attributable to addition of LNG, Downstream and Power projects resulting from our combination with CB&I Consistent with the increase in oil price, we are continuing to see recovery in the offshore & subsea, LNG and downstream markets Bids and change orders up $11.5 billion from prior quarter, primarily as a result of our combination with CB&I 1) Includes change orders. There is no assurance that bids outstanding or target projects will be awarded to McDermott, or that outstanding change orders ultimately will be approved and paid by the applicable customers in the full amounts requested or at all. Target projects are those that we beli eve fit McDermott?s capabilities and are anticipated to be awarded in the market in next five quarters. 23
|
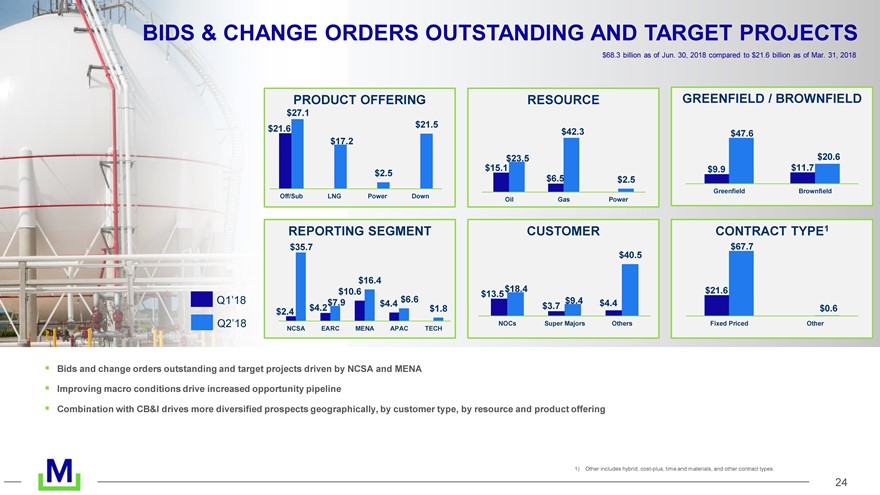
BIDS & CHANGE ORDERS OUTSTANDING AND TARGET PROJECTS $68.3 billion as of Jun. 30, 2018 compared to $21.6 billion as of Mar. 31, 2018 PRODUCT OFFERING RESOURCE GREENFIELD / BROWNFIELD $27.1 $21.5 $21.6 $42.3 $17.2 $47.6 $23.5 $20.6 $15.1 $9.9 $11.7 $2.5 $6.5 $2.5 Greenfield Brownfield Off/Sub LNG Power Down Oil Gas Power REPORTING SEGMENT CUSTOMER CONTRACT TYPE1 $35.7 $67.7 $40.5 $16.4 $18.4 $10.6 $13.5 $21.6 Q1?18 $7.9 $6.6 $9.4 $4.4 $4.4 $3.7 $2.4 $4.2 $1.8 $0.6 Q2?18 NOCs Super Majors Others Fixed Priced Other NCSA EARC MENA APAC TECH Bids and change orders outstanding and target projects driven by NCSA and MENA Improving macro conditions drive increased opportunity pipeline Combination with CB&I drives more diversified prospects geographically, by customer type, by resource and product offering 1) Other includes hybrid, cost-plus, time and materials, and other contract types. 24
|
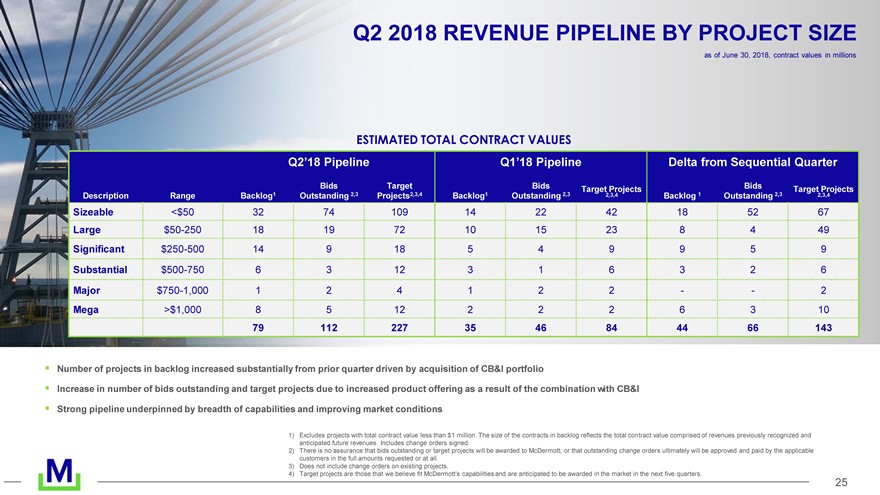
Q2 2018 REVENUE PIPELINE BY PROJECT SIZE as of June 30, 2018, contract values in millions ESTIMATED TOTAL CONTRACT VALUES Q2?18 Pipeline Q1?18 Pipeline Delta from Sequential Quarter Bids Target Bids Target Projects Bids Target Projects Description Range Backlog1 Outstanding 2,3 Projects2,3,4 Backlog1 Outstanding 2,3 2,3,4 Backlog 1 Outstanding 2,3 2,3,4 Sizeable <$50 32 74 109 14 22 42 18 52 67 Large $50-250 18 19 72 10 15 23 8 4 49 Significant $250-500 14 9 18 5 4 9 9 5 9 Substantial $500-750 6 3 12 3 1 6 3 2 6 Major $750-1,000 1 2 4 1 2 2 - - 2 Mega >$1,000 8 5 12 2 2 2 6 3 10 79 112 227 35 46 84 44 66 143 Number of projects in backlog increased substantially from prior quarter driven by acquisition of CB&I portfolio Increase in number of bids outstanding and target projects due to increased product offering as a result of the combination with CB&I Strong pipeline underpinned by breadth of capabilities and improving market conditions 1) Excludes projects with total contract value less than $1 million. The size of the contracts in backlog reflects the total contract value comprised of revenues previously recognized and anticipated future revenues. Includes change orders signed. 2) There is no assurance that bids outstanding or target projects will be awarded to McDermott, or that outstanding change orders ultimately will be approved and paid by the applicable customers in the full amounts requested or at all. 3) Does not include change orders on existing projects. 4) Target projects are those that we believe fit McDermott?s capabilities and are anticipated to be awarded in the market in the next five quarters. 25
|
SECOND HALF 2018 GUIDANCE 26
|
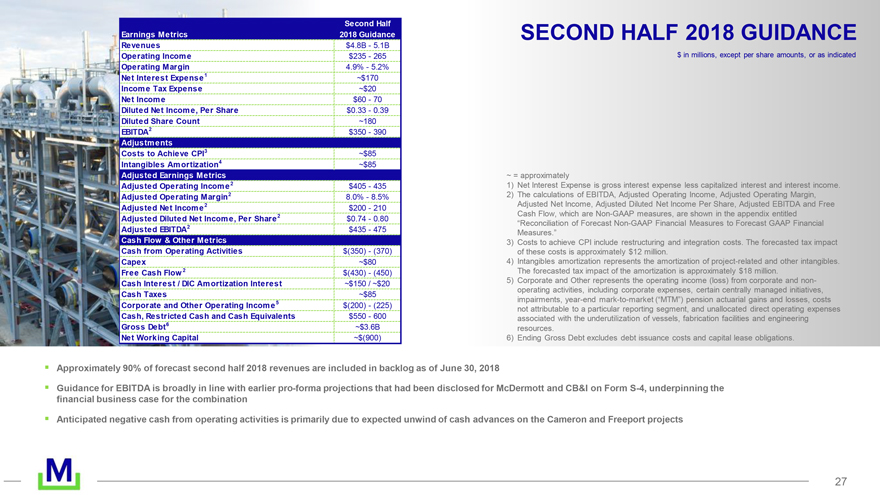
Second Half Earnings Metrics 2018 Guidance SECOND HALF 2018 GUIDANCE Revenues $4.8B - 5.1B Operating Income $235 - 265 $ in millions, except per share amounts, or as indicated Operating Margin 4.9% - 5.2% Net Interest Expense1 ~$170 Income Tax Expense ~$20 Net Income $60 - 70 Diluted Net Income, Per Share $0.33 - 0.39 Diluted Share Count ~180 EBITDA2 $350 - 390 Adjustments Costs to Achieve CPI3 ~$85 Intangibles Amortization4 ~$85 Adjusted Earnings Metrics ~ = approximately Adjusted Operating Income2 $405 - 435 1) Net Interest Expense is gross interest expense less capitalized interest and interest income. Adjusted Operating Margin2 8.0% - 8.5% 2) The calculations of EBITDA, Adjusted Operating Income, Adjusted Operating Margin, 2 Adjusted Net Income, Adjusted Diluted Net Income Per Share, Adjusted EBITDA and Free Adjusted Net Income $200 - 210 2 Cash Flow, which are Non-GAAP measures, are shown in the appendix entitled Adjusted Diluted Net Income, Per Share $0.74 - 0.80 “Reconciliation of Forecast Non-GAAP Financial Measures to Forecast GAAP Financial Adjusted EBITDA2 $435 - 475 Measures.” Cash Flow & Other Metrics 3) Costs to achieve CPI include restructuring and integration costs. The forecasted tax impact Cash from Operating Activities $(350) - (370) of these costs is approximately $12 million. Capex ~$80 4) Intangibles amortization represents the amortization of project-related and other intangibles. Free Cash Flow 2 $(430) - (450) The forecasted tax impact of the amortization is approximately $18 million. Cash Interest / DIC Amortization Interest ~$150 / ~$20 5) Corporate and Other represents the operating income (loss) from corporate and non-operating activities, including corporate expenses, certain centrally managed initiatives, Cash Taxes ~$85 5 impairments, year-end mark-to-market (“MTM”) pension actuarial gains and losses, costs Corporate and Other Operating Income $(200) - (225) Cash, Restricted Cash and Cash Equivalents $550 - 600 not attributable to a particular reporting segment, and unallocated direct operating expenses associated with the underutilization of vessels, fabrication facilities and engineering Gross Debt6 ~$3.6B resources. Net Working Capital ~$(900) 6) Ending Gross Debt excludes debt issuance costs and capital lease obligations. Approximately 90% of forecast second half 2018 revenues are included in backlog as of June 30, 2018 Guidance for EBITDA is broadly in line with earlier pro-forma projections that had been disclosed for McDermott and CB&I on Form S-4, underpinning the financial business case for the combination Anticipated negative cash from operating activities is primarily due to expected unwind of cash advances on the Cameron and Freeport projects 27
|
FREQUENTLY ASKED QUESTIONS 28
|
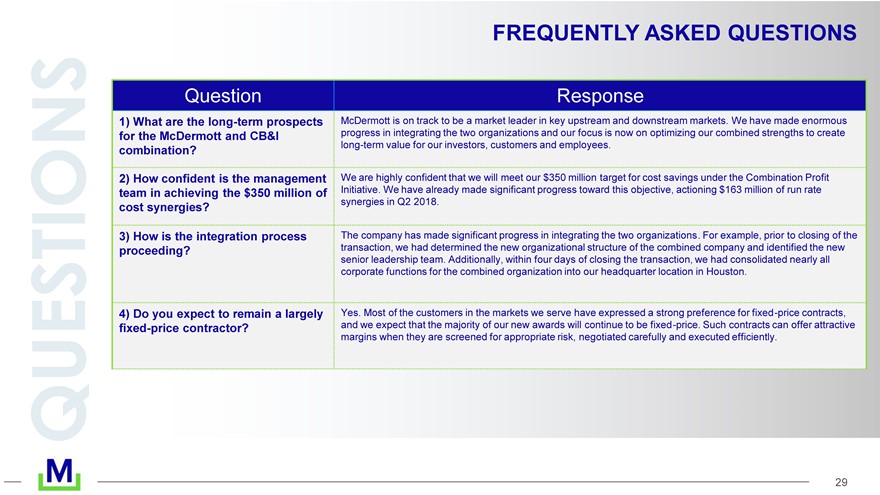
FREQUENTLY ASKED QUESTIONS Question Response 1) What are the long-term prospects McDermott is on track to be a market leader in key upstream and downstream markets. We have made enormous for the McDermott and CB&I progress in integrating the two organizations and our focus is now on optimizing our combined strengths to create long-term value for our investors, customers and employees. combination? 2) How confident is the management We are highly confident that we will meet our $350 million target for cost savings under the Combination Profit team in achieving the $350 million of Initiative. We have already made significant progress toward this objective, actioning $163 million of run rate synergies in Q2 2018. cost synergies? 3) How is the integration process The company has made significant progress in integrating the two organizations. For example, prior to closing of the proceeding? transaction, we had determined the new organizational structure of the combined company and identified the new senior leadership team. Additionally, within four days of closing the transaction, we had consolidated nearly all corporate functions for the combined organization into our headquarter location in Houston. 4) Do you expect to remain a largely Yes. Most of the customers in the markets we serve have expressed a strong preference for fixed-price contracts, fixed-price contractor? and we expect that the majority of our new awards will continue to be fixed-price. Such contracts can offer attractive margins when they are screened for appropriate risk, negotiated carefully and executed efficiently. 29
|
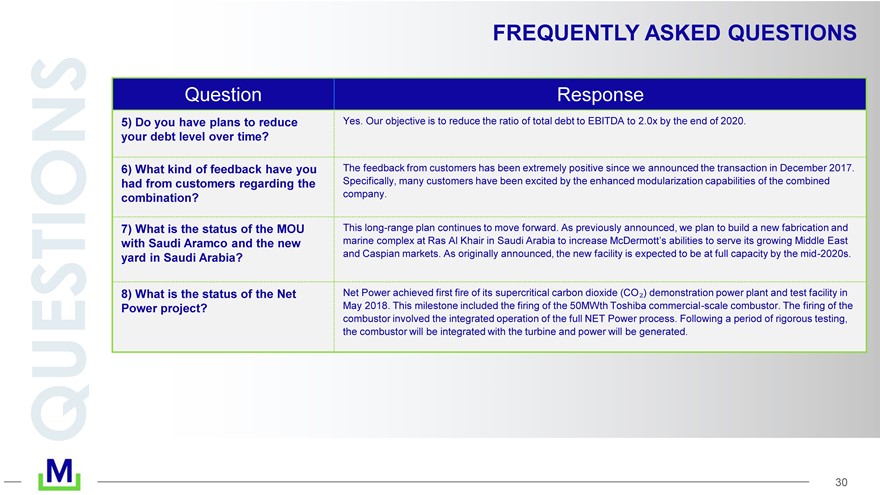
FREQUENTLY ASKED QUESTIONS Question Response 5) Do you have plans to reduce Yes. Our objective is to reduce the ratio of total debt to EBITDA to 2.0x by the end of 2020. your debt level over time? 6) What kind of feedback have you The feedback from customers has been extremely positive since we announced the transaction in December 2017. had from customers regarding the Specifically, many customers have been excited by the enhanced modularization capabilities of the combined combination? company. 7) What is the status of the MOU This long-range plan continues to move forward. As previously announced, we plan to build a new fabrication and with Saudi Aramco and the new marine complex at Ras Al Khair in Saudi Arabia to increase McDermott?s abilities to serve its growing Middle East yard in Saudi Arabia? and Caspian markets. As originally announced, the new facility is expected to be at full capacity by the mid-2020s. 8) What is the status of the Net Net Power achieved first fire of its supercritical carbon dioxide (CO?) demonstration power plant and test facility in Power project? May 2018. This milestone included the firing of the 50MWth Toshiba commercial-scale combustor. The firing of the combustor involved the integrated operation of the full NET Power process. Following a period of rigorous testing, the combustor will be integrated with the turbine and power will be generated. 30

|
FINANCIAL APPENDIX 31
|
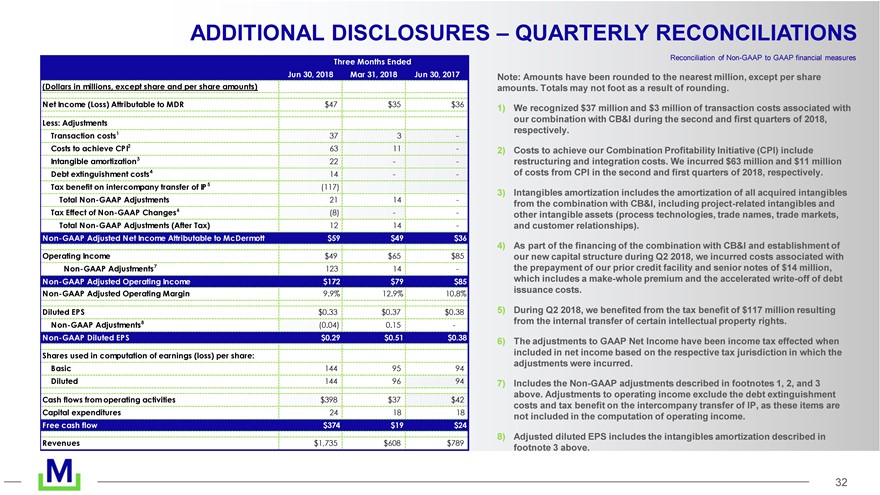
ADDITIONAL DISCLOSURES ? QUARTERLY RECONCILIATIONS Three Months Ended Reconciliation of Non-GAAP to GAAP financial measures Jun 30, 2018 Mar 31, 2018 Jun 30, 2017 (Dollars in millions, except share and per share amounts) Net Income (Loss) Attributable to MDR $47 $35 $36 Less: Adjustments Transaction costs1 37 3 - Costs to achieve CPI2 63 11 - Intangible amortization3 22 - - Debt extinguishment costs4 14 - - Tax benefit on intercompany transfer of IP 5 (117) Total Non-GAAP Adjustments 21 14 - Tax Effect of Non-GAAP Changes6 (8) - - Total Non-GAAP Adjustments (After Tax) 12 14 - Non-GAAP Adjusted Net Income Attributable to McDermott $59 $49 $36 Operating Income $49 $65 $85 Non-GAAP Adjustments7 123 14 - Non-GAAP Adjusted Operating Income $172 $79 $85 Non-GAAP Adjusted Operating Margin 9.9% 12.9% 10.8% Diluted EPS $0.33 $0.37 $0.38 Non-GAAP Adjustments8 (0.04) 0.15 - Non-GAAP Diluted EPS $0.29 $0.51 $0.38 Shares used in computation of earnings (loss) per share: Basic 144 95 94 Diluted 144 96 94 Cash flows from operating activities $398 $37 $42 Capital expenditures 24 18 18 Free cash flow $374 $19 $24 Revenues $1,735 $608 $789 Note: Amounts have been rounded to the nearest million, except per share amounts. Totals may not foot as a result of rounding. 1) We recognized $37 million and $3 million of transaction costs associated with our combination with CB&I during the second and first quarters of 2018, respectively. 2) Costs to achieve our Combination Profitability Initiative (CPI) include restructuring and integration costs. We incurred $63 million and $11 million of costs from CPI in the second and first quarters of 2018, respectively. 3) Intangibles amortization includes the amortization of all acquired intangibles from the combination with CB&I, including project-related intangibles and other intangible assets (process technologies, trade names, trade markets, and customer relationships). 4) As part of the financing of the combination with CB&I and establishment of our new capital structure during Q2 2018, we incurred costs associated with the prepayment of our prior credit facility and senior notes of $14 million, which includes a make-whole premium and the accelerated write-off of debt issuance costs. 5) During Q2 2018, we benefited from the tax benefit of $117 million resulting from the internal transfer of certain intellectual property rights. 6) The adjustments to GAAP Net Income have been income tax effected when included in net income based on the respective tax jurisdiction in which the adjustments were incurred. 7) Includes the Non-GAAP adjustments described in footnotes 1, 2, and 3 above. Adjustments to operating income exclude the debt extinguishment costs and tax benefit on the intercompany transfer of IP, as these items are not included in the computation of operating income. 8) Adjusted diluted EPS includes the intangibles amortization described in footnote 3 above. 32
|
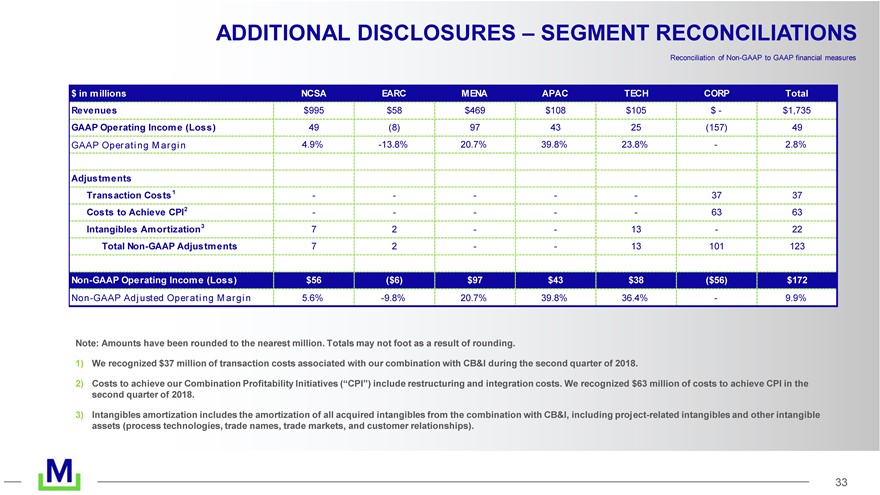
ADDITIONAL DISCLOSURES ? SEGMENT RECONCILIATIONS Reconciliation of Non-GAAP to GAAP financial measures $ in millions NCSA EARC MENA APAC TECH CORP Total Revenues $995 $58 $469 $108 $105 $ - $1,735 GAAP Operating Income (Loss) 49 (8) 97 43 25 (157) 49 GAAP Operating M argin 4.9% -13.8% 20.7% 39.8% 23.8% - 2.8% Adjustments Transaction Costs1 - - - - - 37 37 Costs to Achieve CPI2 - - - - - 63 63 Intangibles Amortization3 7 2 - - 13 - 22 Total Non-GAAP Adjustments 7 2 - - 13 101 123 Non-GAAP Operating Income (Loss) $56 ($6) $97 $43 $38 ($56) $172 Non-GAAP Adjusted Operating M argin 5.6% -9.8% 20.7% 39.8% 36.4% - 9.9% Note: Amounts have been rounded to the nearest million. Totals may not foot as a result of rounding. 1) We recognized $37 million of transaction costs associated with our combination with CB&I during the second quarter of 2018. 2) Costs to achieve our Combination Profitability Initiatives (?CPI?) include restructuring and integration costs. We recognized $63 million of costs to achieve CPI in the second quarter of 2018. 3) Intangibles amortization includes the amortization of all acquired intangibles from the combination with CB&I, including project-related intangibles and other intangible assets (process technologies, trade names, trade markets, and customer relationships). 33
|
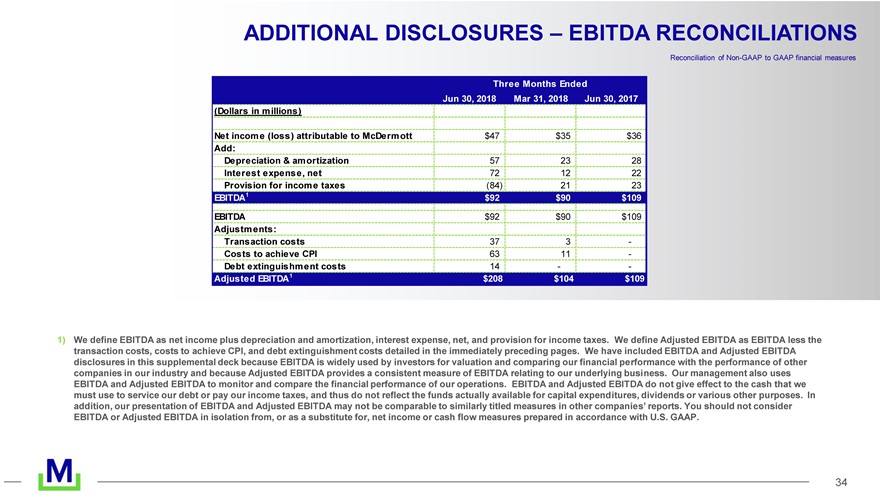
ADDITIONAL DISCLOSURES ? EBITDA RECONCILIATIONS Reconciliation of Non-GAAP to GAAP financial measures Three Months Ended Jun 30, 2018 Mar 31, 2018 Jun 30, 2017 (Dollars in millions) Net income (loss) attributable to McDermott $47 $35 $36 Add: Depreciation & amortization 57 23 28 Interest expense, net 72 12 22 Provision for income taxes (84) 21 23 EBITDA1 $92 $90 $109 EBITDA $92 $90 $109 Adjustments: Transaction costs 37 3 -Costs to achieve CPI 63 11 -Debt extinguishment costs 14 - - Adjusted EBITDA1 $208 $104 $109 1) We define EBITDA as net income plus depreciation and amortization, interest expense, net, and provision for income taxes. We define Adjusted EBITDA as EBITDA less the transaction costs, costs to achieve CPI, and debt extinguishment costs detailed in the immediately preceding pages. We have included EBITDA and Adjusted EBITDA disclosures in this supplemental deck because EBITDA is widely used by investors for valuation and comparing our financial performance with the performance of other companies in our industry and because Adjusted EBITDA provides a consistent measure of EBITDA relating to our underlying business. Our management also uses EBITDA and Adjusted EBITDA to monitor and compare the financial performance of our operations. EBITDA and Adjusted EBITDA do not give effect to the cash that we must use to service our debt or pay our income taxes, and thus do not reflect the funds actually available for capital expenditures, dividends or various other purposes. In addition, our presentation of EBITDA and Adjusted EBITDA may not be comparable to similarly titled measures in other companies? reports. You should not consider EBITDA or Adjusted EBITDA in isolation from, or as a substitute for, net income or cash flow measures prepared in accordance with U.S. GAAP. 34
|
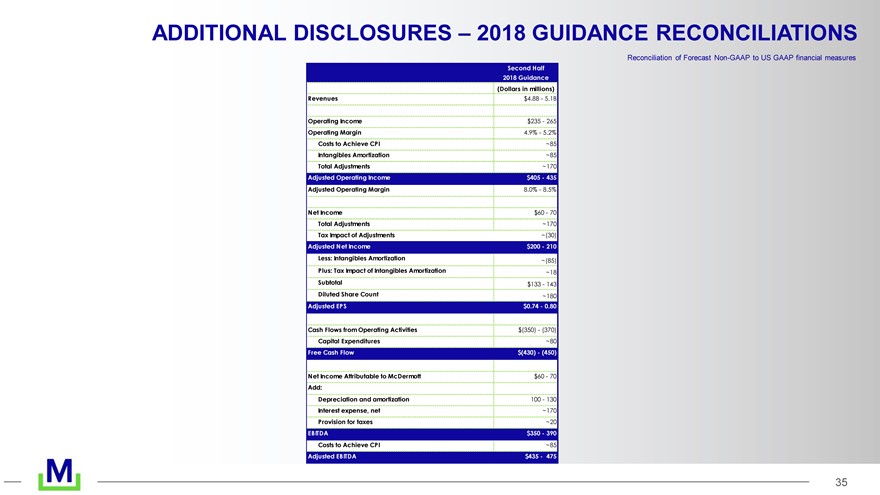
ADDITIONAL DISCLOSURES ? 2018 GUIDANCE RECONCILIATIONS Reconciliation of Forecast Non-GAAP to US GAAP financial measures Second Half 2018 Guidance (Dollars in millions) Revenues $4.8B - 5.1B Operating Income $235 - 265 Operating Margin 4.9% - 5.2% Costs to Achieve CPI ~85 Intangibles Amortization ~85 Total Adjustments ~170 Adjusted Operating Income $405 - 435 Adjusted Operating Margin 8.0% - 8.5% Net Income $60 - 70 Total Adjustments ~170 Tax Impact of Adjustments ~(30) Adjusted Net Income $200 - 210 Less: Intangibles Amortization ~(85) Plus: Tax Impact of Intangibles Amortization ~18 Subtotal $133 - 143 Diluted Share Count ~180 Adjusted EPS $0.74 - 0.80 Cash Flows from Operating Activities $(350) - (370) Capital Expenditures ~80 Free Cash Flow $(430) - (450) Net Income Attributable to McDermott $60 - 70 Add: Depreciation and amortization 100 - 130 Interest expense, net ~170 Provision for taxes ~20 EBITDA $350 - 390 Costs to Achieve CPI ~85 Adjusted EBITDA $435 - 475 35
|
M 36