Attached files
| file | filename |
|---|---|
| 8-K - 8-K 7-31-18 INVESTOR PRESENTATION - Blue Hills Bancorp, Inc. | a8-kinvestorpresentation7x.htm |

Keefe Bruyette & Woods 2018 Community Bank Investor Conference July 31, 2018 William Parent - Chief Executive Officer Our Transformative Journey Continues

Cautionary Note Regarding Forward-Looking Statements & Non-GAAP Information This presentation, as well as other written communications made from time to time by the Company and its subsidiaries and oral communications made from time to time by authorized officers of the Company, may contain statements relating to the future results of the Company (including certain projections and business trends) that are considered “forward-looking statements” as defined in the Private Securities Litigation Reform Act of 1995 (the “PSLRA”). Such forward-looking statements may be identified by the use of such words as “believe,” “expect,” “anticipate,” “should,” “planned,” “estimated,” “intend” and “potential.” For these statements, the Company claims the protection of the safe harbor for forward-looking statement contained in the PSLRA. The Company cautions you that a number of important factors could cause actual results to differ materially from those currently anticipated in any forward-looking statement. Such factors include, but are not limited to: our ability to implement successfully our business strategy, which includes significant asset and liability growth; changes that could adversely affect the business in which the Company and the Bank are engaged; prevailing economic and geopolitical conditions; changes in interest rates, loan demand, real estate values and competition; changes in accounting principles, policies and guidelines; changes in any applicable law, rule, regulation or practice with respect to tax or legal issues; and other economic, competitive, governmental, regulatory and technological factors affecting the Company’s operations, pricing, products and services. For additional information on some of the risks and important factors that could affect the Company’s future results and financial condition, see “Risk Factors” in the Company’s Annual Report on Form 10-K as filed with the Securities and Exchange Commission. The forward-looking statements are made as of the date of this presentation, and, except as may be required by applicable law or regulation, the Company assumes no obligation to update the forward-looking statements or to update the reasons why actual results could differ from those projected in the forward-looking statements. In addition, this presentation includes non-GAAP financial measures to describe Blue Hills Bancorp's performance. These non- GAAP measures are reconciled to GAAP measures within the appendix. Management believes these measures provide useful information to investors by allowing them to make peer comparisons and better assess the Company's historical trends. 2

3

4

Balance Sheet Transformation December 31, 2011 June 30, 2018 Other Other 6% 15% Securities 11% Loans 29% Securities Loans 56% 83% Total Assets $0.97 billion Total Assets $2.74 billion 5

Loan Driven Growth Total assets ($ millions) Net loans ($ millions) 3,000 2,500 $2,741 $2,669 $2,186 $2,242 $2,470 2,500 2,000 $1,913 $2,114 2,000 $1,523 $1,728 1,500 1,500 $1,314 $1,133 $1,229 1,000 $971 1,000 $765 $488 500 500 $277 0 0 1 2 3 4 5 6 7 8 1 2 3 4 5 6 7 8 01 1 1 1 1 1 1 1 01 1 1 1 1 1 1 1 2 20 20 20 20 20 20 20 2 20 20 20 20 20 20 20 1/ / / / / / / / 1/ / / / / / / / 3 31 31 31 31 31 31 30 3 31 31 31 31 31 31 30 2/ / / / / / / / 2/ / / / / / / / 1 12 12 12 12 12 12 6 1 12 12 12 12 12 12 6 6

Well Diversified Portfolio Loan composition at 6/30/2018 Loan composition at 12/31/2011 Construction 4% Consumer 1% Other Loans 5% C&I 12% Residential 44% CRE 36% Home Equity Residential 3% 95% $2.24 billion $204 million 7

Commercial Lending Originations ($ millions) 600 • Bank formed commercial lending group in 2011 500 $419 $413 • Group is run by Kevin Malone, 400 $376 100 132 former Greater Boston & $315 $303 85 300 319 291 Rhode Island market president 121 110 281 200 $167 for TD Bank 194 193 $157 56 51 100 111 106 • Commercial portfolio has $2 grown from $9 million at 0 2011 2012 2013 2014 2015 2016 2017 1H '18 December 31, 2011 to $1.2 Originations Participations billion at June 30, 2018 8

Commercial Real Estate Portfolio CRE Loans ($ millions) 1,000 $834 $825 800 $687 $561 600 • Approximately 90% of non- $388 400 owner occupied CRE loans are in $229 Massachusetts 200 $101 $8 0 • Non-owner occupied CRE = 2011 2012 2013 2014 2015 2016 2017 1H '18 213% of total risk based capital Other: 7% • CRE loans are swapped to Industrial: 4% Residential Investment floating rate and this contributes Properties: 21% Hotels: 5% to the bank's asset sensitive rate risk position Office: 20% Owner Occupied: 12% Land: 6% 9 Mixed Use: 25%

C&I Portfolio C&I Loans Industry Concentration at 6/30/2018 ($ millions) 300 $269 $254 Other: 5% Accommodation & 250 Food Services: 10% $206 Leasing: 9% 200 $183 $152 150 $111 Construction: 7% Finance & Insurance: 15% 100 50 $34 $1 Retail Trade: 8% 0 2011 2012 2013 2014 2015 2016 2017 1H '18 Warehousing & Administrative: 15% Storage: 5% • Focused on family owned Manufacturing: 11% businesses and growth Wholesale companies Trade: 15% • Asset Based lending team added in 2016 • Cash management system upgraded in 2017 10

Residential Mortgage Portfolio Residential mortgages ($ millions) 1,200 $986 1,000 $923 $851 800 $600 • Group is run by Bob Driscoll, who 600 $460 $365 has been with Blue Hills Bank since 400 $264 $312 1996 200 0 • New Massachusetts loan production 2011 2012 2013 2014 2015 2016 2017 1H '18 offices opened in 2016-2018 Originations (Cambridge, Franklin, Winchester, ($ millions) Hingham, Concord, Dorchester, and Marblehead) 600 $522 $495 500 • Most loans on balance sheet are non- 13 6 400 conforming (88% at 6/30/2018) 509 300 $237 $260 $239 • Most originations are for home 36 200 $166 $176 66 489 239 $134 purchases (approximately 80%) 89 104 224 100 88 171 46 77 72 0 2011 2012 2013 2014 2015 2016 2017 1H '18 11 Originations Purchases

Reserve Coverage Loan loss reserve, % of total loans 2.0% 1.5% 1.25% 1.25% 1.13% 1.13% 1.11% 0.97% 0.95% 1.0% 0.89% 0.5% 0.0% 1 2 3 4 5 6 7 8 1 1 1 1 1 1 1 1 0 0 0 0 0 0 0 0 /2 /2 /2 /2 /2 /2 /2 /2 1 1 1 1 1 1 1 0 /3 /3 /3 /3 /3 /3 /3 /3 2 2 2 2 2 2 2 6 1 1 1 1 1 1 1 Note: Trend reflects the migration from using national FDIC historical loss rates to the Company's own loss experience. 12

Nonperforming Assets NPAs, % of assets 1.00% 0.75% 0.51% 0.51% 0.50% 0.43% 0.36% 0.28% 0.26% 0.25% 0.18% 0.13% 0.00% 1 2 3 4 5 6 7 8 1 1 1 1 1 1 1 1 0 0 0 0 0 0 0 0 /2 /2 /2 /2 /2 /2 /2 /2 1 1 1 1 1 1 1 0 /3 /3 /3 /3 /3 /3 /3 /3 2 2 2 2 2 2 2 6 1 1 1 1 1 1 1 13

Improved Deposit Mix Deposits ($ millions) Deposit composition NOW & Demand At 12/31/2011 11% 2,500 $2,112 Savings $2,040 CDs 23% 2,000 51% $1,809 1,500 $1,434 Money market $1,213 15% 1,000 $915 NOW & $818 $756 Demand At 6/30/2018 CDs 18% 38% 500 Savings 10% 0 11 2 3 4 5 6 7 8 0 01 01 01 01 01 01 01 /2 2 2 2 2 2 2 2 1 1/ 1/ 1/ 1/ 1/ 1/ 0/ /3 3 3 3 3 3 3 3 2 2/ 2/ 2/ 2/ 2/ 2/ 6/ 1 1 1 1 1 1 1 Money market 34% 14

Retail Banking Non-brokered deposits by customer type Non-brokered deposits by location at 6/30/2018 at 6/30/2018 Commercial De Novos (2) 9% Municipal 14% 9% Business Nantucket (1) Banking 19% 13% Legacy Consumer Franchise / Other 69% 67% • Group is run by Jim Kivlehan, former (1) Acquired January 2014 executive at Citizens Bank (2) Branch openings: Milton Q4'14, Westwood Q4'15, Seaport Q4'16 • Non brokered deposits per branch = $158.5 million • Loans/deposits ratio =107% at 6/30/2018 (peer average of 106% based on 14 New England publicly traded community banks at 3/31/2018) 15

Net Interest Income Improvement Driven by Loan Growth & Margin Expansion (asset sensitive rate risk position) ($ millions) 80 70 20.9% $66.8 CAGR = 60 $55.8 50 $45.3 40 $37.8 $37.0 $32.1 30 20 10 0 2014 2015 2016 2017 1H '18 1H '17 Net Interest Margin: 2.57% 2.64% 2.66% 2.75% 2.93% 2.72% 16 Note: Data shown is on a non-GAAP basis; see Appendix for GAAP reconciliations.

Core Fee Income Core fee income ($ millions) 10 $9.5 9 31.3% 8 $7.7 CAGR = 7 6 $5.2 $4.9 5 $4.2 $3.8 4 3 2 1 0 2014 2015 2016 2017 1H '18 1H '17 Note: Core fee income includes deposit account fees, interchange & ATM fees, mortgage banking revenue, and loan level derivative income (CRE loan swaps) 17

Investment Spending - Non Interest Expense ($ millions) 60 $54.0 $55.1 50 $48.5 3.6% $40.6 40 CAGR = 30 20 10 $5.5 $5.5 $2.4 0 2014 Total Equity Plans DeNovo 2014 Adjusted Other 2017 Total 1H'18 NIE Branches NIE Franchise NIE annualized Expansion / Infrastructure (1) (1) Includes relocation of company headquarters, significant expansion of mortgage business, creation of asset based lending and government banking businesses, as well as other initiatives. 18 Note: Data shown is on a non-GAAP basis; see Appendix for GAAP reconciliations.

Significant Positive Operating Leverage Pre-tax, Pre-Provision, Net Revenue excluding nonrecurring items ($ millions; except EPS) $24.4 25 $0.6 86.0% $0.56 PPNR $0.48 Growth Rates 20 CAGR = $16.0 ) 1H'18 vs 1H'17 46% ) 1 $0.4 ( $14.6 2 15 ( R S N P 2017 vs 2016 67% P $11.0 E P 10 $8.5 $0.28 2016 vs 2015 71% $0.25 $0.2 2015 vs 2014 125% 5 $3.8 $0.14 0 $0.0 2014 2015 2016 2017 1H'17 1H'18 (1) PPNR = Pre-Tax, Pre-Provision, Net Revenue (2) Blue HIlls was not a public company for all of 2014 (IPO in July 2014), therefore, EPS is not applicable for the full year in 2014. Note: Date shown is on a non-GAAP basis; see Appendix for GAAP reconciliation. 19

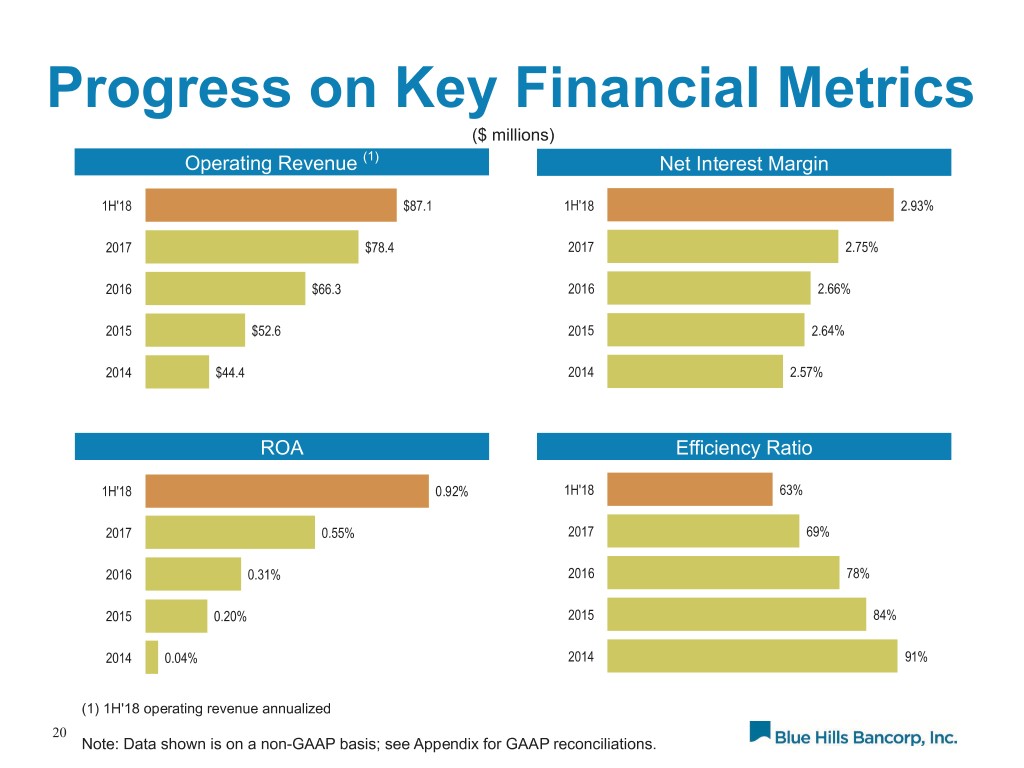
Progress on Key Financial Metrics ($ millions) Operating Revenue (1) Net Interest Margin 1H'18 $87.1 1H'18 2.93% 2017 $78.4 2017 2.75% 2016 $66.3 2016 2.66% 2015 $52.6 2015 2.64% 2014 $44.4 2014 2.57% ROA Efficiency Ratio 1H'18 0.92% 1H'18 63% 2017 0.55% 2017 69% 2016 0.31% 2016 78% 2015 0.20% 2015 84% 2014 0.04% 2014 91% (1) 1H'18 operating revenue annualized 20 Note: Data shown is on a non-GAAP basis; see Appendix for GAAP reconciliations.

Capital Deployment Tangible Common Equity 500 30% • TCE ratio decline mainly reflects balance sheet 25% expansion $398.2 $48.6 400 $390.9 23.2% • Regular quarterly $14.2 dividend has been raised 20% multiple times; currently ) s 300 n o o $0.20 per share i i t l l i a R m $(32.6) 15% $ $(37.5) E • Two special dividends ( C E 14.3% T C have been paid; $0.20 in T 200 2017 & $0.30 in 2018 10% • No buybacks since 100 Q4'16 due to valuation 5% • Acquisitions problematic due to stock's valuation 0 0% 12/31/2014 Buybacks Dividends Share Based Other 6/30/2018 Compensation (mainly earnings) 21

Stock Valuation 220 80 201% 200 62 60 180 174% 169% 49 V 45 B 160 156% T I / E P 40 / P V 139% B T 140 134% / P 123% 26 120 20 109% 20 98% 100 93% 80 0 12/31/14 12/31/15 12/31/16 12/31/17 7/25/18 P/TBV P/ITBV P/E Dividend Yield 0.0% 0.5% 0.6% 4.0% 4.8% P/TBV = Price/tangible book value P/ITBV = Price/invested tangible book value (8.0%) P/E = Price earnings ratio based on consensus estimates; 7/25/18 P/E based on 2019 consensus estimate 22 Note: Dividend yield calculations for 2017 and 2018 include special dividends

Challenges and Opportunities Ahead Continue to improve returns & financial ratios Grow core deposit funding Maintain discipline amid significant competitive pressures Look for ways to deploy excess capital and boost ROE Emphasize importance of risk management in all areas of the bank 23

Appendix 24

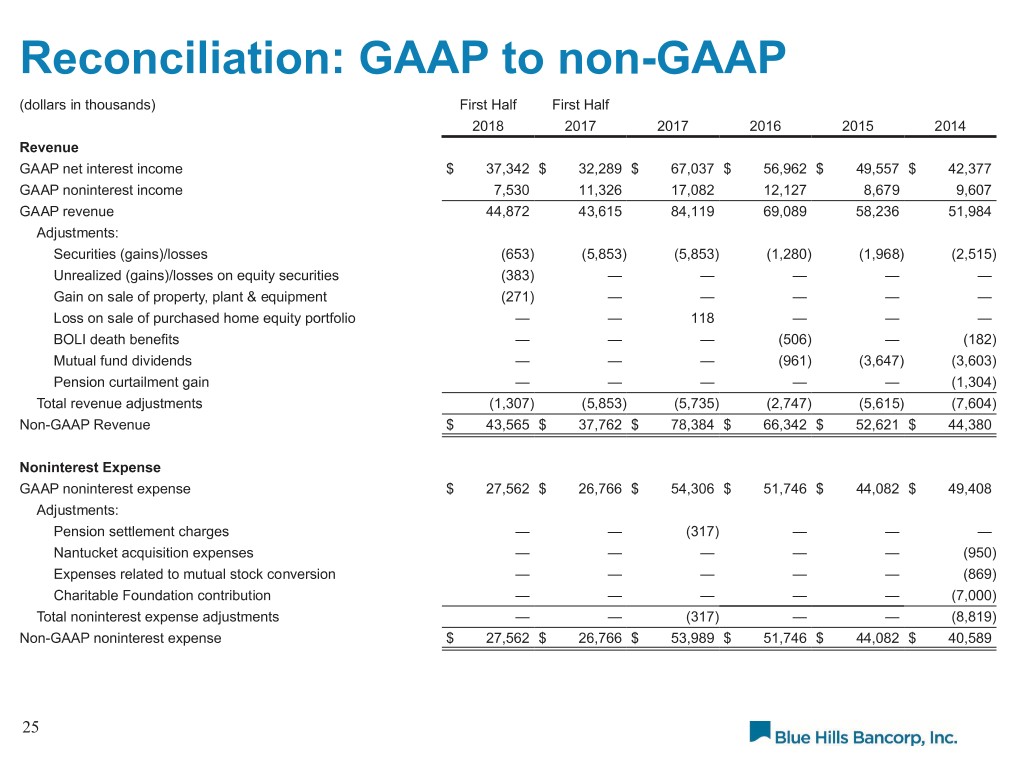
Reconciliation: GAAP to non-GAAP (dollars in thousands) First Half First Half 2018 2017 2017 2016 2015 2014 Revenue GAAP net interest income $ 37,342 $ 32,289 $ 67,037 $ 56,962 $ 49,557 $ 42,377 GAAP noninterest income 7,530 11,326 17,082 12,127 8,679 9,607 GAAP revenue 44,872 43,615 84,119 69,089 58,236 51,984 Adjustments: Securities (gains)/losses (653) (5,853) (5,853) (1,280) (1,968) (2,515) Unrealized (gains)/losses on equity securities (383) — — — — — Gain on sale of property, plant & equipment (271) — — — — — Loss on sale of purchased home equity portfolio — — 118 — — — BOLI death benefits — — — (506) — (182) Mutual fund dividends — — — (961) (3,647) (3,603) Pension curtailment gain — — — — — (1,304) Total revenue adjustments (1,307) (5,853) (5,735) (2,747) (5,615) (7,604) Non-GAAP Revenue $ 43,565 $ 37,762 $ 78,384 $ 66,342 $ 52,621 $ 44,380 Noninterest Expense GAAP noninterest expense $ 27,562 $ 26,766 $ 54,306 $ 51,746 $ 44,082 $ 49,408 Adjustments: Pension settlement charges — — (317) — — — Nantucket acquisition expenses — — — — — (950) Expenses related to mutual stock conversion — — — — — (869) Charitable Foundation contribution — — — — — (7,000) Total noninterest expense adjustments — — (317) — — (8,819) Non-GAAP noninterest expense $ 27,562 $ 26,766 $ 53,989 $ 51,746 $ 44,082 $ 40,589 25

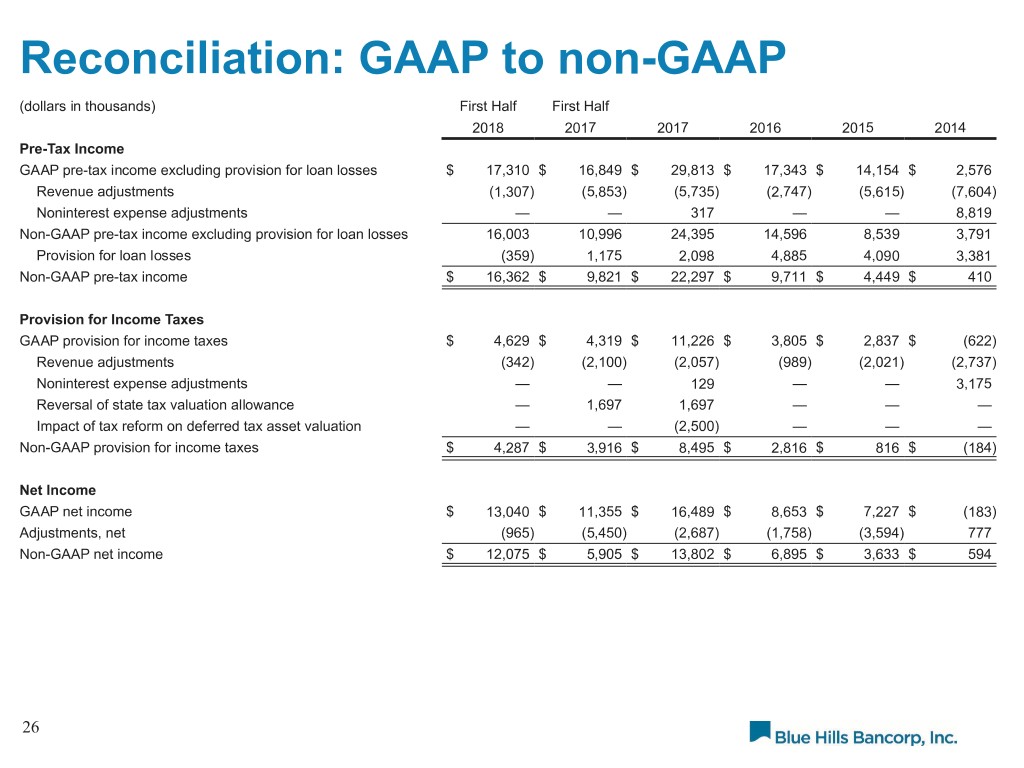
Reconciliation: GAAP to non-GAAP (dollars in thousands) First Half First Half 2018 2017 2017 2016 2015 2014 Pre-Tax Income GAAP pre-tax income excluding provision for loan losses $ 17,310 $ 16,849 $ 29,813 $ 17,343 $ 14,154 $ 2,576 Revenue adjustments (1,307) (5,853) (5,735) (2,747) (5,615) (7,604) Noninterest expense adjustments — — 317 — — 8,819 Non-GAAP pre-tax income excluding provision for loan losses 16,003 10,996 24,395 14,596 8,539 3,791 Provision for loan losses (359) 1,175 2,098 4,885 4,090 3,381 Non-GAAP pre-tax income $ 16,362 $ 9,821 $ 22,297 $ 9,711 $ 4,449 $ 410 Provision for Income Taxes GAAP provision for income taxes $ 4,629 $ 4,319 $ 11,226 $ 3,805 $ 2,837 $ (622) Revenue adjustments (342) (2,100) (2,057) (989) (2,021) (2,737) Noninterest expense adjustments — — 129 — — 3,175 Reversal of state tax valuation allowance — 1,697 1,697 — — — Impact of tax reform on deferred tax asset valuation — — (2,500) — — — Non-GAAP provision for income taxes $ 4,287 $ 3,916 $ 8,495 $ 2,816 $ 816 $ (184) Net Income GAAP net income $ 13,040 $ 11,355 $ 16,489 $ 8,653 $ 7,227 $ (183) Adjustments, net (965) (5,450) (2,687) (1,758) (3,594) 777 Non-GAAP net income $ 12,075 $ 5,905 $ 13,802 $ 6,895 $ 3,633 $ 594 26

Reconciliation: GAAP to non-GAAP (dollars in thousands) First Half First Half 2018 2017 2017 2016 2015 2014 Return on Assets Average assets $ 2,651,776 $ 2,488,938 $ 2,531,560 $ 2,240,393 $ 1,852,895 $1,611,715 ROA GAAP basis 0.99% 0.92% 0.65% 0.39% 0.39% (0.01)% ROA non-GAAP basis 0.92% 0.48% 0.55% 0.31% 0.20% 0.04 % Return on Average Equity Average Equity $ 399,897 $ 395,906 $ 398,679 $ 392,670 $ 411,272 NM ROE GAAP basis 6.58% 5.78% 4.14% 2.20% 1.76% NM ROE non-GAAP basis 6.09% 3.01% 3.46% 1.76% 0.88% NM Net Interest Margin GAAP net interest income $ 37,342 $ 32,289 $ 67,037 $ 56,962 $ 49,557 $ 42,377 FTE adjustment 66 126 248 307 341 396 FTE net interest income 37,408 32,415 67,285 57,269 49,898 42,773 Purchase accounting accretion (371) (288) (491) (512) (933) (1,334) Mutual fund dividends — — — (961) (3,647) (3,603) Accelerated bond amortization — — — 10 — — Non-GAAP net interest income $ 37,037 $ 32,127 $ 66,794 $ 55,806 $ 45,318 $ 37,836 Average Earning Assets $ 2,551,795 $ 2,389,240 $ 2,432,227 $ 2,137,525 $ 1,760,261 $1,524,578 Nantucket Accretion 1,473 2,004 1,869 2,387 3,136 3,403 Mutual Funds — (12,897) (6,406) (41,301) (43,837) (54,460) Non-GAAP average earning assets $ 2,553,268 $ 2,378,347 $ 2,427,690 $ 2,098,611 $ 1,719,560 $1,473,521 GAAP NIM 2.95% 2.73% 2.76% 2.66% 2.82% 2.78 % FTE NIM 2.96% 2.74% 2.77% 2.68% 2.83% 2.81 % Non-GAAP NIM (FTE and excluding mutual fund dividends) 2.93% 2.72% 2.75% 2.66% 2.64% 2.57 % 27

Reconciliation: GAAP to non-GAAP (dollars in thousands) First Half First Half 2018 2017 2017 2016 2015 2014 Efficiency Ratio GAAP basis 61.42% 61.37% 64.56% 74.90% 75.70% 95.04% Non-GAAP basis 63.27% 70.88% 68.88% 78.00% 83.77% 91.46% NIE / Average Assets GAAP basis 2.10% 2.17% 2.15% 2.31% 2.38% 3.07% Non-GAAP basis 2.10% 2.17% 2.13% 2.31% 2.38% 2.52% Diluted Earnings Per Share Average diluted shares (thousands) 24,910.065 24,311.222 24,482.414 24,540.929 26,069.589 NM EPS GAAP basis $ 0.52 $ 0.47 $ 0.67 $ 0.35 $ 0.28 NM EPS non-GAAP basis $ 0.48 $ 0.25 $ 0.56 $ 0.28 $ 0.14 NM 28
