Attached files
| file | filename |
|---|---|
| EX-32.0 - EXHIBIT 32.0 - Blue Hills Bancorp, Inc. | certificationofchiefexcecu.htm |
| EX-31.2 - EXHIBIT 31.2 CERTIFICATION OF CFO 2018 - Blue Hills Bancorp, Inc. | a312certificationofthechie.htm |
| EX-31.1 - EXHIBIT 31.1 CEO CERTIFICATION 2017 - Blue Hills Bancorp, Inc. | a311certificationofthechie.htm |
| EX-23 - EXHIBIT 23 CONSENT WOLF 2017 - Blue Hills Bancorp, Inc. | copyofexhibit232017consent.htm |
UNITED STATES SECURITIES AND EXCHANGE COMMISSION
Washington, D.C. 20549
FORM 10-K
þ | Annual Report Pursuant to Section 13 or 15(d) of the Securities Exchange Act of 1934 |
For the Fiscal Year Ended December 31, 2017
OR
o | Transition Report Pursuant to Section 13 or 15(d) of the Securities Exchange Act of 1934 |
For the transition period from to
Commission file number 001-36551
Blue Hills Bancorp, Inc.
(Exact name of registrant as specified in its charter)
Maryland | 46-5429062 |
(State or other jurisdiction of incorporation or organization) | (I.R.S. Employer Identification No.) |
500 River Ridge Drive Norwood, Massachusetts | 02062 Zip Code |
(Address of Principal Executive Offices) | |
(617) 361-6900
(Registrant’s telephone number, including area code)
Securities Registered Pursuant to Section 12(b) of the Act:
Title of Each Class | Name of Each Exchange on Which Registered |
Common Stock, $0.01 par value | The NASDAQ Stock Market, LLC |
Securities Registered Pursuant to Section 12(g) of the Act:
None
Indicate by check mark if the registrant is a well-known seasoned issuer, as defined in Rule 405 of the Securities Act. Yes o No þ
Indicate by check mark if the registrant is not required to file reports pursuant to Section 13 or Section 15(d) of the Act. Yes o No þ
Indicate by check mark whether the registrant (1) has filed all reports required to be filed by section 13 or 15(d) of the Securities Exchange Act of 1934 during the preceding 12 months (or for such shorter period that the registrant was required to file such reports), and (2) has been subject to such filing requirements for the past 90 days. Yes þ No o
Indicate by check mark whether the registrant has submitted electronically and posted on its corporate Website, if any, every Interactive Data File required to be submitted and posted pursuant to Rule 405 of Regulation S-T (§ 232.405 of this chapter) during the preceding 12 months (or for such shorter period that the registrant was required to submit and post such files). Yes þ No o
Indicate by check mark if disclosure of delinquent filers pursuant to Item 405 of Regulation S-K (§ 229.405 of this chapter) is not contained herein, and will not be contained, to the best of registrant’s knowledge, in definitive proxy or information statements incorporated by reference in Part III of this Form 10-K or any amendment to this form 10-K. þ
Indicate by check mark whether the registrant is a large accelerated filer, an accelerated filer, a non-accelerated filer, or a smaller reporting company. See the definitions of “large accelerated filer,” “accelerated filer” and “smaller reporting company” in Rule 12b-2 of the Exchange Act. (Check one):
Large Accelerated Filer | o | Accelerated Filer | þ | Non-Accelerated Filer | o | Smaller Reporting Company | o |
If an emerging growth company, indicate by check mark if the registrant has elected not to use the extended transition period for complying with any new or revised financial accounting standards provided pursuant to Section 13(a) of the Exchange Act. þ
Indicate by check mark whether the registrant is a shell company (as defined in Rule 12b-2 of the Act). Yes o No þ
The aggregate market value of the voting and non-voting common stock held by non-affiliates of the Registrant as of its last completed second fiscal quarter was $431,133,000
As of March 2, 2018, there were 26,859,423 outstanding shares of the Registrant’s common stock.
DOCUMENTS INCORPORATED BY REFERENCE
Portions of the Proxy Statement for the 2018 Annual Meeting of Stockholders of the Registrant are incorporated by reference in Part III of this Form 10-K.
BLUE HILLS BANCORP, INC.
2017 FORM 10-K ANNUAL REPORT
TABLE OF CONTENTS
Page | ||
PART I | ||
Item 1. | ||
Item 1A. | ||
Item 1B. | ||
Item 2. | ||
Item 3. | ||
Item 4. | ||
PART II | ||
Item 5. | ||
Item 6. | ||
Item 7. | ||
Item 7A. | ||
Item 8. | ||
Item 9. | ||
Item 9A. | ||
Item 9B. | ||
PART III | ||
Item 10. | ||
Item 11. | ||
Item 12. | ||
Item 13. | ||
Item 14. | ||
PART IV | ||
Item 15. | ||
Item 16. | ||
SIGNATURES | ||
PART I
ITEM 1. BUSINESS
This Annual Report contains forward-looking statements, which can be identified by the use of words such as “estimate,” “project,” “believe,” “intend,” “anticipate,” “plan,” “seek,” “expect,” “will,” “may” and words of similar meaning. These forward-looking statements include, but are not limited to:
• | statements of our goals, intentions and expectations; |
• | statements regarding our business plans, prospects, growth and operating strategies; |
• | statements regarding the asset quality of our loan and investment portfolios; and |
• | estimates of our risks and future costs and benefits. |
These forward-looking statements are based on our current beliefs and expectations and are inherently subject to significant business, economic and competitive uncertainties and contingencies, many of which are beyond our control. In addition, these forward-looking statements are subject to assumptions with respect to future business strategies and decisions that are subject to change. We do not undertake any obligation to update any forward-looking statements after the date of this Annual Report, except as required by law.
The following factors, among others, could cause actual results to differ materially from the anticipated results or other expectations expressed in the forward-looking statements:
• | our ability to implement successfully our business strategy, which includes continued loan and deposit growth; |
• | our ability to increase our market share in our market areas, enter new markets and capitalize on growth opportunities; |
• | our ability to implement successfully our branch network expansion strategy; |
• | general economic conditions, either nationally or in our market areas, that are worse than expected; |
• | competition among depository and other financial institutions; |
• | inflation and changes in the interest rate environment that reduce our margins or reduce the fair value of financial instruments; |
• | changes in monetary policy, changes in government support for housing; |
• | adverse changes in asset quality including an unanticipated credit deterioration in our loan portfolio; |
• | adverse changes in the securities markets which could cause a material decline in our reported equity and/or our net income if we must record impairment charges or a decline in the fair value of our securities; |
• | changes in laws or government regulations or policies affecting financial institutions, including changes in regulatory fees, capital requirements and the corporate tax rate; |
• | changes in consumer spending, borrowing and savings habits; |
• | changes in accounting policies and practices, as may be adopted by the bank regulatory agencies, the Financial Accounting Standards Board, or the Securities and Exchange Commission; |
• | changes in our organization, compensation and benefit plans; |
• | changes in our financial condition or results of operations that reduce capital available to pay dividends; |
and
• | cyber security attacks or intrusions that could adversely impact our businesses. |
Because of these and a wide variety of other risks and uncertainties, including those included in this annual report under “Item1A. Risk Factors,” our actual future results may be materially different from the results indicated by these forward-looking statements.
Blue Hills Bancorp, Inc.
Blue Hills Bancorp, Inc. (“Blue Hills Bancorp” or the “Company”) is a Maryland corporation that owns 100% of the common stock of Blue Hills Bank (the “Bank”) and Blue Hills Funding Corporation. Blue Hills Bancorp was incorporated in February 2014 to become the holding company of the Bank in connection with the mutual-to-stock conversion of Hyde Park Bancorp, MHC, the Bank’s former holding company. On July 21, 2014, we completed our initial public offering of common stock in connection with the conversion, selling 27,772,500 shares of common stock at $10.00 per share for approximately $277.7 million in gross proceeds, including 2,277,345 shares sold to the Bank’s employee stock ownership plan. In addition, in connection with the conversion, we issued 694,313 shares of our common stock and contributed $57,000 in cash to the Blue Hills Bank Foundation. As of December 31, 2017, we had consolidated assets of $2.67 billion, consolidated deposits of $2.04 billion and consolidated equity of $397.8 million. Other than holding the common stock of Blue Hills Bank, Blue Hills Bancorp has not engaged in any significant business to date. In the future, we may pursue other business activities, including mergers and acquisitions, investment alternatives and diversification of operations. There are, however, no current understandings or agreements for these activities.
3
The executive and administrative office of Blue Hills Bancorp, Inc. is located at 500 River Ridge Drive, Norwood, Massachusetts 02062, and its telephone number at this address is (617) 361-6900. Our website address is www.bluehillsbancorp.com. Information on our website is not and should not be considered to be a part of this annual report.
Blue Hills Bank
Blue Hills Bank was organized in 1871 and is a Massachusetts-chartered savings bank headquartered in Hyde Park, Massachusetts. We provide financial services to individuals, families, small to mid-size businesses and government and non-profit organizations online and through our eleven full-service branch offices located in Boston, Dedham, Hyde Park, Milton, Nantucket, Norwood, West Roxbury, and Westwood, Massachusetts. Our three branches in Nantucket were acquired in January 2014 (“Nantucket Bank Acquisition”), and operate under the name Nantucket Bank, a division of Blue Hills Bank. We also operate loan production offices in Boston, Cambridge, Concord, Dorchester, Franklin, Hingham, Lowell, Marblehead, Plymouth, and Winchester, Massachusetts. Our primary deposit-taking market includes Norfolk, Suffolk and Nantucket Counties in Massachusetts, and our lending market is primarily based in eastern Massachusetts, however, we actively pursue opportunities across New England.
Our business consists primarily of accepting deposits from the general public, commercial businesses and government and non-profit organizations, and investing those deposits, together with funds generated from operations and borrowings, in 1-4 family residential mortgage loans, commercial real estate loans, commercial business loans and investment securities. To a much lesser extent, we originate home equity loans and lines of credit, construction loans and consumer loans. We offer a full range of deposit accounts, including passbook and statement savings accounts, certificates of deposit, money market accounts, commercial and regular checking accounts and IRAs. Through our bundled products, we offer reduced fees and higher interest rates on relationship accounts.
Blue Hills Bank’s main banking office is located at 1196 River Street, Hyde Park, Massachusetts 02136. Our telephone number at this address is (617) 361-6900. Our website address is www.bluehillsbank.com. Information on our website is not and should not be considered part of this annual report.
Available Information
The Company is a public company and files interim, quarterly and annual reports with the Securities and Exchange Commission. These respective reports are on file and a matter of public record with the Securities and Exchange Commission and may be read and copied at the Securities and Exchange Commission’s Public Reference Room at 100 F Street, NE, Washington, DC 20549. The public may obtain information on the operation of the Public Reference Room by calling the Securities and Exchange Commission at 1-800-SEC-0330. The Securities and Exchange Commission maintains an Internet site that contains reports, proxy and information statements, and other information regarding issuers that file electronically with the SEC (http://www.sec.gov).
Market Area
We provide financial services to individuals, families, small to middle-market businesses and government and non-profit organizations online and through our eleven full-service branch offices and through our relationship managers. Our primary deposit taking market includes Norfolk, Suffolk and Nantucket Counties in Massachusetts. Our primary lending market encompasses a broader region of eastern Massachusetts. In addition, we also make loans secured by properties and the assets of businesses located outside of our primary lending market area. These loans are typically made to businesses headquartered or operating in New England.
Due to our proximity to Boston, our market area benefits from the presence of numerous institutions of higher learning, medical care and research centers and the corporate headquarters of several financial investment companies. Eastern Massachusetts also has many high technology companies employing personnel with specialized skills. As a result, healthcare, high-tech and financial services companies constitute major sources of employment in our regional market area, as well as the colleges and universities that populate the Boston Metropolitan Statistical Area (“MSA”). These factors affect the demand for residential homes, apartments, office buildings, shopping centers, industrial warehouses and other commercial properties. Tourism also is a prominent component of our market area’s economy, as Boston annually ranks as one of the nation’s top tourist destinations.
4
Population and household data indicate that the market surrounding our branches is a mix of urban, suburban and island markets. Suffolk County, where the city of Boston is located, and Norfolk County are two of the largest counties in Massachusetts, with populations of approximately 797,000 and 702,000, respectively. Suffolk County experienced relatively strong demographic growth from 2010 to 2017, at 10.40%, which exceeded both the national and state growth rates of 5.76% and 4.85%, respectively. Norfolk County, a suburban market with a large commuter population, experienced moderate population growth from 2010 to 2017 of 4.6%. Nantucket County is a popular tourist destination and summer colony and thus has seasonal fluctuations in population. Nantucket County has a full-time population of approximately 11,000 residents, which expands to a population of around 100,000 during the peak of the summer vacation season. From 2010 to 2017, Nantucket County experienced population growth of 10.45%. Recent population growth trends are generally projected to moderate slightly over the next five years.
Income measures show that Suffolk County is a relatively low-income market, characterized by its urban demographic in the city of Boston. Median household income for Suffolk County falls below the state measure but exceeds the national measure. Comparatively, income measures show that Norfolk and Nantucket counties are relatively affluent markets, as the wealthiest counties in Massachusetts. In particular, Norfolk County is characterized by a high concentration of white collar professionals who work in the Boston area. Nantucket County is a prestigious vacation destination targeted towards high-income visitors, with home values among the highest in the country. Median household and per capita income measures for Norfolk and Nantucket Counties are both well above the comparable U.S. and Massachusetts income measures. Projected income growth measures for Suffolk and Norfolk Counties are somewhat above the comparable projected growth rates for the U.S. and Massachusetts, whereas Nantucket County’s projected income growth rate is somewhat lower.
The December 2017 unemployment rates for Norfolk, Suffolk and Nantucket Counties were 2.7%, 2.7% and 5.8%, respectively. Norfolk, Suffolk and Nantucket Counties, along with the Commonwealth of Massachusetts, all reported higher unemployment rates for December 2017 compared to a year ago.
Competition
We face intense competition in our market area both in making loans and attracting deposits. We compete with commercial banks, savings institutions, mortgage brokerage firms, credit unions, finance companies, mutual funds, insurance companies and investment banking firms. Some of our competitors have greater name recognition and market presence that benefit them in attracting business, and offer certain services that we do not or cannot provide.
Our deposit sources are primarily concentrated in the communities surrounding our full-service branch offices. As of June 30, 2017 (the latest date for which information is publicly available from the Federal Deposit Insurance Corporation), we ranked sixteenth of 48 banks and thrift institutions with offices in Norfolk County, Massachusetts, with a 1.46% market share. As of that same date, we ranked tenth of 45 banks and thrift institutions with offices in Suffolk County, Massachusetts, with a 0.75% market share. Also, as of that same date, we ranked first of four banks and thrift institutions with offices in Nantucket County, Massachusetts, with a 42.10% market share.
5
Lending Activities
Our primary lending activities are the origination of 1-4 family residential mortgage loans, commercial real estate loans, commercial business loans, home equity loans and lines of credit, other consumer loans and construction loans. Most loans are to borrowers in our core market of New England but to diversify risk we also have loans to borrowers located outside of New England. We also sell in the secondary market the majority of the fixed-rate conforming 1-4 family residential mortgage loans that we originate, generally on a servicing-released, limited or no recourse basis, while retaining jumbo fixed-rate and adjustable-rate 1-4 family residential mortgage loans to manage the duration and time to re-pricing of our loan portfolio.
Loan Portfolio Composition. The following table sets forth the composition of our loan portfolio at the dates indicated. Loans held for sale, which amounted to $9.0 million, $2.8 million, $12.9 million, $14.6 million, and $765,000 at December 31, 2017, 2016, 2015, 2014, and 2013, respectively, are not included below.
2017 | 2016 | 2015 | 2014 | 2013 | ||||||||||||||||||||||||||||||
Amount | Percent | Amount | Percent | Amount | Percent | Amount | Percent | Amount | Percent | |||||||||||||||||||||||||
(Dollars in thousands) | ||||||||||||||||||||||||||||||||||
Real estate loans: | ||||||||||||||||||||||||||||||||||
1-4 family residential | $ | 922,627 | 41.87 | % | $ | 851,154 | 44.12 | % | $ | 599,938 | 38.98 | % | $ | 460,273 | 40.13 | % | $ | 364,942 | 47.26 | % | ||||||||||||||
Home equity | 80,662 | 3.66 | 78,719 | 4.08 | 77,399 | 5.03 | 61,750 | 5.38 | 25,535 | 3.31 | ||||||||||||||||||||||||
Commercial | 834,264 | 37.86 | 687,289 | 35.63 | 561,203 | 36.46 | 387,807 | 33.81 | 228,688 | 29.61 | ||||||||||||||||||||||||
Construction | 91,050 | 4.13 | 76,351 | 3.96 | 79,773 | 5.18 | 53,606 | 4.67 | 16,559 | 2.14 | ||||||||||||||||||||||||
Total real estate loans | 1,928,603 | 87.52 | 1,693,513 | 87.79 | 1,318,313 | 85.65 | 963,436 | 83.99 | 635,724 | 82.32 | ||||||||||||||||||||||||
Commercial business loans | 253,509 | 11.50 | 206,234 | 10.69 | 182,677 | 11.87 | 151,823 | 13.24 | 111,154 | 14.39 | ||||||||||||||||||||||||
Consumer loans | 21,698 | 0.98 | 29,281 | 1.52 | 38,186 | 2.48 | 31,778 | 2.77 | 25,372 | 3.29 | ||||||||||||||||||||||||
Total loans | 2,203,810 | 100.00 | % | 1,929,028 | 100.00 | % | 1,539,176 | 100.00 | % | 1,147,037 | 100.00 | % | 772,250 | 100.00 | % | |||||||||||||||||||
Other items: | ||||||||||||||||||||||||||||||||||
Allowance for loan losses | (20,877 | ) | (18,750 | ) | (17,102 | ) | (12,973 | ) | (9,671 | ) | ||||||||||||||||||||||||
Deferred loan costs (fees) and discounts | 3,214 | 2,593 | 1,201 | (1,150 | ) | 2,003 | ||||||||||||||||||||||||||||
Total loans, net | $ | 2,186,147 | $ | 1,912,871 | $ | 1,523,275 | $ | 1,132,914 | $ | 764,582 | ||||||||||||||||||||||||
6
Loan Portfolio Maturities and Yields. The following table summarizes the dollar amount of loans maturing in our portfolio based on their contractual terms to maturity at December 31, 2017, but does not include scheduled payments, potential payments, or the impact of interest rate swaps. Demand loans, having no stated repayment schedule or maturity, and overdraft loans are reported as being due in one year or less. Balances noted below do not reflect fair value adjustments, discounts or deferred costs and fees.
1-4 Family Residential Loans | Home Equity Loans and Lines of Credit | Commercial Real Estate Loans | Construction Loans | ||||||||||||||||||||||||
Amount | Yield | Amount | Yield | Amount | Yield | Amount | Yield | ||||||||||||||||||||
(Dollars in thousands) | |||||||||||||||||||||||||||
Due During the Years Ending December 31, | |||||||||||||||||||||||||||
2018 | $ | 188 | 5.15 | % | $ | 4 | 4.75 | % | $ | 62,985 | 4.16 | % | $ | 44,619 | 4.18 | % | |||||||||||
2019 | 195 | 4.73 | 10 | 5.46 | 63,207 | 3.73 | 19,780 | 4.29 | |||||||||||||||||||
2020 | 498 | 4.70 | 93 | 4.86 | 54,148 | 3.70 | — | — | |||||||||||||||||||
2021 to 2022 | 2,283 | 3.49 | 210 | 5.42 | 190,511 | 3.85 | 1,512 | 6.25 | |||||||||||||||||||
2023 to 2027 | 12,009 | 3.76 | 1,563 | 4.93 | 445,876 | 3.69 | 14,699 | 4.40 | |||||||||||||||||||
2028 to 2032 | 58,044 | 3.33 | 5,080 | 4.83 | 4,955 | 4.13 | 3,436 | 3.13 | |||||||||||||||||||
2033 and beyond | 849,410 | 3.70 | 73,702 | 4.07 | 12,582 | 3.90 | 7,004 | 3.86 | |||||||||||||||||||
Total | $ | 922,627 | 3.68 | % | $ | 80,662 | 4.14 | % | $ | 834,264 | 3.77 | % | $ | 91,050 | 4.21 | % | |||||||||||
Commercial Business Loans | Consumer Loans | Total Loans | ||||||||||||||||||
Amount | Yield | Amount | Yield | Amount | Yield | |||||||||||||||
(Dollars in thousands) | ||||||||||||||||||||
Due During the Years Ending December 31, | ||||||||||||||||||||
2018 | $ | 35,057 | 5.03 | % | $ | 244 | 11.71 | % | $ | 143,097 | 4.39 | % | ||||||||
2019 | 12,219 | 4.41 | 208 | 7.44 | 95,619 | 3.94 | ||||||||||||||
2020 | 32,581 | 4.52 | 557 | 6.95 | 87,877 | 4.03 | ||||||||||||||
2021 to 2022 | 105,377 | 4.54 | 4,175 | 3.68 | 304,068 | 4.10 | ||||||||||||||
2023 to 2027 | 40,242 | 4.76 | 16,490 | 4.54 | 530,879 | 3.83 | ||||||||||||||
2028 to 2032 | — | — | — | — | 71,515 | 3.48 | ||||||||||||||
2033 and beyond | 28,033 | 4.44 | 24 | 3.57 | 970,755 | 3.76 | ||||||||||||||
Total | $ | 253,509 | 4.62 | % | $ | 21,698 | 4.54 | % | $ | 2,203,810 | 3.87 | % | ||||||||
The following table sets forth the scheduled repayments of fixed- and adjustable-rate loans at December 31, 2017 that are contractually due after December 31, 2018.
Due After December 31, 2018 | |||||||||||
Fixed | Adjustable | Total | |||||||||
(In thousands) | |||||||||||
Real estate loans and lines: | |||||||||||
1-4 family residential | $ | 607,552 | $ | 314,887 | $ | 922,439 | |||||
Home equity | 3,238 | 77,420 | 80,658 | ||||||||
Commercial real estate | 41,718 | 729,561 | 771,279 | ||||||||
Construction | 6,440 | 39,991 | 46,431 | ||||||||
Total real estate loans and lines | 658,948 | 1,161,859 | 1,820,807 | ||||||||
Commercial business loans | 48,134 | 170,318 | 218,452 | ||||||||
Consumer loans | 21,454 | — | 21,454 | ||||||||
Total loans | $ | 728,536 | $ | 1,332,177 | $ | 2,060,713 | |||||
7
1-4 Family Residential Mortgage Loans. At December 31, 2017, $922.6 million, or 41.9%, of our loan portfolio, consisted of 1-4 family residential mortgage loans with $55.5 million comprised of non-owner occupied properties. We offer fixed-rate and adjustable-rate residential mortgage loans with maturities up to 30 years.
Some of the housing stock in our primary lending market area comprises two-, three- and four-unit properties, all of which are classified as 1-4 family residential mortgage loans.
Our 1-4 family residential mortgage loans that we originate are generally underwritten according to Fannie Mae and Freddie Mac guidelines, and we refer to loans that conform to such guidelines as “conforming loans”. We generally originate both fixed- and adjustable-rate mortgage loans in amounts up to the maximum conforming loan limits as established by the Federal Housing Finance Agency. We also originate loans above the conforming limits, referred to as “jumbo loans”, which are common in our market area. We generally underwrite jumbo loans in a manner similar to conforming loans. During the year ended December 31, 2017, we originated $488.9 million of 1-4 family residential loans. See “Lending Activities-Loan Originations, Sales, Participations and Servicing”.
We originate our adjustable-rate 1-4 family residential mortgage loans with initial interest rate adjustment periods of three, five, seven and ten years, based on changes in a designated market index. These loans are limited to a 500 basis point initial increase in their interest rate, a 200 basis point increase in their interest rate annually after the initial adjustment, and a maximum upward adjustment of 500 to 600 basis points over the life of the loan. We determine whether a borrower qualifies for an adjustable-rate mortgage loan in conformance with the underwriting guidelines set forth by Fannie Mae and Freddie Mac in the secondary mortgage market. In particular, we determine whether a borrower qualifies for an adjustable-rate mortgage loan with an initial fixed-rate period of five years or less based on the ability to repay both principal and interest using the higher of an interest rate which is 2.0% above the initial interest rate, or the fully indexed rate, including a reasonable estimate of real estate taxes and insurance, and taking into account the maximum debt-to-income ratio stipulated in the underwriting guidelines in the secondary mortgage market. The qualification for an adjustable-rate mortgage loan with an initial fixed-rate period exceeding five years is based on the borrower’s ability to repay at the higher of the initial fixed interest rate or the fully indexed rate.
We originate 1-4 family residential mortgage loans with loan-to-value ratios up to 80% without private mortgage insurance or a state guarantee program. We originate loans with loan-to-value ratios of up to 97% with private mortgage insurance and where the borrower’s debt does not exceed 43% of the borrower’s monthly cash flow. To encourage lending to low- and moderate-income home buyers, we participate in several publicly-sponsored loan programs, including: the Massachusetts Housing Finance Agency program, which provides competitive terms for loans with higher loan-to-value ratios than are available with conventional financing; the Federal Home Loan Banks Equity Builder Program, which provides closing cost and down payment assistance to income-eligible home buyers; and the Mass Housing Partnership’s One program that contains a number of attractive features for low- and moderate-income home buyers. Also, in 2016, we began participation in the governmentally sponsored Federal Housing Administration (FHA) program, which allows first-time home buyers to obtain competitive mortgage rates with low closing costs and minimal down payments.
The vast majority of the conforming fixed-rate 1-4 family residential mortgage loans we originate are sold into the secondary market to mortgage investors with servicing released and to the Federal Home Loan Bank of Boston with servicing retained. For the year ended December 31, 2017, we received servicing fees, including credit enhancement fees, of $506,000 on mortgage loans that we serviced for third parties. At December 31, 2017, the unpaid principal balance of loans serviced for others totaled $245.1 million.
We do not offer loans that provide for negative amortization of principal, such as “Option ARM” loans, where the borrower can pay less than the interest owed on the loan, resulting in an increased principal balance during the life of the loan. Additionally, we generally do not offer “subprime loans” (loans that are made with low down-payments to borrowers with weakened credit histories typically characterized by payment delinquencies, previous charge-offs, judgments, bankruptcies, or borrowers with questionable repayment capacity as evidenced by low credit scores or high debt-burden ratios) or Alt-A loans (defined as loans having less than full documentation).
Home Equity Loans and Lines of Credit. In addition to traditional 1-4 family residential mortgage loans, we offer home equity lines of credit and, to a lesser extent, home equity loans, that are secured by the borrower’s primary residence or secondary residence. Home equity loans and lines of credit are generally underwritten with the same criteria that we use to underwrite 1-4 family residential mortgage loans. We offer these products online and through our branch office network.
8
At December 31, 2017, we had $80.7 million in home equity lines and loans outstanding, of which 98.3% were performing in accordance with original terms. The home equity lines of credit that we originate are revolving lines of credit, which generally have a term of 25 years, with draws available for the first ten years. Our 25-year lines of credit are interest only during the first ten years, and amortize on a fifteen-year basis thereafter. We generally originate home equity lines of credit with loan-to-value ratios of up to 80% when combined with the principal balance of the existing first mortgage loan, although loan-to-value ratios may occasionally exceed 80% on a case-by-case basis. Maximum loan-to-value ratios are determined based on an applicant’s credit score, property value, loan amount and debt-to-income ratio. Lines of credit above $250,000 require a full appraisal. Rates are adjusted monthly based on changes in a designated market index. We also originate fixed-rate home equity loans with terms up to 15 years, although, in the current interest rate environment, fixed-rate loans with terms greater than five years are not a priority. While all home equity lines and loans outstanding at December 31, 2017 were originated by the Company, during the third quarter of 2017 we recorded a loss of $118,000 from the sale of the remaining $12.0 million of a home equity loan portfolio that had been purchased in 2012.
Commercial Real Estate. At December 31, 2017, $834.3 million, or 37.9%, of our loan portfolio consisted of commercial real estate loans. At December 31, 2017, the majority of our commercial real estate loans were secured by properties located in eastern Massachusetts. In addition, the vast majority of the commercial real estate loans in our portfolio were originated by us as lead lender, rather than loans that we have obtained through participations.
Our commercial real estate mortgage loans are primarily secured by office buildings, multi-family apartment buildings, owner-occupied businesses and industrial buildings. As of December 31, 2017, our two largest commercial real estate loans totaled $27.0 million and $26.4 million, which financed an office and retail property and an office and flex research and development property, respectively. These loans were performing in accordance with their terms at December 31, 2017. At that date, we had 22 other commercial real estate loans with outstanding principal balances exceeding $10.0 million.
Our commercial real estate loans generally have terms of three to ten years with adjustable, LIBOR-based, Federal Home Loan Bank Classic Advance or Wall Street Journal Prime rates of interest. These loans generally amortize on a 25 to 30-year basis, with a balloon payment due at maturity.
To facilitate qualified commercial customers’ access to fixed-rate financing, we enter into loan-level interest rate swaps through a third party advisor. These swap agreements enable the Bank to write LIBOR-based, adjustable-rate loans, whereas customers ultimately pay a fixed interest rate. Interest rate risk associated with these transactions is controlled by entering into offsetting positions with third parties. Credit risk is minimized by limiting transactions to highly-rated counterparties and through collateral agreements. Collateral is required to be exchanged when the valuation reaches agreed upon thresholds, for certain counterparties. We generally receive fees in offering these interest rate swap agreements. As of December 31, 2017, the notional value of interest rate swaps on loans with commercial real estate loan customers amounted to $582.4 million, and we earned net fee income of $2.8 million from customer swaps in 2017.
In underwriting commercial real estate loans we consider a number of factors, which include the projected net cash flow to the loan’s debt service requirement (generally requiring a minimum of 125%), tenant rollover risk, vacancy, the age and condition of the collateral, a market analysis of particular assets by geographic location, the financial resources and income level of the sponsor and the sponsor’s experience in owning or managing similar properties. Commercial real estate and multi-family real estate loans are generally originated in amounts up to 75% of the appraised value or the purchase price of the property securing the loan, whichever is lower. When circumstances warrant, guarantees are obtained from commercial real estate and multi-family real estate sponsors. In addition, the sponsor’s and guarantor’s financial information on such loans is monitored on an ongoing basis by requiring periodic financial statement updates.
Commercial real estate loans generally entail greater credit risks compared to the 1-4 family residential mortgage loans we originate, as they typically involve larger loan balances concentrated with single borrowers or groups of related borrowers. In addition, the payment of loans secured by income-producing properties typically depends on the successful operation of the property, as repayment of the loan generally is dependent, in large part, on sufficient income from the property to cover operating expenses and debt service. Changes in economic conditions that are not in the control of the borrower or lender could affect the value of the collateral for the loan or the future cash flow of the property. Commercial real estate loans are closely underwritten and managed within approved guidelines. In addition, our Risk Management group provides regular follow up via portfolio and loan reviews.
9
Construction Loans. We originate or participate in loans originated by others to established local developers to finance the construction of commercial and multi-family properties. To a lesser extent, we originate loans to local builders and individuals to finance the construction of 1-4 family residential properties. At December 31, 2017, $91.1 million, or 4.1% of our loan portfolio consisted of construction loans. Commercial construction loans totaled $81.6 million. The two largest loans outstanding amounted to $18.4 million and $14.6 million, respectively, which are both secured by multi-family residential properties. As of December 31, 2017, our commitments to fund these two commercial construction projects totaled $37.0 million including the amount outstanding. These loans were performing in accordance with their terms at December 31, 2017.
Our commercial construction loans generally call for the payment of interest only with interest rates that are tied to LIBOR. Construction loans for commercial real estate are originated with principal balances of up to $20.0 million with a loan-to-completed value ratio of 65% to 80%, depending on the type of property. Advances on construction loans are made in accordance with a schedule reflecting the cost of construction. Repayment of construction loans for income-producing properties usually is expected from permanent financing upon completion of construction. In the case of construction loans for 1-4 family residential properties, repayment normally is expected from the sale of units to individual purchasers, or in the case of individuals building their own homes, from a permanent mortgage.
Construction loans are closely underwritten within approved guidelines. Before making a commitment to fund a construction loan, we require an appraisal of the property by a licensed appraiser. The amount of funds disbursed per construction requisitions during the term of the construction loan is generally justified by a Bank-appointed construction engineer.
Construction financing generally involves greater credit risk than long-term financing on improved, tenanted investment real estate. Risk of loss on a construction loan depends largely upon the accuracy of the initial estimate of the value of the property at completion of construction compared to the estimated cost (including interest) of construction and other assumptions. The Bank utilizes third party firms to monitor construction completion schedules and draw schedules. If the estimate of construction cost is inaccurate, we may be required to advance additional funds beyond the amount originally committed in order to protect the value of the property. Moreover, if the estimated value of the completed project is inaccurate, the borrower may hold a property with a value that is insufficient to assure full repayment of the construction loan upon the sale of the property. Construction loans also expose us to the risk that improvements will not be completed on time in accordance with specifications and projected costs. In addition, the ultimate sale or rental of the property may not occur as anticipated.
Commercial Business Loans. We originate commercial term loans and variable rate lines of credit to businesses in our primary market area. Our commercial loans are generally used for working capital purposes, funding business acquisitions, or for acquiring machinery and equipment. These loans are generally secured by all business assets including business equipment, inventory, accounts receivable, trademarks, and real estate, and are generally originated with maximum loan-to-value ratios of up to 80%. The commercial business loans that we offer are generally adjustable-rate loans with terms ranging from three to five years. At December 31, 2017, we had $253.5 million of commercial business loans, representing 11.5% of our total loan portfolio outstanding.
We also participate in large loans originated by other banks with customers operating in sectors where our commercial lenders have substantial experience. As of December 31, 2017, our two largest commercial business loan relationships outstanding amounted to $13.8 million and $13.3 million, to a wholesale supplier of energy products and a technology consulting and staffing company, respectively. In each case, these were participation loans syndicated by other banks and our total commitments on these loans were $30.0 million and $15.0 million, respectively, including the amounts outstanding. These loans were performing in accordance with their terms at December 31, 2017. In addition to the total commitment of $30.0 million, noted above, at December 31, 2017, our second largest customer commitment was $27.0 million, to a steel and mining company, with no outstanding balance at December, 31, 2017. In each case, these were participation arrangements syndicated by other banks. These loans were performing in accordance with their terms at December 31, 2017.
When making commercial business loans, we consider the debt service capabilities of the borrower, the projected cash flows of the business and the value of the collateral. Many of our loans are guaranteed by the principals of the borrower.
10
Commercial business loans generally have a greater credit risk than residential mortgage loans. Unlike residential mortgage loans, which generally are made on the basis of the borrower’s ability to make repayment from his or her employment and other income, and which are secured by real property whose value tends to be more easily ascertainable, commercial business loans are of higher risk and typically are made on the basis of the borrower’s ability to make repayment from the cash flow of the borrower’s business. As a result, the availability of funds for the repayment of commercial business loans may be substantially dependent on the success of the business itself. Further, the collateral securing the loans may depreciate over time, may be difficult to appraise and may fluctuate in value based on the success of the business. In addition, at December 31, 2017, we had $10.0 million of unsecured, subordinated loans to financial institutions operating in New England, for which repayment is dependent on the ability of the financial institutions to generate income. We seek to minimize these risks through our underwriting standards and the experience of our lenders and credit department. The commercial lending and risk management units are responsible for the underwriting and documentation of new commercial loans, as well as the quarterly review of credit ratings of existing loans.
Consumer Loans. We offer consumer loans on a limited and selective basis. At December 31, 2017, $21.7 million, or 1.0%, of our loan portfolio, consisted of consumer loans, of which $15.6 million related to classic and collector automobile loans, and only $6.1 million related to other consumer loans.
Our portfolio of classic and collector automobile loans is the result of a 2011 initiative to increase our exposure to higher-yielding loan assets and diversify our credit portfolio, resulting in an agreement to purchase loans from a third-party originator. Pursuant to the terms of this agreement, we elected to purchase loans secured by classic and collector automobiles according to a defined price schedule, which varied according to the terms of the loans and the credit quality of the borrower. Our primary considerations, when we originated these loans, were the borrower’s ability to repay the loan and the value of the underlying collateral. The average FICO score of borrowers for these loans was 746 at origination. We financed up to the full sales price of the vehicle. In order to mitigate our risk of loss, we have a 50% loss sharing arrangement with the third-party originator of these loans. Since the commencement of the program, we have purchased approximately $67.6 million in classic and collector automobile loans and recorded $124,000 of losses. We did not purchase any loans for this portfolio in 2016 or 2017, and do not anticipate any future purchases.
Loan Originations, Sales, Participations and Servicing. Loans that we originate are generally underwritten pursuant to our policies and procedures, which incorporate standard underwriting guidelines, including those of Freddie Mac and Fannie Mae in the case of residential mortgages, to the extent applicable. We originate both adjustable-rate and fixed-rate loans. Our loan origination and sales activity may be adversely affected by a rising interest rate environment that typically results in decreased loan demand and lower pricing in secondary markets.
In 2017, 98.8%, or $488.9 million, of our 1-4 family residential mortgage loan originations were generated by our loan officers or referred by branch managers and employees located in our banking offices. In addition to our in-house originations, we also source 1-4 family residential mortgages from a federally insured correspondent that adheres to the Bank’s underwriting practices and is in compliance with federal, state and local laws and regulations governing fair lending practices and mortgage origination.
In 2017, in an effort to manage interest rate risk in and generate non-interest income, we sold the majority of fixed-rate 1-4 family residential mortgage loans that we originated. In 2017, we sold $322.9 million of conforming and non-conforming residential mortgage loans to other investors. Included in the $322.9 million of residential mortgage loans sold in 2017, were $51.6 million of non-conforming portfolio loans. We intend to continue to explore the practice of selling some of our non-conforming residential mortgage loans in the future, subject to our interest rate risk appetite, mortgage loan pricing in the secondary market and the pricing of servicing rights.
We have sold mortgage loans to the Federal Home Loan Bank of Boston through the Mortgage Partnership Finance (“MPF”) program, which generally has required us to retain approximately 5% of credit risk, for which we were paid a credit enhancement fee. We have also sold loans to the Federal Home Loan Bank of Boston through a different program without retaining any credit risk. To date, we have sold $230.8 million of loans to the Federal Home Loan Bank of Boston through the MPF program with credit risk retention. At December 31, 2017, the credit risk retained by us on loans sold through the MPF program amounted to $7.6 million, or 3.3% of the volume of loans sold through the MPF program. Neither mortgage loans serviced for others nor the contingent liability associated with sold loans is recorded on the consolidated balance sheets. There have been no contingency losses recognized on these loans to date.
11
We have retained the servicing on all loans sold to the Federal Home Loan Bank of Boston, and we have released the servicing on loans sold to other mortgage investors and banks seeking exposure to non-conforming loans. Loan servicing includes collecting and remitting loan payments, accounting for principal and interest, contacting delinquent borrowers, supervising foreclosures and property dispositions in the event of unremedied defaults, and making certain insurance and tax payments on behalf of the borrowers and generally administering the loans. We retain a portion of the interest paid by the borrower on the loans we service as consideration for our servicing activities.
In 2017, we had $242.8 million in commercial business and commercial real estate originations. In order to have access to larger customers and diversify risk, from time to time we will participate in portions of commercial business and commercial real estate loans with other banks. Pursuant to these loan participations, the Bank and participating lenders share ratably in cash flows and any gains or losses that may result from a borrower’s lack of compliance with contractual terms of the loan. When we are not lead lender, we always follow our customary loan underwriting and approval policies. In cases where the Bank has transferred a portion of its originated commercial loan to participating lenders, the Bank continues to service the loan as agent of the participating lenders and, as such, collects cash payments from the borrowers, remits payments (net of servicing fees, if applicable) to participating lenders and disburses required escrow funds to relevant parties. At December 31, 2017, we held $217.9 million of commercial business, commercial real estate and construction loans in our portfolio that were participation loans obtained from other lenders, and we serviced $88.8 million in loans for other lenders participating in loans originated by us.
12
The following table shows the loan origination, acquisition, participation, sale and repayment activities for loans and loans held for sale, for the periods indicated.
For the Years Ended December 31, | |||||||||||||||||||
2017 | 2016 | 2015 (4) | 2014 | 2013 | |||||||||||||||
(In thousands) | |||||||||||||||||||
Originations by type: | |||||||||||||||||||
Real estate loans: | |||||||||||||||||||
1-4 family residential | $ | 488,861 | $ | 508,447 | $ | 224,316 | $ | 154,188 | $ | 70,107 | |||||||||
Commercial real estate | 202,895 | 170,210 | 217,433 | 125,370 | 142,768 | ||||||||||||||
Construction | 37,749 | 65,087 | 45,102 | 35,991 | 1,327 | ||||||||||||||
Home equity | 21,324 | 15,769 | 24,721 | 7,988 | 3,235 | ||||||||||||||
Total real estate loans | 750,829 | 759,513 | 511,572 | 323,537 | 217,437 | ||||||||||||||
Commercial business loans | 39,882 | 55,297 | 56,066 | 31,627 | 50,177 | ||||||||||||||
Consumer loans | 2,062 | 2,850 | 3,049 | 1,204 | 132 | ||||||||||||||
Total loans originated | 792,773 | 817,660 | 570,687 | 356,368 | 267,746 | ||||||||||||||
Acquired: (1) | |||||||||||||||||||
Real estate loans: | |||||||||||||||||||
Commercial real estate | — | — | — | 57,967 | — | ||||||||||||||
Home equity | — | — | — | 39,996 | — | ||||||||||||||
Total real estate loans | — | — | — | 97,963 | — | ||||||||||||||
Commercial business loans | — | — | — | 3,862 | — | ||||||||||||||
Consumer loans | — | — | — | 444 | — | ||||||||||||||
Total loans acquired | — | — | — | 102,269 | — | ||||||||||||||
Participations (2): | |||||||||||||||||||
Real estate loans: | |||||||||||||||||||
1-4 family | 5,745 | 12,955 | 35,917 | 65,091 | 104,556 | ||||||||||||||
Commercial real estate | 23,786 | 2,168 | — | — | 13,168 | ||||||||||||||
Construction | 30,932 | 19,203 | 26,163 | 22,262 | 18,534 | ||||||||||||||
Total real estate loans | 60,463 | 34,326 | 62,080 | 87,353 | 136,258 | ||||||||||||||
Commercial business loans | 77,024 | 63,949 | 73,362 | 87,502 | 88,846 | ||||||||||||||
Consumer loans | — | — | 14,803 | 15,654 | 17,367 | ||||||||||||||
Total loan participations | 137,487 | 98,275 | 150,245 | 190,509 | 242,471 | ||||||||||||||
Sales (3): | |||||||||||||||||||
Real estate loans: | |||||||||||||||||||
1-4 family | (322,911 | ) | (128,945 | ) | (39,080 | ) | (41,417 | ) | (51,022 | ) | |||||||||
Commercial real estate | (22,400 | ) | (13,807 | ) | — | — | (3,600 | ) | |||||||||||
Construction | — | (15,830 | ) | (7,517 | ) | (95 | ) | — | |||||||||||
Home equity | (12,218 | ) | — | — | — | — | |||||||||||||
Total real estate loans | (357,529 | ) | (158,582 | ) | (46,597 | ) | (41,512 | ) | (54,622 | ) | |||||||||
Commercial business loans | (661 | ) | (20,902 | ) | (796 | ) | (208 | ) | (11,868 | ) | |||||||||
Total loans sold | (358,190 | ) | (179,484 | ) | (47,393 | ) | (41,720 | ) | (66,490 | ) | |||||||||
Principal repayments: | |||||||||||||||||||
Total principal repayments | (291,122 | ) | (356,715 | ) | (283,114 | ) | (218,798 | ) | (163,394 | ) | |||||||||
Net increase | $ | 280,948 | $ | 379,736 | $ | 390,425 | $ | 388,628 | $ | 280,333 | |||||||||
_______________________
(1) | Includes loans acquired in the Nantucket Bank Acquisition. |
(2) | Includes loan purchases and participations by the Bank in loans originated or syndicated by other financial institutions. |
(3) | Includes loan sales and participations by other financial institutions in loans originated or syndicated by the Bank. |
(4) | Certain amounts in the 2015 presentation have been reclassified to conform to the current presentation. |
13
Loan Approval Procedures and Authority. Our lending activities follow written policies approved by our Board of Directors. The loan approval process is intended to assess the borrower’s ability to repay the loan and the value of the collateral, if any, that will secure the loan. To assess the borrower’s ability to repay, we review the borrower’s employment, where applicable, credit history, information on the historical and projected income and expenses, where applicable, balance sheet, profit and loss, and cash flow of the borrower. We require “full documentation” on all of our loan applications. We do not discriminate in our lending decisions based on a borrower’s race, religion, national origin, gender, marital status or age.
Our policies and loan approval limits are approved by our Board of Directors. Aggregate lending relationships in amounts up to $5.0 million can be approved by designated individual officers or officers acting together with specific lending approval authority. Relationships which meet or exceed underwriting standards (Risk Ratings 1-5) between $5.0 million and $30.0 million require the approval of the Management Credit Committee, and those greater than $30.0 million require the approval of the Board of Directors. Relationships above $20.0 million deemed “bankable with care” (Risk Rating 6) require the approval of the Board of Directors. Our Chief Risk Officer generally must approve loans in excess of $3.0 million.
Our Senior Credit Officer is responsible for the underwriting and documentation of new commercial loans to small business customers. Our Chief Risk Officer reviews the servicing and risk rating of all criticized loans and loans rated “bankable with care” on the watch list no less frequently than monthly. Our Senior Credit Officer reviews all construction loans and higher risk commercial business loans quarterly. We consider our Chief Risk Officer and Senior Credit Officer to be objective because they have no loan production goals and have annual performance objectives based on credit quality and credit risk management.
We require appraisals by a third party appraiser based on a comparison with current market sales for all real property securing 1-4 family residential mortgage loans, multi-family loans and commercial real estate loans, although home equity loans and lines of credit may be approved based on an Automated Valuation Model (AVM). All appraisers are independent, state-licensed or state-certified appraisers and are approved by the Board of Directors annually.
Non-Performing and Problem Assets. When a residential mortgage loan or home equity line of credit is 15 days past due, a late payment fee is generally assessed and a notice mailed to the borrower. We will attempt direct contact with the borrower to determine when payment will be made. We will send a letter when a loan is 30 days or more past due and will attempt to contact the borrowers by telephone. By the 36th day of delinquency, we will attempt to contact the borrowers and inform them of loss mitigation options that may be available, providing the borrowers with written notice containing information about those loss mitigation options by the 45th day of delinquency. By the 150th day of delinquency (regardless of accrual status), unless the borrower has made arrangements to bring the loan current on its payments, we will refer the loan to legal counsel to commence foreclosure proceedings. In addition, a property appraisal is made to determine the condition and market value. The account will be monitored on a regular basis thereafter. In attempting to resolve a default on a residential mortgage loan, Blue Hills Bank complies with all applicable Massachusetts laws regarding a borrower’s right to cure.
When automobile finance loans become 10 to 15 days past due, a late fee is charged according to applicable guidelines. When the loan is 11 days past due, the customer will receive a phone call from our servicer requesting a payment. Letters are generated at 15, 25 and 34 days past due. A letter stating our intent to repossess the automobile goes to the customer 21 days prior to repossession, which is triggered at 45 days past due. Vehicles are assigned for repossession at 65 to 70 days past due; the customer has 21 days for right of redemption until the vehicle is sold. Automobile loans are placed on non-accrual status at 90 days past due and charged off at 120 days past due.
Because of the nature of the collateral securing consumer loans, we may commence collection procedures sooner for consumer loans than for residential mortgage loans or home equity lines of credit.
Small business loans that are past due five days are referred to the responsible loan officer, who will after 10 days direct efforts to bring the loan current. After 30 days past due, the loan is reviewed for placement on the Watch List, and if the loan has been downgraded to Special Mention, the Chief Risk Officer will determine whether the Senior Credit Officer will assume day-to-day management of the credit or act in an advisory role with the goal of either bringing the loan current or maximizing recovery of principal and interest. All small business loans that are 30 days or more past due are regularly monitored by the lending unit and the Senior Credit Officer and reviewed monthly or more frequently as necessary by the Chief Risk Officer.
14
Commercial business loans that are past due are immediately referred to the EVP of Commercial Lending, who will direct efforts to bring the loan current. After 30 days past due the loan is placed on the Watch List, and, if the loan has been downgraded to Special Mention, the Chief Risk Officer determines whether the Senior Credit Officer will assume day-to-day management, with the oversight of the Chief Risk Officer, or act in an advisory role with the goal of either bringing the loan current or maximizing our recovery of principal and interest. All commercial loans that are 30 days or more past due, regardless of risk rating, are regularly monitored by the lending unit and the Senior Credit Officer and reviewed monthly or more frequently as necessary by the Chief Risk Officer.
It is the policy of the Company to discontinue the accrual of interest on loans past due in excess of 90 days, unless the loan is well-secured and in the process of collection, or when in the judgment of management, the ultimate collectability of the principal or interest becomes doubtful and to reverse all interest income previously accrued. Past due status is based on contractual terms of the loan. The interest on non-accrual loans is accounted for on the cash-basis until qualifying for return to accrual. Loans are returned to accrual status when all the principal and interest amounts contractually due have been current for six consecutive months and future payments are reasonably assured.
Non-Performing Assets. The table below sets forth the amounts and categories of our non-performing assets at the dates indicated.
At December 31, | |||||||||||||||||||
2017 | 2016 | 2015 | 2014 | 2013 | |||||||||||||||
(Dollars in thousands) | |||||||||||||||||||
Non-accrual loans: | |||||||||||||||||||
1-4 family residential | $ | 5,190 | $ | 6,478 | $ | 5,688 | $ | 3,876 | $ | 1,706 | |||||||||
Home equity loans and lines | 1,387 | 1,153 | 270 | 578 | 36 | ||||||||||||||
Commercial real estate | 4,744 | 941 | 4,631 | — | — | ||||||||||||||
Commercial business | — | 241 | 10 | — | — | ||||||||||||||
Consumer | 202 | 170 | 145 | 27 | — | ||||||||||||||
Total non-accrual loans | 11,523 | 8,983 | 10,744 | 4,481 | 1,742 | ||||||||||||||
Loans delinquent 90 days or greater and still accruing | — | — | — | — | — | ||||||||||||||
Other real estate owned | — | — | — | — | — | ||||||||||||||
Total non-performing assets | $ | 11,523 | $ | 8,983 | $ | 10,744 | $ | 4,481 | $ | 1,742 | |||||||||
Ratios: | |||||||||||||||||||
Non-performing loans to total loans | 0.52 | % | 0.47 | % | 0.70 | % | 0.39 | % | 0.23 | % | |||||||||
Non-performing assets to total assets | 0.43 | % | 0.36 | % | 0.51 | % | 0.26 | % | 0.13 | % | |||||||||
For the year ended December 31, 2017, gross interest income that would have been recorded had our non-accruing loans been current in accordance with their original terms was $605,000, of which $557,000 of interest income was recognized on such loans for the year ended December 31, 2017.
15
Troubled Debt Restructurings. We periodically modify loans to extend the term or make other concessions to help a borrower stay current on their loan and to avoid foreclosure. We generally do not forgive principal or interest on loans or modify the interest rates on loans to rates that are below market rates. The table below sets forth the amounts for our residential troubled debt restructurings at the dates indicated.
At December 31, | |||||||||||||||||||
2017 | 2016 | 2015 | 2014 | 2013 | |||||||||||||||
(Dollars in thousands) | |||||||||||||||||||
Performing troubled debt restructurings | $ | 653 | $ | 138 | $ | 148 | $ | 255 | $ | 279 | |||||||||
Non-accrual troubled debt restructurings | 1,533 | 1,274 | 1,183 | 467 | 260 | ||||||||||||||
Total | $ | 2,186 | $ | 1,412 | $ | 1,331 | $ | 722 | $ | 539 | |||||||||
Performing troubled debt restructurings as a % of total loans | 0.03 | % | 0.01 | % | 0.01 | % | 0.02 | % | 0.04 | % | |||||||||
Non-accrual troubled debt restructurings as a % of total loans | 0.07 | % | 0.07 | % | 0.08 | % | 0.04 | % | 0.03 | % | |||||||||
Total troubled debt restructurings as a % of total loans | 0.10 | % | 0.08 | % | 0.09 | % | 0.06 | % | 0.07 | % | |||||||||
At December 31, 2017, we had $2.2 million of troubled debt restructurings, all of which related to residential mortgage loans, of which $653,000 were performing in accordance with their restructured terms. For the year ended December 31, 2017, gross interest income that would have been recorded had our troubled debt restructurings been performing in accordance with their original terms was $138,000. Interest income recognized on such modified loans for the year ended December 31, 2017 was $120,000.
16
The following table sets forth certain information with respect to our loan portfolio delinquencies at the dates indicated.
Loans Delinquent For | Total | |||||||||||||||||||
60-89 Days | 90 Days and Over | |||||||||||||||||||
Number | Amount | Number | Amount | Number | Amount | |||||||||||||||
(Dollars in thousands) | ||||||||||||||||||||
At December 31, 2017 | ||||||||||||||||||||
Real estate: | ||||||||||||||||||||
1-4 family residential | 2 | $ | 348 | 7 | $ | 2,184 | 9 | $ | 2,532 | |||||||||||
Home equity | 1 | 13 | 5 | 656 | 6 | 669 | ||||||||||||||
Commercial real estate | — | — | 2 | 3,893 | 2 | 3,893 | ||||||||||||||
Consumer loans | 1 | 7 | 1 | 92 | 2 | 99 | ||||||||||||||
Total loans | 4 | $ | 368 | 15 | $ | 6,825 | 19 | $ | 7,193 | |||||||||||
At December 31, 2016 | ||||||||||||||||||||
Real estate: | ||||||||||||||||||||
1-4 family residential | 2 | $ | 373 | 14 | $ | 2,322 | 16 | $ | 2,695 | |||||||||||
Home equity | 4 | 496 | 6 | 775 | 10 | 1,271 | ||||||||||||||
Commercial business | 1 | 13 | — | — | 1 | 13 | ||||||||||||||
Consumer loans | 2 | 5 | 1 | 7 | 3 | 12 | ||||||||||||||
Total loans | 9 | $ | 887 | 21 | $ | 3,104 | 30 | $ | 3,991 | |||||||||||
At December 31, 2015 | ||||||||||||||||||||
Real estate: | ||||||||||||||||||||
1-4 family residential | — | $ | — | 5 | $ | 990 | 5 | $ | 990 | |||||||||||
Home equity | 1 | 19 | 2 | 176 | 3 | 195 | ||||||||||||||
Commercial real estate (1) | 1 | 1,249 | — | — | 1 | 1,249 | ||||||||||||||
Consumer loans | 1 | 80 | 2 | 120 | 3 | 200 | ||||||||||||||
Total loans | 3 | $ | 1,348 | 9 | $ | 1,286 | 12 | $ | 2,634 | |||||||||||
At December 31, 2014 | ||||||||||||||||||||
Real estate: | ||||||||||||||||||||
1-4 family residential | 3 | $ | 522 | 8 | $ | 1,370 | 11 | $ | 1,892 | |||||||||||
Home equity | — | — | 1 | 475 | 1 | 475 | ||||||||||||||
Consumer loans | — | — | 1 | 5 | 1 | 5 | ||||||||||||||
Total loans | 3 | $ | 522 | 10 | $ | 1,850 | 13 | $ | 2,372 | |||||||||||
At December 31, 2013 | ||||||||||||||||||||
Real estate: | ||||||||||||||||||||
1-4 family residential | 2 | $ | 196 | 6 | $ | 828 | 8 | $ | 1,024 | |||||||||||
Home equity | — | — | 1 | 36 | 1 | 36 | ||||||||||||||
Total loans | 2 | $ | 196 | 7 | $ | 864 | 9 | $ | 1,060 | |||||||||||
(1) The commercial real estate loan included in the 60-89 days delinquent buckets above is also included in the non-accrual total.
Other Real Estate Owned. Real estate acquired by us as a result of foreclosure or by deed in lieu of foreclosure is classified as other real estate owned. When property is acquired it is recorded at estimated fair market value at the date of foreclosure less the cost to sell, establishing a new cost basis. Estimated fair value generally represents the sales price a buyer would be willing to pay on the basis of current market conditions, including normal terms from other financial institutions. Holding costs and declines in estimated fair market value result in charges to expense after acquisition. At December 31, 2017, we had no other real estate owned.
17
Classification of Assets. Our policies, consistent with regulatory guidelines, provide for the classification of loans and other assets that are considered to be of lesser quality as substandard, doubtful, or loss assets. An asset is considered substandard if it is inadequately protected by the current net worth and paying capacity of the obligor or of the collateral pledged, if any. Substandard assets include those assets characterized by the distinct possibility that we will sustain some loss if the deficiencies are not corrected. Assets classified as doubtful have all of the weaknesses inherent in those classified substandard with the added characteristic that the weaknesses present make collection or liquidation in full, on the basis of currently existing facts, conditions and values, highly questionable and improbable. Assets (or portions of assets) classified as loss are those considered uncollectible and of such little value that their continuance as assets is not warranted. Assets that do not expose us to risk sufficient to warrant classification in one of the aforementioned categories, but which possess potential weaknesses that deserve our close attention, are required to be designated as special mention.
We maintain an allowance for loan losses at an amount estimated to equal all credit losses incurred in our loan portfolio that are both probable and reasonable to estimate at a balance sheet date. Our determination as to the classification of our assets and the amount of our loss allowances is subject to review by regulatory agencies, which may require that we establish additional loss allowances. We regularly review our asset portfolio to determine whether any assets require classification in accordance with applicable regulations.
The following table sets forth our amounts of classified loans, loans designated as special mention and criticized loans (classified loans and loans designated as special mention) as of the dates indicated.
At December 31, | |||||||||||
2017 | 2016 | 2015 | |||||||||
(In thousands) | |||||||||||
Classified loans: | |||||||||||
Substandard | $ | 10,355 | $ | 8,452 | $ | 6,963 | |||||
Doubtful | 250 | 645 | 712 | ||||||||
Loss | — | — | — | ||||||||
Total classified loans | 10,605 | 9,097 | 7,675 | ||||||||
Special mention | 9,896 | 31,857 | 13,421 | ||||||||
Total criticized loans | $ | 20,501 | $ | 40,954 | $ | 21,096 | |||||
At December 31, 2017, we had $10.4 million of substandard loans, of which $2.6 million were 1-4 family residential mortgage loans, and $7.8 million were commercial real estate loans. At December 31, 2017, special mention loans amounted to $9.9 million, of which $2.8 million were 1-4 family residential mortgage loans, $1.5 million were home equity, $4.7 million were commercial real estate loans, $744,000 were commercial business loans and $121,000 were consumer loans. Special mention loans decreased from December 31, 2016 due to upgrades and payoffs. Loans classified as doubtful at December 31, 2017, 2016, and 2015 consist primarily of 1-4 family residential mortgages.
Potential problem loans are loans that are currently performing and are not included in classified loans above, but may be delinquent. These loans require an increased level of management attention, because we have serious doubts as to the ability of the borrower to comply with the present loan repayment terms and as a result such loans may be included at a later date in non-accrual loans. At December 31, 2017, we had no potential problem loans that are not discussed above under “Classification of Assets.”
18
Allowance for Loan Losses. We provide for loan losses based upon the consistent application of our documented allowance for loan loss methodology. All loan losses are charged against the allowance when management believes the uncollectability of a loan balance is confirmed. Subsequent recoveries, if any, are credited to the allowance. Additions to the allowance for loan losses are provided by charges to income based on various factors which, in our judgment, deserve current recognition in estimating probable losses. We regularly review the loan portfolio, including a review of our classified assets, and make provisions for loan losses in order to maintain the allowance for loan losses in accordance with U.S. GAAP.
The allowance for loan losses is based on the size and composition of the loan portfolio, delinquency levels, loss experience, economic conditions and other factors related to the collectability of the loan portfolio. Prior to the second quarter of 2016, for portfolios for which the Company had insufficient loss experience, losses from a national peer group of depository institutions with assets between one and five billion dollars for relevant portfolios dating back to 2009 were used. Commencing in the second quarter of 2016, the Company began to phase in its own loss history by loan type based upon the age and loss experience of the loan portfolio.
The allowance for loan losses is evaluated regularly by management and reflects consideration of all significant factors that affect the collectability of the loan portfolio. Management's evaluation is submitted on a quarterly basis to the Board for approval of the methodology and any changes in qualitative factors described below. The evaluation is inherently subjective as it requires estimates that are susceptible to significant revision as more information becomes available. It is the intention of management to maintain an allowance that is prudently commensurate with the growth in the loan portfolio.
The allowance consists of general, allocated and unallocated components, as further described below.
General component. The general component of the allowance for loan losses is based on a combination of our own loss history and an extrapolated historical loss experience based on FDIC data for depository institutions with assets of one billion to five billion dollars for periods ranging from 2009-2017, adjusted for qualitative and environmental factors including changes to lending policies and procedures, economic and business conditions, portfolio characteristics, staff experience, problem loan trends, collateral values, concentrations and the competitive, legal and regulatory environment.
The qualitative factors are determined based on the various risk characteristics of each loan segment. Risk characteristics relevant to each portfolio segment are as follows:
Residential real estate - We do not generally originate loans with a loan-to-value ratio greater than 80 percent and do not generally grant loans that would be classified as subprime upon origination. When we do extend credit either on a first- or second-lien basis at a loan-to-value ratio greater than 80 percent, such loans are supported by either mortgage insurance or state guarantee programs. All loans in this segment are collateralized by owner-occupied 1-4 family residential real estate and repayment is dependent on the credit quality of the individual borrower. The health of the regional economy, including unemployment rates and housing prices, will have an effect on the credit quality of loans in this segment.
Home equity - Loans in this segment are generally secured by first or second liens on residential real estate. Repayment is dependent on the credit quality of the individual borrower. Management evaluates each loan application based on factors including the borrower’s credit score, income, length of employment, and other factors to establish the creditworthiness of the borrower.
Commercial real estate - Loans in this segment include investment real estate and are generally secured by assignments of leases, and real estate collateral. In cases where there is a concentration of exposure to a single large tenant, underwriting standards include analysis of the tenant's ability to support lease payments over the duration of the loan. The underlying cash flows generated by the properties can be adversely impacted by a downturn in the economy due to increased vacancy rates, which in turn can have an effect on credit quality in this segment. Payments on loans secured by income-producing properties often depend on the successful operation and management of properties. Management continually monitors cash flows on these loans.
Construction - Loans in this segment primarily include speculative real estate development loans for which payment is derived from sale of the property or permanent financing. Credit risk is affected by cost overruns, time to sell at an adequate price, and market conditions.
19
Commercial business - Loans in this segment are generally secured by business assets, including accounts receivable, inventory, real estate and intangible assets. Strict underwriting standards include considerations of the borrower’s ability to support the debt service requirements from the underlying historical and projected cash flows of the business, collateral values, the borrower’s credit history and the ultimate collectability of the debt. Economic conditions, real estate values, commodity prices, unemployment trends and other factors will affect the credit quality of loans in these segments.
Consumer - Loans in this segment primarily include classic and collector automobile loans. The classic and collector automobile loan portfolio is primarily comprised of geographically diverse loans originated by and purchased from a third party, who also provides collection services. While this portfolio generated minimal charge-offs during 2017 and 2016, the provisions during the year are based on management’s estimate of inherent losses.
Allocated component. The allocated component relates to loans that are on the watch list (non-accruing loans, partially charged off non-accruing loans and accruing adversely-rated loans) and considered impaired. Impairment is measured by either the present value of expected future cash flows discounted at the loan’s effective interest rate or the fair value of the collateral if the loan is collateral dependent. An allowance is established when the discounted cash flows (or collateral value) of the impaired loan is lower than the carrying value of that loan.
A loan is considered impaired when, based on current information and events, it is probable that we will be unable to collect the scheduled payments of principal or interest when due according to the contractual terms of the loan agreement. Factors considered by management in determining impairment include payment status, collateral value, and the probability of collecting scheduled principal and interest payments when due. Loans that experience insignificant payment delays and payment shortfalls generally are not classified as impaired. Management determines the significance of payment delays and payment shortfalls on a case-by-case basis, taking into consideration all of the circumstances surrounding the loan and the borrower, including the length of the delay, the reasons for the delay, the borrower’s prior payment record, and the amount of the shortfall in relation to the principal and interest owed.
We periodically may agree to modify the contractual terms of loans. When a loan is modified and a concession is made to a borrower experiencing financial difficulty, the modification is considered a troubled debt restructuring (“TDR”). All TDRs are initially classified as impaired.
Unallocated component. Through the third quarter of 2016, the Company maintained an unallocated component to cover uncertainties that could affect management’s estimate of probable losses. The unallocated component of the allowance reflected the margin of imprecision inherent in the underlying assumptions used in the methodologies for estimating allocated and general reserves in the portfolio. As a large portion of the Company's loan portfolio had seasoned, the unallocated component of the allowance for loan losses was eliminated during the fourth quarter of 2016.
We evaluate the loan portfolio on a quarterly basis and the allowance is adjusted accordingly. While we use the best information available to make evaluations, future adjustments to the allowance may be necessary if conditions differ substantially from the information used in making the evaluations. In addition, various regulatory agencies, as an integral part of their examination process, will periodically review the allowance for loan losses. Such agencies may require us to recognize additions to the allowance based on their analysis of information available to them at the time of their examination.
20
The following table sets forth activity in our allowance for loan losses for the periods indicated.
At or For the Years Ended December 31, | |||||||||||||||||||
2017 | 2016 | 2015 | 2014 | 2013 | |||||||||||||||
(In thousands) | |||||||||||||||||||
Balance at beginning of year | $ | 18,750 | $ | 17,102 | $ | 12,973 | $ | 9,671 | $ | 5,550 | |||||||||
Charge-offs: | |||||||||||||||||||
Real estate: | |||||||||||||||||||
1-4 family residential | (52 | ) | — | — | (18 | ) | (165 | ) | |||||||||||
Commercial real estate | (73 | ) | (321 | ) | — | — | — | ||||||||||||
Commercial business | — | (3,098 | ) | — | — | — | |||||||||||||
Consumer loans | (134 | ) | (56 | ) | (43 | ) | (61 | ) | (44 | ) | |||||||||
Total charge-offs | (259 | ) | (3,475 | ) | (43 | ) | (79 | ) | (209 | ) | |||||||||
Recoveries: | |||||||||||||||||||
Real estate: | |||||||||||||||||||
1-4 family residential | 199 | 100 | 82 | — | 236 | ||||||||||||||
Commercial real estate | — | 101 | — | — | — | ||||||||||||||
Commercial business | 74 | 37 | — | — | — | ||||||||||||||
Consumer loans | 15 | — | — | — | — | ||||||||||||||
Total recoveries | 288 | 238 | 82 | — | 236 | ||||||||||||||
Net (charge-offs) recoveries | 29 | (3,237 | ) | 39 | (79 | ) | 27 | ||||||||||||
Provision for loan losses | 2,098 | 4,885 | 4,090 | 3,381 | 4,094 | ||||||||||||||
Balance at end of year | $ | 20,877 | $ | 18,750 | $ | 17,102 | $ | 12,973 | $ | 9,671 | |||||||||
Ratios: | |||||||||||||||||||
Net (charge-offs) recoveries to average loans outstanding | — | % | (0.19 | )% | — | % | — | % | — | % | |||||||||
Allowance for loan losses to non-performing loans at end of year | 181 | % | 209 | % | 159 | % | 290 | % | 555 | % | |||||||||
Allowance for loan losses to total loans at end of year (1) | 0.95 | % | 0.97 | % | 1.11 | % | 1.13 | % | 1.25 | % | |||||||||
_______________________
(1) | Total loans do not include deferred costs and discounts. |
21
Allocation of Allowance for Loan Losses. The following table sets forth the allowance for loan losses allocated by loan category and the percent of loans in each category to total loans at the dates indicated. The allowance for loan losses allocated to each category is not necessarily indicative of future losses in any particular category and does not restrict the use of the allowance to absorb losses in other categories.
At December 31, | ||||||||||||||||||||
2017 | 2016 | 2015 | ||||||||||||||||||
Allowance for Loan Losses | Percent of Loans in Each Category to Total Loans | Allowance for Loan Losses | Percent of Loans in Each Category to Total Loans | Allowance for Loan Losses | Percent of Loans in Each Category to Total Loans | |||||||||||||||
(Dollars in thousands) | ||||||||||||||||||||
Real estate: | ||||||||||||||||||||
1-4 family residential | $ | 5,076 | 41.87 | % | $ | 4,846 | 44.12 | % | $ | 3,916 | 38.98 | % | ||||||||
Home equity | 699 | 3.66 | 537 | 4.08 | 636 | 5.03 | ||||||||||||||
Commercial | 9,584 | 37.86 | 8,374 | 35.63 | 7,147 | 36.46 | ||||||||||||||
Construction | 1,708 | 4.13 | 1,353 | 3.96 | 1,364 | 5.18 | ||||||||||||||
Commercial business loans | 3,473 | 11.50 | 3,206 | 10.69 | 2,839 | 11.87 | ||||||||||||||
Consumer loans | 337 | 0.98 | 434 | 1.52 | 772 | 2.48 | ||||||||||||||
Total allocated allowance | $ | 20,877 | 100.00 | % | $ | 18,750 | 100.00 | % | $ | 16,674 | 100.00 | % | ||||||||
Unallocated | — | — | 428 | |||||||||||||||||
Total | $ | 20,877 | $ | 18,750 | $ | 17,102 | ||||||||||||||
At December 31, | |||||||||||||
2014 | 2013 | ||||||||||||
Allowance for Loan Losses | Percent of Loans in Each Category to Total Loans | Allowance for Loan Losses | Percent of Loans in Each Category to Total Loans | ||||||||||
(Dollars in thousands) | |||||||||||||
Real Estate: | |||||||||||||
1-4 family residential | $ | 3,222 | 40.13 | % | $ | 2,835 | 47.26 | % | |||||
Home equity | 340 | 5.38 | 247 | 3.31 | |||||||||
Commercial | 3,551 | 33.81 | 2,608 | 29.61 | |||||||||
Construction | 1,056 | 4.67 | 303 | 2.14 | |||||||||
Commercial business loans | 3,410 | 13.24 | 2,416 | 14.39 | |||||||||
Consumer loans | 736 | 2.77 | 574 | 3.29 | |||||||||
Total allocated allowance | $ | 12,315 | 100.00 | % | $ | 8,983 | 100.00 | % | |||||
Unallocated | 658 | 688 | |||||||||||
Total | $ | 12,973 | $ | 9,671 | |||||||||
22
Investments
The objectives of the investment portfolio are: to invest funds not currently required for the Bank’s loan portfolio, cash requirements or other assets essential to our operations; to provide for capital preservation of the funds invested while generating maximum income and capital appreciation in accordance with the objectives of liquidity, quality and diversification; and to employ a percentage of assets in a manner that will balance the market, credit and duration risks of other assets.
Investment management practices are governed by our investment policy, which outlines internal guidelines and parameters. The investment policy is reviewed and approved by the Board of Directors at least annually. Compliance with the investment policy is monitored on a regular basis. The Bank’s Management Investment Committee, consisting of the Chief Executive Officer, Chief Financial Officer and Treasurer, oversees investment portfolio management with day-to-day management responsibility assigned to the Treasurer. Additionally the Bank’s Asset/Liability Management Committee, evaluates portfolio performance from the standpoint of meeting overall income and capital appreciation targets in accordance with the objectives of liquidity, quality and diversification.
At December 31, 2017, our securities portfolio consisted of U.S. government agency obligations, U.S. government-sponsored enterprise obligations including mortgage-backed securities and collateralized mortgage obligations, and equity securities, including CRA-related mutual funds. We only purchase investment grade debt securities. We do not own any trust preferred securities. During 2017, we exited a third party investment advisory arrangement that had been responsible for managing an allocation of corporate debt securities pursuant to particular investment objectives established by the Bank.
At December 31, 2017, we had no investments in a single company or entity that had an aggregate book value in excess of 10% of our equity, except for U.S. government-sponsored enterprise obligations including mortgage-backed securities. Generally, mortgage-backed securities are more liquid than individual mortgage loans, since there is an active trading market for such securities; their cashflow profiles make them attractive investments for liquidity management purposes. In addition, mortgage-backed securities may be used to collateralize our borrowings. Investments in mortgage-backed securities involve a risk that actual payments will be greater or less than the prepayment rate estimated at the time of purchase, which may require adjustments to the amortization of any premium or accretion of any discount relating to such interests, thereby affecting the net yield on our securities. Prepayment speeds determine whether prepayment estimates require modifications that could cause amortization or accretion adjustments.
At the time of purchase, we designate a security as either held to maturity or available for sale, based upon our intent and ability to hold such security until maturity. Securities available for sale are reported at market value. A periodic review and evaluation of the securities portfolios is conducted to determine if the fair value of any security has declined below its carrying value and whether such decline is other-than-temporary. For securities classified as available for sale, unrealized gains and losses are excluded from earnings and are reported through other comprehensive income (loss). Commencing on January 1, 2018, with the adoption of ASU 2016-01, Financial Instruments – Overall, (Subtopic 825-10) equity investments are required to be measured at fair value with changes in fair value recognized in net income. See Note 2 to the consolidated financial statements. If a security is reclassified from available for sale to held to maturity, the fair value at the time of transfer becomes the security's new cost basis for which it is reported. The unrealized holding gain or loss at the transfer date continues to be reported in other comprehensive income and is amortized over the security's remaining life as an adjustment of yield in a manner similar to a premium or discount. At December 31, 2017, all debt securities are classified as held to maturity.
23
Investment Securities Portfolio. The following tables set forth the composition of our investment securities portfolio at the dates indicated.
At December 31, | |||||||||||||||||||||||
2017 | 2016 | 2015 | |||||||||||||||||||||
Amortized Cost | Fair Value | Amortized Cost | Fair Value | Amortized Cost | Fair Value | ||||||||||||||||||
(In thousands) | |||||||||||||||||||||||
Securities available for sale: | |||||||||||||||||||||||
Debt securities: | |||||||||||||||||||||||
Mortgage and other asset-backed securities: | |||||||||||||||||||||||
Privately issued commercial mortgage-backed securities | $ | — | $ | — | $ | 10,530 | $ | 10,489 | $ | 13,126 | $ | 12,931 | |||||||||||
Other asset-backed securities | — | — | 9,174 | 8,985 | 11,395 | 11,253 | |||||||||||||||||
Total mortgage and other asset-backed | — | — | 19,704 | 19,474 | 24,521 | 24,184 | |||||||||||||||||
Other bonds and obligations: | |||||||||||||||||||||||
State and political | — | — | 12,730 | 12,693 | 16,016 | 16,315 | |||||||||||||||||
Financial services: | |||||||||||||||||||||||
Banks | — | — | 20,263 | 20,022 | 18,813 | 18,861 | |||||||||||||||||
Diversified financial entities | — | — | 17,198 | 17,190 | 23,124 | 23,300 | |||||||||||||||||
Insurance and REITs | — | — | 18,304 | 18,238 | 16,883 | 16,602 | |||||||||||||||||
Total financial services | — | — | 55,765 | 55,450 | 58,820 | 58,763 | |||||||||||||||||
Other corporate: | |||||||||||||||||||||||
Industrials | — | — | 49,217 | 48,964 | 55,470 | 54,532 | |||||||||||||||||
Utilities | — | — | 24,895 | 25,087 | 31,952 | 30,320 | |||||||||||||||||
Total other corporate | — | — | 74,112 | 74,051 | 87,422 | 84,852 | |||||||||||||||||
Total debt securities | — | — | 162,311 | 161,668 | 186,779 | 184,114 | |||||||||||||||||
Marketable equity securities: | 9,437 | 9,720 | 45,612 | 43,168 | 50,612 | 47,576 | |||||||||||||||||
Total securities available for sale | $ | 9,437 | $ | 9,720 | $ | 207,923 | $ | 204,836 | $ | 237,391 | $ | 231,690 | |||||||||||
Securities held to maturity: | |||||||||||||||||||||||
Debt securities: | |||||||||||||||||||||||
U.S. Treasury | $ | — | $ | — | $ | — | $ | — | $ | 636 | $ | 634 | |||||||||||
Government-sponsored enterprises | 30,673 | 29,779 | 32,667 | 31,737 | 28,256 | 28,224 | |||||||||||||||||
Government-sponsored mortgage-backed and collateralized mortgage obligations | 244,668 | 241,261 | 153,938 | 152,146 | 155,232 | 154,410 | |||||||||||||||||
SBA asset-backed securities | 28,375 | 28,074 | 14,422 | 14,210 | 16,017 | 15,958 | |||||||||||||||||
Total securities held to maturity | $ | 303,716 | $ | 299,114 | $ | 201,027 | $ | 198,093 | $ | 200,141 | $ | 199,226 | |||||||||||
24
Portfolio Maturities and Yields. The composition and maturities of the portion of the investment securities portfolio relating to debt securities at December 31, 2017 are summarized in the following table. Maturities are based on the final contractual payment dates, and do not reflect the impact of scheduled payments, prepayments or early redemptions that may occur.
One Year or Less | More than One Year through Five Years | More than Five Years through Ten Years | ||||||||||||||||||
Amortized Cost | Weighted Average Yield | Amortized Cost | Weighted Average Yield | Amortized Cost | Weighted Average Yield | |||||||||||||||
(Dollars in thousands) | ||||||||||||||||||||
Securities held to maturity: | ||||||||||||||||||||
Debt securities: | ||||||||||||||||||||
Government-sponsored enterprises | $ | — | — | % | $ | 15,626 | 1.68 | % | $ | 15,047 | 1.81 | % | ||||||||
Government-sponsored mortgage-backed and collateralized mortgage obligations | 4 | 5.40 | 14 | 1.47 | 24,828 | 1.98 | ||||||||||||||
SBA asset-backed securities | — | — | — | — | 13,854 | 2.39 | ||||||||||||||
Total debt securities held to maturity | $ | 4 | $ | 15,640 | $ | 53,729 | ||||||||||||||
More than Ten Years | Total Securities | ||||||||||||||||
Amortized Cost | Weighted Average Yield | Amortized Cost | Fair Value | Weighted Average Yield | |||||||||||||
(Dollars in thousands) | |||||||||||||||||
Securities held to maturity: | |||||||||||||||||
Debt securities: | |||||||||||||||||
Government-sponsored enterprises | $ | — | — | % | $ | 30,673 | $ | 29,779 | 1.74 | % | |||||||
Government-sponsored mortgage-backed and collateralized mortgage obligations | 219,822 | 2.38 | 244,668 | 241,261 | 2.34 | ||||||||||||
SBA asset-backed securities | 14,521 | 2.33 | 28,375 | 28,074 | 2.36 | ||||||||||||
Total debt securities held to maturity | $ | 234,343 | $ | 303,716 | $ | 299,114 | 2.28 | % | |||||||||
Bank-Owned Life Insurance. Bank-owned life insurance provides us noninterest income that is non-taxable. Applicable regulations generally limit our investment in bank-owned life insurance to 25% of our Tier 1 capital plus our allowance for loan losses. At December 31, 2017, we had $33.1 million in bank-owned life insurance.
Sources of Funds
General. Deposits traditionally have been our primary source of funds for our investment and lending activities. We also borrow from the Federal Home Loan Bank of Boston to supplement cash flow needs, to lengthen the maturities of liabilities for interest rate risk management purposes and to manage our cost of funds. Our additional sources of funds are scheduled payments and prepayments of principal and interest on loans and investment securities, fee income and proceeds from the sales of loans and securities.
Deposits. We accept deposits primarily from customers in the communities in which our offices are located, as well as from customers outside our office locations using online channels and from small businesses, other commercial customers and municipalities throughout our lending area. We rely on our competitive pricing and products, convenient locations, mobile and online capabilities and quality customer service to attract and retain deposits. We offer a variety of deposit accounts with a range of interest rates and terms. Our deposit accounts consist of passbook and statement savings accounts, certificates of deposit, money market accounts, commercial and regular checking accounts, and IRAs. Deposit rates and terms are based primarily on current business strategies and market interest rates, liquidity requirements and our deposit growth goals. We also utilize brokered deposits and other listed deposit products as part of our funding sources to fund loan growth.
25
The following tables set forth the distribution of our average total deposit accounts, by account type, for the periods indicated.
For the Years Ended December 31, | |||||||||||||||||||||||||||||
2017 | 2016 | 2015 | |||||||||||||||||||||||||||
Average Balance | Percent | Weighted Average Rate (1) | Average Balance | Percent | Weighted Average Rate (1) | Average Balance | Percent | Weighted Average Rate (1) | |||||||||||||||||||||
(Dollars in thousands) | |||||||||||||||||||||||||||||
Deposit type: | |||||||||||||||||||||||||||||
Non-interest bearing deposits | $ | 201,715 | 10.57 | % | — | % | $ | 163,403 | 10.41 | % | — | % | $ | 138,438 | 10.87 | % | — | % | |||||||||||
Interest bearing deposits: | |||||||||||||||||||||||||||||
NOW | 152,469 | 7.99 | 0.04 | 139,829 | 8.91 | 0.05 | 127,183 | 9.98 | 0.05 | ||||||||||||||||||||
Regular savings | 249,256 | 13.06 | 0.32 | 275,347 | 17.55 | 0.34 | 294,004 | 23.08 | 0.36 | ||||||||||||||||||||
Money market | 643,433 | 33.72 | 0.96 | 470,403 | 29.98 | 0.86 | 307,661 | 24.15 | 0.72 | ||||||||||||||||||||
Brokered money market | 49,041 | 2.57 | 1.22 | 47,071 | 3.00 | 0.61 | 28,130 | 2.21 | 0.52 | ||||||||||||||||||||
Certificates of deposit | 382,157 | 20.02 | 1.39 | 333,857 | 21.28 | 1.29 | 310,249 | 24.35 | 1.26 | ||||||||||||||||||||
Brokered certificates of deposit | 230,329 | 12.07 | 0.97 | 139,128 | 8.87 | 0.62 | 68,245 | 5.36 | 0.45 | ||||||||||||||||||||
Total interest bearing deposits | 1,706,685 | 89.43 | 0.89 | % | 1,405,635 | 89.59 | 0.75 | % | 1,135,472 | 89.13 | 0.68 | % | |||||||||||||||||
Total deposits | $ | 1,908,400 | 100.00 | % | 0.80 | % | $ | 1,569,038 | 100.00 | % | 0.67 | % | $ | 1,273,910 | 100.00 | % | 0.60 | % | |||||||||||
_________________________ (1) The weighted average rate is calculated using stated rate of each deposit account within the given categories as of December 31, 2017, 2016 and 2015. | |||||||||||||||||||||||||||||
The following table sets forth certificates of deposit classified by interest rate as of the dates indicated, including brokered deposits. At December 31, 2017, we had a total of $698.1 million in certificates of deposit, of which $406.4 million had remaining maturities of one year or less.
At December 31, | |||||||||||
2017 | 2016 | 2015 | |||||||||
(Dollars in thousands) | |||||||||||
Interest rate range: | |||||||||||
Less than 0.50% | $ | 28,812 | $ | 76,658 | $ | 123,629 | |||||
0.50% to 0.99% | 38,944 | 252,662 | 122,370 | ||||||||
1.00% to 1.49% | 375,271 | 138,502 | 94,031 | ||||||||
1.50% to 1.99% | 184,129 | 71,687 | 45,285 | ||||||||
2.00% to 2.99% | 70,992 | 48,125 | 63,190 | ||||||||
Total | $ | 698,148 | $ | 587,634 | $ | 448,505 | |||||
26
The following table sets forth, by interest rate ranges, the maturities of our certificates of deposit, including brokered deposits.
At December 31, 2017 | ||||||||||||||||||||||
Period to Maturity | ||||||||||||||||||||||
Less Than or Equal to One Year | More Than One to Two Years | More Than Two to Three Years | More Than Three Years | Total | Percent of Total | |||||||||||||||||
(Dollars in thousands) | ||||||||||||||||||||||
Interest rate range: | ||||||||||||||||||||||
Less than 0.50% | $ | 28,812 | $ | — | $ | — | $ | — | $ | 28,812 | 4.13 | % | ||||||||||
0.50% to 0.99% | 27,534 | 11,410 | — | — | 38,944 | 5.58 | ||||||||||||||||
1.00% to 1.49% | 321,061 | 42,452 | 11,396 | 362 | 375,271 | 53.75 | ||||||||||||||||
1.50% to 1.99% | 28,905 | 91,084 | 34,765 | 29,375 | 184,129 | 26.37 | ||||||||||||||||
2.00% to 2.99% | 50 | 35,726 | 16,572 | 18,644 | 70,992 | 10.17 | ||||||||||||||||
Total | $ | 406,362 | $ | 180,672 | $ | 62,733 | $ | 48,381 | $ | 698,148 | 100.00 | % | ||||||||||
As of December 31, 2017, the aggregate amount of outstanding certificates of deposit in amounts greater than or equal to $100,000, excluding brokered deposits, was $302.9 million. The following table sets forth the maturity of those certificates as of December 31, 2017.
At December 31, 2017 | |||
(In thousands) | |||
Maturing in: | |||
Three months or less | $ | 14,707 | |
Over three months through six months | 33,320 | ||
Over six months through one year | 51,955 | ||
Over one year to three years | 173,577 | ||
Over three years | 29,335 | ||
Total | $ | 302,894 | |
Borrowings. Our borrowings consist of advances from the Federal Home Loan Bank of Boston. At December 31, 2017, we had access to additional Federal Home Loan Bank advances of up to $594.1 million. The following table sets forth information concerning balances and interest rates on our Federal Home Loan Bank advances at the dates and for the years indicated.
At or For the Years Ended December 31, | |||||||||||
2017 | 2016 | 2015 | |||||||||
(In thousands) | |||||||||||
Balance at end of year | $ | 205,000 | $ | 251,000 | $ | 75,000 | |||||
Average balance during year | 199,004 | 249,226 | 146,720 | ||||||||
Maximum outstanding at any month end | 280,000 | 325,000 | 260,000 | ||||||||
Weighted average interest rate at end of year | 1.54 | % | 0.97 | % | 0.76 | % | |||||
Average interest rate during year | 1.27 | % | 0.84 | % | 0.83 | % | |||||
Expense and Tax Allocation
Blue Hills Bank has entered into an agreement with Blue Hills Bancorp, Inc. to provide it with certain administrative support services, whereby Blue Hills Bank is compensated at not less than the fair market value of the services provided. In addition, Blue Hills Bank and Blue Hills Bancorp, Inc. have entered into an agreement establishing a method for allocating and for reimbursing the payment of their consolidated tax liability.
27
Personnel
On a full time equivalent basis, we had 237 employees at December 31, 2017. Our employees are not represented by any collective bargaining group.
Subsidiary Activity
Blue Hills Bancorp, Inc. owns 100% of Blue Hills Bank and Blue Hills Funding Corporation, the company that financed the loan to the ESOP. Blue Hills Bank has three subsidiaries, B.H. Security Corporation ("B.H. Security"), HP Security Corporation (“HP Security”) and 1196 Corporation (“1196 Corporation”). B.H. Security, HP Security and 1196 Corporation buy, sell and hold securities on their own behalf as wholly-owned subsidiaries of Blue Hills Bank, and this activity results in tax advantages in Massachusetts. At December 31, 2017, B.H. Security, HP Security and 1196 Corporation had total assets of $274.2 million, $253,000, and $5.5 million respectively.
28
REGULATION AND SUPERVISION
General
Blue Hills Bank is a Massachusetts-chartered stock savings bank and is the wholly-owned subsidiary of Blue Hills Bancorp, Inc., a Maryland corporation and a registered bank holding company. Blue Hills Bank’s deposits are insured up to applicable limits by the Federal Deposit Insurance Corporation, or “FDIC”, and by the Depositors Insurance Fund of Massachusetts for amounts in excess of the FDIC insurance limits. Blue Hills Bank is subject to extensive regulation by the Massachusetts Commissioner of Banks, as its chartering agency, and by the FDIC, its primary federal regulator and deposit insurer. Blue Hills Bank is required to file reports with, and is periodically examined by, the FDIC and the Massachusetts Commissioner of Banks concerning its activities and financial condition and must obtain regulatory approvals prior to entering into certain transactions, including, but not limited to, mergers with or acquisitions of other financial institutions. Blue Hills Bank is also a member of and owns stock in the Federal Home Loan Bank of Boston, which is one of the twelve regional banks in the Federal Home Loan Bank System.
As a registered bank holding company, Blue Hills Bancorp, Inc. is regulated by the Board of Governors of the Federal Reserve System, or the “Federal Reserve Board.” Blue Hills Bancorp, Inc. is also subject to the rules and regulations of the Securities and Exchange Commission under the federal securities laws.
The regulatory and supervisory structure establishes a comprehensive framework of activities in which an institution can engage and is intended primarily for the protection of depositors and the deposit insurance funds, rather than for the protection of stockholders and creditors. The regulatory structure also gives the regulatory authorities extensive discretion in connection with their supervisory and enforcement activities and examination policies, including policies concerning the establishment of deposit insurance assessment fees, classification of assets and establishment of adequate loan loss reserves for regulatory purposes. Any change in such regulatory requirements and policies, whether by the Massachusetts legislature, the Massachusetts Commissioner of Banks, the FDIC, the Federal Reserve Board or Congress, could have a material adverse impact on the financial condition and results of operations of Blue Hills Bancorp, Inc. and Blue Hills Bank.
Set forth below are certain material statutory and regulatory requirements applicable to Blue Hills Bancorp, Inc. and Blue Hills Bank. The summary is not intended to be a complete description of such statutes and regulations and their effects on Blue Hills Bancorp, Inc. and Blue Hills Bank.
Massachusetts Banking Laws and Supervision
General. As a Massachusetts-chartered stock savings bank, Blue Hills Bank is subject to supervision, regulation and examination by the Massachusetts Commissioner of Banks and to various Massachusetts statutes and regulations which govern, among other things, investment powers, lending and deposit-taking activities, borrowings, maintenance of surplus and reserve accounts, distribution of earnings and payment of dividends. In addition, Blue Hills Bank is subject to Massachusetts consumer protection and civil rights laws and regulations. The approval of the Massachusetts Commissioner of Banks and/or the Massachusetts Board of Bank Incorporation is required for a Massachusetts-chartered bank to establish or close branches, merge with other financial institutions, issue stock and undertake certain other activities.
Massachusetts regulations generally allow Massachusetts banks to, with appropriate regulatory approvals, engage in activities permissible for federally chartered banks or banks chartered by another state. The Commissioner also has adopted procedures reducing regulatory burdens and expense and expediting branching by well-capitalized and well-managed banks.
The Commonwealth of Massachusetts recently adopted a law modernizing the Massachusetts banking law, which affords Massachusetts chartered banks with greater flexibility compared to federally chartered and out-of-state banks.
Recent Massachusetts banking legislation, “An Act Modernizing the Banking Laws and Enhancing the Competitiveness of State-Chartered Banks,” became effective April 2015. Among other things, the legislation attempts to better synchronize Massachusetts laws with federal requirements in the same areas, streamlines the process for an institution to engage in activities permissible for federally chartered and out of state institutions, consolidates corporate governance statutes and provides authority for the Commissioner to establish a tiered supervisory system for Massachusetts-chartered institutions based on factors such as asset size, capital level, balance sheet composition, examination rating, compliance and other factors deemed appropriate.
29
Dividends. A Massachusetts stock bank may declare cash dividends from net profits not more frequently than quarterly. Non-cash dividends may be declared at any time. No dividends may be declared, credited or paid if the bank’s capital stock is impaired. The approval of the Massachusetts Commissioner of Banks is required if the total of all dividends declared in any calendar year exceeds the total of its net profits for that year combined with its retained net profits of the preceding two years. Dividends from Blue Hills Bancorp, Inc. may depend, in part, upon receipt of dividends from Blue Hills Bank. The payment of dividends from Blue Hills Bank would be restricted by federal law if the payment of such dividends resulted in Blue Hills Bank failing to meet regulatory capital requirements.
Loans to One Borrower Limitations. Massachusetts banking law grants broad lending authority. However, with certain limited exceptions, total obligations to one borrower may not exceed 20 percent of the total of the bank’s capital, surplus and undivided profits.
Investment Activities. In general, Massachusetts-chartered savings banks may invest in preferred and common stock of any corporation organized under the laws of the United States or any state provided such investments do not involve control of any corporation and do not, in the aggregate, exceed 4% of the bank’s deposits. Massachusetts-chartered savings banks may in addition invest an amount equal to 1.0% of their deposits in stocks of Massachusetts corporations or companies with substantial employment in the Commonwealth, which have pledged to the Massachusetts Commissioner of Banks that such monies will be used for further development within the Commonwealth. Federal law imposes additional restrictions on Blue Hills Bank’s investment activities. See “-Federal Bank Regulations-Business and Investment Activities” for such federal restrictions.
Parity Regulation. A Massachusetts bank may, in accordance with Massachusetts law and regulations issued by the Massachusetts Commissioner of Banks, exercise any power and engage in any activity that has been authorized for national banks, federal thrifts or state banks in a state other than Massachusetts, provided that the activity is permissible under applicable federal and not specifically prohibited by Massachusetts law. Such powers and activities must be subject to the same limitations and restrictions imposed on the national bank, federal thrift or out-of-state bank that exercised the power or activity. In many cases, a Massachusetts Bank is required to submit advanced written notice to the Massachusetts Commissioner of Banks prior to engaging in certain activities authorized for national banks, federal thrifts or out-of-state banks.
Regulatory Enforcement Authority. Any Massachusetts savings bank that does not operate in accordance with the regulations, policies and directives of the Massachusetts Commissioner of Banks may be subject to sanctions for non-compliance, including revocation of its charter. The Massachusetts Commissioner of Banks may, under certain circumstances, suspend or remove officers or directors who have violated the law, conducted the bank’s business in an unsafe or unsound manner or contrary to the depositors’ interests or been negligent in the performance of their duties. Upon finding that a bank has engaged in an unfair or deceptive act or practice, the Massachusetts Commissioner of Banks may issue an order to cease and desist and impose a fine on the bank concerned. The Commissioner also has authority to take possession of a bank and appoint a liquidating agent under certain conditions including an unsafe and unsound condition to transact business, the conduct of business in an unsafe or unauthorized manner, impaired capital, or violations of law or the bank’s charter. In addition, Massachusetts consumer protection and civil rights statutes applicable to Blue Hills Bank permit private individual and class action law suits and provide for the rescission of consumer transactions, including loans, and the recovery of statutory and punitive damage and attorney’s fees in the case of certain violations of those statutes.
Depositors Insurance Fund. Massachusetts-chartered savings banks, below a certain level of deposits, are required to be members of the Depositors Insurance Fund, a corporation that insures savings bank deposits in excess of federal deposit insurance coverage. The Depositors Insurance Fund is authorized to charge savings banks an annual assessment fee on deposit balances in excess of amounts insured by the FDIC. Assessment rates are based on the institution’s risk category, similar to the method currently used to determine assessments by the FDIC discussed below under “-Federal Regulations-Insurance of Deposit Accounts.”
Protection of Personal Information. Massachusetts has adopted regulatory requirements intended to protect personal information. The requirements are similar to existing federal laws such as the Gramm-Leach-Bliley Act, discussed below under “-Federal Bank Regulations-Privacy Regulations”, that require organizations to establish written information security programs to prevent identity theft. The Massachusetts regulation also contains technology system requirements, especially for the encryption of personal information sent over wireless or public networks or stored on portable devices.
Massachusetts has other statutes or regulations that are similar to certain of the federal provisions discussed below.
30
Federal Bank Regulations
Capital Requirements. Under the FDIC’s regulations, federally insured state-chartered banks that are not members of the Federal Reserve System (“state non-member banks”), such as Blue Hills Bank, are required to comply with minimum leverage capital requirements. Federal regulations require federally insured depository institutions to meet several minimum capital standards: a common equity Tier 1 capital to risk-based assets ratio of 4.5%, a Tier 1 capital to risk-based assets ratio of 6.0%, a total capital to risk-based assets of 8%, and a Tier 1 capital to total assets leverage ratio of 4%. In addition to establishing the minimum regulatory capital requirements, the regulations limit capital distributions and certain discretionary bonus payments to management if the institution does not hold a “capital conservation buffer” consisting of 2.5% of common equity Tier 1 capital to risk-weighted assets above the amount necessary to meet its minimum risk-based capital requirements. The capital conservation buffer requirement is being phased in. It is currently at 1.875%, and will be fully phased in at 2.5% on January 1, 2019.
In determining the amount of risk-weighted assets for purposes of calculating risk-based capital ratios, all assets, including certain off-balance sheet assets (e.g., recourse obligations, direct credit substitutes, residual interests) are multiplied by a risk weight factor assigned by the regulations based on the risks believed inherent in the type of asset. Higher levels of capital are required for asset categories believed to present greater risk. In assessing an institution’s capital adequacy, the FDIC takes into consideration, not only these numeric factors, but qualitative factors as well, and has the authority to establish higher capital requirements for individual institutions if it deems necessary.
Standards for Safety and Soundness. As required by statute, the federal banking agencies adopted final regulations and Interagency Guidelines Establishing Standards for Safety and Soundness to implement safety and soundness standards. The guidelines set forth the safety and soundness standards that the federal banking agencies use to identify and address problems at insured depository institutions before capital becomes impaired. The guidelines address internal controls and information systems, the internal audit system, credit underwriting, loan documentation, interest rate exposure, asset growth, asset quality, earnings, compensation, fees and benefits and, more recently, safeguarding customer information. If the appropriate federal banking agency determines that an institution fails to meet any standard prescribed by the guidelines, the agency may require the institution to submit to the agency an acceptable plan to achieve compliance with the standard.
Business and Investment Activities. Under federal law, all state-chartered FDIC-insured banks, including savings banks, have been limited in their activities as principal and in their equity investments to the type and the amount authorized for national banks, notwithstanding state law. Federal law permits exceptions to these limitations. For example, certain state-chartered savings banks may, with FDIC approval, continue to exercise state authority to invest in common or preferred stocks listed on a national securities exchange and in the shares of an investment company registered under the Investment Company Act of 1940, as amended. The maximum permissible investment is the lesser of 100% of Tier 1 capital or the maximum amount permitted by Massachusetts law. Blue Hills Bank received approval from the FDIC to retain and acquire such equity instruments up to the specified limits. Any such grandfathered authority may be terminated upon the FDIC’s determination that such investments pose a safety and soundness risk or upon the occurrence of certain events such as the savings bank’s conversion to a different charter.
The FDIC is also authorized to permit state banks to engage in state authorized activities or investments not permissible for national banks (other than non-subsidiary equity investments) if they meet all applicable capital requirements and it is determined that such activities or investments do not pose a significant risk to the FDIC insurance fund. The FDIC has adopted regulations governing the procedures for institutions seeking approval to engage in such activities or investments. The Gramm-Leach-Bliley Act of 1999 specified that a state bank may control a subsidiary that engages in activities as principal that would only be permitted for a national bank to conduct in a “financial subsidiary,” if a bank meets specified conditions and deducts its investment in the subsidiary for regulatory capital purposes.
Interstate Banking and Branching. Federal law permits well capitalized and well managed bank holding companies to acquire banks in any state, subject to Federal Reserve Board approval, certain concentration limits and other specified conditions. Interstate mergers of banks are also authorized, subject to regulatory approval and other specified conditions. In addition, banks are permitted to establish de novo branches on an interstate basis to the extent that branching is authorized by the law of the host state for the banks chartered by that state.
31
Prompt Corrective Regulatory Action. Federal law establishes a system of prompt corrective action to resolve the problems of undercapitalized institutions. The FDIC has adopted regulations to implement the prompt corrective action legislation. An institution is deemed to be “well capitalized” if it has a total risk-based capital ratio of 10.0% or greater, a Tier 1 risk-based capital ratio of 8.0% or greater, a leverage ratio of 5.0% or greater and a common equity Tier 1 ratio of 6.5% or greater. An institution is “adequately capitalized” if it has a total risk-based capital ratio of 8.0% or greater, a Tier 1 risk-based capital ratio of 6.0% or greater, a leverage ratio of 4.0% or greater and a common equity Tier 1 ratio of 4.5% or greater. An institution is “undercapitalized” if it has a total risk-based capital ratio of less than 8.0%, a Tier 1 risk-based capital ratio of less than 6.0%, a leverage ratio of less than 4.0% or a common equity Tier 1 ratio of less than 4.5%. An institution is deemed to be “significantly undercapitalized” if it has a total risk-based capital ratio of less than 6.0%, a Tier 1 risk-based capital ratio of less than 4.0%, a leverage ratio of less than 3.0% or a common equity Tier 1 ratio of less than 3.0%. An institution is considered to be “critically undercapitalized” if it has a ratio of tangible equity (as defined in the regulations) to total assets that is equal to or less than 2.0%.
“Undercapitalized” banks must adhere to growth, capital distribution (including dividend) and other limitations and are required to submit a capital restoration plan. A bank’s compliance with such a plan must be guaranteed by any company that controls the undercapitalized institution in an amount equal to the lesser of 5% of the institution’s total assets when deemed undercapitalized or the amount necessary to achieve the status of adequately capitalized. If an “undercapitalized” bank fails to submit an acceptable plan, it is treated as if it is “significantly undercapitalized.” “Significantly undercapitalized” banks must comply with one or more of a number of additional measures, including, but not limited to, a required sale of sufficient voting stock to become adequately capitalized, a requirement to reduce total assets, cessation of taking deposits from correspondent banks, the dismissal of directors or officers and restrictions on interest rates paid on deposits, compensation of executive officers and capital distributions by the parent holding company. “Critically undercapitalized” institutions are subject to additional measures including, subject to a narrow exception, the appointment of a receiver or conservator within 270 days after it obtains such status.
Transactions with Affiliates. Transactions between a bank (and, generally, its subsidiaries) and its related parties or affiliates are limited by Sections 23A and 23B of the Federal Reserve Act. An affiliate of a bank is any company or entity that controls, is controlled by or is under common control with the bank. In a holding company context, the parent bank holding company and any companies which are controlled by such parent holding company are affiliates of the bank. Generally, Sections 23A and 23B of the Federal Reserve Act limit the extent to which the bank or its subsidiaries may engage in “covered transactions” with any one affiliate to 10% of such institution’s capital stock and surplus and contain an aggregate limit on all such transactions with all affiliates to an amount equal to 20% of such institution’s capital stock and surplus. The term “covered transaction” includes the making of loans, purchase of assets, issuance of a guarantee and similar transactions. In addition, loans or other extensions of credit by the institution to the affiliate are required to be collateralized in accordance with specified requirements. The law also requires that affiliate transactions be on terms and conditions that are substantially the same, or at least as favorable to the institution, as those provided to non-affiliates.
The Sarbanes-Oxley Act of 2002 generally prohibits loans by a company to its executive officers and directors. The law contains a specific exception for loans by a depository institution to its executive officers and directors in compliance with federal banking laws, assuming such loans are also permitted under the law of the institution’s chartering state. Under such laws, a bank’s authority to extend credit to executive officers, directors and 10% shareholders (“insiders”), as well as entities such persons control, is restricted. The law limits both the individual and aggregate amount of loans that may be made to insiders based, in part, on the bank’s capital position and requires certain board approval procedures to be followed. Such loans are required to be made on terms substantially the same as those offered to unaffiliated individuals and not involve more than the normal risk of repayment. There is an exception for loans made pursuant to a benefit or compensation program that is widely available to all employees of the institution and does not give preference to insiders over other employees. Loans to executive officers are further limited to loans of specific types and amounts.
Enforcement. The FDIC has extensive enforcement authority over insured state savings banks, including Blue Hills Bank. That enforcement authority includes, among other things, the ability to assess civil money penalties, issue cease and desist orders and remove directors and officers. In general, enforcement actions may be initiated in response to violations of laws and regulations and unsafe or unsound practices. The FDIC also has authority under federal law to appoint a conservator or receiver for an insured bank under certain circumstances. With certain exceptions, a receiver or conservator must be appointed for an insured state non-member bank if that bank was “critically undercapitalized” on average during the calendar quarter beginning 270 days after the date on which the institution became “critically undercapitalized.”
32
Federal Insurance of Deposit Accounts. The Federal Deposit Insurance Corporation imposes deposit insurance assessments. Under the Federal Deposit Insurance Corporation’s risk-based assessment system, insured institutions were initially assigned to risk categories based on supervisory evaluations, regulatory capital levels and certain other factors. An institution’s assessment rate depended upon the category to which it is assigned and certain adjustments specified by Federal Deposit Insurance Corporation regulations, with less risky institutions paying lower rates. Assessment rates (inclusive of possible adjustments) ranged from 2 1/2 to 45 basis points of each institution’s total assets less tangible capital. The Federal Deposit Insurance Corporation’s current system represents a change, required by the Dodd-Frank Act, from its prior practice of basing the assessment on an institution’s volume of deposits.
Effective July 1, 2016, the FDIC adopted changes that eliminated the risk categories. Assessments for most institutions are now based on financial measures and supervisory ratings derived from statistical modeling estimating the probability of failure within three years. In conjunction with the Deposit Insurance Fund reserve ratio achieving 1.15%, the assessment range (inclusive of possible adjustments) was reduced for institutions of less than $10 billion in total assets to 1.5 basis points to 30 basis points, also effective July 1, 2016. The Dodd-Frank Act specifies that banks of greater than $10 billion in assets be required to bear the burden of raising the reserve ratio from 1.15% to 1.35%. Such institutions are subject to an annual surcharge of 4.5 basis points of total assets exceeding $10 billion. This surcharge will remain in place until the earlier of the Deposit Insurance Fund reaching the 1.35% ratio or December 31, 2018, at which point a shortfall assessment would be applied. The FDIC, exercising discretion provided to it by the Dodd-Frank Act, has established a long-term goal of achieving a 2% reverse ratio for the Deposit Insurance Fund.
The Federal Deposit Insurance Corporation has authority to increase insurance assessments. A significant increase in insurance premiums would likely have an adverse effect on the operating expenses and results of operations of the Bank. Future insurance assessment rates cannot be predicted.
In addition to FDIC assessments, the Financing Corporation (“FICO”) is authorized to impose and collect, through the FDIC, assessments for costs related to bonds issued by the FICO in the 1980s to recapitalize the former Federal Savings and Loan Insurance Corporation. The bonds issued by the FICO are due to mature in 2017 through 2019. During the calendar year ended December 31, 2017, Blue Hills Bank paid $113,000 in fees related to the FICO.
Blue Hills Bank is a member of the Depositors Insurance Fund, a corporation that insures savings bank deposits in excess of federal deposit insurance coverage. See “-Massachusetts Banking Laws and Supervision-Depositors Insurance Fund,” above.
Community Reinvestment Act. Under the Community Reinvestment Act (“CRA”), a bank has a continuing and affirmative obligation, consistent with its safe and sound operation, to help meet the credit needs of its entire community, including low and moderate income neighborhoods. The CRA does not establish specific lending requirements or programs for financial institutions nor does it limit an institution’s discretion to develop the types of products and services that it believes are best suited to its particular community. The CRA does require the FDIC, in connection with its examination of a bank, to assess the institution’s record of meeting the credit needs of its community and to take such record into account in its evaluation of certain applications by such institution, including applications to establish or acquire branches and merger with other depository institutions. The CRA requires the FDIC to provide a written evaluation of an institution’s CRA performance utilizing a four-tiered descriptive rating system. Blue Hills Bank’s latest FDIC CRA rating, dated September 28, 2015, was “Satisfactory.”
Massachusetts has its own statutory counterpart to the CRA which is also applicable to Blue Hills Bank. The Massachusetts version is generally similar to the CRA but utilizes a five-tiered descriptive rating system. The Massachusetts Commissioner of Banks is required to consider a bank’s record of performance under the Massachusetts law in considering any application by the bank to establish a branch or other deposit-taking facility, relocate an office or to merge or consolidate with or acquire the assets and assume the liabilities of any other banking institution. Blue Hills Bank’s most recent rating under Massachusetts law, dated September 28, 2015, was “Satisfactory.”
Federal Reserve System. The Federal Reserve Board regulations require savings institutions to maintain non-interest earning reserves against their transaction accounts (primarily Negotiable Order of Withdrawal (NOW) and regular checking accounts). The regulations currently provide that reserves be maintained against aggregate transaction accounts as follows: a 3% reserve ratio is assessed on net transaction accounts up to and including $122.3 million; a 10% reserve ratio is applied above $122.3 million. The first $16.0 million of otherwise reservable balances are exempted from the reserve requirements. The amounts are adjusted annually. Blue Hills Bank complies with the foregoing requirements.
33
Federal Home Loan Bank System. Blue Hills Bank is a member of the Federal Home Loan Bank System, which consists of eleven regional Federal Home Loan Banks. The Federal Home Loan Bank System provides a central credit facility primarily for member institutions as well as other entities involved in home mortgage lending. As a member of the Federal Home Loan Bank of Boston, Blue Hills Bank is required to acquire and hold a specified amount of shares of capital stock in the Federal Home Loan Bank of Boston. As of December 31, 2017, Blue Hills Bank was in compliance with this requirement.
Other Regulations
Some interest and other charges collected or contracted by Blue Hills Bank are subject to state usury laws and federal laws concerning interest rates and charges. Blue Hills Bank’s operations also are subject to state and federal laws applicable to credit transactions and other operations, including, but not limited to, the:
• | Truth-In-Lending Act, governing disclosures of credit terms to consumer borrowers; |
• | Real Estate Settlement Procedures Act, requiring that borrowers for mortgage loans for one- to four-family residential real estate receive various disclosures, including good faith estimates of settlement costs, lender servicing and escrow account practices, and prohibiting certain practices that increase the cost of settlement services; |
• | Home Mortgage Disclosure Act, requiring financial institutions to provide information to enable the public and public officials to determine whether a financial institution is fulfilling its obligation to help meet the housing needs of the community it serves; |
• | Equal Credit Opportunity Act, prohibiting discrimination on the basis of race, creed, or other prohibited factors in extending credit; |
• | Fair Credit Reporting Act, governing the use and provision of information to credit reporting agencies; and |
• | Fair Debt Collection Act, governing the manner in which consumer debts may be collected by collection agencies. |
The operations of Blue Hills Bank also are subject to the:
• | Right to Financial Privacy Act, which imposes a duty to maintain confidentiality of consumer financial records and prescribes procedures for complying with administrative subpoenas of financial records; |
• | Electronic Funds Transfer Act and Regulation E promulgated thereunder, that govern automatic deposits to and withdrawals from deposit accounts and customers’ rights and liabilities arising from the use of automated teller machines and other electronic banking services; |
• | Gramm-Leach-Bliley Act privacy statute which requires each depository institution to disclose its privacy policy, identify parties with whom certain nonpublic customer information is shared and provide customers with certain rights to “opt out” of disclosure to certain third parties; and |
• | Title III of The Uniting and Strengthening America by Providing Appropriate Tools Required to Intercept and Obstruct Terrorism Act of 2001 (referred to as the “USA PATRIOT Act”), which significantly expanded the responsibilities of financial institutions, in preventing the use of the United States financial system to fund terrorist activities. Among other things, the USA PATRIOT Act and the related regulations required banks operating in the United States to develop anti-money laundering compliance programs, due diligence policies and controls to facilitate the detection and reporting of money laundering. |
Holding Company Regulation
Blue Hills Bancorp, Inc., as a bank holding company, is subject to examination, regulation, and periodic reporting under the Bank Holding Company Act of 1956, as amended, as administered by the Federal Reserve Board. Blue Hills Bancorp, Inc. is required to obtain the prior approval of the Federal Reserve Board to acquire all, or substantially all, of the assets of any bank or bank holding company. Prior Federal Reserve Board approval would be required for Blue Hills Bancorp, Inc. to acquire direct or indirect ownership or control of any voting securities of any bank or bank holding company if it would, directly or indirectly, own or control more than 5% of any class of voting shares of the bank or bank holding company.
34
A bank holding company is generally prohibited from engaging in, or acquiring, direct or indirect control of more than 5% of the voting securities of any company engaged in non-banking activities. One of the principal exceptions to this prohibition is for activities found by the Federal Reserve Board to be so closely related to banking or managing or controlling banks as to be a proper incident thereto. Some of the principal activities that the Federal Reserve Board has determined by regulation to be closely related to banking are: (i) making or servicing loans; (ii) performing certain data processing services; (iii) providing securities brokerage services; (iv) acting as fiduciary, investment or financial advisor; (v) leasing personal or real property under certain conditions; (vi) making investments in corporations or projects designed primarily to promote community welfare; and (vii) acquiring a savings association.
The Gramm-Leach-Bliley Act of 1999 authorizes a bank holding company that meets specified conditions, including depository institutions subsidiaries that are “well capitalized” and “well managed,” to opt to become a “financial holding company.” A “financial holding company” may engage in a broader array of financial activities than permitted a typical bank holding company. Such activities can include insurance underwriting and investment banking. Blue Hills Bancorp, Inc. has not opted for “financial holding company” status up to this time.
Blue Hills Bancorp, Inc. is subject to the Federal Reserve Board’s requirements for bank holding companies. The Dodd-Frank Act directed the Federal Reserve Board to issue consolidated capital requirements for depository institution holding companies that are not less stringent, both quantitatively and in terms of components of capital, than those applicable to institutions themselves. Consolidated regulatory capital requirements identical to those applicable to the subsidiary banks applied to bank holding companies (with greater than $1.0 billion of assets) as of January 1, 2015.
A bank holding company is generally required to give the Federal Reserve Board prior written notice of any purchase or redemption of then outstanding equity securities if the gross consideration for the purchase or redemption, when combined with the net consideration paid for all such purchases or redemptions during the preceding 12 months, is equal to 10% or more of the company’s consolidated net worth. The Federal Reserve Board may disapprove such a purchase or redemption if it determines that the proposal would constitute an unsafe and unsound practice, or would violate any law, regulation, Federal Reserve Board order or directive, or any condition imposed by, or written agreement with, the Federal Reserve Board. The Federal Reserve Board has adopted an exception to that approval requirement for well-capitalized bank holding companies that meet certain other conditions.
The Dodd-Frank Act codified the “source of strength” doctrine. That longstanding policy of the Federal Reserve Board requires bank holding companies to serve as a source of strength to their subsidiary depository institutions by providing capital, liquidity and other support in times of financial stress.
The Federal Reserve Board has issued a policy statement regarding the payment of dividends and the repurchase of shares of common stock by bank holding companies. In general, the policy provides that dividends should be paid only out of current earnings and only if the prospective rate of earnings retention by the holding company appears consistent with the organization’s capital needs, asset quality and overall financial condition. The policy statement also provides for regulatory consultation prior to a holding company paying dividends or redeeming or repurchasing regulatory capital instruments under certain circumstances.
The Federal Deposit Insurance Act makes depository institutions liable to the FDIC for losses suffered or anticipated by the insurance fund in connection with the default of a commonly controlled depository institution or any assistance provided by the FDIC to such an institution in danger of default. That law would have potential applicability if Blue Hills Bancorp, Inc. ever held as a separate subsidiary a depository institution in addition to Blue Hills Bank.
The status of Blue Hills Bancorp, Inc. as a registered bank holding company under the Bank Holding Company Act will not exempt it from certain federal and state laws and regulations applicable to corporations generally, including, without limitation, certain provisions of the federal securities laws.
Change in Control Regulations. Under the Change in Bank Control Act, no person, or group of persons acting in concert, may acquire control of a bank holding company such as the Company unless the Federal Reserve Board has been given 60 days’ prior written notice and not disapproved the proposed acquisition. The Federal Reserve Board considers several factors in evaluating a notice, including the financial and managerial resources of the acquirer and competitive effects. Control, as defined under the applicable regulations, means the power, directly or indirectly, to direct the management or policies of the company or to vote 25% or more of any class of voting securities of the company. Acquisition of more than 10% of any class of a bank holding company’s voting securities constitutes a rebuttable presumption of control under certain circumstances, including where the issuer has registered securities under Section 12 of the Securities Exchange Act of 1934.
35
In addition, federal regulations provide that no company may acquire control (as defined in the Bank Holding Company Act) of a bank holding company without the prior approval of the Federal Reserve Board. Any company that acquires such control becomes a “bank holding company” subject to registration, examination and regulation by the Federal Reserve Board.
Massachusetts Holding Company Regulation. Under Massachusetts banking laws, a company owning or controlling two or more banking institutions, including a savings bank, is regulated as a bank holding company. Each Massachusetts bank holding company: (i) must obtain the approval of the Massachusetts Board of Bank Incorporation before engaging in certain transactions, such as the acquisition of more than 5% of the voting stock of another banking institution; (ii) must register, and file reports, with the Massachusetts Division of Banks; and (iii) is subject to examination by the Division of Banks. Blue Hills Bancorp, Inc. would become a Massachusetts bank holding company if it acquires a second banking institution and holds and operates it separately from Blue Hills Bank.
Federal Securities Laws
Our common stock is registered with the Securities and Exchange Commission under Section 12(b) of the Securities Exchange Act of 1934, as amended. We are subject to information, proxy solicitation, insider trading restrictions, and other requirements under the Exchange Act.
Emerging Growth Company Status
We qualify as an “emerging growth company” under the Jumpstart Our Business Startups Act of 2012. For as long as we are an emerging growth company, we may choose to take advantage of exemptions from various reporting requirements applicable to other public companies but not to emerging growth companies, including, but not limited to, reduced disclosure obligations regarding executive compensation, exemptions from the requirements of holding a nonbinding advisory vote on executive compensation and stockholder approval of any golden parachute payments not previously approved, and an exemption from having outside auditors attest as to our internal control over financial reporting. In addition, emerging growth companies can delay adopting new or revised accounting standards until such time as those standards apply to private companies. We have irrevocably elected not to adopt new or revised accounting standards on a delayed basis, and will be required to adopt new or revised accounting standards in the same manner as other public companies that are not emerging growth companies.
We will be an emerging growth company until the earlier of: (i) December 31, 2019, (ii) the first fiscal year after our annual gross revenues are $1.0 billion or more, (iii) the date on which we have, during the previous three-year period, issued more than $1.0 billion in non-convertible debt securities or (iv) the end of any fiscal year in which the market value of our common stock held by non-affiliates exceeded $700 million as of the end of the second quarter of that fiscal year.
36
TAXATION
Federal Taxation
General. Blue Hills Bank and Blue Hills Bancorp, Inc. are subject to federal and state income taxation in the same general manner as other corporations, with some exceptions discussed below. The following discussion of federal taxation is intended only to summarize material federal income tax matters and is not a comprehensive description of the tax rules applicable to Blue Hills Bancorp, Inc. and Blue Hills Bank.
Tax Reform. On December 22, 2017, President Trump signed into law the Tax Cuts and Jobs Act (the "Act"), which took effect on January 1, 2018. Some notable provisions of the Act include a reduction of the corporate income tax rate from 35% to 21%, 100% bonus depreciation for certain capital expenditures, and a change from a worldwide system with deferral to a territorial tax system, which includes a one-time toll charge on certain undistributed earnings of non-U.S. subsidiaries. The Company is currently evaluating the prospective impact of this new legislation on its consolidated financial statements. The 2017 tax provision included a charge of $2.5 million related to the Act which was enacted on December 22, 2017.
Method of Accounting. For federal income tax purposes, Blue Hills Bank files a consolidated tax return with Blue Hills Bancorp, Inc. and reports its income and expenses on the accrual method of accounting and uses a tax year ending December 31st for filing their consolidated federal income tax returns.
Minimum Tax. The Internal Revenue Code of 1986, as amended, imposes an alternative minimum tax at a rate of 20% on a base of regular taxable income plus certain tax preferences, referred to as “alternative minimum taxable income.” Alternative minimum tax is payable to the extent 20 percent of alternative minimum taxable income is in excess of the regular corporate tax. Net operating losses can, in general, offset no more than 90% of alternative minimum taxable income. The Act repeals the alternative tax regime for taxable years after December 31, 2017. Certain payments of alternative minimum tax may be used as credits against regular tax liabilities in future years or is otherwise refundable. Blue Hills Bancorp, Inc. and Blue Hills Bank have not been subject to the alternative minimum tax and have no such amounts available for credits against regular future tax liabilities.
Net Operating Loss Carryovers. A financial institution may carry back net operating losses incurred prior to January 1, 2018 to the preceding two taxable years and forward to the succeeding 20 taxable years. For losses incurred after December 31, 2018, the Act limits the net operating loss deduction to 80% of taxable income. In addition, the Act eliminates carry back of net operating losses, yet allows unused net operating losses to be carried forward indefinitely. At December 31, 2017, Blue Hills Bancorp, Inc. and Blue Hills Bank had no net operating loss carryforward for federal income tax purposes.
Corporate Dividends. Blue Hills Bancorp, Inc. will be able to exclude from its income 100% of dividends received from Blue Hills Bank as a member of the same affiliated group of corporations.
Audit of Tax Returns. Blue Hills Bancorp, Inc. and Blue Hills Bank’s federal income tax returns, as applicable, have not been audited in the most recent three-year period.
State Taxation
For tax years beginning on or after January 1, 2009, Massachusetts generally requires corporations engaged in a unitary business to calculate their income on a combined basis with corporations which are under common control. Accordingly, Blue Hills Bancorp, Inc. and Blue Hills Bank currently file combined annual income tax returns. A corporation that qualifies, and elects to be treated for purposes of Massachusetts taxation, as a Massachusetts Security Corporation will be excluded from such a combined group.
37
Blue Hills Bank, under current law, files a Massachusetts combined excise tax return with its affiliates who do not qualify as security corporations. During the 2017 tax year, Blue Hills Bank was subject to an annual Massachusetts tax at a rate of 9.0% of its net income, adjusted for certain items. Massachusetts net income is defined as gross income, other than 95% of dividends received in any taxable year beginning on or after January 1, 1999 from or on account of the ownership of any class of stock if the institution owns 15% or more of the voting stock of the institution paying the dividend, less the deductions, but not the credits allowable under the provisions of the Internal Revenue Code, as amended and in effect for the taxable year. The dividends must meet the qualifications under Massachusetts law. Dividends paid to affiliates participating in a combined return will be 100% excluded to the extent paid from earnings and profits of a unitary business included in the Massachusetts combined return. Deductions with respect to the following items, however, shall not be allowed except as otherwise provided: (a) dividends received, except as otherwise provided; (b) losses sustained in other taxable years; (c) taxes on or measured by income, franchise taxes measured by net income, franchise taxes for the privilege of doing business and capital stock taxes imposed by any state; or (d) the deduction allowed by section 168(k) of the Code.
A financial institution or business corporation is generally entitled to special tax treatment as a “security corporation” under Massachusetts law provided that: (a) its activities are limited to buying, selling, dealing in or holding securities on its own behalf and not as a broker; and (b) it has applied for, and received, classification as a “security corporation” by the Commissioner of the Massachusetts Department of Revenue. A security corporation that is also a bank holding company under the Internal Revenue Code must pay a tax equal to 0.33% of its gross income. A security corporation that is not a bank holding company under the Internal Revenue Code must pay a tax equal to 1.32% of its gross income. HP Security Corporation, BH Security Corporation and 1196 Corporation, wholly owned subsidiaries of Blue Hills Bank, are all qualified as a security corporation. As such, they have received security corporation classification by the Massachusetts Department of Revenue; and do not conduct any activities deemed impermissible under the governing statutes and the various regulations, directives, letter rulings and administrative pronouncements issued by the Massachusetts Department of Revenue.
None of the state tax returns of Blue Hills Bank are currently under audit, nor have any of these tax returns been audited during the past five years.
As a Maryland business corporation, Blue Hills Bancorp, Inc. is required to file annual returns and pay annual fees to the State of Maryland.
38
Executive Officers of the Registrant
The executive officers of Blue Hills Bancorp, Inc. are elected annually by the Board of Directors and serve at the Board’s discretion. The following table sets forth the name and position of the executive officers of Blue Hills Bancorp, and their ages as of December 31, 2017.
Name | Age | Positions Held |
William M. Parent | 56 | President and Chief Executive Officer of Blue Hills Bank and Blue Hills Bancorp |
James E. Kivlehan | 57 | Executive Vice President, Consumer and Business Banking |
Lauren B. Messmore | 47 | Executive Vice President, Chief Financial Officer of Blue Hills Bank and Blue Hills Bancorp |
Kevin F. Malone | 58 | Executive Vice President, Commercial Banking |
Robert M. Driscoll | 43 | Executive Vice President, Home Lending |
Thomas R. Sommerfield | 62 | Senior Vice President, Chief Risk Officer |
Below is additional information regarding the executive officers who are not also directors. Unless otherwise stated, each executive officer has held his current position for at least the last three years.
Executive Officers Who Are Not Also Directors:
James E. Kivlehan has been an been an Executive Vice President for Blue Hills Bank since September of 2013. Prior to September of 2017, Mr. Kivlehan was also the Chief Financial Officer of the Bank, in addition to his overall responsibility for the Consumer and Business Banking business. Prior to joining Blue Hills Bank, Mr. Kivlehan was an Executive Vice President, with more than a decade of service, at Citizens Financial Group, Inc. At Citizens he held multiple executive leadership roles spanning Consumer Banking, Strategy, Business Analytics, M&A and Finance. Mr. Kivlehan is an experienced banking executive with an extensive finance background. A graduate of Babson College, he is a non-practicing CPA, the treasurer of the Neponset Valley chamber of commerce, a member of Financial Executives International, and a past president of the Treasurer’s Club of Boston.
Lauren B. Messmore has been Executive Vice President and Chief Financial Officer for Blue Hills Bank since September of 2017. Ms. Messmore has extensive experience in investment banking, including work at a top-tier global investment bank, Citigroup, as well as co-founding and managing an investment banking boutique. She has a proven track record in strategy development and transaction execution across a wide range of industries. A graduate of Harvard College, Ms. Messmore joined Blue Hills Bank in 2012 as Senior Vice President, Corporate Strategy.
Kevin F. Malone has been Executive Vice President of Commercial Banking at Blue Hills Bank since February 27, 2017. He has more than 30 years of banking experience serving different types of customers ranging from New England based middle market and family-owned businesses to national customers in specialized industries. Prior to joining Blue Hills Bank, Mr. Malone served as Market President, Greater Boston and Rhode Island for TD Bank, where he held various leadership positions for 14 years. Mr. Malone served on the board of the Greater Boston YMCA. Mr. Malone is a graduate of the University of Massachusetts.
Robert M. Driscoll has been Executive Vice President of Home Lending at Blue Hills Bank since January of 2017. Mr. Driscoll has been with Blue Hills Bank since 1996 and oversees all home lending department functions including originations, sales and servicing activities at the Bank. He serves on the board of directors for the Massachusetts Community & Banking Council and is a member of the MBA Real Estate Finance Committee. Mr. Driscoll is a graduate of Northeastern University.
39
Thomas R. Sommerfield has been Senior Vice President, Chief Risk Officer at Blue Hills Bank since 2011. Mr. Sommerfield is responsible for the overall risk management of the Bank, including credit, compliance and enterprise risk. Mr. Sommerfield has more than 36 years of experience in the financial services industry, was previously a Director at Spring Street Capital and has held numerous senior lending, credit and risk management roles at CIT, GE Capital, FleetBoston and its predecessors, and HSBC. Mr. Sommerfield is a graduate of Columbia College. He is the leader of the Bank’s Pan-Mass Challenge team and has served on advisory boards of educational institutions and outreach programs and is currently on the board of VETRN, a charity that funds education and provides mentoring for military veterans who are starting new local businesses.
40
ITEM 1A. RISK FACTORS
Our business strategy includes the continuation of significant growth plans. If we fail to grow or fail to manage our growth effectively, our financial condition and results of operations could be negatively affected.
Our strategic plan includes continued asset and deposit growth and increasing the scale of our operations. Specifically, we intend to: increase our residential, commercial business and commercial real estate loans using the lending origination and servicing platform we have built; add origination capacity in our market area and adjacent market areas; expand our branch network through select de novo and acquisition opportunities; and increase fee income, including through the opportunistic acquisition of fee income businesses that complement our current product capabilities while improving the revenue contribution of fee income from existing customers and income from mortgage banking. In addition, we may expand through acquisitions, should appropriate opportunities arise.
The success of our strategic plan will require, among other things, that we continue to leverage our operating costs through increased loan and deposit market share within our current markets and through expansion into new markets, continue to increase our core funding and decrease our reliance on acquisition based pricing, and increase our fee income through increased deposit services, cash management services and mortgage banking. Our ability to continue to grow successfully will depend on several other factors that may not be within our control, including continued favorable market conditions in the communities we serve, the competitive responses from other financial institutions in our market area, and our ability to maintain high asset quality as we increase our portfolio of commercial real estate loans and commercial business loans.
While we believe we have the management resources, operating platform and internal systems in place to successfully manage our growth, growth opportunities and lower cost deposit sources may not be available and we may not be successful in implementing our business strategy. Furthermore, we are a regulated entity and our regulators periodically review and oversee the pace and quality of our growth in assets, liabilities and liquidity. Regulatory authorities may encourage or require faster growing banks to slow the pace of growth and expansion if regulatory concerns develop.
Because we intend to continue to emphasize our commercial real estate and commercial business loan originations, our overall credit risk will increase.
We intend to continue to grow our commercial real estate and commercial business loan portfolio. At December 31, 2017, $1.2 billion or 53.5% of our total loan portfolio consisted of commercial real estate loans (including commercial construction loans) and commercial business loans, compared to $9.2 million, or 3.4% of our total loan portfolio, at December 31, 2011, the time when we commenced our diversification strategy towards commercial lending. Commercial real estate and commercial business loans generally have more risk than the 1-4 family residential real estate loans that we originate. Because the repayment of commercial real estate and commercial business loans depends on the successful management and operation of the borrower’s properties or businesses, repayment of such loans can be affected by adverse conditions in the local real estate market or economy. Commercial real estate and commercial business loans may also involve relatively large loan balances to individual borrowers or groups of related borrowers.
Further, if we foreclose on a commercial real estate or construction loan, our holding period for the collateral may be longer than for 1-4 family residential mortgage loans because there are fewer potential purchasers of the collateral. Accordingly, if we make any errors in judgment in the collectability of our commercial real estate loans, any resulting charge-offs may be larger on a per loan basis than those incurred with our residential or consumer loan portfolios.
Downturns in the local real estate market or economy could adversely affect our earnings.
A downturn in the real estate market or the local economy could adversely affect the value of properties securing the loan or the revenues from the borrower’s business, thereby increasing the risk of nonperforming loans. If the Company is required to liquidate the collateral securing a loan to satisfy the debt during a period of reduced real estate values, its earnings and shareholders’ equity could be adversely affected. The declines in real estate prices in the Company’s markets also may result in increases in delinquencies and losses in its loan portfolios. Unexpected decreases in real estate prices coupled with a prolonged economic recovery and elevated levels of unemployment could drive losses beyond that which is provided for in the Company’s allowance for loan losses. In that event, the Company’s earnings could be adversely affected.
41
Reduced residential mortgage activity in our market would slow our growth and negatively impact our net income.
We have experienced residential mortgage loan growth during recent years and we have increased our residential mortgage loan infrastructure, including hiring lending officers, underwriting and support personnel and opening loan production offices. Our residential mortgage operations provide a material portion of our income and are significantly affected by market interest rates. Additionally, our mortgage lending activity is affected by home purchase and refinance activity. A reduction in mortgage refinance activity and a rising or higher interest rate environment may result in a decrease in residential mortgage loan originations, resulting in slower growth of our residential lending activity and, possibly, a decrease in the size of our residential loan portfolio. Income from secondary market mortgage operations is volatile, and we may incur losses with respect to our secondary mortgage market operations that could negatively affect our earnings. This could result in a decrease in interest income and a decrease in revenues from loan sales. In addition, our results of operations are affected by the amount of noninterest expenses associated with our expanded residential lending platform, such as salaries and commissions, employee benefits, occupancy, equipment, data processing and other operating costs. During periods of reduced residential mortgage loan demand, our results of operations would be adversely affected to the extent that we are unable to reduce expenses commensurate with the decline in mortgage loan origination activity.
Income from secondary mortgage operations is volatile, and we may incur losses with respect to our secondary mortgage market operations.
A key component of our strategy is to increase the extent to which we sell in the secondary market the longer term, conforming fixed-rate 1-4 family residential mortgage loans that we originate, earning non-interest income in the form of gains on sale. Although to date we have generally originated loans for sale on a “best efforts” basis, and we intend to continue selling most loans in the secondary market with limited or no recourse, we are required, and will continue to be required, to give customary representations and warranties to the buyers relating to compliance with applicable law. If we breach those representations and warranties, the buyers will be able to require us to repurchase the loans and we may incur a loss on the repurchase.
In the future, we expect to continue to utilize “best efforts” forward loan sale commitments and begin utilizing mandatory delivery forward loan sale commitments and To Be Announced (“TBA”) Securities, which are sold from approved counterparties to mitigate the risk of potential changes in the values of derivative loan commitments. For TBAs, we intend to sell a security in the open market with a promise to deliver a pool of loans with an aggregate specified principal amount and quality to the investor at a specified point in the future. If we fail to deliver the pool of loans, we will repurchase the security at the market price on the date of repurchase, which could negatively impact our earnings.
Fair value changes in mortgage banking derivatives and commitments to sell fixed-rate 1-4 family residential mortgages subsequent to inception are estimated using anticipated market prices based on pricing indications provided from syndicate banks and consideration of pull-through and fallout rates derived from our internal data and adjusted using management judgment. Fluctuations in interest rates may impact estimated pull-through rates on mortgage originations, which in turn may affect the valuation of forward loan sale commitments, and could negatively affect our earnings.
Changes in the programs offered by secondary market purchasers or our ability to qualify for their programs may reduce our mortgage banking revenues, which would negatively impact our non-interest income.
We generate mortgage revenues primarily from gains on the sale of single-family mortgage loans pursuant to programs currently offered by Fannie Mae, Freddie Mac, Ginnie Mae and non-GSE investors. These entities account for a substantial portion of the secondary market in residential mortgage loans. Any future changes in these programs, our eligibility to participate in such programs, the criteria for loans to be accepted or laws that significantly affect the activity of such entities could, in turn, materially adversely affect our results of operations.
42
The Company's wholesale funding sources may prove insufficient to replace deposits at maturity and support operations and future growth.
The Company must maintain sufficient funds to respond to the needs of depositors and borrowers. As a part of its liquidity management, the Company uses a number of funding sources in addition to deposit growth and cash flows from loans and investments. These sources include Federal Home Loan Bank advances, brokered deposits, proceeds from the sale of loans, and liquidity resources at the holding company. The Company uses brokered deposits both to support ongoing growth and to provide enhanced deposit insurance to support large dollar commercial relationships. The Company's financial flexibility will be severely constrained if the Company is unable to maintain access to wholesale funding or if adequate financing is not available to accommodate future growth at acceptable costs. Finally, if the Company is required to rely more heavily on more expensive funding sources to support future growth, revenues may not increase proportionately to cover costs. In this case, operating margins and profitability would be adversely affected. Turbulence in the capital and credit markets may adversely affect liquidity and financial condition and the willingness of certain counterparties and customers to do business with the Company.
Our branch network expansion strategy may negatively affect our financial performance.
On January 18, 2014, we completed the acquisition of three branches in Nantucket. We also opened de novo branch offices in Milton, Massachusetts in 2014, in University Station in Westwood, Massachusetts in 2015, and in the Boston Seaport District in October 2016. The costs to open the Westwood, Milton and Boston Seaport District de novo branches was $2.2 million, $1.4 million and $1.9 million, respectively, including the costs of construction, equipment, furnishings and technology as well as marketing and promotional expenses associated with the grand opening of the branches. Any future branch expansion strategy may not generate earnings within a reasonable period of time. Numerous factors contribute to the performance of a new or acquired branch, such as a suitable location, qualified personnel, and an effective marketing strategy. Additionally, it takes time for a new branch to generate sufficient favorably priced deposits to produce enough income, including funding loan growth generated by our organization, to offset expenses related to the branch, some of which, like salaries and occupancy expense, are considered fixed costs. At this time we have no immediate plans to open any additional de novo branches although we may continue to expand through acquisition or opening de novo branches in the future.
Changing interest rates may have a negative effect on our results of operations.
Our earnings and cash flows are dependent on our net interest income and income from our mortgage banking operations. Interest rates are highly sensitive to many factors that are beyond our control, including general economic conditions and policies of various governmental and regulatory agencies and, in particular, the Federal Reserve Board. Changes in market interest rates could have an adverse effect on our financial condition and results of operations. If interest rates increase rapidly, we may have to increase the rates we pay on our deposits, particularly our higher-cost money market and time deposits, and the cost of our borrowed funds may increase, more quickly than any changes in interest rates will take effect on our loans and investments, resulting in a negative effect on interest spreads and net interest income. Furthermore, our mortgage banking income varies directly with movements in interest rates, and increases in interest rates could negatively affect our ability to originate loans in the same volumes, and sell loans with attractive pricing, as we have in recent years. Increases in interest rates may also make it more difficult for borrowers to repay adjustable rate loans.
Conversely, should market interest rates fall below current levels, our net interest margin could also be negatively affected if competitive pressures keep us from further reducing rates on our deposits, while the yields on our assets decrease more rapidly through loan prepayments and interest rate adjustments. Decreases in interest rates often result in increased prepayments of loans and mortgage-related securities, as borrowers refinance their loans to reduce borrowings costs. Under these circumstances, we are subject to reinvestment risk to the extent we are unable to reinvest the cash received from such prepayments in loans or other investments that have interest rates that are comparable to the interest rates on existing loans and securities.
43
Changes in interest rates may also decrease fee income generated from our commercial lending operations. We enter into interest rate swap agreements with some of our commercial borrowers (and mirror swap agreements with a third party) that allow the borrower to pay a fixed interest rate on loans that are originated and carried in our loan portfolio as adjustable rate loans. We receive fee income from borrowers for providing this service. Under certain interest rate scenarios, borrowers may choose not to use this service, and our related fee income will decrease. U.S. GAAP also dictates that the Company must mark these contracts to fair value over the life of each swap. As interest rates change, positive and negative credit valuation marks on these contracts are also recorded in the income statement.
See “Management’s Discussion and Analysis of Financial Condition and Results of Operations-Management of Market Risk.”
A worsening of economic conditions could adversely affect our financial condition and results of operations.
During the financial crisis, there were dramatic declines in the housing market, where falling real estate values and increasing foreclosures, unemployment, and under-employment negatively impacted the credit performance of mortgage loans and resulted in significant write-downs of asset values by financial institutions. Our lending business is tied, in large part, to the housing market and real estate markets in general. A return to these conditions or a general decline in economic conditions could result in more limited demand for the construction of new housing, and weakness in home pricing, and could ultimately result in increased delinquencies on our residential real estate loans, commercial real estate loans, commercial business loans, home equity loans and lines of credit and consumer loans. These conditions may also cause a further reduction in loan demand, and increases in our non-performing assets, net charge-offs and provisions for loan losses, as well as adversely affect our liquidity and the willingness of certain counterparties and customers to do business with us. Negative developments in the financial services industry and the domestic and international credit markets may significantly affect the markets in which we do business, the market for and value of our loans and investments, and our ongoing operations, costs and profitability. Moreover, declines in the stock market in general, or stock values of financial institutions and their holding companies specifically, could adversely affect our stock performance.
Strong competition for deposits and lending opportunities within our market areas, as well as competition from non-depository investment alternatives, may limit our growth and profitability.
Competition in the banking and financial services industry is intense. In our market areas, we compete with commercial banks, savings institutions, mortgage brokerage firms, credit unions, finance companies, mutual funds, insurance companies, and brokerage and investment banking firms operating locally and elsewhere. Some of our competitors have greater name recognition and market presence that benefit them in attracting business, and offer certain services that we do not or cannot provide. In addition, larger competitors may be able to price loans and deposits more aggressively than we do, which could affect our ability to grow and to be profitable on a long-term basis. Our profitability depends upon our ability to compete successfully in our market areas. If we must raise interest rates paid on deposits or lower interest rates charged on our loans, our net interest margin and profitability could be adversely affected.
In addition, checking and savings account balances and other forms of deposits can decrease when our deposit customers perceive alternative investments, such as the stock market or other non-depository investments, as providing superior expected returns, or if our customers seek to spread their deposits over several banks to maximize FDIC insurance coverage. Furthermore, technology and other changes have made it more convenient for bank customers to transfer funds into alternative investments, including products offered by other financial institutions or non-bank service providers. Additional increases in short-term interest rates could increase transfers of deposits to higher yielding deposits. Efforts and initiatives we undertake to retain and increase deposits, including deposit pricing, can increase our costs. When bank customers move money out of bank deposits in favor of alternative investments or into higher-yielding deposits, or spread their accounts over several banks, we can lose a relatively inexpensive source of funds, thus increasing our funding costs and reducing our profitability.
44
Financial reform legislation has increased our costs of operations.
The Dodd-Frank Act has significantly changed the regulation of banks and savings institutions and affects the lending, deposit, investment, trading and operating activities of financial institutions and their holding companies. The Dodd-Frank Act requires various federal agencies to adopt a broad range of new implementing rules and regulations, and to prepare numerous studies and reports for Congress. The current administration in Washington indicated they have plans for Dodd-Frank reform, however, we cannot predict the extent to how those changes will impact our business, operations or financial condition. However, compliance with the Dodd-Frank Act and its implementing regulations and policies has already resulted in changes to our business and operations, as well as additional costs, and diverted management’s time from other business activities, which adversely affects our financial condition and results of operations.
The short-term and long-term impact of the changing regulatory capital requirements and new capital rules may adversely affect our returns on equity and our ability to pay dividends or repurchase stock.
In July 2013, the FDIC and the other federal bank regulatory agencies revised their leverage and risk-based capital requirements and the method for calculating risk-weighted assets to make them consistent with agreements that were reached by the Basel Committee on Banking Supervision and certain provisions of the Dodd-Frank Act. Among other things, the rule established a new common equity Tier 1 minimum capital requirement (4.5% of risk-weighted assets), set the leverage ratio at a uniform 4% of total assets, increased the minimum Tier 1 capital to risk-based assets requirement (from 4% to 6% of risk-weighted assets) and assigned a higher risk weight (150%) to certain exposures that are more than 90 days past due or are on nonaccrual status and to certain commercial real estate facilities that finance the acquisition, development or construction of real property. The rule limits a banking organization’s capital distributions and certain discretionary bonus payments to executive officers if the banking organization does not hold a “capital conservation buffer” consisting of 2.50% of common equity Tier 1 capital to risk-weighted assets in addition to the amount necessary to meet its minimum risk-based capital requirements. The final rule became effective January 1, 2015. The “capital conservation buffer” has been phased in beginning on January 1, 2016. It is currently 1.875% and will be fully phased in at 2.50% on January 1, 2019.
The application of these more stringent capital requirements could, among other things, result in lower returns on equity, and result in regulatory actions if we were to be unable to comply with such requirements. Furthermore, the imposition of liquidity requirements in connection with the implementation of Basel III could result in our having to lengthen the term of our funding, restructure our business models, and/or increase our holdings of liquid assets.
Government responses to economic conditions may adversely affect our operations, financial condition and earnings.
We are subject to extensive regulation, supervision and examination by the Massachusetts Commissioner of Banks, the Federal Deposit Insurance Corporation and the Federal Reserve Board. Such regulation and supervision governs the activities in which an institution and its holding company may engage and are intended primarily for the protection of the insurance fund and the depositors and borrowers of Blue Hills Bank rather than for holders of our common stock. Regulatory authorities have extensive discretion in their supervisory and enforcement activities, including the imposition of restrictions on our operations, the classification of our assets and determination of the level of our allowance for loan losses. Any change in such regulation and oversight, whether in the form of regulatory policy, regulations, legislation or supervisory action, may have a material impact on our operations.
Financial reform legislation has changed the bank regulatory framework, created an independent consumer protection bureau that has assumed the consumer protection responsibilities of the various federal banking agencies, and established more stringent capital standards for banks and bank holding companies. The legislation has also resulted in new regulations affecting the lending, funding, trading and investment activities of banks and bank holding companies. Bank regulatory agencies also have been responding aggressively to concerns and adverse trends identified in examinations. Ongoing uncertainty regarding the effect of new legislation and regulatory actions may adversely affect our operations by restricting our business activities, including our ability to originate or sell loans, modify loan terms, or foreclose on property securing loans. These measures are likely to increase our costs of doing business and may have a significant adverse effect on our lending activities, financial performance and operating flexibility. In addition, these risks could affect the performance and value of our loan and investment securities portfolios, which also would negatively affect our financial performance.
In addition, there have been proposals made by members of Congress and others that would reduce the amount distressed borrowers are otherwise contractually obligated to pay under their mortgage loans and limit an institution’s ability to foreclose on mortgage collateral. Were proposals such as these, or other proposals limiting our rights as a creditor, to be implemented, we could experience increased credit losses or increased expense in pursuing our remedies as a creditor.
45
Non-compliance with the USA PATRIOT Act, Bank Secrecy Act, or other laws and regulations could result in fines or sanctions and restrictions on conducting acquisitions or establishing new branches.
The USA PATRIOT and Bank Secrecy Acts require financial institutions to develop programs to prevent financial institutions from being used for money laundering and terrorist activities. If such activities are detected, financial institutions are obligated to file suspicious activity reports with the U.S. Treasury’s Office of Financial Crimes Enforcement Network. These rules require financial institutions to establish procedures for identifying and verifying the identity of customers seeking to open new financial accounts. Failure to comply with these regulations could result in fines or sanctions, and restrictions on conducting acquisitions or establishing new branches. During the last year, several banking institutions have received large fines for non-compliance with these laws and regulations. The policies and procedures we have adopted that are designed to assist in compliance with these laws and regulations may not be effective in preventing violations of these laws and regulations.
for purposes of its regulations.
Changes in the valuation of our securities portfolio could adversely affect us.
As of December 31, 2017, our investment securities portfolio, which includes government agency, mortgage-backed
securities, and marketable equity securities totaled $313.4 million, or 11.7% of our total assets. Our securities portfolio may be impacted by fluctuations in market value, potentially reducing earnings. Fluctuations in market value may be caused by changes in market interest rates, lower market prices for securities and limited investor demand. Management evaluates securities for other-than-temporary impairment on a quarterly basis, with more frequent evaluation for selected issues. In analyzing a debt issuer’s financial condition, management considers whether the securities are issued by the federal government or its agencies, whether downgrades by bond rating agencies have occurred, industry analysts’ reports and, to a lesser extent given the relatively insignificant levels of depreciation in our debt portfolio, spread differentials between the effective rates on instruments in the portfolio compared to risk-free rates. Changes in interest rates can also have an adverse effect on our financial condition, as our available-for-sale securities are reported at their estimated fair value, and therefore are impacted by fluctuations in interest rates. The declines in fair value could result charges to earnings that could have a material adverse effect on our net income and capital levels.
We may be adversely affected by recent changes in U.S. tax laws.
Changes in tax laws contained in the Tax Cuts and Jobs Act, which was enacted in December 2017, include a number of provisions that will have an impact on the banking industry, borrowers and the market for single-family residential real estate. Changes include (i) a lower limit on the deductibility of mortgage interest on single-family residential mortgage loans, (ii) the elimination of interest deductions for certain home equity loans, (iii) a limitation on the deductibility of business interest expense and (iv) a limitation on the deductibility of property taxes and state and local income taxes.
The recent changes in the tax laws may have an adverse effect on the market for, and valuation of, residential properties, and on the demand for such loans in the future, and could make it harder for borrowers to make their loan payments. In addition, these recent changes may also have a disproportionate effect on taxpayers in states with high residential home prices and high state and local taxes. If home ownership becomes less attractive, demand for mortgage loans could decrease. The value of the properties securing loans in our loan portfolio may be adversely impacted as a result of the changing economics of home ownership, which could require an increase in our provision for loan losses, which would reduce our profitability and could materially adversely affect our business, financial condition and results of operations.
If our allowance for loan losses is not sufficient to cover actual loan losses, our earnings will decrease.
We make various assumptions and judgments about the collectability of our loan portfolio, including the creditworthiness of our borrowers and the value of the real estate and other assets serving as collateral for the repayment of many of our loans. In determining the amount of the allowance for loan losses, we review our loans and our loss and delinquency experience, and we evaluate economic conditions. If our assumptions are incorrect, our allowance for loan losses may not be sufficient to cover probable incurred losses in our loan portfolio, resulting in additions to our allowance. Material additions to our allowance could materially decrease our net income. Furthermore, our strategic plan envisages significant growth in lending, which will require additional provisions for loan losses and reduce our earnings in the short term. In addition, bank regulators periodically review our allowance for loan losses and may require us to increase our allowance for loan losses or recognize further loan charge-offs. Any increase in our allowance for loan losses or loan charge-offs as required by these regulatory authorities might have a material adverse effect on our financial condition and results of operations.
46
The Financial Accounting Standards Board ("FASB") has adopted Accounting Standard Update ("ASU") 2016-13, which will be effective in the first quarter of 2020. This standard, often referred to as “CECL” (reflecting a current expected credit loss model), will require companies to recognize an allowance for credit losses based on estimates of losses expected to be realized over the contractual lives of the loans. Under current U.S. GAAP, companies generally recognize credit losses only when it is probable that a loss has been incurred as of the balance sheet date. This new standard will require us to collect and review increased types and amounts of data for us to determine the appropriate level of the allowance for loan losses, and may require us to increase our allowance for loan losses. Any increase in our allowance for loan losses or expenses may have a material adverse effect on our financial condition and results of operations. We are actively working through the provisions of the Update. Management has established a steering committee which has identified the methodologies and the additional data requirements necessary to implement the Update and has engaged a third-party software service provider to assist in the Company's implementation.
Changes in our accounting policies or in accounting standards could materially affect how we report our financial condition and results of operations.
Our accounting policies are essential to understanding our financial condition and results of operations. Some of these policies require the use of estimates and assumptions that may affect the value of our assets or liabilities and financial results. Some of our accounting policies are critical because they require management to make difficult, subjective, and complex judgments about matters that are inherently uncertain, and because it is likely that materially different amounts would be reported under different conditions or using different assumptions. If such estimates or assumptions underlying our financial statements are incorrect, we may experience material losses.
From time to time, the Financial Accounting Standards Board and the Securities and Exchange Commission change the financial accounting and reporting standards or the interpretation of those standards that govern the preparation of our financial statements. These changes are beyond our control, can be hard to predict and could materially affect how we report our financial condition and results of operations. We could also be required to apply a new or revised standard retroactively, which may result in our restating our prior period financial statements.
In January 2016, FASB issued ASU 2016-01, Financial Instruments – Overall, (Subtopic 825-10). The amendments in this Update address certain aspects of recognition, measurement, presentation, and disclosure of financial instruments. Targeted improvements to generally accepted accounting principles include the requirement for equity investments (except those accounted for under the equity method of accounting or those that result in consolidation of the investee) to be measured at fair value with changes in fair value recognized in net income and the elimination of the requirement for public business entities to disclose the methods and significant assumptions used to estimate the fair value for financial instruments measured at amortized cost. For public business entities, the amendments in this Update are effective for fiscal years beginning after December 15, 2017, including interim periods within those fiscal years. The impact of the change, if applied, to the Company's equity investments for the year ended December 31, 2017, would have resulted in a gain of $1.7 million (pre-tax) being recognized in net income, after reclassification for the realized loss on mutual funds.
47
Technological advances impact our business.
The banking industry is undergoing technological changes with frequent introductions of new technology-driven products and services. In addition to improving customer services, the effective use of technology increases efficiency and enables financial institutions to reduce costs provided that they produce economies of scale and deploy technology in a safe and sound manner. Our future success will depend, in part, on our ability to address the needs of our customers by using technology to provide products and services that will satisfy customer demands for convenience as well as to create additional efficiencies in operations. Many competitors have substantially greater resources to invest in technological improvements and greater scale of operations to spread the costs of improvement over, creating a competitive advantage. We may not be able to effectively implement new technology-driven products and services or successfully market such products and services to a large enough number of customers to cover the up-front costs of implementation and ongoing costs to operate.
Our information systems may experience an interruption or breach in security.
We rely heavily on communications and information systems to conduct our business including systems operated by third party vendors. For example, we rely extensively on our core processing vendor for our informational management systems. Any failure, interruption, or breach in security or operational integrity of these systems could result in failures or disruptions in our customer relationship management, general ledger, deposit, loan, and other systems. While we have policies and procedures designed to prevent or limit the effect of the failure, interruption, or security breach of our information systems, we cannot assure you that any such failures, interruptions, or security breaches will not occur or, if they do occur, that they will be adequately rectified. The occurrence of any failures, interruptions, or security breaches of our information systems could damage our reputation, result in a loss of customer business, cause us to incur costs of rectification, subject us to additional regulatory scrutiny, or expose us to civil litigation and possible financial liability, any of which could have a material adverse effect on our financial condition and results of operations.
Evolving information technologies, the need to mitigate against and react to cyber-security risks and electronic fraud risks require significant resources and notwithstanding our investment in resources, we remain subject to cyber security risks and electronic fraud.
The Company needs to invest in information technology to keep pace with technology changes, and while the Company invests amounts it believes will be adequate, it may fail to invest adequate amounts such that the efficiency of information technology systems fails to meet operational needs. The risk of electronic fraudulent activity within the financial services industry, especially in the commercial banking sector due to cyber attacks (crime committed through or involving the internet (phishing, hacking, denial of service attacks, stealing information, unauthorized intrusions into internal systems or the systems of the Company's third party vendors)) could adversely impact the Company’s operations or damage its reputation. The Company's information technology infrastructure and systems may be vulnerable to cyber terrorism, computer viruses, system failures and other intentional or unintentional interference, fraud and other unauthorized attempts to access or interfere with the systems. A breach of our security controls and the occurrence of one or more of these incidents could have a material adverse effect on the Company's reputation, business, financial condition or results of operations. Further, any such occurrences could result in regulatory actions (including fines), litigation, unexpected costs and expenses, third-party damages or other loss or liabilities, any of which could have a material adverse effect on the results of operations or financial condition.
Our performance depends on key personnel.
Our performance depends largely on the efforts and abilities of our senior officers. Our business model depends on the experience and expertise of our senior management team and lending staff. Several of these individuals have been involved in the banking business for much of their professional careers. Our performance will also depend upon our ability to attract and retain additional qualified management and banking personnel. There can be no assurances that our management team will be able to manage our operations or our expected growth or that we will be able to attract and retain additional qualified personnel as needed in the future. The loss of any officer could adversely affect us. We do not currently maintain “key man” life insurance on any of our officers.
48
Impairment of goodwill could require charges to earnings, which could result in a negative impact on our results of operations.
Goodwill arises when a business is purchased for an amount greater than the fair market value of its net assets. We recognized goodwill as an asset on our balance sheet in connection with our acquisition of three branches in Nantucket in January 2014. We evaluate goodwill for impairment at least annually. A significant decline in our expected future cash flows, a significant adverse change in the business climate, slower growth rates or other factors could result in impairment of goodwill. If we were to conclude that a future write-down of goodwill was necessary, then we would record the appropriate charge to earnings, which could be materially adverse to our results of operations and financial position.
ITEM 1B. UNRESOLVED STAFF COMMENTS
Not applicable.
49
ITEM 2. | PROPERTIES |
At December 31, 2017, we operate from our eleven full-service banking offices, including our main office, located in Boston, Dedham, Hyde Park, Milton, Nantucket, Norwood, West Roxbury, and Westwood, Massachusetts. The net book value of our premises, land and equipment was $21.6 million at December 31, 2017.
The following table sets forth information with respect to our full service banking offices, including the expiration date of leases with respect to leased facilities.
Office Name and Address | Leased or Owned | Year Acquired or Leased | Month of lease expiration | |||
Full Service Banking Offices: | ||||||
Blue Hills Bank – River Street (Main Office) 1196 River Street Hyde Park, MA 02136 | Owned (1) | 1871 | ||||
Blue Hills Bank – Truman 1065 Truman Parkway Hyde Park, MA 02136 | Owned/ Leased (2) | 1977 | March 2021 | |||
Blue Hills Bank – Dedham 749 Providence Highway Dedham, MA 02026 | Leased | 1988 | May 2023 | |||
Blue Hills Bank – Norwood 111 Lenox Street Norwood, MA 02062 | Leased | 1998 | October 2020 | |||
Blue Hills Bank – West Roxbury 1920 Centre Street West Roxbury, MA 02132 | Leased | 2004 | February 2019 | |||
Blue Hills Bank – Westwood 171 University Avenue Westwood, MA 02090 | Owned/ Leased (2) | 2015 | May 2030 | |||
Blue Hills Bank – Milton 480 Adams Street Milton, MA 02186 | Leased | 2014 | September 2024 | |||
Blue Hills Bank – Seaport District 87 Seaport Boulevard Boston, MA 02210 | Leased | 2016 | September 2026 | |||
Nantucket Bank – Pleasant Street 104 Pleasant Street Nantucket, MA 02554 | Owned | 2014 | ||||
Nantucket Bank – Orange Street 2 Orange Street Nantucket, MA 02554 | Owned | 2014 | ||||
Nantucket Bank – Amelia Drive 1 Amelia Drive Nantucket, MA 02554 | Owned | 2014 | ||||
_________________________ (1) We lease 1,500 square feet of additional office space adjacent to this location at 1202 River Street. This lease expires in March 2018. (2) This office building is owned and located on land that is leased. | ||||||
50
The following table sets forth information with respect to loan production and administrative offices, including the expiration date of leases with respect to leased facilities.
Office Name and Address | Leased or Owned | Year Acquired or Leased | Month of lease expiration | |||
Administrative and Other Facilities: | ||||||
Blue Hills Bank 81 Newbury St., 2nd Floor Boston, MA 02115 | Leased | 2014 | March 2018(2) | |||
Blue Hills Bank 10 Cordage Park Circle, Suite 222 Plymouth, MA 02360 | Leased | 2014 | December 2020 | |||
Blue Hills Bank 186 Concord Avenue Cambridge, MA 02138 | Leased | 2015 | September 2018 | |||
Blue Hills Bank 470 King Street Franklin, MA 02038 | Leased | 2016 | February 2026 | |||
Blue Hills Bank 48 Mount Vernon Street, 3rd Floor Winchester, MA 01890 | Leased | 2016 | April 2018 | |||
Blue Hills Bank 65 South Street, 2nd Floor Hingham, MA 02043 | Leased | 2016 | August 2021 | |||
Blue Hills Bank 45 Walden Street Unit 1F Concord, MA 01742 | Leased | 2016 | October 2019 | |||
Blue Hills Bank 16 Stedman Street, Unit 4 Lowell, MA 01851 | Leased | 2016 | December 2018 | |||
Blue Hills Bank 191A Chandler Road, Suite 2 Andover, MA 01810 | Leased | 2017 | August 2018 | |||
Blue Hills Bank (1) 134 Washington Street, Unit 4 Marblehead, MA 01945 | Leased | 2018 | December 2020 | |||
500 River Ridge Drive, Suite 300 Norwood, MA 02062 | Leased | 2016 | March 2027 | |||
9 Bayberry Court Nantucket, MA 02554 | Owned | 2014 | ||||
3 Madison Court Nantucket, MA 02554 | Owned | 2014 | ||||
_________________________ (1) The lease for this property was signed in 2017, effective January 2018. The location is expected to open in the first quarter of 2018. (2) The Company does not plan to renew this lease in 2018. | ||||||
The administrative offices located at 500 River Ridge Drive, Norwood, Massachusetts are Blue Hills Bancorp’s corporate headquarters and house several of our back-office functions. The administrative offices located at 9 Bayberry Court, Nantucket, include four condominium units that are used for employee housing and office space. The property located at 3 Madison Court, Nantucket consists of a two-unit building used for employee housing. We rent units to certain employees in Nantucket at below-market rates in order to help attract and retain banking staff.
51
ITEM 3. | LEGAL PROCEEDINGS |
We are not involved in any material pending legal proceedings as a plaintiff or a defendant other than routine legal proceedings occurring in the ordinary course of business. We are not involved in any legal proceedings the outcome of which we believe would be material to our financial condition or results of operations.
On December 30, 2014, a former employee filed a complaint in U.S. Federal District Court of Massachusetts, claiming wrongful termination following a whistleblower claim. This complaint alleged violations of the Federal Deposit Insurance Act, the False Claims Act, and the Family and Medical Leave Act (FMLA). The former employee withdrew all of his claims after reaching a confidential settlement agreement in January of 2018. Both parties provided mutual releases of all claims and have executed a confidentiality agreement. All costs related to the case were reflected in the consolidated statements of net income as of December 31, 2017.
ITEM 4. MINE SAFETY DISCLOSURES
Not Applicable.
ITEM 5. | MARKET FOR REGISTRANT’S COMMON EQUITY, RELATED STOCKHOLDER MATTERS AND ISSUER PURCHASES OF EQUITY SECURITIES |
Market Information and Holders
The Company’s shares of common stock are traded on the NASDAQ Global Market under the symbol “BHBK”. The approximate number of shareholders of record of the Company’s common stock as of February 28, 2018 was 3,778
The Company's stock commenced trading on July 22, 2014. The following table sets forth for the periods indicated the intra-day high and low sales prices per share of common stock as reported by NASDAQ. The Company declared its first dividend in the third quarter of 2015. See “Dividends” below.
2017 | High | Low | Dividends Declared | ||||||
Fourth quarter | $ | 22.05 | $ | 19.25 | $ | 0.15 | |||
Third quarter | 19.75 | 17.65 | 0.15 | ||||||
Second quarter | 19.35 | 17.35 | 0.25(1) | ||||||
First quarter | 19.73 | 16.40 | 0.05 | ||||||
2016 | High | Low | Dividends Declared | ||||||
Fourth quarter | $ | 19.00 | $ | 14.51 | $ | 0.03 | |||
Third quarter | 15.09 | 13.78 | 0.03 | ||||||
Second quarter | 14.96 | 13.36 | 0.03 | ||||||
First quarter | 15.51 | 13.22 | 0.02 | ||||||
(1) Includes a $0.05 regular quarterly cash dividend, and a $0.20 special dividend | |||||||||
52
Dividends
The Company’s Board of Directors has the authority to declare dividends on our shares of common stock, subject to statutory and regulatory requirements. In determining whether to pay a cash dividend and the amount of such cash dividend, the Board of Directors takes into account a number of factors, including capital requirements, our consolidated financial condition and results of operations, tax considerations, statutory and regulatory limitations and general economic conditions. No assurances can be given that any dividends will be paid or that, if paid, will not be reduced or eliminated in the future. Special cash dividends, stock dividends or returns of capital, to the extent permitted by applicable law, may be paid in addition to, or in lieu of, regular cash dividends. Blue Hills Bancorp, Inc. files a consolidated tax return with Blue Hills Bank. Accordingly, it is anticipated that any cash distributions made by us to our stockholders would be treated as cash dividends and not as a non-taxable return of capital for federal and state tax purposes.
The Federal Reserve Board has issued a policy statement regarding the payment of dividends by bank holding companies. In general, the policy provides that dividends should be paid only out of current earnings and only if the prospective rate of earnings retention by the holding company appears consistent with the organization’s capital needs, asset quality and overall financial condition. In addition, the Federal Reserve Board has established requirements with respect to the maintenance of appropriate levels of capital by registered bank holding companies. These regulatory policies and requirements could affect the ability of Blue Hills Bancorp to pay dividends. See “Regulation and Supervision-Holding Company Regulation.”
Pursuant to its articles of incorporation, Blue Hills Bancorp, Inc. is authorized to issue preferred stock. If Blue Hills Bancorp, Inc. issues preferred stock, the holders thereof may have a priority over the holders of our shares of common stock with respect to the payment of dividends. Initially, dividends Blue Hills Bancorp, Inc. can declare and pay will depend upon the net proceeds retained from the stock offering and the earnings received from the investment of those proceeds.
Massachusetts banking law and Federal Deposit Insurance Corporation regulations impose limitations on capital distributions by savings institutions. See “Regulation and Supervision-Massachusetts Banking Laws and Supervision-Dividends.”
Any payment of dividends by Blue Hills Bank to Blue Hills Bancorp, Inc. that would be deemed to be drawn out of Blue Hills Bank’s bad debt reserves, if any, would require a payment of taxes at the then-current tax rate by Blue Hills Bank on the amount of earnings deemed to be removed from the reserves for such distribution. See “Regulation and Supervision-Federal Regulation-Capital Distributions.” Blue Hills Bank does not intend to make any distribution to Blue Hills Bancorp, Inc. that would create such a federal tax liability. See “Taxation-Federal Taxation” and “-State Taxation.”
Recent Sales of Unregistered Securities; Use of Proceeds from Registered Securities
Not Applicable.
53
Securities Authorized for Issuance under Equity Compensation Plans
Set forth below is information as of December 31, 2017 with respect to compensation plans (other than our employee stock ownership plan) under which equity securities of the Registrant are authorized for issuance. Additional information regarding stock-based compensation plans is presented in Note 11 – Stock Based Compensation in the notes to consolidated financial statements included in Item 8. Financial Statements and Supplementary Data located elsewhere in this report.
Equity Compensation Plan Information | |||||||
Number of Securities to Be Issued Upon Exercise of Outstanding Options, Warrants and Rights | Weighted-average Exercise Price of Outstanding Options, Warrants and Rights(1) | Number of Securities Remaining Available for Future Issuance Under Share-based Compensation Plans (excluding securities reflected in first column) | |||||
Equity compensation plans approved by security holders | 2,684,650 | $ | 14.70 | 178,151 | |||
Equity compensation plans not approved by security holders | — | $ | — | — | |||
(1) Reflects weighted average price of stock options only.
Purchases of Equity Securities by the Issuer and Affiliated Purchases
There were no purchases made by or on behalf of the Company during the year ended December 31, 2017.
54
Stock Performance Graph
The Company’s shares of common stock began trading on the NASDAQ Global Market on July 22, 2014. Accordingly, no comparative stock performance information is available prior to this date. The performance graph below compares the Company’s cumulative shareholder return on its common stock since the inception of trading on July 22, 2014 to the cumulative total return of the Russell 2000 index of small capitalization companies and the SNL Thrift Composite comprising thrifts with total assets of $1.0 billion to $5.0 billion. The initial offering price of the Company's shares was $10.00 per share, however the graph below depicts the cumulative return on the stock since inception of trading at $12.38 per share on July 22, 2014. Total shareholder return is measured by dividing total dividends (assuming dividend reinvestment) for the measurement period plus share price change for the period by the share price at the beginning of the measurement period. The return is based on an initial investment of $100.00.
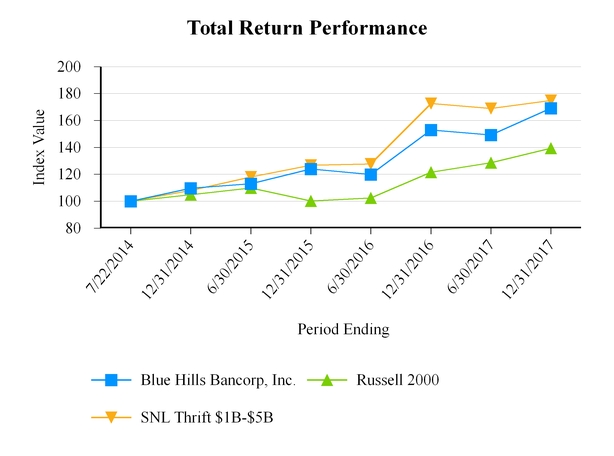
Period Ending | ||||||||||||||||
Index | 7/22/2014 | 12/31/2014 | 6/30/2015 | 12/31/2015 | 6/30/2016 | 12/31/2016 | 6/30/2017 | 12/31/2017 | ||||||||
Blue Hills Bancorp, Inc. | 100.00 | 109.69 | 113.09 | 123.99 | 119.96 | 152.94 | 149.24 | 169.14 | ||||||||
Russell 2000 | 100.00 | 104.85 | 109.84 | 100.22 | 102.44 | 121.58 | 128.53 | 139.39 | ||||||||
SNL Thrift $1B-$5B | 100.00 | 107.95 | 118.00 | 126.72 | 127.59 | 172.72 | 168.98 | 174.94 | ||||||||
55
ITEM 6. SELECTED CONSOLIDATED FINANCIAL AND OTHER DATA
The information at December 31, 2017 and 2016 and for the years ended December 31, 2017, 2016 and 2015 is derived in part from, and should be read together with, the audited consolidated financial statements and notes thereto included in this Annual Report on Form 10-K. The information at December 31, 2015, 2014 and 2013 and for the years ended December 31, 2014 and 2013 is derived in part from audited consolidated financial statements that are not included in this Annual Report on Form 10-K. For the below stated performance ratios, interest income on tax-exempt securities and loans has been adjusted to a fully taxable-equivalent (FTE) basis using a federal statutory tax rate of 35% for the years ended December 31, 2017 and 2016. A statutory rate of 34% was used for the years ended December 31, 2015, 2014, and 2013.
The following table sets forth selected financial data and other data for the Company.
At December 31, | |||||||||||||||||||
2017 | 2016 | 2015 | 2014 | 2013 | |||||||||||||||
(In thousands) | |||||||||||||||||||
Selected Financial Condition Data: | |||||||||||||||||||
Total assets | $ | 2,668,520 | $ | 2,469,692 | $ | 2,114,343 | $ | 1,728,148 | $ | 1,314,287 | |||||||||
Securities | 313,436 | 405,863 | 431,831 | 416,447 | 441,306 | ||||||||||||||
Loans receivable, net | 2,186,147 | 1,912,871 | 1,523,275 | 1,132,914 | 764,582 | ||||||||||||||
Deposits | 2,039,869 | 1,808,687 | 1,433,849 | 1,212,716 | 915,223 | ||||||||||||||
Borrowings | 205,000 | 251,000 | 260,000 | 75,000 | 215,000 | ||||||||||||||
Total equity | 397,806 | 386,907 | 398,829 | 411,606 | 171,534 | ||||||||||||||
Years Ended December 31, | |||||||||||||||||||
2017 | 2016 | 2015 | 2014 | 2013 | |||||||||||||||
(Dollars in thousands, except per share data) | |||||||||||||||||||
Selected Operating Data: | |||||||||||||||||||
Interest and dividend income | $ | 84,775 | $ | 69,538 | $ | 58,301 | $ | 49,275 | $ | 33,092 | |||||||||
Interest expense | 17,738 | 12,576 | 8,744 | 6,898 | 7,971 | ||||||||||||||
Net interest and dividend income | 67,037 | 56,962 | 49,557 | 42,377 | 25,121 | ||||||||||||||
Provision for loan losses | 2,098 | 4,885 | 4,090 | 3,381 | 4,094 | ||||||||||||||
Net interest and dividend income, after provision for loan losses | 64,939 | 52,077 | 45,467 | 38,996 | 21,027 | ||||||||||||||
Realized securities gains and impairment losses, net | 5,853 | 1,280 | 1,968 | 2,515 | 4,999 | ||||||||||||||
Other noninterest income | 11,229 | 10,847 | 6,711 | 7,092 | 8,012 | ||||||||||||||
Total noninterest income | 17,082 | 12,127 | 8,679 | 9,607 | 13,011 | ||||||||||||||
Noninterest expenses | 54,306 | 51,746 | 44,082 | 49,408 | 31,659 | ||||||||||||||
Income (loss) before income taxes | 27,715 | 12,458 | 10,064 | (805 | ) | 2,379 | |||||||||||||
Provision (benefit) for income taxes | 11,226 | 3,805 | 2,837 | (622 | ) | (284 | ) | ||||||||||||
Net income (loss) | $ | 16,489 | $ | 8,653 | $ | 7,227 | $ | (183 | ) | $ | 2,663 | ||||||||
Earnings per common share: | |||||||||||||||||||
Basic | $ | 0.69 | $ | 0.35 | $ | 0.28 | N/A | N/A | |||||||||||
Diluted | $ | 0.67 | $ | 0.35 | $ | 0.28 | N/A | N/A | |||||||||||
Weighted average shares outstanding: | |||||||||||||||||||
Basic | 23,985,822 | 24,420,405 | 26,064,947 | N/A | N/A | ||||||||||||||
Diluted | 24,482,414 | 24,540,929 | 26,069,589 | N/A | N/A | ||||||||||||||
56
At or For the Years Ended December 31, | ||||||||||||||||||
2017 | 2016 | 2015 | 2014 | 2013 | ||||||||||||||
Selected Financial Ratios and Other Data: | ||||||||||||||||||
Performance Ratios: | ||||||||||||||||||
Return on average assets (ratio of net income (loss) to average assets) | 0.65 | % | 0.39 | % | 0.39 | % | (0.01 | )% | 0.22 | % | ||||||||
Return on average equity (ratio of net income (loss) to average equity) | 4.14 | 2.20 | 1.76 | (0.07 | ) | 1.52 | ||||||||||||
Dividend payout ratio (dividends declared/earnings per share) | 89.55 | 31.43 | 14.29 | N/A | N/A | |||||||||||||
Interest rate spread (1) | 2.57 | 2.51 | 2.65 | 2.67 | 2.12 | |||||||||||||
Net interest margin (2) | 2.77 | 2.68 | 2.83 | 2.81 | 2.24 | |||||||||||||
Efficiency ratio (3) | 65.00 | 75.00 | 76.00 | 95.00 | 83.02 | |||||||||||||
Noninterest expense to average total assets | 2.15 | 2.31 | 2.38 | 3.07 | 2.65 | |||||||||||||
Average interest-earning assets to average interest-bearing liabilities | 127.63 | 129.17 | 137.29 | 129.81 | 117.24 | |||||||||||||
Average equity to average total assets | 15.75 | 17.53 | 22.20 | 17.41 | 14.68 | |||||||||||||
Asset Quality Ratios: | ||||||||||||||||||
Non-performing assets to total assets | 0.43 | % | 0.36 | % | 0.51 | % | 0.26 | % | 0.13 | % | ||||||||
Non-performing loans to total loans | 0.52 | 0.47 | 0.70 | 0.39 | 0.23 | |||||||||||||
Allowance for loan losses to non-performing loans | 181 | 209 | 159 | 290 | 555 | |||||||||||||
Allowance for loan losses to total loans | 0.95 | 0.97 | 1.11 | 1.13 | 1.25 | |||||||||||||
Consolidated Capital Ratios: | ||||||||||||||||||
Total capital to risk-weighted assets | 19.7 | % | 20.5 | % | 24.8 | % | 32.6 | % | 19.8 | % | ||||||||
Tier 1 capital to risk-weighted assets | 18.7 | 19.5 | 23.8 | 31.5 | 18.5 | |||||||||||||
Common equity Tier 1 to risk-weighted assets | 18.7 | 19.5 | 23.8 | N/A | N/A | |||||||||||||
Tier 1 capital to average assets | 14.9 | 16.0 | 19.6 | 23.3 | 13.2 | |||||||||||||
Book value per share | $ | 14.83 | $ | 14.46 | $ | 14.00 | $ | 14.46 | N/A | |||||||||
Tangible book value per share | $ | 14.47 | $ | 14.06 | $ | 13.58 | $ | 13.99 | N/A | |||||||||
Capital Ratios for the Bank: | ||||||||||||||||||
Total capital to risk-weighted assets | 16.4 | % | 16.3 | % | 18.1 | % | 22.7 | % | 16.6 | % | ||||||||
Tier 1 capital to risk-weighted assets | 15.4 | 15.3 | 17.1 | 21.6 | 15.3 | |||||||||||||
Common equity Tier 1 to risk-weighted assets | 15.4 | 15.3 | 17.1 | N/A | N/A | |||||||||||||
Tier 1 capital to average assets | 12.3 | 12.5 | 14.0 | 15.9 | 11.1 | |||||||||||||
Other Data: | ||||||||||||||||||
Number of full service offices | 11 | 12 | 11 | 10 | 6 | |||||||||||||
Number of full time equivalent employees | 237 | 228 | 209 | 202 | 147 | |||||||||||||
_______________________
(1) | The average interest rate spread represents the difference between the weighted-average yield on interest-earning assets and the weighted average cost of interest-bearing liabilities for the period. |
(2) | The net interest margin represents net interest income as a percent of average interest-earning assets for the period on a fully taxable-equivalent (FTE) basis. |
(3) | The efficiency ratio represents noninterest expense divided by the sum of net interest income and noninterest income, including gains on securities available for sale, net. |
57
ITEM 7. | MANAGEMENT’S DISCUSSION AND ANALYSIS OF FINANCIAL CONDITION AND RESULTS OF OPERATIONS |
The objective of this section is to help readers understand our views on our results of operations and financial condition. You should read this discussion in conjunction with the consolidated financial statements and notes to the consolidated financial statements that appear elsewhere in this Annual Report.
Overview
Our results of operations depend primarily on interest and dividend income from our loans and investment securities, net of interest expense from our deposits and wholesale funding. Net interest and dividend income is the difference between (1) the interest and dividend income we earn on our interest-earning assets, consisting primarily of loans, investment securities and other interest-earning assets, and (2) the interest we pay on our interest-bearing liabilities, consisting primarily of deposits (including NOW accounts, regular savings accounts, money market accounts, certificates of deposit and brokered deposits), and Federal Home Loan Bank of Boston advances.
Our results of operations also are affected by the provision for loan losses, noninterest income and noninterest expense. Noninterest income currently consists primarily of deposit account fees, interchange and ATM fees, mortgage banking revenue, loan level derivative income, gains or losses on the sale of investment securities, income derived from bank-owned life insurance, and other income sources. Noninterest expense currently consists primarily of salaries and employee benefits, occupancy and equipment expenses, data processing, professional fees, advertising expenses, FDIC insurance premiums, and other operating expenses. Our results of operations also may be affected significantly by general and local economic and competitive conditions, changes in market interest rates, governmental policies and actions of regulatory authorities.
In 2010, the Company embarked on a change in our strategic direction designed to transform our Bank into a full-service community bank with a full complement of retail and commercial loan and deposit products. The change in strategic direction involved the hiring of a new senior management team with experience in the areas of operations which the Bank planned to expand, including officers and personnel with commercial real estate and commercial business lending and underwriting experience, as well as operations, and risk management personnel. Many members of the new management team have significant employment and advisory experience with larger commercial banking institutions. In addition to the new executive management team, other personnel were hired to effect the change in strategic direction, which has increased the size of our operations and infrastructure. Our employee base has more than doubled from the end of 2010 to 237 full-time equivalent employees at December 31, 2017.
The result of these efforts is a more diversified company across all aspects of operations, assets and funding sources. Our lending platforms for mortgage banking, commercial real estate, and commercial business are fully in place with scalable capacity. We have the capabilities to meet the need of commercial and retail customers through a technology infrastructure that offers multiple delivery channels and a full array of competitive functionality.
Our loan and deposit product lines, the overall size of our operations and the diversification of our asset base, including residential, commercial real estate and commercial business lending activity have increased significantly. From December 31, 2011 to December 31, 2017, our assets have grown $1.7 billion, or 174.9%, and net loans have grown $1.9 billion, or 690.6%. During this period, our commercial real estate, commercial business and construction loans have grown to $1.2 billion at December 31, 2017 from $9.3 million at December 31, 2011. The 1-4 family residential mortgage portfolio stood at $922.6 million at December 31, 2017, up $658.5 million, or 249.3%, from December 31, 2011. While the loan portfolio has grown significantly over the past six years, the investment securities portfolio declined $234.0 million, or 42.7%, to $313.4 million at December 31, 2017 from $547.5 million at December 31, 2011. Investment securities represented 11.7% of total assets at December 31, 2017 compared to 56.4% at December 31, 2011. From December 31, 2011 to December 31, 2017, our deposits have grown $1.3 billion, or 169.7%, to $2.0 billion. Core deposits (consisting of customer savings, money market, NOW and demand deposit accounts) have grown $879.8 million, or 238.4%, to $1.2 billion, while certificates of deposits and brokered deposits have increased $403.6 million, or 104.2% to $790.9 million.
58
Below is a summary of 2017 highlights:
2017 HIGHLIGHTS
• | Revenue growth and expense discipline allowed the Company to generate strong operating leverage in 2017 which, in turn, resulted in improvements to the efficiency ratio and return on assets compared to 2016. |
• | Loans grew 14% to $2.2 billion at December 31, 2017 from the end of 2016. Over the past three years, loans have increased $1.1 billion, or 93%, as the Company continued to execute on its balance sheet diversification strategy through an expansion of the residential mortgage, commercial real estate and commercial business loan portfolios. Since the end of 2014, commercial real estate loans are up 116%, 1-4 family residential mortgages have increased 101% and commercial business loans have grown 67%. |
• | Mortgage banking capabilities have been expanded over the past few years, including the opening of several new loan offices in Eastern Massachusetts. Current plans call for opening additional offices in Marblehead and Dorchester during the first quarter of 2018. Mortgage banking income grew to $3.7 million in 2017, up $1.2 million, or 48%, from 2016. Mortgage banking revenue was just $282,000 in 2015. Mortgage originations have been strong the past two years, totaling $495 million in 2017 and $539 million in 2016 compared to $269 million in 2015. |
• | Commercial loan originations (real estate and non-real estate combined) were $412 million in 2017 compared to $359 million in 2016 and $331 million in 2015. The Company has continued to expand its asset-based lending and specialized lending businesses as well as its commercial deposit taking capabilities, including converting to a new cash management platform. The combination of commercial and small business deposits totaled $359 million at December 31, 2017, up 20% from the end of 2016 and up 65% from the end of 2015. |
• | Over the past few years, new retail branches were opened in Milton (fourth quarter of 2014), Westwood (fourth quarter of 2015), and the Seaport District of Boston (fourth quarter of 2016). These three branches had combined total deposits of $266 million at December 31, 2017. Deposits, excluding brokered deposits, increased 13% during 2017. |
• | Our Government Banking division has added to the growth in deposits over the past two years, as municipal deposits were $137 million at the end of 2017, up 32% from the end of 2016 and up 188% from the end of 2015. |
• | During 2017, the Company completed the process of restructuring its securities portfolio by selling its mutual fund and corporate bond portfolios. The remaining portfolio was moved in-house, saving annual investment management fees of approximately $400,000. |
• | Net interest margin improved in 2017 compared to 2016 as the Company benefited from maintaining an asset sensitive interest rate risk position while the Federal Reserve raised interest rates. |
• | Capital deployment efforts continued as the Company reduced its tangible common equity to tangible assets ratio to 14.6% at December 31, 2017 from 23.7% at September 30, 2014 (the Company's first quarter as a public company). The Company's equity to assets at December 31, 2017 was 14.9%, compared to 24.3% at September 30, 2014. During 2017, the Company paid a $0.20 per share special dividend and raised its regular quarterly dividend twice. The quarterly dividend was $0.15 per share at the end of 2017 compared to $0.03 at the end of 2016. |
• | Credit quality was strong throughout 2017 and the Company had net loan recoveries of $29,000 during the year. |
• | The Company and its charitable foundations made donations in excess of $1.0 million in each of the last four years to various nonprofits reflecting the Company's active involvement in the communities it serves. Most of the donations were made through the Blue Hills Bank charitable foundations which support non-profits in the fields of education and the arts, health and human services, affordable housing, financial literacy, and community services. |
59
Critical Accounting Policies
Critical accounting policies are defined as those that involve significant judgments and uncertainties, and could potentially result in materially different results under different assumptions and conditions. We believe that the most critical accounting policies upon which our financial condition and results of operations depend, and which involve the most complex subjective decisions or assessments, are the following:
Allowance for loan losses. The allowance for loan losses is based on the size and the composition of the loan portfolio, delinquency levels, loss experience, economic conditions and other factors related to the collectability of the loan portfolio. Prior to the second quarter of 2016, for portfolios for which the Company had insufficient loss experience, losses from a national peer group of depository institutions with assets between one and five billion dollars for relevant portfolios dating back to 2009 were used. Commencing in the second quarter of 2016, the Company began to phase in its own loss history by loan type based upon the age and loss experience of the loan portfolio. This change impacted the loss factors used for the majority of loan portfolios. Loss experience is updated at least quarterly with consideration given to unique circumstances in the portfolio. Loan losses are charged against the allowance when management believes the uncollectability of a loan balance is confirmed. Subsequent recoveries, if any, are credited to the allowance. The allowance for loan losses is evaluated regularly by management and reflects consideration of all significant factors that affect the collectability of the loan portfolio. The evaluation is inherently subjective as it requires estimates that are susceptible to significant revision as more information becomes available. It is the intention of management to maintain an allowance that is prudently commensurate with the growth in the loan portfolio. The allowance consists of general, allocated and unallocated components, as further described below.
General component. The general component of the allowance for loan losses is based on a combination of the Company's own loss history and an extrapolated historical loss experience based on FDIC data for depository institutions with assets of one billion to five billion dollars dating back to 2009 adjusted for qualitative and environmental factors including changes to lending policies and procedures, economic and business conditions, portfolio characteristics, staff experience, problem loan trends, collateral values, concentrations and the competitive, legal and regulatory environment.
Allocated component. The allocated component relates to loans that are on the watch list (non-accruing loans, partially charged-off non-accruing loans, accruing adversely-rated loans, and other loans our Risk Management group requires to be reviewed on a monthly basis) and considered impaired. Impairment is measured by either the present value of expected future cash flows discounted at the loan’s effective interest rate or the fair value of the collateral if the loan is collateral dependent. An allowance is established when the discounted cash flows (or collateral value) of the impaired loan is lower than the carrying value of that loan. A loan is considered impaired when, based on current information and events, it is probable that the Company will be unable to collect the scheduled payments of principal or interest when due according to the contractual terms of the loan agreement. Management reviews all loan types for individual impairment. Factors considered by management in determining impairment include payment status, collateral value, and the probability of collecting scheduled principal and interest payments when due. Loans that experience insignificant payment delays and payment shortfalls generally are not classified as impaired. Management determines the significance of payment delays and payment shortfalls on a case-by-case basis, taking into consideration all of the circumstances surrounding the loan and the borrower, including the length of the delay, the reasons for the delay, the borrower’s prior payment record, and the amount of the shortfall in relation to the principal and interest owed.
We periodically may agree to modify the contractual terms of loans. When a loan is modified and a concession is made to a borrower experiencing financial difficulty, the modification is considered TDR. All TDRs are initially classified as impaired.
Unallocated component. Through the third quarter of 2016, the Company maintained an unallocated component to cover uncertainties that could affect management’s estimate of probable losses. The unallocated component of the allowance reflected the margin of imprecision inherent in the underlying assumptions used in the methodologies for estimating allocated and general reserves in the portfolio. As a large portion of the Company's loan portfolio had seasoned, the unallocated component of the allowance for loan losses was eliminated during the fourth quarter of 2016.
60
Income taxes. Deferred tax assets and liabilities are reflected at currently enacted income tax rates applicable to the period in which the deferred tax assets or liabilities are expected to be realized or settled. As changes in tax laws or rates are enacted, deferred tax assets and liabilities are adjusted accordingly through the provision for income taxes. Accordingly, changes resulting from the Tax Cuts and Jobs Act enacted on December 22, 2017 have been recognized in the consolidated financial statements as of and for the year ended December 31, 2017. The Company exercises significant judgment in evaluating the amount and timing of recognition of the resulting tax assets and liabilities. These judgments require the Company to make projections of future taxable income. These judgments and estimates, which are inherently subjective, are reviewed periodically as regulatory and business factors change. A valuation allowance related to deferred tax assets is established when, in the judgment of management, it is more likely than not that all or a portion of such deferred tax assets will not be realized. A tax position that meets the more likely than not recognition threshold is initially and subsequently measured as the largest amount of tax benefit that has a greater than 50% likelihood of being realized upon settlement with a taxing authority that has full knowledge of all relevant information. The determination of whether or not a tax position has met the more likely than not recognition threshold considers the facts, circumstances and information available at the reporting date and is subject to management’s judgment. There was no reserve for uncertain tax positions as of December 31, 2017 or 2016. The Company records interest and penalties as part of income tax expense.
Comparison of Financial Condition at December 31, 2017 and 2016
Total Assets. Total assets increased $198.8 million to $2.7 billion at December 31, 2017 from $2.5 billion at December 31, 2016. The increase was primarily due to an increase in loans of $273.3 million, or 14.3%.
Loans. Net loans increased by $273.3 million, or 14.3%, to $2.2 billion at December 31, 2017 from $1.9 billion at December 31, 2016. Most of the increase in loans during 2017 was due to loans originated by the Company. The Company continues to execute on its strategy to increase lending, particularly through an expansion of the residential mortgage, commercial real estate and commercial business loan portfolios. By category, the growth was driven by commercial real estate loans, which increased $147.0 million, or 21.4%, 1-4 family residential loans, which increased $71.5 million, or 8.4%, and commercial business loans, which increased $47.3 million, or 22.9%.
Allowance for Loan Losses. The allowance for loan losses was $20.9 million, or 0.95% of loans, at December 31, 2017 compared to $18.8 million, or 0.97% of loans, at December 31, 2016. During 2017, the Company continued the process, begun in 2016, of migrating from using historical loss rates from national FDIC data to using its own historical losses. As part of this migration, the Company no longer maintained an unallocated component of the allowance for loan losses at December 31, 2017 and December 31, 2016.
Securities. The combination of securities available for sale and securities held to maturity were $313.4 million at December 31, 2017, compared to $405.9 million at December 31, 2016. The decline of $92.4 million, or 22.8%, from the end of 2016 was mainly due to the sales of the mutual fund investment portfolio and the remaining available-for-sale corporate debt securities portfolio in the first half of 2017.
Cash and Cash Equivalents. Cash and cash equivalents increased by $15.7 million, or 51.4%, to $46.2 million at December 31, 2017 from $30.5 million at December 31, 2016.
Bank-Owned Life Insurance. The Company's investment in bank-owned life insurance changed only slightly during the year and at December 31, 2017, the investment was $33.1 million, compared to $32.0 million at December 31, 2016. The growth was due to current period earnings on the policies.
Goodwill and Core Deposit Intangible. Goodwill and core deposit intangible assets totaled $9.7 million at December 31, 2017 compared to $10.6 million at December 31, 2016. The balance at each date relates to the January 2014 Nantucket Bank acquisition and is a combination of the core deposit intangible associated with the deposit liabilities assumed and the goodwill resulting from the transaction. The decline from the end of 2016 was due solely to amortization of the core deposit intangible.
Premises and Equipment. Premises and equipment was $21.6 million at December 31, 2017, down $461,000, or 2.1%, from $22.0 million at December 31, 2016. The slight decline in 2017 mainly reflected depreciation.
61
Deposits. Deposits increased by $231.2 million, or 12.8%, to $2.0 billion at December 31, 2017 from $1.8 billion at December 31, 2016. By category, the more significant increases were seen in certificates of deposit, which were up $108.3 million, money market deposits, which were up $73.4 million, and NOW and demand deposits, which were up $49.8 million. Deposit growth from the end of 2016 was helped by the new branch in the Seaport district of Boston that was opened in the fourth quarter of 2016.
Borrowings. Total borrowings declined to $205.0 million at December 31, 2017 from $251.0 million at December 31, 2016. Short-term borrowings of $100.0 million at December 31, 2017 and $146.0 million at December 31, 2016 consisted of advances from the Federal Home Loan Bank of Boston. Long-term borrowings of $105.0 million at December 31, 2017 and December 31, 2016 consisted of advances from the Federal Home Loan Bank of Boston. The balance of long-term borrowings at December 31, 2017 had maturities ranging from 2018 through 2022.
Equity. Total equity increased $10.9 million, or 2.8%, to $397.8 million at December 31, 2017 from $386.9 million at December 31, 2016. The increase reflects net income of $16.5 million in 2017 and other factors, partially offset by the payment of common stock dividends at an aggregate cost of $14.4 million. There were no share repurchases in 2017.
Comparison of Results of Operations for the Years Ended December 31, 2017 and 2016
General. The Company reported net income of $16.5 million for the year ended December 31, 2017, an increase of $7.8 million, or 90.6%, from net income of $8.7 million for the year ended December 31, 2016.
62
Average Balances and Yields
The following table sets forth average balance sheets, average yields and costs, and certain other information for the periods indicated. All average balances are daily average balances. Non-accrual loans were included in the computation of average balances, but have been reflected in the table as loans carrying a zero yield. The yields set forth below include the effect of deferred fees, discounts and premiums that are amortized or accreted to interest income or expense. Interest income on tax-exempt securities and loans has been adjusted to a fully taxable-equivalent (FTE) basis using a federal statutory tax rate of 35% for the years ended December 31, 2017 and 2016. A statutory rate of 34% was used for the year ended December 31, 2015.
For the Year Ended December 31, 2017 | ||||||||||
Average Outstanding Balance | Interest | Yield / Cost | ||||||||
(Dollars in thousands) | ||||||||||
Interest-earning assets: | ||||||||||
Total loans | $ | 2,070,513 | $ | 76,932 | 3.72 | % | ||||
Securities | 329,369 | 7,306 | 2.22 | |||||||
Other interest earning assets (1) | 32,345 | 785 | 2.43 | |||||||
Total interest-earning assets | 2,432,227 | 85,023 | 3.50 | |||||||
Non-interest-earning assets | 99,333 | |||||||||
Total assets | $ | 2,531,560 | ||||||||
Interest-bearing liabilities: | ||||||||||
NOW accounts | $ | 152,469 | 67 | 0.04 | % | |||||
Regular savings accounts | 249,256 | 800 | 0.32 | |||||||
Money market accounts | 692,474 | 6,780 | 0.98 | |||||||
Certificates of deposit | 612,486 | 7,568 | 1.24 | |||||||
Total interest-bearing deposits | 1,706,685 | 15,215 | 0.89 | |||||||
Borrowings | 199,004 | 2,523 | 1.27 | |||||||
Total interest-bearing liabilities | 1,905,689 | 17,738 | 0.93 | |||||||
Non-interest-bearing deposits | 201,715 | |||||||||
Other non-interest-bearing liabilities | 25,477 | |||||||||
Total liabilities | 2,132,881 | |||||||||
Equity | 398,679 | |||||||||
Total liabilities and equity | $ | 2,531,560 | ||||||||
Net interest-earning assets (2) | $ | 526,538 | ||||||||
Net interest and dividend income (FTE) | 67,285 | |||||||||
Less: FTE adjustment | (248 | ) | ||||||||
Net interest and dividend income (GAAP) | $ | 67,037 | ||||||||
Net interest rate spread (FTE) (3) | 2.57 | % | ||||||||
Net interest margin (FTE) (4) | 2.77 | % | ||||||||
Average interest-earning assets to interest-bearing liabilities | 127.63 | % | ||||||||
Total cost of deposits | 0.80 | % | ||||||||
_____________________
(Footnotes on following page).
63
For the Years Ended December 31, | |||||||||||||||||||||
2016 | 2015 | ||||||||||||||||||||
Average Outstanding Balance | Interest | Yield/ Cost | Average Outstanding Balance | Interest | Yield/ Cost | ||||||||||||||||
(Dollars in thousands) | |||||||||||||||||||||
Interest-earning assets: | |||||||||||||||||||||
Total loans | $ | 1,688,878 | $ | 59,174 | 3.50 | % | $ | 1,292,909 | $ | 45,544 | 3.52 | % | |||||||||
Securities | 415,220 | 10,068 | 2.42 | 427,237 | 12,738 | 2.98 | |||||||||||||||
Other interest earning assets (1) | 33,427 | 603 | 1.80 | 40,115 | 360 | 0.90 | |||||||||||||||
Total interest-earning assets | 2,137,525 | 69,845 | 3.27 | 1,760,261 | 58,642 | 3.33 | |||||||||||||||
Non-interest-earning assets | 102,868 | 92,634 | |||||||||||||||||||
Total assets | $ | 2,240,393 | $ | 1,852,895 | |||||||||||||||||
Interest-bearing liabilities: | |||||||||||||||||||||
NOW accounts | $ | 139,829 | 67 | 0.05 | % | $ | 127,183 | 62 | 0.05 | % | |||||||||||
Regular savings accounts | 275,347 | 938 | 0.34 | 294,004 | 1,144 | 0.39 | |||||||||||||||
Money market accounts | 517,474 | 4,321 | 0.84 | 335,791 | 2,314 | 0.69 | |||||||||||||||
Certificates of deposit | 472,985 | 5,162 | 1.09 | 378,494 | 4,007 | 1.06 | |||||||||||||||
Total interest-bearing deposits | 1,405,635 | 10,488 | 0.75 | 1,135,472 | 7,527 | 0.66 | |||||||||||||||
Borrowings | 249,226 | 2,088 | 0.84 | 146,720 | 1,217 | 0.83 | |||||||||||||||
Total interest-bearing liabilities | 1,654,861 | 12,576 | 0.76 | 1,282,192 | 8,744 | 0.68 | |||||||||||||||
Non-interest-bearing deposits | 163,403 | 138,438 | |||||||||||||||||||
Other non-interest-bearing liabilities | 29,459 | 20,993 | |||||||||||||||||||
Total liabilities | 1,847,723 | 1,441,623 | |||||||||||||||||||
Equity | 392,670 | 411,272 | |||||||||||||||||||
Total liabilities and equity | $ | 2,240,393 | $ | 1,852,895 | |||||||||||||||||
Net interest-earning assets (2) | $ | 482,664 | $ | 478,069 | |||||||||||||||||
Net interest and dividend income (FTE) | 57,269 | 49,898 | |||||||||||||||||||
Less FTE adjustment | (307 | ) | (341 | ) | |||||||||||||||||
Net interest and dividend income (GAAP) | $ | 56,962 | $ | 49,557 | |||||||||||||||||
Net interest rate spread (FTE) (3) | 2.51 | % | 2.65 | % | |||||||||||||||||
Net interest margin (FTE) (4) | 2.68 | % | 2.83 | % | |||||||||||||||||
Average interest-earning assets to interest-bearing liabilities | 129.17 | % | 137.29 | % | |||||||||||||||||
Total cost of deposits | 0.67 | % | 0.59 | % | |||||||||||||||||
______________________
(1) | Includes Federal Home Loan Bank stock and short-term investments. |
(2) | Net interest-earning assets represent total interest-earning assets less total interest-bearing liabilities. |
(3) | Net interest rate spread represents the difference between the weighted average yield on interest-earning assets and the weighted average cost of interest-bearing liabilities. |
(4) | Net interest margin represents net interest and dividend income on a fully taxable equivalent basis as a percentage of average interest-earning assets. |
64
Rate/Volume Analysis
The following table presents the effects of changing rates and volumes on our net interest and dividend income for the fiscal years indicated. The rate column shows the effects attributable to changes in rate (changes in rate multiplied by prior volume). The volume column shows the effects attributable to changes in volume (changes in volume multiplied by prior rate). The total column represents the sum of the prior columns. For purposes of this table, changes attributable to both rate and volume, which cannot be segregated, have been allocated proportionately, based on the changes due to rate and the changes due to volume.
Year Ended December 31, 2017 vs. 2016 | |||||||||||
Increase (Decrease) Due to | Total Increase (Decrease) | ||||||||||
Volume | Rate | ||||||||||
Interest-earning assets: | (In thousands) | ||||||||||
Loans | $ | 12,821 | $ | 4,937 | $ | 17,758 | |||||
Securities | (1,974 | ) | (788 | ) | (2,762 | ) | |||||
Other | (18 | ) | 200 | 182 | |||||||
Total interest-earning assets | $ | 10,829 | $ | 4,349 | $ | 15,178 | |||||
Interest-bearing liabilities: | |||||||||||
NOW accounts | $ | 4 | $ | (4 | ) | $ | — | ||||
Savings | (85 | ) | (53 | ) | (138 | ) | |||||
Money market | 1,292 | 1,167 | 2,459 | ||||||||
Certificates of deposit | 1,401 | 1,005 | 2,406 | ||||||||
Total interest-bearing deposits | 2,612 | 2,115 | 4,727 | ||||||||
Borrowings | (361 | ) | 796 | 435 | |||||||
Total interest-bearing liabilities | $ | 2,251 | $ | 2,911 | $ | 5,162 | |||||
Change in net interest and dividend income | $ | 8,578 | $ | 1,438 | $ | 10,016 | |||||
Year Ended December 31, 2016 vs. 2015 | |||||||||||
Increase (Decrease) Due to | Total Increase (Decrease) | ||||||||||
Volume | Rate | ||||||||||
Interest-earning assets: | (In thousands) | ||||||||||
Loans | $ | 13,890 | $ | (260 | ) | $ | 13,630 | ||||
Securities | (347 | ) | (2,323 | ) | (2,670 | ) | |||||
Other | (52 | ) | 295 | 243 | |||||||
Total interest-earning assets | $ | 13,491 | $ | (2,288 | ) | $ | 11,203 | ||||
Interest-bearing liabilities: | |||||||||||
NOW accounts | $ | 5 | $ | — | $ | 5 | |||||
Savings accounts | (68 | ) | (138 | ) | (206 | ) | |||||
Money market | 1,076 | 931 | 2,007 | ||||||||
Certificates of deposit | 967 | 188 | 1,155 | ||||||||
Total interest-bearing deposits | 1,980 | 981 | 2,961 | ||||||||
Borrowings | 846 | 25 | 871 | ||||||||
Total interest-bearing liabilities | $ | 2,826 | $ | 1,006 | $ | 3,832 | |||||
Change in net interest and dividend income | $ | 10,665 | $ | (3,294 | ) | $ | 7,371 | ||||
65
Net Interest and Dividend Income. Net interest and dividend income increased $10.1 million, or 17.7%, to $67.0 million for the year ended December 31, 2017 from $57.0 million for the year ended December 31, 2016. Net interest margin improved 10 basis points to 2.76% for the year ended December 31, 2017, compared to 2.66% for the year ended December 31, 2016. On a fully tax equivalent (FTE) basis, net interest and dividend income increased $10.0 million, or 17.5%, to $67.3 million for the year ended December 31, 2017 from $57.3 million for the year ended December 31, 2016. On a fully tax equivalent (FTE) basis, net interest margin improved 9 basis points to 2.77% for the year ended December 31, 2017, compared to 2.68% for the year ended December 31, 2016. The Company has an asset sensitive interest rate risk position and net interest and dividend income as well as net interest margin benefited from rate hikes announced by the Federal Reserve. See Management Market of Risk Section. The growth in net interest and dividend income from 2016 was also due to an increase of $294.7 million, or 13.8%, in average earning assets. The improvements in net interest and dividend income were partially offset by higher funding costs reflecting deposit pricing competition and the rising rate environment. The cost of interest bearing liabilities rose to 0.93% in 2017 from 0.76% in 2016.
Interest and Dividend Income. Interest and dividend income increased $15.2 million, or 21.9%, to $84.8 million in 2017 from $69.5 million in 2016. The increase was primarily due to a $17.7 million, or 30.1%, increase in interest and fees on loans to $76.7 million, partially offset by a $1.8 million, or 20.1%, decline in interest on securities to $7.1 million and a $863,000, or 54.1%, decline in dividends to $733,000. The $17.7 million increase in interest and fees on loans was primarily due to a $381.6 million, or 22.6%, increase in the average balance of loans to $2.1 billion for the year ended December 31, 2017 and a 22 basis point increase in the yield on loans to 3.72% in 2017. The increase in the average balance of loans mainly reflects growth in the residential mortgage, commercial real estate, and commercial business portfolios while the yield on loans improved due to the repricing of floating rate loans from rate hikes announced by the Federal Reserve. The decline in interest on securities mainly reflects the sale of the remaining available-for-sale corporate debt securities portfolio and the decline in dividends mainly reflects the sale of the mutual fund investment portfolio. Both portfolio sales took place in the first half of 2017.
Interest Expense. Interest expense increased $5.2 million, or 41.0%, to $17.7 million for the year ended December 31, 2017 from $12.6 million for the year ended December 31, 2016. Interest expense on deposits increased $4.7 million, or 45.1%, to $15.2 million in 2017 from $10.5 million in 2016. The growth was due to a $301.1 million, or 21.4%, increase in average interest-bearing deposits to $1.71 billion in 2017 from $1.41 billion in 2016 as average money market deposits were up $175.0 million and average certificates of deposits were up $139.5 million. In addition, the yield on interest bearing deposits increased 14 basis points from 2016 to 0.89% in 2017 reflecting the rising rate environment and deposit pricing competition. Interest expense on borrowings increased $435,000, or 20.8%, to $2.5 million in 2017 from $2.1 million in 2016. This increase was due to the average cost of borrowings increasing to 1.27% in 2017 from 0.84% in 2016, partially offset by a $50.2 million, or 20.2% decline in the average balance of borrowings to $199.0 million in 2017 from $249.2 million in 2016.
Provision for Loan Losses. The provision for loan losses was $2.1 million in 2017 compared to $4.9 million in 2016. The provision in both periods reflects management’s assessment of the risks inherent in the loan portfolio. In addition, the provisions in both periods were impacted by loan growth and loan mix, as well as the Company migrating from the use of historical loss rates based on national FDIC data to loss rates based on the Company's own experience. The decline in the provision from 2016 also reflects a lower provision for commercial business loans due primarily to the recording of a $3.2 million provision in 2016 on loans to one commercial customer. The Company had net loan recoveries of $29,000 in 2017 compared to net chargeoffs of $3.2 million in 2016. Excluding net charge-offs related to the aforementioned commercial customer, net charge-offs would have been $32,000 in 2016.
Noninterest Income. Noninterest income increased $5.0 million, or 40.9%, from 2016 to $17.1 million in 2017. The increase was mainly driven by a $5.9 million gain recorded in 2017 from the Company's investment in Northeast Retirement Services, Inc., which was acquired by Community Bank System, Inc. In addition, mortgage banking revenue increased $1.2 million, or 47.9%, to $3.7 million in 2017 from $2.5 million in 2016 due to a higher level of loan sales. Loan level derivative income also increased $421,000, or 17.8%, to $2.8 million in 2017 from $2.4 million in 2016. These improvements were partially offset by a $1.4 million decline in realized securities gains with losses of $94,000 in 2017 and gains of $1.3 million in 2016. In addition, miscellaneous income declined $768,000, or 48.7%, from 2016 to $808,000 in 2017. 2016 also included $506,000 of bank-owned life insurance death benefit gains compared to none in 2017.
66
Noninterest Expense. Noninterest expense increased $2.6 million, or 4.9%, to $54.3 million for the year ended December 31, 2017 from $51.7 million for the year ended December 31, 2016. The increase from 2016 was mainly due to higher salaries and benefits expense, which was up $2.4 million, or 8.4%, to $31.3 million in 2017 and higher occupancy and equipment expense, which was up $1.0 million, or 13.9%, to $8.4 million in 2017. The increase in salaries and benefits expense was due, in part, to higher incentive compensation and merit raises. In addition, the number of full-time equivalent employees increased to 237 at December 31, 2017 from 228 at December 31, 2016. The increase in occupancy and equipment expense was primarily due to the opening of a new branch in the Seaport District of Boston in the fourth quarter of 2016 and the opening of new loan production offices. Other categories of noninterest expense had smaller changes, including declines in professional fees, advertising, FDIC deposit insurance, amortization of core deposit intangible and other expense.
Income Tax Provision. The Company recorded a tax provision of $11.2 million in 2017 on pre-tax income of $27.7 million for an effective tax rate of 40.5%. The 2017 tax provision included a charge of $2.5 million related to the Tax Cuts and Jobs Act (the “Act”) which was enacted on December 22, 2017. The Act provides for a reduction in the corporate income tax rate from 35% to 21% effective January 1, 2018 and this reduction in the corporate tax rate resulted in a downward revaluation to the Company's net deferred tax asset. Excluding that charge, the effective tax rate in 2017 was 31.5%. In 2016, the Company recorded a tax provision of $3.8 million on pre-tax income of $12.5 million for an effective tax rate of 30.5%. See Note 8 to the consolidated financial statements for rate reconciliations for both years.
Comparison of Results of Operations for the Years Ended December 31, 2016 and 2015
General. The Company reported net income of $8.7 million for the year ended December 31, 2016, an increase of $1.4 million, or 19.7%, from net income of $7.2 million for the year ended December 31, 2015.
Net Interest and Dividend Income. Net interest and dividend income increased $7.4 million, or 14.9%, to $57.0 million for the year ended December 31, 2016 from $49.6 million for the year ended December 31, 2015. Net interest margin declined 16 basis points to 2.66% for the year ended December 31, 2016, compared to 2.82% for the year ended December 31, 2015. The growth in net interest and dividend income from 2015 was mainly due to an increase of $377.3 million, or 21.4%, in average earning assets. The Company has a nominal asset sensitive interest rate risk position and net interest revenue and margin also benefited from rate hikes announced by the Federal Reserve in both December 2015 and December 2016. Partially offsetting the improvement was a $2.7 million decline in mutual fund dividends to $961,000 in 2016 from $3.6 million in 2015. In addition, the cost of interest-bearing deposits increased to 0.75% in 2016 from 0.66% in 2015 due, in part, to promotional rate programs and there was a decline in the acquisition accounting accretion related to the January 2014 Nantucket Bank acquisition to $512,000 in 2016 from $933,000 in 2015.
Interest and Dividend Income. Interest and dividend income increased $11.2 million, or 19.3%, to $69.5 million in 2016 from $58.3 million in 2015. The increase was primarily due to a $13.6 million, or 30.0%, increase in interest on loans to $59.0 million, partially offset by a $2.5 million, or 60.8%, decline in dividends caused by a $2.7 million drop in dividends from mutual funds. The $13.6 million increase in interest on loans was primarily due to a $396.0 million, or 30.6%, increase in the average balance of loans to $1.69 billion for the year ended December 31, 2016, partially offset by a 2 basis point decrease in the average yield on loans to 3.50%. The increase in the average balance of loans mainly reflects growth in the residential mortgage, commercial real estate, construction, and commercial business portfolios. The yield on loans decreased due to a lower contribution from acquisition accounting accretion related to the loans obtained in the Nantucket Bank acquisition, partially offset from the repricing of floating rate loans from rate hikes announced by the Federal Reserve in both December 2015 and December 2016.
Interest Expense. Interest expense increased $3.8 million, or 43.8%, to $12.6 million for the year ended December 31, 2016 from $8.7 million for the year ended December 31, 2015. Interest expense on deposits increased $3.0 million, or 39.3%, to $10.5 million in 2016 from $7.5 million in 2015. The growth was due to a $270.2 million, or 23.8%, increase in average interest-bearing deposits to $1.41 billion in 2016 from $1.14 billion in 2015 as average money market deposits were up $181.7 million and average certificates of deposits were up $94.5 million. In addition, the yield on interest bearing deposits increased 9 basis points from 2015 to 0.75% in 2016. Interest expense on borrowings increased $871,000, or 71.6%, to $2.1 million in 2016 from $1.2 million in 2015. The average balance of borrowings grew $102.5 million, or 69.9%, to $249.2 million in 2016 from $146.7 million in 2015 while the yield in 2016 of 0.84% was up just one basis point from 2015.
67
Provision for Loan Losses. The provision for loan losses was $4.9 million in 2016 compared to $4.1 million in 2015. The provision in both periods reflects management’s assessment of the risks inherent in the loan portfolio. In addition, the provisions in both periods were impacted by loan growth and loan mix, while the 2016 provision was impacted by the Company starting to migrate from the use of historical loss rates based on national FDIC data to loss rates based on the Company's own experience. The increase in the provision from 2015 also reflects a higher provision for commercial business loans due primarily to the recording of a $3.2 million provision in 2016 on loans to one commercial customer. This was partially offset by a lower provision on commercial real estate loans due, in part, to the reversal in 2016 of specific reserves of approximately $400,000, originally established in 2015, against loans secured by one income property. Net charge-offs in 2016 were $3.2 million. Excluding net charge-offs related to the aforementioned commercial customer, net charge-offs would have been $32,000 compared to net recoveries of $39,000 in 2015.
Noninterest Income. Noninterest income increased $3.4 million, or 39.7%, from 2015 to $12.1 million in 2016. The increase was mainly driven by mortgage banking revenue which rose to $2.5 million in 2016 from $282,000 in 2015 due to a higher level of loan sales. In addition, miscellaneous income increased $1.1 million, or 247.9%, from 2015 to $1.6 million in 2016 due, in part, to credit valuation marks on commercial loan customer back-to-back interest rate swap contracts where customers opt to convert their loans from floating to fixed rate via the rate swaps. In addition, 2016 included $506,000 of bank-owned life insurance death benefit gains compared to none in 2015. These improvements were partially offset by a $688,000, or 35.0%, decline in realized securities gains.
Noninterest Expense. Noninterest expense increased $7.7 million, or 17.4%, to $51.7 million for the year ended December 31, 2016 from $44.1 million for the year ended December 31, 2015. The increase from 2015 was mainly due to higher salaries and benefits expense, which were up $6.3 million, or 27.8%, to $28.9 million in 2016 and higher occupancy and equipment expense, which was up $1.1 million, or 17.6%, to $7.4 million in 2016. The increase in salaries and benefits expense was due in part to equity grants made under the Equity Incentive Plan that was approved by shareholders at the Company’s 2015 Annual Shareholders Meeting. A full year of expense was recorded on these grants in 2016 compared to three months in 2015. Salaries and benefits expense was also impacted by merit and promotional increases. The remaining increase in salaries and benefits expense, as well as the increase in occupancy and equipment expense mainly reflects growth initiatives, including the opening of new branches in the Seaport District of Boston and in Westwood, the opening of new loan production offices, and the relocation of the Company's headquarters to a new location in Norwood.
Income Tax Provision. The Company recorded a tax provision of $3.8 million in 2016 on pre-tax income of $12.5 million for an effective tax rate of 30.5%. In 2015, the Company recorded a tax provision of $2.8 million on pre-tax income of $10.1 million for an effective tax rate of 28.2%. The major drivers in the increase in tax rate from 2015 related to an increase in state taxes as well as an increase in permanent differences for equity incentives. See Note 8 to the consolidated financial statements for rate reconciliations for both years.
68
Management of Market Risk
General.
Market risk is the risk that the market value or estimated fair value of our assets, liabilities, and derivative financial instruments will decline as a result of changes in interest rates or financial market volatility, or that our net income will be significantly reduced by interest rate changes.
Our most significant form of market risk is interest rate risk because, as a financial institution, the majority of our assets and liabilities are sensitive to changes in interest rates. Therefore, a principal part of our operations is to manage interest rate risk and limit the exposure of our financial condition and results of operations to changes in market interest rates. Our Asset/Liability Management Committee (“ALCO”) is responsible for evaluating the interest rate risk inherent in our assets and liabilities, for determining the level of risk that is appropriate given our business strategy, operating environment, capital, liquidity and performance objectives, and for managing this risk consistent with the policy and guidelines approved by our Board of Directors.
Net Interest Income Analysis.
Income simulation is the primary tool for measuring the interest rate risk inherent in our balance sheet at a given point in time by showing the effect on net interest income, over specified time horizons, under a range of interest rate ramp and shock scenarios. These simulations take into account repricing, maturity and prepayment characteristics of individual products. These estimates require us to make certain assumptions including loan and mortgage-related investment prepayment speeds, reinvestment rates, and deposit maturities and decay rates. These assumptions are inherently uncertain and, as a result, we cannot precisely predict the impact of changes in interest rates on our net interest income. Although the net interest income table below provides an indication of our interest rate risk exposure at a particular point in time, such estimates are not intended to, and do not, provide a precise forecast of the effect of changes in market interest rates on our net interest income and will differ from actual results. The ALCO reviews the methodology utilized for calculating interest rate risk exposure and may periodically adopt modifications to this methodology. Simulation results are reviewed by the ALCO to determine whether the exposure resulting from changes in market interest rates remains within established tolerance levels and develops appropriate strategies to manage this exposure.
As of December 31, 2017, net interest income simulation indicated that our exposure to changing interest rates was within our internal guidelines. The following table presents the estimated impact of interest rate ramps on our estimated net interest income over the period indicated:
Change in Interest Rates (basis points) (1) | Change in Net Interest Income Year One | Change in Net Interest Income Year Two | ||
-100 | (2.4)% | (6.1)% | ||
+100 | 1.4% | 3.2% | ||
+200 | 2.7% | 4.4% | ||
_______________________
(1) | The calculated change in net interest income assumes a gradual parallel shift across the yield curve over a one-year period. |
The table above indicates that at December 31, 2017, in the event of a 100 and 200 basis point increase in interest rates, we would experience a 1.4% and 2.7% increase, respectively, in net interest income in Year One of the simulation. In the subsequent Year Two, we would experience a 3.2% and 4.4% increase, respectively, in net interest income. In the event of a 100 basis point decrease in interest rates, we would experience a 2.4% decrease in net interest income in Year One and a 6.1% decrease in net interest income in Year Two.
69
Economic Value of Equity Analysis.
We also analyze the sensitivity of our financial condition to changes in interest rates through our economic value of equity model. This analysis measures the difference between predicted changes in the present value of our assets and predicted changes in the present value of our liabilities assuming various changes in current interest rates. Our economic value of equity analysis as of December 31, 2017 indicated that, in the event of an instantaneous 100 and 200 basis point increase in interest rates, we would experience an estimated 3.5% and 8.0% decrease, respectively, in the economic value of our equity. At the same date, our analysis indicated that, in the event of an instantaneous 100 basis point decrease in interest rates, we would experience an estimated 2.8% decrease in the economic value of our equity. The impact on our economic value of equity under all scenarios discussed above is within policy guidelines. The estimates of changes in the economic value of our equity require us to make certain assumptions including loan and mortgage-related investment prepayment speeds, reinvestment rates, and deposit maturities and decay rates. These assumptions are inherently uncertain and, as a result, we cannot precisely predict the impact of changes in interest rates on the economic value of our equity. Although our economic value of equity analysis provides an indication of our interest rate risk exposure at a particular point in time, such estimates are not intended to, and do not, provide a precise forecast of the effect of changes in market interest rates on the economic value of our equity and will differ from actual results.
Liquidity and Capital Resources
Liquidity is a financial institution’s capacity to readily meet its current and future financial obligations. It is further defined as the ability to respond to the needs of depositors and borrowers, as well as to opportunities for earnings enhancements. The Company’s primary source of liquidity is deposits. At December 31, 2017, the Company had $1.7 billion of deposits (excluding brokered deposits), which represents 63.6% of total assets. Other sources of liquidity include cash flows from loan repayments and the investment portfolio and discretionary use of wholesale funds, including Federal Home Loan Bank of Boston (“FHLBB”) borrowings and brokered deposits. Wholesale funds are used to diversify our funding mix and to support asset growth when profitable lending and investment opportunities exist. Securities designated as available for sale may also be sold in response to short-term or long-term liquidity needs and eligible securities may be pledged to support collateralized borrowings.
We have a detailed liquidity funding policy and a contingency funding plan that outlines a comprehensive management response to unexpected demands for liquidity. Management employs stress testing methodology to estimate needs for contingent funding that could result from unexpected outflows of funds in excess of ordinary course of business. To supplement its liquidity, Blue Hills Bank has established collateralized borrowing capacity with the Federal Reserve Bank of Boston and also maintains additional collateralized borrowing capacity with the FHLBB. At December 31, 2017, we had $205.0 million of FHLBB advances outstanding. At that date, we had the ability to borrow up to an additional $594.1 million from the FHLBB. At December 31, 2017, we had $42.0 million in available unsecured federal funds lines with correspondent banks, which could be drawn upon as needed. There were no amounts outstanding under these lines of credit at December 31, 2017.
Liquidity management is monitored by the ALCO, which is responsible for establishing and monitoring liquidity targets as well as strategies to meet these targets. Liquidity remained within target ranges established by the ALCO during 2017. Management believes our sources of funding will meet anticipated funding needs.
Our most liquid assets are cash and cash equivalents. The level of these assets is dependent on our operating, financing, lending and investing activities during any given period. At December 31, 2017, cash and cash equivalents totaled $46.2 million.
Our cash flows are derived from operating activities, investing activities and financing activities as reported in our Consolidated Statements of Cash Flows included in our Consolidated Financial Statements.
Our primary investing activities are originating loans and purchasing securities. During the years ended December 31, 2017 and December 31, 2016, we had $792.8 million and $817.7 million of loan originations, respectively. We also underwrote and participated in $137.5 million and $98.3 million of loans originated by third parties in 2017 and 2016, respectively. During the year ended December 31, 2017, we purchased $181.5 million of securities and received proceeds from the sale of securities totaling $213.1 million. During the year ended December 31, 2016, those amounts were $136.5 million and $97.8 million, respectively.
70
Financing activities consist primarily of activity in deposit accounts and borrowings. We experienced net increases in deposits of $231.2 million and $374.8 million for the years ended December 31, 2017 and 2016, respectively. Included in the net deposit increases are a $41.7 million increase in brokered deposits for the year ended December 31, 2017 compared to a $122.5 million increase for the year ended December 31, 2016. At December 31, 2017, brokered deposits totaled $342.6 million compared to $300.9 million at December 31, 2016. Deposit flows are affected by the overall level of interest rates, the interest rates and products offered by us and our local competitors, and by other factors. We experienced a net decrease in borrowings of $46.0 million for the year ended December 31, 2017 compared to a net decrease of $9.0 million for the year ended December 31, 2016.
At December 31, 2017, we had $66.0 million in loan commitments outstanding. In addition to commitments to originate loans, we had $299.1 million in unused lines of credit to borrowers and letters of credit and $82.2 million in undisbursed construction loans. Certificates of deposit due within one year of December 31, 2017 totaled $406.4 million or 19.9%, of total deposits. Excluding brokered deposits, certificates of deposit due within one year of December 31, 2017 totaled $156.6 million, or 7.7%, of total deposits. If these deposits do not remain with us, we may be required to seek other sources of funds, including loan and securities sales, brokered deposits, and Federal Home Loan Bank advances. While management believes that we have adequate liquidity to meet our commitments and to fund the Bank’s lending and investment activities, the availability of these funding sources are subject to broad economic conditions and could be restricted in the future. Such restrictions would impact our immediate liquidity and/or additional liquidity needs (see Item 1A for liquidity risk factor).
Blue Hills Bancorp is a separate legal entity from the Bank and must provide for its own liquidity. In addition to its operating expenses, Blue Hills Bancorp is responsible for paying dividends declared to its shareholders. Blue Hills Bancorp may continue to repurchase shares of its common stock in the future. Blue Hills Bancorp's primary sources of funds are the net proceeds it retained from the stock offering, interest and dividends on securities and dividends received from the Bank. The amount of dividends that the Bank may declare and pay to Blue Hills Bancorp in any calendar year, without prior regulatory approval, cannot exceed net income for that year to date plus retained net income (as defined) for the preceding two calendar years. Blue Hills Bancorp believes that such restriction will not have an impact on Blue Hills Bancorp's ability to meet its ongoing cash obligations. At December 31, 2017 and 2016, Blue Hills Bancorp had cash and cash equivalents of $42.1 million and $66.3 million, respectively, on an unconsolidated basis.
We are subject to various regulatory capital requirements, including a risk-based capital measure. The risk-based capital guidelines include both a definition of capital and a framework for calculating risk-weighted assets by assigning balance sheet assets and off-balance sheet items to broad risk categories. At December 31, 2017, we exceeded all regulatory capital requirements and are considered “well capitalized” under regulatory guidelines (see Note 9 of the Notes to Consolidated Financial Statements).
Off-Balance Sheet Arrangements and Contractual Obligations
Commitments. We are a party to financial instruments with off-balance sheet risk in the normal course of business to meet the financing needs of our customers. These financial instruments include commitments to extend credit, which involve elements of credit and interest rate risk in excess of the amount recognized in the accompanying consolidated balance sheets. The contract amount of these instruments reflects the extent of involvement we have in these particular classes of financial instruments. We use the same credit policies in making commitments as we do for on-balance sheet instruments. Our exposure to credit loss is represented by the contractual amount of the instruments. Commitments to extend credit are agreements to lend to a customer as long as there is no violation of any condition established in the contract. Commitments and unadvanced funds on lines-of-credit generally have fixed expiration dates and may expire without being drawn upon. Therefore, the total commitment amount does not necessarily represent future cash requirements. We evaluate each customer’s creditworthiness on a case-by-case basis. In addition, from time to time we enter into commitments to sell mortgage loans that we originate. For additional information, see Note 13 of the Notes to Consolidated Financial Statements.
71
Contractual Obligations. We are obligated to make future payments according to various contracts. The following table presents the expected future payments of the contractual obligations aggregated by obligation type at December 31, 2017.
One year or less | More than one year to three years | More than three years to five years | More than five years | Total | |||||||||||||||
(In thousands) | |||||||||||||||||||
Federal Home Loan Bank of Boston advances | $ | 125,000 | $ | 70,000 | $ | 10,000 | $ | — | $ | 205,000 | |||||||||
Certificates of deposit | 406,362 | 243,405 | 48,381 | — | 698,148 | ||||||||||||||
Operating leases | 2,698 | 4,899 | 4,564 | 9,640 | 21,801 | ||||||||||||||
Music venue naming rights | 477 | 1,031 | 1,141 | 612 | 3,261 | ||||||||||||||
Total contractual obligations | $ | 534,537 | $ | 319,335 | $ | 64,086 | $ | 10,252 | $ | 928,210 | |||||||||
Recent Accounting Pronouncements
For a discussion of the impact of recent accounting pronouncements, see Note 2 of the Notes to Consolidated Financial Statements.
Impact of Inflation and Changing Prices
Our Consolidated Financial Statements and related notes have been prepared in accordance with U.S. GAAP. U.S. GAAP generally requires the measurement of financial position and operating results in terms of historical dollars without consideration of changes in the relative purchasing power of money over time due to inflation. The impact of inflation is reflected in the increased cost of our operations. Unlike industrial companies, our assets and liabilities are primarily monetary in nature. As a result, changes in market interest rates have a greater impact on performance than the effects of inflation.
ITEM 7A. QUANTITATIVE AND QUALITATIVE DISCLOSURES ABOUT MARKET RISK
Information regarding quantitative and qualitative disclosures about market risk appears under Item 7, “Management’s Discussion and Analysis of Financial Condition and Results of Operations,” under the caption “Asset/Liability Management”.
Blue Hills Bancorp, Inc.
ITEM 8. | FINANCIAL STATEMENTS AND SUPPLEMENTARY DATA |
Page | |
72
REPORT OF INDEPENDENT REGISTERED PUBLIC ACCOUNTING FIRM
To the Board of Directors and Stockholders of Blue Hills Bancorp, Inc.:
Opinion on the Consolidated Financial Statements
We have audited the accompanying consolidated balance sheets of Blue Hills Bancorp, Inc. and Subsidiaries (the "Company") as of December 31, 2017 and 2016, the related consolidated statements of net income, comprehensive income (loss), changes in stockholders’ equity and cash flows for each of the three years in the period ended December 31, 2017, and the related notes (collectively referred to as the "consolidated financial statements"). In our opinion, the consolidated financial statements present fairly, in all material respects, the financial position of the Company as of December 31, 2017 and 2016, and the results of its operations and its cash flows for each of the three years in the period ended December 31, 2017, in conformity with accounting principles generally accepted in the United States of America.
Basis for Opinion
These consolidated financial statements are the responsibility of the Company's management. Our responsibility is to express an opinion on the Company's consolidated financial statements based on our audits. We are a public accounting firm registered with the Public Company Accounting Oversight Board (United States) ("PCAOB") and are required to be independent with respect to the Company in accordance with the U.S. federal securities laws and the applicable rules and regulations of the Securities and Exchange Commission and the PCAOB.
We conducted our audits in accordance with the standards of the PCAOB. Those standards require that we plan and perform the audit to obtain reasonable assurance about whether the consolidated financial statements are free of material misstatement, whether due to error or fraud. Our audits included performing procedures to assess the risks of material misstatement of the consolidated financial statements, whether due to error or fraud, and performing procedures that respond to those risks. Such procedures included examining, on a test basis, evidence regarding the amounts and disclosures in the consolidated financial statements. Our audits also included evaluating the accounting principles used and significant estimates made by management, as well as evaluating the overall presentation of the consolidated financial statements. We believe that our audits provide a reasonable basis for our opinion.
/s/ Wolf & Company, P.C.
We have served as the Company's auditor since 2001.
Boston, Massachusetts
March 7, 2018
73
Blue Hills Bancorp, Inc. and Subsidiaries
Consolidated Balance Sheets
December 31, | |||||||
2017 | 2016 | ||||||
(In thousands, except share data) | |||||||
Assets | |||||||
Cash and due from banks | $ | 16,149 | $ | 14,752 | |||
Short-term investments | 30,018 | 15,744 | |||||
Total cash and cash equivalents | 46,167 | 30,496 | |||||
Securities available for sale, at fair value | 9,720 | 204,836 | |||||
Securities held to maturity, at amortized cost | 303,716 | 201,027 | |||||
Federal Home Loan Bank stock, at cost | 12,105 | 13,352 | |||||
Loans held for sale | 8,992 | 2,761 | |||||
Loans, net of allowance for loan losses of $20,877 in 2017 and $18,750 in 2016 | 2,186,147 | 1,912,871 | |||||
Premises and equipment, net | 21,573 | 22,034 | |||||
Accrued interest receivable | 6,438 | 6,057 | |||||
Goodwill | 9,160 | 9,160 | |||||
Core deposit intangible | 557 | 1,400 | |||||
Net deferred tax asset | 6,000 | 10,146 | |||||
Bank-owned life insurance | 33,078 | 32,015 | |||||
Other assets | 24,867 | 23,537 | |||||
$ | 2,668,520 | $ | 2,469,692 | ||||
Liabilities and Stockholders' Equity | |||||||
Deposits: | |||||||
Non-interest bearing | $ | 219,984 | $ | 184,982 | |||
Interest bearing | 1,819,885 | 1,623,705 | |||||
Total deposits | 2,039,869 | 1,808,687 | |||||
Short-term borrowings | 100,000 | 146,000 | |||||
Long-term debt | 105,000 | 105,000 | |||||
Accrued expenses and other liabilities | 25,845 | 23,098 | |||||
Total liabilities | 2,270,714 | 2,082,785 | |||||
Commitments and contingencies (Notes 1, 4 and 13) | |||||||
Stockholders' Equity: | |||||||
Preferred stock, zero par value, (50,000,000 shares authorized; none issued and outstanding) | — | — | |||||
Common stock, $0.01 par value; 100,000,000 shares authorized, 26,827,660 and 26,759,953 issued and outstanding at December 31, 2017 and 2016, respectively | 268 | 268 | |||||
Additional paid-in capital | 254,750 | 249,308 | |||||
Unearned compensation- ESOP | (19,737 | ) | (20,496 | ) | |||
Retained earnings | 163,978 | 161,896 | |||||
Accumulated other comprehensive loss | (1,453 | ) | (4,069 | ) | |||
Total stockholders' equity | 397,806 | 386,907 | |||||
$ | 2,668,520 | $ | 2,469,692 | ||||
The accompanying notes are an integral part of these consolidated financial statements.
74
Blue Hills Bancorp, Inc. and Subsidiaries
Consolidated Statements of Net Income
Years Ended December 31, 2017, 2016 and 2015
2017 | 2016 | 2015 | |||||||||
(Dollars in thousands, except per share data) | |||||||||||
Interest and dividend income: | |||||||||||
Interest and fees on loans | $ | 76,701 | $ | 58,953 | $ | 45,342 | |||||
Interest on securities | 7,110 | 8,895 | 8,828 | ||||||||
Dividends | 733 | 1,596 | 4,068 | ||||||||
Other | 231 | 94 | 63 | ||||||||
Total interest and dividend income | 84,775 | 69,538 | 58,301 | ||||||||
Interest expense: | |||||||||||
Interest on deposits | 15,215 | 10,488 | 7,527 | ||||||||
Interest on borrowings | 2,523 | 2,088 | 1,217 | ||||||||
Total interest expense | 17,738 | 12,576 | 8,744 | ||||||||
Net interest and dividend income | 67,037 | 56,962 | 49,557 | ||||||||
Provision for loan losses | 2,098 | 4,885 | 4,090 | ||||||||
Net interest and dividend income, after provision for loan losses | 64,939 | 52,077 | 45,467 | ||||||||
Noninterest income: | |||||||||||
Deposit account fees | 1,418 | 1,327 | 1,314 | ||||||||
Interchange and ATM fees | 1,609 | 1,546 | 1,511 | ||||||||
Mortgage banking | 3,657 | 2,473 | 282 | ||||||||
Loss on sale of purchased home equity portfolio | (118 | ) | — | — | |||||||
Loan level derivative fee income | 2,792 | 2,371 | 2,120 | ||||||||
Gains (losses) on sales and calls of securities, net | (94 | ) | 1,280 | 1,968 | |||||||
Gain on exchange of investment in Northeast Retirement Services | 5,947 | — | — | ||||||||
Bank-owned life insurance income | 1,063 | 1,048 | 1,031 | ||||||||
Bank-owned life insurance death benefit gains | — | 506 | — | ||||||||
Miscellaneous | 808 | 1,576 | 453 | ||||||||
Total noninterest income | 17,082 | 12,127 | 8,679 | ||||||||
Noninterest expense: | |||||||||||
Salaries and employee benefits | 31,278 | 28,853 | 22,570 | ||||||||
Occupancy and equipment | 8,393 | 7,370 | 6,267 | ||||||||
Data processing | 4,149 | 3,460 | 3,510 | ||||||||
Professional fees | 2,275 | 2,638 | 2,689 | ||||||||
Advertising | 1,922 | 2,423 | 2,458 | ||||||||
FDIC deposit insurance | 881 | 1,125 | 999 | ||||||||
Directors’ fees | 1,566 | 1,458 | 644 | ||||||||
Amortization of core deposit intangible | 843 | 1,225 | 1,607 | ||||||||
Other general and administrative | 2,999 | 3,194 | 3,338 | ||||||||
Total noninterest expense | 54,306 | 51,746 | 44,082 | ||||||||
Income before income taxes | 27,715 | 12,458 | 10,064 | ||||||||
Provision for income taxes | 11,226 | 3,805 | 2,837 | ||||||||
Net income | $ | 16,489 | $ | 8,653 | $ | 7,227 | |||||
Earnings per common share: | |||||||||||
Basic | $ | 0.69 | $ | 0.35 | $ | 0.28 | |||||
Diluted | $ | 0.67 | $ | 0.35 | $ | 0.28 | |||||
Weighted average shares outstanding: | |||||||||||
Basic | 23,985,822 | 24,420,405 | 26,064,947 | ||||||||
Diluted | 24,482,414 | 24,540,929 | 26,069,589 | ||||||||
The accompanying notes are an integral part of these consolidated financial statements.
75
Blue Hills Bancorp, Inc. and Subsidiaries
Consolidated Statements of Comprehensive Income (Loss)
Years Ended December 31, 2017, 2016 and 2015
2017 | 2016 | 2015 | |||||||||
(In thousands) | |||||||||||
Net income | $ | 16,489 | $ | 8,653 | $ | 7,227 | |||||
Other comprehensive income (loss): | |||||||||||
Securities available for sale: | |||||||||||
Change in unrealized holding gains (losses) | 3,276 | 3,849 | (8,332 | ) | |||||||
Reclassification adjustment for net (gains) losses realized in net income (1) | 94 | (1,235 | ) | (1,968 | ) | ||||||
Reclassification of unrealized gains on securities transferred to held to maturity | — | — | (666 | ) | |||||||
Net unrealized gains (losses) | 3,370 | 2,614 | (10,966 | ) | |||||||
Tax effect | (1,147 | ) | (938 | ) | 3,818 | ||||||
Net-of-tax amount | 2,223 | 1,676 | (7,148 | ) | |||||||
Securities held to maturity: | |||||||||||
Reclassification of unrealized gains on securities transferred from available for sale | — | — | 666 | ||||||||
Amortization of amounts previously recorded upon transfer from available for sale (2) | (87 | ) | (234 | ) | (95 | ) | |||||
Net change in unrealized gains | (87 | ) | (234 | ) | 571 | ||||||
Tax effect | 48 | 83 | (197 | ) | |||||||
Net-of-tax amount | (39 | ) | (151 | ) | 374 | ||||||
Defined benefit pension plan: | |||||||||||
Gains (losses) arising during the period | 491 | (895 | ) | (1,610 | ) | ||||||
Reclassification adjustment for losses recognized in net periodic benefit cost (3) | 297 | 271 | 110 | ||||||||
Net gains (losses) | 788 | (624 | ) | (1,500 | ) | ||||||
Tax effect | (356 | ) | 218 | 509 | |||||||
Net-of-tax amount | 432 | (406 | ) | (991 | ) | ||||||
Other comprehensive income (loss) | 2,616 | 1,119 | (7,765 | ) | |||||||
Comprehensive income (loss) | $ | 19,105 | $ | 9,772 | $ | (538 | ) | ||||
_______________________
(1) | Amounts are included in gains on sales and calls of securities, net and net impairment losses, in noninterest income in the consolidated statements of net income. Income tax expense (benefit) associated with the reclassification adjustment for the years ended December 31, 2017, 2016 and 2015 was approximately $(32,000), $431,000 and $691,000, respectively. |
(2) | Amounts are included in interest income on securities in the consolidated statements of net income. Income tax expense associated with the amortization amount for the years ended December 31, 2017, 2016 and 2015 was $48,000, $83,000, and $35,000, respectively. |
(3) | Amounts are included in salaries and employee benefits, in noninterest expense in the consolidated statements of net income. Income tax benefit associated with the reclassification adjustment for the years ended December 31, 2017, 2016 and 2015 was $121,000, $97,000 and $37,000, respectively. |
The accompanying notes are an integral part of these consolidated financial statements.
76
Blue Hills Bancorp, Inc. and Subsidiaries
Consolidated Statements of Changes in Stockholders' Equity
For the Years Ended December 31, 2017, 2016 and 2015
Common Stock | Additional paid-in capital | Unearned Compensation- ESOP | Retained Earnings | Accumulated Other Comprehensive Income (Loss) | Total | |||||||||||||||
Shares | Amount | |||||||||||||||||||
(In thousands, except share data) | ||||||||||||||||||||
Balance at December 31, 2014 | 28,466,813 | $ | 285 | $ | 281,035 | $ | (22,014 | ) | $ | 149,723 | $ | 2,577 | $ | 411,606 | ||||||
Comprehensive income (loss) | — | — | — | — | 7,227 | (7,765 | ) | (538 | ) | |||||||||||
ESOP shares committed to be released | — | — | 304 | 759 | — | — | 1,063 | |||||||||||||
Common stock dividends declared ($0.04 per share) | — | — | — | — | (1,032 | ) | — | (1,032 | ) | |||||||||||
Repurchase of common stock | (929,300 | ) | (10 | ) | (13,111 | ) | — | — | — | (13,121 | ) | |||||||||
Share redemption for tax withholdings on deferred compensation obligation | (27,956 | ) | — | (439 | ) | — | — | — | (439 | ) | ||||||||||
Restricted stock awards granted | 983,175 | 10 | (10 | ) | — | — | — | — | ||||||||||||
Stock based compensation expenses | — | — | 1,124 | — | — | — | 1,124 | |||||||||||||
Tax benefit from deferred compensation | — | — | 166 | — | — | — | 166 | |||||||||||||
Balance at December 31, 2015 | 28,492,732 | 285 | 269,069 | (21,255 | ) | 155,918 | (5,188 | ) | 398,829 | |||||||||||
Comprehensive income | — | — | — | — | 8,653 | 1,119 | 9,772 | |||||||||||||
ESOP shares committed to be released | — | — | 371 | 759 | — | — | 1,130 | |||||||||||||
Common stock dividends declared ($0.11 per share) | — | — | — | — | (2,675 | ) | — | (2,675 | ) | |||||||||||
Repurchase of common stock | (1,708,340 | ) | (17 | ) | (24,415 | ) | — | — | — | (24,432 | ) | |||||||||
Restricted stock awards granted | 31,450 | — | — | — | — | — | — | |||||||||||||
Restricted stock awards forfeited | (11,800 | ) | — | — | — | — | — | — | ||||||||||||
Stock based compensation expenses | — | — | 4,868 | — | — | — | 4,868 | |||||||||||||
Share redemption for tax withholdings for restricted stock vesting | (46,969 | ) | — | (730 | ) | — | — | — | (730 | ) | ||||||||||
Proceeds from exercise of options | 2,880 | — | 40 | — | — | — | 40 | |||||||||||||
Tax benefit from deferred and stock based compensation | — | — | 105 | — | — | — | 105 | |||||||||||||
Balance at December 31, 2016 | 26,759,953 | 268 | 249,308 | (20,496 | ) | 161,896 | (4,069 | ) | 386,907 | |||||||||||
Cumulative effect of change in accounting principle (Note 1) | — | — | 27 | — | (27 | ) | — | — | ||||||||||||
Comprehensive income | — | — | — | — | 16,489 | 2,616 | 19,105 | |||||||||||||
ESOP shares committed to be released | — | — | 672 | 759 | — | — | 1,431 | |||||||||||||
Common stock dividends declared ($0.60 per share) | — | — | — | — | (14,380 | ) | — | (14,380 | ) | |||||||||||
Restricted stock awards granted | 184,695 | 1 | — | — | — | — | 1 | |||||||||||||
Restricted stock awards forfeited | (85,317 | ) | (1 | ) | — | — | — | — | (1 | ) | ||||||||||
Stock based compensation expenses | — | — | 5,483 | — | — | — | 5,483 | |||||||||||||
Share redemption for tax withholdings for restricted stock vesting | (49,141 | ) | — | (983 | ) | — | — | — | (983 | ) | ||||||||||
Proceeds from exercise of options | 17,470 | — | 243 | — | — | — | 243 | |||||||||||||
Balance at December 31, 2017 | 26,827,660 | $ | 268 | $ | 254,750 | $ | (19,737 | ) | $ | 163,978 | $ | (1,453 | ) | $ | 397,806 | |||||
The accompanying notes are an integral part of these consolidated financial statements.
77
Blue Hills Bancorp, Inc. and Subsidiaries
Consolidated Statements of Cash Flows
Years Ended December 31, 2017, 2016 and 2015
2017 | 2016 | 2015 | |||||||||
(In thousands) | |||||||||||
Cash flows from operating activities: | |||||||||||
Net income | $ | 16,489 | $ | 8,653 | $ | 7,227 | |||||
Adjustments to reconcile net income to net cash provided by operating activities: | |||||||||||
Provision for loan losses | 2,098 | 4,885 | 4,090 | ||||||||
Net amortization of securities | 1,650 | 2,924 | 3,710 | ||||||||
Losses (gains) on sales and calls of securities, net | 94 | (1,280 | ) | (1,968 | ) | ||||||
Net change in loans held for sale | (6,231 | ) | (1,106 | ) | (374 | ) | |||||
Losses (gains) on sales of residential portfolio loans, net | (54 | ) | (319 | ) | 44 | ||||||
Loss on sale of purchased home equity portfolio | 118 | — | — | ||||||||
Loss on sale of foreclosed property | 7 | — | — | ||||||||
Net amortization of deferred loan origination costs and discounts | 11 | (374 | ) | 100 | |||||||
Depreciation and amortization of premises and equipment | 2,120 | 2,011 | 1,824 | ||||||||
Amortization of core deposit intangible | 843 | 1,225 | 1,607 | ||||||||
Bank-owned life insurance income, including death benefit gains | (1,063 | ) | (1,554 | ) | (1,031 | ) | |||||
ESOP expense | 1,431 | 1,130 | 1,063 | ||||||||
Deferred income tax provision (benefit) | 2,691 | (118 | ) | (302 | ) | ||||||
Stock based compensation expense | 5,483 | 4,868 | 1,124 | ||||||||
Excess tax benefit from deferred and stock based compensation | — | 105 | 166 | ||||||||
Gain on exchange of investment in Northeast Retirement Services | (5,947 | ) | — | — | |||||||
Net change in: | |||||||||||
Accrued interest receivable | (381 | ) | (713 | ) | (911 | ) | |||||
Other assets | (2,545 | ) | (3,477 | ) | (1,153 | ) | |||||
Accrued expenses and other liabilities | 2,882 | 809 | (8,661 | ) | |||||||
Net cash provided by operating activities | 19,696 | 17,669 | 6,555 | ||||||||
Cash flows from investing activities: | |||||||||||
Activity in securities available for sale: | |||||||||||
Purchases | (13,951 | ) | (76,512 | ) | (153,222 | ) | |||||
Sales | 213,084 | 97,824 | 99,522 | ||||||||
Maturities/calls | — | 4,133 | 5,632 | ||||||||
Principal paydowns | 5,049 | 3,497 | 24,487 | ||||||||
Activity in securities held to maturity: | |||||||||||
Purchases | (167,591 | ) | (59,939 | ) | (23,361 | ) | |||||
Maturities/calls | 30,000 | 22,835 | 9,000 | ||||||||
Principal paydowns | 33,595 | 34,866 | 10,421 | ||||||||
Loan originations and purchases, net of paydowns | (339,412 | ) | (403,729 | ) | (400,115 | ) | |||||
Proceeds from residential portfolio loan sales | 51,661 | 21,163 | 7,608 | ||||||||
Proceeds from sale of purchased home equity portfolio | 12,100 | — | — | ||||||||
Proceeds from sale of foreclosed property | 195 | — | — | ||||||||
Net purchases of premises and equipment | (1,659 | ) | (4,030 | ) | (3,051 | ) | |||||
Purchases of FHLBB stock | (9,353 | ) | (5,487 | ) | (3,296 | ) | |||||
Redemption of FHLBB stock | 10,600 | 5,702 | 1,431 | ||||||||
Proceeds from exchange of investment in Northeast Retirement Services | 1,595 | — | — | ||||||||
Proceeds from bank-owned life insurance death benefits | — | 1,165 | — | ||||||||
Net cash used in investing activities | (174,087 | ) | (358,512 | ) | (424,944 | ) | |||||
The accompanying notes are an integral part of these consolidated financial statements.
(continued)
78
Blue Hills Bancorp, Inc. and Subsidiaries
Consolidated Statements of Cash Flows
Years Ended December 31, 2017, 2016 and 2015
(concluded)
2017 | 2016 | 2015 | |||||||||
(In thousands) | |||||||||||
Cash flows from financing activities: | |||||||||||
Net change in deposits, excluding brokered | 189,495 | 252,295 | 124,670 | ||||||||
Net change in brokered deposits | 41,687 | 122,543 | 96,463 | ||||||||
Net change in short-term borrowings | (46,000 | ) | (59,000 | ) | 165,000 | ||||||
Repayments of long-term debt | (45,000 | ) | (20,000 | ) | — | ||||||
Proceeds from long-term debt | 45,000 | 70,000 | 20,000 | ||||||||
Repurchase of common stock | — | (24,432 | ) | (13,121 | ) | ||||||
Share redemption for tax withholdings on deferred compensation obligation | — | — | (439 | ) | |||||||
Share redemption for tax withholdings for restricted stock vesting | (983 | ) | (730 | ) | — | ||||||
Proceeds from exercise of stock options | 243 | 40 | — | ||||||||
Common stock dividends paid | (14,380 | ) | (2,675 | ) | (1,032 | ) | |||||
Net cash provided by financing activities | 170,062 | 338,041 | 391,541 | ||||||||
Net change in cash and cash equivalents | 15,671 | (2,802 | ) | (26,848 | ) | ||||||
Cash and cash equivalents at beginning of year | 30,496 | 33,298 | 60,146 | ||||||||
Cash and cash equivalents at end of year | $ | 46,167 | $ | 30,496 | $ | 33,298 | |||||
Supplementary information: | |||||||||||
Interest paid | $ | 17,358 | $ | 12,378 | $ | 8,700 | |||||
Income taxes paid, net of refunds | 7,674 | 4,390 | 4,280 | ||||||||
Securities transferred from available-for-sale to held-to-maturity | — | — | 196,958 | ||||||||
Portfolio loans transferred to loans held for sale designation | — | — | 11,222 | ||||||||
The accompanying notes are an integral part of these consolidated financial statements.
79
BLUE HILLS BANCORP, INC. AND SUBISDIARIES
NOTES TO CONSOLIDATED FINANCIAL STATEMENTS
NOTE 1 - BASIS OF PRESENTATION AND CONSOLIDATION
Basis of Presentation
The accompanying consolidated financial statements include the accounts of Blue Hills Bancorp, Inc. (the “Company”), a Maryland corporation, and its wholly-owned subsidiaries, Blue Hills Funding Corporation and Blue Hills Bank ("the Bank"), the principal operating entity. The Bank's wholly-owned subsidiaries include B.H. Security Corporation, HP Security Corporation, and 1196 Corporation, which are Massachusetts security corporations. All significant intercompany balances and transactions have been eliminated in consolidation.
Business
The Company provides a variety of financial services to individuals and businesses online and through its branches and loan offices in Boston, Cambridge, Concord, Dedham, Dorcheseter, Franklin, Hingham, Hyde Park, Lowell, Milton, Nantucket, Norwood, Marblehead, Plymouth, West Roxbury, Westwood, and Winchester Massachusetts. Its primary deposit products are checking, savings, money market and term certificate accounts and its primary lending products are residential mortgage loans, home equity loans, commercial real estate loans, commercial business loans and consumer loans.
Use of estimates
In preparing consolidated financial statements in conformity with accounting principles generally accepted in the United States of America, management is required to make estimates and assumptions that affect the reported amounts of assets and liabilities as of the date of the balance sheet and reported amounts of revenues and expenses during the reporting period. Actual results could differ from those estimates. Material estimates that are particularly susceptible to significant change in the near term relate to the determination of the allowance for loan losses and the realizability of deferred tax assets.
Cash and cash equivalents
For purposes of the consolidated statements of cash flows, cash and cash equivalents include cash on hand, balances due from banks, and short-term investments comprised of federal funds sold, money-market mutual funds, and interest-bearing deposits, all of which mature within ninety days. The Company maintains balances on deposit with other financial institutions in excess of the federally insured limit.
Restrictions on cash and due from banks
The Company may be required to maintain average balances on hand or with the Federal Reserve Bank ( the “FRB”). At December 31, 2017 and December 31, 2016 there was no reserve requirement.
Fair value hierarchy
The Company groups its assets and liabilities measured at fair value in three levels, based on the markets in which the assets and liabilities are traded and the reliability of the assumptions used to determine fair value.
Level 1 - Valuation is based on quoted prices in active markets for identical assets or liabilities. Valuations are obtained from readily available pricing sources for market transactions involving identical assets or liabilities.
Level 2 - Valuation is based on observable inputs other than Level 1 prices, such as quoted prices for similar assets and liabilities; quoted prices in markets that are not active; or other inputs that are observable or can be corroborated by observable market data for substantially the full term of the assets and liabilities.
Level 3 - Valuation is based on unobservable inputs that are supported by little or no market activity and that are significant to the fair value of the assets or liabilities. Level 3 assets and liabilities include those whose value is determined using unobservable inputs to pricing models, discounted cash flow methodologies, or similar techniques, as well as instruments for which the determination of fair value requires significant management judgment or estimation.
Securities
Debt securities that management has the positive intent and ability to hold to maturity are classified as “held-to-maturity” and recorded at amortized cost. Securities not classified as held-to-maturity, including equity securities with readily determinable fair values, are classified as “available-for-sale” and recorded at fair value, with unrealized gains and losses excluded from earnings and reported in other comprehensive income.
80
Purchase premiums and discounts are recognized in interest income using the interest method over the terms of the securities. Gains and losses on the sale of securities are recorded on the trade date and are determined using the specific identification method.
At least quarterly, and more frequently when warranted by economic or market conditions, management evaluates all securities with a decline in fair value below the amortized cost of the investment to determine whether or not the impairment is deemed to be other-than-temporary ("OTTI"). OTTI is required to be recognized if: (1) the Company intends to sell the security; (2) it is more likely than not that the Company will be required to sell the security before recovery of its amortized cost basis; or (3) for debt securities, the present value of expected cash flows is not sufficient to recover the entire amortized cost basis. For all impaired debt securities that the Company intends to sell, or more likely than not will be required to sell, the full amount of the depreciation is recognized as OTTI through earnings. Credit-related OTTI for all other impaired debt securities is recognized through earnings. Non-credit related OTTI for such debt securities is recognized in other comprehensive income, net of applicable taxes. Marketable equity securities are evaluated for OTTI based on the severity and duration of the impairment and, if deemed to be other than temporary, the declines in fair value are reflected in earnings as realized losses.
Federal Home Loan Bank stock
The Company, as a member of the Federal Home Loan Bank of Boston (the "FHLBB") system, is required to maintain an investment in capital stock of the FHLBB. Based on the redemption provisions of the FHLBB, the stock has no quoted market value and is carried at cost. At its discretion, the FHLBB may declare dividends on the stock. The Company reviews its investment for impairment based on the ultimate recoverability of the cost basis in the FHLBB stock. As of December 31, 2017, and 2016, no impairment has been recognized.
Loans held for sale
Loans originated and intended for sale in the secondary market are carried at the lower of cost or estimated fair value in the aggregate. Net unrealized losses, if any, are recognized through a valuation allowance by charges to income.
Loans
The Company has historically granted mortgage and consumer loans to its customers and a substantial portion of the loan portfolio consists of mortgage loans in communities including and near the locations of its banking offices. The ability of the Company’s debtors to honor their contracts is dependent upon the real estate and general economic conditions in these areas.
The Company’s loan portfolio includes 1-4 family residential real estate, home equity, commercial real estate, construction, commercial business, and consumer segments.
Loans that management has the intent and ability to hold for the foreseeable future or until maturity or pay-off generally are reported at their outstanding unpaid principal balances adjusted for the allowance for loan losses, charge-offs, deferred origination fees and costs, and discounts and fair value adjustments on purchased loans. Interest income is accrued on the unpaid principal balance. Deferred loan origination fees/costs and discounts on purchased loans are recognized as an adjustment of the related loan yield using the interest method.
It is the policy of the Company to discontinue the accrual of interest on loans past due in excess of 90 days, unless the loan is well-secured and in the process of collection, or when in the judgment of management, the ultimate collectability of the principal or interest becomes doubtful and to reverse all interest previously accrued against interest income. Past due status is based on contractual terms of the loan. The interest on non-accrual loans is accounted for on the cash-basis until qualifying for return to accrual. Loans are returned to accrual status when all the principal and interest amounts contractually due have been current for six consecutive months and future payments are reasonably assured.
Allowance for loan losses
The allowance for loan losses is based on the size and the composition of the loan portfolio, delinquency levels, loss experience, economic conditions and other factors related to the collectability of the loan portfolio. Prior to the second quarter of 2016, for portfolios for which the Company had insufficient loss experience, losses from a national peer group of depository institutions with assets between one and five billion dollars for relevant portfolios dating back to 2009 were used. Commencing in the second quarter of 2016, the Company began to phase in its own loss history by loan type based upon the age and loss experience of the loan portfolio. This change impacted the loss factors used for the majority of loan portfolios. Loss experience is updated at least quarterly with consideration given to unique circumstances in the portfolio. Loan losses are charged against the allowance when management believes the uncollectability of a loan balance is confirmed. Subsequent recoveries, if any, are credited to the allowance.
81
The allowance for loan losses is evaluated regularly by management and reflects consideration of all significant factors that affect the collectability of the loan portfolio. The evaluation is inherently subjective as it requires estimates that are susceptible to significant revision as more information becomes available. It is the intention of management to maintain an allowance that is prudently commensurate with the growth and risk in the loan portfolio.
The allowance consists of general, allocated and unallocated components, as further described below:
General component
The general component of the allowance for loan losses is based on a combination of the Company's own history and an extrapolated historical loss experience based on FDIC data for depository institutions with assets of one billion to five billion dollars dating back to 2009, adjusted for qualitative and environmental factors including changes to lending policies and procedures, economic and business conditions, portfolio characteristics, staff experience, problem loan trends, collateral values, concentrations and the competitive, legal and regulatory environment.
The qualitative factors are determined based on the various risk characteristics of each loan segment. Risk characteristics relevant to each portfolio segment are as follows:
Residential real estate - The Company does not generally originate loans with a loan-to-value ratio greater than 80 percent and does not generally grant loans that would be classified as subprime upon origination. When the Company does extend credit either on a first- or second-lien basis at a loan-to-value ratio greater than 80 percent, such loans are supported by either mortgage insurance or state guarantee programs. All loans in this segment are collateralized by owner-occupied, 1-4 family residential real estate and repayment is dependent on the credit quality of the individual borrower. The health of the national economy, including unemployment rates and housing prices, will have an effect on the credit quality of loans in this segment.
Home equity - Loans in this segment are generally secured by first or second liens on residential real estate. Repayment is dependent on the credit quality of the individual borrower. The Company evaluates each loan application based on factors including the borrower’s credit score, income, length of employment, and other factors to establish the creditworthiness of the borrower.
Commercial real estate - Loans in this segment include investment real estate and are generally secured by assignments of leases, real estate collateral and owner-occupied properties. In cases where there is a concentration of exposure to a single large tenant, underwriting standards include analysis of the tenant’s ability to support lease payments over the duration of the loan. The underlying cash flows generated by the properties may be adversely impacted by a downturn in the economy due to increased vacancy rates, which in turn, can have an effect on the credit quality in this segment. Payments on loans secured by income-producing properties often depend on the successful operation and management of the properties. Management continually monitors the cash flows of these loans.
Construction - Loans in this segment primarily include real estate development loans for which payment is derived from permanent financing or sale of the property. Credit risk is affected by cost overruns, time to sell at an adequate price, and market conditions.
Commercial business - Loans in this segment are generally secured by business assets, including accounts receivable, inventory, real estate and intangible assets. Strict underwriting standards include considerations of the borrower’s ability to support the debt service requirements from the underlying historical and projected cash flows of the business, collateral values, the borrower’s credit history and the ultimate collectability of the debt. Economic conditions, real estate values, commodity prices, unemployment trends and other factors will affect the credit quality of loans in these segments.
Consumer - Loans in this segment primarily include used classic and collector automobile loans. A significant portion of the used automobile loan portfolio is comprised of geographically diverse loans originated by and purchased from a third party, who also provides collection services.
82
Allocated component
The allocated component relates to loans that are on the watch list (partially charged-off loans, non-accruing loans and accruing adversely-rated loans) and considered impaired. Impairment is measured by either the present value of expected future cash flows discounted at the loan’s effective interest rate or the fair value of the collateral if the loan is collateral dependent. An allowance is established when the discounted cash flows (or collateral value) of the impaired loan is lower than the carrying value of that loan.
A loan is considered impaired when, based on current information and events, it is probable that the Company will be unable to collect the scheduled payments of principal or interest when due according to the contractual terms of the loan agreement. Management reviews all loan types for individual impairment. Factors considered by management in determining impairment include payment status, collateral value, and the probability of collecting scheduled principal and interest payments when due. Loans that experience insignificant payment delays and payment shortfalls generally are not classified as impaired. Management determines the significance of payment delays and payment shortfalls on a case-by-case basis, taking into consideration all of the circumstances surrounding the loan and the borrower, including the length of the delay, the reasons for the delay, the borrower’s prior payment record, and the amount of the shortfall in relation to the principal and interest owed.
The Company periodically may agree to modify the contractual terms of loans. When a loan is modified and a concession is made to a borrower experiencing financial difficulty, the modification is considered a troubled debt restructuring (“TDR”). All TDRs are initially classified as impaired and generally remain impaired for the remaining life of the loan. The impaired classification may be removed if the borrower demonstrates compliance with the modified terms and the restructuring agreement specifies an interest rate equal to that which would be provided to a borrower with similar credit at the time of restructuring.
Unallocated component
Through the third quarter of 2016, the Company maintained an unallocated component to cover uncertainties that could affect management’s estimate of probable losses. The unallocated component of the allowance reflected the margin of imprecision inherent in the underlying assumptions used in the methodologies for estimating allocated and general reserves in the portfolio. As a large portion of the Company's loan portfolio had seasoned, the unallocated component of the allowance for loan losses was eliminated during the fourth quarter of 2016.
Foreclosed Assets
Assets acquired through, or in lieu of, loan foreclosure are held for sale and are initially recorded at fair value, less cost to sell, at the date of foreclosure, establishing a new cost basis. Subsequent to foreclosure, valuations are periodically performed by management and the assets are carried at the lower of carrying amount or fair value less cost to sell. Revenue and expenses from operations, changes in the valuation allowance and any direct writedowns are included in net expenses from foreclosed assets.
Premises and equipment
Land is carried at cost. Buildings, leasehold improvements and equipment are stated at cost, less accumulated depreciation and amortization, computed on the straight-line method over the estimated useful lives of the assets or the expected terms of the leases, if shorter. Expected terms include lease option periods to the extent that the exercise of such options is reasonably assured.
83
Goodwill and identifiable intangible assets
Goodwill is the price paid in excess of the fair value of net assets acquired and is not amortized. Goodwill at December 31, 2017 and 2016 relates to the acquisition of Nantucket Bank. Goodwill is evaluated for impairment at least annually, or more often if warranted, using a combined qualitative and quantitative impairment approach.The initial qualitative approach assesses whether the existence of events or circumstances led to a determination that it is more likely than not that the fair value of a reporting unit is less than its carrying amount. If, after assessing the totality of events and circumstances, the Company determines it is more likely than not that the fair value is less than carrying value, the two-step quantitative impairment test is performed. Step one of the quantitative impairment test compares book value to the fair value of the reporting unit. If test one is failed, a more detailed analysis is performed, which involves measuring the excess of the fair value of the reporting unit, as determined in step one, over the aggregate fair value of the individual assets, liabilities, and identifiable intangibles as if the reporting unit was being acquired in a business combination. Effective January 1, 2017, the Company adopted Financial Accounting Standards Board ("FASB") Accounting Standards Update ("ASU") 2017-04, Intangibles - Goodwill and Other (Topic 350): Simplifying the Test for Goodwill Impairment. The amendments in this Update simplify the goodwill impairment model by eliminating the second step of the model. The resulting impairment test compares the fair value of a reporting unit with its carrying amount, including goodwill. If the carrying amount exceeds the reporting unit’s fair value, an impairment charge would be recognized for the difference, but should not exceed the carrying amount of goodwill allocated to that reporting unit. The Company still has the option to perform the qualitative assessment to determine if the quantitative impairment test is necessary. Early adoption of this Update had no impact on the Company’s consolidated financial statements.
Identifiable intangible assets subject to amortization consist of the core deposit intangible acquired in the acquisition of Nantucket Bank, which has an estimated life of approximately 5.5 years. Identifiable intangible assets are reviewed for impairment whenever events or changes in circumstances indicate that the carrying amount of the assets may not be recoverable.
The core deposit intangible is being amortized using the sum of the years' digits method over its estimated life. Information related to the core deposit intangible, including the estimated annual amortization expense, is summarized below:
(In thousands) | |||
Balance at December 31, 2014 | $ | 4,232 | |
Amortization | (1,607 | ) | |
Balance at December 31, 2015 | 2,625 | ||
Amortization | (1,225 | ) | |
Balance at December 31, 2016 | 1,400 | ||
Amortization | (843 | ) | |
Balance at December 31, 2017 | $ | 557 | |
Estimated amortization expense for the years ending December 31, | |||
2018 | $ | 461 | |
2019 | 96 | ||
Total remaining | $ | 557 | |
Bank-owned life insurance
Bank-owned life insurance policies are reflected on the consolidated balance sheets at cash surrender value. Changes in cash surrender value are reflected in noninterest income in the consolidated statements of net income.
Mortgage Servicing Rights
The Company services mortgage loans for others. Mortgage servicing assets are recognized as separate assets when rights are acquired through purchase or through sale of financial assets. Fair value is determined using prices for similar assets with similar characteristics, when available, or based upon discounted cash flows using market-based assumptions. The valuation model incorporates assumptions that market participants would use in estimating future net servicing income, such as the cost to service, the discount rate, an inflation rate, ancillary income, prepayment speeds and default rates and losses. Capitalized servicing rights are reported in other assets and are amortized into loan servicing fee income in proportion to, and over the
84
period of, the estimated future net servicing income of the underlying financial assets. Servicing assets are evaluated for impairment based upon the fair value of the rights as compared to amortized cost. Impairment is determined by stratifying rights by predominant risk characteristics, such as interest rates and terms. Impairment is recognized through a valuation allowance for an individual stratum, to the extent that fair value is less than the capitalized amount for the stratum. Changes in the valuation allowance are reported in loan servicing fee income.
Non-marketable investments
The aggregate carrying amount of all cost and equity method investments included in other assets at December 31, 2017 and 2016 is $11.3 million and $10.2 million, respectively. The fair values of these investments are not readily available and are not evaluated for impairment unless there are identified events or changes in circumstances that may have a significant adverse effect on the fair value of the investments. At December 31, 2017 and 2016, the Company was contractually committed under these non-marketable investments to make additional capital contributions of $9.4 million and $8.9 million, respectively.
Interest rate swap agreements
For asset/liability management purposes, the Company periodically uses interest rate swap agreements to hedge various exposures or to modify interest rate characteristics of various balance sheet accounts. All interest rate swap agreements are recorded at fair value. Depending upon the intended use for the interest rate swap at inception, the Company designates the derivative as either an economic hedge of an asset or liability or a hedging instrument subject to the hedge accounting provisions. If the interest rate swap is not designated in a hedge relationship, gains or losses reflecting changes in fair value are recorded in earnings.
Certain interest rate swap contracts are utilized to help commercial loan borrowers manage their interest rate risk. The interest rate swap contracts with commercial loan borrowers allow the borrowers to convert floating rate loan payments to fixed rate payments. When the Company enters into an interest rate swap contract with a commercial loan borrower, the Company concurrently enters into a matching interest rate swap with a correspondent bank counterparty in order to minimize interest rate risk to the Company. These interest rate derivative instruments are recorded on the consolidated balance sheets as either an asset or liability measured at fair value. These derivatives do not qualify for hedge accounting. As such, all changes in fair value of these derivative instruments are included in miscellaneous income. The Company pays and receives fees for entering into these contracts. The net fees are recognized in loan level derivative income when received.
Derivative Loan Commitments
Mortgage loan commitments are referred to as derivative loan commitments if the loan that will result from exercise of the commitment will be held for sale upon funding. Loan commitments that are derivatives are recognized at fair value on the consolidated balance sheet in other assets and other liabilities with changes in their fair values recorded in mortgage banking income.
Forward Loan Sale Commitments
To protect against the price risk inherent in derivative loan commitments, the Company enters into forward loan sale commitments to mitigate the risk of potential decreases in the values of loans that would result from the exercise of the derivative loan commitments. Forward loan sale commitments are recognized at fair value on the consolidated balance sheet in other assets or other liabilities with changes in their fair values recorded in mortgage banking income. The Company estimates the fair value of its forward loan sale commitments based on changes in the fair value of underlying mortgage loans.
Transfers of financial assets
Transfers of an entire financial asset, a group of entire financial assets, or a participating interest in an entire financial asset are accounted for as sales when control over the assets has been surrendered. Control over transferred assets is deemed to be surrendered when (1) the assets have been isolated from the Company, (2) the transferee obtains the right (free of conditions that constrain it from taking advantage of that right) to pledge or exchange the transferred assets, and (3) the Company does not maintain effective control over the transferred assets through an agreement to repurchase them before their maturity.
During the normal course of business, the Company may transfer a portion of a financial asset, for example, a participation loan. In order to be eligible for sales treatment, the transfered portion of the loan must meet the criteria of a participating interest. If it does not meet the criteria of a participating interest, the transfer must be accounted for as a secured borrowing. In order to meet the criteria for a participating interest, all cash flows from the loan must be divided proportionately, the rights of each loan holder must have the same priority, the loan holders must have no recourse to the transferor other than standard representations and warranties and no loan holder has the right to pledge or exchange the entire loan.
85
Retirement plan
The Company accounts for its defined benefit pension plan using an actuarial model that allocates pension costs over the service period of employees in the plan. The Company accounts for the over-funded or under-funded status of its defined benefit plan as an asset or liability on its consolidated balance sheets and recognizes changes in the funded status that are not reflected in net periodic pension cost as other comprehensive income or loss. The Company amended its defined benefit pension plan in 2013 freezing the plan to new participants and subsequently amended the plan and froze it for all participants effective October 31, 2014.
Earnings per common share
Basic earnings per share represents income available to common stockholders divided by the weighted-average number of common shares outstanding during the period. Unallocated ESOP shares are not deemed outstanding for earnings per share calculations. Dividend rights on unvested restricted stock awards are forfeitable; therefore unvested restricted stock awards are not considered outstanding in the computation of basic earnings per share. Diluted earnings per share reflects additional common shares that would have been outstanding if dilutive potential common shares had been issued, as well as any adjustment to income that would result from the assumed issuance. Potential common shares that may be issued by the Company relate to outstanding stock options and unvested restricted stock awards and are determined using the treasury stock method.
Advertising costs
Advertising costs are expensed as incurred.
Share-based Compensation Plans
The Company measures and recognizes compensation cost relating to share-based payment transactions based on the grant-date fair value of the equity instruments issued. Share-based compensation is recognized over the period the employee is required to provide services for the award. The Company uses the Black-Scholes option-pricing model to determine the fair value of stock options granted. For an award with a performance and/or service condition that affects vesting, the performance and/or service condition is not considered in determining the award’s fair value on the grant date. On January 1, 2017, the Company applied the changes related to FASB ASU 2016-09, Compensation-Stock Compensation (Topic 718): Improvements to Employee Share-Based Payment Accounting. Under this Update, the Company has elected to account for forfeitures of share-based payments by recognizing forfeitures of awards as they occur (e.g., when an award does not vest because the employee leaves the Company or does not meet specific performance measures). The transition to this methodology is applied on a modified retrospective basis, whereby the compensation cost is calculated as if the company did not historically record a forfeiture estimate for outstanding awards and instead accounted for forfeitures of outstanding awards as the forfeitures occurred, with a cumulative-effect adjustment to retained earnings. The cumulative effect of changing to this methodology resulted in a $27,000 adjustment to beginning retained earnings in the consolidated statement of changes in stockholders' equity for the year ended December 31, 2017.
Employee Stock Ownership Plan
Compensation expense for the ESOP is recorded at an amount equal to the shares allocated by the ESOP multiplied by the average fair market value of the shares during the period. The Company recognizes compensation expense ratably over the year based upon the Company’s estimate of the number of shares expected to be allocated by the ESOP. Unearned compensation applicable to the ESOP is reflected as a reduction of stockholders' equity on the consolidated balance sheet. The difference between the average fair market value and the cost of the shares allocated by the ESOP is recorded as an adjustment to additional paid-in capital.
Income taxes
Deferred tax assets and liabilities are reflected at currently enacted income tax rates applicable to the period in which the deferred tax assets or liabilities are expected to be realized or settled. As changes in tax laws or rates are enacted, deferred tax assets and liabilities are adjusted through the provision for income taxes. Accordingly, changes resulting from the Tax Cuts and Jobs Act enacted on December 22, 2017 have been recognized in the consolidated financial statements as of and for the year ended December 31, 2017. See Note 8. The Company exercises significant judgment in evaluating the amount and timing of recognition of the resulting tax assets and liabilities. These judgments require the Company to make projections of future taxable income. These judgments and estimates, which are inherently subjective, are reviewed periodically as regulatory and business factors change. A valuation allowance related to deferred tax assets is established when, in the judgment of management, it is more likely than not that all or a portion of such deferred tax assets will not be realized.
86
A tax position that meets the more likely than not recognition threshold is initially and subsequently measured as the largest amount of tax benefit that has a greater than 50% likelihood of being realized upon settlement with a taxing authority that has full knowledge of all relevant information. The determination of whether or not a tax position has met the more likely than not recognition threshold considers the facts, circumstances and information available at the reporting date and is subject to management’s judgment. There was no reserve for uncertain tax positions as of December 31, 2017 or 2016. The Company records interest and penalties as part of income tax expense.
Effective January 1, 2017, with the application of ASU 2016-09, Compensation-Stock Compensation (Topic 718): Improvements to Employee Share-Based Payment Accounting, the Company no longer records the excess tax benefits or deficiencies related to share-based compensation in additional paid in capital. Instead, excess tax benefits or deficiencies are recorded in the income statement as part of the provision for income taxes on a prospective basis. For interim reporting purposes the excess tax benefits or deficiencies are recorded as discrete items in the period in which they occur. Excess tax benefits are now presented as an operating activity in the statement of cash flows. In addition, under the new guidance, when calculating incremental shares for earnings per share, entities exclude from assumed proceeds excess tax benefits that previously would have been recorded in additional paid in capital. The total income tax benefit recorded in the provision for income taxes relating to excess tax benefits on stock-based compensation for the year ended December 31, 2017 was $448,000.
In 2016, income tax benefits related to stock compensation in excess of grant date fair value less any proceeds on exercise were recognized as an increase to additional paid-in capital upon vesting or exercising and delivery of the stock. Any income tax effects related to stock compensation that were less than grant date fair value less any proceeds on exercise were recognized as a reduction of additional paid-in capital to the extent of previously recognized income tax benefits and then through income tax expense for the remaining amount.
Comprehensive Income/Loss
Accounting principles generally require that recognized revenue, expenses, gains and losses be included in net income. Although certain changes in assets and liabilities are reported as a separate component of the equity section of the balance sheet, such items, along with net income, are components of comprehensive income/loss.
Reclassification
Certain amounts in the 2016 consolidated financial statements have been reclassified to conform to the 2017 presentation.
NOTE 2 – RECENT ACCOUNTING STANDARDS UPDATES
In February 2018, the FASB issued ASU 2018-02, Reclassification of Certain Tax Effects from Accumulated Other Comprehensive Income. The purpose of this Update is to allow a reclassification from accumulated other comprehensive income to retained earnings for stranded tax effects resulting from the Tax Cuts and Jobs Act. The Update is effective for public business entities for annual periods being after December 15, 2018, and interim periods within those fiscal years. Early adoption of the amendments in this Update is permitted, including adoption in any interim period. The Company adopted the Update on January 1, 2018. The impact to the consolidated financial statements upon adopting this Update is not material. See Note 16 to the consolidated financial statements.
In August 2017, the FASB issued ASU 2017-12, Derivatives and Hedging:Targeted Improvements to Accounting for Hedging Activities. The purpose of this Update is to better align a company’s financial reporting for hedging activities with the economic objectives of those activities. This Update is effective for public business entities for fiscal years beginning after December 15, 2018, with early adoption, including adoption in an interim period permitted. The Update requires a modified retrospective transition method in which the Company will recognize the cumulative effect of the change on the opening balance of each affected component of equity in the statement of financial position as of the date of adoption. While the Company continues to assess all potential impacts of the standard, we currently expect the adoption to have an immaterial impact on our consolidated financial statements.
87
In May 2017, the FASB issued ASU 2017-09, Compensation-Stock Compensation (Topic 718): Scope of Modification Accounting which amends the scope of modification accounting for share-based payment arrangements. The Update provides guidance on the types of changes to the terms or conditions of share-based payment awards to which an entity would be required to apply modification accounting. Specifically, an entity would not apply modification accounting if the fair value, vesting conditions, and classification of the awards are the same immediately before and after the modification. The Update is effective for public business entities for annual periods being after December 15, 2017, including interim periods within those annual periods. The Update should be applied prospectively to awards modified on or after the effective date. The impact to the consolidated financial statements upon adopting this Update is not expected to be material.
In January 2016, the FASB issued ASU 2016-01, Financial Instruments – Overall, (Subtopic 825-10). The amendments in this Update address certain aspects of recognition, measurement, presentation, and disclosure of financial instruments. Targeted improvements to generally accepted accounting principles include the requirement for equity investments (except those accounted for under the equity method of accounting or those that result in consolidation of the investee) to be measured at fair value with changes in fair value recognized in net income and the elimination of the requirement for public business entities to disclose the methods and significant assumptions used to estimate the fair value for financial instruments measured at amortized cost. For public business entities, the amendments in this Update are effective for fiscal years beginning after December 15, 2017, including interim periods within those fiscal years. The Company does not anticipate that adoption of the Update will materially impact the Company's financial position. The Update also requires Companies to utilize an "exit price" fair value methodology when measuring the fair value of financial instruments. The impact of the change, if applied, to the Company's equity investments for the year ended December 31, 2017 would have resulted in a gain of $1.7 million (pre-tax) being recognized in net income, after reclassification for the realized loss on mutual funds.
In February 2016, the FASB issued ASU 2016-02, Leases (Topic 842). This Update is intended to improve financial reporting about leasing transactions and the key provision impacting the Company is the requirement for a lessee to record a right-to-use asset and a liability representing the obligation to make lease payments for long-term operating leases. Additionally, the Update includes additional quantitative and qualitative disclosures required by lessees and lessors to help users better understand the amount, timing, and uncertainty of cash flows arising from leases. This Update is effective for fiscal years beginning after December 31, 2018, and interim periods within those fiscal years. Lessees and lessors are required to recognize and measure leases at the beginning of the earliest period presented using a modified retrospective approach. The modified retrospective approach includes a number of optional practical expedients that entities may elect to apply as well as transition guidance specific to nonstandard leasing transactions. The Company's assets and liabilities will increase based on the present value of remaining lease payments for leases in place at the adoption date; however, this is not expected to be material to the Company's results of operations or financial position. Future lease commitments as of December 31, 2017 amounted to $21.8 million.
In June, 2016, the FASB issued ASU 2016-13, Financial Instruments-Credit Losses (Topic 326): Measurement of Credit Losses on Financial Instruments, which removes the thresholds that companies apply to measure credit losses on financial instruments measured at amortized cost, such as loans, receivables, and held-to-maturity debt securities. Under current U.S. GAAP, companies generally recognize credit losses when it is probable that the loss has been incurred. The revised guidance will remove previously established recognition thresholds based on probability, and will require companies to recognize an allowance for credit losses for the difference between the amortized cost basis of a financial instrument and the net amount that the company expects to collect over the instrument’s contractual life. ASU 2016-13 also amends the credit loss measurement guidance for available-for-sale debt securities and will require that credit losses be recorded through an allowance for credit losses. Additionally, this Update may reduce the carrying value of the Company's held-to-maturity investment securities as it will require an allowance on the expected losses over the life of these securities to be recorded upon adoption. The ASU is effective for public business entities fiscal years beginning after December 15, 2019 and for interim periods within those fiscal years. Any increase in our allowance for loan losses or expenses may have a material adverse effect on our financial condition and results of operations. The Company is actively working through the provisions of the Update. Management has established a steering committee which has identified the methodologies and the additional data requirements necessary to implement the Update and has engaged a third-party software service provider to assist in the Company's implementation.
In May 2014, the FASB issued ASU 2014-09, Revenue from Contracts with Customers. This Update provides a revenue recognition framework for any entity that either enters into contracts with customers to transfer goods or services or enters into contracts for the transfer of non-financial assets unless those contracts are within the scope of other accounting standards. This Update is effective for annual periods beginning after December 15, 2017, including interim periods within that reporting period with early adoption permitted. The Company's revenue relates principally to financial instruments, which are explicitly excluded from the scope of the new guidance. Therefore the impact to the consolidated financial statements upon adopting this Update is not expected to be material.
88
In October 2016, the FASB issued ASU 2016-16, Income Taxes (Topic 740): Intra-Entity Transfers of Assets Other Than Inventory. The amendments in this Update require an entity to recognize the income tax consequences of an intra-entity transfer of an asset other than inventory when the transfer occurs. For public business entities, the amendments are effective for annual reporting periods beginning after December 15, 2017, including interim reporting periods within those annual reporting periods. The impact to the consolidated financial statements upon adopting this Update is not expected to be material.
In November 2016, the FASB issued ASU 2016-18, Statement of Cash Flows (Topic 230): Restricted Cash. The amendments in this Update require that in the statement of cash flows, amounts generally described as restricted cash and restricted cash equivalents be included with cash and cash equivalents when reconciling the beginning-of-period and end-of-period total amounts. For public business entities, the amendments are effective for fiscal years beginning after December 15, 2017, and interim periods within those fiscal years. The impact to the consolidated financial statements upon adopting this Update is not expected to be material.
NOTE 3 - SECURITIES
The amortized cost and estimated fair value of securities available for sale and held to maturity, with gross unrealized gains and losses, follow:
December 31, 2017 | |||||||||||||||
Amortized Cost | Gross Unrealized Gains | Gross Unrealized Losses | Fair Value | ||||||||||||
(In thousands) | |||||||||||||||
Securities Available for Sale: | |||||||||||||||
Marketable equity securities | $ | 9,437 | $ | 755 | $ | (472 | ) | $ | 9,720 | ||||||
Securities Held to Maturity: | |||||||||||||||
Debt securities: | |||||||||||||||
Government-sponsored enterprises | $ | 30,673 | $ | — | $ | (894 | ) | $ | 29,779 | ||||||
Government-sponsored mortgage-backed and collateralized mortgage obligations | 244,668 | 30 | (3,437 | ) | 241,261 | ||||||||||
SBA asset-backed securities | 28,375 | 28 | (329 | ) | 28,074 | ||||||||||
Total securities held to maturity | $ | 303,716 | $ | 58 | $ | (4,660 | ) | $ | 299,114 | ||||||
89
December 31, 2016 | |||||||||||||||
Amortized Cost | Gross Unrealized Gains | Gross Unrealized Losses | Fair Value | ||||||||||||
(In thousands) | |||||||||||||||
Securities Available for Sale: | |||||||||||||||
Debt securities: | |||||||||||||||
Mortgage- and other asset-backed securities: | |||||||||||||||
Privately issued commercial mortgage-backed securities | $ | 10,530 | $ | — | $ | (41 | ) | $ | 10,489 | ||||||
Other asset-backed securities | 9,174 | 6 | (195 | ) | 8,985 | ||||||||||
Total mortgage- and other asset-backed securities | 19,704 | 6 | (236 | ) | 19,474 | ||||||||||
State and political | 12,730 | 120 | (157 | ) | 12,693 | ||||||||||
Financial services: | |||||||||||||||
Banks | 20,263 | 57 | (298 | ) | 20,022 | ||||||||||
Diversified financial entities | 17,198 | 190 | (198 | ) | 17,190 | ||||||||||
Insurance and REITs | 18,304 | 150 | (216 | ) | 18,238 | ||||||||||
Total financial services | 55,765 | 397 | (712 | ) | 55,450 | ||||||||||
Other corporate: | |||||||||||||||
Industrials | 49,217 | 508 | (761 | ) | 48,964 | ||||||||||
Utilities | 24,895 | 292 | (100 | ) | 25,087 | ||||||||||
Total other corporate | 74,112 | 800 | (861 | ) | 74,051 | ||||||||||
Total debt securities | 162,311 | 1,323 | (1,966 | ) | 161,668 | ||||||||||
Marketable equity securities: | |||||||||||||||
Mutual funds: | |||||||||||||||
Domestic community | 3,216 | 25 | (19 | ) | 3,222 | ||||||||||
Global asset allocation | 42,396 | 48 | (2,498 | ) | 39,946 | ||||||||||
Total marketable equity securities | 45,612 | 73 | (2,517 | ) | 43,168 | ||||||||||
Total securities available for sale | $ | 207,923 | $ | 1,396 | $ | (4,483 | ) | $ | 204,836 | ||||||
Securities Held to Maturity: | |||||||||||||||
Debt securities: | |||||||||||||||
Government-sponsored enterprises | $ | 32,667 | $ | 4 | $ | (934 | ) | $ | 31,737 | ||||||
Government-sponsored mortgage-backed and collateralized mortgage obligations | 153,938 | 14 | (1,806 | ) | 152,146 | ||||||||||
SBA asset-backed securities | 14,422 | — | (212 | ) | 14,210 | ||||||||||
Total securities held to maturity | $ | 201,027 | $ | 18 | $ | (2,952 | ) | $ | 198,093 | ||||||
During the third quarter of 2015, approximately $196.3 million of securities available for sale, with net unrealized gains of $666,000, were reclassified to held-to-maturity designation. Held-to-maturity investments are investments that management has the positive intent and ability to hold to maturity. If a security is reclassified from available-for-sale to held-to-maturity, the fair value at the time of transfer becomes the security's new cost basis. The unrealized holding gain at the transfer date continues to be reported in accumulated other comprehensive income and is amortized over the security's remaining life as an adjustment of yield in a manner similar to a premium or discount. At December 31, 2017, there are $250,000 of net holding gains remaining in accumulated other comprehensive income.
90
The amortized cost and estimated fair value of debt securities by contractual maturity at December 31, 2017 follow. Expected maturities will differ from contractual maturities because the issuers may have the right to call or prepay obligations with or without call or prepayment penalties. Based on expected maturities, the mortgage and asset-backed securities and collateralized mortgage obligations, included below, have a 3.9 year weighted average duration.
Held to Maturity | |||||||
Amortized Cost | Fair Value | ||||||
(In thousands) | |||||||
After 1 year through 5 years | $ | 15,626 | $ | 15,366 | |||
After 5 years through 10 years | 15,047 | 14,413 | |||||
30,673 | 29,779 | ||||||
Mortgage- and asset-backed securities and collateralized mortgage obligations amortizing monthly | 273,043 | 269,335 | |||||
Total debt securities | $ | 303,716 | $ | 299,114 | |||
For the years ended December 31, 2017, 2016 and 2015, proceeds from sales of securities available for sale amounted to $213.1 million, $97.8 million and $99.5 million, respectively. Gross realized gains amounted to $2.2 million, $2.3 million and $2.0 million, respectively, and gross realized losses amounted to $2.3 million, $981,000 and $56,000, respectively.
At December 31, 2017 and 2016, government-sponsored enterprise obligations with an amortized cost of $30.7 million and $27.3 million, respectively, and a fair value of $30.3 million and $27.0 million, respectively, were pledged to secure borrowings. See Note 7.
The Company continually reviews investment securities for the existence of OTTI, taking into consideration current market conditions, the extent and nature of changes in fair value, issuer rating changes and trends, the credit worthiness of the obligor of the security, volatility of earnings, current analysts’ evaluations, the Company’s intent to sell the security, or whether it is more likely than not that the Company will be required to sell the debt security before its anticipated recovery, as well as other qualitative factors. The term “other-than-temporary” is not intended to indicate that the decline is permanent, but indicates that the prospects for a near-term recovery of value is not necessarily favorable, or that there is a lack of evidence to support a realizable value equal to or greater than the carrying value of the investment.
Information pertaining to securities with gross unrealized losses aggregated by investment category and length of time that individual securities have been in a continuous loss position, follows:
December 31, 2017 | |||||||||||||||
Less Than Twelve Months | More Than Twelve Months | ||||||||||||||
Gross Unrealized Losses | Fair Value | Gross Unrealized Losses | Fair Value | ||||||||||||
(In thousands) | |||||||||||||||
Securities Available for Sale: | |||||||||||||||
Temporarily impaired marketable equity securities | $ | (449 | ) | $ | 4,310 | $ | (23 | ) | $ | 443 | |||||
Securities Held to Maturity: | |||||||||||||||
Debt securities: | |||||||||||||||
Government-sponsored enterprises | $ | (109 | ) | $ | 8,521 | $ | (785 | ) | $ | 21,258 | |||||
Government-sponsored mortgage-backed and collateralized mortgage obligations | (1,563 | ) | 119,782 | (1,874 | ) | 111,712 | |||||||||
SBA asset-backed securities | (34 | ) | 9,897 | (295 | ) | 11,423 | |||||||||
Total temporarily impaired securities held to maturity | $ | (1,706 | ) | $ | 138,200 | $ | (2,954 | ) | $ | 144,393 | |||||
91
December 31, 2016 | |||||||||||||||
Less Than Twelve Months | More Than Twelve Months | ||||||||||||||
Gross Unrealized Losses | Fair Value | Gross Unrealized Losses | Fair Value | ||||||||||||
(In thousands) | |||||||||||||||
Securities Available for Sale: | |||||||||||||||
Debt securities: | |||||||||||||||
Mortgage- and other asset-backed securities: | |||||||||||||||
Privately issued commercial mortgage- backed securities | $ | (11 | ) | $ | 3,163 | $ | (30 | ) | $ | 7,326 | |||||
Other asset-backed securities | (43 | ) | 3,924 | (152 | ) | 3,732 | |||||||||
Total mortgage- and other asset-backed securities | (54 | ) | 7,087 | (182 | ) | 11,058 | |||||||||
State and political | (157 | ) | 5,301 | — | — | ||||||||||
Financial services: | |||||||||||||||
Banks | (298 | ) | 14,553 | — | — | ||||||||||
Diversified financial entities | (198 | ) | 9,369 | — | — | ||||||||||
Insurance and REITs | (216 | ) | 6,900 | — | — | ||||||||||
Total financial services | (712 | ) | 30,822 | — | — | ||||||||||
Other corporate: | |||||||||||||||
Industrials | (655 | ) | 24,630 | (106 | ) | 2,284 | |||||||||
Utilities | (99 | ) | 11,200 | (1 | ) | 794 | |||||||||
Total other corporate | (754 | ) | 35,830 | (107 | ) | 3,078 | |||||||||
Total debt securities | (1,677 | ) | 79,040 | (289 | ) | 14,136 | |||||||||
Marketable equity securities: | |||||||||||||||
Mutual funds: | |||||||||||||||
Domestic community | — | — | (19 | ) | 448 | ||||||||||
Global asset allocation | (424 | ) | 15,153 | (2,074 | ) | 22,442 | |||||||||
Total marketable equity securities | (424 | ) | 15,153 | (2,093 | ) | 22,890 | |||||||||
Total temporarily impaired securities available for sale | $ | (2,101 | ) | $ | 94,193 | $ | (2,382 | ) | $ | 37,026 | |||||
Securities Held to Maturity: | |||||||||||||||
Debt securities: | |||||||||||||||
Government-sponsored enterprises | $ | (934 | ) | $ | 28,533 | $ | — | $ | — | ||||||
Government-sponsored mortgage-backed and collateralized mortgage obligations | (1,763 | ) | 146,098 | (43 | ) | 3,827 | |||||||||
SBA asset-backed securities | (104 | ) | 9,157 | (108 | ) | 5,053 | |||||||||
Total temporarily impaired securities held to maturity | $ | (2,801 | ) | $ | 183,788 | $ | (151 | ) | $ | 8,880 | |||||
At December 31, 2017, several debt securities have unrealized losses with aggregate depreciation of less than 2% from the Company’s amortized cost basis. The unrealized losses were primarily caused by interest rate fluctuations. It is expected that none of these securities would be settled at a price less than the par value of the investment. Because the decline in market value is attributable to changes in interest rates and not to credit quality, and because the Company does not intend to sell the securities and it is more likely than not that the Company will not be required to sell the securities before recovery of their amortized cost bases, which may be maturity, the Company does not consider these securities to be other than temporarily impaired at December 31, 2017.
92
At December 31, 2017, three equity securities have aggregate unrealized losses of $472,000; 9% of the Company’s cost basis. No issues have been identified that cause management to believe the declines in market value are other than temporary and the Company has the ability and intent to hold these investments until a recovery of fair value.
NOTE 4 - LOANS AND THE ALLOWANCE FOR LOAN LOSSES
A summary of the balances of loans follows:
December 31, | |||||||
2017 | 2016 | ||||||
(In thousands) | |||||||
Real estate: | |||||||
1-4 family residential | $ | 922,627 | $ | 851,154 | |||
Home equity | 80,662 | 78,719 | |||||
Commercial real estate | 834,264 | 687,289 | |||||
Construction | 91,050 | 76,351 | |||||
1,928,603 | 1,693,513 | ||||||
Commercial business | 253,509 | 206,234 | |||||
Consumer | 21,698 | 29,281 | |||||
Total loans | 2,203,810 | 1,929,028 | |||||
Allowance for loan losses | (20,877 | ) | (18,750 | ) | |||
Discount and fair value adjustments on purchased loans | (1,477 | ) | (1,846 | ) | |||
Deferred loan costs and fees, net | 4,691 | 4,439 | |||||
Loans, net | $ | 2,186,147 | $ | 1,912,871 | |||
The Company has sold residential mortgage loans in the secondary mortgage market, some of which are sold with limited recourse. The Company has retained the servicing responsibility on a portion of the loans sold and receives fees for the services provided. The unpaid principal balances of mortgage loans serviced for others were $245.1 million and $89.7 million at December 31, 2017 and 2016, respectively. The maximum contingent liability associated with loans sold with recourse is $7.6 million at December 31, 2017. Neither mortgage loans serviced for others nor the contingent liability associated with sold loans is recorded on the consolidated balance sheets. There have been no contingency losses recognized on these loans to date.
The Company has transferred a portion of its originated commercial real estate, commercial business and construction loans to participating lenders. The amounts transferred have been accounted for as sales and are therefore not included on the consolidated balance sheets. The Company and participating lenders share ratably in cash flows and any gains or losses that may result from a borrower’s lack of compliance with contractual terms of the loan. The Company continues to service the loans on behalf of the participating lenders and, as such, collects cash payments from the borrowers, remits payments (net of servicing fees) to participating lenders and disburses required escrow funds to relevant parties. At December 31, 2017 and 2016, the Company was servicing loans for participants aggregating $88.8 million and $56.0 million, respectively.
At December 31, 2017 and 2016, 1-4 family residential loans in the amount of $816.9 million and $759.9 million, respectively, and commercial real estate loans in the amount of $266.3 million and $293.1 million, respectively, were pledged to secure borrowings. See Note 7.
93
Activity in the allowance for loan losses for the years ended December 31, 2017, 2016 and 2015 follows:
1-4 Family Residential | Home Equity | Commercial Real Estate | Construction | Commercial Business | Consumer | Unallocated | Total | ||||||||||||||||||||||||
(In thousands) | |||||||||||||||||||||||||||||||
2017 | |||||||||||||||||||||||||||||||
Beginning balance | $ | 4,846 | $ | 537 | $ | 8,374 | $ | 1,353 | $ | 3,206 | $ | 434 | $ | — | $ | 18,750 | |||||||||||||||
Provision for loan losses | 83 | 162 | 1,283 | 355 | 193 | 22 | — | 2,098 | |||||||||||||||||||||||
Loans charged-off | (52 | ) | — | (73 | ) | — | — | (134 | ) | — | (259 | ) | |||||||||||||||||||
Recoveries | 199 | — | — | — | 74 | 15 | — | 288 | |||||||||||||||||||||||
Ending balance | $ | 5,076 | $ | 699 | $ | 9,584 | $ | 1,708 | $ | 3,473 | $ | 337 | $ | — | $ | 20,877 | |||||||||||||||
2016 | |||||||||||||||||||||||||||||||
Beginning balance | $ | 3,916 | $ | 636 | $ | 7,147 | $ | 1,364 | $ | 2,839 | $ | 772 | $ | 428 | $ | 17,102 | |||||||||||||||
Provision (credit) for loan losses | 830 | (99 | ) | 1,447 | (11 | ) | 3,428 | (282 | ) | (428 | ) | 4,885 | |||||||||||||||||||
Loans charged-off | — | — | (321 | ) | — | (3,098 | ) | (56 | ) | — | (3,475 | ) | |||||||||||||||||||
Recoveries | 100 | — | 101 | — | 37 | — | — | 238 | |||||||||||||||||||||||
Ending balance | $ | 4,846 | $ | 537 | $ | 8,374 | $ | 1,353 | $ | 3,206 | $ | 434 | $ | — | $ | 18,750 | |||||||||||||||
2015 | |||||||||||||||||||||||||||||||
Beginning balance | $ | 3,222 | $ | 340 | $ | 3,551 | $ | 1,056 | $ | 3,410 | $ | 736 | $ | 658 | $ | 12,973 | |||||||||||||||
Provision (credit) for loan losses | 612 | 296 | 3,596 | 308 | (571 | ) | 79 | (230 | ) | 4,090 | |||||||||||||||||||||
Loans charged-off | — | — | — | — | — | (43 | ) | — | (43 | ) | |||||||||||||||||||||
Recoveries | 82 | — | — | — | — | — | — | 82 | |||||||||||||||||||||||
Ending balance | $ | 3,916 | $ | 636 | $ | 7,147 | $ | 1,364 | $ | 2,839 | $ | 772 | $ | 428 | $ | 17,102 | |||||||||||||||
94
Additional information pertaining to the allocation of the allowance for loan losses to loan segments at December 31, 2017 and 2016, follows:
1-4 Family Residential | Home Equity | Commercial Real Estate | Construction | Commercial Business | Consumer | Unallocated | Total | ||||||||||||||||||||||||
(In thousands) | |||||||||||||||||||||||||||||||
December 31, 2017 | |||||||||||||||||||||||||||||||
Allowance related to impaired loans | $ | 80 | $ | — | $ | — | $ | — | $ | — | $ | 1 | $ | — | $ | 81 | |||||||||||||||
Allowance related to non-impaired loans | 4,996 | 699 | 9,584 | 1,708 | 3,473 | 336 | — | 20,796 | |||||||||||||||||||||||
Total allowance for loan losses | $ | 5,076 | $ | 699 | $ | 9,584 | $ | 1,708 | $ | 3,473 | $ | 337 | $ | — | $ | 20,877 | |||||||||||||||
Impaired loans | $ | 5,949 | $ | 1,387 | $ | 4,744 | $ | — | $ | — | $ | 202 | $ | — | $ | 12,282 | |||||||||||||||
Non-impaired loans | 916,678 | 79,275 | 829,520 | 91,050 | 253,509 | 21,496 | — | 2,191,528 | |||||||||||||||||||||||
Total loans | $ | 922,627 | $ | 80,662 | $ | 834,264 | $ | 91,050 | $ | 253,509 | $ | 21,698 | $ | — | $ | 2,203,810 | |||||||||||||||
December 31, 2016 | |||||||||||||||||||||||||||||||
Allowance related to impaired loans | $ | 17 | $ | — | $ | — | $ | — | $ | — | $ | — | $ | — | $ | 17 | |||||||||||||||
Allowance related to non-impaired loans | 4,829 | 537 | 8,374 | 1,353 | 3,206 | 434 | — | 18,733 | |||||||||||||||||||||||
Total allowance for loan losses | $ | 4,846 | $ | 537 | $ | 8,374 | $ | 1,353 | $ | 3,206 | $ | 434 | $ | — | $ | 18,750 | |||||||||||||||
Impaired loans | $ | 6,726 | $ | 1,153 | $ | 941 | $ | — | $ | 241 | $ | 170 | $ | — | $ | 9,231 | |||||||||||||||
Non-impaired loans | 844,428 | 77,566 | 686,348 | 76,351 | 205,993 | 29,111 | — | 1,919,797 | |||||||||||||||||||||||
Total loans | $ | 851,154 | $ | 78,719 | $ | 687,289 | $ | 76,351 | $ | 206,234 | $ | 29,281 | $ | — | $ | 1,929,028 | |||||||||||||||
The following is a summary of past due and non-accrual loans, by loan segment, at December 31, 2017 and 2016:
30-59 Days Past Due | 60-89 Days Past Due | Past Due 90 Days or More | Total Past Due | Loans on Non-accrual | |||||||||||||||
(In thousands) | |||||||||||||||||||
December 31, 2017 | |||||||||||||||||||
Real estate: | |||||||||||||||||||
1-4 family residential | $ | 381 | $ | 348 | $ | 2,184 | $ | 2,913 | $ | 5,190 | |||||||||
Home equity | 509 | 13 | 656 | 1,178 | 1,387 | ||||||||||||||
Commercial real estate | — | — | 3,893 | 3,893 | 4,744 | ||||||||||||||
Consumer | 107 | 7 | 92 | 206 | 202 | ||||||||||||||
Total | $ | 997 | $ | 368 | $ | 6,825 | $ | 8,190 | $ | 11,523 | |||||||||
December 31, 2016 | |||||||||||||||||||
Real estate: | |||||||||||||||||||
1-4 family residential | $ | 584 | $ | 373 | $ | 2,322 | $ | 3,279 | $ | 6,478 | |||||||||
Home equity | 452 | 496 | 775 | 1,723 | 1,153 | ||||||||||||||
Commercial real estate | 1,393 | — | — | 1,393 | 941 | ||||||||||||||
Commercial business | 4,996 | 13 | — | 5,009 | 241 | ||||||||||||||
Consumer | 175 | 5 | 7 | 187 | 170 | ||||||||||||||
Total | $ | 7,600 | $ | 887 | $ | 3,104 | $ | 11,591 | $ | 8,983 | |||||||||
There were no loans past due 90 days or more and still accruing at December 31, 2017 and 2016.
95
The following is a summary of information pertaining to impaired loans by loan segment at the dates indicated:
Recorded Investment | Unpaid Principal Balance | Related Allowance | |||||||||
December 31, 2017 | (In thousands) | ||||||||||
Impaired loans without a valuation allowance: | |||||||||||
Real estate: | |||||||||||
1-4 family residential | $ | 4,501 | $ | 4,897 | $ | — | |||||
Home equity | 1,387 | 1,523 | — | ||||||||
Commercial real estate | 4,744 | 5,206 | — | ||||||||
Commercial business | — | 11 | — | ||||||||
Consumer | 191 | 243 | — | ||||||||
Total | 10,823 | 11,880 | — | ||||||||
Impaired loans with a valuation allowance: | |||||||||||
Real estate: | |||||||||||
1-4 family residential | 1,448 | 1,448 | 80 | ||||||||
Consumer | 11 | 11 | 1 | ||||||||
Total | 1,459 | 1,459 | 81 | ||||||||
Total impaired loans | $ | 12,282 | $ | 13,339 | $ | 81 | |||||
December 31, 2016 | |||||||||||
Impaired loans without a valuation allowance: | |||||||||||
Real estate: | |||||||||||
1-4 family residential | $ | 6,605 | $ | 7,023 | $ | — | |||||
Home equity | 1,153 | 1,225 | — | ||||||||
Commercial real estate | 941 | 1,207 | — | ||||||||
Commercial business | 241 | 3,279 | — | ||||||||
Consumer | 170 | 183 | — | ||||||||
Total | 9,110 | 12,917 | — | ||||||||
Impaired loans with a valuation allowance: | |||||||||||
1-4 family residential | 121 | 313 | 17 | ||||||||
Total impaired loans | $ | 9,231 | $ | 13,230 | $ | 17 | |||||
96
The following tables set forth information regarding average balances and interest income recognized (the majority of which is on a cash basis) on impaired loans, by segment, for the years ended December 31, 2017, 2016 and 2015:
Average Recorded Investment | Interest Income Recognized | ||||||
2017 | (In thousands) | ||||||
Real estate: | |||||||
1-4 family residential | $ | 6,254 | $ | 281 | |||
Home equity | 1,264 | 58 | |||||
Commercial real estate | 4,125 | 220 | |||||
Commercial business | 129 | 20 | |||||
Consumer | 241 | 9 | |||||
Total | $ | 12,013 | $ | 588 | |||
2016 | |||||||
Real estate: | |||||||
1-4 family residential | $ | 6,451 | $ | 449 | |||
Home equity | 555 | 29 | |||||
Commercial real estate | 3,192 | 206 | |||||
Commercial business | 672 | 55 | |||||
Consumer | 160 | 12 | |||||
Total | $ | 11,030 | $ | 751 | |||
2015 | |||||||
Real estate: | |||||||
1-4 family residential | $ | 4,869 | $ | 270 | |||
Home equity | 575 | 14 | |||||
Commercial real estate | 926 | 161 | |||||
Commercial business | 2 | 1 | |||||
Consumer | 78 | 6 | |||||
Total | $ | 6,450 | $ | 452 | |||
No additional funds are committed to be advanced in connection with impaired loans.
Troubled debt restructurings recorded during the year ended December 31, 2017 totaled $973,000. There were no material troubled debt restructurings recorded during the years ended December 31, 2016 and 2015.
97
Credit Quality Information
The Company utilizes a ten-grade internal loan rating system for all loans as follows:
Loans rated 1 - 6 are considered "acceptable" rated loans that are performing as agreed, and generally require only routine supervision.
Loans rated 7 are considered “special mention.” These loans are starting to show signs of potential weakness and are being closely monitored by management.
Loans rated 8 are considered “substandard.” Generally, a loan is considered substandard if it is inadequately protected by the current net worth and paying capacity of the obligors and/or the collateral pledged. There is a distinct possibility that the Company will sustain some loss if the weakness is not corrected. Generally, all loans 90 days delinquent are rated 8.
Loans rated 9 are considered “doubtful.” Serious problems exist to the point where a partial loss of principal is likely. Weakness is so pronounced that on the basis of current information, conditions and values, collection in full is highly improbable.
Loans rated 10 are considered "loss" and the credit extended to the customer is considered uncollectible or of such little value that it does not warrant consideration as an active asset.
The Company assigns a 6 risk-rating to otherwise performing, satisfactorily collateralized consumer and residential loans where the Company becomes aware of deterioration in a FICO score or other indication of potential inability to service the debt. The Company assigns risk ratings of 7-10 to residential or consumer loans that have a well-defined weakness that may jeopardize the collection of the contractual principal and interest, are contractually past due 90 days or more or legal action has commenced against the borrower. All other residential mortgage and consumer loans have no risk rating.
On an annual basis, or more often if needed, the Company formally reviews the ratings on all commercial and construction loans. At least annually, the Company engages an independent third party to review a significant portion of loans within these segments. Management uses the results of these reviews as part of its annual review process. Management primarily utilizes delinquency reports, the watch list and other loan reports to monitor credit quality of other loan segments.
The following tables present the Company’s loans by risk rating at December 31, 2017 and 2016:
1-4 Family Residential | Home Equity | Commercial Real Estate | Construction | Commercial Business | Consumer | Total Loans | |||||||||||||||||||||
(In thousands) | |||||||||||||||||||||||||||
December 31, 2017 | |||||||||||||||||||||||||||
Loans rated 1 - 6 | $ | 1,022 | $ | 270 | $ | 821,815 | $ | 91,050 | $ | 252,765 | $ | 3 | $ | 1,166,925 | |||||||||||||
Loans rated 7 | 2,848 | 1,523 | 4,660 | — | 744 | 121 | 9,896 | ||||||||||||||||||||
Loans rated 8 | 2,566 | — | 7,789 | — | — | — | 10,355 | ||||||||||||||||||||
Loans rated 9 | 250 | — | — | — | — | — | 250 | ||||||||||||||||||||
Loans rated 10 | — | — | — | — | — | — | — | ||||||||||||||||||||
Loans not rated | 915,941 | 78,869 | — | — | — | 21,574 | 1,016,384 | ||||||||||||||||||||
$ | 922,627 | $ | 80,662 | $ | 834,264 | $ | 91,050 | $ | 253,509 | $ | 21,698 | $ | 2,203,810 | ||||||||||||||
December 31, 2016 | |||||||||||||||||||||||||||
Loans rated 1 - 6 | $ | 1,054 | $ | 293 | $ | 671,872 | $ | 76,351 | $ | 188,706 | $ | 4 | $ | 938,280 | |||||||||||||
Loans rated 7 | 3,514 | 967 | 9,720 | — | 17,510 | 146 | 31,857 | ||||||||||||||||||||
Loans rated 8 | 2,442 | 258 | 5,697 | — | 18 | 37 | 8,452 | ||||||||||||||||||||
Loans rated 9 | 645 | — | — | — | — | — | 645 | ||||||||||||||||||||
Loans rated 10 | — | — | — | — | — | — | — | ||||||||||||||||||||
Loans not rated | 843,499 | 77,201 | — | — | — | 29,094 | 949,794 | ||||||||||||||||||||
$ | 851,154 | $ | 78,719 | $ | 687,289 | $ | 76,351 | $ | 206,234 | $ | 29,281 | $ | 1,929,028 | ||||||||||||||
98
NOTE 5 - PREMISES AND EQUIPMENT
A summary of the cost and accumulated depreciation and amortization of premises and equipment follows:
December 31, | Estimated Useful Lives | ||||||||
2017 | 2016 | ||||||||
(In thousands) | |||||||||
Land | $ | 4,087 | $ | 4,087 | |||||
Buildings | 11,043 | 10,322 | 5 to 40 years | ||||||
Leasehold improvements | 9,551 | 9,334 | 5 to 10 years | ||||||
Furniture and fixtures | 4,139 | 3,874 | 3 to 5 years | ||||||
Technology equipment | 6,579 | 6,139 | 1 to 3 years | ||||||
Construction in progress | 185 | 169 | |||||||
Premises and equipment, gross | 35,584 | 33,925 | |||||||
Less accumulated depreciation and amortization | (14,011 | ) | (11,891 | ) | |||||
Premises and equipment, net | $ | 21,573 | $ | 22,034 | |||||
Depreciation and amortization expense for the years ended December 31, 2017, 2016 and 2015 amounted to $2.1 million, $2.0 million and $1.8 million, respectively.
NOTE 6 - DEPOSITS
A summary of deposit balances, by type, is as follows:
December 31, | |||||||
2017 | 2016 | ||||||
(In thousands) | |||||||
NOW and demand | $ | 381,316 | $ | 331,508 | |||
Regular savings | 221,004 | 262,984 | |||||
Money market | 646,603 | 573,204 | |||||
Brokered money market | 92,798 | 53,357 | |||||
Total non-certificate accounts | 1,341,721 | 1,221,053 | |||||
Term certificates of $250,000 or more | 134,649 | 77,550 | |||||
Term certificates less than $250,000 | 313,733 | 262,564 | |||||
Brokered certificates of deposit | 249,766 | 247,520 | |||||
Total certificate accounts | 698,148 | 587,634 | |||||
Total deposits | $ | 2,039,869 | $ | 1,808,687 | |||
At December 31, 2017, the scheduled maturities of certificate accounts, including brokered certificates of deposits, are as follows:
Amount | Weighted Average Rate | |||||
(Dollars in thousands) | ||||||
2018 | 406,362 | 1.18 | % | |||
2019 | 180,672 | 1.72 | ||||
2020 | 62,733 | 1.79 | ||||
2021 | 19,513 | 1.84 | ||||
2022 | 28,868 | 2.04 | ||||
$ | 698,148 | 1.43 | % | |||
99
NOTE 7 - BORROWINGS
Federal Home Loan Bank of Boston advances
FHLBB advances with an original maturity of less than one year amounted to $100.0 million and $146.0 million at December 31, 2017 and 2016, respectively, with a weighted average rate of 1.57% and 0.76%, respectively. The Company also had, at both December 31, 2017 and 2016, a $7.7 million line of credit with the FHLBB with an interest rate that adjusts daily. No advances were outstanding on this line at December 31, 2017 or 2016. All borrowings from the FHLBB are secured by a blanket security agreement on qualified collateral, principally residential and commercial mortgage loans, as well as certain U.S. government-sponsored enterprise securities. See Notes 3 and 4.
Long-term debt consists of the following FHLBB advances:
December 31, 2017 | December 31, 2016 | ||||||||||||
Amount | Weighted Average Rate | Amount | Weighted Average Rate | ||||||||||
(Dollars in thousands) | |||||||||||||
Fixed-rate advances maturing: | |||||||||||||
2017 | $ | — | — | % | $ | 15,000 | 1.99 | % | |||||
2018 | 25,000 | 1.97 | 20,000 | 2.12 | |||||||||
2019 | 35,000 | 1.32 | 25,000 | 1.20 | |||||||||
2020 | 35,000 | 1.70 | 15,000 | 1.49 | |||||||||
2021 | — | — | 30,000 | 0.28 | |||||||||
2022 * | 10,000 | 0.42 | — | — | |||||||||
$ | 105,000 | 1.51 | % | $ | 105,000 | 1.27 | % | ||||||
* Includes advances callable in 2018 | |||||||||||||
Other lines-of-credit
At both December 31, 2017 and 2016, the Company had $42.0 million in available unsecured federal funds lines with correspondent banks, which could be drawn upon, as needed. There were no amounts outstanding at December 31, 2017 or 2016.
100
NOTE 8- INCOME TAXES
Allocation of federal and state income taxes between current and deferred portions is as follows:
Years Ended December 31, | |||||||||||
2017 | 2016 | 2015 | |||||||||
(In thousands) | |||||||||||
Current tax provision: | |||||||||||
Federal | $ | 6,984 | $ | 3,617 | $ | 2,933 | |||||
State | 1,551 | 306 | 206 | ||||||||
8,535 | 3,923 | 3,139 | |||||||||
Deferred tax provision (benefit): | |||||||||||
Federal | 1,792 | 344 | 7 | ||||||||
State | 77 | 47 | (148 | ) | |||||||
Statutory rate change | 2,500 | (289 | ) | — | |||||||
Federal and State | 4,369 | 102 | (141 | ) | |||||||
Change in valuation reserve | (1,678 | ) | (220 | ) | (161 | ) | |||||
Deferred income tax provision (benefit) | 2,691 | (118 | ) | (302 | ) | ||||||
Provision for income taxes | $ | 11,226 | $ | 3,805 | $ | 2,837 | |||||
The reasons for the differences between the statutory federal income tax provision and the actual tax provision (benefit) are summarized as follows:
Years Ended December 31, | |||||||||||
2017 | 2016 | 2015 | |||||||||
(Dollars in thousands) | |||||||||||
Statutory federal tax provision | $ | 9,700 | $ | 4,236 | $ | 3,429 | |||||
Increase (decrease) resulting from: | |||||||||||
State taxes, net of federal tax benefit | 1,058 | 233 | 39 | ||||||||
Dividends received deduction | (26 | ) | (41 | ) | (211 | ) | |||||
Tax-exempt bank-owned life insurance | (372 | ) | (528 | ) | (351 | ) | |||||
Tax-exempt interest | (155 | ) | (189 | ) | (222 | ) | |||||
Change in valuation reserve | (1,678 | ) | (220 | ) | (161 | ) | |||||
Equity incentives | 121 | 339 | 52 | ||||||||
Amortization of low income housing partnership | 166 | 219 | — | ||||||||
Tax credits utilized | (188 | ) | (286 | ) | (45 | ) | |||||
Accrual adjustment | 23 | 207 | 13 | ||||||||
Statutory rate change | 2,500 | (289 | ) | — | |||||||
Other, net | 77 | 124 | 294 | ||||||||
Tax provision | $ | 11,226 | $ | 3,805 | $ | 2,837 | |||||
Effective tax rates | 40.5 | % | 30.5 | % | 28.2 | % | |||||
101
The components of the net deferred tax asset are as follows:
December 31, | |||||||
2017 | 2016 | ||||||
(In thousands) | |||||||
Deferred tax assets: | |||||||
Federal | $ | 6,742 | $ | 11,700 | |||
State | 3,416 | 3,258 | |||||
Deferred tax assets, gross | 10,158 | 14,958 | |||||
Valuation reserve | (112 | ) | (1,790 | ) | |||
Deferred tax assets, net | 10,046 | 13,168 | |||||
Deferred tax liabilities: | |||||||
Federal | (3,050 | ) | (2,427 | ) | |||
State | (996 | ) | (595 | ) | |||
Deferred tax liabilities | (4,046 | ) | (3,022 | ) | |||
Net deferred tax asset | $ | 6,000 | $ | 10,146 | |||
The tax effects of each item that give rise to deferred tax assets (liabilities) are as follows:
December 31, | |||||||
2017 | 2016 | ||||||
(In thousands) | |||||||
Deferred tax assets: | |||||||
Depreciation and amortization | $ | 279 | $ | 747 | |||
Employee benefit plans and share-based compensation plans | 410 | 571 | |||||
Allowance for loan losses | 5,868 | 7,660 | |||||
Contribution carryover | 1,122 | 2,317 | |||||
Net unrealized loss on securities held as, or transferred, from available for sale | — | 893 | |||||
Net unrealized losses on defined benefit pension plan | 757 | 1,270 | |||||
Deferred rent expense | 170 | 123 | |||||
Other | (31 | ) | — | ||||
Valuation reserve | (112 | ) | (1,790 | ) | |||
Deferred tax liabilities: | |||||||
Deferred loan origination costs | (1,338 | ) | (1,947 | ) | |||
Net unrealized gain on securities held as, or transferred from, available for sale | (166 | ) | — | ||||
Gain on exchange of investment in Northeast Retirement Services | (959 | ) | — | ||||
Other | — | 302 | |||||
Net deferred tax asset | $ | 6,000 | $ | 10,146 | |||
A summary of the change in the net deferred tax asset is as follows:
Years Ended December 31, | |||||||||||
2017 | 2016 | 2015 | |||||||||
(In thousands) | |||||||||||
Balance at beginning of year | $ | 10,146 | $ | 10,665 | $ | 6,233 | |||||
Deferred tax (provision) benefit | (2,691 | ) | 118 | 302 | |||||||
Tax effect of changes in accumulated other comprehensive income | (1,455 | ) | (637 | ) | 4,130 | ||||||
Balance at end of year | $ | 6,000 | $ | 10,146 | $ | 10,665 | |||||
On December 22, 2017, the Tax Cuts and Jobs Act (the “Act”) became law. The Act amends the Internal Revenue Code to reduce tax rates and modify policies, credits, and deductions for individuals and businesses. For businesses, the Act reduces the corporate tax rate from a maximum of 35% to 21%. The rate reduction is effective January 1, 2018.
102
Under U.S. Generally Accepted Accounting Principles, the Company uses the asset and liability method of accounting for income taxes. Under this method, deferred tax assets and liabilities are recognized for the future tax consequences attributable to differences between the financial statement carrying amounts of existing assets and liabilities and their respective tax basis. Deferred tax assets and liabilities are measured using enacted tax rates expected to apply to taxable income in the years in which those temporary differences are expected to be recovered or settled. As a result of the reduction in the corporate tax rate to 21% from 35% under the Act, the Company has revalued its net deferred tax asset as of December 31, 2017 and as a result, recognized additional income tax expense of $2.5 million in the Company’s consolidated statement of net income for the fourth quarter of 2017.
For the year ended December 31, 2016, the Company recorded a tax benefit of $289,000 related to the statutory rate change from 34% to 35% and its impact on the Company's net deferred tax asset.
At December 31, 2017 and 2016, management maintained a valuation reserve in the amount of $112,000 and $1.8 million, respectively, primarily related to state deferred tax assets. During 2017, management determined that due to positive evidence supporting future state profitability, it is more likely than not a tax benefit could be realized for state deferred tax assets with the exception of a portion of the state charitable contribution carryforward. As a result, the Company reversed $1.7 million of valuation allowance with a corresponding benefit to the consolidated statement of net income.
At December 31, 2017, the Company allocated tax expense between the components of the consolidated statements of income as required by the intraperiod allocation rules.
The federal income tax reserve for loan losses at the Company’s base year amounted to $1.3 million. If any portion of the reserve is used for purposes other than to absorb loan losses, approximately 150% of the amount actually used (limited to the amount of the reserve) would be subject to taxation in the year in which used. As the Company intends to use the reserve to only absorb loan losses, a deferred income tax liability of $354,000 has not been provided.
The Company’s income tax returns are subject to review and examination by federal and state taxing authorities. The Company is currently open to audit under the applicable statutes of limitations by the Internal Revenue Service and state taxing authorities for the years ended December 31, 2014 through 2017.
Management periodically evaluates the sustainability of tax positions taken. Whenever management estimates the probability of sustaining a tax position is at least more likely than not, the tax position is deemed warranted and is recognized at the largest amount of benefit that is greater than 50% likely of being realized upon settlement. Interest and penalties related to uncertain tax positions are recognized as income tax expense. In the years ended December 31, 2017 and 2016, $13,000 and $22,000, respectively, of interest and penalties were paid. No interest or penalties were recorded for the year ended December 31, 2015.
NOTE 9 - EQUITY
Minimum regulatory capital requirements
The Company (on a consolidated basis) and the Bank are subject to various regulatory capital requirements administered by the federal banking agencies. Failure to meet minimum capital requirements can initiate certain mandatory, and possibly additional discretionary actions by regulators that, if undertaken, could have a direct material effect on the Company’s and the Bank’s consolidated financial statements. Under capital adequacy guidelines and the regulatory framework for prompt corrective action, the Company and the Bank must meet specific capital guidelines that involve quantitative measures of their assets, liabilities, and certain off-balance sheet items as calculated under regulatory accounting practices. The capital amounts and classification are also subject to qualitative judgments by the regulators about components, risk weightings, and other factors. Prompt corrective action provisions are not applicable to bank holding companies.
103
Federal banking regulations include minimum capital ratios as displayed in the following table. Additionally, community banking institutions must maintain a capital conservation buffer of common equity Tier 1 capital in an amount greater than 2.5% of total risk-weighted assets to avoid being subject to limitations on capital distributions and discretionary bonuses. The capital conservation buffer is being phased in over three years, beginning on January 1, 2016, with an initial phase-in of 0.625%. Also, certain deductions from and adjustments to regulatory capital are being phased in over several years. The required minimum conservation buffer is 1.25% as of December 31, 2017 and will increase to 1.875% on January 1, 2018 and 2.5% on January 1, 2019. Management believes that the Company’s capital levels will remain characterized as well-capitalized throughout the phase-in periods. Management believes that the Company will remain characterized as “well capitalized” throughout the phase-in periods.
As of December 31, 2017, the most recent notification from the Federal Deposit Insurance Corporation categorized the Bank as well capitalized under the regulatory framework for prompt corrective action. To be categorized as well capitalized, an institution must maintain minimum ratios as set forth in the following table. There are no conditions or events since the notification that management believes have changed the Bank’s category. Management believes, as of December 31, 2017 and 2016, that the Company and the Bank meet all capital adequacy requirements to which they are subject. The Company’s and the Bank’s actual capital amounts and ratios as of December 31, 2017 and 2016 are also presented in the following table.
Actual | Minimum Capital Requirement | Minimum To Be Well Capitalized | ||||||||||||||||||
Amount | Ratio | Amount | Ratio | Amount | Ratio | |||||||||||||||
(Dollars in thousands) | ||||||||||||||||||||
Blue Hills Bancorp, Inc.: | ||||||||||||||||||||
December 31, 2017 | ||||||||||||||||||||
Total capital (to risk weighted assets) | $ | 410,088 | 19.7 | % | $ | 166,635 | 8.0 | % | $ | 208,294 | 10.0 | % | ||||||||
Tier 1 capital (to risk weighted assets) | 389,211 | 18.7 | 124,977 | 6.0 | 166,635 | 8.0 | ||||||||||||||
Common equity Tier 1 (to risk weighted assets) | 389,211 | 18.7 | 93,732 | 4.5 | 135,391 | 6.5 | ||||||||||||||
Tier 1 capital (to average assets) | 389,211 | 14.9 | 104,278 | 4.0 | 130,348 | 5.0 | ||||||||||||||
December 31, 2016 | ||||||||||||||||||||
Total capital (to risk weighted assets) | 395,325 | 20.5 | 154,471 | 8.0 | 193,089 | 10.0 | ||||||||||||||
Tier 1 capital (to risk weighted assets) | 376,575 | 19.5 | 115,854 | 6.0 | 154,471 | 8.0 | ||||||||||||||
Common equity Tier 1 (to risk weighted assets) | 376,575 | 19.5 | 86,890 | 4.5 | 125,508 | 6.5 | ||||||||||||||
Tier 1 capital (to average assets) | 376,575 | 16.0 | 94,166 | 4.0 | 117,708 | 5.0 | ||||||||||||||
Blue Hills Bank: | ||||||||||||||||||||
December 31, 2017 | ||||||||||||||||||||
Total capital (to risk weighted assets) | 341,175 | 16.4 | 166,391 | 8.0 | 207,988 | 10.0 | ||||||||||||||
Tier 1 capital (to risk weighted assets) | 320,298 | 15.4 | 124,793 | 6.0 | 166,391 | 8.0 | ||||||||||||||
Common equity Tier 1 (to risk weighted assets) | 320,298 | 15.4 | 93,595 | 4.5 | 135,192 | 6.5 | ||||||||||||||
Tier 1 capital (to average assets) | 320,298 | 12.3 | 104,137 | 4.0 | 130,171 | 5.0 | ||||||||||||||
December 31, 2016 | ||||||||||||||||||||
Total capital (to risk weighted assets) | 313,457 | 16.3 | 154,196 | 8.0 | 192,745 | 10.0 | ||||||||||||||
Tier 1 capital (to risk weighted assets) | 294,707 | 15.3 | 115,647 | 6.0 | 154,196 | 8.0 | ||||||||||||||
Common equity Tier 1 (to risk weighted assets) | 294,707 | 15.3 | 86,735 | 4.5 | 125,284 | 6.5 | ||||||||||||||
Tier 1 capital (to average assets) | 294,707 | 12.5 | 94,099 | 4.0 | 117,623 | 5.0 | ||||||||||||||
Preferred stock
The Company has authorized 50,000,000 shares, zero par value of Preferred Stock. As of December 31, 2017, there were no shares issued or outstanding.
104
Restrictions on dividends, loans and advances
Federal and state banking regulations place certain restrictions on dividends paid and loans or advances made by the Bank to the Company. The total amount of dividends which may be paid in any calendar year cannot exceed the Bank’s net income for the current year, plus the Bank’s net income retained for the two previous years, without regulatory approval. Loans or advances are limited to 10 percent of the Bank’s capital stock and surplus on a secured basis. At December 31, 2017, the Bank's retained earnings available for the payment of dividends was $36.5 million. Funds available for loans or advances by the Bank to the Company amounted to $31.9 million. In addition, as a result of regulatory capital requirements, $166.4 million of the Company's $328.7 million equity in the net assets of the Bank was restricted at December 31, 2017.
In addition, dividends paid by the Bank to the Company would be prohibited if the effect thereof would cause the Bank’s capital to be reduced below applicable capital requirements.
The payment of dividends by the Company is subject to Maryland law. The Company can pay dividends on its common stock if, after giving effect to such distribution, (i) it would be able to pay its indebtedness as the indebtedness comes due in the usual course of business and (ii) its total assets exceed the sum of its liabilities and the amount needed, if Blue Hills Bancorp were to be dissolved at the time of the distribution, to satisfy the preferential rights upon dissolution of any holders of capital stock who have a preference in the event of dissolution; provided, however, that even if the Company's assets are less than the amount necessary to satisfy the requirement set forth in (ii) above, the Company may make a distribution from: (A) the Company's net earnings for the fiscal year in which the distribution is made; (B) the Company's net earnings for the preceding fiscal year; or (C) the sum of the Company's net earnings for the preceding eight fiscal quarters. The holders of common stock of the Company will be entitled to receive and share equally in dividends as may be declared by our Board of Directors out of funds legally available. If the Company issues shares of preferred stock, the holders thereof may have a priority over the holders of the common stock with respect to dividends.
Liquidation account
At the time of conversion to a stock holding company, the Company substantially restricted retained earnings by establishing a liquidation account and the Bank established a parallel liquidation account. The liquidation accounts amounted to $49.0 million and $61.0 million at December 31, 2017 and 2016, respectively, and are maintained for the benefit of eligible deposit account holders who continue to maintain their accounts at the Bank after the conversion. The liquidation accounts will be reduced annually to the extent that eligible account holders have reduced their qualifying deposits. Subsequent increases will not restore an eligible account holder’s interest in the liquidation accounts. In the event of a complete liquidation of the Bank, each account holder will be entitled to receive a distribution from the liquidation accounts as described in the Plan of Conversion. Neither the Company nor the Bank may declare or pay a cash dividend on its common stock if such dividend would cause its regulatory capital to be reduced below the amount required to maintain its respective liquidation account.
105
NOTE 10 - EMPLOYEE BENEFIT PLANS
Pension plan
The Company historically provided basic and supplemental pension benefits for eligible employees through the Savings Banks Employees Retirement Association’s (“SBERA”) Pension Plan (the “Plan”). The Company accounts for the defined benefit pension plan using an actuarial model that allocates pension costs over the service period of employees in the plan. The Company accounts for the over-funded or under-funded status of its defined benefit plan as an asset or liability on its consolidated balance sheets and recognizes changes in the funded status in the year in which the changes occur as other comprehensive income or loss. The Company amended its defined benefit pension plan to freeze all participants effective October 31, 2014. Accumulated benefits for participants earned through the end of October 2014 will remain secured by the Plan assets. Information pertaining to the Plan is as follows:
Years Ended December 31, | |||||||||||
2017 | 2016 | 2015 | |||||||||
(In thousands) | |||||||||||
Change in plan assets: | |||||||||||
Fair value of plan assets at beginning of year | $ | 9,811 | $ | 8,814 | $ | 9,443 | |||||
Actual return (loss) on plan assets | 1,414 | 847 | (304 | ) | |||||||
Employer contribution | 1,110 | 470 | — | ||||||||
Benefits paid | (178 | ) | (320 | ) | (325 | ) | |||||
Settlement payments | (1,394 | ) | — | — | |||||||
Fair value of plan assets at end of year | 10,763 | 9,811 | 8,814 | ||||||||
Change in benefit obligation: | |||||||||||
Benefit obligation at beginning of year | 11,896 | 10,772 | 10,135 | ||||||||
Interest cost | 390 | 422 | 401 | ||||||||
Actuarial loss | 481 | 1,022 | 561 | ||||||||
Benefits paid | (178 | ) | (320 | ) | (325 | ) | |||||
Settlement payments | (1,394 | ) | — | — | |||||||
Benefit obligation at end of year | 11,195 | 11,896 | 10,772 | ||||||||
Funded status and accrued liability at end of year | $ | (432 | ) | $ | (2,085 | ) | $ | (1,958 | ) | ||
Accumulated benefit obligation at end of year | $ | 11,195 | $ | 11,896 | $ | 10,772 | |||||
At December 31, 2017 and 2016, the discount rate used to determine the benefit obligation was 3.43% and 3.86%, respectively.
The components of net periodic pension cost (benefit) are as follows:
Years Ended December 31, | |||||||||||
2017 | 2016 | 2015 | |||||||||
(In thousands) | |||||||||||
Interest cost | 390 | 422 | 401 | ||||||||
Expected return on plan assets | (758 | ) | (720 | ) | (745 | ) | |||||
Amortization of net actuarial loss | 297 | 271 | 110 | ||||||||
Settlement loss | 317 | — | — | ||||||||
Net periodic pension cost (benefit) | $ | 246 | $ | (27 | ) | $ | (234 | ) | |||
The assumptions used to determine net periodic pension cost (benefit) are as follows:
Years Ended December 31, | ||||||||
2017 | 2016 | 2015 | ||||||
Discount rate | 3.86 | % | 4.01 | % | 4.00 | % | ||
Expected long-term rate of return on plan assets | 8.00 | % | 8.00 | % | 8.00 | % | ||
106
The Company has selected its assumption with respect to the expected long-term rate of return based on prevailing yields on high-quality, fixed-income investments increased by a premium for equity return expectations.
SBERA offers a common and collective trust as the underlying investment structure for pension plans participating in SBERA. The target allocation mix for the common and collective trust portfolio calls for an equity-based investment range from 40% to 64% of total portfolio assets. The remainder of the portfolio is allocated to fixed income from 15% to 25% and other investments including global asset allocation and hedge funds from 25% to 41%. The Trustees of SBERA, through the Investment Committee, select investment managers for the common and collective trust portfolio. A professional investment advisory firm is retained by the Investment Committee to provide allocation analysis, performance measurement and to assist with manager searches. The overall investment objective is to diversify equity investments across a spectrum of investment types to limit risks from large market swings.
The fair value of major categories of the Company’s pension plan assets are summarized below:
Level 1 | Level 2 | Level 3 | Total Fair Value | ||||||||||||
(In thousands) | |||||||||||||||
December 31, 2017 | |||||||||||||||
Collective funds | $ | 420 | $ | — | $ | — | $ | 420 | |||||||
Equity securities | 2,413 | — | — | 2,413 | |||||||||||
Mutual funds | 2,079 | — | — | 2,079 | |||||||||||
Total investments measured in the fair value hierarchy | 4,912 | — | — | 4,912 | |||||||||||
Investments measured at net asset value (a) | — | — | — | 5,851 | |||||||||||
$ | 4,912 | $ | — | $ | — | $ | 10,763 | ||||||||
December 31, 2016 | |||||||||||||||
Collective funds | $ | 681 | $ | — | $ | — | $ | 681 | |||||||
Equity securities | 1,929 | — | — | 1,929 | |||||||||||
Mutual funds | 1,209 | — | — | 1,209 | |||||||||||
Short-term investments | 124 | — | — | 124 | |||||||||||
$ | 3,943 | $ | — | $ | — | $ | 3,943 | ||||||||
Investments measured at net asset value (a) | — | — | — | 5,868 | |||||||||||
$ | 3,943 | $ | — | $ | — | $ | 9,811 | ||||||||
(a) In accordance with FASB ASC 820, Fair Value Measurements, certain investments that were measured at net asset value per share (or its equivalent) have not been classified in the fair value hierarchy. There are no unfunded commitments or redemption restrictions for these investments, which can be redeemed on a daily basis.
The fair value hierarchy above was received from SBERA, the plan administrator. The Plan assets measured at fair value in Level 1 are based on quoted market prices in an active exchange market. Plan assets measured at fair value in Level 2 are based on pricing models that consider standard input factors such as observable market data, benchmark yields, interest rate volatilities, broker/dealer quotes, credit spreads and new issue data. Plan assets measured at fair value in Level 3 are based on unobservable inputs, which include the SBERA’s assumptions and the best information available under the circumstance.
107
Estimated future benefit payments, assuming employees retire at age 65 and take normal distribution payments, are as follows:
Amount | |||
Year Ending December 31, | (In thousands) | ||
2018 | $ | 843 | |
2019 | 505 | ||
2020 | 684 | ||
2021 | 933 | ||
2022 | 628 | ||
2023-2027 | 2,880 | ||
No further contributions are anticipated during 2018.
401(k) Plan
The Company has a 401(k) Plan whereby each employee having completed at least three months of service beginning with their date of employment, automatically becomes an eligible participant in the 401(k) Plan. Employees may contribute a portion of their compensation subject to certain limits based on Federal tax laws. The Company provides a 4% matching contribution equal to 100% of an employee’s first 3% of deferral and 50% of the next 2% deferral. For the years ended December 31, 2017, 2016 and 2015 expenses related to the plan were $670,000, $784,000, and $610,000, respectively.
Short-term Incentive Compensation Plan
All employees meeting specified service requirements are eligible to participate in the discretionary Short-term Incentive Compensation Plan. The purpose of the plan is to motivate and reward employees for achieving strategic objectives through a goals program. The Company recorded expenses of $2.9 million, $2.5 million, and $2.3 million for achievement of the 2017, 2016 and 2015 goals, respectively.
Employee Stock Ownership Plan
The Company maintains the ESOP to provide eligible employees the opportunity to own Company stock. This plan is a tax-qualified retirement plan for the benefit of Company employees. The Company, through its wholly-owned subsidiary, Blue Hills Funding Corporation, granted a loan to the ESOP in July of 2014 for the purchase of 2,277,345 shares of the Company’s common stock at a price of $10.00 per share. Principal and interest is payable annually over 30 years at a rate per annum equal to the Prime Rate (4.50% at December 31, 2017). Loan payments are funded by cash contributions from the Company and dividends received on unallocated shares. The loan is secured by the shares purchased, which are held in a suspense account for allocation among participants as the loan is repaid. The balance of the ESOP loan at December 31, 2017 was $20.5 million. Contributions are allocated to eligible participants on the basis of compensation, subject to federal tax limits. The number of shares committed to be released per year is 75,912 through 2043. Shares held by the ESOP include the following:
December 31, | |||||
2017 | 2016 | ||||
Allocated | 219,860 | 149,613 | |||
Committed to be allocated | 75,912 | 75,912 | |||
Unallocated | 1,973,699 | 2,049,608 | |||
2,269,471 | 2,275,133 | ||||
The fair value of unallocated shares was $39.7 million and $38.4 million at December 31, 2017 and 2016, respectively.
Total compensation expense recognized in connection with the ESOP amounted to $1.4 million, $1.1 million, and $1.1 million for the years ended December 31, 2017, 2016 and 2015, respectively.
108
NOTE 11 - STOCK BASED COMPENSATION
Under the Blue Hills Bancorp, Inc. 2015 Equity Incentive Plan (the "Equity Plan"), the Company may grant options, restricted stock, restricted units or performance awards to its directors, officers and employees. Both incentive stock options and non-qualified stock options may be granted under the Equity Plan, with the total number of shares reserved for options equaling 2,846,681. The exercise price of each option equals the market price of the Company’s stock on the date of grant and the maximum term of each option is ten years. A total of 1,138,673 shares are reserved for awards of restricted stock or restricted units. The vast majority of options and awards vest ratably over five years. The fair value of shares awarded is based on the market price at the date of grant.
Expense related to options and restricted stock granted to employees is recognized in salaries and benefits within noninterest expense and expense related to options and restricted stock granted to directors is recognized as directors' fees within noninterest expense.
The Company has standard form agreements used for stock option and restricted stock awards and generally provide that: (1) any unvested options or unvested restricted stock vest upon a Change in Control; and, that (2) any stock options which vest pursuant to a Change in Control, which is an event described in Section 280G of the Internal Revenue Code of 1986, will be cashed out at the difference between the acquisition price and the exercise price of the stock option.
Stock Options
The fair value of each option grant is estimated on the date of the grant using the Black-Scholes option-pricing model with the following assumptions:
• | Volatility is based on peer group volatility because the Company does not have a sufficient trading history. |
• | Expected life represents the period of time that the option is expected to be outstanding, taking into account the contractual term, and the vesting period. |
• | Expected dividend yield is based on the Company's history and expectation of dividend payouts. |
• | The risk-free rate is based on the U.S. Treasury yield curve in effect at the time of grant for a period equivalent to the expected life of the option. |
The Company made the following awards of options to purchase shares of common stock during the years ended December 31, 2017, 2016 and 2015:
2017 | 2016 | 2015 | |||||||||
Options granted | 412,100 | 55,000 | 2,434,000 | ||||||||
Vesting period (years) | 5 | 5 | 5 | ||||||||
Term (years) | 10 | 10 | 10 | ||||||||
Fair value calculation assumptions: | |||||||||||
Expected volatility | 26.91%-27.43% | 28.47 | % | 28.85 | % | ||||||
Expected life (years) | 6.5 | 6.5 | 6.5 | ||||||||
Expected dividend yield | 0.71%-2.22% | 0.58 | % | 0.54 | % | ||||||
Risk free interest rate | 1.87%-2.16% | 1.38 | % | 1.55 | % | ||||||
Fair value per option | $4.07-$5.31 | $ | 4.02 | $ | 4.23 | ||||||
Weighted average grant date fair value | $ | 5.09 | $ | 4.02 | $ | 4.23 | |||||
109
A summary of the status of the Company's stock option grants for the year ended December 31, 2017 is presented in the table below:
Stock Option Awards | Weighted Average Exercise Price | Weighted Average Remaining Contractual Term (years) | Aggregate Intrinsic Value | ||||||||||
Balance at January 1, 2017 | 2,449,670 | $ | 14.06 | ||||||||||
Granted | 412,100 | 18.22 | |||||||||||
Forfeited | (159,650 | ) | 14.18 | ||||||||||
Exercised | (17,470 | ) | 13.9 | — | $ | 77,000 | |||||||
Outstanding at December 31, 2017 | 2,684,650 | $ | 14.70 | 7.98 | $ | 14,506,000 | |||||||
Exercisable at December 31, 2017 | 925,990 | $ | 14.07 | 7.75 | $ | 5,584,000 | |||||||
Unrecognized compensation cost inclusive of directors' options at December 31, 2017 | $6,950,000 | ||||||||||||
Weighted average remaining recognition period (years) | 3.12 | ||||||||||||
For the years ended December 31, 2017, 2016 and 2015, stock-based compensation expense applicable to the stock options was $2.3 million, $2.1 million and $473,000, respectively. The recognized tax benefit related to this expense was $657,000, $502,000 and $112,000, respectively.
Restricted Stock
Shares issued upon vesting may be either authorized but unissued shares or reacquired shares held by the Company. Any shares not issued because vesting requirements are not met will again be available for issuance under the plan. The fair market value of shares awarded, based on the market price at the date of grant, is recorded as unearned compensation and amortized over the applicable vesting period. Of the restricted shares granted 40,000 are performance based, of which 6,000 have vested, and 32,000 remain unvested. There were 2,000 performance shares forfeited during the year ended December 31, 2017.
The following table presents the activity in non-vested stock awards under the Equity Plan for the year ended December 31, 2017:
Outstanding Restricted Stock Awards | Weighted Average Grant Price | ||||||
Non-vested stock awards at January 1, 2017 | 816,070 | $ | 14.06 | ||||
Granted | 184,695 | 18.25 | |||||
Vested | (185,028 | ) | 14.06 | ||||
Forfeited | (85,317 | ) | 14.11 | ||||
Non-vested stock awards at December 31, 2017 | 730,420 | $ | 15.11 | ||||
Unrecognized compensation cost inclusive of directors' awards at December 31, 2017 | $ | 9,704,000 | |||||
Weighted average remaining recognition period (years) | 3.17 | ||||||
For the years ended December 31, 2017, 2016 and 2015, shared-based compensation expense applicable to restricted stock awards was $3.2 million, $2.8 million and $651,000, respectively. The recognized tax benefit related to this expense was $1.3 million, $987,000 and $228,000, respectively.
110
NOTE 12 - EARNINGS PER SHARE
Earnings per share consisted of the following components for the years ended December 31, 2017, 2016 and 2015.
2017 | 2016 | 2015 | |||||||||
(Dollars in thousands, except per share amounts) | |||||||||||
Net income applicable to common stock | $ | 16,489 | $ | 8,653 | $ | 7,227 | |||||
Average number of common shares outstanding | 26,849,253 | 27,464,996 | 28,460,077 | ||||||||
Less: Average unvested restricted stock awards | (851,779 | ) | (957,364 | ) | (231,652 | ) | |||||
Less: Average unallocated ESOP shares | (2,011,652 | ) | (2,087,227 | ) | (2,163,478 | ) | |||||
Average number of common shares outstanding used to calculate basic earnings per common share | 23,985,822 | 24,420,405 | 26,064,947 | ||||||||
Effect of dilutive stock options | 248,161 | — | — | ||||||||
Effect of dilutive unvested restricted stock awards | 248,431 | 120,524 | 4,642 | ||||||||
Average number of common shares outstanding used to calculate diluted earnings per common share | 24,482,414 | 24,540,929 | 26,069,589 | ||||||||
Earnings per common share: | |||||||||||
Basic | $ | 0.69 | $ | 0.35 | $ | 0.28 | |||||
Diluted | $ | 0.67 | $ | 0.35 | $ | 0.28 | |||||
For the years ended December 31, 2017, 2016 and 2015, options for 407,950, 2,486,000 and 2,434,000 shares, respectively, were not included in the computation of diluted earnings per share because to do so would have been antidilutive as the weighted average exercise prices of the stock options exceeded the weighted average market price for the periods presented.
NOTE 13 - OTHER COMMITMENTS AND CONTINGENCIES
In the normal course of business, there are outstanding commitments and contingencies which are not reflected in the accompanying consolidated financial statements.
Loan commitments
The Company is a party to financial instruments with off-balance sheet risk in the normal course of business to meet the financing needs of its customers. These financial instruments include commitments to extend credit, which involve elements of credit and interest rate risk in excess of the amount recognized in the accompanying consolidated balance sheets. The contract amount of these instruments reflects the extent of involvement the Company has in these particular classes of financial instruments. The Company’s exposure to credit loss is represented by the contractual amount of the instruments. The Company uses the same credit policies in making commitments as it does for on-balance sheet instruments.
Financial instruments whose contract amounts represent credit risk consist of:
December 31, | |||||||
2017 | 2016 | ||||||
(In thousands) | |||||||
Commitments to originate loans | $ | 66,020 | $ | 51,622 | |||
Letters of credit | 6,314 | 3,277 | |||||
Unused lines-of-credit: | |||||||
Commercial | 203,631 | 164,185 | |||||
Home equity | 73,369 | 55,344 | |||||
Consumer | 15,819 | 15,995 | |||||
Undisbursed construction loans | 82,177 | 96,169 | |||||
111
Commitments to extend credit are agreements to lend to a customer as long as there is no violation of any condition established in the contract. Commitments and unadvanced funds on lines-of-credit generally have fixed expiration dates and may expire without being drawn upon. Therefore, the total commitment amount does not necessarily represent future cash requirements.
The Company evaluates each customer’s creditworthiness on a case-by-case basis. These financial instruments are primarily secured by mortgage liens on real estate.
Operating lease commitments
Pursuant to the terms of noncancelable lease agreements in effect at December 31, 2017, pertaining to premises, future minimum rent commitments are as follows:
Year Ending December 31, | Amount | ||
(In thousands) | |||
2018 | $ | 2,698 | |
2019 | 2,490 | ||
2020 | 2,409 | ||
2021 | 2,278 | ||
2022 | 2,286 | ||
Thereafter | 9,640 | ||
$ | 21,801 | ||
Rent expense for years ended December 31, 2017, 2016 and 2015 amounted to $3.0 million, $2.2 million and $1.6 million, respectively. Certain leases contain renewal options for up to 30 years. The cost of such options is not included above.
Other Commitments
Effective January 1, 2014, the Bank entered into an agreement for the naming rights of a Boston waterfront music venue. The agreement spans a ten-year period, with an opt-out option at the end of year seven, where the Bank paid $390,000 during the first year with 5% annual increases in subsequent years. Total expenses related to the agreement were $454,000, $430,000 and $410,000 for the years ended December 31, 2017, 2016 and 2015, respectively.
Employment and change in control agreements
The Company has entered into an employment agreement with its President and Chief Executive Officer that generally provides for a specified minimum annual compensation and the continuation of certain benefits currently received. Employment may be terminated for cause, as defined, or termination without cause, or upon certain change in control events, which would result in a cash severance payment that will be determined based on the event. The agreement has an initial term of three years, with automatic one-year extensions on the anniversary date of the agreement. The Company has also entered into change in control agreements with certain members of management which provide for the continuation of base salaries for specified periods of time in the event of involuntary termination without cause or termination for good reason in the event of a change in control.
Contingencies
The Company is involved in various litigation and other legal claims that arise in the normal course of business. On December 30, 2014, a former employee filed a complaint in U.S. Federal District Court of Massachusetts, claiming wrongful termination following a whistleblower claim. This complaint alleged violations of the Federal Deposit Insurance Act, the False Claims Act, and the Family and Medical Leave Act ("FMLA"). The former employee withdrew all of his claims after reaching a confidential settlement agreement in January of 2018. Both parties provided mutual releases of all claims and have executed a confidentiality agreement. All costs related to the case were reflected in the consolidated statements of net income as of December 31, 2017.
112
NOTE 14 - ON BALANCE SHEET DERIVATIVE INSTRUMENTS AND HEDGING ACTIVITIES
The Company is party to derivative financial instruments in the normal course of business to manage exposure to fluctuations in interest rates and to meet the needs of commercial customers. These financial instruments have been generally limited to loan level interest rate swap agreements, which are entered into with counterparties that meet established credit standards. These transactions involve both credit and market risk. The notional amounts are amounts on which calculations, payments, and the value of the derivatives are based. Notional amounts do not represent direct credit exposures. The fair value of the derivative instruments is reflected on the Company’s consolidated balance sheet as other assets or accrued expenses and other liabilities as appropriate. Changes in the fair value of these agreements are recorded in miscellaneous income in the consolidated statements of net income.
The Company did not have any fair value hedges or cash flow hedges at December 31, 2017 and 2016. The table below presents information about derivative financial instruments not designated as hedging instruments at December 31, 2017 and 2016.
Derivative Gains | Derivative Losses | ||||||||||||||
Notional Amount | Fair Value | Notional Amount | Fair Value | ||||||||||||
(In thousands) | |||||||||||||||
December 31, 2017 | |||||||||||||||
Commercial loan level interest rate swap agreements | $ | 582,388 | $ | 8,741 | $ | 582,388 | $ | 8,741 | |||||||
Other contracts | 27,689 | 25 | 54,293 | 44 | |||||||||||
Total derivatives | $ | 610,077 | $ | 8,766 | $ | 636,681 | $ | 8,785 | |||||||
December 31, 2016 | |||||||||||||||
Commercial loan level interest rate swap agreements | $ | 419,488 | $ | 9,016 | $ | 419,488 | $ | 8,932 | |||||||
Other contracts | 15,865 | 8 | 33,045 | 56 | |||||||||||
Total derivatives | $ | 435,353 | $ | 9,024 | $ | 452,533 | $ | 8,988 | |||||||
The Company is exposed to credit-related losses in the event of nonperformance by the counterparties to these agreements. The Company controls the credit risk of its financial contracts through credit approvals, limits and monitoring procedures, and does not expect any counterparties to fail their obligations. The Company has minimum collateral posting thresholds with certain of its interest rate swap derivative counterparties.
Other contracts represent risk participation agreements on commercial loan level interest rate swap agreements. The Company has entered into risk participation agreements with the correspondent institutions to share in any interest rate swap gains or losses incurred as a result of the commercial loan customers’ termination of a loan level interest rate swap agreement prior to maturity. The Company records these risk participation agreements at fair value.
Mortgage Banking Derivatives
The Company enters into commitments to fund residential mortgage loans at specified rates and times in the future, with the intention that loans will subsequently be sold in the secondary market. Mortgage loan commitments are referred to as derivative loan commitments if the loan that will result from exercise of the commitment will be held for sale upon funding. These commitments are recognized at fair value on the consolidated balance sheet in other assets and other liabilities with changes in their fair values recorded in non-interest income.
Outstanding loan commitments expose the Company to the risk that the price of the loans arising from exercise of the loan commitment might change from inception of the rate lock to funding of the loan due to changes in mortgage interest rates. If interest rates increase, the value of these loan commitments decreases. Conversely, if interest rates decrease, the value of these loan commitments increases. At December 31, 2017 and 2016, the notional amount of mortgage loan commitments amounted to $16.4 million and $6.8 million, respectively.
To protect against the price risk inherent in derivative loan commitments, the Company utilizes “best efforts” forward loan sale commitments to mitigate the risk of potential decreases in the values of loans that would result from the exercise of the derivative loan commitments.
113
With a “best efforts” contract, the Company commits to deliver an individual mortgage loan of a specified principal amount and quality to an investor if the loan to the underlying borrower closes. Generally, the price the investor will pay the seller for an individual loan is specified prior to the loan being funded (e.g., on the same day the lender commits to lend funds to a potential borrower).
The Company expects that these forward sale commitments will experience changes in fair value opposite to the change in fair value of derivative loan commitments. The notional amount of forward loan sale commitments at December 31, 2017 and 2016 was $25.3 million and $9.5 million, respectively.
The fair value of such commitments as of December 31, 2017 and 2016 are outlined below:
Assets | Liabilities | ||||||||||
Balance Sheet Location | Fair Value | Balance Sheet Location | Fair Value | ||||||||
(In thousands) | |||||||||||
December 31, 2017 | |||||||||||
Mortgage loan commitments | Other Assets | $ | 210 | Other Liabilities | $ | 36 | |||||
Forward loan sale commitments | Other Assets | 22 | Other Liabilities | 69 | |||||||
Total | $ | 232 | $ | 105 | |||||||
December 31, 2016 | |||||||||||
Mortgage loan commitments | Other Assets | $ | 111 | Other Liabilities | $ | 3 | |||||
Forward loan sale commitments | Other Assets | 15 | Other Liabilities | 74 | |||||||
Total | $ | 126 | $ | 77 | |||||||
NOTE 15 - FAIR VALUE MEASURMENTS
Determination of fair value
The Company uses fair value measurements to record fair value adjustments to certain assets and liabilities and to determine fair value disclosures. Fair value is the price that would be received to sell an asset or paid to transfer a liability in an orderly transaction between market participants at the measurement date. Fair value is best determined based upon quoted market prices. However, in many instances, there are no quoted market prices for the Company’s various assets and liabilities. In cases where quoted market prices are not available, fair values are based on estimates using present value or other valuation techniques. Those techniques are significantly affected by the assumptions used, including the discount rate and estimates of future cash flows. Accordingly, the fair value estimates may not be realized in an immediate settlement of the assets and liabilities.
The following methods and assumptions were used by the Company in estimating fair value disclosures for financial instruments:
Cash and cash equivalents: The carrying amounts of cash and due from banks and short-term investments approximate fair value.
Securities: All fair value measurements are obtained from a third-party pricing service and are not adjusted by management. The securities measured at fair value in Level 1 are based on quoted market prices in an active exchange market. These securities include U.S. Treasury securities and marketable equity securities. All other securities are measured at fair value in Level 2 based on pricing models that consider standard input factors such as observable market data, benchmark yields, interest rate volatilities, broker/dealer quotes, credit spreads and new issue data.
Federal Home Loan Bank stock: The carrying value of Federal Home Loan Bank stock approximates fair value based on the redemption provisions of the Federal Home Loan Bank.
114
Loans held for sale: Fair values are based on commitments in effect from investors or prevailing market prices.
Loans: Fair values are estimated using discounted cash flow analyses, using market interest rates currently being offered for loans with similar terms to borrowers of similar credit quality. Fair values for non-performing loans are estimated using discounted cash flow analyses or underlying collateral values, where applicable.
Accrued interest receivable: The carrying amount of accrued interest receivable approximates fair value.
Deposits: The fair values for non-certificate accounts are, by definition, equal to the amount payable on demand at the reporting date (i.e., their carrying amounts). Fair values for certificate accounts are estimated using a discounted cash flow calculation that applies market interest rates currently being offered on certificates to a schedule of aggregated expected monthly maturities on time deposits.
Borrowings: The fair values of borrowings are estimated using discounted cash flow analyses based on the current borrowing rates in the market for similar types of borrowing arrangements.
Interest rate swap agreements: The fair values of interest rate swap agreements are based on a valuation model that uses primarily observable inputs, such as benchmark yield curves and interest rates and also include the value associated with counterparty credit risk. Credit risk adjustments consider factors such as the likelihood of default by the Company and its counterparties, its net exposures and remaining contractual life. To date, the Company has not realized any losses due to a counterparty's inability to pay any net uncollateralized position.
Forward loan sale commitments and derivative loan commitments: Fair values of forward loan sale commitments and derivative loan commitments are based on fair values of the underlying mortgage loans and, for derivative loan commitments, fair values also include the value of servicing, deferred origination fees/costs and the probability of such commitments being exercised. Significant judgment and estimation is required in determining these fair value measurements.
Off-balance sheet instruments: Fair values for off-balance sheet lending commitments are based on fees currently charged to enter into similar agreements, taking into account the remaining terms of the agreements and the counterparties’ credit standing. The estimated fair value of off-balance sheet financial instruments at December 31, 2017 and 2016, was immaterial since fees charged are not material.
115
Assets and liabilities measured at fair value on a recurring basis
Assets and liabilities measured at fair value on a recurring basis are summarized below:
Level 1 | Level 2 | Level 3 | Total Fair Value | ||||||||||||
(In thousands) | |||||||||||||||
December 31, 2017 | |||||||||||||||
Assets | |||||||||||||||
Marketable equity securities | $ | 9,720 | $ | — | $ | — | $ | 9,720 | |||||||
Derivative assets: | |||||||||||||||
Interest rate swap agreements | — | 8,766 | — | 8,766 | |||||||||||
Forward loan sale commitments | — | — | 22 | 22 | |||||||||||
Mortgage loan commitments | — | — | 210 | 210 | |||||||||||
Total assets | $ | 9,720 | $ | 8,766 | $ | 232 | $ | 18,718 | |||||||
Liabilities | |||||||||||||||
Derivative liabilities: | |||||||||||||||
Interest rate swap agreements | $ | — | $ | 8,785 | $ | — | $ | 8,785 | |||||||
Forward loan sale commitments | — | — | 69 | 69 | |||||||||||
Mortgage loan commitments | — | — | 36 | 36 | |||||||||||
Total liabilities | $ | — | $ | 8,785 | $ | 105 | $ | 8,890 | |||||||
December 31, 2016 | |||||||||||||||
Assets | |||||||||||||||
Securities available for sale: | |||||||||||||||
Debt securities | $ | — | $ | 161,668 | $ | — | $ | 161,668 | |||||||
Marketable equity securities | 43,168 | — | — | 43,168 | |||||||||||
Derivative assets: | |||||||||||||||
Interest rate swap agreements | — | 9,024 | — | 9,024 | |||||||||||
Forward loan sale commitments | — | — | 15 | 15 | |||||||||||
Mortgage loan commitments | — | — | 111 | 111 | |||||||||||
Total assets | $ | 43,168 | $ | 170,692 | $ | 126 | $ | 213,986 | |||||||
Liabilities | |||||||||||||||
Derivative liabilities: | |||||||||||||||
Interest rate swap agreements | $ | — | $ | 8,988 | $ | — | $ | 8,988 | |||||||
Forward loan sale commitments | — | — | 74 | 74 | |||||||||||
Mortgage loan commitments | — | — | 3 | 3 | |||||||||||
Total liabilities | $ | — | $ | 8,988 | $ | 77 | $ | 9,065 | |||||||
Assets measured at fair value on a non-recurring basis
The Company may also be required, from time to time, to measure certain assets at fair value on a non-recurring basis in accordance with generally accepted accounting principles. These adjustments to fair value usually result from application of lower-of-cost-or-market accounting or write-downs of individual assets. There are no liabilities measured at fair value on a non-recurring basis. The following table summarizes the fair value hierarchy applicable to assets measured at fair value on a non-recurring basis:
December 31, 2017 | December 31, 2016 | ||||||||||||||||||||||
Level 1 | Level 2 | Level 3 | Level 1 | Level 2 | Level 3 | ||||||||||||||||||
(In thousands) | |||||||||||||||||||||||
Impaired loans | $ | — | $ | — | $ | 2,214 | $ | — | $ | — | $ | 136 | |||||||||||
116
The following table summarizes the total losses on assets measured at fair value on a non-recurring basis for the years ended December 31, 2017, 2016 and 2015.
Years Ended December 31, | |||||||||||
2017 | 2016 | 2015 | |||||||||
(In thousands) | |||||||||||
Impaired loans | $ | (5 | ) | $ | (2,911 | ) | $ | (404 | ) | ||
Gains and losses applicable to impaired loans are based on the appraised value of the underlying collateral, discounted as necessary due to management’s estimates of changes in market conditions. The losses applicable to impaired loans are not recorded as a direct adjustment to current earnings or comprehensive income, but rather as a component in determining the overall adequacy of the allowance for loan losses. Adjustments to the estimated fair value of impaired loans may result in increases or decreases to the provision for loan losses.
Summary of fair values of financial instruments
The estimated fair values, and related carrying amounts, of the Company’s financial instruments are as follows. Certain financial instruments and all nonfinancial instruments are exempt from disclosure requirements. Accordingly, the aggregate fair value amounts presented herein do not represent the underlying fair value of the Company.
Carrying Amount | Fair Value | ||||||||||||||||||
Level 1 | Level 2 | Level 3 | Total | ||||||||||||||||
(In thousands) | |||||||||||||||||||
December 31, 2017 | |||||||||||||||||||
Financial assets: | |||||||||||||||||||
Cash and cash equivalents | $ | 46,167 | $ | 46,167 | $ | — | $ | — | $ | 46,167 | |||||||||
Securities available for sale | 9,720 | 9,720 | — | — | 9,720 | ||||||||||||||
Securities held to maturity | 303,716 | — | 299,114 | — | 299,114 | ||||||||||||||
Federal Home Loan Bank stock | 12,105 | — | — | 12,105 | 12,105 | ||||||||||||||
Loans and loans held for sale, net | 2,195,139 | — | — | 2,174,871 | 2,174,871 | ||||||||||||||
Accrued interest receivable | 6,438 | — | — | 6,438 | 6,438 | ||||||||||||||
Financial liabilities: | |||||||||||||||||||
Deposits | 2,039,869 | — | — | 2,036,150 | 2,036,150 | ||||||||||||||
Borrowings | 205,000 | — | 203,913 | — | 203,913 | ||||||||||||||
On-balance sheet derivative financial instruments: | |||||||||||||||||||
Derivative assets: | |||||||||||||||||||
Interest rate swap agreements | 8,766 | — | 8,766 | — | 8,766 | ||||||||||||||
Forward loan sale commitments | 22 | — | — | 22 | 22 | ||||||||||||||
Mortgage loan commitments | 210 | — | — | 210 | 210 | ||||||||||||||
Derivative liabilities: | |||||||||||||||||||
Interest rate swap agreements: | 8,785 | — | 8,785 | — | 8,785 | ||||||||||||||
Forward loan sale commitments | 69 | — | — | 69 | 69 | ||||||||||||||
Mortgage loan commitments | 36 | — | — | 36 | 36 | ||||||||||||||
117
Carrying Amount | Fair Value | ||||||||||||||||||
Level 1 | Level 2 | Level 3 | Total | ||||||||||||||||
(In thousands) | |||||||||||||||||||
December 31, 2016 | |||||||||||||||||||
Financial assets: | |||||||||||||||||||
Cash and cash equivalents | $ | 30,496 | $ | 30,496 | $ | — | $ | — | $ | 30,496 | |||||||||
Securities available for sale | 204,836 | 43,168 | 161,668 | — | 204,836 | ||||||||||||||
Securities held to maturity | 201,027 | — | 198,093 | — | 198,093 | ||||||||||||||
Federal Home Loan Bank stock | 13,352 | — | — | 13,352 | 13,352 | ||||||||||||||
Loans and loans held for sale, net | 1,915,632 | — | — | 1,903,978 | 1,903,978 | ||||||||||||||
Accrued interest receivable | 6,057 | — | — | 6,057 | 6,057 | ||||||||||||||
Financial liabilities: | |||||||||||||||||||
Deposits | 1,808,687 | — | — | 1,808,629 | 1,808,629 | ||||||||||||||
Borrowings | 251,000 | — | 250,648 | — | 250,648 | ||||||||||||||
On-balance sheet derivative financial instruments: | |||||||||||||||||||
Derivative assets: | |||||||||||||||||||
Interest rate swap agreements | 9,024 | — | 9,024 | — | 9,024 | ||||||||||||||
Forward loan sale commitments | 15 | — | — | 15 | 15 | ||||||||||||||
Mortgage loan commitments | 111 | — | — | 111 | 111 | ||||||||||||||
Derivative liabilities: | |||||||||||||||||||
Interest rate swap agreements: | 8,988 | — | 8,988 | — | 8,988 | ||||||||||||||
Forward loan sale commitments | 74 | — | — | 74 | 74 | ||||||||||||||
Mortgage loan commitments | 3 | — | — | 3 | 3 | ||||||||||||||
118
NOTE 16 - OTHER COMPREHENSIVE INCOME
Accounting principles generally require that recognized revenues, expenses, gains and losses be included in net income. Although certain changes in assets and liabilities are reported as a separate component of equity on the consolidated balance sheets, such items, along with net income, are components of comprehensive income.
The components of accumulated other comprehensive loss, included in stockholders' equity, are as follows:
December 31, | |||||||
2017 | 2016 | ||||||
(In thousands) | |||||||
Securities available for sale: | |||||||
Net unrealized gain (loss) | $ | 283 | $ | (3,087 | ) | ||
Tax effect | (107 | ) | 1,007 | ||||
Net-of-tax amount | 176 | (2,080 | ) | ||||
Stranded tax effect related to the Act (see Note 2) | (33 | ) | — | ||||
Securities available for sale, net | 143 | (2,080 | ) | ||||
Securities held to maturity: | |||||||
Net unrealized gain on transferred securities | 250 | 337 | |||||
Tax effect | (59 | ) | (114 | ) | |||
Net-of-tax amount | 191 | 223 | |||||
Stranded tax effect related to the Act (see Note 2) | (7 | ) | — | ||||
Securities held to maturity, net | 184 | 223 | |||||
Defined benefit pension plan: | |||||||
Unrecognized net actuarial loss | (2,694 | ) | (3,482 | ) | |||
Tax effect | 757 | 1,270 | |||||
Net-of-tax amount | (1,937 | ) | (2,212 | ) | |||
Stranded tax effect related to the Act (see Note 2) | 157 | — | |||||
Defined benefit pension plan, net | (1,780 | ) | (2,212 | ) | |||
$ | (1,453 | ) | $ | (4,069 | ) | ||
Actuarial losses of $266,000, included in accumulated other comprehensive loss at December 31, 2017, are expected to be recognized as a component of net periodic pension cost, included in salaries and employee benefits expense, during the year ending December 31, 2018.
119
NOTE 17 - CONDENSED FINANCIAL STATEMENTS OF PARENT COMPANY
Financial information pertaining only to Blue Hills Bancorp, Inc. is as follows:
December 31, | |||||||
BALANCE SHEETS | 2017 | 2016 | |||||
(In thousands) | |||||||
Assets | |||||||
Cash balances at Blue Hills Bank | $ | 42,111 | $ | 66,326 | |||
Total cash and cash equivalents | 42,111 | 66,326 | |||||
Investment in Blue Hills Bank | 328,740 | 303,036 | |||||
Investment in Blue Hills Funding Corp. | 26,417 | 25,165 | |||||
Other assets | 21,146 | 13,499 | |||||
Total assets | $ | 418,414 | $ | 408,026 | |||
Liabilities and Stockholders' Equity | |||||||
Liability to ESOP | $ | 20,533 | $ | 20,995 | |||
Accrued expenses | 75 | 124 | |||||
Stockholders' equity | 397,806 | 386,907 | |||||
Total liabilities and stockholders' equity | $ | 418,414 | $ | 408,026 | |||
Years Ended December 31, | |||||||||||
2017 | 2016 | 2015 | |||||||||
STATEMENTS OF NET INCOME | (In thousands) | ||||||||||
Operating expenses | $ | 2,105 | $ | 2,478 | $ | 1,860 | |||||
Loss before income taxes and equity in undistributed net income of subsidiaries | $ | (2,105 | ) | $ | (2,478 | ) | $ | (1,860 | ) | ||
Applicable income tax benefit | (451 | ) | (758 | ) | (1,112 | ) | |||||
Loss before equity in income of subsidiaries | (1,654 | ) | (1,720 | ) | (748 | ) | |||||
Equity in undistributed net income of subsidiaries | 18,143 | 10,373 | 7,975 | ||||||||
Net income | $ | 16,489 | $ | 8,653 | $ | 7,227 | |||||
120
Years Ended December 31, | |||||||||||
2017 | 2016 | 2015 | |||||||||
STATEMENTS OF CASH FLOWS | (In thousands) | ||||||||||
Cash flows from operating activities: | |||||||||||
Net income | $ | 16,489 | $ | 8,653 | 7,227 | ||||||
Adjustments to reconcile net income to net cash provided by (used for) operating activities: | |||||||||||
Equity in undistributed net income of subsidiaries | (18,143 | ) | (10,373 | ) | (7,975 | ) | |||||
Excess tax benefit from deferred and stock based compensation | — | (105 | ) | (166 | ) | ||||||
Net change in other assets | (1,164 | ) | 11,625 | (1,157 | ) | ||||||
Net change in other liabilities | (49 | ) | 97 | (241 | ) | ||||||
Net cash provided by (used for) operating activities | (2,867 | ) | 9,897 | (2,312 | ) | ||||||
Cash flows used for investing activities: | |||||||||||
Investment in Blue Hills Bank | (6,228 | ) | (16,844 | ) | (3,929 | ) | |||||
Net cash used for investing activities | (6,228 | ) | (16,844 | ) | (3,929 | ) | |||||
Cash flows used for financing activities: | |||||||||||
Excess tax benefit from deferred and stock based compensation | — | 105 | 166 | ||||||||
Repurchase of common stock | — | (24,432 | ) | (13,121 | ) | ||||||
Share redemption for tax withholdings | (983 | ) | (730 | ) | (439 | ) | |||||
Proceeds from exercise of stock options | 243 | 40 | — | ||||||||
Common and preferred stock dividends paid | (14,380 | ) | (2,675 | ) | (1,032 | ) | |||||
Net cash used for financing activities | (15,120 | ) | (27,692 | ) | (14,426 | ) | |||||
Net change in cash and cash equivalents | (24,215 | ) | (34,639 | ) | (20,667 | ) | |||||
Cash and cash equivalents at beginning of year | 66,326 | 100,965 | 121,632 | ||||||||
Cash and cash equivalents at end of year | $ | 42,111 | $ | 66,326 | $ | 100,965 | |||||
121
NOTE 18 - SELECTED QUARTERLY FINANCIAL DATA (UNAUDITED)
First Quarter | Second Quarter | Third Quarter | Fourth Quarter | ||||||||||||||||||||||||||||
2017 | 2016 | 2017 | 2016 | 2017 | 2016 | 2017 | 2016 | ||||||||||||||||||||||||
(In thousands, except share data) | |||||||||||||||||||||||||||||||
Interest and dividend income | $ | 19,781 | $ | 16,063 | $ | 20,574 | $ | 16,356 | $ | 21,545 | $ | 17,685 | $ | 22,875 | $ | 19,434 | |||||||||||||||
Interest expense | 3,900 | 2,862 | 4,166 | 3,040 | 4,591 | 3,190 | 5,081 | 3,484 | |||||||||||||||||||||||
Net interest and dividend income | 15,881 | 13,201 | 16,408 | 13,316 | 16,954 | 14,495 | 17,794 | 15,950 | |||||||||||||||||||||||
Provision (credit) for loan losses | 57 | (27 | ) | 1,118 | 1,113 | 242 | 2,872 | 681 | 927 | ||||||||||||||||||||||
Other noninterest income | 1,891 | 1,621 | 3,582 | 2,147 | 2,826 | 3,834 | 2,930 | 3,509 | |||||||||||||||||||||||
Realized securities gains (losses), net | (1,022 | ) | (244 | ) | 928 | 664 | — | 298 | — | 298 | |||||||||||||||||||||
Gain on exchange of investment in Northeast Retirement Services | 5,947 | — | — | — | — | — | — | — | |||||||||||||||||||||||
Total noninterest income | 6,816 | 1,377 | 4,510 | 2,811 | 2,826 | 4,132 | 2,930 | 3,807 | |||||||||||||||||||||||
Total noninterest expense | 13,400 | 12,068 | 13,366 | 12,935 | 13,355 | 13,234 | 14,185 | 13,509 | |||||||||||||||||||||||
Provision for income taxes | 1,753 | 870 | 2,566 | 721 | 2,342 | 891 | 4,565 | 1,323 | |||||||||||||||||||||||
Net income | $ | 7,487 | $ | 1,667 | $ | 3,868 | $ | 1,358 | $ | 3,841 | $ | 1,630 | $ | 1,293 | $ | 3,998 | |||||||||||||||
Basic earnings per share | $ | 0.31 | $ | 0.07 | $ | 0.16 | $ | 0.06 | $ | 0.16 | $ | 0.07 | $ | 0.05 | $ | 0.17 | |||||||||||||||
Diluted earnings per share | $ | 0.31 | $ | 0.07 | $ | 0.16 | $ | 0.05 | $ | 0.16 | $ | 0.07 | $ | 0.05 | $ | 0.17 | |||||||||||||||
Weighted average common shares (basic) | 23,911,419 | 25,066,086 | 23,952,443 | 24,575,211 | 23,973,116 | 24,129,512 | 24,104,239 | 23,919,483 | |||||||||||||||||||||||
Weighted average common shares (diluted) | 24,275,665 | 25,132,441 | 24,346,553 | 24,699,794 | 24,510,092 | 24,307,540 | 24,795,366 | 24,032,613 | |||||||||||||||||||||||
122
ITEM 9. | CHANGES IN AND DISAGREEMENTS WITH ACCOUNTANTS ON ACCOUNTING AND FINANCIAL DISCLOSURE |
None.
ITEM 9A. | CONTROLS AND PROCEDURES |
Conclusion Regarding the Effectiveness of Disclosure Controls and Procedures
The Company carried out an evaluation, under the supervision and with the participation of the Company’s management, including the Company’s Chief Executive Officer along with the Company’s Chief Financial Officer, of the effectiveness of the design and operation of the Company’s disclosure controls and procedures, as such term is defined under Rule 13a-15(e) promulgated under the Securities Exchange Act of 1934, as amended (the “Exchange Act”). Based upon that evaluation, the Company’s Chief Executive Officer along with the Company’s Chief Financial Officer concluded that the Company’s disclosure controls and procedures are effective as of the end of the period covered by this annual report.
Changes in Internal Control over Financial Reporting
There were no changes in our internal control over financial reporting that occurred during the fourth quarter that have materially affected, or are reasonably likely to materially affect, the Company’s internal control over financial reporting.
Management’s Report on Internal Control Over Financial Reporting
Management of Blue Hills Bancorp, Inc. is responsible for establishing and maintaining adequate internal control over financial reporting. Internal control over financial reporting is defined in Rule 13a-15(f) under the Exchange Act as a process designed by, or under the supervision of, the Company’s principal executive and principal financial officers and effected by the Company’s Board of Directors, management and other personnel, to provide reasonable assurance regarding the reliability of financial reporting and the preparation of financial statements for external purposes in accordance with generally accepted accounting principles. Blue Hills Bancorp, Inc.'s internal control over financial reporting includes those policies and procedures that:
(i) pertain to the maintenance of records that in reasonable detail accurately and fairly reflects the transactions and disposition of the assets of the Company;
(ii) provide reasonable assurance that transactions are recorded as necessary to permit preparation of financial statements in accordance with generally accepted accounting principles, and that receipts and expenditures of the Company are being made only in accordance with authorizations of management and directors of the Company; and
(iii) provide reasonable assurance regarding prevention or timely detection of unauthorized acquisition, use or disposition of the Company’s assets that could have a material effect on the financial statements.
Because of its inherent limitations, internal control over financial reporting may not prevent or detect misstatements. Also, projections of any evaluation of effectiveness to future periods are subject to the risk that controls may become inadequate because of changes in conditions, or that the degree of compliance with the policies or procedures may deteriorate.
Management assessed the effectiveness of the Company’s internal control over financial reporting as of December 31, 2017. In making this assessment, management used the criteria set forth by the Committee of Sponsoring Organizations of the Treadway Commission (COSO) in Internal Control-Integrated Framework (2013).
Based on our assessment and those criteria, management believes that the Company maintained effective internal control over financial reporting as of December 31, 2017.
ITEM 9B. | OTHER INFORMATION |
None.
123
ITEM 10. DIRECTORS, EXECUTIVE OFFICERS AND CORPORATE GOVERNANCE
The information in Blue Hills Bancorp’s definitive Proxy Statement for the 2018 Annual Meeting of Stockholders under the captions “Proposals to be Voted on by Stockholders-Proposal 1-Election of Directors,” “Other Information Relating to Directors and Executive Officers-Section 16(a) Beneficial Ownership Reporting Compliance,” and “Corporate Governance-Code of Ethics,” "-Procedures to be Followed by Stockholders,” “-Committees of the Board of Directors,” "-Audit Committee” and “-Audit Report,” is incorporated herein by reference.
ITEM 11. | EXECUTIVE COMPENSATION |
The information in Blue Hills Bancorp’s definitive Proxy Statement for the 2018 Annual Meeting of Stockholders under the caption “Executive Compensation,” “Director Compensation” and "Compensation Committee Interlocks and Insider Participation" is incorporated herein by reference.
ITEM 12. | SECURITY OWNERSHIP OF CERTAIN BENEFICIAL OWNERS AND MANAGEMENT AND RELATED STOCKHOLDER MATTERS |
The information in Blue Hills Bancorp’s definitive Proxy Statement for the 2018 Annual Meeting of Stockholders under the caption “Stock Ownership” is incorporated herein by reference.
ITEM 13. | CERTAIN RELATIONSHIPS AND RELATED TRANSACTIONS, AND DIRECTOR INDEPENDENCE |
The information in Blue Hills Bancorp’s definitive Proxy Statement for the 2018 Annual Meeting of Stockholders under the captions “Transactions with Certain Related Persons” and "Corporate Governance-Director Independence” is incorporated herein by reference.
ITEM 14. | PRINCIPAL ACCOUNTING FEES AND SERVICES |
The information in Blue Hills Bancorp’s definitive Proxy Statement for the 2018 Annual Meeting of Stockholders under the captions “Proposal II-Ratification of Independent Registered Public Accounting Firm-Audit Fees” and “-Pre-Approval of Services by the Independent Registered Public Accounting Firm” is incorporated herein by reference.
PART IV
ITEM 15. EXHIBITS AND FINANCIAL STATEMENT SCHEDULES
(a)(1) Financial Statements
The following documents are filed as part of this Form 10-K.
(A) | Report of Independent Registered Public Accounting Firm |
(B) | Consolidated Balance Sheets as of December 31, 2017 and 2016 |
(C) | Consolidated Statements of Net Income for the years ended December 31, 2017, 2016 and 2015 |
(D) | Consolidated Statements of Comprehensive Income (Loss) for the years ended December 31, 2017, 2016 and 2015 |
(E) | Consolidated Statements of Changes in Stockholders’ Equity for the years ended December 31, 2017, 2016 and 2015 |
(F) | Consolidated Statements of Cash Flows for the years ended December 31, 2017, 2016 and 2015 |
(G) | Notes to Consolidated Financial Statements. |
(a)(2) Financial Statement Schedules -None.
124
(a)(3) Exhibits
3.1 | |
3.2 | |
4 | |
10.1 | |
10.2 | |
10.5 | |
10.6 | |
10.7 | |
10.8 | |
10.9 | |
10.10 | |
10.11 | |
21 | |
23 | |
31.1 | |
31.2 | |
32 | |
101 | The following financial statements for the year ended December 31, 2016, formatted in XBRL, which are furnished, and not filed: (i) Consolidated Balance Sheets, (ii) Consolidated Statements of Income, (iii) Consolidated Statements of Comprehensive Income (Loss), (iv) Consolidated Statements of Changes in Stockholders’ Equity (v) Consolidated Statements of Cash Flows, and (vi) the Notes to Consolidated Financial Statements. |
101.INS | XBRL Instance Document |
101.SCH | XBRL Taxonomy Extension Schema Document |
125
101.CAL | XBRL Taxonomy Extension Calculation Linkbase Document |
101.DEF | XBRL Taxonomy Extension Definition Linkbase Document |
101.LAB | XBRL Taxonomy Extension Labels Linkbase Document |
101.PRE | XBRL XBRL Taxonomy Extension Presentation Linkbase Document |
+ Compensatory arrangements.
ITEM 16. | FORM 10-K SUMMARY |
None.
126
SIGNATURES
Pursuant to the requirements of Section 13 or 15(d) of the Securities Exchange Act of 1934, the Registrant has duly caused this report to be signed on its behalf by the undersigned, thereunto duly authorized.
BLUE HILLS BANCORP, INC. (Registrant) | |||
Date: March 7, 2018 | By: | /s/ William M. Parent | |
William M. Parent President and Chief Executive Officer (Duly Authorized Representative) | |||
Pursuant to the requirements of the Securities Exchange of 1934, this report has been signed below by the following persons on behalf of the Registrant and in the capacities and on the dates indicated.
Signatures | Title | Date | ||
/s/ William M. Parent | ||||
William M. Parent | President, Chief Executive Officer and Director (Principal Executive Officer) | March 7, 2018 | ||
/s/ Lauren B. Messmore | ||||
Lauren B. Messmore | Executive Vice President and Chief Financial Officer (Principal Accounting and Financial Officer) | March 7, 2018 | ||
/s/ David J. Houston, Jr. | ||||
David J. Houston, Jr. | Chairman of the Board | March 7, 2018 | ||
/s/ George E. Clancy | ||||
George E. Clancy | Director | March 7, 2018 | ||
/s/ Anthony LaCava | ||||
Anthony LaCava | Director | March 7, 2018 | ||
/s/ Brian G. Leary | ||||
Brian G. Leary | Director | March 7, 2018 | ||
127
/s/ Peter J. Manning | ||||
Peter J. Manning | Director | March 7, 2018 | ||
/s/ Ronald K. Perry | ||||
Ronald K. Perry | Director | March 7, 2018 | ||
/s/ David Powers | ||||
David Powers | Director | March 7, 2018 | ||
/s/ Pamela C. Scott | ||||
Pamela C. Scott | Director | March 7, 2018 | ||
/s/ Janice L. Shields | ||||
Janice L. Shields | Director | March 7, 2018 | ||
/s/ Scott Smith | ||||
Scott Smith | Director | March 7, 2018 | ||
128