Attached files
| file | filename |
|---|---|
| EX-99.1 - EXHIBIT 99.1 - BROADWIND, INC. | exh_991.htm |
| 8-K - FORM 8-K - BROADWIND, INC. | f8k_073118.htm |
Exhibit 99.2

Q2 2018 Earnings Call July 31, 2018
Industry Data and Forward - Looking Statements Disclaimer ▪ Broadwind obtained the industry and market data used throughout this presentation from our own research, internal surveys and st udies conducted by third parties, independent industry associations or general publications and other publicly available informatio n. Independent industry publications and surveys generally state that they have obtained information from sources believed to be reliable, but do not gu arantee the accuracy or completeness of such information. Forecasts are particularly likely to be inaccurate, especially over long periods of time. W e a re not aware of any misstatements in the industry data we have presented herein, but estimates involve risks and uncertainties and a re subject to change based on various factors beyond our control. ▪ Our forward - looking statements may include or relate to our beliefs, expectations, plans and/or assumptions with respect to the following: ( i ) state, local and federal regulatory frameworks affecting the industries in which we compete, including the wind energy industry, and th e related extension, continuation or renewal of federal tax incentives and grants and state renewable portfolio standards; (ii) our customer relat ion ships and our substantial dependency on a few significant customers and our efforts to diversify our customer base and sector focus and lev era ge relationships across business units; (iii) our ability to continue to grow our business organically and through acquisitions; (iv) our prod uct ion, sales, collections, customer deposits and revenues generated by new customer orders and the resulting cash flows; (v) the sufficiency of our liqu idi ty and alternate sources of funding, if necessary; (vi) our ability to realize revenue from customer orders and backlog; (vii) our ability to ope rate our business efficiently, manage capital expenditures and costs effectively, and generate cash flow; (viii) the economy and the potential imp act it may have on our business, including our customers; (ix) the state of the wind energy market and other energy and industrial markets gener all y and the impact of competition and economic volatility in those markets; (x) the effects of market disruptions and regular market volatility, in clu ding fluctuations in the price of oil, gas and other commodities; (xi) the effects of the change of administrations in the U.S. federal government; (x ii) our ability to successfully integrate and operate the business of Red Wolf Company, LLC and to identify, negotiate and execute future acquis iti ons; and (xiii) the potential loss of tax benefits if we experience an “ownership change” under Section 382 of the Internal Revenue Code of 1986, as amended; and (xiv) the impact of future sales of our common stock or securities convertible into our common stock on our stock price. These statements are based on information currently available to us and are subject to various risks, uncertainties and other factors. We are unde r n o duty to update any of these statements. You should not consider any list of such factors to be an exhaustive statement of all of the risks, unce rta inties or other factors that could cause our current beliefs, expectations, plans and/or assumptions to change. ▪ This presentation contains non - GAAP financial information. We believe that certain non - GAAP financial measures may provide users of this financial information with meaningful comparisons between current results and results in prior operating periods. We believe tha t these non - GAAP financial measures can provide additional meaningful reflection of underlying trends of the business because they provide a c omp arison of historical information that excludes certain infrequently occurring or non - operational items that impact the overall comparabili ty. Non - GAAP financial measures should be viewed in addition to, and not as an alternative to, our reported results prepared in accordance wi th GAAP. Please see our earnings release dated July 31, 2018 for a reconciliation of certain non - GAAP measures presented in this presentation. July 31, 2018 2

Highlights ▪ $37M revenue and $2.1M EBITDA – BWEN recovery in line with guidance ▪ Core wind, oil and gas and mining markets remain strong – gas turbine demand weak ▪ Tariffs and trade politics remain a headwind ▪ Customer diversification efforts on track ▪ Liquidity stable, with $10M available on credit line July 31, 2018 3
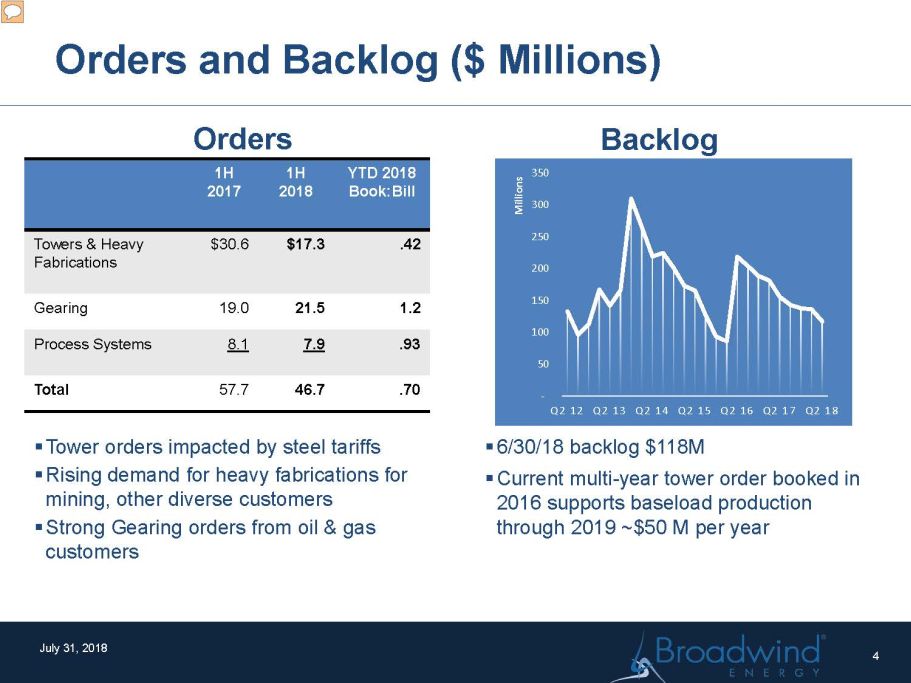
Orders and Backlog ($ Millions) Orders ▪ Tower orders impacted by steel tariffs ▪ Rising demand for heavy fabrications for mining, other diverse customers ▪ Strong Gearing orders from oil & gas customers Backlog ▪ 6/30/18 backlog $118M ▪ Current multi - year tower order booked in 2016 supports baseload production through 2019 ~$50 M per year July 31, 2018 1H 2017 1H 2018 YTD 2018 Book:Bill Towers & Heavy Fabrications $30.6 $17.3 .42 Gearing 19.0 21.5 1.2 Process Systems 8.1 7.9 .93 Total 57.7 46.7 .70 4 - 50 100 150 200 250 300 350 Q2 12 Q2 13 Q2 14 Q2 15 Q2 16 Q2 17 Q2 18 Millions

Successful Diversification of BWEN Customer Base July 31, 2018 5 $0 $5,000 $10,000 $15,000 $20,000 $25,000 $30,000 $35,000 $40,000 $45,000 Customer Diversification Progress YTD actual ▪ Diversification of customer base on track to meet $40M target for 2018 orders ▪ Oil and gas, mining and other industrial has grown to ~$65M annual intake for BWEN $40M target $0 $10,000 $20,000 $30,000 $40,000 $50,000 $60,000 $70,000 $80,000 Non - Wind Order Trend (T12M) Mining/OHV Oil & Gas Industrial

Market Outlook – US Wind (GW) Source : MAKE Global Wind Market Outlook Update – Q2 2018 Forecast Development Pipeline - GW Source: AWEA Q2 2018 Market Report July 31, 2018 6 0 5 10 15 20 25 30 35 40 Q1 16 Q2 16 Q3 16 Q4 16 Q1 17 Q2 17 Q3 17 Q4 17 Q1 18 Q2 18 Under construction at QE Adv. Development ▪ Project pipeline remains strong in support of 10+ GW outlook for 2019/20 ▪ 2021 forecast upgraded to near 7.5GW ▪ Post 2021 fall off predicted 0 2 4 6 8 10 12 14 2015a 2016a 2017a 2018e 2019e 2020e 2021e Forecast – GW Installations

Tariff and Trade Uncertainties 7 ▪ Steel accounts for nearly half of material content of a wind turbine – tariff impacts steel plate but not imported towers ▪ Fluctuating US vs Chinese steel prices influence tower sourcing for US OEM’s – depending on location of windfarm and shipping costs (also highly variable) ▪ Section 232 announcement has triggered domestic steel price spike of ~50% ▪ Argentina, Brazil and S. Korea subsequently agreed to quota of 70% of prior exports. Western Europe and NAFTA discussions ongoing ▪ Impact to US manufacturers is accelerating as steel contracts expire 200 300 400 500 600 700 800 900 1000 1100 Q1 17 Q2 17 Q3 17 Q4 17 Q1 18 Q2 18 18-Jul Relative Steel Price $/ST * US China Source: Platts July 31, 2018 2017 Steel Imports by Source Country ( Dept Commerce) NAFTA (Canada + Mexico) China Brazil/ S.Korea W. Europe Other Turkey Russia Japan

2018 Priorities July 31, 2018 8 ▪ Customer diversification ▪ Manufacturing footprint r eduction ▪ Restructure systems to support changing sales mix ▪ CI to offset margin compression ▪ Manage through steel escalation risk

Towers and Heavy Fabrications Q2 2017 Q2 2018 1H 2017 1H 2018 Orders ($M) $1.5 $9.5 $30.6 $17.3 Sections Sold (#) 264 201 664 344 Revenue ($M) 34.3 24.0 83.2 40.8 Operating Inc/(Loss) ($M) 2.8 .7 8.6 (.8) - % of Sales 8.2% 3.0% 10.4% (1.9%) EBITDA* ($M) 3.9 2.2 10.9 2.1 - % of Sales 11.4% 9.0% 13.1% 5.1% Q2 Results ▪ Tower orders up from PY; tariffs are delaying orders and encouraging increased imports ▪ Q2 18 tower sections sold down 24% vs. prior year, but up 41% sequentially as production recovery continues ▪ Operating income lower than PY due to low tower volume, partially offset by productivity improvements and reduction in overhead and SG&A expenses 2018 Objectives ▪ Diversify tower customer base and grow heavy fabrications business ▪ Cost out to offset margin pressure ▪ Build capabilities and customer base for heavy fabrications July 31, 2018 * Reconciliation to non - GAAP measure included in Appendix 9 Q1 16 Q2 16 Q3 16 Q4 16 Q1 17 Q2 17 Q3 17 Q4 17 Q1 18 Q2 18 Quarterly Tower Section Sales

Gearing Q2 2017 Q2 2018 1H 2017 1H 2018 Orders ($M) $11.6 $6.1 $19.0 $21.5 Revenue ($M) 6.1 8.6 9.9 17.4 Operating (Loss)/ Income ($M) (.6) (.7) (2.2) (1.3) EBITDA* ($M) - - (.9) - Q2 Results ▪ As expected, orders intake slowed after a very strong Q1 to yield a 1H 2018 yoy improvement of 13% with increases in the mining sector augmenting continued strength in oil & gas ▪ Revenue up 41% compared to Q2 17 ▪ EBITDA breakeven – revenue increase offset by increases in material costs, manufacturing variances and volume related FOH and SG&A costs July 31, 2018 2018 Objectives ▪ Continue diversification of customer base ▪ Achieve consistent operating pattern ▪ Grow and optimize Gearbox production ▪ Generate positive operating income * Reconciliation to non - GAAP measure included in Appendix 10 0.0 2.0 4.0 6.0 8.0 10.0 12.0 2013 2014 2015 2016 2017 Q1 18 Q2 18 $M Gearing Revenue by Market Oil & Gas Mining Wind Industrial Steel

July 31, 2018 Process Systems Q2 2017 Q2 2018 1H 2017 1H 2018 Orders ($M) $4.4 $3.0 $8.1 $7.9 Revenue ($M) 3.0 4.1 6.3 8.5 Operating (Loss) ($M) (1.1) (5.8) (1.9) (6.7) EBITDA* ($M) (.6) (.2) (1.1) (.5) * Reconciliation to non - GAAP measure included in Appendix Q2 Results ▪ Process Systems includes Abilene - based CNG and fabrications, and Red Wolf as of Feb 1, 2017 ▪ Operating loss worse due mainly to $5.0M goodwill impairment charge ▪ Continuing restructuring plan for Abilene fabrications facility and exit of CNG business 2018 Objectives ▪ Progress Red Wolf customer diversification ▪ Expand share with existing customers ▪ Exit CNG 11
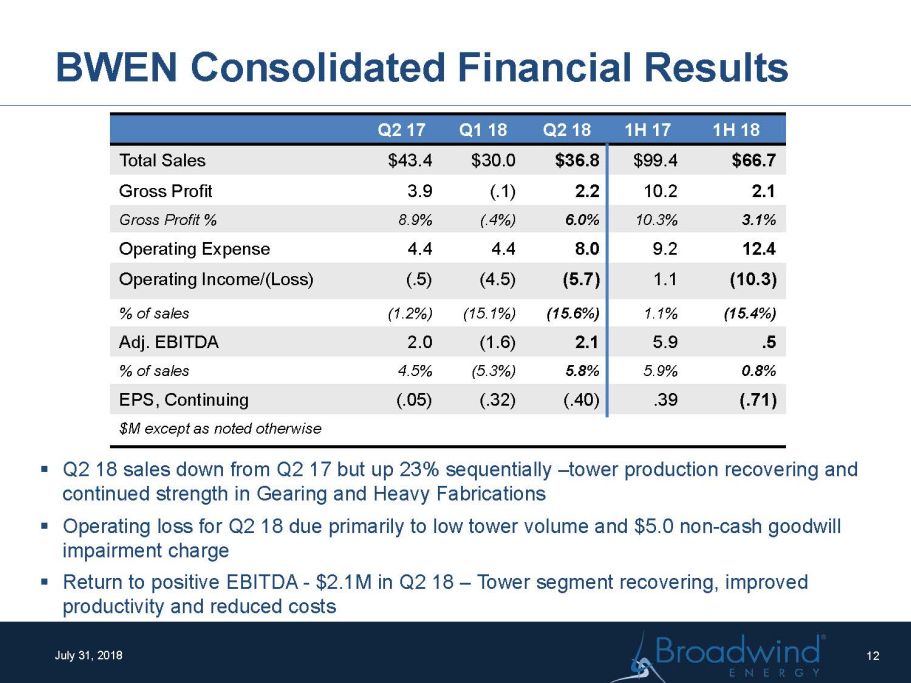
BWEN Consolidated Financial Results July 31, 2018 ▪ Q2 18 sales down from Q2 17 but up 23% sequentially – tower production recovering and continued strength in Gearing and Heavy Fabrications ▪ Operating loss for Q2 18 due primarily to low tower volume and $5.0 non - cash goodwill impairment charge ▪ Return to positive EBITDA - $2.1M in Q2 18 – Tower segment recovering, improved productivity and reduced costs 12 Q2 17 Q1 18 Q2 18 1H 17 1H 18 Total Sales $43.4 $30.0 $36.8 $99.4 $66.7 Gross Profit 3.9 (.1) 2.2 10.2 2.1 Gross Profit % 8.9% (.4%) 6.0% 10.3% 3.1% Operating Expense 4.4 4.4 8.0 9.2 12.4 Operating Income/(Loss) (.5) (4.5) (5.7) 1.1 (10.3) % of sales (1.2%) (15.1%) (15.6%) 1.1% (15.4%) Adj. EBITDA 2.0 (1.6) 2.1 5.9 .5 % of sales 4.5% (5.3%) 5.8% 5.9% 0.8% EPS, Continuing (.05) (.32) (.40) .39 (.71) $M except as noted otherwise

Operating Working Capital (OWC) July 31, 2018 ▪ Reduction in AR past dues since year end ▪ Inventory turns improving because of elevated production levels ▪ Advance deposits expanding with addition of new customers * Operating Working Capital = Trade A/R + Inventories – Trade Payables – Customer Deposits 12/31/17 3/31/18 6/30/18 DSO 70 48 44 Inv. Turns 5.0 5.4 6.7 DPO 44 42 41 Cash Conv. (days) 48 44 36 OWC $M 11.4 14.3 14.3 OWC* Historical Trend – cents/$ sales OWC* Management 13 $(0.05) $- $0.05 $0.10 $0.15 $0.20
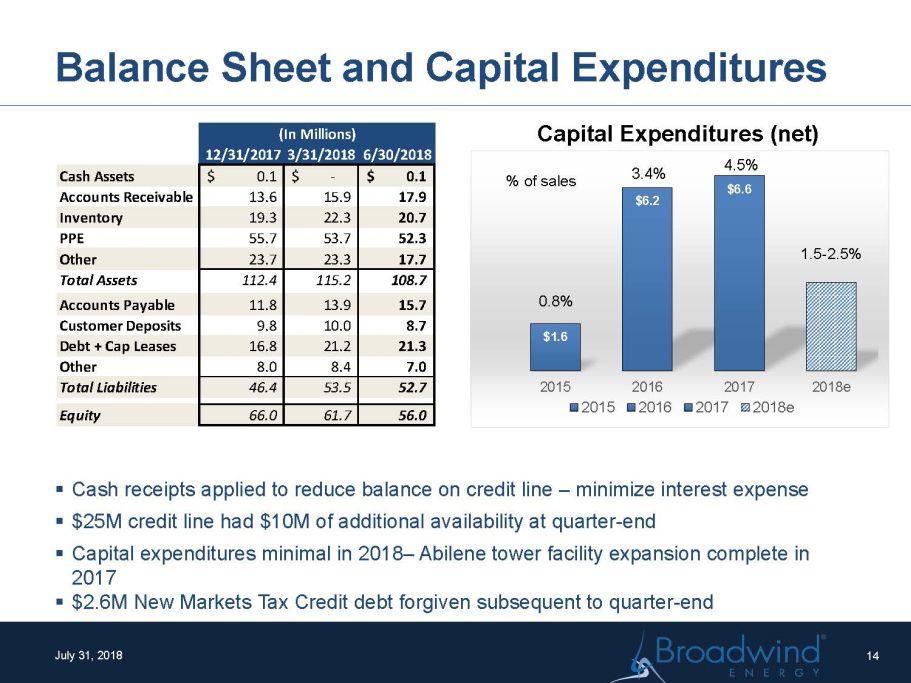
Balance Sheet and Capital Expenditures July 31, 2018 $1.6 $6.2 $6.6 2015 2016 2017 2018e 2015 2016 2017 2018e 1.5 - 2.5% Capital Expenditures (net) ▪ Cash receipts applied to reduce balance on credit line – minimize interest expense ▪ $25M credit line had $10M of additional availability at quarter - end ▪ Capital expenditures minimal in 2018 – Abilene tower facility expansion complete in 2017 ▪ $2.6M New Markets Tax Credit debt forgiven subsequent to quarter - end 14 % of sales 0.8% 3.4% 4.5% 12/31/20173/31/20186/30/2018 Cash Assets 0.1$ -$ 0.1$ Accounts Receivable 13.6 15.9 17.9 Inventory 19.3 22.3 20.7 PPE 55.7 53.7 52.3 Other 23.7 23.3 17.7 Total Assets 112.4 115.2 108.7 Accounts Payable 11.8 13.9 15.7 Customer Deposits 9.8 10.0 8.7 Debt + Cap Leases 16.8 21.2 21.3 Other 8.0 8.4 7.0 Total Liabilities 46.4 53.5 52.7 Equity 66.0 61.7 56.0 (In Millions)

Appendix July 31, 2018 15 Consolidated 2018 2017 2018 2017 Net (Loss)/Income from continuing operations……………………………. (6,083)$ (688)$ (10,894)$ 5,794$ Interest Expense………………………………………………. 352 217 650 356 Income Tax Provision/(Benefit)……………………………… (6) (16) (33) (5,034) Depreciation and Amortization………………………………………………………………2,349 2,203 4,706 4,304 Share-based Compensation and Other Stock Payments………………………………………………………………418 241 846 462 Restructuring Costs…………………………………………. 116 - 267 - Impairment Charges…………………………………………………. 4,993 - 4,993 - Adjusted EBITDA (Non-GAAP)…………………………. 2,139$ 1,957$ 535$ 5,882$ Three Months Ended June 30, Six Months Ended June 30, Towers and Heavy Fabrications Segment 2018 2017 2018 2017 Net (Loss)/Income…………………………………………. 629$ 2,024$ (486)$ 6028 Interest Expense/(Benefit)…………………………………. 49 20 80 35 Income Tax (Benefit)/Provision……………………………… 46 772 (373) 2603 Depreciation and Amortization………………………………………………………………1,280 1,070 2,535 2162 Share-based Compensation and Other Stock Payments………………………………………………………………169 58 312 115 Adjusted EBITDA (Non-GAAP)…………………………….. 2,173$ 3,944$ 2,068$ 10,943$ Three Months Ended June 30, Six Months Ended June 30, Gearing Segment 2018 2017 2018 2017 Net Income/(Loss)…………...……………………………. (662)$ (638)$ (1,293)$ (2,175)$ Interest Expense…………………………………………… 2 2 5 6 Income Tax Provision/(Benefit)……………………………… (3) 2 - 4 Depreciation and Amortization………………………………………………………………586 612 1,176 1,238 Share-based Compensation and Other Stock Payments………………………………………………………………77 23 143 41 Adjusted EBITDA (Non-GAAP)……………………….. -$ 1$ 31$ (886)$ Three Months Ended June 30, Six Months Ended June 30,

Appendix July 31, 2018 16 Process Systems 2018 2017 2018 2017 Net Income/(Loss)………………………………………………… (3,977)$ (5,070)$ (4,621)$ (5,769)$ Interest Expense……………………………………………………. 1 1 2 3 Income Tax Provision/(Benefit)…………………………………… (1,797) 3,966 (2,050) 3,841 Depreciation and Amortization……………………………………. 423 467 874 801 Share-based Compensation and Other Stock Payments………… 24 10 52 15 Restructuring Expense……………………………………………. 116 - 267 - Impairment Expense………………………………………………… 4,993 - 4,993 - Adjusted EBITDA (Non-GAAP)……………………………… (217)$ (626)$ (483)$ (1,109)$ Three Months Ended June 30, Six Months Ended June 30, Corporate and Other 2018 2017 2018 2017 Net(Loss)/Income………………………………………………….. (2,073)$ 2,996$ (4,494)$ 7,710$ Interest Expense………………………………………………… 300 194 563 312 Income Tax Provision/(Benefit)……………………………… 1,748 (4,756) 2,390 (11,482) Depreciation and Amortization………………………………………………………………60 54 121 103 Share-based Compensation and Other Stock Payments………………………………………………………………148 150 339 291 Adjusted EBITDA (Non-GAAP)……………………………. 183$ (1,362)$ (1,081)$ (3,066)$ Three Months Ended June 30, Six Months Ended June 30,
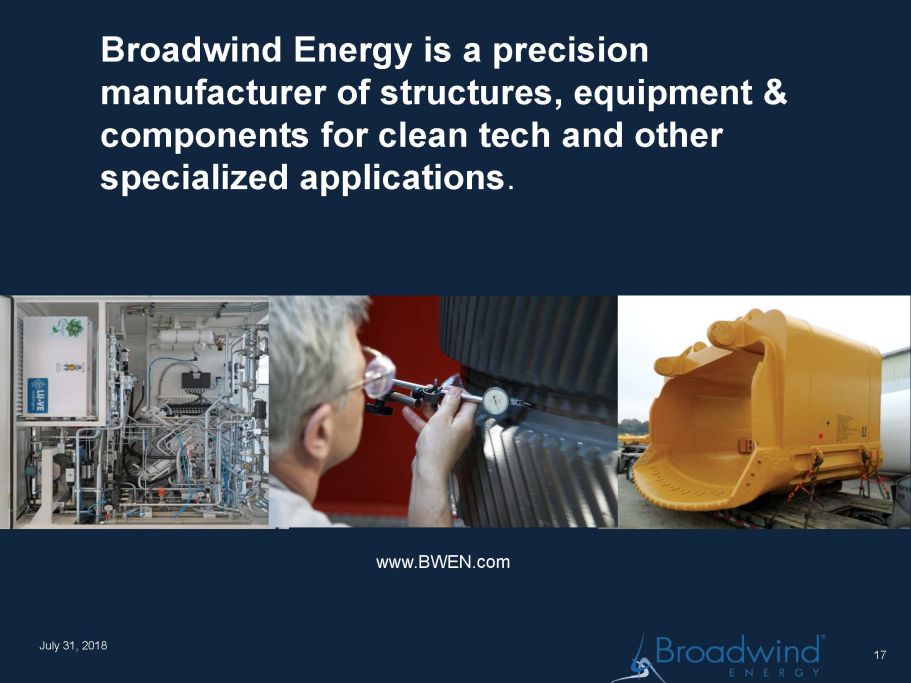
Broadwind Energy is a precision manufacturer of structures, equipment & components for clean tech and other specialized applications . www.BWEN.com July 31, 2018 17