Attached files
| file | filename |
|---|---|
| EX-23.1 - EX-23.1 - BROADWIND, INC. | a2223204zex-23_1.htm |
| EX-31.1 - EX-31.1 - BROADWIND, INC. | a2223204zex-31_1.htm |
| EX-23.2 - EX-23.2 - BROADWIND, INC. | a2223204zex-23_2.htm |
| EX-32.1 - EX-32.1 - BROADWIND, INC. | a2223204zex-32_1.htm |
| EX-32.2 - EX-32.2 - BROADWIND, INC. | a2223204zex-32_2.htm |
| EX-31.2 - EX-31.2 - BROADWIND, INC. | a2223204zex-31_2.htm |
| EX-10.27 - EX-10.27 - BROADWIND, INC. | a2223204zex-10_27.htm |
| EX-10.47 - EX-10.47 - BROADWIND, INC. | a2223204zex-10_47.htm |
| EX-10.25 - EX-10.25 - BROADWIND, INC. | a2223204zex-10_25.htm |
| EX-10.26 - EX-10.26 - BROADWIND, INC. | a2223204zex-10_26.htm |
| EXCEL - IDEA: XBRL DOCUMENT - BROADWIND, INC. | Financial_Report.xls |
| EX-21.1 - EX-21.1 - BROADWIND, INC. | a2223204zex-21_1.htm |
Use these links to rapidly review the document
TABLE OF CONTENTS
INDEX TO FINANCIAL STATEMENTS
UNITED STATES
SECURITIES AND EXCHANGE COMMISSION
Washington, D.C. 20549
FORM 10-K
| (Mark One) | ||
| ý | ANNUAL REPORT PURSUANT TO SECTION 13 OR 15(d) OF THE SECURITIES EXCHANGE ACT OF 1934 | |
| For the fiscal year ended December 31, 2014 | ||
| Or | ||
| o | TRANSITION REPORT PURSUANT TO SECTION 13 OR 15(d) OF THE SECURITIES EXCHANGE ACT OF 1934 | |
| For the transition period from to | ||
| Commission File Number 001-34278 | ||

BROADWIND ENERGY, INC.
(Exact name of Registrant as specified in its charter)
| Delaware (State of or other jurisdiction of incorporation or organization) |
88-0409160 (I.R.S. Employer Identification No.) |
|
3240 S. Central Avenue Cicero, Illinois (Address of principal executive offices) |
60804 (Zip code) |
|
Registrant's telephone number, including area code: (708) 780-4800 |
||
Securities registered pursuant to Section 12(b) of the Exchange Act: None |
||
Securities registered pursuant to Section 12(g) of the Exchange Act: Common Stock, $0.001 par value |
||
Indicate by check mark whether the Registrant is a well-known seasoned issuer, as defined in Rule 405 of the Securities Act. Yes o No ý
Indicate by check mark if the Registrant is not required to file reports pursuant to Section 13 or 15(d) of the Exchange Act. Yes o No ý
Indicate by check mark whether the Registrant (1) has filed all reports required to be filed by Section 13 or 15(d) of the Exchange Act during the preceding 12 months (or for such shorter period that the Registrant was required to file such reports), and (2) has been subject to such filing requirements for the past 90 days. Yes ý No o
Indicate by check mark whether the Registrant has submitted electronically and posted on its corporate Web site, if any, every Interactive Data File required to be submitted and posted pursuant to Rule 405 of Regulation S-T (§232.405 of this chapter) during the preceding 12 months (or for such shorter period that the Registrant was required to submit and post such files). Yes ý No o
Indicate by check mark if disclosure of delinquent filers pursuant to Item 405 of Regulation S-K (§229.405) is not contained herein, and will not be contained, to the best of Registrant's knowledge, in definitive proxy or information statements incorporated by reference in Part III of this Form 10-K or any amendment to this Form 10-K. o
Indicate by check mark whether the Registrant is a large accelerated filer, an accelerated filer, a non-accelerated filer or a smaller reporting company. See the definitions of "large accelerated filer," "accelerated filer" and "smaller reporting company" in Rule 12b-2 of the Exchange Act.
| Large accelerated filer o | Accelerated filer ý | Non-accelerated filer o (Do not check if a smaller reporting company) |
Smaller reporting company o |
Indicate by check mark whether the Registrant is a shell company, as defined in Rule 12b-2 of the Exchange Act. Yes o No ý
As of June 30, 2014 the aggregate market value of the Registrant's voting common stock held by non-affiliates of the Registrant was approximately $85,457,000, based upon the $8.77 per share closing sale price of the Registrant's common stock as reported on the NASDAQ Capital Market. For purposes of this calculation, the Registrant's directors and executive officers and holders of 10% or more of the Registrant's outstanding shares of voting common stock have been assumed to be affiliates, with such affiliates holding an aggregate of 5,016,000 shares of the Registrant's voting common stock on June 30, 2014.
The number of shares of the Registrant's common stock, par value $0.001, outstanding as of February 19, 2015, was 14,844,554.
DOCUMENTS INCORPORATED BY REFERENCE
Portions of the Registrant's Proxy Statement for the Registrant's 2015 Annual Meeting of Stockholders are incorporated by reference in Part III of this Form 10-K.
BROADWIND ENERGY, INC.
FORM 10-K
Cautionary Note Regarding Forward-Looking Statements
This Annual Report on Form 10-K ("Annual Report") contains "forward-looking statements"—that is, statements related to future, not past, events—as defined in Section 21E of the Securities Exchange Act of 1934, as amended (the "Exchange Act"), that reflect our current expectations regarding our future growth, results of operations, financial condition, cash flows, performance, business prospects and opportunities, as well as assumptions made by, and information currently available to, our management. Forward-looking statements include any statement that does not directly relate to a current or historical fact. We have tried to identify forward-looking statements by using words such as "anticipate," "believe," "expect," "intend," "will," "should," "may," "plan" and similar expressions, but these words are not the exclusive means of identifying forward-looking statements. Our forward-looking statements may include or relate to the following: (i) our plans to continue to grow our business organically; (ii) our beliefs with respect to the sufficiency of our liquidity and our plans to evaluate alternate sources of funding if necessary; (iii) our plans and assumptions, including estimated costs and saving opportunities, regarding our restructuring efforts; (iv) our expectations relating to state, local and federal regulatory frameworks affecting the industries in which we compete, including the wind energy industry, and the related extension, continuation or renewal of federal tax incentives and grants and state renewable portfolio standards ("RPSs"); (v) our expectations with respect to our customer relationships and efforts to diversify our customer base and sector focus and leverage customer relationships across business units; (vi) our ability to realize revenue from customer orders and backlog; (vii) our ability to operate our business efficiently, manage capital expenditures and costs effectively, and generate cash flow; (viii) our beliefs and expectations relating to the economy and the potential impact it may have on our business, including our customers; (ix) our beliefs regarding the state of the wind energy market and other energy and industrial markets generally and the impact of competition and economic volatility in those markets; and (x) the potential loss of tax benefits if we experience an "ownership change" under Section 382 of the Internal Revenue Code of 1986, as amended (the "IRC"). These statements are based on information currently available to us and are subject to various risks, uncertainties and other factors, including, but not limited to, those discussed in Item 1A "Risk Factors" in Part I of this Annual Report, that could cause our actual growth, results of operations, financial condition, cash flows, performance, business prospects and opportunities to differ materially from those expressed in, or implied by, these statements. You should not consider any list of such factors to be an exhaustive statement of all of the risks, uncertainties or potentially inaccurate assumptions that could cause our current expectations or beliefs to change. Except as expressly required by the federal securities laws, we undertake no obligation to update such factors or to publicly announce the results of any of the forward-looking statements contained herein to reflect future events, developments or changed circumstances or for any other reason.
As used in this Annual Report, the terms "we," "us," "our," "Broadwind" and the "Company" refer to Broadwind Energy, Inc., a Delaware corporation headquartered in Cicero, Illinois, and its wholly-owned subsidiaries (the "Subsidiaries"). Dollars are presented in thousands unless otherwise stated.
Business Overview
Broadwind provides technologically advanced high-value products and services to energy, mining and infrastructure sector customers, primarily in the U.S. Our most significant presence is within the U.S. wind energy industry, although we have diversified into other industrial markets in order to improve our capacity utilization and reduce our exposure to uncertainty related to favorable governmental policies currently supporting the U.S. wind energy industry. Within the U.S. wind energy industry, we provide products and services to turbine manufacturers and wind farm developers and
1
operators. Outside of the wind energy market, we provide precision gearing, specialty weldments and services to a broad range of industrial customers for oil and gas, mining, steel and other industrial applications.
In 2014, 75% of our sales were linked to new wind energy installations, predominantly for towers used for new wind turbines. The market for new U.S. wind energy installations is affected by a number of factors, including: (i) economic growth and the associated demand for new electricity generation; (ii) the cost of competing energy sources, primarily natural gas; (iii) federal and state-level wind energy development incentives; (iv) available transmission infrastructure and the proliferation of smart grid technology; (v) improvements in wind energy cost competitiveness resulting from the maturation of technologies and services within the wind energy industry; and (vi) any state or federal government actions around regulating carbon emissions. The highest impact development incentive has been the federal Production Tax Credit (the "PTC") for new wind turbines placed into service. Legislation supporting this incentive has been intermittent, which has caused volatility in the demand for new wind energy projects. The long-term PTC which expired at the end of 2012 provided incentives for wind installations completed during a given year, and consequently there was a rush to complete projects and the industry achieved record new installations totaling 13,131 megawatts ("MW") in 2012. The PTC was reinstated at the beginning of 2013, but with incentives for projects started in 2013 and either completed by the end of 2015 or under continuous construction until completed. At the beginning of 2013, there was a lack of advanced stage projects in the development pipeline and the level of wind turbine installations completed in 2013 dropped sharply to 1,084 MW; however, 12,900 MW of projects were started in 2013. In 2014, the level of installations rose to 4,854 MW, and as of December 31, 2014 there were 12,700 MW of projects under construction across 98 projects in 23 states. In December 2014, the existing PTC was extended, but only through the end of 2014. Although this extension was supportive of the wind energy industry, the timing of the new law significantly limits its future practical impact beyond the near-term. We expect strong installations related to the PTC in 2015 and 2016.
The market for wind towers is broadly correlated to the demand for new wind turbines. However, demand for our products also reflects the level of competition in our respective markets, the strength of our customer relationships and the proximity of our plants to wind farm development sites, as well as other factors. During 2014 demand for our wind towers was strong because several domestic competitors exited the market in 2012, foreign competition from China and Vietnam was limited by U.S. Department of Commerce ("USDOC") antidumping and countervailing duty orders, and we have continued working with large customers representing a significant portion of the U.S. market.
Outside of the market for new wind energy installations, we serve a number of other industrial markets, including oil and gas, mining and steel production. We also provide gearing and services for the installed wind energy base. Although sales to these customers currently represent about 25% percent of our revenue, our strategic objective is to grow in these markets, with a medium-term target of deriving 50% of our revenue from outside of the more volatile wind energy market. Our products sold into these markets include gearboxes (both new and rebuilt), loose gearing and large industrial weldments. The following table details the percentage of our revenue generated in each sector for the past two years:
| |
Annual Revenue |
||||||
|---|---|---|---|---|---|---|---|
| |
2014 | 2013 | |||||
New Wind Installations |
75 | % | 69 | % | |||
Wind Installed Base Support |
8 | % | 11 | % | |||
Industrial Gearing & Weldments |
17 | % | 20 | % | |||
| | | | | | | | |
Total |
100 | % | 100 | % | |||
2
Segments
See Note 17, "Segment Reporting" in the notes to our consolidated financial statements for a discussion of our financial information related to geographic areas, revenues, operating income or loss and total assets by segment. Following is a description of products and services offered in each segment:
Towers and Weldments
Our Towers and Weldments segment specializes in the production of towers to support wind turbines, and the fabrication of large industrial weldments for oil and gas, mining and other industrial customers. Our production facilities, located in Manitowoc, Wisconsin and Abilene, Texas, are situated in close proximity to the primary U.S. domestic wind energy resources and equipment manufacturing hubs, and are also easily accessible to key oil and gas deposits and industrial equipment manufacturers.
Our towers are sold to wind turbine original equipment manufacturers ("OEMs") who utilize our products in the installation of wind turbines. We specialize in state-of-the-art wind towers that are increasingly taller, larger and more technically advanced, designed for large, utility-scale wind turbines, which generate multiple MW of electricity per hour. Our two manufacturing facilities have a combined annual tower production capacity of approximately 500 towers, sufficient to support turbines generating more than 1,000 MW of power.
Our industrial weldments product line applies our core competency in welding large structures to other industries, including the oil and gas, mining and heavy equipment industries. We fabricate these large industrial weldments in or near our tower manufacturing facilities in Manitowoc, Wisconsin and Abilene, Texas. These facilities have the scale, capacity, cranes and ancillary equipment needed to support integrated blasting, cutting, beveling, rolling and welding capabilities. In addition, the Abilene facility offers the industry large, modern blast and paint booths.
Due to the customized nature of our products, they are generally sold through our direct sales force following an evaluation, qualification and testing period, which may occur over several months. We compete based on product performance, quality, price, location and available capacity.
Gearing
We engineer, build and remanufacture precision gears and gearing systems for oil and gas, wind energy, mining, steel and other industrial applications. We use an integrated manufacturing process, generally starting with steel bars or forgings, which are then machined in our Cicero, Illinois facility. Most of the precision gears are heat-treated in our Neville Island, Pennsylvania facility and then returned to the Cicero facility for finishing and assembly.
For several years prior to 2010, we predominantly focused on manufacturing gearing for wind turbines. As production of gearing for wind turbines has increasingly moved outside of the U.S., our sales to this industry are now primarily for replacement gearing for the existing installed wind turbine fleet. Beginning in 2010, we increased our sales force and shifted our focus to the manufacture of custom-engineered gearing systems and gearboxes for oil and gas, mining and other industrial customers, which now comprises the majority of this segment's sales. Due to the highly specialized nature of our gearing, it is generally sold through our direct sales force and specialized sales agents following an evaluation, qualifying, and prototyping and testing period, which may occur over a period of several months. We compete based on product performance, quality, on-time delivery, price and lead time. We are monitoring the recent sharp decrease in the price of crude oil that began in the last quarter of 2014, and are anticipating a potential reduction in the rate of orders from some of our oil industry customers.
3
Services
We offer a comprehensive range of services primarily to wind farm developers and operators. We specialize in non-routine maintenance services for both kilowatt and megawatt class turbines. We also offer comprehensive field services to the wind energy industry. We are increasingly focusing our efforts on the identification and/or development of product and service offerings which will improve the reliability and efficiency of wind turbines, with primary focus on turbine drivetrains and blades. We provide wind services across the U.S., with primary dispatch locations in South Dakota and Texas. We operate drivetrain service centers in Abilene, Texas (the "Abilene Gearbox Facility") for multi-MW wind turbines and in Howard, South Dakota for both multi-MW wind turbines and kilowatt class turbines.
The market for wind turbine services is generally linked to the growing base of installed turbines. Our Services segment competes with a number of wind turbine manufacturers and independent service providers in a highly-fragmented but growing industry. Sales contacts are typically initiated through a small direct sales force and through operating managers located in our service locations. Sales are generally made under individual purchase orders, although we periodically enter into blanket purchase orders with key customers.
Business and Operating Strategy
We intend to capitalize on the markets in wind energy, oil and gas, mining and other industrial verticals in North America by leveraging our core competencies in large precision gearing and drivetrains, industrial welding and non-routine field service repairs. Our strategic objectives include the following:
- •
- Expand and diversify our customer
base. In 2014, due to growth in sales to two large tower customers, and weaker gearing and services markets, sales derived from our top
five customers represented 87% of total sales, up from 83% in 2013. To reduce the concentration of sales and reduce our wind energy industry concentration, we have expanded our market research
activities and our sales force in support of expanding and diversifying our customer base. We are positioned to expand industrial sales of both gearing and weldments and have expanded our
manufacturing of gearboxes for oil and gas, mining and steel customers. In our Services segment, we are focused on expansion of drivetrain and blade services with large wind farm owners and OEMs, and
on developing new value-added products for our customers.
- •
- Improve capacity utilization and
profitability. Tower and gear manufacturing and drivetrain remanufacturing all require significant capital investments. As a result of
significant capital expenditures made in 2008 and 2009, we have manufacturing capacity available that will potentially allow us to significantly increase our annual revenues. We are working to improve
our capacity utilization and financial results by using our existing manufacturing capacity to continue to penetrate the North American wind energy market, and further expand into other energy and
infrastructure sectors. In 2014, we took orders for wind towers that will consume substantially all of our available tower production capacity in 2015. In addition, we completed a multi-year
restructuring plan to reduce overhead and operating costs in all of our business segments and increase the overall efficiency of our operations while maintaining required manufacturing capacity.
- •
- Improve production technology and operational efficiency. We believe that the proper coordination and integration of the supply chain plus "Continuous Improvement" initiatives are key factors that enable high operating efficiencies, increased reliability, better delivery and lower costs. Our manufacturing facilities include state-of-the-art equipment and lean processes to help enhance our operational efficiency and flexibility. The ongoing operational improvements in our Abilene, Texas tower manufacturing facility should further enhance operating efficiency in this segment as
4
- •
- Leverage customer relationships across business units. We believe that there is a significant opportunity to support our wind energy and industrial customers by bundling our products and services into integrated solutions. We are translating our cross-business competencies in gearing, welding and services into solutions for customers in the wind energy, oil and gas and mining market verticals. In wind energy, we continue to leverage our deep precision gearing expertise and services capability in the remanufacturing of gearboxes both up-tower and in our drivetrain service centers.
compared to 2014. We have staffed our operations with Continuous Improvement experts in order to optimize our production processes to generate increased output, leverage our scale and lower our costs while maintaining product quality.
Restructuring Activities
During the third quarter of 2011, we conducted a review of our business strategies and product plans based on the outlook for the economy at large, the forecast for the industries we serve, and our business environment. We concluded that our manufacturing footprint and fixed cost base were too large and expensive for our medium-term needs and began restructuring our facility capacity and our management structure to consolidate and increase the efficiencies of our operations.
We have made substantial progress in executing a plan to reduce our facility footprint by approximately 40% through the sale and/or closure of facilities comprising a total of approximately 600,000 square feet. As part of this plan, in the third quarter of 2011, we determined that our idle Brandon, South Dakota tower manufacturing facility (the "Brandon Facility") should be sold, and as a result we reclassified the Brandon Facility property and equipment to Assets Held for Sale and the related indebtedness to Liabilities Held for Sale. In April 2013, we completed the sale of the Brandon Facility, generating a gain on sale of $3,585 and approximately $8,000 in net proceeds after closing costs and the repayment of the mortgage on the Brandon Facility. Including the sale of the Brandon Facility, we have closed or reduced our leased presence at six facilities and achieved a reduction of approximately 400,000 square feet. During 2013, we determined that our idle Clintonville, Wisconsin facility (the "Clintonville Facility") was no longer required in our operations and reclassified the property and equipment associated with the Clintonville Facility, as well as certain Gearing equipment, to Assets Held for Sale. The most significant remaining reduction relates to the anticipated closure and disposition of one of our gearing facilities located in Cicero, Illinois (the "Cicero Avenue Facility"). The use of the Cicero Avenue Facility in our production was significantly curtailed at the end of 2013, and we recorded a related $1,732 impairment, primarily in cost of sales in the fourth quarter of 2013. We believe our remaining locations will be sufficient to support our Towers and Weldments, Gearing, Services and general corporate and administrative activities, while allowing for growth for the next several years.
In the third quarter of 2012, we identified a liability associated with the planned sale of the Cicero Avenue Facility. The liability is associated with environmental remediation costs that were originally identified while preparing the site for sale. The liability has been adjusted as needed since being originally identified and the expenses associated with this liability have been recorded as restructuring charges. As of December 31, 2014, the accrual balance remaining was $513.
We have completed our restructuring effort with approximately $13,700 of restructuring costs incurred. Our restructuring charges have generally included costs to close or exit facilities, costs to move equipment, the related costs of building infrastructure for moved equipment and employee related costs. Of the total restructuring costs incurred, a total of approximately $4,800 consists of non-cash charges. Restructuring costs incurred to date include $900 of severance and $1,750 of accelerated depreciation of the Cicero Avenue Facility.
5
COMPANY HISTORY
We were incorporated in 1996 in Nevada as Blackfoot Enterprises, Inc., and through a series of subsequent transactions, became Broadwind Energy, Inc., a Delaware corporation, in 2008. Through several acquisitions in 2007 and 2008, we focused on expanding upon our core platform as a wind tower component manufacturer and established our gearing systems, industrial products, technical services, precision repair and engineering and our previously held logistics businesses. Beginning in 2011, we made a strategic decision to diversify our business into other industrial markets in order to improve our capacity utilization and reduce our exposure to uncertainty related to favorable governmental policies currently supporting the U.S. wind energy industry. In connection with that decision and our review of our business strategies and product plans based on the outlook for the economy at large, the forecast for the industries we serve, and our business environment, we divested our logistics business and began restructuring our facility capacity and our management structure to consolidate and increase the efficiencies of our operations.
SALES AND MARKETING
We market our towers, gearing and industrial weldments products and our maintenance services primarily through our direct sales force (supplemented with independent sales agents in our Gearing segment). Our sales and marketing strategy is to develop and maintain long-term relationships with our energy and infrastructure sector customers and to offer an integrated suite of products and services to them. We believe this strategy best leverages our gearbox and blade knowledge and our core competency in specialty welding. We believe this strategy also offers opportunities to cross-sell products and services across our platform of product and service offerings. We also intend for our offerings to fulfill needs that our customers may consider non-core and do not desire to provide for within their own organizations. Within the wind energy industry, our customer base consists of wind turbine manufacturers who supply end-users and wind farm developers with completed wind turbines, as well as wind farm developers and wind farm operators themselves. Within the oil and gas and mining industries, our customer base consists of manufacturers of hydraulic fracturing and mud pumps, mining equipment and off-highway vehicles. To support the efforts of our sales force, we utilize a number of marketing tactics to build our brand and position and promote our products and services. Our efforts include participation in industry conferences, media relations, use of social media channels, use of our website and other channels to connect with customers.
COMPETITION
We do not believe that any competitors have developed a suite of products and services for the North American wind energy industry directly comparable to those offered by our businesses. However, each of our businesses, when considered individually, faces competition from both domestic and international companies, and some of our customers maintain internal service capabilities that compete with our service offerings. Many of these competitors are larger and better capitalized than we are.
For our Towers and Weldments segment, the largest North American based competitor is Trinity Industries. Other competitors include Vestas Wind Systems, which has periodically produced towers for third party customers in addition to meeting its own captive tower requirements, and Marmen Industries, a Canadian manufacturer that has recently expanded into the U.S. market. A number of tower producers, including DMI Industries, Katana Summit, Ameron International and SIAG, exited the market in 2012 and have not returned. We also face competition from imported towers, predominantly from Asian manufacturers. However, imports from China and Vietnam have substantially ceased following a determination by the U.S. International Trade Commission that wind towers from those countries were being sold in the U.S. at less than fair value. As a result of the determination, the USDOC issued antidumping and countervailing duty orders on imports of wind towers from China and an antidumping duty order on imports of towers from Vietnam.
6
The market for blade repair, drivetrain and field services in which our Services segment competes is highly fragmented, and includes OEMs such as General Electric and Siemens, large-scale service providers such as enXco, and a number of independent service providers including Moventas, Gearbox Express, IPS and UpWind Solutions.
In our Gearing segment, which is focused on oil and gas, mining and steel markets, our key competitors include Overton Chicago Gear, Cincinnati Gearing Systems, Merit Gear, Milwaukee Gear and Horsburgh & Scott. In addition, we also compete with the internal gear manufacturing capacity of relevant equipment manufacturers and face growing competition from foreign competitors. We also manufacture wind energy gear sets, but do not manufacture complete gearboxes for this industry.
ENVIRONMENTAL REGULATION AND COMPLIANCE
Our operations are subject to numerous federal, state and local environmental laws and regulations. Although it is our objective to maintain compliance with these laws and regulations, it may not be possible to quantify with certainty the potential impact of actions regarding environmental matters, particularly remediation and other compliance efforts that we may undertake in the future. Several of our facilities have a history of industrial operations and contaminants have been detected at some of our facilities. Refer to Item 3 "Legal Proceedings" for further discussion of environmental regulation and compliance.
BACKLOG
We sell our towers under either supply agreements or individual purchase orders, depending on the size and duration of the purchase commitment. Under the supply agreements, we typically receive a purchase commitment for towers to be delivered in future fiscal quarters, then receive purchase orders on a periodic basis based upon the customer's forecast of production volume requirements within the contract terms. For our Services and Gearing segments, purchases are generally based on individual purchase orders. As of December 31, 2014, the dollar amount of our backlog believed to be firm under our supply agreements, purchase orders awarded and service contracts was approximately $202 million. This represents a 35% decrease from the backlog at December 31, 2013, primarily due to increased demand, which was unusually high as a result of the structure of the PTC extension in January 2013 and the reduction in the number of tower manufacturers in late 2012.
SEASONALITY
The majority of our business is not affected by seasonality. Within our Services segment, revenues can be negatively affected by weather related constraints, typically during portions of the first and fourth quarters of the year.
EMPLOYEES
We had 857 employees at December 31, 2014, of which 723 were in manufacturing, service and field support related functions and 134 were in administrative functions. Approximately 15% of our employees were covered by collective bargaining agreements with local unions in our Cicero, Illinois and Neville Island, Pennsylvania locations at December 31, 2014. The current collective bargaining agreement with the Cicero union is expected to remain in effect through February 2018. The current collective bargaining agreement with the Neville Island union is expected to remain in effect through October 2017. We believe that our relationship with our employees is generally good.
RAW MATERIALS
The primary raw material used in the construction of wind towers and gearing products is steel in the form of plate, bar stock, forgings or castings. Although we are generally responsible for
7
procurement of the raw materials, in some cases our customers have sourced and retained title to steel plate which we convert into finished wind towers.
We operate a multiple supplier sourcing strategy and source our raw materials through various suppliers located throughout the U.S. and abroad. We generally do not have long-term supply agreements with our raw materials suppliers and closely match terms with those of our customers to limit our exposure to commodity price fluctuations. We believe that we will be able to obtain an adequate supply of steel and other raw materials to meet our manufacturing requirements, although, from time to time we have faced shortages of specific grades of steel. Such shortages may limit our ability to meet customer demand and cause manufacturing inefficiencies.
QUALITY CONTROL
We have a long-standing focus on processes for ensuring the manufacture of high-quality products. To achieve high standards of production and operational quality, we implement strict and extensive quality control and inspection throughout our production processes. We maintain internal quality controls over all core manufacturing processes and carry out quality assurance inspections at the completion of each major manufacturing step to ensure the quality of our products. The manufacturing process at our Gearing operation, for example, involves transforming forged steel into precision gears through gear cutting, heat treating, testing and finishing. We inspect and test raw materials before they enter the assembly process, re-test the raw materials after rough machining, test the functioning of gear teeth and cores after thermal treatment and accuracy test final outputs for compliance with product specifications. We believe our investment in industry-leading heat treatment, high precision machining, specialized grinding technologies and cutting-edge welding has contributed to our high product reliability and the consistent performance of our products under varying operating conditions. Our Gearing segment is ISO 9001:2008 certified. Our tower manufacturing plants in Manitowoc, Wisconsin and Abilene, Texas are ISO 9001:2010 certified. In addition, our Services segment has received ISO 9001:2008 certification related to the remanufacture of gearboxes, main shafts and other drive system components. In the second half of 2014, we learned of deficiencies in our quality process in the Abilene, Texas tower plant. We are in the process of rectifying those deficiencies. See "Item 7. Management's Discussion and Analysis of Financial Condition and Results of Operations" for further discussion of the effects of the deficiencies.
CUSTOMERS
We manufacture products for and provide services to a variety of customers in the wind energy, oil and gas, mining and other infrastructure industries. The majority of our wind energy industry customer base consists of wind turbine manufacturers who supply wind farm operators and wind farm developers with completed wind turbines. In the other industrial sectors, we sell our products through our trained sales force or through manufacturers' representatives to a wide variety of customers. The wind turbine market is very concentrated. According to American Wind Energy Association 2014 industry data, the top three wind turbine manufacturers constituted approximately 98% of the U.S. market. As a result, our concentration with a limited number of customers has accounted for the majority of our revenues. Sales to each of Siemens and General Electric represented an amount greater than 10% of our consolidated revenues for the years ended December 31, 2014 and 2013. The loss of one of these customers could have a material adverse effect on our business. As discussed as a component of our business strategies, we are seeking to diversify our customer base.
WORKING CAPITAL
Our primary customers are wind turbine manufacturers, wind farm developers and wind farm operators. The industry has historically entered into customized contracts with varying terms and conditions between suppliers and customers, depending on the specific objectives of each party. Our
8
practices mirror this historical industry practice of negotiating agreements on a case-by-case basis. As a result, working capital needs, including levels of accounts receivable ("A/R"), customer deposits and inventory, can vary significantly from quarter to quarter based on the contractual terms associated with each quarter's sales, such as whether and when we are required to purchase and supply steel pursuant to such contractual terms.
In analyzing our liquidity, we focus on operating working capital, which is comprised of A/R and inventories, net of accounts payable ("A/P") and customer deposits. Our operating working capital at December 31, 2014 was $13,853 or 6% of trailing three months of sales annualized. This is an increase of $8,505 from December 31, 2013, when operating working capital was $5,348, or 2% of trailing three months of sales annualized. The increase reflects reduced levels of accounts payable due in part to a shift in steel suppliers.
CORPORATE INFORMATION
Our principal executive office is located at 3240 South Central Avenue, Cicero, IL 60804. Our phone number is (708) 780-4800 and our website address is www.bwen.com.
OTHER INFORMATION
On our website at www.bwen.com, we make available under the "Investors" menu selection, free of charge, our Annual Reports on Form 10-K, Quarterly Reports on Form 10-Q, Current Reports on Form 8-K, and amendments to these reports filed or furnished pursuant to Section 13(a) or 15(d) of the Exchange Act as soon as reasonably practicable after such reports or amendments are electronically filed with, or furnished to, the SEC. Materials that we file or furnish to the SEC may also be read and copied at the SEC's Public Reference Room at 100 F Street, N.E., Washington, DC 20549. Information on the operation of the Public Reference Room may be obtained by calling the SEC at 1-800-SEC-0330. Also, the SEC maintains an Internet site at www.sec.gov that contains reports, proxy and information statements, and other information that we file electronically with the SEC.
The U.S. wind energy industry is significantly impacted by tax and other economic incentives and political and governmental policies. A significant change in these incentives and policies could significantly impact our results of operations and growth. More generally, our financial and operating performance is subject to certain factors which are out of our control, including the state of the wind energy market in North America.
We supply products and services to wind turbine manufacturers and owners and operators of wind energy generation facilities. The U.S. wind energy industry is significantly impacted by federal tax incentives and state RPSs. Despite recent reductions in the cost of wind turbines, wind energy may not be economically viable in many parts of the country absent such incentives.
These programs have provided material incentives to develop wind energy generation facilities and thereby impact the demand for our products and services. The increased demand for our products and services that generally results from the credits and incentives could be impacted by the expiration of these programs. Because of the long lead times necessary to develop wind energy projects, any failure by Congress to extend or renew these incentives could negatively impact potential wind energy installations and would likely inhibit the development of wind energy generation facilities and the demand for wind turbines, towers, gearing and related components in many areas of the U.S.
One such federal government program, the PTC, previously provided economic incentives to the owners of wind energy facilities in the form of an investment tax credit ("ITC"), as well as cash grants equal in value to the ITC. The PTC was extended by the American Recovery and Reinvestment Act in February 2009, and further extended by the American Taxpayer Relief Act in January 2013, which
9
provided the owner of a qualifying wind energy facility under construction before the end of 2013 that met certain completion conditions with a ten-year tax credit against the owner's federal income tax obligations based on the amount of electricity generated by the qualifying wind energy facility and sold to unrelated third parties. The PTC was further extended through the end of 2014 by the passage of the EXPIRE Act of 2014. Thus, any project developer that expends at least 5% of the total cost of the project by the end of 2014 and commissions the project by 2016 will be eligible for PTCs for ten years. Additionally, if construction of a project is commenced by the end of 2014 and the project developer can demonstrate continuous construction, they too may be eligible for PTCs for a ten-year period.
State RPSs generally require or encourage state-regulated electric utilities to supply a certain proportion of electricity from renewable energy sources or devote a certain portion of their plant capacity to renewable energy generation. Typically, utilities comply with such standards by qualifying for renewable energy credits evidencing the share of electricity that was produced from renewable sources. Under many state standards, these renewable energy credits can be unbundled from their associated energy and traded in a market system, allowing generators with insufficient credits to meet their applicable state mandate. These standards have spurred significant growth in the wind energy industry and a corresponding increase in the demand for our products and services. Currently, the majority of states and the District of Columbia have RPSs in place and certain states have voluntary utility commitments to supply a specific percentage of their electricity from renewable sources. The enactment of RPSs in additional states or any changes to existing RPSs (including changes due to the failure to extend or renew the federal incentives described above), or the enactment of a federal RPS or imposition of other greenhouse gas regulations, may impact the demand for our products and services. We cannot assure that government support for renewable energy will continue. The elimination of, or reduction in, state or federal government policies that support renewable energy could have a material adverse impact on our business, results of operations, financial performance and future development efforts.
As a supplier of products and services to wind turbine manufacturers and owners and operators of wind energy generation facilities, our results of operations (like those of our customers) are subject to general economic conditions, and specifically to the state of the wind energy market. In addition to the state and federal government policies supporting renewable energy described above, the growth and development of the larger wind energy market in North America is subject to a number of factors, including, among other things:
- •
- the availability and cost of financing for the estimated pipeline of wind development projects;
- •
- the cost of electricity, which may be affected by a number of factors, including government regulation, power transmission,
seasonality, fluctuations in demand, and the cost and availability of fuel and particularly natural gas;
- •
- the general demand for electricity or "load growth";
- •
- the development of new power generating technology or advances in existing technology or discovery of power generating natural
resources;
- •
- the development of electrical transmission infrastructure;
- •
- state and federal laws and regulations regarding avian protection plans and noise or turbine setback requirements;
- •
- state and federal laws and regulations, particularly those favoring low carbon energy generation alternatives;
- •
- administrative and legal challenges to proposed wind development projects;
10
- •
- the improvement in efficiency and cost of wind energy, as influenced by advances in turbine design and operating efficiencies; and
- •
- public perception and localized community responses to wind energy projects.
In addition, while some of the factors listed above may only affect individual wind project developments or portions of the market, in the aggregate they may have a significant effect on the successful development of the wind energy market as a whole, and thus affect our operating and financial results.
We are substantially dependent on a few significant customers.
Historically, the majority of our revenues are highly concentrated with a limited number of customers. In 2014, two customers—Siemens and General Electric—each accounted for more than 10% of our consolidated revenues, and our five largest customers accounted for 87% of our consolidated revenues. Our customers periodically have expressed their intent to scale back, delay or restructure existing customer agreements, which has led to reduced revenues from these customers. It is possible that this may occur again in the future. As a result, our operating profits and gross margins have historically been negatively affected by significant variability in production levels, which has created production volume inefficiencies in our operations and cost structures.
Additionally, if our relationships with significant customers should change materially, it could be difficult for us to immediately and profitably replace lost sales in a market with such concentration, which could have a material adverse effect on our operating and financial results. We could be adversely impacted by decreased customer demand for our products and services due to (1) the impact of current or future economic conditions on our customers, (2) our customers' loss of market share to their competitors that do not use our products and services, and (3) our loss of market share with our customers. We could lose market share with our customers to our competitors or to our customers themselves, should they decide to become more vertically integrated and produce our products or internally deliver the services that we currently provide.
In addition, even if our customers continue to do business with us, we could be adversely affected by a number of other potential developments with our customers. For example:
- •
- Our customers may not comply with their contractual payment or volume obligations. The inability or failure of our customers to meet
their contractual obligations could have a material adverse effect on our business, financial position and results of operations;
- •
- Certain customer contracts provide the customer with the opportunity to cancel a substantial portion of its volume obligation by
providing us with notice of such election prior to commencement of production. Such contracts generally require the customer to pay a sliding cancelation fee based on how far in advance of
commencement of production such notice is provided;
- •
- If we are unable to deliver products to our customers in accordance with an agreed upon schedule we may become subject to liquidated
damages provisions in certain supply agreements for the period of time we are unable to deliver finished products. Although the liquidated damages provisions are generally capped at certain levels,
they can become significant and may have a negative impact on our profit margins and financial results. We paid $1,200 of related damages in the fourth quarter of 2014.
- •
- Although the Subsidiaries operate independently, a dispute between a significant customer and us or one of the Subsidiaries could have a negative effect on the business relationship we have with that customer across our entire organization. Among other things, such a dispute could lead to an overall decrease in such customer's demand for our products and services or difficulty in collecting amounts due to one or more of the Subsidiaries that are otherwise not related to such dispute; and
11
- •
- A material change in payment terms with a significant customer could have a material adverse effect on our short-term cash flows.
We have generated net losses since our inception.
We have experienced operating losses for each of the years during which we have operated, and losses may occur in the foreseeable future. We have incurred significant costs in connection with the development of our businesses, and there is no assurance that we will generate sufficient revenues to offset anticipated operating costs. Although we anticipate deriving revenues from the sale of our products and services, no assurance can be given that these products and services can be sold on a profitable basis. If we achieve profitability, we cannot give any assurance that we would be able to sustain or increase profitability on a quarterly or annual basis in the future.
Disruptions in the supply of parts and raw materials, or changes in supplier relations, may negatively impact our operating results.
We are dependent upon the supply of certain raw materials used in our production process, and these raw materials are exposed to price fluctuations on the open market. Raw material costs for materials such as steel, our primary raw material, have fluctuated significantly and may continue to fluctuate. To reduce price risk caused by market fluctuations, we have generally matched raw material purchases to our sales contracts or incorporated price adjustment clauses in our contracts. However, limitations on availability of raw materials or increases in the cost of raw materials (including steel), energy, transportation and other necessary services may impact our operating results if our manufacturing businesses are not able to fully pass on the costs associated with such increases to their respective customers. Alternatively, we will not realize material improvements from declines in steel prices as the terms of our contracts generally require that we pass these cost savings through to our customers. In addition, we may encounter supplier constraints, be unable to maintain favorable supplier arrangements and relations or be affected by disruptions in the supply chain caused by such events as natural disasters, shipping delays, power outages and labor strikes. Additionally, our supply chain has become more global in nature and, thus, more complex from a shipping and logistics perspective. In the event of significant increases or decreases in the price of raw materials, particularly steel, our margins and profitability could be negatively impacted.
Our diversification outside of the wind energy market exposes us to business risks associated with the oil and gas and mining industries, among others, which may slow our growth or penetration in these markets.
Although we have some experience in the oil and gas and mining markets through our gearing and specialty weldments businesses, these markets have not been our primary focus. In further diversifying our business to serve these markets, we will face competitors who may have more resources, longer operating histories and more well-established relationships than we do, and we may not be able to successfully or profitably generate additional business opportunities in these industries. Moreover, if we are able to successfully diversify into these markets our business may be exposed to risks associated with these industries, which could adversely affect our future earnings and growth. These risks include, among other things:
- •
- the prices and relative demand for oil, gas, minerals and other commodities;
- •
- domestic and global political and economic conditions affecting the oil, gas and mining industries;
- •
- changes in oil, gas and mining technology;
- •
- the price and availability of alternative fuels and energy sources, as well as changes in energy consumption or supply; and
12
- •
- federal, state and local regulations, including, among others, regulations relating to hydraulic fracturing and greenhouse gas emissions.
Our customers may be significantly affected by disruptions and volatility in the economy and in the wind energy market.
Market disruptions and regular market volatility, including the recent material decline in oil prices, may adversely impact our customers' ability to pay amounts due to us and could cause related increases in our working capital or borrowing needs. In addition, our customers have in the past attempted and may attempt in the future to renegotiate the terms of contracts or reduce the size of orders with us as a result of disruptions and volatility in the markets. We cannot predict with certainty the amount of our backlog that we will ultimately ship to our customers.
Market disruptions and regular market volatility may also result in an increased likelihood of our customers asserting warranty or remediation claims in connection with our products or services that they would not ordinarily assert in a more stable economic environment. In the event of such a claim, we may incur costs if we decide to compensate the affected customer or to engage in litigation against the affected customer regarding the claim. We maintain product liability insurance, but there can be no guarantee that such insurance will be available or adequate to protect against such claims. A successful claim against us could have a material adverse effect on our business.
We may have difficulty obtaining additional financing when needed or on acceptable terms, and there can be no assurances that our operations will generate cash flows in an amount sufficient to enable us to pay our indebtedness.
We rely on banks and capital markets as a source of liquidity for capital requirements not satisfied by cash flows from operations or asset sales. We have experienced operating losses for each of the years during which we have operated, and our committed sources of liquidity may be inadequate to satisfy our operational needs. There can be no assurances that our recent restructuring efforts will be successful in improving our profitability. If we are not able to access capital at competitive rates, the ability to implement our business plans may be adversely affected. In the absence of access to capital resources, we could face substantial liquidity problems and might be required to dispose of material assets or operations at times when the prices for such assets or operations are depressed. In such event, we may not be able to consummate those dispositions. Furthermore, the proceeds of any such dispositions may not be adequate to meet our debt service obligations when due.
Additionally, our ability to make scheduled payments on our existing or future debt obligations and fund operations will depend on our future financial and operating performance. There can be no assurances that our operations will generate sufficient cash flows to enable us to pay our remaining indebtedness or to fund our other liquidity needs. If we cannot make scheduled payments on our debt, we will be in default and, as a result, among other things, our debt holders could declare all outstanding principal and interest to be due and payable which could force us to liquidate certain assets or alter our business operations or debt obligations. In addition, raising capital in the equity capital markets could result in limitations on our ability to use our net operating loss carryforwards.
Our plans for growth and diversification may not be successful, and could result in poor financial performance.
We have made a strategic decision to diversify our business further into oil and gas, mining and other industries, particularly within our gearing and specialty weldments businesses. While we have historically participated in these lines of business, there is no assurance that we will be able to grow our presence in these markets at a rate sufficient to compensate for a potentially weaker wind energy market. Moreover, our participation in these markets may require additional investments in personnel,
13
equipment and operational infrastructure. If we are unable to further penetrate these markets, our plans to diversify our operations may not be successful and our anticipated future growth may be adversely affected.
We may also grow our existing business through increased production levels at existing facilities. Such growth will require coordinated efforts across the Company and continued enhancements to our current operating infrastructure, including management and operations personnel, systems, equipment and property. Moreover, if our efforts do not adequately predict the demand of our customers and our potential customers, our future earnings may be adversely affected.
We face competition from industry participants who may have greater resources than we do.
Our businesses are subject to risks associated with competition from new or existing industry participants who may have more resources and better access to capital. Many of our competitors and potential competitors may have substantially greater financial, customer support, technical and marketing resources, larger customer bases, longer operating histories, greater name recognition and more established relationships in the industry than we do. Among other things, these industry participants compete with us based upon price, quality, location and available capacity. We cannot be sure that we will have the resources or expertise to compete successfully in the future. Some of our competitors may also be able to provide customers with additional benefits at lower overall costs to increase market share. We cannot be sure that we will be able to match cost reductions by our competitors or that we will be able to succeed in the face of current or future competition. In addition, we may face competition from our customers as they seek to be more vertically integrated and offer full service packages.
If our projections regarding the future market demand for our products and services are inaccurate, our operating results and our overall business may be adversely affected.
We have previously made significant capital investments in anticipation of rapid growth in the U.S. wind energy market. However, the growth in the U.S. wind energy market has not kept pace with the expectations we had when some of these capital investments were made, and there can be no assurance that the U.S. wind energy market will grow and develop in a manner consistent with our expectations, or that we will be able to fill our idle capacity through the further diversification of our operations. Our internal manufacturing and service capabilities have required significant up-front fixed costs. If market demand for our products and services does not increase at the pace we have anticipated and align with our manufacturing capacity, we may be unable to offset these costs and to achieve economies of scale, and our operating results may continue to be adversely affected as a result of high fixed costs, reduced margins and underutilization of capacity. In light of these considerations, we may be forced to temporarily idle existing capacity or sell to third parties manufacturing capacity that we cannot utilize in the near term, in addition to the steps that we have already taken to adjust our capacity more closely to demand. Alternatively, if we experience rapid demand for our products and services in excess of our estimates, or we reduce our manufacturing capacity, our installed capital equipment and existing workforce may be insufficient to support higher production volumes, which could adversely affect our customer relationships and overall reputation. In addition, we may not be able to expand our workforce and operations in a timely manner, procure adequate resources or locate suitable third-party suppliers to respond effectively to changes in demand for our existing products and services or to the demand for new products and services requested by our customers, and our business could be adversely affected. Our ability to meet such excess customer demand could also depend on our ability to raise additional capital and effectively scale our manufacturing operations.
14
We rely on unionized labor, the loss of which could adversely affect our future success.
We are dependent on the services of unionized labor and have collective bargaining agreements with certain of our operations workforce at our Cicero, Illinois and Neville Island, Pennsylvania Gearing facilities. The loss of the services of these and other personnel, whether through terminations, attrition, labor strike or otherwise, or a material change in our collective bargaining agreements, could have a material adverse impact on us and our future profitability. Collective bargaining agreements have been ratified by the collective bargaining units in place at our Cicero and Neville Island facilities and are expected to expire in February 2018 and October 2017, respectively. As of December 31, 2014, our collective bargaining units represented approximately 15% of our workforce.
We may need to hire additional qualified personnel, including management personnel, and the loss of our key personnel could adversely affect our business.
Our future success will depend largely on the skills, efforts and motivation of our executive officers and other key personnel. Our success also depends, in large part, upon our ability to attract and retain highly qualified management and key personnel throughout our organization. We face competition in the attraction and retention of personnel who possess the skill sets we seek. In addition, key personnel may leave us and subsequently compete against us. The loss of the services of any of our key personnel, or our failure to attract and retain other qualified and experienced personnel on acceptable terms, could have a material adverse effect on our business, results of operations or financial condition.
Our ability to comply with regulatory requirements is critical to our future success, and our current level of controls cannot guarantee that we are in compliance with all such requirements.
As a manufacturer and distributor of wind and other energy industry products we are subject to the requirements of federal, state and local or foreign regulatory authorities. In addition, we are subject to a number of industry standard-setting authorities, such as the American Gear Manufacturers Association and the American Welding Society. Changes in the standards and requirements imposed by such authorities could have a material adverse effect on us. In the event we are unable to meet any such standards when adopted, our business could be adversely affected. We may not be able to obtain all regulatory approvals, licenses and permits that may be required in the future, or any necessary modifications to existing regulatory approvals, licenses and permits, or maintain all required regulatory approvals, licenses and permits. There can be no guarantee that our businesses are in full compliance with such standards and requirements. We continue to develop our internal controls with a goal of providing a greater degree of certainty that our businesses are in compliance with applicable governmental and regulatory requirements, but our current level of internal control may fail to reveal to us material instances of non-compliance with such requirements, and such non-compliance could have a material adverse effect on our business.
Current or future litigation and regulatory actions could have a material adverse impact on us.
From time to time, we are subject to litigation and other legal and regulatory proceedings relating to our business. No assurances can be given that the results of these matters will be favorable to us. An adverse resolution of lawsuits, investigations or arbitrations could have a material adverse effect on our business, financial condition and results of operations. Defending ourselves in these matters may be time-consuming, expensive and disruptive to normal business operations and may result in significant expense and a diversion of management's time and attention from the operation of our business, which could impede our ability to achieve our business objectives. Additionally, any amount that we may be required to pay to satisfy a judgment or settlement may not be covered by insurance. Under our charter and the indemnification agreements that we have entered into with our officers, directors and certain third parties, we are required to indemnify and advance expenses to them in connection with
15
their participation in certain proceedings. There can be no assurance that any of these payments will not be material.
We could incur substantial costs to comply with environmental, health and safety laws and regulations and to address violations of or liabilities under these requirements.
Our operations are subject to a variety of environmental, health and safety laws and regulations in the jurisdictions in which we operate and sell products governing, among other things, health, safety, pollution and protection of the environment and natural resources, including the use, handling, transportation and disposal of non-hazardous and hazardous materials and wastes, as well as emissions and discharges into the environment, including discharges to air, surface water, groundwater and soil, product content, performance and packaging. We cannot guarantee that we have been or will at all times be in compliance with such laws and regulations. Changes in existing environmental, health and safety laws and regulations, or their application, could cause us to incur additional or unexpected costs to achieve or maintain compliance. Failure to comply with these laws and regulations, obtain the necessary permits to operate our business, or comply with the terms and conditions of such permits may subject us to a variety of administrative, civil and criminal enforcement measures, including the imposition of civil and criminal sanctions, monetary fines and penalties, remedial obligations, and the issuance of compliance requirements limiting or preventing some or all of our operations. The assertion of claims relating to regulatory compliance, on or off-site contamination, natural resource damage, the discovery of previously unknown environmental liabilities, the imposition of criminal or civil fines or penalties and/or other sanctions, or the obligation to undertake investigation, remediation or monitoring activities could result in potentially significant costs and expenditures to address contamination or resolve claims or liabilities. Such costs and expenditures could have a material adverse effect on our business, financial condition or results of operations. Under certain circumstances, violation of such environmental laws and regulations could result in us being disqualified from eligibility to receive federal government contracts or subcontracts under the federal government's debarment and suspension system.
We also are subject to laws and regulations that impose liability and cleanup responsibility for releases of hazardous substances into the environment. Under certain of these laws and regulations, such liabilities can be imposed for cleanup of currently and formerly owned, leased or operated properties, or properties to which hazardous substances or wastes were sent by current or former operators at our current or former facilities, regardless of whether we directly caused the contamination or violated any law at the time of discharge or disposal. Several of our facilities have a history of industrial operations, and contaminants have been detected at some of our facilities. The presence of contamination from hazardous substances or wastes could interfere with ongoing operations or adversely affect our ability to sell, lease or use our properties as collateral for financing. We also could be held liable under third-party claims for property damage, natural resource damage or personal injury and for penalties and other damages under such environmental laws and regulations, which could have a material adverse effect on our business, financial condition and results of operations.
Limitations on our ability to utilize our net operating losses ("NOLs") may negatively affect our financial results.
We may not be able to utilize all of our NOLs. To the extent available, we will use any NOL carryforwards to reduce the U.S. corporate income tax liability associated with our operations. However, if we do not achieve profitability prior to their expiration, we will not be able to fully utilize our NOLs to offset income. For financial statement presentation, all benefits associated with the NOL carryforwards have been reserved; therefore, this potential asset is not reflected on our balance sheet. Section 382 of the IRC generally imposes an annual limitation on the amount of NOL carryforwards that may be used to offset taxable income when a corporation has undergone certain changes in stock
16
ownership. Our ability to utilize NOL carryforwards and built-in losses may be limited, under this section or otherwise, by our issuance of common stock or by other changes in stock ownership. Upon completion of our analysis of IRC Section 382, we have determined that aggregate changes in our stock ownership have triggered an annual limitation of NOL carryforwards and built-in losses available for utilization. Although this event limits the amount of pre-ownership change date NOLs and built-in losses we can utilize annually, it would not preclude us from fully utilizing our current NOL carryforwards prior to their expiration. To the extent our use of NOL carryforwards and associated built-in losses is significantly limited in the future due to additional changes in stock ownership, our income could be subject to U.S. corporate income tax earlier than it would if we were able to use NOL carryforwards and built-in losses without such annual limitation, which could result in lower profits and the loss of benefits from these attributes. To address these concerns, in February 2013 our Board of Directors (the "Board") approved the adoption of a Section 382 rights plan designed to preserve our NOL carryforwards and other tax benefits. Our stockholders subsequently ratified the Section 382 rights plan at our 2013 Annual Meeting of Stockholders. There can be no assurances that the Section 382 rights plan will be effective in protecting our NOL carryforwards.
If our estimates for warranty expenses differ materially from actual claims made, or if we are unable to reasonably estimate future warranty expense for our products and services, our business and financial results could be adversely affected.
We provide warranty terms generally ranging between one and five years to our towers, gearing and services customers depending upon the specific product or service and terms of the customer agreement. We reserve for warranty claims based on industry experience and estimates made by management based upon a percentage of our sales revenues related to such products or services. From time to time, customers have submitted warranty claims to us. However, we have a limited history on which to base our warranty estimates for certain products that we manufacture and services that we provide. Our assumptions could materially differ from the actual performance of our products in the future and could exceed the levels against which we have reserved. In some instances our customers have interpreted the scope and coverage of certain of our warranty provisions differently from our interpretation of such provisions. The expenses associated with remediation activities in the wind energy industry can be substantial, and if we are required to pay such costs in connection with a customer's warranty claim we could be subject to additional unplanned cash expenditures. If our estimates prove materially incorrect, or if we are required to cover remediation expenses in addition to our regular warranty coverage, we could be required to incur additional expenses and could face a material unplanned cash expenditure, which could adversely affect our business, financial condition and results of operations.
We may be unable to keep pace with rapidly changing technology in wind turbine and other industrial component manufacturing.
The global market for wind turbines, as well as for other industrial components we manufacture, is rapidly evolving technologically. Our component manufacturing equipment and technology may not be suited for future generations of products being developed by wind turbine companies. For example, some wind turbine manufacturers are using wind turbine towers made from concrete instead of steel. Other wind turbine designs have reduced the use of gearing or eliminated the gearbox entirely through the use of direct or compact drive technologies. To maintain a successful business in our field, we must keep pace with technological developments and changing standards of our customers and potential customers and meet their constantly evolving demands. If we fail to adequately respond to the technological changes in our industry, or are not suited to provide components for new types of wind turbines, our business, financial condition and operating results may be adversely affected.
ITEM 1B. UNRESOLVED STAFF COMMENTS
None.
17
Our corporate headquarters is located in Cicero, Illinois, a suburb located west of Chicago, Illinois. In addition, the Subsidiaries own or lease operating facilities, which are presented by operating segment as follows:
Operating Segment and Facility Type
|
Location | Owned / Leased |
Approximate Square Footage |
|||||
|---|---|---|---|---|---|---|---|---|
Towers and Weldments |
||||||||
Tower Manufacturing |
Manitowoc, WI | Leased | 206,000 | |||||
Tower Manufacturing |
Abilene, TX | Owned | 146,000 | |||||
Weldments |
Manitowoc, WI | Leased | 45,000 | |||||
Weldments |
Clintonville, WI(1) | Owned | 63,000 | |||||
Gearing and Corporate |
|
|
||||||
Gearing System Manufacturing—Machining |
Cicero, IL(2) | Owned | 149,000 | |||||
Gearing System Manufacturing—Machining and Corporate Administration |
Cicero, IL | Leased | 301,000 | |||||
Gearing System Manufacturing—Heat Treatment & Gearbox Repair |
Neville Island, PA | Owned | 70,000 | |||||
Services |
|
|
||||||
Service and Maintenance |
Abilene, TX | Leased | 80,000 | |||||
Service and Maintenance |
Howard, SD | Owned | 25,000 | |||||
- (1)
- The
Clintonville Facility is listed as Assets Held For Sale as of December 31, 2014 in conjunction with management's determination that the property
is no longer required in our operations.
- (2)
- The use of the Cicero Avenue Facility in our production was significantly curtailed at the end of 2013 and we recorded a related $1,732 impairment in the fourth quarter of 2013.
We consider our facilities to be in good condition and adequate for our present and future needs.
Shareholder Lawsuits
Between February 15, 2011 and March 30, 2011, three putative shareholder derivative lawsuits were filed in the United States District Court for the Northern District of Illinois (the "USDC") against certain of the our current and former officers and directors, and certain Tontine entities, seeking to challenge alleged breaches of fiduciary duty, waste of corporate assets and unjust enrichment, including in connection with the January 2010 secondary public offering of our common stock (the "2010 Stock Offering"). One of the lawsuits also alleged that certain directors violated Section 14(a) of the Exchange Act in connection with the Proxy Statement for our 2010 Annual Meeting of Stockholders. Two of the matters pending in the USDC were subsequently consolidated, and on May 15, 2012, the USDC granted the defendants' motion to dismiss the consolidated cases and also entered an order dismissing the third case. On January 17, 2014, we and the plaintiffs from the consolidated derivative lawsuit filed a joint motion to reopen the derivative action and preliminarily approve a derivative settlement. The USDC subsequently reopened the derivative action and granted preliminary approval of the settlement on February 3, 2014. The settlement resolved outstanding shareholder derivative claims, including those raised in certain shareholder demand letters received by the Board. The terms of the settlement included the adoption by us of certain corporate governance reforms, along with other remedial measures. The settlement provided for our insurance carrier and/or us to pay plaintiffs' counsel's attorneys' fees and expenses in the amount of $600. The USDC granted final approval of the settlement on April 3, 2014.
18
SEC Inquiry
In August 2011, we received a subpoena from the SEC seeking documents related to certain accounting practices at Brad Foote Gear Works, Inc. ("Brad Foote"). The subpoena was issued following an informal inquiry that we received from the SEC in November 2010, which likely arose out of a whistleblower complaint that the SEC received related to revenue recognition, cost accounting and intangible and fixed asset valuations at Brad Foote. We produced documents responsive to the SEC's subpoena. Following the issuance of subpoenas for testimony, the SEC deposed certain of our current and former employees.
On May 8, 2014, we, our Chief Financial Officer ("CFO") and a former Chief Executive Officer and director (the "Former CEO") received "Wells notices" (the "Notices") from the SEC's Division of Enforcement in connection with its ongoing investigation of us. A Wells notice is not a formal allegation or a finding of wrongdoing, but is a preliminary determination by the SEC Enforcement Staff (the "Staff") that the Staff may recommend to the SEC that a civil enforcement action or administrative proceeding be brought against the recipient. The Notices indicated that the Staff had made a preliminary determination to recommend that the SEC file an enforcement action alleging violations of the Securities Act of 1933, as amended (the "Securities Act"), the Exchange Act, the Sarbanes-Oxley Act and certain SEC rules. The Notices to the CFO and the Former CEO related only to an intangible valuation issue relating to events in 2009 and the 2010 Stock Offering, and the Notice to us related to that intangible valuation issue and certain revenue recognition issues relating to events in 2009. Under SEC procedures, a recipient of a Wells notice has an opportunity to respond in the form of a Wells submission that seeks to persuade the SEC that such an action should not be brought. On June 16, 2014, we submitted to the Staff a Wells submission to explain our views concerning such matters.
On February 5, 2015, the SEC announced a settlement with us, our CFO and the Former CEO in connection with the SEC investigation. Consistent with standard SEC practice, we have neither admitted nor denied the SEC's allegations. Under the terms of the settlement, we consented to the entry of a judgment requiring us to pay a civil penalty of $1,000. In addition, (i) our CFO agreed to pay disgorgement and prejudgment interest of $23 (which was reimbursed by us) and a penalty of $50, and (ii) the Former CEO agreed to pay disgorgement and prejudgment interest of $543 (which was reimbursed by us) and a penalty of $75. We cooperated with the SEC over the course of its investigation, and we conducted our own comprehensive review, together with our Board's Audit Committee, in conjunction with the investigation. The USDC granted final approval of the settlement on February 11, 2015.
Environmental Matters
On February 15, 2011, pursuant to a search warrant, officials from the United States Environmental Protection Agency ("USEPA") entered and conducted a search of the Cicero Avenue Facility in connection with the alleged improper disposal of industrial wastewater to the sewer. Also on or about February 15, 2011, in connection with the same matter, we received a grand jury subpoena requesting testimony and the production of certain documents relating to the Cicero Avenue Facility's past compliance with certain environmental laws and regulations relating to the generation, discharge and disposal of wastewater from certain of its processes between 2004 and the present. On or about February 23, 2011, we received another grand jury subpoena relating to the same investigation, requesting testimony and the production of certain other documents relating to certain of the Cicero Avenue Facility's employees, environmental and manufacturing processes, and disposal practices. On April 5, 2012, we received a letter from the United States Attorney's Office, Northern District of Illinois ("USAO") requesting the production of certain financial records from 2008 to the present. We subsequently completed our response to the subpoenas and to the USAO's request and also voluntarily instituted corrective measures at the Cicero Avenue Facility, including changes to its wastewater
19
disposal practices. On September 24, 2013, the USAO commenced a criminal action in the USDC based on this investigation. Subsequently, Brad Foote entered into a plea agreement with the USAO (the "Plea Agreement") with regard to this criminal action, pursuant to which Brad Foote agreed to plead guilty to one count of knowingly violating the Clean Water Act, Title 33, United States Code, Section 1319(c)(2)(A) and pay a $1,500 fine (payable in three installments of $500 within three years of the date of sentencing), subject to the USDC's approval of the Plea Agreement. Brad Foote pled guilty pursuant to the Plea Agreement on November 13, 2013, and the USDC approved the Plea Agreement on February 19, 2014. By correspondence dated April 17, 2014, the USEPA advised that, due to the admitted violation of the Clean Water Act by Brad Foote, the Cicero Avenue Facility was statutorily debarred from receiving federal contracts or benefits if any of the work will be performed at the place where the offense occurred. Subsequently, by correspondence dated November 7, 2014, the USEPA advised that the statutory debarment had been terminated as a result of the corrective actions undertaken by Brad Foote.
Other
We are also a party to additional claims and legal proceedings arising in the ordinary course of business. Due to the inherent uncertainty of litigation, there can be no assurance that the resolution of any particular claim or proceeding would not have a material adverse effect on our results of operations, financial position or liquidity. It is possible that if one or more of the matters described above were decided against us, the effects could be material to our results of operations in the period in which we would be required to record or adjust the related liability and could also be material to our cash flows in the period in which we would be required to pay such liability.
ITEM 4. MINE SAFETY DISCLOSURES
Not Applicable
20
ITEM 5. MARKET FOR REGISTRANT'S COMMON EQUITY, RELATED STOCKHOLDER MATTERS AND ISSUER PURCHASES OF EQUITY SECURITIES
Our common stock is traded on the NASDAQ Capital Market ("NASDAQ") under the symbol "BWEN." The following table sets forth the high and low bid prices of our common stock traded on the NASDAQ.
| |
Common Stock | ||||||
|---|---|---|---|---|---|---|---|
| |
High | Low | |||||
2014 |
|||||||
First quarter |
$ | 12.22 | $ | 8.15 | |||
Second quarter |
13.49 | 8.77 | |||||
Third quarter |
9.45 | 7.49 | |||||
Fourth quarter |
8.13 | 5.33 | |||||
| |
Common Stock | ||||||
|---|---|---|---|---|---|---|---|
| |
High | Low | |||||
2013 |
|||||||
First quarter |
$ | 6.00 | $ | 2.24 | |||
Second quarter |
5.05 | 3.95 | |||||
Third quarter |
8.23 | 4.50 | |||||
Fourth quarter |
10.43 | 5.10 | |||||
The closing price for our common stock as of February 19, 2015 was $5.45. As of February 19, 2015, there were 38 holders of record of our common stock.
Dividends
We have never paid cash dividends on our common stock and have no current plan to do so in the foreseeable future. The declaration and payment of dividends on our common stock are subject to the discretion of our Board and are further limited by our credit agreements and other contractual agreements we may have in place from time to time. The decision of our Board to pay future dividends will depend on general business conditions, the effect of a dividend payment on our financial condition, and other factors our Board may consider relevant. The current policy of our Board is to reinvest cash generated in our operations to promote future growth and to fund potential investments.
Performance Graph
The following graph compares the cumulative five-year shareholder returns for our common stock as compared with the S&P 500 and the First Trust ISE Global Wind Energy Index Fund for the period
21
from December 31, 2009 to December 31, 2014. The graph assumes an investment of $100 as of December 31, 2009 and that dividends were reinvested.
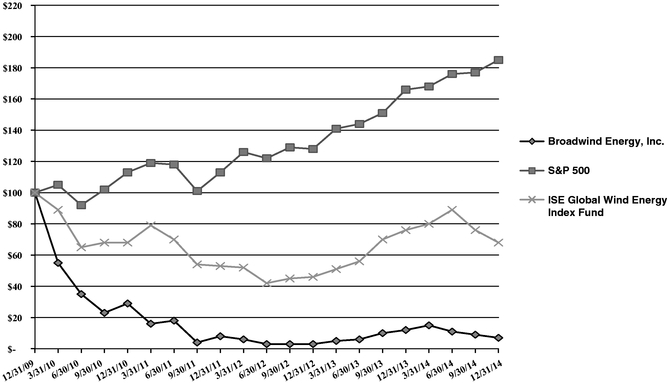
Repurchases
On October 29, 2014, our Board authorized a program to repurchase up to $10,000 of our outstanding common stock over the following six month period. Our share repurchase program does not obligate us to acquire any specific number of shares. The common stock may be acquired in the open market at prices subject to certain pricing guidelines determined us. We have no obligation to repurchase shares, and we may discontinue purchases at any time that we determine additional purchases are not warranted.
The following table provides information about our purchases of equity securities that are registered by us pursuant to Section 12 of the Exchange Act during the quarter ended December 31, 2014:
Period
|
Total Number of Shares Purchased |
Weighted Average Price Paid per Share |
Total Number of Shares Purchased as Part of Publicly Announced Plan |
Approximate Dollar Value of Shares that May Yet Be Purchased Under the Plan |
|||||||||
|---|---|---|---|---|---|---|---|---|---|---|---|---|---|
October 1, 2014 - October 31, 2014 |
20,000 | $ | 6.53 | 20,000 | $ | 9,869 | |||||||
November 1, 2014 - November 30, 2014 |
253,937 | 6.74 | 253,937 | 8,158 | |||||||||
December 1, 2014 - December 31, 2014 |
— | — | — | 8,158 | |||||||||
| | | | | | | | | | | | | | |
|
273,937 | 6.73 | 273,937 | ||||||||||
Unregistered Sales of Equity Securities
There were no unregistered sales of equity securities for the years ended December 31, 2014, 2013 or 2012.
22
Securities Authorized for Issuance Under Equity Compensation Plans
See Part III, Item 12 "Security Ownership of Certain Beneficial Owners and Management and Related Stockholder Matters" of this Annual Report for information as of December 31, 2014 with respect to shares of our common stock that may be issued under our existing share-based compensation plans.
ITEM 6. SELECTED FINANCIAL DATA
The following selected historical consolidated financial and other data are qualified in their entirety by reference to, and should be read in conjunction with, our consolidated financial statements and the related notes thereto appearing elsewhere herein and Part II, Item 7 "Management's Discussion and Analysis of Financial Condition and Results of Operations." Our selected statement of continuing operations data set forth below for each of the years ended December 31, 2014, 2013, 2012, 2011 and 2010, and the balance sheet data as of December 31, 2014, 2013, 2012, 2011 and 2010, are derived from our consolidated financial statements.
(In thousands, except per share data)
| |
For the Year Ended December 31, | |||||||||||||||
|---|---|---|---|---|---|---|---|---|---|---|---|---|---|---|---|---|
| |
2014 | 2013 | 2012 | 2011 | 2010 | |||||||||||
Selected Statement of Operations Data |
||||||||||||||||
Revenues |
$ | 241,268 | $ | 215,710 | $ | 210,707 | $ | 185,854 | $ | 136,896 | ||||||
Gross profit |
17,490 | 12,345 | 6,836 | 7,187 | 1,946 | |||||||||||
Gross profit percentage |
7.2 | % | 5.7 | % | 3.2 | % | 3.9 | % | 1.4 | % | ||||||
Intangible asset and goodwill impairment charges |
$ | — | $ | — | $ | — | $ | — | $ | 40,777 | ||||||
Intangible amortization |
444 | 1,552 | 1,759 | 859 | 2,992 | |||||||||||
Operating loss |
(5,934 | ) | (13,210 | ) | (17,297 | ) | (20,429 | ) | (69,227 | ) | ||||||
Loss from continuing operations |
(6,168 | ) | (10,389 | ) | (17,907 | ) | (20,742 | ) | (69,753 | ) | ||||||
Net loss per share—basic and diluted: |
||||||||||||||||
Loss from continuing operations |
(0.42 | ) | (0.72 | ) | (1.27 | ) | (1.79 | ) | (6.56 | ) | ||||||
Cash dividends per common share |
— |
— |
— |
— |
— |
|||||||||||
| |
As of December 31, | |||||||||||||||
|---|---|---|---|---|---|---|---|---|---|---|---|---|---|---|---|---|
| |
2014 | 2013 | 2012 | 2011 | 2010 | |||||||||||
Selected Balance Sheet Data |
||||||||||||||||
Assets: |
||||||||||||||||
Property and equipment, net |
$ | 62,952 | $ | 69,077 | $ | 79,889 | $ | 87,766 | $ | 106,317 | ||||||
Total assets |
146,617 | 163,694 | 142,910 | 172,891 | 183,506 | |||||||||||
Liabilities: |
||||||||||||||||
Total long-term debt, net of current maturities |
2,650 | 2,755 | 2,956 | 4,797 | 9,671 | |||||||||||
Total stockholders' equity |
88,380 | 95,330 | 103,308 | 117,859 | 126,196 | |||||||||||
23
| |
For the Year Ended December 31, | |||||||||||||||
|---|---|---|---|---|---|---|---|---|---|---|---|---|---|---|---|---|
| |
2014 | 2013 | 2012 | 2011 | 2010 | |||||||||||
Selected Other Data—Non GAAP Financial Measures |
||||||||||||||||
Adjusted EBITDA(1) |
$ | 8,877 | $ | 10,346 | $ | 5,511 | $ | (2,129 | ) | $ | (9,210 | ) | ||||
Adjusted EBITDA margin percentage(2) |
3.7 | % | 4.8 | % | 2.6 | % | –1.1 | % | –6.7 | % | ||||||
- (1)
- For
any period, earnings from continuing operations before interest, taxes, depreciation, amortization, restructuring and share-based payments ("Adjusted
EBITDA") are calculated as presented below. We believe that Adjusted EBITDA is particularly meaningful due principally to the role acquisitions have played in our development and the significant
non-recurring restructuring program. Historically, our growth through acquisitions has resulted in significant non-cash depreciation and amortization expense because a significant portion of the
purchase price of our acquired businesses was generally allocated to depreciable fixed assets and long-lived assets, which primarily consist of goodwill and amortizable intangible assets. Please note
that Adjusted EBITDA should not be considered an alternative to, nor is there any implication that Adjusted EBITDA is more meaningful than, any measure of performance or liquidity promulgated under
accounting principles generally accepted in the U.S. ("GAAP").
- (2)
- Adjusted EBITDA margin percentage is equal to Adjusted EBITDA divided by total revenue.
| |
For the Year Ended December 31, | ||||||||||||||||
|---|---|---|---|---|---|---|---|---|---|---|---|---|---|---|---|---|---|
| |
2014 | 2013 | 2012 | 2011 | 2010 | ||||||||||||
Operating loss |
$ | (5,934 | ) | $ | (13,210 | ) | $ | (17,297 | ) | $ | (20,429 | ) | $ | (69,227 | ) | ||
Depreciation and amortization |
12,183 | 13,962 | 15,678 | 14,534 | 16,463 | ||||||||||||
Restructuring |
1,514 | 6,075 | 2,354 | 572 | — | ||||||||||||
Other income |
226 | 1,000 | 1,271 | 1,169 | 486 | ||||||||||||
Intangible asset and goodwill impairment charges |
— | — | — | — | 40,777 | ||||||||||||
Share-based compensation and other stock payments |
888 | 2,519 | 3,505 | 2,025 | 2,291 | ||||||||||||
| | | | | | | | | | | | | | | | | | |
Adjusted EBITDA |
$ | 8,877 | $ | 10,346 | $ | 5,511 | $ | (2,129 | ) | $ | (9,210 | ) | |||||
| | | | | | | | | | | | | | | | | | |
| | | | | | | | | | | | | | | | | | |
| | | | | | | | | | | | | | | | | | |
24
ITEM 7. MANAGEMENT'S DISCUSSION AND ANALYSIS OF FINANCIAL CONDITION AND RESULTS OF OPERATIONS
As used in this Annual Report, the terms "we," "us," "our," "Broadwind," and the "Company" refer to Broadwind Energy, Inc. and its wholly-owned Subsidiaries.
(Dollar amounts are presented in thousands, except per share data and unless otherwise stated)
We recognized sales of $241,300 in 2014, a 12% increase compared to $215,700 in 2013. The increase reflects growth in our Towers and Weldments segment revenues, partially offset by small declines in our Gearing and Services segment revenues. We reported a net loss of $6,200 or $.42 per share in 2014, compared to a net loss of $10,500 or $.73 per share in 2013. The $.31 per share improvement was due to improvements in the Gearing and Services segments' results, partially offset by a decrease in the Towers and Weldments segment's results. The 2013 year results include restructuring charges of $6,100 and a regulatory settlement charge of $1,500 associated with the USEPA inquiry, partially offset by a $3,600 gain on the sale of the Brandon Facility; the 2014 year results include restructuring charges of $1,500, and a regulatory settlement charge of $1,600 associated with the SEC inquiry.
We booked $135,100 in net new orders in 2014, down from $404,400 in 2013. Towers and Weldments orders vary considerably from year to year and have been significantly impacted by government policies and shifts in supplier capacity; orders for this segment totaled $77,600 in 2014 as compared to $361,500 in 2013. 2014 Services orders totaled $15,700, up significantly from the prior-year's orders of $8,500. Gearing orders totaled $42,900, up from $36,400 in 2013. At December 31, 2014, total backlog was $202,400.
In 2011, we concluded that our manufacturing footprint and fixed cost base were too large and expensive for our medium term needs. We executed a plan to reduce our facility footprint by approximately 40% through the sale and/or closure of facilities comprising a total of approximately 600,000 square feet. Of the $13,700 total restructuring costs incurred, approximately $4,800 are non-cash charges.
We meet our short-term liquidity needs through our available cash balances and the use of a $20,000 secured credit facility with AloStar Bank of Commerce ("AloStar"), which was established on August 23, 2012 (the "Credit Facility"). We intend to negotiate a new facility in anticipation of the expiration of the Credit Facility on August 23, 2015. During 2014, the Credit Facility was used from time to time, although the operating cash generated by the business was generally sufficient to allow us to meet all cash obligations. At December 31, 2014, cash, cash equivalents and short-term investments totaled $20,300 and we had the ability to borrow up to $14,450 under the Credit Facility. There were no Credit Facility borrowings outstanding as of December 31, 2014.
25
RESULTS OF OPERATIONS
Year Ended December 31, 2014 Compared to Year Ended December 31, 2013
The summary of selected financial data table below should be referenced in connection with a review of the following discussion of our results of operations for the year ended December 31, 2014 compared to the year ended December 31, 2013.
| |
For the Year Ended December 31, | |
|
||||||||||||||||
|---|---|---|---|---|---|---|---|---|---|---|---|---|---|---|---|---|---|---|---|
| |
2014 vs. 2013 | ||||||||||||||||||
| |
|
% of Total Revenue |
|
% of Total Revenue |
|||||||||||||||
| |
2014 | 2013 | $ Change | % Change | |||||||||||||||
Revenues |
$ | 241,268 | 100.0 | % | $ | 215,710 | 100.0 | % | $ | 25,558 | 11.8 | % | |||||||
Cost of sales |
222,497 | 92.2 | % | 198,379 | 92.0 | % | 24,118 | 12.2 | % | ||||||||||
Restructuring costs |
1,281 | 0.5 | % | 4,986 | 2.3 | % | (3,705 | ) | (74.3 | )% | |||||||||
| | | | | | | | | | | | | | | | | | | | |
Gross profit |
17,490 | 7.2 | % | 12,345 | 5.7 | % | 5,145 | 41.7 | % | ||||||||||
Operating expenses |
|||||||||||||||||||
Selling, general and administrative expenses |
21,181 | 8.8 | % | 21,414 | 9.9 | % | (233 | ) | (1.1 | )% | |||||||||
Intangible amortization |
444 | 0.2 | % | 1,552 | 0.7 | % | (1,108 | ) | (71.4 | )% | |||||||||
Regulatory settlement |
1,566 | 0.6 | % | 1,500 | 0.7 | % | 66 | N/A | |||||||||||
Restructuring costs |
233 | 0.1 | % | 1,089 | 0.5 | % | (856 | ) | (78.6 | )% | |||||||||
| | | | | | | | | | | | | | | | | | | | |
Total operating expenses |
23,424 | 9.7 | % | 25,555 | 11.8 | % | (2,131 | ) | (8.3 | )% | |||||||||
| | | | | | | | | | | | | | | | | | | | |
Operating loss |
(5,934 | ) | (2.5 | )% | (13,210 | ) | (6.1 | )% | 7,276 | 55.1 | % | ||||||||
Other income (expense) |
|||||||||||||||||||
Interest expense, net |
(728 | ) | (0.3 | )% | (985 | ) | (0.5 | )% | 257 | 26.1 | % | ||||||||
Other, net |
226 | 0.1 | % | 1,000 | 0.5 | % | (774 | ) | (77.4 | )% | |||||||||
Gain (loss) on sale of assets and restructuring |
36 | 0.0 | % | 2,878 | 1.3 | % | (2,842 | ) | 98.7 | % | |||||||||
| | | | | | | | | | | | | | | | | | | | |
Total other (expense) income, net |
(466 | ) | (0.2 | )% | 2,893 | 1.3 | % | (3,359 | ) | 116.1 | % | ||||||||
| | | | | | | | | | | | | | | | | | | | |
Net loss from continuing operations before provision for income taxes |
(6,400 | ) | (2.7 | )% | (10,317 | ) | (4.8 | )% | 3,917 | 38.0 | % | ||||||||
Provision for income taxes |
(232 | ) | (0.1 | )% | 72 | 0.0 | % | (304 | ) | (422.2 | )% | ||||||||
| | | | | | | | | | | | | | | | | | | | |
Loss from continuing operations |
(6,168 | ) | (2.6 | )% | (10,389 | ) | (4.8 | )% | 4,221 | 40.6 | % | ||||||||
Loss from discontinued operations, net of tax |
— | 0.0 | % | (110 | ) | (0.1 | )% | 110 | N/A | ||||||||||
| | | | | | | | | | | | | | | | | | | | |
Net loss |
$ | (6,168 | ) | (2.6 | )% | $ | (10,499 | ) | (4.9 | )% | $ | 4,331 | 41.3 | % | |||||
| | | | | | | | | | | | | | | | | | | | |
| | | | | | | | | | | | | | | | | | | | |
| | | | | | | | | | | | | | | | | | | | |
Consolidated
Revenues increased by $25,558, from $215,710 for the year ended December 31, 2013, to $241,268 for the year ended December 31, 2014. We experienced a significant increase in Towers and Weldments revenue, partially offset by small decreases in Gearing and Services revenue. Towers and Weldments segment revenues increased 16% due to increased customer demand. Tower units sold increased by 11% in 2014 and average selling price rose as we produced larger towers for more powerful turbines. Weldments revenue for large industrial customers decreased $3,291 as compared to the prior year due to weakness in the mining industry. Despite higher orders, Gearing revenue decreased 2% due to production delays as we completed our plant consolidation and inventory reduction Continuous Improvement projects. Services revenue decreased 10% due to the absence of a large industrial project that was completed in early 2013, partially offset by growth in blades revenue in 2014.
26
Gross profit increased by $5,145, from $12,345 for the year ended December 31, 2013, to $17,490 for the year ended December 31, 2014. The increase in gross profit was primarily attributable to $3,706 in lower restructuring charges and $634 in lower plant depreciation charges. Improved contribution margins on increased sales volume were largely offset by higher costs of production due to inefficiencies in our Abilene, Texas tower facility, as well as higher customer accommodation charges and warranty costs. As a result, our gross margin increased from 5.7% for the year ended December 31, 2013, to 7.3% for the year ended December 31, 2014.
Selling, general and administrative ("SG&A") expenses decreased by $233, from $21,414 for the year ended December 31, 2013, to $21,181 for the year ended December 31, 2014. The small decrease was attributable to lower legal expenses, offset by higher professional services fees. SG&A expenses as a percentage of sales decreased from 9.9% in the prior year to 8.8% in the current year, reflecting volume leverage.
Intangible amortization expense decreased from $1,552 for the year ended December 31, 2013, to $444 for the year ended December 31, 2014 due to the previous year's acceleration of amortization related to a portion of our customer relationship intangible asset that became fully amortized during the second quarter of 2013. We also recorded a $1,566 regulatory settlement charge related to settlement of the SEC inquiry in 2014, as compared to a $1,500 regulatory settlement charge associated with settlement of the USEPA inquiry in 2013. See Item 3 Legal Proceedings.
Net loss improved from $10,499 for the year ended December 31, 2013, to $6,168 for the year ended December 31, 2014, as a result of the factors described above.
Towers and Weldments Segment
The following table summarizes the Towers and Weldments segment operating results for the years ended December 31, 2014 and 2013:
| |
Twelve Months Ended December 31, |
||||||
|---|---|---|---|---|---|---|---|
| |
2014 | 2013 | |||||
Orders |
$ | 77,557 | $ | 361,451 | |||
Revenues |
184,904 | 159,478 | |||||
Operating income |
18,065 | 19,550 | |||||
Operating margin |
9.8 | % | 12.3 | % | |||
Towers and Weldments segment revenues increased by $25,426, from $159,478 for the year ended December 31, 2013, to $184,904 for the year ended December 31, 2014. Towers revenues increased $28,717 as we increased our plant capacity utilization in response to strong customer demand, but weldments revenues decreased $3,291. Towers and Weldments segment revenues increased 16%, while towers units sold increased by 11% in 2014 and average selling price rose as we produced larger towers for more powerful turbines. Towers revenue was reduced by $1,596 in 2014 due to customer accommodation charges.
Towers and Weldments segment operating income decreased by $1,485, from $19,550 for the year ended December 31, 2013, to $18,065 for the year ended December 31, 2014. The decrease in operating income resulted from production inefficiencies and increased professional fees, largely offset by increased contribution margin from higher revenues. We experienced costs related to production inefficiencies in our Abilene, Texas facility, as we added additional shifts to increase production and as we introduced a new tower design. Production issues in this facility were the primary cause of $4,087 in increased indirect labor and overhead costs including increased maintenance expenses; we also experienced an increase in customer accommodation charges of $1,596 and warranty of $395 as compared to the prior year. Early in 2014, we experienced $681 in one-time professional expenses
27
related to resolution of the previously disclosed 2013 accounting and internal control matter. Operating margin decreased from 12.3% during the year ended December 31, 2013, to 9.8% during the year ended December 31, 2014.
Gearing Segment
The following table summarizes the Gearing segment operating results for the years ended December 31, 2014 and 2013:
| |
Twelve Months Ended December 31, |
||||||
|---|---|---|---|---|---|---|---|
| |
2014 | 2013 | |||||
Orders including those from intercompany |
$ | 42,910 | $ | 36,359 | |||
Revenues |
42,253 | 43,150 | |||||
Operating loss |
(9,423 | ) | (17,916 | ) | |||
Operating margin |
(22.3 | )% | (41.5 | )% | |||
Gearing segment revenues decreased by $897, from $43,150 for the year ended December 31, 2013, to $42,253 for the year ended December 31, 2014. The 2% decrease in total revenues was due to production delays attributable to our plant consolidation and inventory reduction projects, and the transition to increased volumes of complex gearbox production. Sales decreases to wind, mining and other industrial customers were largely offset by a $10,409 increase in sales to oil & gas customers in 2014 as compared to 2013.
Gearing segment operating loss improved by $8,493, from $17,916 for the year ended December 31, 2013, to $9,423 for the year ended December 31, 2014. The decrease in operating loss was due to $3,737 lower restructuring expenses, $1,825 lower non-cash charges, $716 in increased contribution margin on improved sales mix, $621 lower indirect labor costs, and the absence of the $1,500 environmental regulatory settlement charge recorded in 2013. As a result of the factors described above, operating margin improved from (41.5%) for the year ended December 31, 2013, to (22.3%) for the year ended December 31, 2014.
Services Segment
The following table summarizes the Services segment operating results for the years ended December 31, 2014 and 2013:
| |
Twelve Months Ended December 31, |
||||||
|---|---|---|---|---|---|---|---|
| |
2014 | 2013 | |||||
Orders |
$ | 15,680 | $ | 8,511 | |||
Revenues |
15,560 | 17,243 | |||||
Operating loss |
(4,493 | ) | (4,721 | ) | |||
Operating margin |
(28.9 | )% | (27.4 | )% | |||
Services segment revenues decreased by $1,683, from $17,243 for the year ended December 31, 2013, to $15,560 for the year ended December 31, 2014. The 10% decrease in revenue was due to the absence of a large industrial project that was completed in early 2013, partially offset by stronger demand for turbine blade repairs in 2014.
Services segment operating loss improved by $228, from $4,721 for the year ended December 31, 2013, to $4,493 for the year ended December 31, 2014. The improvement reflects lower revenues offset by improved contribution margins, and lower restructuring expenses. Operating margins deteriorated slightly on lower sales from (27.4%) for the year ended December 31, 2013, to (28.9%) for the year ended December 31, 2014.
28
Corporate and Other
Corporate and Other expenses decreased by $40, from $10,123 for the year ended December 31, 2013, to $10,083 for the year ended December 31, 2014. The decrease in expense was attributable to lower legal, restructuring, and employee and other expenses, offset by a $1,566 provision to settle the SEC inquiry in 2014 as compared to 2013.
Year Ended December 31, 2013 Compared to Year Ended December 31, 2012
The summary of selected financial data table below should be referenced in connection with a review of the following discussion of our results of operations for the year ended December 31, 2013 compared to the year ended December 31, 2012.
| |
For the Year Ended December 31, | |
|
||||||||||||||||
|---|---|---|---|---|---|---|---|---|---|---|---|---|---|---|---|---|---|---|---|
| |
2013 vs. 2012 | ||||||||||||||||||
| |
|
% of Total Revenue |
|
% of Total Revenue |
|||||||||||||||
| |
2013 | 2012 | $ Change | % Change | |||||||||||||||
Revenues |
$ | 215,710 | 100.0 | % | $ | 210,707 | 100.0 | % | $ | 5,003 | 2.4 | % | |||||||
Cost of sales |
198,379 | 92.0 | % | 202,257 | 96.0 | % | (3,878 | ) | (1.9 | )% | |||||||||
Restructuring costs |
4,986 | 2.3 | % | 1,614 | 0.8 | % | 3,372 | 208.9 | % | ||||||||||
| | | | | | | | | | | | | | | | | | | | |
Gross profit |
12,345 | 5.7 | % | 6,836 | 3.2 | % | 5,509 | 80.6 | % | ||||||||||
Operating expenses |
|||||||||||||||||||
Selling, general and administrative expenses |
21,414 | 9.9 | % | 21,634 | 10.3 | % | (220 | ) | (1.0 | )% | |||||||||
Intangible amortization |
1,552 | 0.7 | % | 1,759 | 0.8 | % | (207 | ) | (11.8 | )% | |||||||||
Regulatory settlement |
1,500 | 0.7 | % | — | 0.0 | % | 1,500 | N/A | |||||||||||
Restructuring costs |
1,089 | 0.5 | % | 740 | 0.4 | % | 349 | 47.2 | % | ||||||||||
| | | | | | | | | | | | | | | | | | | | |
Total operating expenses |
25,555 | 11.8 | % | 24,133 | 11.5 | % | 1,422 | 5.9 | % | ||||||||||
| | | | | | | | | | | | | | | | | | | | |
Operating loss |
(13,210 | ) | (6.1 | )% | (17,297 | ) | (8.3 | )% | 4,087 | 23.6 | % | ||||||||
Other (expense) income |
|||||||||||||||||||
Interest expense, net |
(985 | ) | (0.5 | )% | (1,711 | ) | (0.8 | )% | 726 | 42.4 | % | ||||||||
Other, net |
1,000 | 0.5 | % | 1,271 | 0.6 | % | (271 | ) | (21.3 | )% | |||||||||
Gain (loss) on sale of assets and restructuring |
2,878 | 1.3 | % | (144 | ) | 0.0 | % | 3,022 | 2098.6 | % | |||||||||
| | | | | | | | | | | | | | | | | | | | |
Total other (expense) income, net |
2,893 | 1.3 | % | (584 | ) | (0.2 | )% | 3,477 | 595.4 | % | |||||||||
| | | | | | | | | | | | | | | | | | | | |
Net loss from continuing operations before provision for income taxes |
(10,317 | ) | (4.8 | )% | (17,881 | ) | (8.5 | )% | 7,564 | 42.3 | % | ||||||||
Provision for income taxes |
72 | 0.0 | % | 26 | 0.0 | % | 46 | 176.9 | % | ||||||||||
| | | | | | | | | | | | | | | | | | | | |
Loss from continuing operations |
(10,389 | ) | (4.8 | )% | (17,907 | ) | (8.5 | )% | 7,518 | 42.0 | % | ||||||||
Loss from discontinued operations, net of tax |
(110 | ) | (0.1 | )% | — | 0.0 | % | (110 | ) | N/A | |||||||||
| | | | | | | | | | | | | | | | | | | | |
Net loss |
$ | (10,499 | ) | (4.9 | )% | $ | (17,907 | ) | (8.5 | )% | $ | 7,408 | 41.4 | % | |||||
| | | | | | | | | | | | | | | | | | | | |
| | | | | | | | | | | | | | | | | | | | |
| | | | | | | | | | | | | | | | | | | | |
Consolidated
Revenues increased by $5,003, from $210,707 for the year ended December 31, 2012, to $215,710 for the year ended December 31, 2013. The increase in revenues was primarily attributable to an 18%, or $24,257, increase in our Towers and Weldments segment revenue due to increased volumes, partially offset by declines in other segments. We experienced a revenue decline of 22%, or $12,510, in our Gearing segment due to production delays and decreased industrial demand, as compared to the prior
29
year. In our Services segment, we experienced a 22% decrease in revenue in 2014 compared to 2013, due to sharp declines in construction activity, partially offset by a large industrial project performed by the Abilene Gearbox Facility in the first half of 2013.
Gross profit increased by $5,509, from $6,836 for the year ended December 31, 2012, to $12,345 for the year ended December 31, 2013. The increase in gross profit was attributable to increased Towers and Weldments volumes and margins on the current mix of towers, partially offset by lower margins and lower volumes in Gearing and Services for the period ended December 31, 2013 as compared to the period ended December 31, 2012. As a result, our gross margin increased from 3.2% for the year ended December 31, 2012, to 5.7% for the year ended December 31, 2013. Gross profit margin excluding restructuring charges increased to 8.0% in the year ended December 31, 2013, from 4.0% in the year ended December 31, 2012.
SG&A expenses decreased by $220, from $21,634 for the year ended December 31, 2012, to $21,414 for the year ended December 31, 2013. The small decrease was the result of a variety of items including lower facility cost of $362, temporary labor costs of $147 and legal expenses of $279, partially offset by higher professional fees of $507, insurance expenses of $241 and director fees of $108. SG&A expenses as a percentage of sales decreased slightly from 10.3% in the year ended December 31, 2012 to 9.9% in the year ended December 31, 2013.
Intangible amortization expense decreased from $1,759 for the year ended December 31, 2012, to $1,552 for the year ended December 31, 2013 due to the previous acceleration of amortization related to a portion of our customer relationship intangible asset that became fully amortized during the second quarter of 2013. We also recorded a $1,500 charge for a regulatory settlement associated with the Gearing segment environmental inquiry. See Item 3, "Legal Proceedings."
Net loss improved from $17,907 for the year ended December 31, 2012, to $10,499 for the year ended December 31, 2013, as a result of the factors described above and a $3,585 gain on the sale of the Brandon Facility.
Towers and Weldments Segment
The following table summarizes the Towers and Weldments segment operating results for the years ended December 31, 2013 and 2012:
| |
Twelve Months Ended December 31, |
||||||
|---|---|---|---|---|---|---|---|
| |
2013 | 2012 | |||||
Revenues |
$ | 159,478 | $ | 135,221 | |||
Operating income |
19,550 | 2,766 | |||||
Operating margin |
12.3 | % | 2.0 | % | |||
Towers and Weldments segment revenues increased by $24,257, from $135,221 for the year ended December 31, 2012, to $159,478 for the year ended December 31, 2013. Towers and Weldments segment revenues increased due to a $23,469 increase in towers revenues, and a $788 increase in weldments revenues. Towers and Weldments segment revenues increased 18%, while tower sections sold increased by 5% in the year ended December 31, 2013 largely because we produced a larger number of smaller sections in the year ended December 31, 2012. Weldments revenue for large industrial customers increased 7% in the year ended December 31, 2013 as compared to the year ended December 31, 2012. We have continued our strategic focus on diversifying our end-markets; however, expansion of the weldments business has slowed recently due to a downturn in the mining industry.
Towers and Weldments segment operating income increased by $16,784, from $2,766 for the year ended December 31, 2012, to $19,550 for the year ended December 31, 2013. The increase in operating income was attributable to increased volumes and margins on the mix of towers in the year ended
30
December 31, 2013 which included less variability in tower designs than in the prior year period, the reduction of production inefficiencies experienced in the prior year period and the expansion of weldments revenue. Operating margin increased from 2.0% during the year ended December 31, 2012, to 12.3% during the year ended December 31, 2013.
Gearing Segment
The following table summarizes the Gearing segment operating results for the years ended December 31, 2013 and 2012:
| |
Twelve Months Ended December 31, |
||||||
|---|---|---|---|---|---|---|---|
| |
2013 | 2012 | |||||
Revenues |
$ | 43,150 | $ | 55,660 | |||
Operating loss |
(17,916 | ) | (7,626 | ) | |||
Operating margin |
(41.5 | )% | (13.7 | )% | |||
Gearing segment revenues decreased by $12,510, from $55,660 for the year ended December 31, 2012, to $43,150 for the year ended December 31, 2013. The 22% decrease in total revenues was due to production delays attributable to our plant consolidation and the transition to increased volumes of complex gearbox production, and decreased mining and natural gas related sales due to a decline in industrial demand, as compared to the prior year.
Gearing segment operating loss increased by $10,290, from $7,626 for the year ended December 31, 2012, to $17,916 for the year ended December 31, 2013. The increase in operating loss was due to lower sales and production volumes, an unfavorable product mix, $3,295 of increased restructuring expenses, and a $1,500 regulatory settlement associated with the environmental inquiry, partially offset by $1,497 of lower depreciation and amortization, and $498 in lower employee compensation expenses. As a result of the factors described above, operating margin deteriorated from (13.7%) for the year ended December 31, 2012, to (41.5%) for the year ended December 31, 2013.
Services Segment
The following table summarizes the Services segment operating results for the years ended December 31, 2013 and 2012:
| |
Twelve Months Ended December 31, |
||||||
|---|---|---|---|---|---|---|---|
| |
2013 | 2012 | |||||
Revenues |
$ | 17,243 | $ | 22,106 | |||
Operating loss |
(4,721 | ) | (4,185 | ) | |||
Operating margin |
(27.4 | )% | (18.9 | )% | |||
Services segment revenues decreased by $4,863, from $22,106 for the year ended December 31, 2012, to $17,243 for the year ended December 31, 2013. The 22% decrease in revenue was primarily the result of greatly decreased construction activity, partially offset by a large industrial project performed in the first half of 2013 at the Abilene Gearbox Facility. The low level of wind farm construction and installations in 2013 negatively affected our Services segment revenue, both directly and indirectly, as wind farm operators performed non-routine maintenance projects themselves.
Services segment operating loss deteriorated by $536, from $4,185 for the year ended December 31, 2012, to $4,721 for the year ended December 31, 2013. The decline reflects lower volumes and margins, offset by lower operating expenses due to a reduction in headcount in response to the downturn in activity experienced, and also offset by higher margins in the first half of the year
31
due to the large industrial project that was completed in early 2013. Operating margin deteriorated from (18.9%) for the year ended December 31, 2012, to (27.4%) for the year ended December 31, 2013.
Corporate and Other
Corporate and Other expenses increased by $1,871, from $8,252 for the year ended December 31, 2012, to $10,123 for the year ended December 31, 2013. The increase in expenses was primarily attributable to increased employee compensation costs, professional fees and restructuring expenses.
SUMMARY OF CRITICAL ACCOUNTING POLICIES
The methods, estimates and judgments that we use in applying our critical accounting policies have a significant impact on the results that we report in our financial statements. Some of our accounting policies require us to make difficult and subjective judgments, often as a result of the need to make estimates regarding matters that are inherently uncertain.
We have identified the accounting policies listed below to be critical to obtain an understanding of our consolidated financial statements. This section should also be read in conjunction with Note 1, "Description of Business and Summary of Significant Accounting Policies" in the notes to our consolidated financial statements for further discussion of these and other significant accounting policies.
Revenue Recognition
We recognize revenue when the earnings process is complete and when persuasive evidence of an arrangement exists, transfer of title has occurred or services have been rendered, the selling price is fixed or determinable, collectability is reasonably assured and delivery has occurred per the terms of the contract. Customer deposits and other receipts are deferred and recognized when the revenue is realized and earned. Cash payments to customers, like those made for liquidated damages, are presumed to be classified as reductions of revenue in our statement of operations.
In some instances, typically within our Towers and Weldments segment, products are sold under terms included in bill and hold sales arrangements that result in different timing for revenue recognition due to our customers' preference to ship towers in batches to support efficient construction of wind farms. We recognize revenue under these arrangements only when the buyer requests the arrangement, title and risk of ownership has passed to the buyer, a fixed schedule for delivery exists, the ordered goods are segregated from inventory and not available to fill other orders and the goods are complete and ready for shipment. Assuming these required revenue recognition criteria are met, revenue is recognized upon completion of product manufacture and customer acceptance.
Warranty Liability
We provide warranty terms that generally range from one to five years for various products and services relating to workmanship and materials supplied by us. In certain contracts, we have recourse provisions for items that would enable us to seek recovery from third parties for amounts paid to customers under warranty provisions. We estimate the warranty accrual based on various factors, including historical warranty costs, current trends, product mix and sales.
Inventories
Inventories are stated at the lower of cost or market. We have recorded a reserve for excess of cost over market value in our inventory allowance. Market value of inventory, and management's judgment of the need for reserves, encompasses consideration of other business factors including
32
physical condition, inventory holding period, contract terms, and usefulness. Inventories are valued based either on the first-in, first out ("FIFO") method, or on a standard cost basis that approximates the FIFO method.
Inventories consist of raw materials, work-in-process, and finished goods. Raw materials consist of components and parts for general production use. Work-in-process consists of labor and overhead, processing costs, purchased subcomponents, and materials purchased for specific customer orders. Finished goods consist of components purchased from third parties as well as components manufactured by us that will be used to produce final customer products.
Intangible Assets
We review intangible assets for impairment whenever events or circumstances indicate that carrying amounts may not be recoverable. If such events or changes in circumstances occur, we will recognize an impairment loss if the undiscounted future cash flows expected to be generated by the assets are less than the carrying value of the related asset. The impairment loss would adjust the asset to its fair value.
In evaluating the recoverability of definite-lived intangible assets, we must make assumptions regarding estimated future cash flows and other factors to determine the fair value of such assets. If our fair value estimates or related assumptions change in the future, we may be required to record impairment charges related to intangible assets. Asset recoverability is first measured by comparing the assets' carrying amounts to their expected future undiscounted net cash flows to determine if the assets are impaired. If such assets are considered to be impaired, the impairment recognized is measured based on the amount by which the carrying amount of the assets exceeds the fair value.
Due to the Gearing segment's operating losses in each quarter of 2014 combined with its history of continued operating losses, we continue to evaluate the recoverability of certain of our intangible assets associated with the Gearing segment. Based upon our December 31, 2014 overall impairment assessment, the recoverable amount was substantially in excess of the carrying amount of the related assets, and no impairment to these assets was indicated. To the extent the projections used in our analysis are not achieved, there may be a negative effect on the valuation of these assets.
Long-Lived Assets
We review property and equipment and other long-lived assets for impairment whenever events or circumstances indicate that their carrying amounts may not be recoverable. If such events or changes in circumstances occur, we will recognize an impairment loss if the undiscounted future cash flows expected to be generated by the assets are less than the carrying value of the related assets. The impairment loss would adjust the asset to its fair value.
In evaluating the recoverability of long-lived assets, we must make assumptions regarding estimated future cash flows and other factors to determine the fair value of such assets. If our cash flow estimates or related assumptions change in the future, we may be required to record impairment charges related to property and equipment and other long-lived assets. Asset recoverability is first measured by comparing the assets' carrying amounts to their expected future undiscounted net cash flows to determine if the assets are impaired. If such assets are considered to be impaired, the impairment recognized is measured based on the amount by which the carrying amount of the assets exceeds the fair value.
Due to the Gearing and Services segments' operating losses in each quarter of 2014 combined with their history of continued operating losses, we continue to evaluate the recoverability of certain of the long-lived assets associated with the Gearing and Services segments. Based upon our December 31, 2014 overall impairment assessment, the recoverable amount of undiscounted cash flows based upon our most recent projections were substantially in excess of the carrying amount of invested capital for
33
the Gearing and Services segments, respectively, and no impairment to these assets was indicated. To the extent projections used in our evaluations are not achieved, there may be a negative effect on the valuation of these assets.
During the first half of 2013, we took a $288 charge to adjust the carrying value of the Clintonville Facility assets to fair value, and reclassified the resulting $790 carrying value from property and equipment to Assets Held for Sale. This treatment was due to our decision to list the Clintonville Facility for sale as a result of our determination that the Clintonville Facility was no longer required in our operations. The Clintonville Facility remains as Assets Held For Sale, and due to depressed commercial real estate values we have recorded an additional impairment of $84 in 2014 to value the property at its fair value.
In 2013, we took a $345 charge to adjust the carrying value of certain Gearing equipment to fair value, and reclassified the resulting $1,400 carrying value to Assets Held for Sale as a result of a decision to sell this equipment. During the fourth quarter of 2013, we recorded a $1,732 charge to adjust the carrying value of the Cicero Avenue Facility's land and building down to fair value. This treatment was in response to the Cicero Avenue Facility being taken substantially offline prior to year-end in conjunction with our plant consolidation initiative. As the Cicero Avenue Facility is not immediately available for sale, it has not been classified as Assets Held for Sale. The aforementioned impairment charges were recorded as Restructuring expenses within our Statement of Operations.
Income Taxes
We account for income taxes based upon an asset and liability approach. Deferred tax assets and liabilities represent the future tax consequences of the differences between the financial statement carrying amounts of assets and liabilities versus the tax basis of assets and liabilities. Under this method, deferred tax assets are recognized for deductible temporary differences, and operating loss and tax credit carryforwards. Deferred tax liabilities are recognized for taxable temporary differences. Deferred tax assets are reduced by a valuation allowance when, in the opinion of management, it is more likely than not that some portion or all of the deferred tax assets will not be realized. The impact of tax rate changes on deferred tax assets and liabilities is recognized in the year that the change is enacted.
In connection with the preparation of our consolidated financial statements, we are required to estimate our income tax liability for each of the tax jurisdictions in which we operate. This process involves estimating our actual current income tax expense and assessing temporary differences resulting from differing treatment of certain income or expense items for income tax reporting and financial reporting purposes. We also recognize the expected future income tax benefits of NOL carryforwards as deferred income tax assets. In evaluating the realizability of deferred income tax assets associated with NOL carryforwards, we consider, among other things, expected future taxable income, the expected timing of the reversals of existing temporary reporting differences, and the expected impact of tax planning strategies that may be implemented to prevent the potential loss of future income tax benefits. Changes in, among other things, income tax legislation, statutory income tax rates, or future taxable income levels could materially impact our valuation of income tax assets and liabilities and could cause our income tax provision to vary significantly among financial reporting periods.
We also account for the uncertainty in income taxes related to the recognition and measurement of a tax position taken or expected to be taken in an income tax return. We follow the applicable pronouncement guidance on derecognition, classification, interest and penalties, accounting in interim periods, disclosure, and transition related to the uncertainty in these income tax positions.
34
Workers' Compensation Reserves
At the beginning of the third quarter of 2013, we began to self-insure for our workers' compensation liability that include reserves for self-retained losses. Historical loss experience combined with actuarial evaluation methods and the application of risk transfer programs are used to determine required workers' compensation reserves. We take into account claims incurred but not reported when determining our workers' compensation reserves. Workers' compensation reserves are included in accrued liabilities. While we believe that we have adequately reserved for these claims, the ultimate outcome of these matters may exceed the amounts recorded and additional losses may be incurred.
Health Insurance Reserves
At the beginning of the first quarter of 2014, we began to self-insure for our health insurance liabilities that include reserves for self-retained losses. Historical loss experience combined with actuarial evaluation methods and the application of risk transfer programs are used to determine required health insurance reserves. We take into account claims incurred but not reported when determining our health insurance reserves. Health insurance reserves are included in accrued liabilities. While we believe that we have adequately reserved for these claims, the ultimate outcome of these matters may exceed the amounts recorded and additional losses may be incurred.
Recent Accounting Pronouncements
We review new accounting standards as issued. Although some of the accounting standards issued or effective in the current fiscal year may be applicable to us, we have not identified any new standards that we believe merit further discussion, except as discussed below. We are currently evaluating the impact of the new standards on our condensed consolidated financial statements.
In May 2014, the Financial Accounting Standards Board ("FASB") issued ASU 2014-09, Revenue from Contracts with Customers, which amends the guidance in former ASC Topic 605, Revenue Recognition, and provides a single, comprehensive revenue recognition model for all contracts with customers. This standard contains principles that an entity will apply to determine the measurement of revenue and timing of when it is recognized. The entity will recognize revenue to reflect the transfer of goods or services to customers at an amount that the entity expects to be entitled to in exchange for those goods or services. This pronouncement is effective for fiscal years, and interim periods within those years, beginning after December 15, 2016, and early adoption is not permitted. We will adopt the provisions of ASU 2014-09 for the fiscal year beginning January 1, 2017, and are currently evaluating the impact on our condensed consolidated financial statements.
LIQUIDITY, FINANCIAL POSITION AND CAPITAL RESOURCES
As of December 31, 2014, cash and cash equivalents and short-term investments totaled $20,173, a decrease of $5,906 from December 31, 2013. Total debt and capital lease obligations at December 31, 2014 totaled $4,111, and we had the ability to borrow up to $14,452 under the Credit Facility. Although we will occasionally use the Credit Facility, we anticipate that we will be able to satisfy the cash requirements associated with, among other things, working capital needs, capital expenditures and lease commitments through at least the next 12 months primarily with current cash on hand and cash generated by operations.
Pursuant to the Credit Facility, AloStar will advance funds upon request against our borrowing base, which consists of approximately 85% of eligible A/R and approximately 50% of eligible inventory. Under this borrowing structure, borrowings are continuous and all cash receipts are automatically applied to the outstanding borrowed balance. As a result of this structure, we anticipate that cash balances will remain at a minimum at all times when there are amounts outstanding under the Credit Facility. We intend to negotiate a new facility in anticipation of the scheduled expiration of the Credit Facility on August 23, 2015. At December 31, 2014, the Credit Facility was undrawn and we were in compliance with all applicable covenants.
35
While we believe that we will continue to have sufficient cash flows to operate our businesses and meet our financial obligations and debt covenants, there can be no assurances that our operations will generate sufficient cash, that we will be able to comply with applicable loan covenants or that credit facilities will be available to us in an amount sufficient to enable us to pay our indebtedness or to fund our other liquidity needs.
Sources and Uses of Cash
Operating Cash Flows
During the years ended December 31, 2014 and 2013, net cash provided by operating activities totaled $2,501 and $26,254, respectively. The decrease in net cash provided by operating activities was primarily attributable to the timing of receipts of customer deposits, as well as a decrease in A/P balances due to the timing of steel receipts. Partly offsetting this was the absence of the inventory increase experienced in the prior year when tower production and steel inventories increased sharply.
Investing Cash Flows
During the year ended December 31, 2014, net cash used in investing activities totaled $12,320, compared to net cash provided by investing activities of $5,654 for the year ended December 31, 2013. The increase in net cash used in investing activities as compared to the prior-year period was primarily attributable to the purchase of available for sale securities in 2014 and the 2013 sale of the Brandon Facility, which resulted in gross proceeds of approximately $12,000.
Financing Cash Flows
During the years ended December 31, 2014 and 2013, net cash used in financing activities totaled $2,968 and $7,488, respectively. The decrease in net cash used in financing activities as compared to the prior-year period was due primarily to the prior-year period payments under the Credit Facility of credit and notes payable, partially offset by repurchases of common stock of $1,842 during 2014.
Credit Facilities
AloStar Credit Facility
We meet our short-term liquidity needs through available cash balances and the Credit Facility. The Credit Facility is a secured three-year asset-based revolving credit facility, pursuant to which AloStar will advance funds when requested against a borrowing base consisting of approximately 85% of the face value of our eligible A/R and approximately 50% of the book value of our eligible inventory. Borrowings under the Credit Facility bear interest at a per annum rate equal to the one-month London Interbank Offered Rate plus a margin of 4.25%, with a minimum interest rate of 5.25% per annum. We must also pay an unused facility fee to AloStar equal to 0.50% per annum on the unused portion of the Credit Facility along with other standard fees.
The initial term of the August 23, 2012 Loan and Security Agreement establishing the Credit Facility (the "Loan Agreement") ends on August 23, 2015. The Loan Agreement contains customary representations and warranties applicable to us and our Subsidiaries. On a consolidated basis, we are required to maintain a minimum monthly fixed charge coverage ratio and minimum monthly Adjusted EBITDA, along with other customary restrictive covenants, certain of which are subject to materiality thresholds, baskets and customary exceptions and qualifications.
The obligations under the Loan Agreement are secured by, subject to certain exclusions, (i) a first priority security interest in all of the A/R, inventory, chattel paper, payment intangibles, cash and cash equivalents and other working capital assets and stock or other equity interests in the Subsidiaries, and (ii) a first priority security interest in all of Brad Foote's equipment.
36
We intend to negotiate a new credit facility in anticipation of the scheduled expiration of the Credit Facility on August 23, 2015. As of December 31, 2014, there was no outstanding indebtedness under the Credit Facility. We had the ability to borrow up to $14,452 under the Credit Facility as of December 31, 2014, and the per annum interest rate would have been 5.25%. We are in compliance with all applicable covenants under the Loan Agreement as of December 31, 2014.
Other
Included in Long Term Debt, Net of Current Maturities is $2,600 associated with the New Markets Tax Credit transaction described further in Note 19, "New Markets Tax Credit Transaction" in the notes to our consolidated financial statements. Additionally, we have approximately $318 of other term loans outstanding.
Contractual Obligations
The following table sets forth, as of December 31, 2014, minimum future cash payments due under contractual obligations, including, among others, our debt and credit agreements and non-cancelable operating and capital lease agreements as follows:
| |
2015 | 2016 | 2017 | 2018 | 2019 | 2020 & Thereafter |
Total | |||||||||||||||
|---|---|---|---|---|---|---|---|---|---|---|---|---|---|---|---|---|---|---|---|---|---|---|
Debt and credit agreements(1) |
$ | 268 | $ | 51 | $ | — | $ | 2,600 | $ | — | $ | — | $ | 2,919 | ||||||||
Estimated interest payments(2) |
300 | 145 | 145 | 109 | — | — | 699 | |||||||||||||||
Operating lease obligations |
3,252 | 3,237 | 3,129 | 2,991 | 2,741 | 15,168 | 30,518 | |||||||||||||||
Capital lease obligations(3) |
806 | 435 | — | — | — | — | 1,241 | |||||||||||||||
Other long-term liabilities(4) |
2,066 | 498 | 496 | — | — | — | 3,060 | |||||||||||||||
| | | | | | | | | | | | | | | | | | | | | | | |
Total contractual cash obligations |
$ | 6,692 | $ | 4,366 | $ | 3,770 | $ | 5,700 | $ | 2,741 | $ | 15,168 | $ | 38,437 | ||||||||
| | | | | | | | | | | | | | | | | | | | | | | |
| | | | | | | | | | | | | | | | | | | | | | | |
| | | | | | | | | | | | | | | | | | | | | | | |
- (1)
- Debt
and credit agreements represent the minimum future principal payments due under our outstanding contractual obligations.
- (2)
- Interest
payments represent an amount calculated for expected interest due under our outstanding debt and credit agreements. Assumptions used to derive
these amounts were based upon current interest rates as of December 31, 2014, required minimum principal payments due, and maturity of our debt and credit agreements per our contractual
agreements. Actual interest payments could vary materially from those set out in this table.
- (3)
- Capital
lease obligations include both the future principal and interest payments related to these agreements.
- (4)
- Other long-term liabilities represents the regulatory settlements related to the SEC inquiry and the USEPA inquiry.
Debt and Credit Agreements. Debt and credit agreements include outstanding borrowings under our lines of credit, term notes related to vehicle and equipment purchases, and a purchase agreement for manufacturing equipment. See Note 11 "Debt and Credit Agreements" in the notes to our consolidated financial statements for further discussion of our outstanding indebtedness and credit agreements.
Operating Lease Obligations. We lease a number of our facilities and certain equipment under operating leases expiring at various dates through 2026. Lease terms generally range from 3 to 15 years with renewal options for extended terms. The amounts in the table above represent future minimum lease payments for non-cancelable operating leases.
37
Capital Lease Obligations. We have capital lease obligations related to certain manufacturing equipment and vehicles expiring at various dates through 2016. As of December 31, 2014, the balance of our outstanding capital lease obligations was approximately $1,810, which includes accrued interest of approximately $48.
ITEM 7A. QUANTITATIVE AND QUALITATIVE DISCLOSURES ABOUT MARKET RISK
We are exposed to financial market risks, which include changes in interest rates on our variable rate obligations, credit risks on A/R and raw material price fluctuations.
Interest Rate Exposure
As of December 31, 2014, the majority of the third party borrowings under our debt and credit agreements bear annual interest at fixed interest rates; therefore, we have limited interest rate exposure. We are subject to interest rate fluctuation exposure only through amounts financed under the Credit Facility. As of December 31, 2014 and 2013, there was no outstanding indebtedness under the Credit Facility.
Credit Risk Exposure
We are exposed to credit risk on our A/R balances and cash balances. Historically, our A/R balances are highly concentrated with a select number of financially stable customers. During the years ended December 31, 2014 and 2013, our five largest customers accounted for approximately 87% and 83%, respectively, of consolidated revenues. Additionally, as of December 31, 2014 and 2013, our five largest customers comprised approximately 80% and 63%, respectively, of our outstanding A/R balances.
Commodity Risk Exposure
We are dependent upon the supply of certain raw materials used in our production processes, and these raw materials are exposed to price fluctuations on the open market. The primary raw material we use is steel. To reduce price risk caused by market fluctuations, we have incorporated price adjustment clauses in certain sales contracts. Management believes a hypothetical 10% change in the price of steel and other raw materials would not have a significant effect on our consolidated results of operations or cash flows because these costs are generally passed through to our customers. We are monitoring the recent sharp decrease in the price of crude oil that began in the last quarter of 2014, and are anticipating a potential reduction in the rate of orders from some of our oil industry customers.
ITEM 8. FINANCIAL STATEMENTS AND SUPPLEMENTARY DATA
The financial information required by Item 8 is contained in Part IV, Item 15 "EXHIBITS AND FINANCIAL STATEMENT SCHEDULES" of this Annual Report.
ITEM 9. CHANGES IN AND DISAGREEMENTS WITH ACCOUNTANTS ON ACCOUNTING AND FINANCIAL DISCLOSURE
None.
ITEM 9A. CONTROLS AND PROCEDURES
(a) Evaluation of Disclosure Controls and Procedures
We seek to maintain disclosure controls and procedures (as defined in Rules 13a-15(e) and 15d-15(e) under the Exchange Act) that are designed to ensure that information required to be disclosed in our reports filed under the Exchange Act is recorded, processed, summarized and reported
38
within the time periods specified in the SEC's rules and forms. This information is also accumulated and communicated to management, including our Chief Executive Officer ("CEO") and Chief Financial Officer ("CFO"), as appropriate, to allow timely decisions regarding required disclosure. Our management, under the supervision and with the participation of our CEO and CFO, evaluated the effectiveness of the design and operation of our disclosure controls and procedures as of the end of the most recent fiscal year reported on herein. Based on that evaluation, our CEO and CFO concluded that our disclosure controls and procedures were effective as of the end of our 2014 fiscal year reporting period covered by this report.
(b) Changes in Internal Control over Financial Reporting
Other than the remedial actions and internal control enhancements described below, there were no changes in our internal control over financial reporting that occurred during our last fiscal quarter that have materially affected, or are reasonably likely to materially affect, our internal control over financial reporting.
(c) Report of Management on Internal Control Over Financial Reporting
Our management, including our CEO and CFO, is responsible for establishing and maintaining adequate internal control over financial reporting (as defined in Rules 13a-15(f) and 15d-15(f) under the Exchange Act).
Our management, including our CEO and CFO, assessed the effectiveness of our internal control over financial reporting as of December 31, 2014. Management based this assessment on criteria for effective internal control over financial reporting described in "Internal Control—Integrated Framework (1992)" issued by the Committee of Sponsoring Organizations of the Treadway Commission. Based on this assessment, management determined that our internal control over financial reporting was effective as of December 31, 2014.
The effectiveness of the Company's internal control over financial reporting as of December 31, 2014 has been audited by KPMG LLP, our independent registered public accounting firm, as stated in their attestation report appearing in Item 8 of this Annual Report on Form 10-K. KPMG's report expresses an unqualified opinion on the effectiveness of the Company's internal control over financial reporting as of December 31, 2014.
(d) Material Weaknesses Remedial Actions & Internal Control Enhancements
As previously disclosed in our Annual Report on Form 10-K for the year ended December 31, 2013, management identified material weaknesses in our internal control over financial reporting related to (1) segregation of duties, account reconciliations and communication of policies and procedures, (2) inventory accounting, and (3) revenue accounting. Details of previously disclosed material weaknesses are described below; these material weaknesses were determined to have been remediated as of December 31, 2014. The weaknesses related to accounts payable and cost of sales resulted in material misstatements that required us to restate our previously issued 2013 quarterly financial statements; the inventory and revenue related misstatements were also corrected in the 2013 quarterly reports and prior to the issuance of the Annual Report for the year-ended December 31, 2013.
Segregation of duties, account reconciliations and communication of policies and procedures
- 1)
- Previously, we did not maintain effective controls over the preparation, support, review and approval of journal entries. Specifically, effective controls were not in place to ensure proper segregation of duties between the preparation and approval of journal entries.
39
- 2)
- Previously, we did not maintain effective control over the reconciliation of the accrual account for inventory items that have been received for which the related vendor invoice is pending. Specifically, the reconciliation was not properly designed to identify, investigate and resolve reconciling items on a timely basis.
We have now enhanced controls over the review and approval of journal entries. Specifically, we implemented a comprehensive review and certification process for all journal entries and verified proper segregation of incompatible duties. We have updated related internal control documentation to ensure ongoing compliance.
- 3)
- Previously, we did not maintain effective controls over ensuring our commitment to integrity and ethical values. Specifically, our controls over internal communications regarding the importance of maintaining effective internal control over financial reporting and a commitment to integrity and ethical values were not operating effectively.
We have now re-designed the control process relating to the accrual account for inventory items that have been received for which the related vendor invoice is pending. The re-design included development of new reconciliation tools, the separation of incompatible duties as well as the implementation of a comprehensive review and certification process for all journal entries and account analysis on an ongoing basis. We have updated related internal control documentation to ensure ongoing compliance.
We have now implemented several controls during 2014 and enhanced procedures related to communication and monitoring of our ongoing commitment to integrity and ethics throughout the organization. Specifically, we implemented a curriculum of comprehensive training for all appropriate management regarding the importance of full and transparent communication and disclosure over matters that impact our internal controls and financial reporting and disclosure in accordance with our Code of Ethics policy. This includes continuous education for new managers and refresher courses for all managers on an ongoing basis. On a quarterly basis the CFO and Corporate Controller conduct interviews with key managers concerning their knowledge and certification of the completeness and accuracy of financial disclosures and filings. We have updated related internal control documentation and monitoring procedures to ensure ongoing compliance.
Inventory Accounting
- 1)
- Previously, we did not maintain effective controls over the costing and valuation of inventory. Specifically, controls over standard cost updates, capitalization of variances into ending inventory, elimination of intercompany profits in inventory and valuation of inventory related reserves were not properly designed to prevent or detect material misstatements on a timely basis, which we concluded in the aggregate, constitute a material weakness.
We have now completed a comprehensive review, re-design and final documentation of our data compilation and management review process related to adjusting standard inventory costs to actual and reserve computations. This effort involved corporate and business unit financial managers as well as internal auditors and external consulting resources. We conducted a series of meetings to define data sources and steps ensure the completeness and accuracy of inputs, the integrity of mathematical processes applied to the data, and metrics and thresholds used in management review of computations. The end-to-end process was documented and enhanced through repeated monthly testing and review by financial managers, internal auditors and external consultants. Relative to the elimination of intercompany profits in inventory, we increased communication between related business units coordinated by corporate financial managers. We have used documentation to conduct internal training of applicable staff in the
40
specific requirements, and established checklists and certifications to ensure all analysis and review steps are completed on an ongoing basis.
Revenue Accounting
- 1)
- Previously, we did not maintain the requisite knowledge regarding the application of revenue recognition accounting guidance at our Towers and Weldments segment.
We have now implemented participation in SEC reporting and revenue recognition internal and external training by relevant personnel. We conducted internal training of applicable staff in the specific requirements of GAAP related to revenue recognition, and this knowledge has been incorporated into our detailed internal control documentation.
We also have implemented a formal contract review control to identify and account for key terms affecting revenue recognition covering all contracts and purchase orders related to sales of towers. We have implemented enhanced controls throughout the organization including formal communication to Corporate Finance of contracts entered into by each segment to identify any unusual aspects of sales revenue transactions including bill and hold activity. We have established checklists and certifications to ensure the implemented control activities are completed and to monitor ongoing compliance.
As a result of the completion and implementation of the remedial measures described above, management has determined that the material weaknesses were remediated as of December 31, 2014. This Annual Report includes an attestation report of our independent registered public accounting firm regarding internal control over financial reporting pursuant to the rules of the SEC.
None.
ITEM 10. DIRECTORS, EXECUTIVE OFFICERS AND CORPORATE GOVERNANCE
With the exception of the description of our Code of Ethics and Business Conduct below, the information required by this item is incorporated herein by reference from the discussion under the headings "Directors and Director Compensation," "Corporate Governance," "Executive Officers" and "Other Matters—Section 16(a) Beneficial Ownership Reporting Compliance" in our definitive Proxy Statement to be filed in connection with our 2015 Annual Meeting of Stockholders (the "2015 Proxy Statement").
Code of Ethics
We have adopted a Code of Ethics and Business Conduct (the "Code") that applies to all of our directors, executive officers and senior financial officers (including our principal executive officer, principal financial officer, principal accounting officer, controller, and any person performing similar functions). The Code is available on our website at www.bwen.com under the caption "Investors" and is available in print, free of charge, to any stockholder who sends a request for a paper copy to Broadwind Energy, Inc., Attn: Investor Relations, 3240 South Central Avenue, Cicero, IL 60804. We intend to include on our website any amendment to, or waiver from, a provision of the Code that applies to our principal executive officer, principal financial officer, principal accounting officer or controller, or persons performing similar functions, that relates to any element of the code of ethics definition enumerated in Item 406(b) of Regulation S-K.
ITEM 11. EXECUTIVE COMPENSATION
Information regarding director and executive compensation is incorporated by reference from the discussion under the headings "Directors and Director Compensation" and "Compensation Discussion and Analysis" in the 2015 Proxy Statement.
41
ITEM 12. SECURITY OWNERSHIP OF CERTAIN BENEFICIAL OWNERS AND MANAGEMENT AND RELATED STOCKHOLDER MATTERS
Certain of the information required by this item is incorporated herein by reference from the discussion under the heading "Security Ownership of Certain Beneficial Holders and Management" in the 2015 Proxy Statement.
The following table provides information as of December 31, 2014, with respect to shares of our common stock that may be issued under our existing equity compensation plans:
EQUITY COMPENSATION PLAN INFORMATION
| |
(a) | (b) | (c) | |||||||
|---|---|---|---|---|---|---|---|---|---|---|
Plan Category
|
Number of securities to be issued upon exercise of outstanding options, warrants, and rights |
Weighted-average exercise price of outstanding options, warrants, and rights |
Number of securities remaining available for future issuances under equity compensation plans (excluding securities reflected in column (a)) |
|||||||
Equity compensation plans approved by stockholders |
673,756 | (1) | $ | 8.34 | 474,552 | |||||
| | | | | | | | | | | |
Total |
673,756 | $ | 8.34 | 474,552 | ||||||
| | | | | | | | | | | |
| | | | | | | | | | | |
| | | | | | | | | | | |
- (1)
- Includes outstanding stock options to purchase shares of our common stock and outstanding restricted stock awards pursuant to the Amended and Restated Broadwind Energy, Inc. 2007 Equity Incentive Plan and the Broadwind Energy, Inc. 2012 Equity Incentive Plan. Each of these plans has been approved by our stockholders.
ITEM 13. CERTAIN RELATIONSHIPS AND RELATED TRANSACTIONS, AND DIRECTOR INDEPENDENCE
The information required by this item is incorporated herein by reference from the discussion under the headings "Certain Transactions and Business Relationships" and "Corporate Governance" in the 2015 Proxy Statement.
ITEM 14. PRINCIPAL ACCOUNTANT FEES AND SERVICES
The information required by this item is incorporated herein by reference from the discussion under the heading "Ratification of Appointment of Independent Registered Public Accounting Firm" in the 2015 Proxy Statement.
ITEM 15. EXHIBITS AND FINANCIAL STATEMENT SCHEDULES
1. Financial Statements
The financial statements listed on the Index to Financial Statements (page 36) are filed as part of this Annual Report.
2. Financial Statement Schedules
These schedules have been omitted because the required information is included in the consolidated financial statements or notes thereto or because they are not applicable or not required.
3. Exhibits
The exhibits listed on the Index to Exhibits (pages 69 through 72) are filed as part of this Annual Report.
42
43
Report of Independent Registered Public Accounting Firm
The
Board of Directors and Stockholders
Broadwind Energy, Inc.:
We have audited the accompanying consolidated balance sheets of Broadwind Energy, Inc. and its subsidiaries (the "Company") as of December 31, 2014 and 2013, and the related consolidated statements of operations, stockholders' equity, and cash flows for each of the years in the two-year period ended December 31, 2014. We also have audited the Company's internal control over financial reporting as of December 31, 2014, based on criteria established in Internal Control—Integrated Framework (1992) issued by the Committee of Sponsoring Organizations of the Treadway Commission (COSO). The Company's management is responsible for these consolidated financial statements, for maintaining effective internal control over financial reporting, and for its assessment of the effectiveness of internal control over financial reporting, included in the accompanying Report of Management on Internal Control Over Financial Reporting appearing under Item9A(c) of the Company's December 31, 2014 annual report on Form 10-K. Our responsibility is to express an opinion on these consolidated financial statements and an opinion on the Company's internal control over financial reporting based on our audits.
We conducted our audits in accordance with the standards of the Public Company Accounting Oversight Board (United States). Those standards require that we plan and perform the audits to obtain reasonable assurance about whether the financial statements are free of material misstatement and whether effective internal control over financial reporting was maintained in all material respects. Our audits of the consolidated financial statements included examining, on a test basis, evidence supporting the amounts and disclosures in the financial statements, assessing the accounting principles used and significant estimates made by management, and evaluating the overall financial statement presentation. Our audit of internal control over financial reporting included obtaining an understanding of internal control over financial reporting, assessing the risk that a material weakness exists, and testing and evaluating the design and operating effectiveness of internal control based on the assessed risk. Our audits also included performing such other procedures as we considered necessary in the circumstances. We believe that our audits provide a reasonable basis for our opinions.
A company's internal control over financial reporting is a process designed to provide reasonable assurance regarding the reliability of financial reporting and the preparation of financial statements for external purposes in accordance with generally accepted accounting principles. A company's internal control over financial reporting includes those policies and procedures that (1) pertain to the maintenance of records that, in reasonable detail, accurately and fairly reflect the transactions and dispositions of the assets of the company; (2) provide reasonable assurance that transactions are recorded as necessary to permit preparation of financial statements in accordance with generally accepted accounting principles, and that receipts and expenditures of the company are being made only in accordance with authorizations of management and directors of the company; and (3) provide reasonable assurance regarding prevention or timely detection of unauthorized acquisition, use, or disposition of the company's assets that could have a material effect on the financial statements.
Because of its inherent limitations, internal control over financial reporting may not prevent or detect misstatements. Also, projections of any evaluation of effectiveness to future periods are subject to the risk that controls may become inadequate because of changes in conditions, or that the degree of compliance with the policies or procedures may deteriorate.
In our opinion, the consolidated financial statements referred to above present fairly, in all material respects, the financial position of the Company as of December 31, 2014 and 2013, and the results of its operations and its cash flows for each of the years in the two-year period ended December 31, 2014, in conformity with U.S. generally accepted accounting principles. Also in our opinion, the Company maintained, in all material respects, effective internal control over financial
44
reporting as of December 31, 2014, based on criteria established in Internal Control—Integrated Framework (1992) issued by the Committee of Sponsoring Organizations of the Treadway Commission (COSO).
/s/ KPMG LLP
Chicago,
Illinois
February 26, 2015
45
REPORT OF INDEPENDENT REGISTERED PUBLIC ACCOUNTING FIRM
Board
of Directors and Stockholders
Broadwind Energy Inc.
We have audited the consolidated statements of operations, stockholders' equity and cash flows of Broadwind Energy Inc. (a Delaware corporation) and subsidiaries (the Company) for the year ended December 31, 2012. These financial statements are the responsibility of the Company's management. Our responsibility is to express an opinion on these financial statements based on our audit.
We conducted our audit in accordance with the standards of the Public Company Accounting Oversight Board (United States). Those standards require that we plan and perform the audit to obtain reasonable assurance about whether the financial statements are free of material misstatement. We were not engaged to perform an audit of the Company's internal control over financial reporting. Our audit included consideration of internal control over financial reporting as a basis for designing audit procedures that are appropriate in the circumstances, but not for the purpose of expressing an opinion on the effectiveness of the Company's internal control over financial reporting. Accordingly, we express no such opinion. An audit also includes examining, on a test basis, evidence supporting the amounts and disclosures in the financial statements, assessing the accounting principles used and significant estimates made by management, as well as evaluating the overall financial statement presentation. We believe that our audit provides a reasonable basis for our opinion.
In our opinion, the consolidated financial statements referred to above present fairly, in all material respects, the results of operations and cash flows of Broadwind Energy Inc. and subsidiaries for the year ended December 31, 2012, in conformity with accounting principles generally accepted in the United States of America.
/s/ GRANT THORNTON LLP
Chicago,
Illinois
February 27, 2013
46
BROADWIND ENERGY, INC. AND SUBSIDIARIES
CONSOLIDATED BALANCE SHEETS
(In thousands, except share data)
| |
As of December 31, | ||||||
|---|---|---|---|---|---|---|---|
| |
2014 | 2013 | |||||
ASSETS |
|||||||
CURRENT ASSETS: |
|||||||
Cash and cash equivalents |
$ | 12,149 | $ | 24,936 | |||
Short-term investments |
8,024 | 1,143 | |||||
Restricted cash |
83 | 83 | |||||
Accounts receivable, net |
20,012 | 18,735 | |||||
Inventories, net |
34,921 | 37,143 | |||||
Prepaid expenses and other current assets |
1,815 | 2,325 | |||||
Assets held for sale |
738 | 1,970 | |||||
| | | | | | | | |
Total current assets |
77,742 | 86,335 | |||||
| | | | | | | | |
LONG-TERM ASSETS: |
|||||||
Property and equipment, net |
62,952 | 69,077 | |||||
Intangible assets, net |
5,459 | 5,903 | |||||
Other assets |
464 | 2,379 | |||||
| | | | | | | | |
TOTAL ASSETS |
$ | 146,617 | $ | 163,694 | |||
| | | | | | | | |
| | | | | | | | |
| | | | | | | | |
|
|||||||
CURRENT LIABILITIES: |
|||||||
Current maturities of long-term debt |
$ | 268 | $ | 201 | |||
Current portions of capital lease obligations |
766 | 933 | |||||
Accounts payable |
18,461 | 27,537 | |||||
Accrued liabilities |
9,553 | 8,115 | |||||
Customer deposits |
22,619 | 22,993 | |||||
Liabilities held for sale |
— | 749 | |||||
| | | | | | | | |
Total current liabilities |
51,667 | 60,528 | |||||
| | | | | | | | |
LONG-TERM LIABILITIES: |
|||||||
Long-term debt, net of current maturities |
2,650 | 2,755 | |||||
Long-term capital lease obligations, net of current portions |
427 | 1,193 | |||||
Other |
3,493 | 3,888 | |||||
| | | | | | | | |
Total long-term liabilities |
6,570 | 7,836 | |||||
| | | | | | | | |
COMMITMENTS AND CONTINGENCIES |
|||||||
STOCKHOLDERS' EQUITY: |
|||||||
Preferred stock, $0.001 par value; 10,000,000 shares authorized; no shares issued or outstanding |
— | — | |||||
Common stock, $0.001 par value; 30,000,000 shares authorized; 14,844,307 and 14,627,990 shares issued as of December 31, 2014 and 2013, respectively |
15 | 15 | |||||
Treasury stock, at cost, 273,937 shares and 0 shares at December 31, 2014 and 2013, respectively |
(1,842 | ) | — | ||||
Additional paid-in capital |
377,185 | 376,125 | |||||
Accumulated deficit |
(286,978 | ) | (280,810 | ) | |||
| | | | | | | | |
Total stockholders' equity |
88,380 | 95,330 | |||||
| | | | | | | | |
TOTAL LIABILITIES AND STOCKHOLDERS' EQUITY |
$ | 146,617 | $ | 163,694 | |||
| | | | | | | | |
| | | | | | | | |
| | | | | | | | |
The accompanying notes are an integral part of these consolidated financial statements.
47
BROADWIND ENERGY, INC. AND SUBSIDIARIES
CONSOLIDATED STATEMENTS OF OPERATIONS
(In thousands, except per share data)
| |
For the Years Ended December 31, | |||||||||
|---|---|---|---|---|---|---|---|---|---|---|
| |
2014 | 2013 | 2012 | |||||||
Revenues |
$ | 241,268 | $ | 215,710 | $ | 210,707 | ||||
Cost of sales |
222,497 | 198,379 | 202,257 | |||||||
Restructuring |
1,281 | 4,986 | 1,614 | |||||||
| | | | | | | | | | | |
Gross profit |
17,490 | 12,345 | 6,836 | |||||||
| | | | | | | | | | | |
OPERATING EXPENSES: |
||||||||||
Selling, general and administrative |
21,181 | 21,414 | 21,634 | |||||||
Intangible amortization |
444 | 1,552 | 1,759 | |||||||
Regulatory settlement |
1,566 | 1,500 | — | |||||||
Restructuring |
233 | 1,089 | 740 | |||||||
| | | | | | | | | | | |
Total operating expenses |
23,424 | 25,555 | 24,133 | |||||||
| | | | | | | | | | | |
Operating loss |
(5,934 | ) | (13,210 | ) | (17,297 | ) | ||||
| | | | | | | | | | | |
OTHER INCOME (EXPENSE), net: |
||||||||||
Interest expense, net |
(728 | ) | (985 | ) | (1,711 | ) | ||||
Other income, net |
226 | 1,000 | 1,271 | |||||||
Gain (loss) on sale of assets and restructuring |
36 | 2,878 | (144 | ) | ||||||
| | | | | | | | | | | |
Total other (expense) income, net |
(466 | ) | 2,893 | (584 | ) | |||||
| | | | | | | | | | | |
Net loss from continuing operations before provision for income taxes |
(6,400 | ) | (10,317 | ) | (17,881 | ) | ||||
(Benefit) provision for income taxes |
(232 | ) | 72 | 26 | ||||||
| | | | | | | | | | | |
LOSS FROM CONTINUING OPERATIONS |
(6,168 | ) | (10,389 | ) | (17,907 | ) | ||||
LOSS FROM DISCONTINUED OPERATIONS, NET OF TAX |
— | (110 | ) | — | ||||||
| | | | | | | | | | | |
NET LOSS |
$ | (6,168 | ) | $ | (10,499 | ) | $ | (17,907 | ) | |
| | | | | | | | | | | |
| | | | | | | | | | | |
| | | | | | | | | | | |
NET LOSS PER COMMON SHARE—BASIC AND DILUTED: |
||||||||||
Loss from continuing operations |
$ | (0.42 | ) | $ | (0.72 | ) | $ | (1.27 | ) | |
Loss from discontinued operations |
— | (0.01 | ) | — | ||||||
| | | | | | | | | | | |
Net Loss |
$ | (0.42 | ) | $ | (0.73 | ) | $ | (1.27 | ) | |
| | | | | | | | | | | |
| | | | | | | | | | | |
| | | | | | | | | | | |
WEIGHTED AVERAGE COMMON SHARES OUTSTANDING—Basic and diluted |
14,715 | 14,457 | 14,058 | |||||||
The accompanying notes are an integral part of these consolidated financial statements.
48
BROADWIND ENERGY, INC. AND SUBSIDIARIES
CONSOLIDATED STATEMENTS OF STOCKHOLDERS' EQUITY
(In thousands, except share data)
| |
Common Stock | Treasury Stock | |
|
|
|||||||||||||||||
|---|---|---|---|---|---|---|---|---|---|---|---|---|---|---|---|---|---|---|---|---|---|---|
| |
Shares Issued | Issued Amount |
Shares | Issued Amount |
Additional Paid-in Capital |
Accumulated Deficit |
Total | |||||||||||||||
BALANCE, December 31, 2011 |
13,977,920 | $ | 140 | — | $ | — | $ | 370,123 | $ | (252,404 | ) | $ | 117,859 | |||||||||
| | | | | | | | | | | | | | | | | | | | | | | |
Stock issued for restricted stock |
38,667 |
— |
— |
— |
— |
— |
— |
|||||||||||||||
Stock issued under defined contribution 401(k) retirement savings plan |
181,205 | — | — | — | 523 | — | 523 | |||||||||||||||
Reclass between APIC and CS due to 10-1 Split |
(126 | ) | — | — | 126 | — | ||||||||||||||||
Share-based compensation |
— | — | — | — | 2,833 | — | 2,833 | |||||||||||||||
Net loss |
— | — | — | — | — | (17,907 | ) | (17,907 | ) | |||||||||||||
| | | | | | | | | | | | | | | | | | | | | | | |
BALANCE, December 31, 2012 |
14,197,792 | $ | 14 | — | $ | — | $ | 373,605 | $ | (270,311 | ) | $ | 103,308 | |||||||||
| | | | | | | | | | | | | | | | | | | | | | | |
Stock issued for restricted stock |
258,284 |
1 |
— |
— |
— |
— |
1 |
|||||||||||||||
Stock issued under stock option plans |
5,400 | 0 | — | — | 18 | — | 18 | |||||||||||||||
Stock issued under defined contribution 401(k) retirement savings plan |
166,514 | 0 | — | — | 681 | — | 681 | |||||||||||||||
Share-based compensation |
— | — | — | — | 1,821 | — | 1,821 | |||||||||||||||
Net loss |
— | — | — | — | — | (10,499 | ) | (10,499 | ) | |||||||||||||
| | | | | | | | | | | | | | | | | | | | | | | |
BALANCE, December 31, 2013 |
14,627,990 | $ | 15 | — | $ | — | $ | 376,125 | $ | (280,810 | ) | $ | 95,330 | |||||||||
| | | | | | | | | | | | | | | | | | | | | | | |
Stock issued for restricted stock |
196,208 |
— |
— |
— |
— |
— |
— |
|||||||||||||||
Stock issued under stock option plans |
2,863 | — | — | — | 9 | — | 9 | |||||||||||||||
Stock issued under defined contribution 401(k) retirement savings plan |
17,246 | — | — | — | 163 | — | 163 | |||||||||||||||
Stock repurchases under repurchase program |
— | — | (273,937 | ) | (1,842 | ) | — | — | (1,842 | ) | ||||||||||||
Share-based compensation |
— | — | — | — | 888 | — | 888 | |||||||||||||||
Net loss |
— | — | — | — | — | (6,168 | ) | (6,168 | ) | |||||||||||||
| | | | | | | | | | | | | | | | | | | | | | | |
BALANCE, December 31, 2014 |
14,844,307 | $ | 15 | (273,937 | ) | $ | (1,842 | ) | $ | 377,185 | $ | (286,978 | ) | $ | 88,380 | |||||||
| | | | | | | | | | | | | | | | | | | | | | | |
The accompanying notes are an integral part of these consolidated financial statements.
49
BROADWIND ENERGY, INC. AND SUBSIDIARIES
CONSOLIDATED STATEMENTS OF CASH FLOWS
(In thousands)
| |
For the Years Ended December 31, |
|||||||||
|---|---|---|---|---|---|---|---|---|---|---|
| |
2014 | 2013 | 2012 | |||||||
CASH FLOWS FROM OPERATING ACTIVITIES: |
||||||||||
Net loss |
$ | (6,168 | ) | $ | (10,499 | ) | $ | (17,907 | ) | |
Loss from discontinued operations |
— | 110 | — | |||||||
| | | | | | | | | | | |
Loss from continuing operations |
(6,168 | ) | (10,389 | ) | (17,907 | ) | ||||
Adjustments to reconcile net cash used in operating activities: |
||||||||||
Depreciation and amortization expense |
12,183 | 14,856 | 16,537 | |||||||
Impairment charges |
84 | 2,365 | — | |||||||
Stock-based compensation |
886 | 1,821 | 2,833 | |||||||
Allowance for (recovery of) doubtful accounts |
65 | (436 | ) | 15 | ||||||
Common stock issued under defined contribution 401(k) plan |
163 | 681 | 523 | |||||||
(Gain) loss on disposal of assets |
(154 | ) | (3,503 | ) | 548 | |||||
Changes in operating assets and liabilities: |
||||||||||
Accounts receivable |
(1,266 | ) | 1,808 | 5,257 | ||||||
Inventories |
2,222 | (15,155 | ) | 1,367 | ||||||
Prepaid expenses and other current assets |
2,228 | 1,411 | 519 | |||||||
Accounts payable |
(8,578 | ) | 11,671 | (1,165 | ) | |||||
Accrued liabilities |
1,438 | 2,208 | 170 | |||||||
Customer deposits |
(323 | ) | 18,930 | (13,256 | ) | |||||
Other non-current assets and liabilities |
(279 | ) | (14 | ) | 1,677 | |||||
| | | | | | | | | | | |
Net cash provided by (used in) operating activities of continued operations |
2,501 | 26,254 | (2,882 | ) | ||||||
| | | | | | | | | | | |
CASH FLOWS FROM INVESTING ACTIVITIES: |
||||||||||
Proceeds from the sale of logistics business and related note receivable |
— | 250 | 375 | |||||||
Purchases of available for sale securities |
(15,088 | ) | (1,983 | ) | — | |||||
Sales of available for sale securities |
1,101 | 60 | — | |||||||
Maturities of available for sale securities |
7,106 | 780 | — | |||||||
Purchases of property and equipment |
(6,504 | ) | (6,950 | ) | (5,738 | ) | ||||
Proceeds from disposals of property and equipment |
1,065 | 13,249 | 113 | |||||||
Decrease in restricted cash |
— | 248 | 546 | |||||||
| | | | | | | | | | | |
Net cash provided (used in) by investing activities of continued operations |
(12,320 | ) | 5,654 | (4,704 | ) | |||||
| | | | | | | | | | | |
CASH FLOWS FROM FINANCING ACTIVITIES: |
||||||||||
Net proceeds from issuance of stock |
9 | 18 | — | |||||||
Proceeds used in repurchasing of common stock |
(1,842 | ) | — | — | ||||||
Payments on lines of credit and notes payable |
(16,051 | ) | (80,376 | ) | (78,785 | ) | ||||
Payments on related party notes payable |
— | — | (2,791 | ) | ||||||
Proceeds from lines of credit and notes payable |
15,850 | 75,208 | 77,620 | |||||||
Payments for debt issuance costs |
— | — | (638 | ) | ||||||
Principal payments on capital leases |
(934 | ) | (2,338 | ) | (644 | ) | ||||
| | | | | | | | | | | |
Net cash used in financing activities of continued operations |
(2,968 | ) | (7,488 | ) | (5,238 | ) | ||||
| | | | | | | | | | | |
NET INCREASE (DECREASE) IN CASH AND CASH EQUIVALENTS |
(12,787 |
) |
24,420 |
(12,824 |
) |
|||||
CASH AND CASH EQUIVALENTS, beginning of the year |
24,936 | 516 | 13,340 | |||||||
| | | | | | | | | | | |
CASH AND CASH EQUIVALENTS, end of the year |
$ | 12,149 | $ | 24,936 | $ | 516 | ||||
| | | | | | | | | | | |
| | | | | | | | | | | |
| | | | | | | | | | | |
Supplemental cash flow information: |
||||||||||
Interest paid |
$ | 601 | $ | 789 | $ | 1,503 | ||||
Income taxes paid |
$ | 62 | $ | 22 | $ | 26 | ||||
Non-cash investing and financing activities: |
||||||||||
Issuance of restricted stock grants |
$ | 661 | $ | 1,328 | $ | 1,815 | ||||
Equipment addition via capital lease |
$ | — | $ | 1,485 | $ | — | ||||
The accompanying notes are an integral part of these consolidated financial statements.
50
BROADWIND ENERGY, INC. AND SUBSIDIARIES
NOTES TO CONSOLIDATED FINANCIAL STATEMENTS
December 31, 2014, 2013, and 2012
(in
thousands, except share and per share data)
1. DESCRIPTION OF BUSINESS AND SUMMARY OF SIGNIFICANT ACCOUNTING POLICIES
Description of Business
Broadwind Energy, Inc. (the "Company") provides technologically advanced high-value products and services to energy, mining and infrastructure sector customers, primarily in the U.S. The Company's most significant presence is within the U.S. wind energy industry, although the Company has diversified into other industrial markets in order to improve its capacity utilization and reduce its exposure to uncertainty related to favorable governmental policies currently supporting the U.S. wind energy industry. The Company's product and service portfolio provides its wind energy customers, including wind turbine manufacturers, wind farm developers and wind farm operators, with access to a broad array of component and service offerings. Outside of the wind energy market, the Company provides precision gearing and specialty weldments to a broad range of industrial customers for oil and gas, mining and other industrial applications. The Company has three reportable operating segments: Towers and Weldments, Gearing, and Services.
Towers and Weldments
The Company manufactures towers for wind turbines, specifically the large and heavier wind towers that are designed for multiple megawatt ("MW") wind turbines. Production facilities, located in Manitowoc, Wisconsin and Abilene, Texas, are situated in close proximity to the primary U.S. domestic wind energy and equipment manufacturing hubs. The two facilities have a combined annual tower production capacity of up to approximately 500 towers, sufficient to support turbines generating more than 1,000 MW of power. This product segment also encompasses the manufacture of specialty fabrications and specialty weldments for mining and other industrial customers.
Gearing
The Company engineers, builds and remanufactures precision gears and gearing systems for oil and gas, wind energy, mining, steel and other industrial applications. The Company uses an integrated manufacturing process, which includes machining and finishing processes in Cicero, Illinois, and heat treatment in Neville Island, Pennsylvania.
Services
The Company offers a comprehensive range of services, primarily to wind farm developers and operators. The Company specializes in non-routine maintenance services for both kilowatt and MW wind turbines. The Company also offers comprehensive field services to the wind energy industry. The Company is increasingly focusing its efforts on the identification and/or development of product and service offerings which will improve the reliability and efficiency of wind turbines, and therefore enhance the economic benefits to its customers. The Company provides wind services across the U.S., with primary service locations in South Dakota and Texas.
Liquidity
The Company has $20,173 in cash, cash equivalents and short-term investments and $4,111 of debt and capital leases as of December 31, 2014. The Company has a limited history of operations and has
51
BROADWIND ENERGY, INC. AND SUBSIDIARIES
NOTES TO CONSOLIDATED FINANCIAL STATEMENTS (Continued)
December 31, 2014, 2013, and 2012
(in thousands, except share and per share data)
1. DESCRIPTION OF BUSINESS AND SUMMARY OF SIGNIFICANT ACCOUNTING POLICIES (Continued)
incurred operating losses since inception. The Company anticipates that current cash resources and cash to be generated from operations in 2015 will be adequate to meet the Company's liquidity needs for at least the next twelve months. As discussed further in Note 11, "Debt and Credit Agreements" of these consolidated financial statements, the Company is obligated to make principal payments on outstanding debt totaling $268 during 2015. If sales and subsequent collections from several of the Company's large customers, as well as revenues generated from new customer orders, are not materially consistent with management's plans, the Company may encounter cash flow and liquidity issues. Additional funding may not be available when needed or on terms acceptable to the Company, which could affect its overall operations. Any additional equity financing, if available, may be dilutive to stockholders, and additional debt financing, if available, will likely require financial covenants or other restrictions on the Company. There can be no assurances the Company's efforts to generate sufficient cash flow will be successful.
Summary of Significant Accounting Policies
Principles of Consolidation and Basis of Presentation
These consolidated financial statements include the accounts of the Company and entities in which it has a controlling financial interest. All significant intercompany transactions and balances have been eliminated in consolidation. The Company determines whether it has a controlling financial interest in an entity by first evaluating whether the entity is a voting interest entity or a variable interest entity ("VIE").
When the Company obtains an economic interest in an entity, the Company evaluates the entity to determine if the entity is deemed a VIE, and if the Company is deemed to be the primary beneficiary, in accordance with the accounting standard for the consolidation of VIE's. The accounting standard for the consolidation of VIE's requires the Company to qualitatively assess if the Company was the primary beneficiary of the VIE based on whether the Company had (i) the power to direct those matters that most significantly impacted the activities of the VIE and (ii) the obligation to absorb losses or the right to receive benefits of the VIE that could potentially be significant. Refer to Note 19, "New Markets Tax Credit Transaction" of these consolidated financial statements for a description of two VIE's included in the Company's consolidated financial statements.
Management's Use of Estimates
The preparation of financial statements in conformity with accounting principles generally accepted in the U.S. ("GAAP") requires management to make certain estimates and assumptions that affect the reported amounts of assets and liabilities and the disclosure of contingent liabilities as of the date of the financial statements and reported amounts of revenues and expenses during the reported period. Significant estimates, among others, include revenue recognition, future tax rates, inventory reserves, warranty reserves, impairment of property and equipment and intangibles, and allowance for doubtful accounts. Although these estimates are based upon management's best knowledge of current events and actions that the Company may undertake in the future, actual results could differ from these estimates.
52
BROADWIND ENERGY, INC. AND SUBSIDIARIES
NOTES TO CONSOLIDATED FINANCIAL STATEMENTS (Continued)
December 31, 2014, 2013, and 2012
(in thousands, except share and per share data)
1. DESCRIPTION OF BUSINESS AND SUMMARY OF SIGNIFICANT ACCOUNTING POLICIES (Continued)
Cash and Cash Equivalents and Short-Term Investments
Cash and cash equivalents typically comprise cash balances and readily marketable investments with original maturities of three months or less, such as money market funds, short-term government bonds, Treasury bills, marketable securities and commercial paper. Marketable investments with original maturities between three and twelve months are recorded as short-term investments. The Company's treasury policy is to invest excess cash in money market funds or other investments, which are generally of a short-term duration based upon operating requirements. Income earned on these investments is recorded to interest income in the Company's consolidated statements of operations. As of December 31, 2014 and December 31, 2013, cash and cash equivalents totaled $12,149 and $24,936, respectively, and short-term investments totaled $8,024 and $1,143, respectively. For the years ended December 31, 2014, 2013 and 2012, interest income was $21, $8 and $5, respectively.
Restricted Cash
Restricted cash balances relate primarily to provisions contained in certain vendor agreements. The Company anticipates that all restricted cash balances will be used for current purposes. As of December 31, 2014 and 2013, the Company had restricted cash in the amounts of $83 and $83, respectively.
Revenue Recognition
The Company recognizes revenue when the earnings process is complete and when persuasive evidence of an arrangement exists, transfer of title has occurred or services have been rendered, the selling price is fixed or determinable, collectability is reasonably assured and delivery has occurred per the terms of the contract. Customer deposits, deferred revenue and other receipts are deferred and recognized when the revenue is realized and earned. Cash payments to customers are presumed to be classified as reductions of revenue in our statement of operations.
In some instances, typically within the Company's Towers and Weldments segment, products are sold under terms included in bill and hold sales arrangements that result in different timing for revenue recognition. The Company recognizes revenue under these arrangements only when the buyer requests the arrangement, a fixed schedule for delivery exists, the ordered goods are segregated from inventory and not available to fill other orders and the goods are complete and ready for shipment. Assuming these required revenue recognition criteria are met, revenue is recognized upon completion of product manufacture and customer acceptance.
Cost of Sales
Cost of sales represents all direct and indirect costs associated with the production of products for sale to customers. These costs include operation, repair and maintenance of equipment, materials, direct and indirect labor and benefit costs, insurance, equipment rentals, freight in and depreciation. Freight out to customers is at times classified as a selling expense and is then excluded from cost of
53
BROADWIND ENERGY, INC. AND SUBSIDIARIES
NOTES TO CONSOLIDATED FINANCIAL STATEMENTS (Continued)
December 31, 2014, 2013, and 2012
(in thousands, except share and per share data)
1. DESCRIPTION OF BUSINESS AND SUMMARY OF SIGNIFICANT ACCOUNTING POLICIES (Continued)
sales. For each of the years ended December 31, 2014, 2013 and 2012, freight out included in selling, general and administrative expenses was $0.
Selling, General and Administrative Expenses
Selling, general and administrative expenses include all corporate and administrative functions such as sales and marketing, legal, human resource management, finance, investor and public relations, information technology and senior management. These functions serve to support the Company's current and future operations and provide an infrastructure to support future growth. Major expense items in this category include management and staff wages and benefits, share-based compensation and professional services.
Accounts Receivable
The Company generally grants uncollateralized credit to customers on an individual basis based upon the customer's financial condition and credit history. Credit is typically on net 30-day terms and customer deposits are frequently required at various stages of the production process to minimize credit risk.
Historically, the Company's accounts receivable ("A/R") are highly concentrated with a select number of customers. During the year ended December 31, 2014, the Company's five largest customers accounted for 87% of its consolidated revenues and 80% of outstanding A/R balances, compared to the year ended December 31, 2013 when the Company's five largest customers accounted for 83% of its consolidated revenues and 63% of its outstanding A/R balances.
Allowance for Doubtful Accounts
Based upon past experience and judgment, the Company establishes an allowance for doubtful accounts with respect to A/R. The Company's standard allowance estimation methodology considers a number of factors that, based on its collections experience, the Company believes will have an impact on its credit risk and the realizability of its A/R. These factors include individual customer circumstances, history with the Company and other relevant criteria. A/R balances that remain outstanding after the Company has exhausted reasonable collection efforts are written off through a charge to the valuation allowance and a credit to A/R.
The Company monitors its collections and write-off experience to assess whether or not adjustments to its allowance estimates are necessary. Changes in trends in any of the factors that the Company believes may impact the realizability of its A/R, as noted above, or modifications to the Company's credit standards, collection practices and other related policies may impact its allowance for doubtful accounts and its financial results. Bad debt expense for the years ended December 31, 2014, 2013 and 2012 was $81, $107 and $136, respectively.
54
BROADWIND ENERGY, INC. AND SUBSIDIARIES
NOTES TO CONSOLIDATED FINANCIAL STATEMENTS (Continued)
December 31, 2014, 2013, and 2012
(in thousands, except share and per share data)
1. DESCRIPTION OF BUSINESS AND SUMMARY OF SIGNIFICANT ACCOUNTING POLICIES (Continued)
Inventories
Inventories are stated at the lower of cost or market. Cost is determined either based on the first-in, first-out ("FIFO") method, or on a standard cost basis that approximates the FIFO method. Market is determined based on net realizable value. Any excess of cost over market value is included in the Company's inventory allowance. Market value of inventory, and management's judgment of the need for reserves, encompasses consideration of other business factors including physical condition, inventory holding period, contract terms and usefulness.
Inventories consist of raw materials, work-in-process and finished goods. Raw materials consist of components and parts for general production use. Work-in-process consists of labor and overhead, processing costs, purchased subcomponents and materials purchased for specific customer orders. Finished goods consist of components purchased from third parties as well as components manufactured by the Company that will be used to produce final customer products.
Property and Equipment
Property and equipment are stated at cost less accumulated depreciation and amortization. Depreciation and amortization of property and equipment is recognized using the straight-line method over the estimated useful lives of the related assets for financial reporting purposes, and generally an accelerated method for income tax reporting purposes. Depreciation expense and amortization related to property and equipment for the years ended December 31, 2014, 2013 and 2012 was $12,183, $12,410 and $13,919, respectively. Expenditures for additions and improvements are capitalized, while replacements, maintenance and repairs that do not improve or extend the useful lives of the respective assets are expensed as incurred. The Company has in the past capitalized interest costs incurred on indebtedness used to construct property and equipment. Capitalized interest is recorded as part of the asset to which it relates and is amortized over the asset's estimated useful life. There was no interest cost capitalized during the years ended December 31, 2014, 2013 or 2012. Property or equipment sold or disposed of is removed from the respective property accounts, with any corresponding gains and losses recorded to other income or expense in the Company's consolidated statement of operations.
Property and equipment and other long-lived assets are reviewed for impairment whenever events or circumstances indicate that carrying amounts may not be recoverable. If such events or changes in circumstances occur, the Company will recognize an impairment loss if the undiscounted future cash flows expected to be generated by the assets are less than the carrying value of the related asset. The impairment loss would adjust the asset to its fair value.
In evaluating the recoverability of long-lived assets, the Company must make assumptions regarding estimated future cash flows and other factors to determine the fair value of such assets. If the Company's fair value estimates or related assumptions change in the future, the Company may be required to record impairment charges related to property and equipment and other long-lived assets. Asset recoverability is first measured by comparing the assets' carrying amounts to their expected future undiscounted net cash flows to determine if the assets are impaired. If such assets are considered to be impaired, the impairment recognized is measured based on the amount by which the carrying amount
55
BROADWIND ENERGY, INC. AND SUBSIDIARIES
NOTES TO CONSOLIDATED FINANCIAL STATEMENTS (Continued)
December 31, 2014, 2013, and 2012
(in thousands, except share and per share data)
1. DESCRIPTION OF BUSINESS AND SUMMARY OF SIGNIFICANT ACCOUNTING POLICIES (Continued)
of the assets exceeds the fair value. To the extent the projections used in its analysis are not achieved, there may be a negative effect on the valuation of these assets.
Intangible Assets
The Company reviews intangible assets for impairment whenever events or circumstances indicate that carrying amounts may not be recoverable. If such events or changes in circumstances occur an impairment loss is recognized if the undiscounted future cash flows expected to be generated by the assets are less than the carrying value of the related asset. The impairment loss would adjust the asset to its fair value.
In evaluating the recoverability of definite-lived intangible assets, the Company must make assumptions regarding estimated future cash flows and other factors to determine the fair value of such assets. If fair value estimates or related assumptions change in the future, the Company may be required to record impairment charges related to intangible assets. Asset recoverability is first measured by comparing the assets' carrying amounts to their expected future undiscounted net cash flows to determine if the assets are impaired. If such assets are considered to be impaired, the impairment recognized is measured based on the amount by which the carrying amount of the assets exceeds the fair value. To the extent the projections used in its analysis are not achieved, there may be a negative effect on the valuation of these assets.
Warranty Liability
The Company provides warranty terms that generally range from one to five years for various products and services relating to workmanship and materials supplied by the Company. In certain contracts, the Company has recourse provisions for items that would enable the Company to pursue recovery from third parties for amounts paid to customers under warranty provisions. Warranty liability is recorded in accrued liabilities within the consolidated balance sheet. The Company estimates the warranty accrual based on various factors, including historical warranty costs, current trends, product mix and sales. The changes in the carrying amount of the Company's total product warranty liability for the years ended December 31, 2014, 2013 and 2012 were as follows:
| |
As of December 31, | |||||||||
|---|---|---|---|---|---|---|---|---|---|---|
| |
2014 | 2013 | 2012 | |||||||
Balance, beginning of year |
$ | 457 | $ | 707 | $ | 983 | ||||
Warranty expense |
955 |
(183 |
) |
52 |
||||||
Warranty claims |
(214 | ) | (67 | ) | (195 | ) | ||||
Other adjustments |
— | — | (133 | ) | ||||||
| | | | | | | | | | | |
Balance, end of year |
$ | 1,198 | $ | 457 | $ | 707 | ||||
| | | | | | | | | | | |
| | | | | | | | | | | |
| | | | | | | | | | | |
As of December 31, 2014, the increase in the warranty liabilities was due primarily to a $371 obligation to a specific customer.
56
BROADWIND ENERGY, INC. AND SUBSIDIARIES
NOTES TO CONSOLIDATED FINANCIAL STATEMENTS (Continued)
December 31, 2014, 2013, and 2012
(in thousands, except share and per share data)
1. DESCRIPTION OF BUSINESS AND SUMMARY OF SIGNIFICANT ACCOUNTING POLICIES (Continued)
Income Taxes
The Company accounts for income taxes based upon an asset and liability approach. Deferred tax assets and liabilities represent the future tax consequences of the differences between the financial statement carrying amounts of assets and liabilities versus the tax basis of assets and liabilities. Under this method, deferred tax assets are recognized for deductible temporary differences, and operating loss and tax credit carryforwards. Deferred tax liabilities are recognized for taxable temporary differences. Deferred tax assets are reduced by a valuation allowance when, in the opinion of management, it is more likely than not that some portion or all of the deferred tax assets will not be realized. The impact of tax rate changes on deferred tax assets and liabilities is recognized in the year that the change is enacted.
In connection with the preparation of its consolidated financial statements, the Company is required to estimate its income tax liability for each of the tax jurisdictions in which the Company operates. This process involves estimating the Company's actual current income tax expense and assessing temporary differences resulting from differing treatment of certain income or expense items for income tax reporting and financial reporting purposes. The Company also recognizes as deferred income tax assets the expected future income tax benefits of net operating loss ("NOL") carryforwards. In evaluating the realizability of deferred income tax assets associated with NOL carryforwards, the Company considers, among other things, expected future taxable income, the expected timing of the reversals of existing temporary reporting differences and the expected impact of tax planning strategies that may be implemented to prevent the potential loss of future income tax benefits. Changes in, among other things, income tax legislation, statutory income tax rates or future taxable income levels could materially impact the Company's valuation of income tax assets and liabilities and could cause its income tax provision to vary significantly among financial reporting periods.
The Company also accounts for the uncertainty in income taxes related to the recognition and measurement of a tax position taken or expected to be taken in an income tax return. The Company follows the applicable pronouncement guidance on derecognition, classification, interest and penalties, accounting in interim periods, disclosure and transition related to the uncertainty in these income tax positions.
Share-Based Compensation
The Company grants incentive stock options and restricted stock units to certain officers, directors, and employees. The Company accounts for share-based compensation related to these awards based on the estimated fair value of the equity award and recognizes expense ratably over the vesting term of the award. See Note 16 "Share-Based Compensation" of these consolidated financial statements for further discussion of the Company's share-based compensation plans, the nature of share-based awards issued and the Company's accounting for share-based compensation.
57
BROADWIND ENERGY, INC. AND SUBSIDIARIES
NOTES TO CONSOLIDATED FINANCIAL STATEMENTS (Continued)
December 31, 2014, 2013, and 2012
(in thousands, except share and per share data)
1. DESCRIPTION OF BUSINESS AND SUMMARY OF SIGNIFICANT ACCOUNTING POLICIES (Continued)
Net Loss Per Share
The Company presents both basic and diluted net loss per share. Basic net loss per share is based solely upon the weighted average number of common shares outstanding and excludes any dilutive effects of options, warrants and convertible securities. Diluted net loss per share is based upon the weighted average number of common shares and common-share equivalents outstanding during the year excluding those common-share equivalents where the impact to basic net loss per share would be anti-dilutive.
2. EARNINGS PER SHARE
The following table presents a reconciliation of basic and diluted earnings per share for the years ended December 31, 2014, 2013 and 2012 as follows:
| |
For the Years Ended December 31, | |||||||||
|---|---|---|---|---|---|---|---|---|---|---|
| |
2014 | 2013 | 2012 | |||||||
Basic earnings per share calculation: |
||||||||||
Net loss to common stockholders |
$ |
(6,168 |
) |
$ |
(10,499 |
) |
$ |
(17,907 |
) |
|
Weighted average common shares outstanding |
14,715 |
14,457 |
14,058 |
|||||||
Basic net loss per share |
$ | (0.42 | ) | $ | (0.73 | ) | $ | (1.27 | ) | |
Diluted earnings per share calculation: |
||||||||||
Net loss to common stockholders |
$ |
(6,168 |
) |
$ |
(10,499 |
) |
$ |
(17,907 |
) |
|
Weighted average common shares outstanding |
14,715 |
14,457 |
14,058 |
|||||||
Common stock equivalents: |
||||||||||
Stock options and non-vested stock awards(1) |
— | — | — | |||||||
| | | | | | | | | | | |
Weighted average common shares outstanding |
14,715 | 14,457 | 14,058 | |||||||
Diluted net loss per share |
$ | (0.42 | ) | $ | (0.73 | ) | $ | (1.27 | ) | |
- (1)
- Stock options and restricted stock units granted and outstanding of 673,756, 878,113 and 1,048,117 as of December 31, 2014, 2013 and 2012, respectively, are excluded from the computation of diluted earnings due to the anti-dilutive effect as a result of the Company's net loss for these respective years.
3. DISCONTINUED OPERATIONS
In December 2010, the Company's Board of Directors (the "Board") approved a plan to divest the Company's wholly-owned subsidiary Badger Transport, Inc. ("Badger"), which formerly comprised the Company's Logistics segment. In March 2011, the Company completed the sale of Badger to BTI Logistics, LLC. As a component of the proceeds from the sale, the Company received a $1,500 secured promissory note payable from the purchaser. During the first quarter of 2013, the Company recorded a $210 discontinued operations charge to adjust the net balance of the Company's note receivable down
58
BROADWIND ENERGY, INC. AND SUBSIDIARIES
NOTES TO CONSOLIDATED FINANCIAL STATEMENTS (Continued)
December 31, 2014, 2013, and 2012
(in thousands, except share and per share data)
3. DISCONTINUED OPERATIONS (Continued)
to the $150 estimated value of the Company's security interest. During the third quarter of 2013, the Company received a payment under the note in excess of the $150 net receivable recorded, and recorded a discontinued operations gain of $100 to reflect the additional amount received. There is a balance of $860 outstanding on the note receivable, all of which is considered past due. As a result of the uncertainty related to any future expected payments from the purchaser, the note was fully reserved for at December 31, 2013.
Results of operations associated with Badger, which are reflected as discontinued operations in the Company's consolidated statements of income for the twelve months ended December 31, 2014, 2013 and 2012, were as follows:
| |
For the Years Ended December 31, |
|||||||||
|---|---|---|---|---|---|---|---|---|---|---|
| |
2014 | 2013 | 2012 | |||||||
Revenues |
$ | — | $ | — | $ | — | ||||
Loss before provision (benefit) for income taxes |
— | (110 | ) | — | ||||||
Income tax provision (benefit) |
— | — | — | |||||||
| | | | | | | | | | | |
Loss from discontinued operations |
$ | — | $ | (110 | ) | $ | — | |||
| | | | | | | | | | | |
| | | | | | | | | | | |
| | | | | | | | | | | |
4. RECENT ACCOUNTING PRONOUNCEMENTS
The Company reviews new accounting standards as issued. Although some of the accounting standards issued or effective in the current fiscal year may be applicable to it, the Company believes that none of the new standards have a significant impact on its consolidated financial statements, except as discussed below. The Company is currently evaluating the impact of the new standards on its condensed consolidated financial statements.
In May 2014, the Financial Accounting Standards Board ("FASB") issued ASU 2014-09, Revenue from Contracts with Customers, which amends the guidance in former ASC Topic 605, Revenue Recognition, and provides a single, comprehensive revenue recognition model for all contracts with customers. This standard contains principles that an entity will apply to determine the measurement of revenue and timing of when it is recognized. The entity will recognize revenue to reflect the transfer of goods or services to customers at an amount that the entity expects to be entitled to in exchange for those goods or services. This pronouncement is effective for fiscal years, and interim periods within those years, beginning after December 15, 2016, and early adoption is not permitted. The Company will adopt the provisions of ASU 2014-09 for the fiscal year beginning January 1, 2017, and is currently evaluating the impact on its consolidated financial statements.
59
BROADWIND ENERGY, INC. AND SUBSIDIARIES
NOTES TO CONSOLIDATED FINANCIAL STATEMENTS (Continued)
December 31, 2014, 2013, and 2012
(in thousands, except share and per share data)
5. CASH AND CASH EQUIVALENTS AND SHORT-TERM INVESTMENTS
The components of cash and cash equivalents and short-term investments as of December 31, 2014 and December 31, 2013 are summarized as follows:
| |
As of December 31, |
||||||
|---|---|---|---|---|---|---|---|
| |
2014 | 2013 | |||||
Cash and cash equivalents: |
|||||||
Cash |
$ | 8,744 | $ | 12,021 | |||
Money market funds |
877 | 7,423 | |||||
Municipal bonds |
2,528 | 5,492 | |||||
| | | | | | | | |
Total cash and cash equivalents |
12,149 | 24,936 | |||||
| | | | | | | | |
Short-term investments (available-for-sale): |
|||||||
Municipal bonds |
8,024 | 1,143 | |||||
| | | | | | | | |
Total cash and cash equivalents and short-term investments |
20,173 | 26,079 | |||||
| | | | | | | | |
6. ALLOWANCE FOR DOUBTFUL ACCOUNTS
The activity in the A/R allowance from operations for the years ended December 31, 2014, 2013 and 2012 consists of the following:
| |
For the Years Ended December 31, |
|||||||||
|---|---|---|---|---|---|---|---|---|---|---|
| |
2014 | 2013 | 2012 | |||||||
Balance at beginning of year |
$ | 17 | $ | 453 | $ | 438 | ||||
Bad debt expense |
81 | 107 | 136 | |||||||
Write-offs |
(8 | ) | (543 | ) | (121 | ) | ||||
Other adjustments |
(8 | ) | — | — | ||||||
| | | | | | | | | | | |
Balance at end of year |
$ | 82 | $ | 17 | $ | 453 | ||||
| | | | | | | | | | | |
| | | | | | | | | | | |
| | | | | | | | | | | |
7. INVENTORIES
The components of inventories from operations as of December 31, 2014 and 2013 are summarized as follows:
| |
As of December 31, | ||||||
|---|---|---|---|---|---|---|---|
| |
2014 | 2013 | |||||
Raw materials |
$ | 21,385 | $ | 21,859 | |||
Work-in-process |
9,565 | 11,212 | |||||
Finished goods |
6,769 | 6,381 | |||||
| | | | | | | | |
|
37,719 | 39,452 | |||||
Less: Inventory Reserve |
(2,798 | ) | (2,309 | ) | |||
| | | | | | | | |
Net inventories |
$ | 34,921 | $ | 37,143 | |||
| | | | | | | | |
| | | | | | | | |
| | | | | | | | |
60
BROADWIND ENERGY, INC. AND SUBSIDIARIES
NOTES TO CONSOLIDATED FINANCIAL STATEMENTS (Continued)
December 31, 2014, 2013, and 2012
(in thousands, except share and per share data)
8. PROPERTY AND EQUIPMENT
The cost basis and estimated lives of property and equipment from continuing operations as of December 31, 2014 and 2013 are as follows:
| |
As of December 31, | |
||||||
|---|---|---|---|---|---|---|---|---|
| |
2014 | 2013 | Life | |||||
Land |
$ | 2,002 | $ | 1,838 | ||||
Buildings |
21,218 | 21,218 | 39 years | |||||
Machinery and equipment |
106,436 | 100,714 | 2-10 years | |||||
Office furniture and equipment |
3,574 | 3,194 | 3-7 years | |||||
Leasehold improvements |
9,583 | 4,540 | Asset life or life of lease | |||||
Construction in progress |
1,448 | 8,495 | ||||||
| | | | | | | | | |
|
144,261 | 139,999 | ||||||
Less-accumulated depreciation and amortization |
(81,309 | ) | (70,922 | ) | ||||
| | | | | | | | | |
|
$ | 62,952 | $ | 69,077 | ||||
| | | | | | | | | |
| | | | | | | | | |
| | | | | | | | | |
During the fourth quarter of 2014, the Company continued to experience triggering events associated with the Gearing and Services segments' current period operating losses combined with their history of continued operating losses. As a result, the Company evaluated the recoverability of certain of its long-lived assets associated with the Gearing and Services segments. Based upon the Company's assessment, the recoverable amount of undiscounted cash flows based upon the Company's most recent projections substantially exceeded the carrying amount of relevant asset groups within the Gearing and Services segments respectively, and no impairment to these assets was indicated as of December 31, 2014.
9. INTANGIBLE ASSETS
As of December 31, 2014 and 2013, the cost basis, accumulated amortization and net book value of intangible assets were as follows:
| |
December 31, 2014 | December 31, 2013 | |||||||||||||||||||||||
|---|---|---|---|---|---|---|---|---|---|---|---|---|---|---|---|---|---|---|---|---|---|---|---|---|---|
| |
Cost | Accumulated Amortization |
Net Book Value |
Weighted Average Amortization Period |
Cost | Accumulated Amortization |
Net Book Value |
Weighted Average Amortization Period |
|||||||||||||||||
Intangible assets: |
|||||||||||||||||||||||||
Customer relationships |
$ | 3,979 | $ | (3,639 | ) | $ | 340 | 7.2 | $ | 3,979 | $ | (3,595 | ) | $ | 384 | 7.2 | |||||||||
Trade names |
7,999 | (2,880 | ) | 5,119 | 20.0 | 7,999 | (2,480 | ) | 5,519 | 20.0 | |||||||||||||||
| | | | | | | | | | | | | | | | | | | | | | | | | | |
Intangible assets |
$ | 11,978 | $ | (6,519 | ) | $ | 5,459 | 15.8 | $ | 11,978 | $ | (6,075 | ) | $ | 5,903 | 15.8 | |||||||||
| | | | | | | | | | | | | | | | | | | | | | | | | | |
| | | | | | | | | | | | | | | | | | | | | | | | | | |
| | | | | | | | | | | | | | | | | | | | | | | | | | |
During the fourth quarter of 2014, the Company continued to experience a triggering event associated with the Gearing segment's current period operating loss combined with its history of continued operating losses. As a result, the Company evaluated the recoverability of certain of its intangible assets associated with the Gearing segment. Based upon the Company's assessment, the recoverable amount was substantially in excess of the carrying amount, and no impairment to these assets was indicated as of December 31, 2014.
61
BROADWIND ENERGY, INC. AND SUBSIDIARIES
NOTES TO CONSOLIDATED FINANCIAL STATEMENTS (Continued)
December 31, 2014, 2013, and 2012
(in thousands, except share and per share data)
9. INTANGIBLE ASSETS (Continued)
Intangible assets are amortized on a straight-line basis over their estimated useful lives, which range from 10 to 20 years. Amortization expense was $444, $1,552 and $1,759 for the years ended December 31, 2014, 2013 and 2012, respectively. As of December 31, 2014, estimated future amortization expense is as follows:
2015 |
$ | 444 | ||
2016 |
444 | |||
2017 |
444 | |||
2018 |
444 | |||
2019 |
444 | |||
2020 and thereafter |
3,239 | |||
| | | | | |
Total |
$ | 5,459 | ||
| | | | | |
| | | | | |
| | | | | |
10. ACCRUED LIABILITIES
Accrued liabilities as of December 31, 2014 and 2013 consisted of the following:
| |
December 31, | ||||||
|---|---|---|---|---|---|---|---|
| |
2014 | 2013 | |||||
Accrued payroll and benefits |
$ | 3,316 | $ | 5,144 | |||
Accrued property taxes |
86 | 143 | |||||
Income taxes payable |
198 | 493 | |||||
Accrued professional fees |
126 | 36 | |||||
Accrued warranty liability |
1,198 | 457 | |||||
Accrued regulatory settlement |
2,066 | — | |||||
Accrued environmental reserve |
513 | 500 | |||||
Accrued self-insurance reserve |
1,411 | 803 | |||||
Accrued other |
639 | 539 | |||||
| | | | | | | | |
Total accrued liabilities |
$ | 9,553 | $ | 8,115 | |||
| | | | | | | | |
| | | | | | | | |
| | | | | | | | |
11. DEBT AND CREDIT AGREEMENTS
The Company's outstanding debt balances as of December 31, 2014 and 2013 consisted of the following:
| |
December 31, | ||||||
|---|---|---|---|---|---|---|---|
| |
2014 | 2013 | |||||
Line of credit |
— | — | |||||
Term loans and notes payable |
2,918 | 2,956 | |||||
Less—Current portion |
(268 | ) | (201 | ) | |||
| | | | | | | | |
Long-term debt, net of current maturities |
$ | 2,650 | $ | 2,755 | |||
| | | | | | | | |
| | | | | | | | |
| | | | | | | | |
62
BROADWIND ENERGY, INC. AND SUBSIDIARIES
NOTES TO CONSOLIDATED FINANCIAL STATEMENTS (Continued)
December 31, 2014, 2013, and 2012
(in thousands, except share and per share data)
11. DEBT AND CREDIT AGREEMENTS (Continued)
As of December 31, 2014, future annual principal payments on the Company's outstanding debt obligations were as follows:
2015 |
$ | 268 | ||
2016 |
50 | |||
2017 |
— | |||
2018 |
2,600 | |||
2019 |
— | |||
2020 and thereafter |
— | |||
| | | | | |
Total |
$ | 2,918 | ||
| | | | | |
| | | | | |
| | | | | |
Credit Facilities
AloStar Credit Facility
The Credit Facility is a secured three-year-asset based revolving credit facility, pursuant to which AloStar will advance funds when requested against a borrowing base consisting of approximately 85% of the face value of eligible accounts receivable of the Company and approximately 50% of the book value of eligible inventory of the Company. Borrowings under the Credit Facility bear interest at a per annum rate equal to the one month London Interbank Offered Rate plus a margin of 4.25%, with a minimum interest rate of 5.25% per annum. The Company must also pay an unused facility fee to AloStar equal to 0.50% per annum on the unused portion of the Credit Facility along with other standard fees.
The initial term of the August 23, 2012 Loan and Security Agreement establishing the Credit Facility (the "Loan Agreement") ends on August 23, 2015. The Loan Agreement contains customary representations and warranties. It also contains a requirement that the Company, on a consolidated basis, maintain a minimum monthly fixed charge coverage ratio and minimum monthly earnings before interest, taxes, depreciation, amortization, restructuring and share-based payments ("Adjusted EBITDA"), along with other customary restrictive covenants, certain of which are subject to materiality thresholds, baskets and customary exceptions and qualifications.
The obligations under the Loan Agreement are secured by, subject to certain exclusions, (i) a first priority security interest in all of the A/R, inventory, chattel paper, payment intangibles, cash and cash equivalents and other working capital assets and stock or other equity interests in the Subsidiaries, and (ii) a first priority security interest in all of the equipment of the Company's wholly-owned subsidiary Brad Foote Gear Works, Inc. ("Brad Foote").
The Company intends to negotiate a new facility in anticipation of the scheduled expiration of this Credit Facility on August 23, 2015. As of December 31, 2014, there was no outstanding indebtedness under the Credit Facility. The Company had the ability to borrow up to $14,452 under the Credit Facility as of December 31, 2014, and the per annum interest rate would have been 5.25%. The Company was in compliance with all applicable covenants under the Loan Agreement as of December 31, 2014.
63
BROADWIND ENERGY, INC. AND SUBSIDIARIES
NOTES TO CONSOLIDATED FINANCIAL STATEMENTS (Continued)
December 31, 2014, 2013, and 2012
(in thousands, except share and per share data)
11. DEBT AND CREDIT AGREEMENTS (Continued)
Other
Included in Long Term Debt, Net of Current Maturities is $2,600 associated with the New Markets Tax Credit transaction described further in Note 19, "New Markets Tax Credit Transaction" of these condensed consolidated financial statements. Additionally, the Company has approximately $318 of other term loans outstanding.
12. LEASES
The Company leases various property and equipment under operating lease arrangements. Lease terms generally range from 3 to 15 years with renewal options for extended terms. Certain leases contain rent escalation clauses that require additional rental payments in the later years of the term. Rent expense for these types of leases is recognized on a straight-line basis over the minimum lease term. Any lease concessions received by the Company are deferred and recognized as an adjustment to rent expense ratably over the minimum lease term. The Company is required to make additional payments under certain property leases for taxes, insurance and other operating expenses incurred during the operating lease period. Rental expense for the years ended December 31, 2014, 2013 and 2012 was $3,333, $3,278 and $3,824, respectively.
In addition, the Company has entered into capital lease arrangements to finance property and equipment and assumed capital lease obligations in connection with certain acquisitions. During 2013, many of the Company's capital leases expired, resulting in a reduced number of assets subject to capital leases. The cost basis and accumulated depreciation of assets recorded under capital leases, which are included in property and equipment, are as follows as of December 31, 2014 and 2013:
| |
December 31, | ||||||
|---|---|---|---|---|---|---|---|
| |
2014 | 2013 | |||||
Cost |
$ | 2,892 | $ | 2,892 | |||
Accumulated depreciation |
(1,081 | ) | (571 | ) | |||
| | | | | | | | |
Net book value |
$ | 1,811 | $ | 2,321 | |||
| | | | | | | | |
| | | | | | | | |
| | | | | | | | |
Depreciation expense recorded in connection with assets recorded under capital leases was $362, $801 and $687 for the years ended December 31, 2014, 2013 and 2012, respectively.
64
BROADWIND ENERGY, INC. AND SUBSIDIARIES
NOTES TO CONSOLIDATED FINANCIAL STATEMENTS (Continued)
December 31, 2014, 2013, and 2012
(in thousands, except share and per share data)
12. LEASES (Continued)
As of December 31, 2014, future minimum lease payments under capital leases and operating leases are as follows:
| |
Capital Leases |
Operating Leases |
Total | |||||||
|---|---|---|---|---|---|---|---|---|---|---|
2015 |
$ | 806 | $ | 3,252 | $ | 4,058 | ||||
2016 |
435 | 3,237 | 3,672 | |||||||
2017 |
— | 3,129 | 3,129 | |||||||
2018 |
— | 2,991 | 2,991 | |||||||
2019 |
— | 2,741 | 2,741 | |||||||
2020 and thereafter |
— | 15,168 | 15,168 | |||||||
| | | | | | | | | | | |
Total |
1,241 | $ | 30,518 | $ | 31,759 | |||||
| | | | | | | | | | | |
| | | | | | | | | | | |
| | | | | | | | | | | |
Less—portion representing interest at a weighted average annual rate of 5.0% |
(48 | ) | ||||||||
| | | | | | | | | | | |
Principal |
1,193 | |||||||||
Less—current portion |
(766 | ) | ||||||||
| | | | | | | | | | | |
Capital lease obligations, noncurrent portion |
$ | 427 | ||||||||
| | | | | | | | | | | |
| | | | | | | | | | | |
| | | | | | | | | | | |
13. COMMITMENTS AND CONTINGENCIES
Legal Proceedings
From time to time, the Company is subject to legal proceedings or claims arising from its normal course of operations. The Company accrues for costs related to loss contingencies when such costs are probable and reasonably estimable. Except as otherwise noted, as of December 31, 2014, the Company is not aware of any material pending legal proceedings or threatened litigation that would have a material adverse effect on the Company's financial condition or results of operations, although no assurance can be given with respect to the ultimate outcome of pending actions. Refer to Note 22, "Legal Proceedings" of these consolidated financial statements for further discussion of legal proceedings.
Environmental Compliance and Remediation Liabilities
The Company's operations and products are subject to a variety of environmental laws and regulations in the jurisdictions in which the Company operates and sells products governing, among other things, air emissions, wastewater discharges, the use, handling and disposal of hazardous materials, soil and groundwater contamination, employee health and safety, and product content, performance and packaging. Also, certain environmental laws can impose the entire cost or a portion of the cost of investigating and cleaning up a contaminated site, regardless of fault, upon any one or more of a number of parties, including the current or previous owners or operators of the site. These environmental laws also impose liability on any person who arranges for the disposal or treatment of hazardous substances at a contaminated site. Third parties may also make claims against owners or operators of sites and users of disposal sites for personal injuries and property damage associated with releases of hazardous substances from those sites. Refer to Note 22, "Legal Proceedings" of these consolidated financial statements for further discussion of environmental compliance and remediation liabilities.
65
BROADWIND ENERGY, INC. AND SUBSIDIARIES
NOTES TO CONSOLIDATED FINANCIAL STATEMENTS (Continued)
December 31, 2014, 2013, and 2012
(in thousands, except share and per share data)
13. COMMITMENTS AND CONTINGENCIES (Continued)
In connection with the Company's restructuring initiatives, during the third quarter of 2012, the Company identified a liability associated with the planned sale of one of our gearing facilities located in Cicero, Illinois (the "Cicero Avenue Facility"). The liability is associated with environmental remediation costs that were identified while preparing the site for sale. During 2013, the Company applied for and was accepted into the Illinois Environmental Protection Agency ("IEPA") voluntary site remediation program. In the first quarter of 2014, the Company completed a comprehensive review of remedial options for the Cicero Avenue Facility and selected a preferred remediation technology. As part of the voluntary site remediation program, the Company has submitted a plan to the IEPA for approval to conduct a pilot study to test the effectiveness of the selected remediation technology. On July 23, 2014, the Company received comments from the IEPA on the proposed site remediation plan. The Company has provided additional information to the IEPA in response to those questions, but no change to the remediation plan or the financial reserve is needed at this time. The Company will continue to reevaluate its reserve balance associated with this matter as it gathers additional information. As of December 31, 2014, the accrual balance associated with this matter totaled $513.
Collateral
In select instances, the Company has pledged specific inventory and machinery and equipment assets to serve as collateral on related payable or financing obligations.
Warranty Liability
The Company provides warranty terms that generally range from one to five years for various products and services relating to workmanship and materials supplied by the Company. In certain contracts, the Company has recourse provisions for items that would enable the Company to pursue recovery from third parties for amounts paid to customers under warranty provisions.
Liquidated Damages
In certain customer contracts, the Company has agreed to pay liquidated damages in the event of qualifying delivery or production delays. These damages are typically limited to a specific percentage of the value of the product in question and dependent on actual losses sustained by the customer. When the damages are determined to be probable and estimable, the damages are recorded as a reduction to revenue. During 2014, the Company incurred $1,200 of liquidated damages. There was no reserve for liquidated damages as of December 31, 2014.
Workers' Compensation Reserves
At the beginning of the third quarter of 2013, the Company began to self-insure for its workers' compensation liabilities, including reserves for self-retained losses. Historical loss experience combined with actuarial evaluation methods and the application of risk transfer programs are used to determine required workers' compensation reserves. The Company takes into account claims incurred but not reported when determining its workers' compensation reserves. Although the ultimate outcome of these matters may exceed the amounts recorded and additional losses may be incurred, the Company does
66
BROADWIND ENERGY, INC. AND SUBSIDIARIES
NOTES TO CONSOLIDATED FINANCIAL STATEMENTS (Continued)
December 31, 2014, 2013, and 2012
(in thousands, except share and per share data)
13. COMMITMENTS AND CONTINGENCIES (Continued)
not believe that any additional potential exposure for such liabilities will have a material adverse effect on the Company's consolidated financial position or results of operations. As of December 31, 2014, the Company had $1,411 accrued for self-insured workers' compensation.
Other
As of December 31, 2014, approximately 15% of the Company's employees were covered by two collective bargaining agreements with local unions at the Company's Cicero, Illinois and Neville Island, Pennsylvania locations. The current collective bargaining agreement with the Cicero union is expected to remain in effect through February 2018. The current collective bargaining agreement with the Neville Island union is expected to remain in effect through October 2017.
See Note 19, "New Markets Tax Credit Transaction" of these consolidated financial statements related to a strategic financing transaction (the "NMTC Transaction") relating to the Company's drivetrain service center in Abilene, Texas (the "Abilene Gearbox Facility"), which is focused on servicing the growing installed base of MW wind turbines as they come off warranty and, to a limited extent, industrial gearboxes requiring precision repair and testing. Pursuant to the NMTC Transaction, the gross loan and investment in the Abilene Gearbox Facility of $10,000 is expected to generate $3,900 in tax credits over a period of seven years, which the NMTC Transaction makes available to Capital One, National Association ("Capital One"). The Abilene Gearbox Facility must operate and be in compliance with the terms and conditions of the NMTC Transaction during the seven year compliance period, or the Company may be liable for the recapture of $3,900 in tax credits to which Capital One is otherwise entitled. The Company does not anticipate any credit recaptures will be required in connection with the NMTC Transaction.
14. FAIR VALUE MEASUREMENTS
The Company measures its financial assets and liabilities at fair value. Fair value is defined as the price that would be received to sell an asset or paid to transfer a liability (i.e., exit price) in an orderly transaction between market participants at the measurement date. Additionally, the Company is required to provide disclosure and categorize assets and liabilities measured at fair value into one of three different levels depending on the assumptions (i.e., inputs) used in the valuation. Level 1 provides the most reliable measure of fair value while Level 3 generally requires significant management judgment. Financial assets and liabilities are classified in their entirety based on the lowest level of input significant to the fair value measurement. Financial instruments are assessed quarterly to determine the appropriate classification within the fair value hierarchy. Transfers between fair value classifications are made based upon the nature and type of the observable inputs. The fair value hierarchy is defined as follows:
Level 1—Valuations are based on unadjusted quoted prices in active markets for identical assets or liabilities.
Level 2—Valuations are based on quoted prices for similar assets or liabilities in active markets, or quoted prices in markets that are not active for which significant inputs are observable, either directly or indirectly. For the Company's municipal bonds and money market funds, although quoted prices are available and used to value said assets, they are traded less frequently.
67
BROADWIND ENERGY, INC. AND SUBSIDIARIES
NOTES TO CONSOLIDATED FINANCIAL STATEMENTS (Continued)
December 31, 2014, 2013, and 2012
(in thousands, except share and per share data)
14. FAIR VALUE MEASUREMENTS (Continued)
Level 3—Valuations are based on prices or valuation techniques that require inputs that are both unobservable and significant to the overall fair value measurement. Inputs reflect management's best estimate of what market participants would use in valuing the asset or liability at the measurement date. The Company used market negotiations to value its Gearing assets. The Company used real estate appraisals to value its Clintonville, Wisconsin facility (the "Clintonville Facility").
The following table represents the Company's assets measured at fair values as of December 31, 2014 and 2013:
| |
December 31, 2014 | ||||||||||||
|---|---|---|---|---|---|---|---|---|---|---|---|---|---|
| |
Level 1 | Level 2 | Level 3 | Total | |||||||||
Assets measured on a recurring basis: |
|||||||||||||
Municipal bonds and money market funds |
$ | — | $ | 11,429 | $ | — | $ | 11,429 | |||||
Assets measured on a nonrecurring basis: |
|||||||||||||
Clintonville, WI facility |
— | — | 738 | 738 | |||||||||
Gearing Cicero Ave. facility |
— | — | 560 | 560 | |||||||||
| | | | | | | | | | | | | | |
Total assets at fair value |
$ | — | $ | 11,429 | $ | 1,298 | $ | 12,727 | |||||
| | | | | | | | | | | | | | |
| | | | | | | | | | | | | | |
| | | | | | | | | | | | | | |
| |
December 31, 2013 | ||||||||||||
|---|---|---|---|---|---|---|---|---|---|---|---|---|---|
| |
Level 1 | Level 2 | Level 3 | Total | |||||||||
Assets measured on a recurring basis: |
|||||||||||||
Municipal bonds and money market funds |
$ | — | $ | 14,058 | $ | — | $ | 14,058 | |||||
Assets measured on a nonrecurring basis: |
|||||||||||||
Gearing equipment |
— | — | 1,149 | 1,149 | |||||||||
Clintonville, WI facility |
— | — | 821 | 821 | |||||||||
Gearing Cicero Ave. facility |
— | — | 560 | 560 | |||||||||
| | | | | | | | | | | | | | |
Total assets at fair value |
$ | — | $ | 14,058 | $ | 2,530 | $ | 16,588 | |||||
| | | | | | | | | | | | | | |
| | | | | | | | | | | | | | |
| | | | | | | | | | | | | | |
Fair value of financial instruments
The carrying amounts of the Company's financial instruments, which include cash and cash equivalents, restricted cash, short-term investments, A/R, A/P and customer deposits, approximate their respective fair values due to the relatively short-term nature of these instruments. Based upon interest rates currently available to the Company for debt with similar terms, the carrying value of the Company's long-term debt is approximately equal to its fair value.
Assets measured at fair value on a nonrecurring basis
The fair value measurement approach for long-lived assets utilizes a number of significant unobservable inputs or Level 3 assumptions. These assumptions include, among others, projections of the Company's future operating results, the implied fair value of these assets using an income approach by preparing a discounted cash flow analysis and a market-based approach based on the Company's market capitalization, and other subjective assumptions. To the extent projections used in the Company's evaluations are not achieved, there may be a negative effect on the valuation of these assets.
68
BROADWIND ENERGY, INC. AND SUBSIDIARIES
NOTES TO CONSOLIDATED FINANCIAL STATEMENTS (Continued)
December 31, 2014, 2013, and 2012
(in thousands, except share and per share data)
14. FAIR VALUE MEASUREMENTS (Continued)
Due to the Company's operating losses in 2014 combined with its history of continued operating losses, the Company continues to evaluate the recoverability of certain of its identifiable intangible assets and certain property and equipment assets. Based upon the Company's December 31, 2014 assessment, the recoverable amount of undiscounted cash flows based upon the Company's most recent projections substantially exceeded the carrying amount for the Gearing and Services segments, respectively, and no impairment to these assets was indicated.
During the first half of 2013, the Company took a $288 charge to adjust the carrying value of the Clintonville Facility assets to fair value, and reclassified the resulting carrying value from property and equipment to Assets Held for Sale. This treatment was due to the decision to list the Clintonville Facility for sale as a result of management's determination that the Clintonville Facility was no longer required in the Company's operations. The Company also took a $345 charge to adjust the carrying value of certain Gearing equipment to fair value, and reclassified the resulting carrying value to Assets Held for Sale as a result of a decision to sell this equipment. Additionally, during the fourth quarter of 2013, the Company recorded a $1,732 charge to adjust the carrying value of the Cicero Avenue Facility's land and building down to fair value. This treatment was in response to the Cicero Avenue Facility being taken substantially offline in conjunction with the Company's plant consolidation initiative. As the Cicero Avenue Facility is not immediately available for sale, it has not been classified as Assets Held for Sale. The three aforementioned impairment charges were recorded as Restructuring expenses within the Statement of Operations. The Clintonville Facility remains as Assets Held For Sale as of December 31, 2014 and due to depressed commercial real estate values, the Company has recorded an additional impairment of $83 in 2014 to value the property at its fair value.
15. INCOME TAXES
The provision for income taxes for the years ended December 31, 2014, 2013 and 2012 consists of the following:
| |
For the Years Ended December 31, |
|||||||||
|---|---|---|---|---|---|---|---|---|---|---|
| |
2014 | 2013 | 2012 | |||||||
Current provision |
||||||||||
Federal |
$ | — | $ | — | $ | — | ||||
Foreign |
— | — | — | |||||||
State |
(232 | ) | 72 | 26 | ||||||
| | | | | | | | | | | |
Total current (benefit) provision |
(232 | ) | 72 | 26 | ||||||
| | | | | | | | | | | |
Deferred credit |
||||||||||
Federal |
(278 | ) | (2,844 | ) | (5,882 | ) | ||||
State |
1,300 | (585 | ) | (386 | ) | |||||
| | | | | | | | | | | |
Total deferred credit |
1,022 | (3,429 | ) | (6,268 | ) | |||||
| | | | | | | | | | | |
Increase in deferred tax valuation allowance |
(1,022 | ) | 3,429 | 6,268 | ||||||
| | | | | | | | | | | |
Total provision (benefit) for income taxes |
$ | (232 | ) | $ | 72 | $ | 26 | |||
| | | | | | | | | | | |
| | | | | | | | | | | |
| | | | | | | | | | | |
69
BROADWIND ENERGY, INC. AND SUBSIDIARIES
NOTES TO CONSOLIDATED FINANCIAL STATEMENTS (Continued)
December 31, 2014, 2013, and 2012
(in thousands, except share and per share data)
15. INCOME TAXES (Continued)
The (decrease) increase in the deferred tax valuation allowance was ($1,022), $3,429 and $6,268 for the years ended December 31, 2014, 2013 and 2012, respectively. The changes in the deferred tax valuation allowances in 2014, 2013 and 2012 were primarily the result of (decreases) increases to the deferred tax assets pertaining to federal and state NOLs.
The tax effects of the temporary differences and NOLs that give rise to significant portions of deferred tax assets and liabilities are as follows:
| |
As of December 31, | ||||||
|---|---|---|---|---|---|---|---|
| |
2014 | 2013 | |||||
Current deferred income tax assets: |
|||||||
Accrual and reserves |
$ | 5,607 | $ | 5,231 | |||
| | | | | | | | |
Total current deferred tax assets |
5,607 | 5,231 | |||||
Valuation allowance |
(5,607 | ) | (5,231 | ) | |||
| | | | | | | | |
Current deferred tax assets, net of valuation allowance |
— | — | |||||
Noncurrent deferred income tax assets: |
|||||||
Net operating loss carryforwards |
$ | 68,685 | $ | 66,905 | |||
Intangible assets |
26,315 | 30,445 | |||||
Other |
87 | 182 | |||||
| | | | | | | | |
Total noncurrent deferred tax assets |
95,087 | 97,532 | |||||
Valuation allowance |
(94,161 | ) | (95,559 | ) | |||
| | | | | | | | |
Noncurrent deferred tax assets, net of valuation allowance |
926 | 1,973 | |||||
Noncurrent deferred income tax liabilities: |
|||||||
Fixed assets |
$ | (926 | ) | $ | (1,973 | ) | |
Intangible assets |
— | — | |||||
| | | | | | | | |
Total noncurrent deferred tax liabilities |
(926 | ) | (1,973 | ) | |||
| | | | | | | | |
Net deferred income tax liability |
$ | — | $ | — | |||
| | | | | | | | |
| | | | | | | | |
| | | | | | | | |
Valuation allowances of $99,768 and $100,790 have been provided for deferred income tax assets for which realization is uncertain as of December 31, 2014 and 2013, respectively. A reconciliation of the beginning and ending amounts of the valuation is as follows:
Valuation allowance as of December 31, 2013 |
$ | (100,790 | ) | |
Gross increase for current year activity |
1,022 | |||
| | | | | |
Valuation allowance as of December 31, 2014 |
$ | (99,768 | ) | |
| | | | | |
| | | | | |
| | | | | |
As of December 31, 2014, the Company had federal NOL carryforwards of approximately $173,823 expiring in various years through 2034. The majority of the NOL carryforwards will expire in various years from 2028 through 2034.
70
BROADWIND ENERGY, INC. AND SUBSIDIARIES
NOTES TO CONSOLIDATED FINANCIAL STATEMENTS (Continued)
December 31, 2014, 2013, and 2012
(in thousands, except share and per share data)
15. INCOME TAXES (Continued)
As of December 31, 2014, the Company had unapportioned state NOLs in the aggregate of approximately $173,823, expiring in various years from 2021 through 2034, based upon various NOL carryforward periods as designated by the different taxing jurisdictions.
The reconciliation between the statutory U.S. federal income tax rate and the Company's effective income tax rate is as follows:
| |
For the Year Ended December 31, |
|||||||||
|---|---|---|---|---|---|---|---|---|---|---|
| |
2014 | 2013 | 2012 | |||||||
Statutory U.S. federal income tax rate |
34.0 | % | 34.0 | % | 34.0 | % | ||||
State and local income taxes, net of federal income tax benefit |
1.5 | 3.4 | 1.3 | |||||||
Permanent differences |
(9.8 | ) | (6.0 | ) | (1.3 | ) | ||||
Change in valuation allowance |
(24.5 | ) | (31.9 | ) | (34.1 | ) | ||||
Change in uncertain tax positions |
2.7 | (0.3 | ) | (0.1 | ) | |||||
Other |
(0.3 | ) | 0.1 | 0.1 | ||||||
| | | | | | | | | | | |
Effective income tax rate |
3.6 | % | (0.7 | )% | (0.1 | )% | ||||
| | | | | | | | | | | |
| | | | | | | | | | | |
| | | | | | | | | | | |
The Company accounts for the uncertainty in income taxes by prescribing a minimum recognition threshold for a tax position taken, or expected to be taken, in a tax return that is required to be met before being recognized in the financial statements. The changes in the Company's uncertain income tax positions for the years ended December 31, 2014 and 2013 consisted of the following:
| |
For the Year Ended December 31, |
||||||
|---|---|---|---|---|---|---|---|
| |
2014 | 2013 | |||||
Beginning balance |
$ | 286 | $ | 286 | |||
Tax positions related to current year: |
|||||||
Additions |
— | — | |||||
Reductions |
— | — | |||||
| | | | | | | | |
|
— | — | |||||
Tax positions related to prior years: |
|||||||
Additions |
— | — | |||||
Reductions |
— | — | |||||
Settlements |
(192 | ) | — | ||||
Lapses in statutes of limitations |
(13 | ) | — | ||||
Additions from current year acquisitions |
— | — | |||||
| | | | | | | | |
|
(205 | ) | — | ||||
| | | | | | | | |
Ending balance |
$ | 81 | $ | 286 | |||
| | | | | | | | |
| | | | | | | | |
| | | | | | | | |
71
BROADWIND ENERGY, INC. AND SUBSIDIARIES
NOTES TO CONSOLIDATED FINANCIAL STATEMENTS (Continued)
December 31, 2014, 2013, and 2012
(in thousands, except share and per share data)
15. INCOME TAXES (Continued)
The amount of unrecognized tax benefits at December 31, 2014 that would affect the effective tax rate if the tax benefits were recognized was $131.
It is the Company's policy to include interest and penalties in tax expense. During the years ended December 31, 2014 and 2013, the Company recognized and accrued approximately $16 and $41, respectively, of interest and penalties.
The Company files income tax returns in the U.S. federal and state jurisdictions. As of December 31, 2014, open tax years in the federal and some state jurisdictions date back to 1996 due to the taxing authorities' ability to adjust NOL carryforwards. The Company's 2008 and 2009 federal tax returns were examined in 2011 and no material adjustments were identified related to any of the Company's tax positions. Although these periods have been audited, they continue to remain open until all NOLs generated in those tax years have either been utilized or expire.
Section 382 of the Internal Revenue Code of 1986, as amended (the "IRC"), generally imposes an annual limitation on the amount of NOL carryforwards and associated built-in losses that may be used to offset taxable income when a corporation has undergone certain changes in stock ownership. The Company's ability to utilize NOL carryforwards and built-in losses may be limited, under this section or otherwise, by the Company's issuance of common stock or by other changes in stock ownership. Upon completion of the Company's analysis of IRC Section 382, the Company has determined that aggregate changes in stock ownership have triggered an annual limitation on NOL and built-in losses available for utilization. To the extent the Company's use of NOL carryforwards and associated built-in losses is significantly limited in the future due to additional changes in stock ownership, the Company's income could be subject to U.S. corporate income tax earlier than it would if the Company were able to use NOL carryforwards and built-in losses without such annual limitation, which could result in lower profits and the loss of benefits from these attributes.
The Company announced on February 13, 2013, that its Board had adopted a Stockholder Rights Plan (the "Rights Plan") for a three year period designed to preserve the Company's substantial tax assets associated with NOL carryforwards under IRC Section 382. The Rights Plan is intended to act as a deterrent to any person or group, together with its affiliates and associates, being or becoming the beneficial owner of 4.9% or more of the Company's common stock and thereby triggering a further limitation of the Company's available NOL carryforwards. In connection with the adoption of the Rights Plan, the Board declared a non-taxable dividend of one preferred share purchase right (a "Right") for each outstanding share of the Company's common stock to the Company's stockholders of record as of the close of business on February 22, 2013. Each Right entitles its holder to purchase from the Company one-thousandth of a share of the Company's Series A Junior Participating Preferred Stock at an exercise price of $14.00 per Right, subject to adjustment. As a result of the Rights Plan, any person or group that acquires beneficial ownership of 4.9% or more of the Company's common stock without the approval of the Board would be subject to significant dilution in the ownership interest of that person or group. Stockholders who owned 4.9% or more of the outstanding shares of the Company's common stock as of February 12, 2013 will not trigger the preferred share purchase rights unless they acquire additional shares. The Rights Plan was subsequently approved by the Company's stockholders at the Company's 2013 Annual Meeting of Stockholders.
72
BROADWIND ENERGY, INC. AND SUBSIDIARIES
NOTES TO CONSOLIDATED FINANCIAL STATEMENTS (Continued)
December 31, 2014, 2013, and 2012
(in thousands, except share and per share data)
15. INCOME TAXES (Continued)
As of December 31, 2014, the Company had $199 of unrecognized tax benefits, all of which would have a favorable impact on income tax expense. It is reasonably possible that unrecognized tax benefits will decrease by up to approximately $63 as a result of the expiration of the applicable statutes of limitations within the next twelve months. The Company recognizes interest and penalties related to uncertain tax positions as income tax expense. The Company had accrued interest and penalties of $118 as of December 31, 2014. As of December 31, 2013, the Company had unrecognized tax benefits of $495, of which $209 represented accrued interest and penalties.
16. SHARE-BASED COMPENSATION
Overview of Share-Based Compensation Plan
2007 Equity Incentive Plan
The Company has granted incentive stock options and other equity awards pursuant to the Amended and Restated Broadwind Energy, Inc. 2007 Equity Incentive Plan (the "2007 EIP"), which was approved by the Board in October 2007 and by the Company's stockholders in June 2008. The 2007 EIP has been amended periodically since its original approval.
The 2007 EIP reserved 691,051 shares of the Company's common stock for grants to officers, directors, employees, consultants and advisors upon whose efforts the success of the Company and its affiliates depends to a large degree. As of December 31, 2014, the Company had reserved 57,783 shares for issuance upon the exercise of stock options outstanding and 14,822 shares for issuance upon the vesting of restricted stock unit ("RSU") awards outstanding. As of December 31, 2014, 244,334 shares of common stock reserved for stock options and RSU awards under the 2007 EIP have been issued in the form of common stock.
2012 Equity Incentive Plan
On March 8, 2012, the Board approved the Broadwind Energy, Inc. 2012 Equity Incentive Plan (the "2012 EIP;" together with the 2007 EIP, the "Equity Incentive Plans"), and at the Company's Annual Meeting of Stockholders on May 4, 2012, the Company's stockholders approved the adoption of the 2012 EIP. The purposes of the 2012 EIP are (i) to align the interests of the Company's stockholders and recipients of awards under the 2012 EIP by increasing the proprietary interest of such recipients in the Company's growth and success; (ii) to advance the interests of the Company by attracting and retaining officers, other employees, non-employee directors and independent contractors; and (iii) to motivate such persons to act in the long-term best interests of the Company and its stockholders. Under the 2012 EIP, the Company may grant (i) non-qualified stock options; (ii) "incentive stock options" (within the meaning of IRC Section 422); (iii) stock appreciation rights; (iv) restricted stock and RSUs; and (v) performance awards.
The 2012 EIP reserves 1,200,000 shares of the Company's common stock for grants to officers, directors, employees, consultants and advisors upon whose efforts the success of the Company and its affiliates will depend to a large degree. As of December 31, 2014, the Company had reserved 100,935 shares for issuance upon the exercise of stock options outstanding and 500,216 shares for issuance upon
73
BROADWIND ENERGY, INC. AND SUBSIDIARIES
NOTES TO CONSOLIDATED FINANCIAL STATEMENTS (Continued)
December 31, 2014, 2013, and 2012
(in thousands, except share and per share data)
16. SHARE-BASED COMPENSATION (Continued)
the vesting of RSU awards outstanding. As of December 31, 2014, 309,079 shares of common stock reserved for stock options and RSU awards under the 2012 EIP have been issued in the form of common stock.
Stock Options. The exercise price of stock options granted under the Equity Incentive Plans is equal to the closing price of the Company's common stock on the date of grant. Stock options generally become exercisable on the anniversary of the grant date, with vesting terms that may range from one to five years from the date of grant. Additionally, stock options expire ten years after the date of grant. The fair value of stock options granted is expensed ratably over their vesting term.
Restricted Stock Units (RSUs). The granting of RSUs is provided for under the Equity Incentive Plans. RSUs generally vest on the anniversary of the grant date, with vesting terms that may range from one to five years from the date of grant. The fair value of each RSU granted is equal to the closing price of the Company's common stock on the date of grant and is generally expensed ratably over the vesting term of the RSU award.
Stock option activity during the years ended December 31, 2014, 2013 and 2012 under the Equity Incentive Plans was as follows:
| |
Options | Weighted Average Exercise Price |
Weighted Average Remaining Contractual Term |
Aggregate Intrinsic Value (in thousands) |
|||||||||
|---|---|---|---|---|---|---|---|---|---|---|---|---|---|
Outstanding as of December 31, 2011 |
127,505 | $ | 60.10 | ||||||||||
| | | | | | | | | | | | | | |
Granted |
164,997 | 3.39 | |||||||||||
Exercised |
— | — | |||||||||||
Forfeited |
(6,047 | ) | 89.61 | ||||||||||
Cancelled |
— | — | |||||||||||
| | | | | | | | | | | | | | |
Outstanding as of December 31, 2012 |
286,455 | $ | 26.80 | ||||||||||
| | | | | | | | | | | | | | |
Granted |
— | — | |||||||||||
Exercised |
(5,400 | ) | |||||||||||
Forfeited |
(59,241 | ) | 12.81 | ||||||||||
Cancelled |
(14,039 | ) | 103.43 | ||||||||||
| | | | | | | | | | | | | | |
Outstanding as of December 31, 2013 |
207,775 | $ | 26.22 | ||||||||||
| | | | | | | | | | | | | | |
Granted |
— | — | |||||||||||
Exercised |
(2,863 | ) | 3.39 | ||||||||||
Forfeited |
(9,624 | ) | 5.12 | ||||||||||
Cancelled |
(36,570 | ) | 75.12 | ||||||||||
| | | | | | | | | | | | | | |
Outstanding as of December 31, 2014 |
158,718 | $ | 16.64 | 6.62 | $ | 201 | |||||||
| | | | | | | | | | | | | | |
Exercisable as of December 31, 2014 |
104,083 | $ | 23.19 | 6.28 | $ | 101 | |||||||
| | | | | | | | | | | | | | |
| | | | | | | | | | | | | | |
| | | | | | | | | | | | | | |
74
BROADWIND ENERGY, INC. AND SUBSIDIARIES
NOTES TO CONSOLIDATED FINANCIAL STATEMENTS (Continued)
December 31, 2014, 2013, and 2012
(in thousands, except share and per share data)
16. SHARE-BASED COMPENSATION (Continued)
The following table summarizes information with respect to all outstanding and exercisable stock options under the Equity Incentive Plans as of December 31, 2014:
| |
Options Outstanding | Options Exercisable | |||||||||||||
|---|---|---|---|---|---|---|---|---|---|---|---|---|---|---|---|
Exercise Price or Range
|
Number of options outstanding |
Weighted Average Exercise Price |
Weighted Average Remaining Contractual Term |
Number Exercisable |
Weighted Average Exercise Price |
||||||||||
$3.40 - $13.50 |
115,845 | $ | 4.69 | 7.2 years | 61,648 | $ | 5.23 | ||||||||
$14.20 - $54.40 |
29,073 | 24.26 | 5.8 years | 28,635 | 24.40 | ||||||||||
$80.00 - $128.50 |
13,800 | 100.92 | 3.5 years | 13,800 | 100.92 | ||||||||||
| | | | | | | | | | | | | | | | |
|
158,718 | $ | 16.64 | 6.6 years | 104,083 | $ | 23.19 | ||||||||
| | | | | | | | | | | | | | | | |
| | | | | | | | | | | | | | | | |
| | | | | | | | | | | | | | | | |
The following table summarizes information with respect to outstanding RSU's as of December 31, 2014, 2013 and 2012:
| |
Number of Shares | Weighted Average Grant-Date Fair Value Per Share |
|||||
|---|---|---|---|---|---|---|---|
Outstanding as of December 31, 2011 |
364,600 | $ | 13.16 | ||||
| | | | | | | | |
Granted |
515,070 | $ | 3.08 | ||||
Vested |
(50,549 | ) | $ | 21.72 | |||
Forfeited |
(67,459 | ) | $ | 10.48 | |||
| | | | | | | | |
Outstanding as of December 31, 2012 |
761,662 | $ | 6.01 | ||||
| | | | | | | | |
| | | | | | | | |
| | | | | | | | |
Granted |
463,218 | $ | 3.68 | ||||
Vested |
(326,643 | ) | $ | 6.60 | |||
Forfeited |
(227,899 | ) | $ | 4.72 | |||
| | | | | | | | |
Outstanding as of December 31, 2013 |
670,338 | $ | 4.47 | ||||
| | | | | | | | |
| | | | | | | | |
| | | | | | | | |
Granted |
198,541 | $ | 9.15 | ||||
Vested |
(279,415 | ) | $ | 5.10 | |||
Forfeited |
(74,426 | ) | $ | 5.51 | |||
| | | | | | | | |
Outstanding as of December 31, 2014 |
515,038 | $ | 5.78 | ||||
| | | | | | | | |
| | | | | | | | |
| | | | | | | | |
The fair value of each stock option award is estimated on the date of grant using the Black-Scholes option pricing model. The determination of the fair value of each stock option is affected by the Company's stock price on the date of grant, as well as assumptions regarding a number of highly complex and subjective variables. These variables include, but are not limited to, the Company's expected stock price volatility over the expected life of the awards and actual and projected stock option exercise behavior. There were no stock options granted during the twelve months ended December 31, 2014.
75
BROADWIND ENERGY, INC. AND SUBSIDIARIES
NOTES TO CONSOLIDATED FINANCIAL STATEMENTS (Continued)
December 31, 2014, 2013, and 2012
(in thousands, except share and per share data)
16. SHARE-BASED COMPENSATION (Continued)
During the years ended December 31, 2014, 2013 and 2012, the Company utilized a forfeiture rate of 25% for estimating the forfeitures of stock compensation granted.
The following table summarizes share-based compensation expense, net of taxes withheld, included in the Company's consolidated statements of operations for the years ended December 31, 2014, 2013 and 2012 as follows:
| |
For the Years Ended December 31, |
|||||||||
|---|---|---|---|---|---|---|---|---|---|---|
| |
2014 | 2013 | 2012 | |||||||
Share-based compensation expense : |
||||||||||
Cost of sales |
$ | 159 | $ | 228 | $ | — | ||||
Selling, general and administrative |
728 | 1,593 | 2,833 | |||||||
Income tax benefit(1) |
— | — | — | |||||||
| | | | | | | | | | | |
Net effect of share-based compensation expense on net loss |
$ | 887 | $ | 1,821 | $ | 2,833 | ||||
| | | | | | | | | | | |
| | | | | | | | | | | |
| | | | | | | | | | | |
Reduction in earnings per share: |
||||||||||
Basic and diluted earnings per share(2) |
$ | 0.06 | $ | 0.13 | $ | 0.20 | ||||
- (1)
- Income
tax benefit is not illustrated because the Company is currently operating at a loss and an actual income tax benefit was not realized for the years
ended December 31, 2014, 2013 and 2012. The result of the loss situation creates a timing difference, resulting in a deferred tax asset, which is fully reserved for in the valuation allowance.
- (2)
- Diluted earnings per share for the years ended December 31, 2014, 2013 and 2012 does not include common stock equivalents due to their anti-dilutive nature as a result of the Company's net losses for these respective periods. Accordingly, basic earnings per share and diluted earnings per share are identical for all periods presented.
As of December 31, 2014, the Company estimates that pre-tax compensation expense for all unvested share-based awards, including both stock options and RSUs, in the amount of approximately $2,055 will be recognized through the year 2017. The Company expects to satisfy the exercise of stock options and future distribution of shares of restricted stock by issuing new shares of common stock.
17. SEGMENT REPORTING
The Company is organized into reporting segments based on the nature of the products and services offered and business activities from which it earns revenues and incurs expenses for which discrete financial information is available and regularly reviewed by the Company's chief operating
76
BROADWIND ENERGY, INC. AND SUBSIDIARIES
NOTES TO CONSOLIDATED FINANCIAL STATEMENTS (Continued)
December 31, 2014, 2013, and 2012
(in thousands, except share and per share data)
17. SEGMENT REPORTING (Continued)
decision maker. The Company's segments and their product and service offerings are summarized below:
Towers and Weldments
The Company manufactures towers for wind turbines, specifically the large and heavier wind towers that are designed for multiple MW wind turbines. Production facilities, located in Manitowoc, Wisconsin and Abilene, Texas, are situated in close proximity to the primary U.S. domestic wind energy and equipment manufacturing hubs. The two facilities have a combined annual tower production capacity of up to approximately 500 towers, sufficient to support turbines generating more than 1,000 MW of power. This product segment also encompasses the manufacture of specialty weldments for mining and other industrial customers.
Gearing
The Company engineers, builds and remanufactures precision gears and gearing systems for oil and gas, wind, mining, steel and other industrial applications. The Company uses an integrated manufacturing process, which includes machining and finishing processes in Cicero, Illinois, and heat treatment in Neville Island, Pennsylvania.
Services
The Company offers a comprehensive range of services, primarily to wind farm developers and operators. The Company specializes in non-routine maintenance services for both kilowatt and MW turbines. The Company also offers comprehensive field services to the wind energy industry. The Company is increasingly focusing its efforts on the identification and/or development of product and service offerings which will improve the reliability and efficiency of wind turbines, and therefore enhance the economic benefits to its customers. The Company provides wind services across the U.S., with primary service locations in South Dakota and Texas. The Company operates drivetrain service centers in these two locations, focused on servicing the growing installed base of MW wind turbines as they come off warranty and, to a limited extent, industrial gearboxes requiring precision repair and testing.
Corporate and Other
"Corporate" includes the assets and selling, general and administrative expenses of the Company's corporate office. "Eliminations" comprises adjustments to reconcile segment results to consolidated results.
77
BROADWIND ENERGY, INC. AND SUBSIDIARIES
NOTES TO CONSOLIDATED FINANCIAL STATEMENTS (Continued)
December 31, 2014, 2013, and 2012
(in thousands, except share and per share data)
17. SEGMENT REPORTING (Continued)
The accounting policies of the reportable segments are the same as those referenced in Note 1, "Description of Business and Summary of Significant Accounting Policies" of these consolidated financial statements. Summary financial information by reportable segment is as follows:
| |
Towers and Weldments |
Gearing | Services | Corporate | Eliminations | Consolidated | |||||||||||||
|---|---|---|---|---|---|---|---|---|---|---|---|---|---|---|---|---|---|---|---|
2014: |
|||||||||||||||||||
Revenues from external customers |
$ | 184,464 | $ | 41,365 | $ | 15,439 | $ | — | $ | — | $ | 241,268 | |||||||
Intersegment revenues(1) |
440 | 888 | 121 | — | (1,449 | ) | — | ||||||||||||
Net revenues |
184,904 | 42,253 | 15,560 | — | (1,449 | ) | 241,268 | ||||||||||||
Operating profit (loss) |
18,065 | (9,423 | ) | (4,493 | ) | (10,115 | ) | 32 | (5,934 | ) | |||||||||
Depreciation and amortization |
3,993 | 6,816 | 1,239 | 135 | — | 12,183 | |||||||||||||
Capital expenditures |
4,118 | 1,814 | 207 | 365 | — | 6,504 | |||||||||||||
Assets held for sale |
738 | — | — | — | — | 738 | |||||||||||||
Total assets |
51,429 | 50,238 | 10,884 | 297,754 | (263,688 | ) | 146,617 | ||||||||||||
| |
Towers and Weldments |
Gearing | Services | Corporate | Eliminations | Consolidated | |||||||||||||
|---|---|---|---|---|---|---|---|---|---|---|---|---|---|---|---|---|---|---|---|
2013: |
|||||||||||||||||||
Revenues from external customers |
$ | 159,269 | $ | 39,213 | $ | 17,228 | $ | — | $ | 215,710 | |||||||||
Intersegment revenues(1) |
209 | 3,937 | 15 | — | (4,161 | ) | — | ||||||||||||
Net revenues |
159,478 | 43,150 | 17,243 | — | (4,161 | ) | 215,710 | ||||||||||||
Operating profit (loss) |
19,550 | (17,916 | ) | (4,721 | ) | (10,192 | ) | 69 | (13,210 | ) | |||||||||
Depreciation and amortization |
3,872 | 9,535 | 1,398 | 51 | — | 14,856 | |||||||||||||
Capital expenditures |
1,811 | 4,262 | 301 | 576 | — | 6,950 | |||||||||||||
Assets held for sale |
821 | 1,149 | — | — | — | 1,970 | |||||||||||||
Total assets |
52,755 | 67,357 | 14,800 | 300,835 | (272,051 | ) | 163,694 | ||||||||||||
| |
Towers and Weldments |
Gearing | Services | Corporate | Eliminations | Consolidated | |||||||||||||
|---|---|---|---|---|---|---|---|---|---|---|---|---|---|---|---|---|---|---|---|
2012: |
|||||||||||||||||||
Revenues from external customers |
$ | 135,221 | $ | 53,566 | $ | 21,920 | $ | — | $ | — | $ | 210,707 | |||||||
Intersegment revenues(1) |
— | 2,094 | 186 | — | (2,280 | ) | — | ||||||||||||
Net revenues |
135,221 | 55,660 | 22,106 | — | (2,280 | ) | 210,707 | ||||||||||||
Operating profit (loss) |
2,766 | (7,626 | ) | (4,185 | ) | (8,260 | ) | 8 | (17,297 | ) | |||||||||
Depreciation and amortization |
3,676 | 10,955 | 1,841 | 65 | — | 16,537 | |||||||||||||
Capital expenditures |
629 | 3,175 | 1,307 | 627 | — | 5,738 | |||||||||||||
Assets held for sale |
8,042 | — | — | — | — | 8,042 | |||||||||||||
Total assets |
58,843 | 71,371 | 13,976 | 308,336 | (309,616 | ) | 142,910 | ||||||||||||
- (1)
- Intersegment revenues primarily consist of sales from Gearing to Services. Sales from Gearing to Services totaled $888, $3,937 and $2,094 for the years ended December 31, 2014, 2013 and 2012, respectively.
78
BROADWIND ENERGY, INC. AND SUBSIDIARIES
NOTES TO CONSOLIDATED FINANCIAL STATEMENTS (Continued)
December 31, 2014, 2013, and 2012
(in thousands, except share and per share data)
17. SEGMENT REPORTING (Continued)
The Company generates revenues entirely from transactions completed in the U.S. and its long-lived assets are all located in the U.S. All intercompany revenue is eliminated in consolidation. During 2014, two customers each accounted for more than 10% of total net revenues. These two customers accounted for revenues of $128,337 and $53,955 for fiscal year 2014 and were reported within the Towers and Weldments segment. During the years ended December 31, 2014, 2013, and 2012, five customers accounted for 87%, 83% and 67%, respectively, of total net revenues.
18. EMPLOYEE BENEFIT PLANS
Retirement Savings and Profit Sharing Plans
Retirement Savings and Profit Sharing Plans
The Company offers a 401(k) retirement savings plan to all eligible employees who may elect to contribute a portion of their salary on a pre-tax basis, subject to applicable statutory limitations. Participating non-union employees are eligible to receive safe harbor matching contributions equal to 100% of the first 3% of the participant's elective deferral contributions and 50% of the next 2% of the participant's elective deferral contributions. In accordance with the collective bargaining agreements in place at its two union locations, the Company's Illinois-based union employees are eligible to receive a discretionary match in an amount up to 50% of each participant's first 4% of elective deferral contributions, and the Company's Pennsylvania-based union employees are eligible to receive a discretionary match in an amount up to 100% of each participant's first 3% and 50% of the next 2% of elective deferral contributions. The Company has the discretion, subject to applicable statutory requirements, to fund any matching contribution with a contribution to the plan of the Company's common stock. Beginning with the first quarter of 2012, the Company funded the matching contributions in the form of the Company's common stock. Starting in the first quarter of 2014, the Company resumed funding the matching contributions in cash. Under the plan, elective deferrals and basic Company matching will be 100% vested at all times.
For the years ended December 31, 2014, 2013 and 2012, the Company recorded expense under these plans of approximately $701, $705 and $661, respectively.
Deferred Compensation Plan
The Company maintains a deferred compensation plan for certain key employees and nonemployee directors, whereby certain wages earned, compensation for services rendered, and discretionary company-matching contributions may be deferred and deemed to be invested in the Company's common stock. Changes in the fair value of the plan liability are recorded as charges or credits to compensation expense. Compensation expense associated with the deferred compensation plan recorded during the years ended December 31, 2014, 2013, and 2012, was ($23), $41 and ($26), respectively. The fair value of the plan liability to the Company is included in accrued liabilities in the Company's consolidated balance sheets. As of December 31, 2014 and 2013, the fair value of plan liability to the Company was $31 and $54, respectively.
79
BROADWIND ENERGY, INC. AND SUBSIDIARIES
NOTES TO CONSOLIDATED FINANCIAL STATEMENTS (Continued)
December 31, 2014, 2013, and 2012
(in thousands, except share and per share data)
18. EMPLOYEE BENEFIT PLANS (Continued)
In addition to the employee benefit plans described above, the Company participates in certain customary employee benefits plans, including those which provide health and life insurance benefits to employees.
19. NEW MARKETS TAX CREDIT TRANSACTION
On July 20, 2011, the Company executed the NMTC Transaction involving the following third parties: AMCREF Fund VII, LLC ("AMCREF"), a registered community development entity; COCRF Investor VIII, LLC ("COCRF"); and Capital One. The NMTC Transaction allows the Company to receive below market interest rate funds through the federal New Markets Tax Credit ("NMTC") program. The Company received $2,280 in proceeds via the NMTC Transaction. The NMTC Transaction qualifies under the NMTC program and included a gross loan from AMCREF to the Company's wholly-owned subsidiary Broadwind Services, LLC in the principal amount of $10,000, with a term of fifteen years and interest payable at the rate of 1.4% per annum, largely offset by a gross loan in the principal amount of $7,720 from the Company to COCRF, with a term of fifteen years and interest payable at the rate of 2.5% per annum.
The NMTC regulations permit taxpayers to claim credits against their federal income taxes for up to 39% of qualified investments in the equity of community development entities. The NMTC Transaction could generate $3,900 in tax credits, which the Company has made available under the structure by passing them through to Capital One. The proceeds have been applied to the Company's investment in the Abilene Gearbox Facility assets and operating costs, as permitted under the NMTC program.
The Abilene Gearbox Facility must operate and be in compliance with various regulations and restrictions through September 2018, the end of the seven year period, to comply with the terms of the NMTC Transaction, or the Company may be liable under its indemnification agreement with Capital One for the recapture of tax credits. In the event the Company does not comply with these regulations and restrictions, the NMTC program tax credits may be subject to 100% recapture for a period of seven years as provided in the IRC. The Company does not anticipate that any tax credit recapture events will occur or that it will be required to make any payments to Capital One under the indemnification agreement.
The Capital One contribution, including a loan origination payment of $320, has been included as other assets in the Company's condensed consolidated balance sheet as of December 31, 2014. The NMTC Transaction includes a put/call provision whereby the Company may be obligated or entitled to repurchase Capital One's interest in the third quarter of 2018. Capital One may exercise an option to put its investment and receive $130 from the Company. If Capital One does not exercise its put option, the Company can exercise a call option at the then fair market value of the call. The Company expects that Capital One will exercise the put option at the end of the tax credit recapture period. The Capital One contribution other than the amount allocated to the put obligation will be recognized as income only after the put/call is exercised and when Capital One has no ongoing interest. However, there is no legal obligation for Capital One to exercise the put, and the Company has attributed only an insignificant value to the put option included in this transaction structure.
80
BROADWIND ENERGY, INC. AND SUBSIDIARIES
NOTES TO CONSOLIDATED FINANCIAL STATEMENTS (Continued)
December 31, 2014, 2013, and 2012
(in thousands, except share and per share data)
19. NEW MARKETS TAX CREDIT TRANSACTION (Continued)
The Company has determined that two pass-through financing entities created under this transaction structure are variable interest entities ("VIEs"). The ongoing activities of the VIEs—collecting and remitting interest and fees and complying with NMTC program requirements—were considered in the initial design of the NMTC Transaction and are not expected to significantly affect economic performance throughout the life of the VIEs. In making this determination, management also considered the contractual arrangements that obligate the Company to deliver tax benefits and provide various other guarantees under the transaction structure, Capital One's lack of a material interest in the underlying economics of the project, and the fact that the Company is obligated to absorb losses of the VIEs. The Company has concluded that it is required to consolidate the VIEs because the Company has both (i) the power to direct those matters that most significantly impact the activities of each VIE, and (ii) the obligation to absorb losses or the right to receive benefits of each VIE.
The $262 of issue costs paid to third parties in connection with the NMTC Transaction are recorded as prepaid expenses, and are being amortized over the expected seven year term of the NMTC arrangement. Capital One's net contribution of $2,600 is included in Long Term Debt, Net of Current Maturities in the consolidated balance sheet. Incremental costs to maintain the transaction structure during the compliance period will be recognized as they are incurred.
20. RESTRUCTURING
The Company's total net restructuring charges are detailed below:
| |
2011 Actual |
2012 Actual |
2013 Actual |
2014 Actual |
Total Incurred |
|||||||||||
|---|---|---|---|---|---|---|---|---|---|---|---|---|---|---|---|---|
Restructuring charges: |
||||||||||||||||
Capital expenditures |
$ | 5 | $ | 2,596 | $ | 2,352 | $ | 674 | $ | 5,627 | ||||||
Gain on sale of Brandon Facility |
— | — | (3,585 | ) | — | (3,585 | ) | |||||||||
Accelerated depreciation |
— | 819 | 898 | — | 1,717 | |||||||||||
Severance |
430 | — | 435 | — | 865 | |||||||||||
Impairment charges |
— | — | 2,365 | — | 2,365 | |||||||||||
Moving and other exit-related costs |
439 | 1,677 | 3,085 | 1,479 | 6,680 | |||||||||||
| | | | | | | | | | | | | | | | | |
Total |
874 | 5,092 | 5,550 | 2,153 | 13,669 | |||||||||||
During the third quarter of 2011, the Company conducted a review of its business strategies and product plans based on the outlook for the economy at large, the forecast for the industries it serves, and its business environment. The Company concluded that its manufacturing footprint and fixed cost base were too large and expensive for its medium-term needs and began restructuring its facility capacity and its management structure to consolidate and increase the efficiencies of its operations.
The Company has made substantial progress in executing a plan to reduce its facility footprint by approximately 40% through the sale and/or closure of facilities comprising a total of approximately 600,000 square feet. As part of this plan, in the third quarter of 2011, the Company determined that its idle Brandon, South Dakota tower manufacturing facility (the "Brandon Facility") should be sold, and as a result the Company reclassified the Brandon Facility property and equipment to Assets Held for
81
BROADWIND ENERGY, INC. AND SUBSIDIARIES
NOTES TO CONSOLIDATED FINANCIAL STATEMENTS (Continued)
December 31, 2014, 2013, and 2012
(in thousands, except share and per share data)
20. RESTRUCTURING (Continued)
Sale and the related indebtedness to Liabilities Held for Sale. In April 2013, the Company completed the sale of the Brandon Facility, generating a gain on sale of $3,585 and approximately $8,000 in net proceeds after closing costs and the repayment of the mortgage on the Brandon Facility. Including the sale of the Brandon Facility, the Company has so far closed or reduced its leased presence at six facilities and achieved a reduction of approximately 400,000 square feet. During 2013, the Company determined that the Clintonville Facility was no longer required in its operations and reclassified the property and equipment associated with the Clintonville Facility, as well as certain Gearing equipment, to Assets Held for Sale. The most significant remaining reduction relates to the environmental remediation and disposition of the Cicero Avenue Facility. The use of the Cicero Avenue Facility in our production was significantly curtailed at the end of 2013, and we recorded a related $1,732 impairment, primarily in cost of sales in the fourth quarter of 2013. The Company believes its remaining locations will be sufficient to support its Towers and Weldments, Gearing, Services and general corporate and administrative activities, while allowing for growth for the next several years.
In the third quarter of 2012, the Company identified a $352 liability associated with the planned sale of the Cicero Avenue Facility. The Company further adjusted the liability in the fourth quarter of 2013 by recording an additional $258 charge. The liability is associated with environmental remediation costs that were originally identified while preparing the site for sale. The expenses associated with this liability have been recorded as restructuring charges, and as of December 31, 2014, the accrual balance remaining is $513.
The Company has completed the expenditures relating to its restructuring plan. The Company incurred total costs of approximately $13,700. The Company's restructuring charges generally include costs to close or exit facilities, costs to move equipment, the related costs of building infrastructure for moved equipment and employee related costs. Of the total restructuring costs incurred, a total of approximately $4,800 consists of non-cash charges. Restructuring costs also include $900 of severance and $1,750 of accelerated depreciation of the Cicero Avenue Facility. During 2013, the Company incurred restructuring-related impairment charges of $1,732 related to the Cicero Avenue Facility, $288 related to the Clintonville Facility and $345 related to certain Gearing segment machinery and
82
BROADWIND ENERGY, INC. AND SUBSIDIARIES
NOTES TO CONSOLIDATED FINANCIAL STATEMENTS (Continued)
December 31, 2014, 2013, and 2012
(in thousands, except share and per share data)
20. RESTRUCTURING (Continued)
equipment. The table below details the Company's total net restructuring charges incurred as of December 31, 2014:
| |
2011 Actual |
2012 Actual |
2013 Actual |
2014 Actual |
Total Incurred |
|||||||||||
|---|---|---|---|---|---|---|---|---|---|---|---|---|---|---|---|---|
Capital expenditures: |
||||||||||||||||
Gearing |
$ | 5 | $ | 2,072 | $ | 2,075 | $ | 674 | $ | 4,826 | ||||||
Corporate |
— | 524 | 277 | — | 801 | |||||||||||
| | | | | | | | | | | | | | | | | |
Total capital expenditures |
5 | 2,596 | 2,352 | 674 | 5,627 | |||||||||||
Cash expenses: |
||||||||||||||||
Cost of sales: |
||||||||||||||||
Gearing |
131 | 308 | 2,176 | 1,281 | 3,896 | |||||||||||
Services |
— | 225 | 234 | — | 459 | |||||||||||
| | | | | | | | | | | | | | | | | |
Total cost of sales |
131 | 533 | 2,410 | 1,281 | 4,355 | |||||||||||
Selling, general, and administrative expenses: |
||||||||||||||||
Towers and Weldments |
— | 130 | 176 | 47 | 353 | |||||||||||
Gearing |
35 | 520 | 451 | 186 | 1,192 | |||||||||||
Services |
— | 40 | — | — | 40 | |||||||||||
Corporate |
406 | 49 | 462 | — | 917 | |||||||||||
| | | | | | | | | | | | | | | | | |
Total selling, general and administrative expenses |
441 | 739 | 1,089 | 233 | 2,502 | |||||||||||
Other—Towers and Weldments gain on Brandon Facility: |
— |
— |
(3,585 |
) |
— |
(3,585 |
) |
|||||||||
Non-cash expenses: |
||||||||||||||||
Towers and Weldments |
— | — | 291 | 84 | 375 | |||||||||||
Gearing |
247 | 1,166 | 3,008 | (119 | ) | 4,302 | ||||||||||
Services |
— | 58 | (15 | ) | — | 43 | ||||||||||
Corporate |
50 | — | — | — | 50 | |||||||||||
| | | | | | | | | | | | | | | | | |
Total non-cash expenses |
297 | 1,224 | 3,284 | (35 | ) | 4,770 | ||||||||||
| | | | | | | | | | | | | | | | | |
Grand total |
$ | 874 | $ | 5,092 | $ | 5,550 | $ | 2,153 | $ | 13,669 | ||||||
83
BROADWIND ENERGY, INC. AND SUBSIDIARIES
NOTES TO CONSOLIDATED FINANCIAL STATEMENTS (Continued)
December 31, 2014, 2013, and 2012
(in thousands, except share and per share data)
21. QUARTERLY FINANCIAL SUMMARY (UNAUDITED)
The following table provides a summary of selected financial results of operations by quarter for the years ended December 31, 2014 and 2013 as follows:
2014
|
First | Second | Third | Fourth | |||||||||
|---|---|---|---|---|---|---|---|---|---|---|---|---|---|
Revenues |
$ | 58,800 | $ | 68,381 | $ | 60,289 | $ | 53,798 | |||||
Gross profit (loss) |
5,093 | 8,631 | 3,858 | (92 | ) | ||||||||
Operating profit (loss) |
(995 | ) | 2,101 | (1,811 | ) | (5,229 | ) | ||||||
(Loss) income from continuing operations, net of tax |
(1,043 | ) | 1,860 | (1,814 | ) | (5,171 | ) | ||||||
Net (loss) income |
(1,043 | ) | 1,860 | (1,814 | ) | (5,171 | ) | ||||||
(Loss) income from continuing operations per share: |
|||||||||||||
Basic |
(0.07 | ) | 0.13 | (0.12 | ) | (0.35 | ) | ||||||
Diluted |
(0.07 | ) | 0.12 | (0.12 | ) | (0.35 | ) | ||||||
Net (loss) income per share: |
|||||||||||||
Basic |
(0.07 | ) | 0.13 | (0.12 | ) | (0.35 | ) | ||||||
Diluted |
$ | (0.07 | ) | $ | 0.12 | $ | (0.12 | ) | $ | (0.35 | ) | ||
2013
|
First | Second | Third | Fourth | |||||||||
|---|---|---|---|---|---|---|---|---|---|---|---|---|---|
Revenues |
$ | 45,506 | $ | 52,945 | $ | 60,862 | $ | 56,397 | |||||
Gross profit (loss) |
2,170 | 3,401 | 4,618 | 2,156 | |||||||||
Operating profit (loss) |
(4,484 | ) | (2,488 | ) | (2,288 | ) | (3,950 | ) | |||||
Loss from continuing operations, net of tax |
(4,549 | ) | 404 | (2,498 | ) | (3,746 | ) | ||||||
Net loss |
(4,759 | ) | 404 | (2,398 | ) | (3,746 | ) | ||||||
Loss from continuing operations per share: |
|||||||||||||
Basic and Diluted |
(0.32 | ) | 0.03 | (0.18 | ) | (0.25 | ) | ||||||
Net loss per share: |
|||||||||||||
Basic and Diluted |
$ | (0.33 | ) | $ | 0.03 | $ | (0.17 | ) | $ | (0.26 | ) | ||
22. LEGAL PROCEEDINGS
Shareholder Lawsuits
Between February 15, 2011 and March 30, 2011, three putative shareholder derivative lawsuits were filed in the United States District Court for the Northern District of Illinois (the "USDC") against certain of the Company's current and former officers and directors, and certain Tontine entities, seeking to challenge alleged breaches of fiduciary duty, waste of corporate assets and unjust enrichment, including in connection with the January 2010 secondary public offering of the Company's common stock (the "2010 Stock Offering"). One of the lawsuits also alleged that certain directors violated Section 14(a) of the Exchange Act, in connection with the Company's Proxy Statement for its 2010 Annual Meeting of Stockholders. Two of the matters pending in the USDC were subsequently consolidated, and on May 15, 2012, the USDC granted the defendants' motion to dismiss the consolidated cases and also entered an order dismissing the third case. On January 17, 2014, the Company and the plaintiffs from the consolidated derivative lawsuit filed a joint motion to reopen the
84
BROADWIND ENERGY, INC. AND SUBSIDIARIES
NOTES TO CONSOLIDATED FINANCIAL STATEMENTS (Continued)
December 31, 2014, 2013, and 2012
(in thousands, except share and per share data)
22. LEGAL PROCEEDINGS (Continued)
derivative action and preliminarily approve a derivative settlement. The USDC subsequently reopened the derivative action and granted preliminary approval of the settlement on February 3, 2014. The settlement resolved outstanding shareholder derivative claims, including those raised in certain shareholder demand letters received by the Board. The terms of the settlement included the adoption by the Company of certain corporate governance reforms, along with other remedial measures. The settlement provided for the Company's insurance carrier and/or the Company to pay plaintiffs' counsel's attorneys' fees and expenses in the amount of $600. The USDC granted final approval of the settlement on April 3, 2014.
SEC Inquiry
In August 2011, the Company received a subpoena from the SEC seeking documents related to certain accounting practices at Brad Foote. The subpoena was issued following an informal inquiry that the Company received from the SEC in November 2010, which likely arose out of a whistleblower complaint that the SEC received related to revenue recognition, cost accounting and intangible and fixed asset valuations at Brad Foote. The Company produced documents responsive to the SEC's subpoena. Following the issuance of subpoenas for testimony, the SEC deposed certain current and former Company employees.
On May 8, 2014, the Company, its CFO and a former CEO and director (the "Former CEO") received "Wells notices" (the "Notices") from the SEC's Division of Enforcement in connection with its ongoing investigation of the Company. A Wells notice is not a formal allegation or a finding of wrongdoing, but is a preliminary determination by the SEC Enforcement Staff (the "Staff") that the Staff may recommend to the SEC that a civil enforcement action or administrative proceeding be brought against the recipient. The Notices indicated that the Staff had made a preliminary determination to recommend that the SEC file an enforcement action alleging violations of the Securities Act of 1933, the Exchange Act, the Sarbanes-Oxley Act and certain SEC rules. The Notices to the CFO and the Former CEO related only to an intangible valuation issue relating to events in 2009 and the 2010 Stock Offering, and the Notice to the Company related to that intangible valuation issue and certain revenue recognition issues relating to events in 2009. Under SEC procedures, a recipient of a Wells notice has an opportunity to respond in the form of a Wells submission that seeks to persuade the SEC that such an action should not be brought. On June 16, 2014, the Company submitted to the Staff a Wells submission to explain its views concerning such matters.
On February 5, 2015, the SEC announced a settlement with the Company, its CFO and the former CEO in connection with the SEC investigation. Consistent with standard SEC practice, the Company has neither admitted nor denied the SEC's allegations. Under the terms of the settlement, the Company consented to the entry of a judgment requiring the Company to pay a civil penalty of $1,000. In addition, (i) the Company's CFO agreed to pay disgorgement and prejudgment interest of $23 (which was reimbursed by the Company) and a penalty of $50, and (ii) the Former CEO agreed to pay disgorgement and prejudgment interest of $543 (which was reimbursed by the Company) and a penalty of $75. The Company cooperated with the SEC over the course of its investigation, and the Company conducted its own comprehensive review, together with the Board's Audit Committee, in conjunction with the investigation. The USDC granted final approval of the settlement on February 11, 2015.
85
BROADWIND ENERGY, INC. AND SUBSIDIARIES
NOTES TO CONSOLIDATED FINANCIAL STATEMENTS (Continued)
December 31, 2014, 2013, and 2012
(in thousands, except share and per share data)
22. LEGAL PROCEEDINGS (Continued)
Environmental Matters
On February 15, 2011, pursuant to a search warrant, officials from the United States Environmental Protection Agency ("USEPA") entered and conducted a search of the Cicero Avenue Facility in connection with the alleged improper disposal of industrial wastewater to the sewer. On September 24, 2013, the United States Attorney's Office, Northern District of Illinois ("USAO") commenced a criminal action in the USDC based on this investigation. Subsequently, Brad Foote entered into a plea agreement with the USAO (the "Plea Agreement") with regard to this criminal action, pursuant to which Brad Foote agreed to plead guilty to one count of knowingly violating the Clean Water Act, Title 33, United States Code, Section 1319(c)(2)(A) and pay a $1,500 fine (payable in three annual installments of $500 within three years of the date of sentencing), subject to the USDC's approval of the Plea Agreement. Brad Foote pled guilty pursuant to the Plea Agreement on November 13, 2013, and the USDC approved the Plea Agreement on February 19, 2014. By correspondence dated April 17, 2014, the USEPA advised that, due to the admitted violation of the Clean Water Act by Brad Foote, the Cicero Avenue Facility was statutorily debarred from receiving federal contracts or benefits if any of the work will be performed at the place where the offense occurred. Subsequently, by correspondence dated November 7, 2014, the USEPA advised that the statutory debarment had been terminated as a result of the corrective actions undertaken by Brad Foote.
Other
The Company is also a party to additional claims and legal proceedings arising in the ordinary course of business, none of which is deemed to be individually significant at this time. Due to the inherent uncertainty of litigation, there can be no assurance that the resolution of any particular claim or proceeding would not have a material adverse effect on the Company's results of operations, financial position or liquidity. It is possible that if one or more of the matters described above were decided against the Company, the effects could be material to the Company's results of operations in the period in which the Company would be required to record or adjust the related liability and could also be material to the Company's cash flows in the periods the Company would be required to pay such liability.
86
| Exhibit Number |
Description | ||
|---|---|---|---|
| 3.1 | Certificate of Incorporation of the Company (incorporated by reference to Exhibit 3.1 to the Company's Quarterly Report on Form 10-Q for the quarterly period ended June 30, 2008) | ||
3.2 |
Certificate of Amendment to the Certificate of Incorporation of the Company (incorporated by reference to Exhibit 3.1 to the Company's Current Report on Form 8-K filed August 23, 2012) |
||
3.3 |
Second Amended and Restated Bylaws of the Company, adopted as of May 20, 2014 (incorporated by reference to Exhibit 3.1 to the Company's Current Report on Form 8-K filed May 23, 2014) |
||
4.1 |
Section 382 Rights Agreement, dated as of February 12, 2013, between the Company and Wells Fargo Bank, National Association, as rights agent, which includes the Form of Rights Certificate as Exhibit B thereto (incorporated by reference to Exhibit 1 to the Company's Registration Statement on Form 8-A filed February 13, 2013) |
||
4.2 |
Certificate of Designation of Series A Junior Participating Preferred Stock of the Company (incorporated by reference to Exhibit 2 to the Company's Registration Statement on Form 8-A filed February 13, 2013) |
||
10.1 |
Lease Agreement dated December 26, 2007 between Tower Tech Systems Inc. and City Centre, LLC (incorporated by reference to Exhibit 10.3 to the Company's Annual Report on Form 10-KSB for the fiscal year ended December 31, 2007) |
||
10.2 |
Amended and Restated Lease for Industrial/Manufacturing Space dated as of May 1, 2010 between Tower Tech Systems Inc. and City Centre, L.L.C. (incorporated by reference to Exhibit 10.5 to the Company's Quarterly Report on Form 10-Q for the quarterly period ended March 31, 2010) |
||
10.3 |
Purchase Agreement Addendum dated as of February 11, 2008 between Brad Foote Gear Works, Inc. and BFG Cicero LLC (incorporated by reference to Exhibit 10.1 to the Company's Current Report on Form 8-K filed February 21, 2008) |
||
10.4 |
Assignment and Assumption of Purchase Agreement dated as of February 11, 2008 between Brad Foote Gear Works, Inc. and 1309 South Cicero Avenue, LLC (incorporated by reference to Exhibit 10.2 to the Company's Current Report on Form 8-K filed February 21, 2008) |
||
10.5 |
Purchase Agreement Addendum dated as of February 11, 2008 between Brad Foote Gear Works, Inc. and BFG Pittsburgh LLC (incorporated by reference to Exhibit 10.3 to the Company's Current Report on Form 8-K filed February 21, 2008) |
||
10.6 |
Assignment and Assumption of Purchase Agreement dated as of February 11, 2008 between Brad Foote Gear Works, Inc. and 5100 Neville Road, LLC (incorporated by reference to Exhibit 10.4 to the Company's Current Report on Form 8-K filed February 21, 2008) |
||
10.7 |
Securities Purchase Agreement dated as of March 1, 2007 among the Company, Tontine Capital Partners, L.P. and Tontine Capital Overseas Master Fund, L.P. (incorporated by reference to Exhibit 10.2 to the Company's Current Report on Form 8-K filed March 5, 2007) |
||
87
| Exhibit Number |
Description | ||
|---|---|---|---|
| 10.8 | Securities Purchase Agreement dated as of August 22, 2007 among the Company, Tontine Capital Partners, L.P. and Tontine Capital Overseas Master Fund, L.P. (incorporated by reference to Exhibit 10.2 to the Company's Current Report on Form 8-K filed August 24, 2007) | ||
10.9 |
Amended and Restated Securities Purchase Agreement dated as of January 3, 2008 among the Company, Tontine Capital Partners, L.P., Tontine Partners, L.P. and Tontine 25 Overseas Master Fund, L.P. (incorporated by reference to Exhibit 10.1 to the Company's Current Report on Form 8-K filed January 4, 2008) |
||
10.10 |
Securities Purchase Agreement dated as of April 22, 2008 among the Company, Tontine Capital Partners, L.P., Tontine Partners, L.P., Tontine Overseas Fund, Ltd. and Tontine 25 Overseas Master Fund, L.P. (incorporated by reference to Exhibit 10.1 to the Company's Current Report on Form 8-K filed April 28, 2008) |
||
10.11 |
Securities Purchase Agreement dated as of April 22, 2008 between the Company and Charles H. Beynon (incorporated by reference to Exhibit 10.2 to the Company's Current Report on Form 8-K filed April 28, 2008) |
||
10.12 |
Amendment Agreement dated as of April 1, 2013, among the Company; Tontine Capital Management, L.L.C., a Delaware limited liability company; Tontine Capital Overseas GP, L.L.C., a Delaware limited liability company; Tontine Management, L.L.C., a Delaware limited liability company; Tontine Overseas Associates, L.L.C., a Delaware limited liability company; Tontine Capital Overseas Master Fund II, L.P., a Cayman Islands limited partnership; Tontine Power Partners, L.P., a Delaware limited partnership; Tontine Associates, L.L.C., a Delaware limited liability company; Tontine Partners, L.P., a Delaware limited partnership; Tontine Capital Partners, L.P., a Delaware limited partnership; Tontine Overseas Fund, LTD., a Cayman Islands exempted company; Tontine 25 Overseas Master Fund, L.P., a Cayman Islands limited partnership; and Tontine Capital Overseas Master Fund, L.P., a Cayman Islands limited partnership (incorporated by reference to Exhibit 10.1 to the Company's Quarterly Report on Form 10-Q for the quarterly period ended March 31, 2013) |
||
10.13 |
Registration Rights Agreement dated as of March 1, 2007 among the Company, Tontine Capital Partners, L.P. and Tontine Capital Overseas Master Fund, L.P. (incorporated by reference to Exhibit 10.3 to the Company's Current Report on Form 8-K filed March 5, 2007) |
||
10.14 |
Amendment to Registration Rights Agreement dated as of October 19, 2007 among the Company, Tontine Capital Partners, L.P., Tontine Capital Overseas Master Fund, L.P., Tontine Partners, L.P., Tontine Overseas Fund, Ltd. and Tontine 25 Overseas Master Fund, L.P. (incorporated by reference to Exhibit 10.6 to the Company's Current Report on Form 8-K filed October 24, 2007) |
||
10.15 |
Amendment No. 2 to Registration Rights Agreement dated as of July 18, 2008 among the Company, Tontine Capital Partners L.P., Tontine Partners, L.P., Tontine Capital Overseas Master Fund, L.P., Tontine 25 Overseas Master Fund, L.P. and Tontine Overseas Fund, Ltd. (incorporated by reference to Exhibit 10.1 to the Company's Current Report on Form 8-K filed July 23, 2008) |
||
88
| Exhibit Number |
Description | ||
|---|---|---|---|
| 10.16 | Amendment No. 3 to Registration Rights Agreement dated as of September 12, 2008 among the Company, Tontine Capital Partners L.P., Tontine Partners, L.P., Tontine Capital Overseas Master Fund, L.P., Tontine 25 Overseas Master Fund, L.P. and Tontine Overseas Fund, Ltd. (incorporated by reference to Exhibit 10.1 to the Company's Current Report on Form 8-K filed September 12, 2008) | ||
10.17 |
Amendment No. 4 to Registration Rights Agreement dated as of October 31, 2008 among the Company, Tontine Capital Partners, L.P., Tontine Partners, L.P., Tontine Capital Overseas Master Fund, L.P., Tontine Overseas Fund, Ltd. and Tontine 25 Overseas Master Fund, L.P. (incorporated by reference to Exhibit 10.1 to the Company's Current Report on Form 8-K filed November 4, 2008) |
||
10.18 |
Waiver relating to Registration Rights Agreement, dated January 9, 2009, by Tontine Capital Partners, L.P., Tontine Partners, L.P., Tontine Capital Overseas Master Fund, L.P., Tontine Overseas Fund, Ltd. and Tontine 25 Overseas Master Fund, L.P. (incorporated by reference to Exhibit 10.1 to the Company's Current Report on Form 8-K filed January 15, 2009) |
||
10.19 |
Registration Rights Agreement dated as of October 19, 2007 among the Company and the shareholders of Brad Foote Gear Works, Inc. (incorporated by reference to Exhibit 10.2 to the Company's Current Report on Form 8-K filed October 24, 2007) |
||
10.20 |
Registration Rights Agreement dated as of January 16, 2008 among the Company and the members of Energy Maintenance Service, LLC (incorporated by reference to Exhibit 10.2 to the Company's Current Report on Form 8-K filed January 23, 2008) |
||
10.21 |
Registration Rights Agreement dated as of April 24, 2008 between the Company and Charles H. Beynon (incorporated by reference to Exhibit 10.3 to the Company's Current Report on Form 8-K filed April 28, 2008) |
||
10.22 |
Registration Rights Agreement dated as of June 4, 2008 between the Company and the shareholders of Badger Transport, Inc. (incorporated by reference to Exhibit 10.2 to the Company's Current Report on Form 8-K filed June 10, 2008) |
||
10.23 |
† |
Amended and Restated Employment Agreement dated as of December 17, 2012 between the Company and Peter C. Duprey (incorporated by reference to Exhibit 10.1 to the Company's Current Report on Form 8-K filed December 17, 2012) |
|
10.24 |
† |
Amended and Restated Employment Agreement dated as of December 17, 2012 between the Company and Stephanie K. Kushner (incorporated by reference to Exhibit 10.3 to the Company's Current Report on Form 8-K filed December 21, 2012) |
|
10.25 |
† |
Severance and Non-Competition Agreement, dated as of February 21, 2014, by and between the Company and David W. Fell (filed herewith) |
|
10.26 |
† |
Severance and Non-Competition Agreement, dated as of December 15, 2011, by and between the Company and Robert R. Rogowski (filed herewith) |
|
10.27 |
† |
Severance and Non-Competition Agreement, dated as of July 8, 2014, by and between the Company and Erik W. Jensen (filed herewith) |
|
10.28 |
† |
Deferred Compensation Plan (incorporated by reference to Exhibit 10.2 to the Company's Current Report on Form 8-K filed October 26, 2007) |
|
10.29 |
† |
Broadwind Energy, Inc. 2007 Equity Incentive Plan (incorporated by reference to Exhibit 10.1 to the Company's Quarterly Report on Form 10-Q for the quarterly period ended September 30, 2012) |
|
89
| Exhibit Number |
Description | ||
|---|---|---|---|
| 10.30 | † | Broadwind Energy, Inc. 2012 Equity Incentive Plan (incorporated by reference to Exhibit 10.2 to the Company's Quarterly Report on Form 10-Q for the quarterly period ended September 30, 2012) | |
10.31 |
† |
Form of Executive Incentive Stock Option Agreement (incorporated by reference to Exhibit 10.1 to the Company's Quarterly Report on Form 10-Q for the quarterly period ended June 30, 2010) |
|
10.32 |
† |
Form of Incentive Stock Option Agreement (incorporated by reference to Exhibit 10.2 to the Company's Quarterly Report on Form 10-Q for the quarterly period ended June 30, 2010) |
|
10.33 |
† |
Form of Nonqualified Option Agreement (incorporated by reference to Exhibit 10.3 to the Company's Quarterly Report on Form 10-Q for the quarterly period ended June 30, 2010) |
|
10.34 |
† |
Form of Restricted Stock Award Agreement (incorporated by reference to Exhibit 10.4 to the Company's Quarterly Report on Form 10-Q for the quarterly period ended June 30, 2010) |
|
10.35 |
† |
Form of Restricted Stock Unit Award Agreement (incorporated by reference to Exhibit 10.5 to the Company's Quarterly Report on Form 10-Q for the quarterly period ended June 30, 2010) |
|
10.36 |
† |
Form of Performance Award Agreement (incorporated by reference to Exhibit 10.6 to the Company's Quarterly Report on Form 10-Q for the quarterly period ended June 30, 2010) |
|
10.37 |
† |
Form of Stock Appreciation Rights Agreement (incorporated by reference to Exhibit 10.7 to the Company's Quarterly Report on Form 10-Q for the quarterly period ended June 30, 2010) |
|
10.38 |
† |
Form of Non-Employee Director Restricted Stock Award Agreement (incorporated by reference to Exhibit 10.1 to the Company's Quarterly Report on Form 10-Q for the quarterly period ended March 31, 2012) |
|
10.39 |
† |
Form of Restricted Stock Unit Award Agreement (incorporated by reference to Exhibit 10.2 to the Company's Quarterly Report on Form 10-Q for the quarterly period ended March 31, 2012) |
|
10.40 |
† |
Form of Restricted Stock Unit Award Agreement (incorporated by reference to Exhibit 10.3 to the Company's Quarterly Report on Form 10-Q for the quarterly period ended March 31, 2012) |
|
10.41 |
† |
Form of Stock Option Agreement (incorporated by reference to Exhibit 10.4 to the Company's Quarterly Report on Form 10-Q for the quarterly period ended March 31, 2012) |
|
10.42 |
Loan and Security Agreement dated as of August 23, 2012 among the Company, Brad Foote Gear Works, Inc., Broadwind Towers, Inc., Broadwind Services, LLC and AloStar Bank of Commerce (incorporated by reference to Exhibit 10.1 to the Company's Current Report on Form 8-K filed August 23, 2012) |
||
10.43 |
First Amendment to Loan and Security Agreement and Waiver, dated as of February 13, 2013, among the Company, Brad Foote Gear Works, Inc., Broadwind Services, LLC, Broadwind Towers, Inc., 1309 South Cicero Avenue, LLC, 5100 Neville Road, LLC and AloStar Bank of Commerce (incorporated by reference to Exhibit 10.56 to the Company's Annual Report on Form 10-K for the fiscal year ended December 31, 2012) |
||
90
| Exhibit Number |
Description | ||
|---|---|---|---|
| 10.44 | Second Amendment to Loan and Security Agreement and Waiver, dated as of September 30, 2013, among the Company, Brad Foote Gear Works, Inc., Broadwind Services, LLC, Broadwind Towers, Inc., 1309 South Cicero Avenue, LLC, 5100 Neville Road, LLC and AloStar Bank of Commerce (incorporated by reference to Exhibit 10.1 to the Company's Quarterly Report on Form 10-Q for the quarterly period ended September 30, 2013) | ||
10.45 |
Third Amendment to Loan and Security Agreement and Waiver, dated as of June 25, 2014, among the Company, Brad Foote Gear Works, Inc., Broadwind Services, LLC, Broadwind Towers, Inc., 1309 South Cicero Avenue, LLC, 5100 Neville Road, LLC and AloStar Bank of Commerce (incorporated by reference to Exhibit 10.1 to the Company's Quarterly Report on Form 10-Q for the quarterly period ended June 30, 2014) |
||
10.46 |
Fourth Amendment to Loan and Security Agreement and Waiver, dated as of July 22, 2014, among the Company, Brad Foote Gear Works, Inc., Broadwind Services, LLC, Broadwind Towers, Inc., 1309 South Cicero Avenue, LLC, 5100 Neville Road, LLC and AloStar Bank of Commerce (incorporated by reference to Exhibit 10.2 to the Company's Quarterly Report on Form 10-Q for the quarterly period ended June 30, 2014) |
||
10.47 |
Fifth Amendment to Loan and Security Agreement and Waiver, dated as of November 6, 2014, among the Company, Brad Foote Gear Works, Inc., Broadwind Services, LLC, Broadwind Towers, Inc., 1309 South Cicero Avenue, LLC, 5100 Neville Road, LLC and AloStar Bank of Commerce (filed herewith) |
||
10.48 |
Form of Indemnification Agreement (incorporated by reference to Exhibit 10.6 to the Company's Quarterly Report on Form 10-Q for the quarterly period ended March 31, 2010) |
||
16 |
Letter from Grant Thornton LLP to the Securities and Exchange Commission dated October 31, 2013 (incorporated by reference to Exhibit 16.1 to the Company's Current Report on Form 8-K filed October 31, 2013) |
||
21.1 |
Subsidiaries of the Registrant (filed herewith) |
||
23.1 |
Consent of Grant Thornton LLP (filed herewith) |
||
23.2 |
Consent of KPMG LLP (filed herewith) |
||
31.1 |
Rule 13a-14(a) Certification of Chief Executive Officer (filed herewith) |
||
31.2 |
Rule 13a-14(a) Certification of Chief Financial Officer (filed herewith) |
||
32.1 |
Certification of Chief Executive Officer pursuant to 18 U.S.C. Section 1350, as adopted pursuant to Section 906 of the Sarbanes-Oxley Act of 2002 (filed herewith) |
||
32.2 |
Certification of Chief Financial Officer pursuant to 18 U.S.C. Section 1350, as adopted pursuant to Section 906 of the Sarbanes-Oxley Act of 2002 (filed herewith) |
||
- †
- Indicates management contract or compensation plan or arrangement.
91
Pursuant to the requirements of Section 13 or 15(d) of the Securities Exchange Act of 1934, as amended, the registrant has duly caused this report to be signed on its behalf by the undersigned, thereunto duly authorized, on the 26th day of February, 2015.
| BROADWIND ENERGY, INC. | ||||
By: |
/s/ PETER C. DUPREY PETER C. DUPREY President and Chief Executive Officer (Principal Executive Officer) |
|||
Pursuant to the requirements of the Securities Exchange Act of 1934, as amended, this report has been signed below by the following persons on behalf of the registrant and in the capacities and on the dates indicated.
SIGNATURE
|
TITLE
|
DATE
|
||||
|---|---|---|---|---|---|---|
| /s/ PETER C. DUPREY Peter C. Duprey |
President and Chief Executive Officer and Director (Principal Executive Officer) |
February 26, 2015 | ||||
/s/ STEPHANIE K. KUSHNER Stephanie K. Kushner |
Executive Vice President and Chief Financial Officer (Principal Financial Officer) |
February 26, 2015 |
||||
/s/ ROBERT R. ROGOWSKI Robert R. Rogowski |
Vice President and Corporate Controller (Principal Accounting Officer) |
February 26, 2015 |
||||
/s/ DAVID P. REILAND David P. Reiland |
Director and Chairman of the Board |
February 26, 2015 |
||||
/s/ TERENCE P. FOX Terence P. Fox |
Director |
February 26, 2015 |
||||
/s/ CHARLES H. BEYNON Charles H. Beynon |
Director |
February 26, 2015 |
||||
/s/ THOMAS A. WAGNER Thomas A. Wagner |
Director |
February 26, 2015 |
||||
92