Attached files
| file | filename |
|---|---|
| EX-99.4 - EX-99.4 - MARRIOTT VACATIONS WORLDWIDE Corp | d585026dex994.htm |
| EX-99.3 - EX-99.3 - MARRIOTT VACATIONS WORLDWIDE Corp | d585026dex993.htm |
| EX-99.1 - EX-99.1 - MARRIOTT VACATIONS WORLDWIDE Corp | d585026dex991.htm |
| 8-K - 8-K - MARRIOTT VACATIONS WORLDWIDE Corp | d585026d8k.htm |
Exhibit 99.2
Supplemental Information Regarding MVW and ILG
July 26, 2018
Except where the context otherwise suggests, as used herein, (i) “MVW” refers to Marriott Vacations Worldwide Corporation, a Delaware corporation and the parent company of the Marriott Ownership Resorts, Inc. (the “Issuer”), and its subsidiaries, (ii) “ILG” refers to ILG, Inc., a Delaware corporation and the parent company of Interval Acquisition Corp. (“IAC”), and its subsidiaries; (iii) “Combined Company” refers to MVW and its subsidiaries, following completion of the Combination Transactions (as defined below); (iv) “we,” “our” and “us” refer to MVW, ILG or the Combined Company, as the context requires.
On April 30, 2018, Marriott Vacations Worldwide Corporation entered into that certain Agreement and Plan of Merger, dated as of April 30, 2018, by and among Marriott Vacations Worldwide Corporation, ILG, Inc., Ignite Holdco, Inc., Ignite Holdco Subsidiary, Inc., Volt Merger Sub, Inc. and Volt Merger Sub, LLC, as it may be amended, restated or otherwise modified (the “Merger Agreement”), pursuant to which MVW agreed to acquire ILG through a series of business combinations (the “Combination Transactions”).
The below supplemental information reflects certain information included in the Offering Memorandum and Consent Solicitation Statement dated July 26, 2018.
Overview
We are a leader in the upper upscale and luxury vacation ownership industry, with one of the world’s largest vacation ownership platforms, based on number of owners, number of resorts and revenues. We are the exclusive worldwide developer, marketer, seller and manager of vacation ownership and related products under the Marriott Vacation Club and Grand Residences by Marriott brands. We are also the exclusive worldwide developer, marketer and seller of vacation ownership and related products under The Ritz-Carlton Destination Club brand, and we have the non-exclusive right to develop, market and sell whole ownership residential products under The Ritz-Carlton Residences brand. As of March 31, 2018, our portfolio consisted of over 65 branded vacation ownership properties in the United States and nine other countries and territories.
On April 30, 2018, we entered into an Agreement and Plan of Merger pursuant to which MVW will acquire all of the outstanding shares of ILG in a cash and stock transaction for an implied equity value, based on the closing price of MVW’s common stock on April 27, 2018 of approximately $4.7 billion.
ILG is a leading provider of non-traditional lodging, with a portfolio of leisure businesses ranging from vacation exchange and rental services to vacation ownership, including as the exclusive global vacation ownership licensee for the Hyatt, Sheraton and Westin brands. As of March 31, 2018, ILG managed approximately 250 resorts overall, with 43 of those resorts managed within its vacation ownership business. Through the Interval Network, ILG served almost two million members, while providing access to nearly 3,200 resorts located in over 80 countries.
We expect the Combination Transactions to further our strategic goals and create the industry’s leading global provider of upper upscale vacation ownership, exchange networks and management services. We expect the Combined Company to benefit from expanded capabilities and product offerings, which we believe is consistent with our ongoing focus on the satisfaction of our owners, members, guests and associates. We expect to diversify our revenue streams through an expanded fee-based exchange and third-party management businesses. We believe the opportunity for meaningful cost and revenue synergies will enhance cash flow generation and allow us to optimize our capital structure, creating flexibility to selectively pursue compelling new business opportunities. We believe that we have significant competitive advantages, including our scale and global reach; the quality and strength of the Marriott, Hyatt, Sheraton, Westin, Ritz-Carlton and St. Regis brands in vacation ownership; our systems of high-quality resorts; our loyal and highly satisfied customer base; our long-standing track record; and our experienced management team and associates.
For the twelve months ended March 31, 2018, on a pro forma basis after giving effect to the Combination Transactions, the Combined Company would have generated combined total revenue excluding cost reimbursements of $2,922 million and Adjusted EBITDA of $736 million, inclusive of an estimated $75 million of annual cost synergies, which are expected to be fully realized within two years of the completion of the Combination Transactions, but exclusive of $26 million of estimated lost Adjusted EBITDA from disruption of sales operations and rental and ancillary operations at certain MVW and ILG locations due to one or both of Hurricane Irma and Hurricane Maria in the second half of 2017. For information regarding MVW’s Adjusted EBITDA and a reconciliation of MVW’s Adjusted EBITDA to net income, the most directly comparable GAAP measure, on a pro forma basis for the Combination Transactions, see “—Summary Unaudited Pro Forma Combined Financial Data.”
Marriott Vacations Worldwide
MVW’s Brands
We design, build, manage and maintain our properties at upper upscale and luxury levels in accordance with the Marriott and Ritz-Carlton brand standards with which we must comply under our license agreements with Marriott International and The Ritz-Carlton Hotel Company. Our brands are as follows:
Marriott Vacation Club is our signature offering in the upper upscale tier of the vacation ownership industry. Marriott Vacation Club resorts typically combine many of the comforts of home, such as spacious accommodations with one-, two- and three-bedroom options, living and dining areas, in-unit kitchens and laundry
facilities, with resort amenities such as large feature swimming pools, restaurants and bars, convenience stores, fitness facilities and spas, as well as sports and recreation facilities appropriate for each resort’s unique location. Marriott Vacation Club Pulse, an extension to the Marriott Vacation Club brand, features unique properties that embrace the spirit and culture of their urban locations.
Grand Residences by Marriott is an upper upscale tier vacation ownership and whole ownership residence brand. The accommodations for this brand are similar to those we offer under the Marriott Vacation Club brand, but the duration of the vacation ownership interest (or “VOI”) is longer, generally ranging between three and thirteen weeks. We also offer whole ownership residential products under the Grand Residences by Marriott brand.
The Ritz-Carlton Destination Club is a luxury tier vacation ownership brand. The Ritz-Carlton Destination Club provides luxurious vacation experiences commensurate with the quality standards of the Ritz-Carlton brand. The Ritz-Carlton Destination Club resorts generally feature two, three and four bedroom units that typically include marble foyers, walk-in closets, custom kitchen cabinetry and luxury resort amenities such as large feature swimming pools and access to full service restaurants and bars. On-site management and services, which usually include daily housekeeping service, valet, in-residence dining and access to fitness facilities as well as spa and sports facilities as appropriate for each destination, are provided by The Ritz-Carlton Hotel Company. We also have the non-exclusive rights to develop, market and sell whole ownership residential products under the Ritz-Carlton Residences brand. We co-locate our Ritz-Carlton Residences brand properties with The Ritz-Carlton Destination Club resorts.
MVW’s Sources of Revenue
We generate most of our revenues from four primary sources: (1) selling vacation ownership products, (2) financing consumer purchases of vacation ownership products, (3) managing our resorts and providing other services and (4) renting vacation ownership inventory.
Sale of Vacation Ownership Products
Our principal source of revenue is the sale of VOIs. We sell the majority of our products through our Marriott Vacation Club points-based ownership programs focused on North America and Asia Pacific. While the structural characteristics of each of our points-based programs differ, through each program, owners receive an annual allotment of points representing owners’ usage rights, which owners can use to access vacation ownership units across multiple destinations within their program’s portfolio of resort locations
Financing
We earn interest income on loans that we provide to purchasers of our VOIs, as well as loan servicing and other fees. We offer financing for purchasers of our vacation ownership products who meet certain underwriting guidelines. These loans, collateralized by the VOIs and the related receivables, are typically securitized.
Resort Management and Other Services
We generate revenue from fees we earn for managing our resorts. In addition, we earn revenue for providing ancillary offerings, including food and beverage, retail and golf and spa offerings at our resorts. We also receive annual fees, club dues from members within our own Marriott Vacation Club Destinations (“MVCD”) network and certain transaction-based fees from owners and other third parties, including external exchange service providers with which we are associated (including Interval International, the provider of the Interval Network).
Rental
We generate revenue from rentals of inventory that we hold for sale as interests in our vacation ownership programs or as residences, or inventory that we control because our owners have elected alternative usage options permitted under our vacation ownership programs.
ILG
ILG is a leading provider of non-traditional lodging, with a portfolio of leisure businesses ranging from vacation exchange and rental services to vacation ownership, including as the exclusive global vacation ownership licensee for the Hyatt, Sheraton and Westin brands. ILG offers its owners, members and guests access to an array of benefits and services, as well as world-class destinations through its international portfolio of resorts and clubs. ILG operates the following two business segments:
| • | Vacation Ownership (“VO”), which engages in the development, marketing, sales and financing of VOIs, management of vacation ownership resorts and related services to owners; and |
| • | Exchange and Rental, which offers access to vacation accommodations and other travel-related transactions and services to leisure travelers, by providing vacation exchange services and management services, including vacation rentals and other services it provides to resort developers and homeowners’ associations (“HOAs”), as well as operating vacation rental properties. |
ILG’s Brands
Through its Vacation Ownership and Exchange and Rental segments, ILG operates under a number of well-known brands with a long history.
Vistana Signature Experiences (“Vistana”) comprises the vacation ownership business of the Sheraton and Westin brands pursuant to ILG’s exclusive global license with Starwood Hotels and Resorts LLC, a wholly-owned subsidiary of Marriott International. In addition, ILG has a license to use the St. Regis and Luxury Collection brands for specific fractional ownership resorts.
Hyatt Vacation Ownership (“HVO”) is an upper upscale tier brand of the vacation ownership industry. ILG holds the exclusive global license with Hyatt for vacation ownership products.
Through the Sheraton, Westin, St. Regis and Hyatt vacation ownership brands, ILG develops, markets, sells and manages VOIs in resorts located in attractive destinations and provides upper upscale and luxury accommodations with studio, one-, two- and three-bedroom options.
Under the Vacation Resorts International (“VRI”), VRI Europe (“VRI Europe”) and Trading Places International (“TPI”) brands, ILG provides resort management services for vacation ownership resorts, including day-to-day operations, maintenance and certain administrative services for HOAs.
The Interval Network is ILG’s primary exchange offering. The Interval Network is a membership-based exchange program that also provides a comprehensive package of value-added products and services. Generally, individuals are enrolled by resort developers in connection with their purchase of VOIs from such resort developers, with initial membership fees being paid on behalf of members by the resort developers.
ILG also offers exchange services through its Vistana Signature Network and Hyatt Residence Club platforms, which allow VOI owners to participate in exchange programs within those resort collections and through the Interval Network, as well as through TPI’s programs for TPI and VRI managed resorts and direct-to-consumer exchanges.
The Aqua-Aston business provides vacation property rental services and management services on a fee-for-service basis to 40 hotels and resorts primarily located in Hawaii.
ILG’s Sources of Revenue
As of March 31, 2018, ILG had a total of 43 managed resorts within its Vistana and HVO businesses and more than 200 resorts through its VRI, VRI Europe, TPI and Aqua-Aston businesses. Through the Interval Network, ILG served almost two million members, while providing access to nearly 3,200 resorts located in over 80 countries.
Sales and Marketing of VOIs
Vistana and HVO sell VOIs in resorts currently located in the United States, Mexico and the Caribbean. Any sale of a VOI includes mandatory membership in an HOA along with ownership points that offer usage at a specific resort or group of resorts.
Consumer Financing
In connection with the sales of VOIs, ILG provides financing to purchasers who meet certain underwriting criteria. These loans, collateralized by the VOIs and the related receivables, are typically securitized.
Management and Ancillary Services
ILG provides management services to approximately 250 vacation ownership properties and/or their HOAs. The services provided may include day-to-day operations of the resorts, maintenance of the resorts, preparation of reports and budgets, HOA administration, risk management, quality assurance and employee training. ILG’s management services are provided pursuant to agreements with terms generally ranging from one to ten years, many of which are automatically renewable.
Vacation Rental
ILG provides vacation rentals as the key component of a comprehensive package of marketing, management and rental services offered to vacation property owners. This business provides vacation property rental services for condominium owners, hotel owners and HOAs, and revenue is derived principally from fees for rental services and related management services.
Exchange Services / Transactional Revenue
ILG earns most of its exchange revenue from fees paid for membership in the Interval Network, Vistana Signature Network and Hyatt Residence Club and transaction and service fees paid for exchanges, reservation servicing and related transactions. Generally, individuals are enrolled by resort developers in connection with their purchase of VOIs, but members may also enroll directly. Annual fees may be paid by resort developers on behalf of their owners or by individual members. ILG also derives revenue from club rentals, fees for ancillary products and services provided to members, fees from other exchange and rental programs and other products and services sold to developers.
Combination Rationale
We believe that the Combined Company benefits from a number of competitive strengths. By combining two of the premier global vacation ownership companies, we expect the Combination Transactions to provide significant strategic and financial benefits, including long-term, exclusive access to world-class vacation ownership brands, enhanced scale, contribution from higher-margin recurring revenue streams, incremental growth opportunities, identifiable cost synergies and robust cash flow.
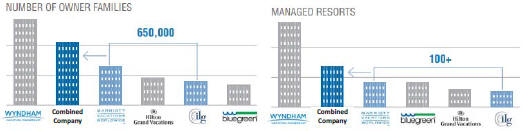
Creates Leading Upper Upscale Vacation Ownership Business. Upon completion of the Combination Transactions, we will create the industry’s leading global upper upscale branded vacation ownership business. The Combined Company will be the global licensee of seven upper upscale and luxury vacation brands, including Marriott Vacation Club, Grand Residences by Marriott, The Ritz-Carlton Destination Club, Sheraton Vacation Club, Westin Vacation Club, St. Regis Residence Club and Hyatt Residence Club. The Combined Company’s licenses with Marriott International and Hyatt provide exclusive access to several world-class loyalty programs, including Marriott Rewards, The Ritz-Carlton Rewards and Starwood Preferred Guest (the “Marriott Loyalty Programs”) and Hyatt’s loyalty program, World of Hyatt. In addition, our licensing agreements enable us to benefit from Marriott’s and Hyatt’s reservation platforms and provide us with the opportunity to market to guests at their hotel properties. These highly-identifiable vacation ownership brands have over 650,000 owners and approximately 110 vacation ownership properties.
Adding Brands and Growing Scale
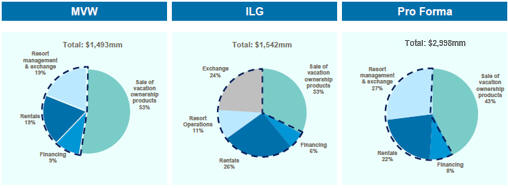
Increased Revenue Diversification with the Addition of Recurring Fee-Based Revenue. We believe that the addition of ILG’s exchange and resort management businesses will enhance our margins and significantly diversify our revenue profile, creating the opportunity to realize recurring, margin enhancing, fee-based revenue streams. During the twelve-month period ended March 31, 2018, over 50% of our total pro forma revenue was generated by recurring revenue streams, including resort management and exchange revenues, rentals and financing revenues.
Net Revenue for the Twelve-Month Period Ended March 31, 2018
 Recurring and fee-based revenue
 |
Note: Revenues shown in the charts above exclude cost reimbursements and include an estimated adjustment of $36 million, $40 million and $76 million for MVW, ILG and pro forma, respectively, for the impact of the 2017 hurricanes on revenues during the period.
Through ILG’s exchange businesses, ILG receives annual membership dues and recurring transaction fees from approximately 1.8 million members of the Interval Network and club dues from Vistana Signature Network and Hyatt Residence Club members. Over 40% of ILG’s exchange-related revenue excluding cost reimbursement is derived from membership and club dues. Memberships are typically structured to have one- to five-year terms with automatic renewal features and ILG has continued to increase its corporate membership in the Interval Network. As
of December 31, 2017, approximately 43% of all members in the Interval Network comprised individuals enrolled through corporate developer accounts. In addition, Marriott Vacation Club, Vistana and HVO affiliated members represent approximately one-third of the Interval Network’s 1.8 million members. This significant contribution of members affiliated with the Company’s brands should stabilize a large portion of the Interval Network’s member base.
Through its Vistana, HVO, VRI, and TPI brands, ILG provides vacation ownership management services through cost-plus or fee-for-service agreements to approximately 250 resorts. Management services are typically provided pursuant to agreements with terms ranging from one to ten years, many of which are automatically renewable. The addition of capital-light, recurring revenue creates an opportunity to continue to grow our revenue base in a margin accretive manner over time.
Significant Cost and Revenue Synergies as a Result of the Strategic Combination. We believe there is a significant opportunity to rationalize costs across both companies. We believe a minimum of $75 million of annual run rate cost synergies, primarily related to redundancies and managing the Combined Company more efficiently, can be realized within two years of the closing of the Combination Transactions. In addition, we believe we may achieve incremental cost savings and revenue synergies during and following integration that have not yet been identified and are not included in those estimates. We expect to achieve growth after the closing of the Combination Transactions from the enhanced marketing capabilities across the expanded portfolio and owner and guest network and the expansion of certain exclusive marketing rights through our recently amended license agreement with Marriott International, which will drive incremental tours and sales in Vistana’s properties.
Competitive Strengths
Premier Global Brands With Exclusive Access to Expansive Customer Bases. We believe that our exclusive licenses with Marriott International and Hyatt for premier global brands in the vacation ownership business provide us with a meaningful competitive advantage. Marriott International is a leading lodging company with more than 6,500 hotels in 127 countries and territories. In addition, Hyatt has over 700 affiliated hotels globally. Consumer confidence in these renowned brands helps us attract and retain guests and owners. In addition, through our six Marriott vacation ownership brands, we will benefit from the exclusive long-term access to approximately 100 million members in Marriott Loyalty Programs. We believe this exclusive access to guests with an affinity for our brands aids our marketing efforts and significantly enhances our ability to drive future sales, as MVW generates nearly 80% of its VOI sales through brand loyalty-affiliated sales channels. We also expect to leverage our exclusive call transfer, on-site marketing at branded hotels, and use of certain exclusive marketing rights to increase sales across all of our Marriott-affiliated vacation ownership properties.
Through ILG’s relationship with Hyatt, we will also have the exclusive rights to develop, market and sell through the HVO programs, which will provide access to the almost 10 million members of the World of Hyatt loyalty program.
Capital Efficient Business Model Providing Strong Free Cash Flow and Financial Flexibility. We believe that the increased scale, recurring revenue fee streams and enhanced margin profile of the Combined Company will enable us to maintain flexibility for continued organic growth, strategic acquisitions and debt repayment with more than 50% of total pro forma revenue for the twelve-month period ended March 31, 2018 not dependent upon the sale of VOIs. The addition of ILG’s exchange networks and resort management businesses creates ample opportunities to realize recurring higher-margin, fee-based revenue streams with modest required capital expenditures, enhancing our margins and free cash flow generation over time.
In addition, as of March 31, 2018, MVW and ILG had finished vacation ownership inventory balances of $372 million and $493 million, respectively. MVW’s disciplined inventory approach and use of capital efficient deal structures, including working with third parties that develop new inventory or convert previously built units that are sold to us close to when such inventory is needed to support sales, is expected to support strong free cash flow generation.
Long-standing Track Record and Experienced Management. We have been a pioneer in the vacation ownership industry since 1984, when Marriott International became the first company to introduce a lodging-branded vacation ownership product. Our seasoned management team is led by Stephen P. Weisz, our President and Chief Executive Officer. Mr. Weisz has served as President of our company since 1996 and has over 45 years of combined experience at Marriott International and MVW. William J. Shaw, the Chairman of our Board of Directors, is the former Vice Chairman, President and Chief Operating Officer of Marriott International and spent nearly 37 years with Marriott International. In addition, our Chief Financial and Administrative Officer, John E. Geller, Jr. has 13 years of industry experience and spent nine years with Marriott International and MVW. We believe our management team’s extensive public company and vacation ownership industry experience has enabled us to achieve solid operating results and will enable us to continue to respond quickly and effectively to changing market conditions and consumer trends.
Engaged Associates Delivering High Levels of Customer Service Driving Repeat Customers. We believe that our associates provide superior customer service as evidenced by customer satisfaction scores of 91 and this dedication to serving the customer enhances our competitive position. Approximately 62% of the Combined Company’s contract sales in 2017 were to existing owners, which enabled them to enjoy longer stays and have greater flexibility in their vacation choices. Sales to existing owners typically have significantly lower sales and marketing costs than sales to new owners.
We leverage outstanding associate engagement and a strong corporate culture to help deliver positive customer experiences in sales, marketing and resort operations. We survey our associates regularly through an external survey provider to understand their satisfaction and engagement, defined as how passionate employees are about the company’s mission and their willingness to “go the extra mile” to see it succeed. MVW routinely ranks highly compared to other companies participating in such surveys. In 2017, 85% of MVW’s associates indicated that they were “engaged,” which is eight points above Aon Hewitt’s “Global Best Employer” benchmark of 77%. This external benchmark is based on research conducted by Aon Hewitt of more than 500 organizations that are considered to be “Best Employers.”
Business Strategy
Our strategic goal is to further strengthen our leadership position in the vacation ownership, exchange, management and rental industry. To achieve this goal, we are pursuing the following initiatives:
Drive Profitable Contract Sales Growth and Associated Management, Rental and Consumer Financing Revenue. We intend to continue to generate growth in vacation ownership sales by leveraging our globally recognized brand names and targeting high-quality inventory that allows us to add desirable new destinations with on-site sales locations. We expect to focus our efforts to generate growth through our integrated platform that provides exclusive access to the world-class loyalty programs of Marriott International and Hyatt. We will also continue to focus on the satisfaction of our approximately 650,000 owners around the world. In 2017, approximately 62% of the Combined Company’s sales of vacation ownership products were to our existing owners. In addition, we are concentrating on cost effectively growing our first-time buyer tours to achieve our longer term goal of selling to a balanced mix of new buyers and existing buyers. Our strategy includes an emphasis on new sales locations and new marketing channels geared toward driving first-time buyer tour growth.
As the combined vacation ownership business continues to grow sales and we add new resorts, our non-sales based vacation ownership revenue streams from consumer financing, management fees, rentals and ancillary services, are expected to grow.
Expand Revenues from Recurring, Exchange and Third-Party Management Businesses. We plan to grow our revenues from ILG’s recurring, exchange and third-party management businesses. ILG provides management services to more than 200 vacation ownership properties and homeowners’ associations in the United States, Mexico, the Caribbean and Europe. All of these businesses provide resort management services for vacation ownership resorts, which in the United States are governed by a board of directors comprised of owner or developer representatives that are charged with ensuring the resorts are well-maintained and financially stable. Our services may include day-to-day operations of the resorts, maintenance of the resorts, preparation of reports, budgets, HOA administration, risk management, quality assurance and employee training. The fees we receive in this business are more predictable due to the relatively fixed nature of resort operating expenses and contractual agreements that typically span many years and are often automatically renewable.
Focus on the Satisfaction of Our Owners and Guests to Drive Repeated Sales. We are in the business of providing high-quality vacation experiences to our owners and guests around the world, and we believe that maintaining a high level of engagement across all of our customer groups is key to our success. We intend to maintain and improve their satisfaction with our products and services, which drives incremental sales as customers choose to spend more time at our resorts. Because our existing owners and guests are our most cost-effective sales channels, we intend to continue leveraging our strong customer satisfaction to drive higher margin sales volumes. We intend to provide innovative offerings in new destinations to meet the needs of current and future customers and intend to develop new offerings to attract the next generation of travelers looking for a greater variety of experiences with the high quality standards expected from brands they trust.
Maximize Cash Flow, Optimize Our Capital Structure and Pursue De-leveraging. Through the use of the Combined Company’s points-based products, we are able to more closely match inventory investment with sales pace and reduce inventory levels, thereby maximizing strong cash flows over time. Limiting the amount of completed inventory on hand and pursuing capital efficient inventory arrangements enable us to reduce the maintenance fees we pay on unsold inventory. In addition, we proactively buy back previously sold VOIs at lower costs than would be required to develop new inventory.
We expect to have an attractive leverage profile after giving pro forma effect to the Transactions. As of March 31, 2018, on an as adjusted basis after giving effect to the Transactions, we would have had corporate debt of approximately $2,555 million, and for the twelve months ended March 31, 2018, on a pro forma basis after giving effect to the Transactions, our Adjusted EBITDA would have been $736 million (including an estimated $75 million of annual cost synergies, but excluding of $26 million of estimated lost Adjusted EBITDA from disruption of sales operations and rental and ancillary operations at certain MVW and ILG locations due to one or both of Hurricane Irma and Hurricane Maria in the second half of 2017), resulting in an as adjusted corporate net debt to Adjusted EBITDA ratio of approximately 3.21x for the twelve-month period ended March 31, 2018. See “—Summary Unaudited Pro Forma Combined Financial Data” for a reconciliation of Adjusted EBITDA to net income, the most directly comparable GAAP measure on a pro forma basis.
We intend to meet our ongoing liquidity needs through cash on hand, operating cash flow, a $600 million five-year Revolving Credit Facility that we expect to enter into in connection with the Transactions, our existing $250 million warehouse credit facility and continued access to the asset-backed securities term financing market. We believe that this will enable the Combined Company to maintain a level of liquidity that ensures financial flexibility, which will allow us to optimize our cost of capital, de-lever, help us withstand potential future economic downturns and continue to pursue compelling new business opportunities.
Selectively Pursue Compelling New Business Opportunities. We are positioned to explore new business opportunities, such as the continued enhancement of our exchange programs, new management affiliations and acquisitions of existing vacation ownership and related businesses. We intend to selectively pursue these types of opportunities, focusing on those that drive recurring revenue and profit streams. Prior to entering into any new business opportunity, we will evaluate its strategic fit and assess whether it is complementary to our current business, has strong expected financial returns and complements our existing competencies.
SUMMARY HISTORICAL FINANCIAL DATA OF MVW
The following table presents MVW’s summary historical financial data, which was derived from MVW’s last three fiscal years of consolidated financial statements and related notes. The summary historical financial data of MVW set forth below does not include the effects of the Combination Transactions. The summary historical financial data as of and for each of the fiscal years ended December 31, 2017, December 30, 2016 and January 1, 2016 is derived from MVW’s audited consolidated financial statements included in MVW’s Current Report on Form 8-K filed with the SEC on June 5, 2018, which is incorporated by reference in this offering memorandum and consent solicitation statement. MVW’s audited consolidated financial statements included in MVW’s Annual Report on Form 10-K for the fiscal year ended December 31, 2017 did not reflect the adoption of ASC 606. As MVW adopted ASC 606 effective January 1, 2018 on a retrospective basis, MVW recast its audited consolidated financial statements to reflect the adoption of ASC 606 as of January 3, 2015, the first day of its fiscal year ended January 1, 2016 in MVW’s Current Report on Form 8-K filed with the SEC on June 5, 2018.
The summary historical financial data for MVW as of March 31, 2018 and for the three months ended March 31, 2018 and March 31, 2017 are derived from MVW’s unaudited consolidated financial statements and related notes contained in its Quarterly Report on Form 10-Q for the three months ended March 31, 2018, which is incorporated by reference into this offering memorandum and consent solicitation statement. The unaudited financial data presented has been prepared on a basis consistent with MVW’s audited consolidated financial statements as recast in MVW’s Current Report on Form 8-K filed with the SEC on June 5, 2018 reflecting the adoption of ASC 606. In the opinion of MVW’s management, such unaudited financial data reflect all adjustments, consisting only of normal and recurring adjustments, necessary for a fair presentation of the results for those periods. The results of operations for the interim periods are not necessarily indicative of the results to be expected for the full year or any future period.
Historical results are not necessarily indicative of the results that may be expected for any future period or any future date. Because this information is only a summary and does not provide all of the information contained in MVW’s consolidated financial statements, including the related notes, this summary historical financial data should be read in conjunction with MVW’s Current Reports on Form 8-K filed with the SEC on June 5, 2018 and July 19, 2018 and MVW’s Quarterly Report on Form 10-Q for the quarterly period ended March 31, 2018 filed with the SEC on May 4, 2018.
| Three Months Ended March 31, |
Fiscal Year | |||||||||||||||||||
| ($ in millions, except operating statistics) | 2018 | 2017(1) | 2017(1) | 2016(1) | 2015(1) | |||||||||||||||
| Consolidated Statement of Income Data: |
||||||||||||||||||||
| Revenues |
||||||||||||||||||||
| Sale of vacation ownership products |
$ | 175 | $ | 164 | $ | 757 | $ | 623 | $ | 693 | ||||||||||
| Resort management and other services |
70 | 67 | 279 | 278 | 269 | |||||||||||||||
| Financing |
35 | 32 | 135 | 127 | 125 | |||||||||||||||
| Rental |
75 | 68 | 262 | 252 | 260 | |||||||||||||||
| Cost reimbursements |
216 | 197 | 750 | 720 | 720 | |||||||||||||||
|
|
|
|
|
|
|
|
|
|
|
|||||||||||
| Total Revenues |
571 | 528 | 2,183 | 2,000 | 2,067 | |||||||||||||||
|
|
|
|
|
|
|
|
|
|
|
|||||||||||
| Expenses |
||||||||||||||||||||
| Cost of vacation ownership products |
46 | 44 | 194 | 163 | 218 | |||||||||||||||
| Marketing and sales |
107 | 98 | 395 | 340 | 317 | |||||||||||||||
| Resort management and other services |
38 | 37 | 155 | 157 | 163 | |||||||||||||||
| Financing |
4 | 4 | 18 | 19 | 21 | |||||||||||||||
| Rental |
56 | 53 | 223 | 212 | 211 | |||||||||||||||
| General and administrative |
29 | 28 | 110 | 105 | 106 | |||||||||||||||
| Litigation settlement |
— | — | 4 | (1 | ) | — | ||||||||||||||
| Organizational and separation related |
— | — | — | — | 1 | |||||||||||||||
| Consumer financing interest |
7 | 6 | 25 | 24 | 25 | |||||||||||||||
| Three Months Ended March 31, |
Fiscal Year | |||||||||||||||||||
| ($ in millions, except operating statistics) | 2018 | 2017(1) | 2017(1) | 2016(1) | 2015(1) | |||||||||||||||
| Royalty fee |
15 | 16 | 63 | 61 | 59 | |||||||||||||||
| Impairment |
— | — | — | — | 1 | |||||||||||||||
| Cost reimbursements |
216 | 197 | 750 | 720 | 720 | |||||||||||||||
|
|
|
|
|
|
|
|
|
|
|
|||||||||||
| Total Expenses |
518 | 483 | 1,937 | 1,800 | 1,842 | |||||||||||||||
|
|
|
|
|
|
|
|
|
|
|
|||||||||||
| Gains and other income, net |
1 | — | 6 | 11 | 10 | |||||||||||||||
| Interest expense |
(4 | ) | (1 | ) | (10 | ) | (9 | ) | (13 | ) | ||||||||||
| Other |
(3 | ) | — | (2 | ) | (4 | ) | (8 | ) | |||||||||||
|
|
|
|
|
|
|
|
|
|
|
|||||||||||
| Income before income taxes |
47 | 44 | 240 | 198 | 214 | |||||||||||||||
| Provision for income taxes |
(11 | ) | (16 | ) | (5 | ) | (76 | ) | (87 | ) | ||||||||||
|
|
|
|
|
|
|
|
|
|
|
|||||||||||
| Net income |
$ | 36 | $ | 28 | $ | 235 | $ | 122 | $ | 127 | ||||||||||
|
|
|
|
|
|
|
|
|
|
|
|||||||||||
| Consolidated Statement of Cash Flows Data: |
||||||||||||||||||||
| Net cash flows provided by (used in): |
||||||||||||||||||||
| Operating activities |
$ | 23 | $ | 46 | $ | 142 | $ | 141 | $ | 119 | ||||||||||
| Investing activities |
$ | (12 | ) | $ | (13 | ) | $ | (38 | ) | $ | 34 | $ | (63 | ) | ||||||
| Financing activities |
$ | (119 | ) | $ | (81 | ) | $ | 171 | $ | (206 | ) | $ | (259 | ) | ||||||
| Consolidated Balance Sheet Data: |
||||||||||||||||||||
| Cash and cash equivalents |
$ | 324 | $ | 102 | $ | 409 | $ | 147 | $ | 177 | ||||||||||
| Total assets |
$ | 2,760 | $ | 2,276 | $ | 2,845 | $ | 2,320 | $ | 2,351 | ||||||||||
| Long-term debt, gross |
$ | 1,060 | $ | 692 | $ | 1,146 | $ | 746 | $ | 688 | ||||||||||
| Total equity |
$ | 1,066 | $ | 915 | $ | 1,041 | $ | 895 | $ | 979 | ||||||||||
| Other Consolidated Financial Data: |
||||||||||||||||||||
|
EBITDA(2) |
$ | 57 | $ | 50 | $ | 271 | $ | 228 | $ | 249 | ||||||||||
| Adjusted EBITDA(2) |
$ | 63 | $ | 54 | $ | 294 | $ | 237 | $ | 257 | ||||||||||
| Adjusted free cash flow(3) |
$ | 57 | $ | 77 | $ | 253 | $ | 160 | $ | 239 | ||||||||||
| Selected Operating Statistics: |
||||||||||||||||||||
| Contract sales(4) |
204 | 200 | 826 | 741 | 747 | |||||||||||||||
| Number of managed resorts (as of period end)(5) |
69 | 67 | 69 | 67 | 62 | |||||||||||||||
| Volume per guest (North America)(6) |
3,728 | 3,691 | 3,565 | 3,462 | 3,386 | |||||||||||||||
| Financing |
||||||||||||||||||||
| Average FICO score (United States)(7) |
740 | 740 | 743 | 741 | 736 | |||||||||||||||
| Historical default rate(8) |
0.7 | % | 0.9 | % | 3.6 | % | 3.8 | % | 3.5 | % | ||||||||||
| Financing propensity(9) |
61.7 | % | 66.1 | % | 64.0 | % | 60.1 | % | 49.9 | % | ||||||||||
| (1) | In 2017, MVW changed to a calendar year-end and end-of-month quarterly reporting cycle. Earlier fiscal years ended on the Friday closest to December 31. As a result of the change in its financial reporting cycle, MVW’s quarter ended March 31, 2017 was composed of 91 days and its 2017, 2016 and 2015 fiscal years were composed of 366 days, 364 days and 364 days, respectively. |
| (2) | MVW defines EBITDA, a financial measure that is not prescribed by GAAP, as earnings, or net income, before interest expense (excluding consumer financing interest expense), income taxes, depreciation and amortization. MVW defines Adjusted EBITDA, a financial measure that is not prescribed by GAAP, as EBITDA, adjusted for non-cash share-based compensation expense and certain other items. For purposes of MVW’s EBITDA and Adjusted EBITDA calculations, MVW does not adjust for consumer financing interest expense as MVW considers it to be an operating expense of its business. EBITDA and Adjusted EBITDA have limitations and should not be considered in isolation or as a substitute for performance measures calculated in accordance with GAAP. See “Presentation of Financial and Other information—Non-GAAP Financial Measures of MVW and ILG.” |
The following table presents a reconciliation of MVW’s net income, the most directly comparable GAAP measure, to EBITDA and Adjusted EBITDA for the three months ended March 31, 2018 and 2017 and for the fiscal years ended December 31, 2017, December 30, 2016 and January 1, 2016.
| Three Months Ended March 31, |
Fiscal Year | |||||||||||||||||||
| ($ in millions) | 2018 | 2017(a) | 2017(a) | 2016(a) | 2015(a) | |||||||||||||||
| Net income |
$ | 36 | $ | 28 | $ | 235 | $ | 122 | $ | 127 | ||||||||||
| Interest expenses (excluding consumer financing interest expense) |
4 | 1 | 10 | 9 | 13 | |||||||||||||||
| Tax (benefit) provision |
11 | 16 | 5 | 76 | 87 | |||||||||||||||
| Depreciation and amortization |
6 | 5 | 21 | 21 | 22 | |||||||||||||||
|
|
|
|
|
|
|
|
|
|
|
|||||||||||
| EBITDA |
57 | 50 | 271 | 228 | 249 | |||||||||||||||
| Non-cash share-based compensation |
4 | 3 | 16 | 14 | 14 | |||||||||||||||
| Certain items(b) |
3 | — | 7 | (5 | ) | (6 | ) | |||||||||||||
|
|
|
|
|
|
|
|
|
|
|
|||||||||||
| Adjusted EBITDA |
$ | 63 | $ | 54 | $ | 294 | $ | 237 | $ | 257 | ||||||||||
|
|
|
|
|
|
|
|
|
|
|
|||||||||||
| (a) | In 2017, MVW changed to a calendar year-end and end-of-month quarterly reporting cycle. Earlier fiscal years ended on the Friday closest to December 31. As a result of the change in its financial reporting cycle, MVW’s quarter ended March 31, 2017 was composed of 91 days and its 2017, 2016 and 2015 fiscal years were composed of 366 days, 364 days and 364 days, respectively. |
| (b) | “Certain items” for the 2018 first quarter consisted of $3 million of acquisition costs, including $2 million of acquisition costs associated with the anticipated future acquisition of an operating property in San Francisco, California and $1 million of other acquisition costs, partially offset by a less than $1 million favorable true up of previously recorded costs associated with Hurricane Irma and Hurricane Maria (recorded in gains and other income) and a less than $1 million true up of previously recorded litigation settlement expenses. These exclusions increased Adjusted EBITDA by $3 million. |
“Certain items” for the 2017 first quarter primarily consisted of $1 million of acquisition costs. These exclusions increased Adjusted EBITDA by $1 million.
The “certain items” reflected in Adjusted EBITDA for 2017 consisted of $9 million in net insurance proceeds related to the settlement of business interruption insurance claims arising from Hurricane Matthew, $7 million of variable compensation expense related to the impact of the 2017 Hurricanes, $4 million of litigation settlement expenses, $2 million of acquisition costs, a charge of $1 million associated with the estimated property damage insurance deductibles and impairment of property and equipment at several of MVW’s resorts, primarily in Florida and the Caribbean, that were impacted by the 2017 Hurricanes, $1 million of variable compensation expense related to the impact of Hurricane Matthew and less than $1 million of miscellaneous losses and other expense. These adjustments increased Adjusted EBITDA for 2017 by $7 million. MVW estimates that the effects of Hurricane Irma and Hurricane Maria negatively impacted Adjusted EBITDA by approximately $7 million in 2017. Adjusting for that impact, Adjusted EBITDA in 2017 would have totaled approximately $301 million.
The “certain items” reflected in Adjusted EBITDA for 2016 consisted of $11 million of gains and other income not associated with MVW’s on-going core operations, $5 million of acquisition costs, $1 million of hurricane related expenses, less than $1 million of profit from the operations of the portion of the property MVW acquired in Surfers Paradise, Australia in 2015 that MVW sold in the second quarter of 2016, and a less than $1 million reversal of litigation settlement expense. In the aggregate, these adjustments decreased EBITDA for 2016 by $5 million. MVW estimates that the effects of Hurricane Matthew negatively impacted Adjusted EBITDA by approximately $4 million in the fourth quarter of 2016. Adjusting for that impact, Adjusted EBITDA in 2016 would have totaled approximately $241 million.
The “certain items” reflected in Adjusted EBITDA for 2015 consisted of $10 million of gains and other income not associated with MVW’s on-going core operations, $8 million of transaction costs associated with acquisitions, $6 million of development profit from the disposition of units in Macau as whole ownership residential units rather than through the Marriott Vacation Club, Asia Pacific points program, $2 million of refurbishment costs, $2 million of profit from the operations of the portion of the property MVW acquired in Surfers Paradise, Australia in 2015 that MVW sold in the second quarter of 2016, $1 million of organizational and separation related costs, less than $1 million of impairment charges and a less than $1 million reversal of litigation settlement expense. In the aggregate, these adjustments decreased Adjusted EBITDA for 2015 by $6 million.
| (3) | Adjusted free cash flow is a non-GAAP measure, which MVW defines as net cash, cash equivalents and restricted cash provided by operating activities less capital expenditures for property and equipment (excluding inventory), changes in restricted cash, and the borrowing and repayment activity related to MVW’s securitizations and certain other adjustments set forth in the table below. |
The following table presents a reconciliation of MVW’s net cash, cash equivalents and restricted cash provided by operating activities, the most directly comparable GAAP measure, to adjusted free cash flow for the three months ended March 31, 2018 and 2017 and for the fiscal years ended December 31, 2017, December 30, 2016 and January 1, 2016.
| Three Months Ended March 31, |
Fiscal Year | |||||||||||||||||||
| 2018 | 2017(a) | 2017(a) | 2016(a) | 2015(a) | ||||||||||||||||
| ($ in millions) | ||||||||||||||||||||
| Net cash, cash equivalents and restricted cash provided by operating activities |
$ | 23 | $ | 46 | $ | 142 | $ | 141 | $ | 119 | ||||||||||
| Capital expenditures for property and equipment (excluding inventory) |
(3 | ) | (4 | ) | (19 | ) | (17 | ) | (20 | ) | ||||||||||
| New sales centers(b) |
— | (1 | ) | (7 | ) | (18 | ) | (12 | ) | |||||||||||
| Organizational and separation related capital expenditures |
— | — | — | — | (4 | ) | ||||||||||||||
| Investment in operating portion of Surfers Paradise hotel that will be sold(c) |
— | — | — | — | (48 | ) | ||||||||||||||
| Decrease (increase) in restricted cash |
21 | 2 | (15 | ) | 5 | 38 | ||||||||||||||
| Borrowings from securitization transactions |
— | — | 400 | 377 | 255 | |||||||||||||||
| Repayment of debt related to securitizations |
(86 | ) | (54 | ) | (293 | ) | (323 | ) | (278 | ) | ||||||||||
| Organizational and separation related and other charges |
— | — | — | — | 8 | |||||||||||||||
| Proceeds from sale of operating portion of Surfers Paradise hotel(c) |
— | — | — | — | 48 | |||||||||||||||
| Accelerated payment of liability for Marriott Rewards customer loyalty program(d) |
— | — | — | — | 66 | |||||||||||||||
| Transaction costs |
3 | — | — | — | — | |||||||||||||||
| Net change in borrowings available from the securitization of eligible vacation ownership notes receivable through the warehouse credit facility(e) |
99 | 88 | 45 | (5 | ) | 67 | ||||||||||||||
| Adjusted free cash flow |
$ | 57 | $ | 77 | $ | 253 | $ | 160 | $ | 239 | ||||||||||
| (a) | In 2017, MVW changed to a calendar year-end and end-of-month quarterly reporting cycle. Earlier fiscal years ended on the Friday closest to December 31. As a result of the change in its financial reporting cycle, MVW’s quarter ended March 31, 2017 was composed of 91 days and its 2017, 2016 and 2015 fiscal years were composed of 366 days, 364 days and 364 days, respectively. |
| (b) | Represents incremental investment in new sales centers, mainly to support new sales distributions. |
| (c) | Represents the estimated investment in, as well as the estimated proceeds from the subsequent sale of, the operating portion of the Surfers Paradise hotel. |
| (d) | Represents the portion of the first quarter of 2016 liability for a Marriott Rewards customer loyalty program payment that was accelerated in to the fourth quarter of 2015. |
| (e) | Represents the net change in borrowings available from the securitization of eligible vacation ownership notes receivable through the warehouse credit facility between the 2016/2015/2014 and 2017/2016/2015 year ends. |
| (4) | Contract sales consist of the total amount of vacation ownership product sales under contract signed during the period where MVW has received a down payment of at least ten percent of the contract price, reduced by actual rescissions during the period, inclusive of contracts associated with sales of vacation ownership products on behalf of third parties, which MVW refers to as “resales contract sales.” In circumstances where a customer applies any or all of their existing ownership interests as part of the purchase price for additional interests, MVW includes only the incremental value purchased as contract sales. Contract sales differ from revenues from the sale of vacation ownership products that MVW reports in its income statements due to the requirements for revenue recognition described in Note 1, “Summary of Significant Accounting Policies,” accompanying MVW’s audited consolidated financial statements included in MVW’s Current Report on Form 8-K filed with the SEC on June 5, 2018, which is incorporated by reference in this offering memorandum and consent solicitation statement. MVW considers contract sales to be an important operating measure because it reflects the pace of sales in MVW’s business. |
| (5) | Number of managed resorts for the three months ended March 31, 2017 excludes an operating property owned by a third party located in San Francisco, California for which substantially all of the management activities were sub-contracted to a third party. Number of managed resorts for the fiscal year ended January 1, 2016 excludes operating properties owned by MVW located in San Diego, California and Surfers Paradise, Queensland, Australia and units in an operating hotel located in Washington, D.C. which were managed by a third party. |
| (6) | We calculate volume per guest by dividing vacation ownership contract sales, excluding fractional sales, telesales and other sales that are not attributed to a tour at a sales location, by the number of tours at sales locations in a given period. We believe that this operating metric is valuable in evaluating the effectiveness of the sales process as it combines the impact of average contract price with the number of touring guests who make a purchase. |
| (7) | We base our financing terms largely on a purchaser’s FICO score, which is a branded version of a consumer credit score widely used in the United States by banks and lending institutions. FICO scores range from 300 to 850 and are calculated based on information obtained from one or more of the three major U.S. credit reporting agencies that compile and report on a consumer’s credit history. |
| (8) | Represents defaults as a percentage of each year’s beginning gross vacation ownership notes receivable balance. |
| (9) | We calculate financing propensity as contract sales volume of financed contracts closed in the period divided by contract sales volume of all contracts closed in the period. |
SUMMARY HISTORICAL FINANCIAL DATA OF ILG
The following table presents ILG’s summary historical financial data, which was derived from ILG’s last three fiscal years of consolidated financial statements. This disclosure does not include the effects of the Combination Transactions. The summary historical financial data for each of the fiscal years ended December 31, 2017, December 31, 2016 and December 31, 2015 is derived from ILG’s audited consolidated financial statements included in ILG’s Current Report on Form 8-K filed with the SEC on June 5, 2018, which is incorporated by reference in this offering memorandum and consent solicitation statement. ILG’s audited consolidated financial statements included in ILG’s Annual Report on Form 10-K for the fiscal year ended December 31, 2017 did not reflect the adoption of ASC 606. As ILG adopted ASC 606 effective January 1, 2018 on a retrospective basis, ILG recast its audited consolidated financial statements to reflect the adoption of ASC 606 as of January 1, 2015, the first day of its fiscal year ended December 31, 2015 in ILG’s Current Report on Form 8-K filed with the SEC on June 5, 2018.
The summary historical financial data for ILG as of March 31, 2018 and for the three months ended March 31, 2018 and March 31, 2017 are derived from ILG’s unaudited consolidated financial statements and related notes contained in its Quarterly Report on Form 10-Q for the three months ended March 31, 2018, which is incorporated by reference into this offering memorandum and consent solicitation statement. The unaudited financial data presented has been prepared on a basis consistent with ILG’s audited consolidated financial statements as recast in ILG’s Current Report on Form 8-K filed with the SEC on June 5, 2018 reflecting the adoption of ASC 606. In the opinion of ILG’s management, such unaudited financial data reflect all adjustments, consisting only of normal and recurring adjustments, necessary for a fair presentation of the results for those periods. The results of operations for the interim periods are not necessarily indicative of the results to be expected for the full year or any future period.
Historical results are not necessarily indicative of the results that may be expected for any future period or any future date. Because this information is only a summary and does not provide all of the information contained in ILG’s consolidated financial statements, including the related notes, this summary historical financial data should be read in conjunction with ILG’s Current Report on Form 8-K filed with the SEC on June 5, 2018, ILG’s Current Report on Form 8-K filed on July 19, 2018 with the SEC, and ILG’s Quarterly Report on Form 10-Q for the quarterly period ended March 31, 2018 filed with the SEC on May 4, 2018.
| Three Months Ended March 31, |
Fiscal Year | |||||||||||||||||||
| ($ in millions, except operating statistics) | 2018 | 2017 | 2017 | 2016(1) | 2015 | |||||||||||||||
| Consolidated Statement of Income Data: |
||||||||||||||||||||
| Revenues |
||||||||||||||||||||
| Service and membership related |
$ | 152 | $ | 127 | $ | 506 | $ | 457 | $ | 425 | ||||||||||
| Sales of vacation ownership products, net |
123 | 105 | 464 | 313 | 27 | |||||||||||||||
| Rental and ancillary services |
118 | 107 | 386 | 265 | 91 | |||||||||||||||
| Consumer financing |
24 | 21 | 89 | 57 | 5 | |||||||||||||||
| Cost reimbursements |
65 | 84 | 326 | 265 | 151 | |||||||||||||||
|
|
|
|
|
|
|
|
|
|
|
|||||||||||
| Total Revenues |
482 | 444 | 1,771 | 1,357 | 699 | |||||||||||||||
| Operating costs and expenses |
||||||||||||||||||||
| Cost of service and membership related sales |
64 | 35 | 165 | 125 | 106 | |||||||||||||||
| Cost of vacation ownership product sales |
39 | 25 | 90 | 101 | 20 | |||||||||||||||
| Cost of sales of rental and ancillary services |
72 | 77 | 295 | 183 | 40 | |||||||||||||||
| Cost of consumer financing |
8 | 6 | 29 | 13 | — | |||||||||||||||
| Cost of reimbursements |
65 | 84 | 326 | 265 | 151 | |||||||||||||||
| Royalty fee expense |
11 | 10 | 43 | 28 | 3 | |||||||||||||||
| Selling and marketing expense |
78 | 70 | 293 | 189 | 67 | |||||||||||||||
| General and administrative expense |
59 | 54 | 225 | 198 | 150 | |||||||||||||||
| Amortization expense of intangibles |
5 | 5 | 20 | 19 | 14 | |||||||||||||||
| Depreciation expense |
15 | 15 | 60 | 43 | 18 | |||||||||||||||
|
|
|
|
|
|
|
|
|
|
|
|||||||||||
| Total operating costs and expenses |
416 | 381 | 1,546 | 1,164 | 569 | |||||||||||||||
|
|
|
|
|
|
|
|
|
|
|
|||||||||||
| Three Months Ended March 31, |
Fiscal Year | |||||||||||||||||||
| ($ in millions, except operating statistics) | 2018 | 2017 | 2017 | 2016(1) | 2015 | |||||||||||||||
| Operating income |
66 | 63 | 225 | 193 | 130 | |||||||||||||||
| Other income (expense) |
||||||||||||||||||||
| Interest income |
— | — | 1 | 1 | 1 | |||||||||||||||
| Interest expense |
(7 | ) | (5 | ) | (26 | ) | (23 | ) | (21 | ) | ||||||||||
| Gain on bargain purchase(2) |
— | — | 2 | 163 | — | |||||||||||||||
| Other income (expense), net |
5 | 10 | (3 | ) | (7 | ) | 3 | |||||||||||||
| Equity in earnings from unconsolidated entities |
1 | 2 | 4 | 5 | 4 | |||||||||||||||
|
|
|
|
|
|
|
|
|
|
|
|||||||||||
| Total other income (expense), net |
(1 | ) | 7 | (22 | ) | 139 | (13 | ) | ||||||||||||
|
|
|
|
|
|
|
|
|
|
|
|||||||||||
| Earnings before income taxes and noncontrolling interests |
65 | 70 | 203 | 332 | 117 | |||||||||||||||
| Income tax provision |
(20 | ) | (25 | ) | (26 | ) | (60 | ) | (41 | ) | ||||||||||
|
|
|
|
|
|
|
|
|
|
|
|||||||||||
| Net income |
45 | 45 | 177 | 272 | 76 | |||||||||||||||
|
|
|
|
|
|
|
|
|
|
|
|||||||||||
| Net income attributable to noncontrolling interests |
(2 | ) | (1 | ) | (3 | ) | (2 | ) | (2 | ) | ||||||||||
|
|
|
|
|
|
|
|
|
|
|
|||||||||||
| Net income attributable to common stockholders |
$ | 43 | $ | 44 | $ | 174 | $ | 270 | $ | 74 | ||||||||||
|
|
|
|
|
|
|
|
|
|
|
|||||||||||
| Consolidated Statement of Cash Flows Data: |
||||||||||||||||||||
| Net cash flows provided by (used in): |
||||||||||||||||||||
| Operating activities |
$ | 152 | $ | 58 | $ | 205 | $ | 8 | $ | 140 | ||||||||||
| Investing activities |
$ | (16 | ) | $ | (22 | ) | $ | (115 | ) | $ | (127 | ) | $ | (21 | ) | |||||
| Financing activities |
$ | (75 | ) | $ | (38 | ) | $ | 12 | $ | 259 | $ | (103 | ) | |||||||
| Consolidated Balance Sheet Data: |
||||||||||||||||||||
| Cash and cash equivalents |
$ | 158 | $ | 122 | $ | 122 | $ | 126 | $ | 93 | ||||||||||
| Total assets |
$ | 3,770 | $ | 3,687 | $ | 3,687 | $ | 3,314 | $ | 1,282 | ||||||||||
| Long-term debt, net of current portion |
$ | 563 | $ | 562 | $ | 562 | $ | 580 | $ | 416 | ||||||||||
| Total equity |
$ | 1,738 | $ | 1,716 | $ | 1,716 | $ | 1,600 | $ | 467 | ||||||||||
| Other Consolidated Financial Data: |
||||||||||||||||||||
|
EBITDA(3) |
$ | 90 | $ | 94 | $ | 305 | $ | 414 | $ | 167 | ||||||||||
| Adjusted EBITDA(3) |
$ | 98 | $ | 92 | $ | 352 | $ | 310 | $ | 186 | ||||||||||
| Free cash flow(4) |
$ | 66 | $ | 54 | $ | 128 | $ | 180 | $ | 129 | ||||||||||
| Operating Statistics: |
||||||||||||||||||||
| Exchange and Rental |
||||||||||||||||||||
| Total active members (‘000s)(5) |
1,822 | 1,829 | 1,813 | 1,822 | 1,811 | |||||||||||||||
| Average revenue per member(6)(7)) |
53.17 | 52.12 | 190.05 | 191.61 | 194.60 | |||||||||||||||
| Vacation Ownership (Vistana/HVO)(7) |
||||||||||||||||||||
| Number of owner families (as of period end) |
258,000 | 254,000 | 257,000 | 253,000 | 253,000 | |||||||||||||||
| Number of managed resorts (as of period end) |
43 | 43 | 43 | 43 | 38 | |||||||||||||||
| Volume per guest(8) |
3,230 | 3,267 | 3,049 | 3,017 | 2,849 | |||||||||||||||
| Financing |
||||||||||||||||||||
| Average FICO score (United States)(7)(9) |
735 | 737 | 737 | 737 | 733 | |||||||||||||||
| Historical default rate(10) |
4.7 | % | 4.3 | % | 4.5 | % | 4.4 | % | 2.4 | % | ||||||||||
| Financing propensity(7)(11) |
56 | % | 68 | % | 68 | % | 73 | % | 76 | % | ||||||||||
| (1) | Amounts are exclusive of securitized debt from variable interest entities (“VIES”) presented on ILG’s historical consolidated balance sheets for the years ended December 31, 2017 and 2016. |
| (2) | The 2016 fiscal year includes $163 million of gain on bargain purchase that was recorded in connection with the Vistana acquisition and represents the excess of the fair value of the net tangible and intangible assets acquired over the purchase price. The gain on bargain purchase of $2 million in 2017 pertains to additional tax-related adjustments to our purchase price allocation for Vistana in the second quarter of 2017 prior to the measurement period closing on May 11, 2017. |
| (3) | ILG defines EBITDA as net income attributable to common stockholders excluding, if applicable: (1) non-operating interest income and interest expense, (2) income taxes, (3) depreciation expense, and (4) amortization expense of intangibles. ILG defines Adjusted EBITDA as EBITDA excluding, if applicable: (1) non-cash compensation expense, (2) goodwill and asset impairments, (3) acquisition-related and restructuring costs, (4) other non-operating income and expense, (5) the impact of the application of purchase accounting, and (6) other special items. |
ILG’s EBITDA and Adjusted EBITDA should be considered in addition to results prepared in accordance with GAAP, but should not be considered a substitute for or superior to GAAP results. See “Presentation of Financial and Other information—Non-GAAP Financial Measures of MVW and ILG.”
The following table presents a reconciliation of ILG’s net income attributable to common stockholders to operating income, the most directly comparable GAAP measures, to EBITDA and Adjusted EBITDA for the three months ended March 31, 2018 and 2017 and for the years ended December 31, 2017, 2016 and 2015.
| Three Months Ended March 31, |
Fiscal Year | |||||||||||||||||||
| ($ in millions) | 2018 | 2017 | 2017 | 2016 | 2015 | |||||||||||||||
| Net income attributable to common stockholders |
$ | 43 | $ | 44 | $ | 174 | $ | 270 | $ | 74 | ||||||||||
| Net income attributable to noncontrolling interest |
2 | 1 | 3 | 2 | 2 | |||||||||||||||
| Net income |
45 | 45 | 177 | 272 | 76 | |||||||||||||||
| Income tax provision |
20 | 25 | 26 | 60 | 41 | |||||||||||||||
| Other special items(a) |
— | — | (2 | ) | (163 | ) | — | |||||||||||||
| Equity in earning from unconsolidated entities |
(1 | ) | (2 | ) | (4 | ) | (5 | ) | (4 | ) | ||||||||||
| Other non-operating expense, net |
(5 | ) | (10 | ) | 3 | 7 | (3 | ) | ||||||||||||
| Interest expense |
7 | 5 | 26 | 23 | 21 | |||||||||||||||
| Interest income |
— | — | (1 | ) | (1 | ) | (1 | ) | ||||||||||||
| Operating income |
66 | 63 | 225 | 193 | 130 | |||||||||||||||
| Other non-operating income (expense), net(b) |
5 | 10 | (3 | ) | (7 | ) | 3 | |||||||||||||
| Other special items |
— | — | 2 | 163 | — | |||||||||||||||
| Equity in earnings from unconsolidated entities |
1 | 2 | 4 | 5 | 4 | |||||||||||||||
| Net income attributable to noncontrolling interest |
(2 | ) | (1 | ) | (3 | ) | (2 | ) | (2 | ) | ||||||||||
| Depreciation expense(c) |
15 | 15 | 60 | 43 | 18 | |||||||||||||||
| Amortization expense of intangibles(d) |
5 | 5 | 20 | 19 | 14 | |||||||||||||||
|
|
|
|
|
|
|
|
|
|
|
|||||||||||
| EBITDA |
90 | 94 | 305 | 414 | 167 | |||||||||||||||
| Impact of Purchase Accounting(e) |
— | (3 | ) | (4 | ) | 12 | 1 | |||||||||||||
| Other special items(f) |
4 | — | 4 | (163 | ) | — | ||||||||||||||
| Asset impairments |
2 | 2 | 10 | — | — | |||||||||||||||
| Acquisition related and restructuring costs(g) |
1 | 3 | 12 | 22 | 8 | |||||||||||||||
| Less: Other non-operating (income) expense, net |
(5 | ) | (10 | ) | 3 | 7 | (3 | ) | ||||||||||||
| Non-cash compensation expense(h) |
6 | 6 | 22 | 18 | 13 | |||||||||||||||
|
|
|
|
|
|
|
|
|
|
|
|||||||||||
| Adjusted EBITDA |
$ | 98 | $ | 92 | $ | 352 | $ | 310 | $ | 186 | ||||||||||
|
|
|
|
|
|
|
|
|
|
|
|||||||||||
| (a) | The 2016 fiscal year includes $163 million of gain on bargain purchase that was recorded in connection with the Vistana acquisition and represents the excess of the fair value of the net tangible and intangible assets acquired over the purchase price. The gain on bargain purchase of $2 million in 2017 pertains to additional tax-related adjustments to our purchase price allocation for Vistana in the second quarter of 2017 prior to the measurement period closing on May 11, 2017. |
| (b) | Other non-operating income and expense consists principally of foreign currency translations of cash held in certain countries in currencies, principally U.S. dollars, other than their functional currency, in addition to any gains or losses on extinguishment of debt. |
| (c) | Depreciation expense is a non-cash expense relating to ILG’s property and equipment and is recorded on a straight-line basis to allocate the cost of depreciable assets to operations over their estimated service lives. |
| (d) | Amortization expense of intangibles is a non-cash expense relating primarily to acquisitions. At the time of an acquisition, the intangible assets of the acquired company, such as customer relationships, purchase agreements and resort management agreements are valued and amortized over their estimated lives. ILG believes that since intangibles represent costs incurred by the acquired company to build value prior to acquisition, they were part of transaction costs. |
| (e) | Impact of the application of purchase accounting represents the difference between amounts derived from the fair value remeasurement of assets and liabilities acquired in a business combination versus the historical basis. ILG believes generally this is most meaningful in the first year subsequent to an acquisition. |
| (f) | Other special items consists of other items that ILG believes are not related to its core business operations. For the three months ended March 31, 2018 and 2017, such items include (as applicable to the respective period): (i) costs related to the litigation matters described in Note 21 accompanying ILG’s unaudited condensed consolidated financial statements included in ILG’s Quarterly Report on Form 10-Q for the quarter ended March 31, 2018, (ii) impact to ILG’s financial statements related to natural disasters, including Hurricane Irma and other named storms, and (iii) costs related to ILG’s board of directors’ strategic review. For the years ended December 31, 2017 and 2016, such items include (as applicable to the respective period): (i) the gain on bargain purchase recognized as part of the Vistana acquisition, (ii) costs related to the litigation matters described in Note 22 accompanying the audited consolidated financial statements included in ILG’s as recast in ILG’s Current Report on Form 8-K filed with the SEC on June 5, 2018, (iii) impact to ILG’s financial statements related to natural disasters, including Hurricane Irma and other named storms, and (iv) costs related to activist defense. |
| (g) | Acquisition-related and restructuring costs are transaction fees, costs incurred in connection with performing due diligence, subsequent adjustments to ILG’s initial estimate of contingent consideration obligations associated with business acquisitions, and other direct costs related to acquisition activities. Additionally, this item includes certain restructuring charges primarily related to workforce reductions, costs associated with integrating acquired businesses and estimated costs of exiting contractual commitments. |
| (h) | Non-cash compensation expense consists principally of expense associated with the grants of restricted stock units. These expenses are not paid in cash, and ILG will include the related shares in its future calculations of diluted shares of stock outstanding. Upon vesting of restricted stock units, the awards will be settled, at ILG’s discretion, on a net basis, with ILG remitting the required tax withholding amount from its current funds. |
| (4) | ILG’s free cash flow is a non-GAAP measure. ILG defines free cash flow as cash and restricted cash provided by operating activities less capital expenditures, plus net changes in financing-related restricted cash and net borrowing and repayment activity pertaining to securitizations, and excluding changes in operating-related restricted cash and certain payments unrelated to ILG’s ongoing core business, such as acquisition-related and restructuring costs. |
The following table presents a reconciliation of ILG’s operating income before inventory spread, the most directly comparable GAAP measure, to free cash flow for the three months ended March 31, 2018 and 2017 and for the years ended December 31, 2017, 2016 and 2015.
| Three Months Ended March 31, |
Year Ended December 31, | |||||||||||||||||||
| ($ in millions) | 2018 | 2017 | 2017 | 2016 | 2015 | |||||||||||||||
| Operating activities before inventory spend |
$ | 146 | $ | 145 | $ | 310 | $ | 168 | $ | 143 | ||||||||||
| Inventory spend |
(21 | ) | (57 | ) | (231 | ) | (175 | ) | — | |||||||||||
| Net changes in operating-related restricted cash |
27 | (30 | ) | 126 | 15 | (3 | ) | |||||||||||||
|
|
|
|
|
|
|
|
|
|
|
|||||||||||
| Net cash provided by operating activities |
152 | 58 | 205 | 8 | 140 | |||||||||||||||
|
|
|
|
|
|
|
|
|
|
|
|||||||||||
| Repayments on securitizations |
(45 | ) | (32 | ) | (178 | ) | (93 | ) | — | |||||||||||
| Proceeds from securitizations, net of debt issuance costs |
— | — | 322 | 370 | — | |||||||||||||||
| Net changes in financing-related restricted cash |
1 | 18 | 14 | (25 | ) | — | ||||||||||||||
|
|
|
|
|
|
|
|
|
|
|
|||||||||||
| Net securitization activities |
(44 | ) | (14 | ) | 158 | 252 | — | |||||||||||||
|
|
|
|
|
|
|
|
|
|
|
|||||||||||
| Net changes in operating-related restricted cash |
(27 | ) | 30 | (126 | ) | (15 | ) | 3 | ||||||||||||
| Capital expenditures |
(16 | ) | (22 | ) | (119 | ) | (95 | ) | (20 | ) | ||||||||||
| Acquisition-related and restructuring payments |
1 | 2 | 10 | 30 | 6 | |||||||||||||||
|
|
|
|
|
|
|
|
|
|
|
|||||||||||
| Free cash flow |
$ | 66 | $ | 54 | $ | 128 | $ | 180 | $ | 129 | ||||||||||
|
|
|
|
|
|
|
|
|
|
|
|||||||||||
| (5) | Represents active members of the Interval Network as of the end of the period. Active members are members in good standing that have paid membership fees and any other applicable charges in full as of the end of the period or are within the allowed grace period. All Hyatt Residence Club members and Vistana Signature Network members are also members of the Interval Network. |
| (6) | Represents membership fee revenue, transaction revenue and ancillary member revenue for the Interval Network, Hyatt Residence Club and Vistana Signature Network for the applicable period divided by the monthly weighted average number of active members during the applicable period. |
| (7) | Includes Vistana on a pro forma basis for pre-acquisition periods. |
| (8) | Represents consolidated timeshare contract sales excluding telesales, divided by tour flow during the period. |
| (9) | ILG bases its financing terms largely on a purchaser’s FICO score, which is a branded version of a consumer credit score widely used in the United States by banks and lending institutions. FICO scores range from 300 to 850 and are calculated based on information obtained from one or more of the three major U.S. credit reporting agencies that compile and report on a consumer’s credit history. Figures herein represent the weighted average FICO scores of loans originated over the last twelve months as of each quarter-end date. |
| (10) | Represents the trailing twelve months of defaults as a percentage of each period’s beginning gross vacation ownership mortgages receivable balance. |
| (11) | We calculate financing propensity as contract sales volume of financed sales divided by total contract sales volume in the period. |
SUMMARY UNAUDITED PRO FORMA COMBINED
FINANCIAL DATA
The following table shows summary unaudited pro forma combined financial data for the financial condition and results of operations of MVW after giving effect to the Combination Transactions and related transactions as further described in the section entitled “Unaudited Pro Forma Combined Financial Statements.” This information has been prepared using the acquisition method of accounting under GAAP, under which the assets and liabilities of ILG will be recorded by MVW at their respective fair values as of the date the Combination Transactions are completed. The summary unaudited pro forma combined balance sheet data as of March 31, 2018 and 2017 is presented as if the Combination Transactions had occurred on March 31, 2018 and 2017, respectively. The unaudited pro forma combined statement of income data for the three months ended March 31, 2018 and 2017, the fiscal year ended December 31, 2017 and the twelve months ended March 31, 2018 are presented as if the Combination Transactions occurred on December 31, 2016.
This summary unaudited pro forma combined financial data does not reflect the realization of any cost savings from operating efficiencies, synergies or other restructuring, or associated costs to achieve such savings, that may result from the Combination Transactions (other than as set forth below). Further, this data does not reflect the effect of any regulatory actions that may impact MVW when the Combination Transactions are completed. This data has been derived from and should be read in conjunction with the section entitled “Unaudited Pro Forma Combined Financial Statements” appearing elsewhere in this offering memorandum and consent solicitation statement and the accompanying notes thereto. In addition, the summary unaudited pro forma combined financial statements were based on and should be read in conjunction with the historical consolidated financial statements and related notes of both MVW and ILG for the applicable periods, which have been incorporated in this offering memorandum and consent solicitation statement by reference. The unaudited pro forma combined financial data for the twelve months ended March 31, 2018 is derived by taking the December 31, 2017 pro forma information, subtracting the March 31, 2017 pro forma information and then adding the March 31, 2018 pro forma information.
This summary unaudited pro forma combined financial data has been presented for informational purposes only and is not necessarily indicative of what MVW’s financial position or results of operations actually would have been had the Combination Transactions been completed as of the dates indicated. In addition, this summary unaudited pro forma combined financial data does not purport to project the future financial position or operating results of MVW. The unaudited summary pro forma combined financial data is based upon currently available information and estimates and assumptions that MVW’s management believes are reasonable as of the date hereof. Any of the factors underlying these estimates and assumptions may change or prove to be materially different, and the estimates and assumptions may not be representative of facts existing at the closing date of the Combination Transactions.
This summary unaudited pro forma combined financial data should be read in conjunction with MVW’s and ILG’s Current Reports on Form 8-K, each filed with the SEC on June 5, 2018, the sections entitled “Selected Financial Data” and “Management’s Discussion and Analysis of Financial Condition and Results of Operation” included in MVW’s and ILG’s Current Reports on Form 8-K, each filed with the SEC on July 19, 2018, and the sections entitled “The Combination Transactions,” “Capitalization” and “Unaudited Pro Forma Combined Financial Statements,” appearing elsewhere in this offering memorandum and consent solicitation statement.
| Three Months Ended March 31, |
Year Ended December 31, |
Twelve Months Ended March 31, |
||||||||||||||
| ($ in millions) | 2018 | 2017 | 2017 | 2018 | ||||||||||||
| Consolidated Statement of Income Data: |
||||||||||||||||
| Revenues |
||||||||||||||||
| Sale of vacation ownership products |
$ | 298 | $ | 269 | $ | 1,221 | $ | 1,250 | ||||||||
| Resort management and other services |
214 | 188 | 757 | 783 | ||||||||||||
| Financing |
55 | 51 | 214 | 218 | ||||||||||||
| Rental |
194 | 176 | 653 | 671 | ||||||||||||
| Cost reimbursements |
281 | 281 | 1,076 | 1,076 | ||||||||||||
|
|
|
|
|
|
|
|
|
|||||||||
| Total Revenues |
1,042 | 965 | 3,921 | 3,998 | ||||||||||||
|
|
|
|
|
|
|
|
|
|||||||||
| Three Months Ended March 31, |
Year Ended December 31, |
Twelve Months Ended March 31, |
||||||||||||||
| ($ in millions) | 2018 | 2017 | 2017 | 2018 | ||||||||||||
| Expenses |
||||||||||||||||
| Cost of vacation ownership products |
88 | 72 | 298 | 314 | ||||||||||||
| Marketing and sales |
185 | 165 | 675 | 695 | ||||||||||||
| Resort management and other services |
99 | 70 | 310 | 339 | ||||||||||||
| Financing |
8 | 7 | 35 | 36 | ||||||||||||
| Rental |
128 | 130 | 518 | 516 | ||||||||||||
| General and administrative |
102 | 96 | 394 | 400 | ||||||||||||
| Litigation settlement |
— | — | 4 | 4 | ||||||||||||
| Consumer financing interest |
11 | 9 | 37 | 39 | ||||||||||||
| Royalty fee |
26 | 26 | 106 | 106 | ||||||||||||
| Amortization expense of intangibles |
11 | 11 | 45 | 45 | ||||||||||||
| Cost reimbursements |
281 | 281 | 1,076 | 1,076 | ||||||||||||
|
|
|
|
|
|
|
|
|
|||||||||
| Total Expenses |
939 | 867 | 3,498 | 3,570 | ||||||||||||
|
|
|
|
|
|
|
|
|
|||||||||
| Gains and other income, net |
1 | — | 6 | 7 | ||||||||||||
| Interest expense |
(34 | ) | (31 | ) | (128 | ) | (131 | ) | ||||||||
| Other |
3 | 12 | 2 | (7 | ) | |||||||||||
|
|
|
|
|
|
|
|
|
|||||||||
| Income Before Income Taxes and Non-Controlling Interests |
73 | 79 | 303 | 297 | ||||||||||||
| Provision for income taxes |
(22 | ) | (28 | ) | 22 | 28 | ||||||||||
|
|
|
|
|
|
|
|
|
|||||||||
| Net Income |
51 | 51 | 325 | 325 | ||||||||||||
|
|
|
|
|
|
|
|
|
|||||||||
| Net Income attributable to non-controlling interests |
(2 | ) | (1 | ) | (3 | ) | (4 | ) | ||||||||
|
|
|
|
|
|
|
|
|
|||||||||
| Net Income attributable to common stockholders |
$ | 49 | $ | 50 | $ | 322 | $ | 321 | ||||||||
|
|
|
|
|
|
|
|
|
|||||||||
| Selected Balance Sheet Data: |
||||||||||||||||
| Cash and cash equivalents |
$ | 190 | ||||||||||||||
| Total assets |
$ | 8,899 | ||||||||||||||
| Total debt, gross |
$ | 3,846 | ||||||||||||||
| Total equity |
$ | 3,485 | ||||||||||||||
| Credit Statistics: |
||||||||||||||||
| Adjusted EBITDA(1) |
$ | 736 | ||||||||||||||
| Secured corporate net debt(2)(3) |
971 | |||||||||||||||
| Ratio of secured corporate net debt to Adjusted EBITDA |
1.32x | |||||||||||||||
| Total corporate net debt(3) |
$ | 2,373 | ||||||||||||||
| Ratio of total corporate net debt to Adjusted EBITDA |
3.22x | |||||||||||||||
| (1) | MVW defines EBITDA, a financial measure that is not prescribed by GAAP, as earnings, or net income, before interest expense (excluding consumer financing interest expense), income taxes, depreciation and amortization. MVW defines Adjusted EBITDA, a financial measure that is not prescribed by GAAP, as EBITDA adjusted for certain other items and excludes non-cash share-based compensation expense and the impact of the application of purchase accounting. For purposes of MVW’s EBITDA and Adjusted EBITDA calculations, MVW does not adjust for consumer financing interest expense as MVW considers it to be an operating expense of its business. EBITDA and Adjusted EBITDA have limitations and should not be considered in isolation or as a substitute for performance measures calculated in accordance with GAAP. See “Presentation of Financial and Other Information—Non-GAAP Financial Measures of MVW and ILG.” |
The following table presents a reconciliation of MVW’s pro forma net income, the most directly comparable GAAP measure, to pro forma EBITDA and pro forma Adjusted EBITDA for the three months ended March 31, 2018 and 2017, the year ended December 31, 2017 and the twelve months ended March 31, 2018.
| Three Months Ended March 31, |
Year Ended December 31, |
Twelve Months Ended March 31 |
||||||||||||||
| ($ in millions) | 2018 | 2017 | 2017 | 2018 | ||||||||||||
| Net income attributable to common stockholders |
$ | 49 | $ | 50 | $ | 322 | $ | 321 | ||||||||
| Interest expense |
34 | 31 | 128 | 131 | ||||||||||||
| Tax provision |
22 | 28 | (22 | ) | (28 | ) | ||||||||||
| Amortization expense of intangibles |
11 | 11 | 45 | 45 | ||||||||||||
| Depreciation |
21 | 20 | 81 | 82 | ||||||||||||
|
|
|
|
|
|
|
|
|
|||||||||
| EBITDA |
$ | 137 | $ | 140 | $ | 554 | $ | 551 | ||||||||
| Non-cash share-based compensation |
10 | 9 | 38 | 39 | ||||||||||||
| Certain items(a) |
4 | (6 | ) | 35 | 45 | |||||||||||
| Impact of purchase accounting(b) |
8 | 2 | 20 | 26 | ||||||||||||
| Cost synergies(c) |
75 | |||||||||||||||
|
|
|
|
|
|
|
|
|
|||||||||
| Adjusted EBITDA(d) |
$ | 159 | $ | 145 | $ | 647 | $ | 736 | ||||||||
|
|
|
|
|
|
|
|
|
|||||||||
| (a) | “Certain items” includes various adjustments made by MVW and ILG in calculating each respective company’s historical Adjusted EBITDA. Included from the MVW historical Adjusted EBITDA table are the amounts reflected under the line item titled “Certain items,” and included from the ILG historical Adjusted EBITDA table are the amounts included in the line items titled “Other special items,” “Asset impairments,” “Acquisition related and restructuring costs,” and “Less: Other non-operating (income) expense, net.” For further details regarding these historical adjustments to Adjusted EBITDA for MVW and ILG, respectively, see Note (2) under “Summary Historical Financial Data of MVW” and Note (3) under “Summary Historical Financial Data of ILG.” An incremental adjustment has been made to the historical Adjusted EBITDA adjustments related to acquisition costs to avoid double counting since they are eliminated as part of the pro forma adjustments and added back as part of the historical Adjusted EBITDA adjustments. |
| (b) | Reflects the remeasurement of assets and liabilities acquired in a business combination from book value to their respective fair values as a result of the application of purchase accounting. This adjustment includes the historical adjustments made to ILG’s Adjusted EBITDA in connection with its previous acquisitions as well as the impact of the applicable pro forma adjustments related to purchase accounting associated with the Combination Transactions. |
| (c) | Reflects cost savings and other synergies from the Combination Transactions as a result of restructuring activities and other cost savings initiatives that MVW expects to realize within two years following the consummation of the Combination Transactions. MVW currently anticipates that there will be one-time costs of $85 million in order to achieve these cost savings and other synergies, which costs are expected to be incurred within two years following the consummation of the Combination Transactions. However, (i) there can be no assurance that such cost savings and other synergies will be achieved, (ii) it may take longer than anticipated to achieve such cost savings and other synergies and (iii) it may require additional costs to achieve these cost savings and other synergies. See “Risk factors— Risks Relating to the Combined Company Upon Completion of the Combination Transactions.” |
| (d) | Calculated excluding $26 million of estimated lost Adjusted EBITDA from disruption of sales operations and rental and ancillary operations at certain MVW and ILG locations due to one or both of the 2017 Hurricanes, for which the Company expects to receive business interruption proceeds upon settlement of outstanding insurance claims. |
| (2) | Represents secured debt and includes indebtedness incurred under the New Credit Facilities and capital leases; excludes non-recourse, securitized debt, including any borrowings under the warehouse credit facility; net of cash and cash equivalents of $190 million. |
| (3) | Excludes non-recourse, securitized debt, including any borrowings under the warehouse credit facility; net of cash and cash equivalents of $190 million. |
Non-GAAP Financial Information
Certain financial measures presented above are not calculated in accordance with U.S. generally accepted accounting principles (“GAAP”), including EBITDA, Adjusted EBITDA, adjusted free cash flow, pro forma EBITDA and pro forma Adjusted EBITDA.
MVW
MVW defines EBITDA as earnings, or net income, before interest expense (excluding consumer financing interest expense), income taxes, depreciation and amortization. MVW’s Adjusted EBITDA reflects EBITDA as adjusted for certain other items described under “Summary—Summary Historical Financial Data of MVW,” and excludes non-cash share-based compensation expense to address considerable variability among companies in recording compensation expense because companies use share-based payment awards differently, both in the type and quantity of awards granted, and the impact of the application of purchase accounting. For purposes of MVW’s EBITDA and Adjusted EBITDA calculations, MVW does not adjust for consumer financing interest expense because MVW considers it to be an operating expense of its business. MVW considers EBITDA and Adjusted EBITDA to be indicators of operating performance, which it uses to measure its ability to service debt, fund capital expenditures and expand its business. MVW uses EBITDA and Adjusted EBITDA, as do analysts, lenders, investors and others, because these measures exclude certain items that can vary widely across different industries or among companies within the same industry. For example, interest expense can be dependent on a company’s capital structure, debt levels and credit ratings. Accordingly, the impact of interest expense on earnings can vary significantly among companies. The tax positions of companies can also vary because of their differing abilities to take advantage of tax benefits and because of the tax policies of the jurisdictions in which they operate. As a result, effective tax rates and provision for income taxes can vary considerably among companies. EBITDA and Adjusted EBITDA also exclude depreciation and amortization because companies utilize productive assets of different ages and use different methods of both acquiring and depreciating productive assets. These differences can result in considerable variability in the relative costs of productive assets and the depreciation and amortization expense among companies. Together, EBITDA and Adjusted EBITDA facilitate MVW’s comparison of results from its ongoing core operations before the impact of these items with results from other vacation ownership companies.
MVW defines adjusted free cash flow as net cash, cash equivalents and restricted cash provided by operating activities less capital expenditures for property and equipment (excluding inventory), changes in restricted cash, and the borrowing and repayment activity related to MVW’s securitizations and certain other adjustments described in the section entitled “Summary—Summary Historical Financial Data of MVW.” MVW evaluates adjusted free cash flow as a liquidity measure that provides useful information to MVW management and investors about the amount of cash provided by operating activities after capital expenditures for property and equipment, changes in restricted cash, and the borrowing and repayment activity related to MVW’s securitizations, which cash can be used for strategic opportunities, including acquisitions and strengthening the balance sheet. Adjusted free cash flow allows for period-over-period comparisons of the cash generated by MVW’s business before the impact of these items. Analysis of adjusted free cash flow also facilitates MVW’s management’s comparison of its results with its competitors’ results.
MVW defines corporate debt as total gross debt outstanding less gross securitization debt, and corporate net debt as corporate debt less cash and cash equivalents.
ILG
ILG defines EBITDA as net income attributable to common stockholders excluding, if applicable: (1) non-operating interest income and interest expense, (2) income taxes, (3) depreciation expense and (4) amortization expense of intangibles. ILG defines Adjusted EBITDA as EBITDA excluding, if applicable: (1) non-cash compensation expense, (2) goodwill and asset impairments, (3) acquisition-related and restructuring costs, (4) other non-operating income and expense, (5) the impact of the application of purchase accounting, and (6) other special items. ILG’s presentation of EBITDA and Adjusted EBITDA may not be comparable to similarly-titled measures used by other companies. ILG believes the performance measures such as EBITDA and Adjusted EBITDA are
useful to investors because they represent the consolidated operating results from its segments, excluding the effects of any non-core expenses or gains. ILG also believes these measures improve the transparency of its disclosures, provide a meaningful presentation of its results from its business operations, excluding the impact of certain items not related to its core business operations and improve the period-to-period comparability of results from business operations. These non-GAAP performance measures have certain limitations in that they do not take into account the impact of certain expenses to ILG’s statement of operations, such as non-cash compensation and acquisition-related and restructuring costs as it relates to Adjusted EBITDA.
ILG defines free cash flow as cash and restricted cash provided by operating activities less capital expenditures, plus net changes in financing-related restricted cash and net borrowing and repayment activity pertaining to securitizations, and excluding changes in operating-related restricted cash and certain payments unrelated to ILG’s ongoing core business, such as acquisition-related and restructuring costs.
Pro forma
Pro forma EBITDA and pro forma Adjusted EBITDA present EBITDA and Adjusted EBITDA on a pro forma basis for the Combination Transactions. To the extent that MVW’s and ILG’s definitions of EBITDA and Adjusted EBITDA differ, pro forma EBITDA and pro forma Adjusted EBITDA are calculated using MVW’s definitions of EBITDA and Adjusted EBITDA.
EBITDA, Adjusted EBITDA, adjusted free cash flow, pro forma EBITDA and pro forma Adjusted EBITDA have limitations and should not be considered in isolation or as a substitute for performance measures calculated in accordance with GAAP. In addition, other companies in MVW’s and ILG’s industry may calculate EBITDA, Adjusted EBITDA, adjusted free cash flow, pro forma EBITDA and pro forma Adjusted EBITDA differently than MVW and ILG do or may not calculate them at all, limiting their usefulness as comparative measures.
Pro Forma Information
Certain pro forma information is included herein. The pro forma information is presented for illustrative purposes only and is not necessarily indicative of the results that would have occurred if the Combination Transactions had been previously consummated, nor is it indicative of future results.
Disclaimer
The information contained herein (unless otherwise indicated) has been provided by MVW solely for informational purposes. This information does not constitute a recommendation regarding the securities of MVW. This information does not constitute, or form part of, any offer, invitation to sell or issue, or any solicitation of any offer to subscribe for, purchase or otherwise acquire any securities of MVW, nor shall it, or the fact of its communication, form the basis of, or be relied upon in connection with, or act as any inducement to enter into any contract or commitment whatsoever with respect to such securities. The information herein is not directed to, or intended for distribution to or use by, any person or entity that is a citizen or resident located in any locality, state, country or other jurisdiction where such distribution, publication, availability or use would be contrary to law or regulation or which would require registration of licensing within such jurisdiction. The information contained herein is provided as of the date set forth above and is subject to change without notice. The information contained herein may be updated, completed, revised and amended and such information may change materially in the future. MVW is under no obligation to update or keep current the information contained herein.