Attached files
| file | filename |
|---|---|
| 8-K - FORM 8-K - Kraton Corp | kra726188-kxearningspresen.htm |
Kraton Corporation Second Quarter 2018 Earnings Presentation July 26, 2018

Disclaimers Forward Looking Statements Some of the statements and information in this presentation contain forward-looking statements within the meaning of the Private Securities Litigation Reform Act of 1995. This presentation includes forward-looking statements that reflect our plans, beliefs, expectations, and current views with respect to, among other things, future events and financial performance. Forward-looking statements are often identified by words such as “outlook,” “believes,” “estimates,” “expects,” “projects,” “may,” “intends,” “plans”, “on track” “on trend”, or “anticipates,” or by discussions of strategy, plans or intentions, including all matters described on the slide titled “2018 Modeling Assumptions” and our expectations for targeted debt reduction.. All forward-looking statements in this presentation are made based on management's current expectations and estimates, which involve known and unknown risks, uncertainties, and other important factors that could cause actual results to differ materially from those expressed in forward-looking statements. These risks and uncertainties are more fully described in our latest Annual Report on Form 10-K, including but not limited to “Part I, Item 1A. Risk Factors” and “Part II, Item 7. Management’s Discussion and Analysis of Financial Condition and Results of Operations” therein, and in our other filings with the Securities and Exchange Commission, and include, but are not limited to, risks related to: Kraton's ability to repay its indebtedness; Kraton's reliance on third parties for the provision of significant operating and other services; conditions in the global economy and capital markets; fluctuations in raw material costs; limitations in the availability of raw materials; competition in Kraton's end-use markets; and other factors of which we are currently unaware or deem immaterial. Readers are cautioned not to place undue reliance on our forward-looking statements. Forward-looking statements speak only as of the date they are made, and we assume no obligation to update such information in light of new information or future events. Kraton Second Quarter 2018 Earnings Call 2

Disclaimers GAAP Disclaimer This presentation includes the use of non-GAAP financial measures, as defined below. Tables included in this presentation reconcile each of these non- GAAP financial measures with the most directly comparable GAAP financial measure. For additional information on the impact of the spread between the FIFO basis of accounting and estimated current replacement cost (“ECRC”), see our Annual Report on Form 10-K for the fiscal year ended December 31, 2017. We consider these non-GAAP financial measures to be important supplemental measures in the evaluation of our absolute and relative performance. However, we caution that these non-GAAP financial measures have limitations as analytical tools and may vary substantially from other measures of our performance. You should not consider them in isolation, or as a substitute for analysis of our results under GAAP in the United States. EBITDA, Adjusted EBITDA, and Adjusted EBITDA Margin: For our consolidated results, EBITDA represents net income (loss) before interest, taxes, depreciation and amortization. For each reporting segment, EBITDA represents operating income before depreciation and amortization, disposition and exit of business activities and earnings of unconsolidated joint ventures. Among other limitations, EBITDA does not: reflect the significant interest expense on our debt or reflect the significant depreciation and amortization expense associated with our long-lived assets; and EBITDA included herein should not be used for purposes of assessing compliance or non-compliance with financial covenants under our debt agreements since it calculation differs in such agreements. Other companies in our industry may calculate EBITDA differently than we do, limiting its usefulness as a comparative measure. As an analytical tool, Adjusted EBITDA is subject to all the limitations applicable to EBITDA. We prepare Adjusted EBITDA by eliminating from EBITDA the impact of a number of items we do not consider indicative of our on-going performance but you should be aware that in the future we may incur expenses similar to the adjustments in this presentation. Our presentation of Adjusted EBITDA should not be construed as an inference that our future results will be unaffected by unusual or non-recurring items. In addition, due to volatility in raw material prices, Adjusted EBITDA may, and often does, vary substantially from EBITDA and other performance measures, including net income calculated in accordance with U.S. GAAP. We define Adjusted EBITDA Margin as Adjusted EBITDA as a percentage of revenue (for each reporting segment or on a consolidated bases, as applicable). Adjusted Gross Profit and Adjusted Gross Profit Per Ton: We define Adjusted Gross Profit Per Ton as Adjusted Gross Profit divided by total sales volume (for each reporting segment or on a consolidated basis, as applicable). We define Adjusted Gross Profit as gross profit excluding certain charges and expenses. Adjusted Gross Profit is limited because it often varies substantially from gross profit calculated in accordance with U.S. GAAP due to volatility in raw material prices. Adjusted Diluted Earnings Per Share: Adjusted Diluted Earnings Per Share is Diluted Earnings (Loss) Per Share excluding the impact of a number of non-recurring items we do not consider indicative of our on-going performance. Net Debt and Consolidated Net Debt: Net debt for Kraton is total debt (excluding debt of KFPC due to its own capital structure) less cash and cash equivalents. Consolidated net debt is Kraton net debt plus debt of Kraton Formosa Polymers (KFPC) joint venture less KFPC’s cash and cash equivalents. Management believes that net debt is useful to investors in determining our leverage since we could choose to use cash and cash equivalents to satisfy our debt obligations. Consolidated Net Debt Leverage Ratio: The consolidated net debt leverage ratio is defined as consolidated net debt as of the balance sheet date divided by Adjusted EBITDA for the twelve months then ended. Our use of this term may vary from the use of slimilarly-titled measures by others in our industry due to the potential inconsistencies in the method of calculation and differences due to items subject to interpretation. Kraton Second Quarter 2018 Earnings Call 3
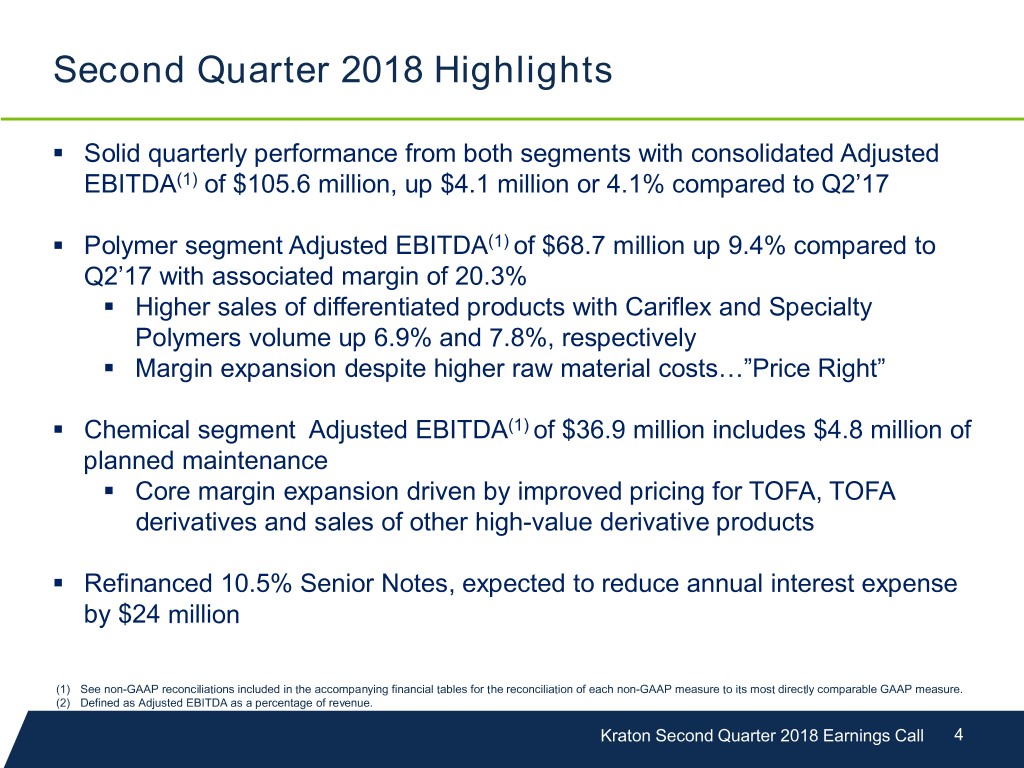
Second Quarter 2018 Highlights . Solid quarterly performance from both segments with consolidated Adjusted EBITDA(1) of $105.6 million, up $4.1 million or 4.1% compared to Q2’17 . Polymer segment Adjusted EBITDA(1) of $68.7 million up 9.4% compared to Q2’17 with associated margin of 20.3% . Higher sales of differentiated products with Cariflex and Specialty Polymers volume up 6.9% and 7.8%, respectively . Margin expansion despite higher raw material costs…”Price Right” . Chemical segment Adjusted EBITDA(1) of $36.9 million includes $4.8 million of planned maintenance . Core margin expansion driven by improved pricing for TOFA, TOFA derivatives and sales of other high-value derivative products . Refinanced 10.5% Senior Notes, expected to reduce annual interest expense by $24 million (1) See non-GAAP reconciliations included in the accompanying financial tables for the reconciliation of each non-GAAP measure to its most directly comparable GAAP measure. (2) Defined as Adjusted EBITDA as a percentage of revenue. Kraton Second Quarter 2018 Earnings Call 4
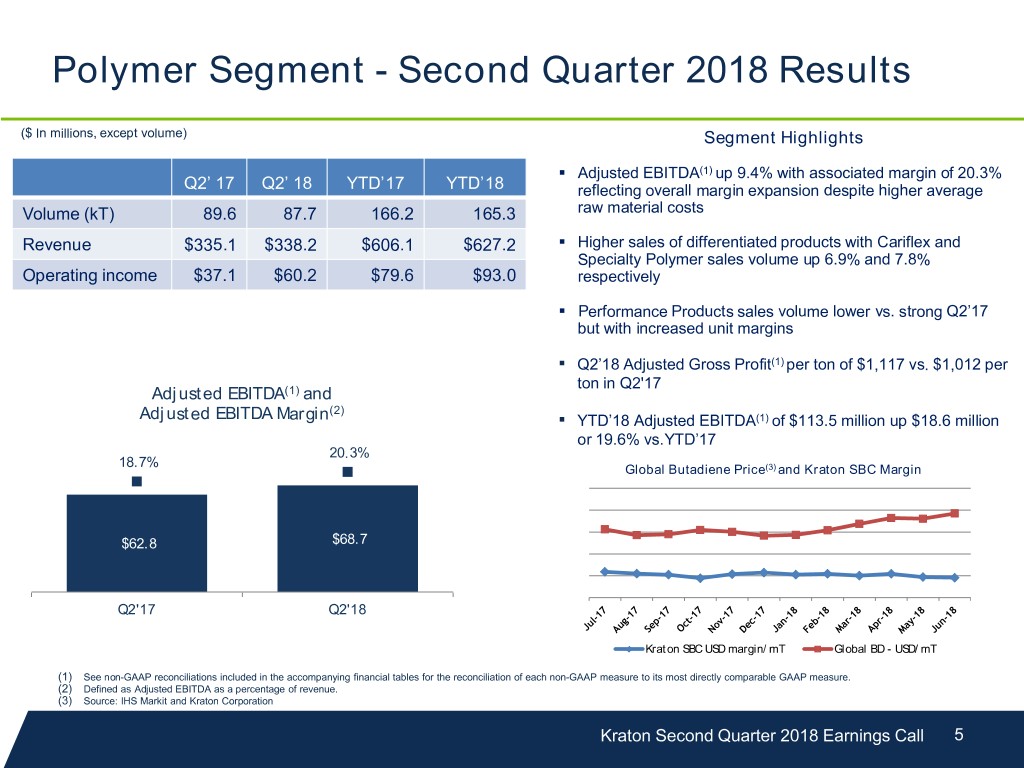
Polymer Segment - Second Quarter 2018 Results ($ In millions, except volume) Segment Highlights . Adjusted EBITDA(1) up 9.4% with associated margin of 20.3% Q2’ 17 Q2’ 18 YTD’17 YTD’18 reflecting overall margin expansion despite higher average Volume (kT) 89.6 87.7 166.2 165.3 raw material costs Revenue $335.1 $338.2 $606.1 $627.2 . Higher sales of differentiated products with Cariflex and Specialty Polymer sales volume up 6.9% and 7.8% Operating income $37.1 $60.2 $79.6 $93.0 respectively . Performance Products sales volume lower vs. strong Q2’17 but with increased unit margins ▪ Q2’18 Adjusted Gross Profit(1) per ton of $1,117 vs. $1,012 per ton in Q2'17 Adjusted EBITDA(1) and Adjusted EBITDA Margin(2) ▪ YTD’18 Adjusted EBITDA(1) of $113.5 million up $18.6 million or 19.6% vs.YTD’17 20.3% $80.0 18.7% (3) 20.0% Global Butadiene Price and Kraton SBC Margin $70.0 $60.0 15.0% $50.0 $40.0 10.0% $68.7 $30.0 $62.8 $20.0 5.0% $10.0 $- 0.0% Q2'17 Q2'18 Kraton SBC USD margin/mT Global BD - USD/mT (1) See non-GAAP reconciliations included in the accompanying financial tables for the reconciliation of each non-GAAP measure to its most directly comparable GAAP measure. (2) Defined as Adjusted EBITDA as a percentage of revenue. (3) Source: IHS Markit and Kraton Corporation Kraton Second Quarter 2018 Earnings Call 5

Chemical Segment - Second Quarter 2018 Results ($ In millions, except volume) Segment Highlights Q2’ 17 Q2’ 18 YTD’17 YTD’18 ▪ Improved core margins reflecting improved Volume (kT) 101.6 110.8 219.7 226.8 pricing and strong demand for TOFA, TOFA derivatives and other upgraded products Revenue $190.2 $200.2 $377.3 $413.6 Operating income $25.4 $22.6 $43.0 $51.9 ▪ Sales volume up 9.1% vs. Q2'17 with Performance Chemicals volume up 16.8%, partially offset by a modest decline in Adhesives (1) Adjusted EBITDA and ▪ Adjusted EBITDA(1) negatively impacted by Adjusted EBITDA Margin(2) Q2’18 planned maintenance costs of $4.8 20.3% million $45.0 18.4% 20.0% $40.0 $35.0 (1) 15.0% ▪ YTD’18 Adjusted EBITDA up $8.6 million or $30.0 $25.0 11.9% despite impact of Q2’18 planned 10.0% $20.0 $38.7 $36.9 $15.0 maintenance and higher average raw material $10.0 5.0% $5.0 costs $- 0.0% Q2'17 Q2'18 (1) See non-GAAP reconciliations included in the accompanying financial tables for the reconciliation of each non-GAAP measure to its most directly comparable GAAP measure. (2) Defined as Adjusted EBITDA as a percentage of revenue. Kraton Second Quarter 2018 Earnings Call 6
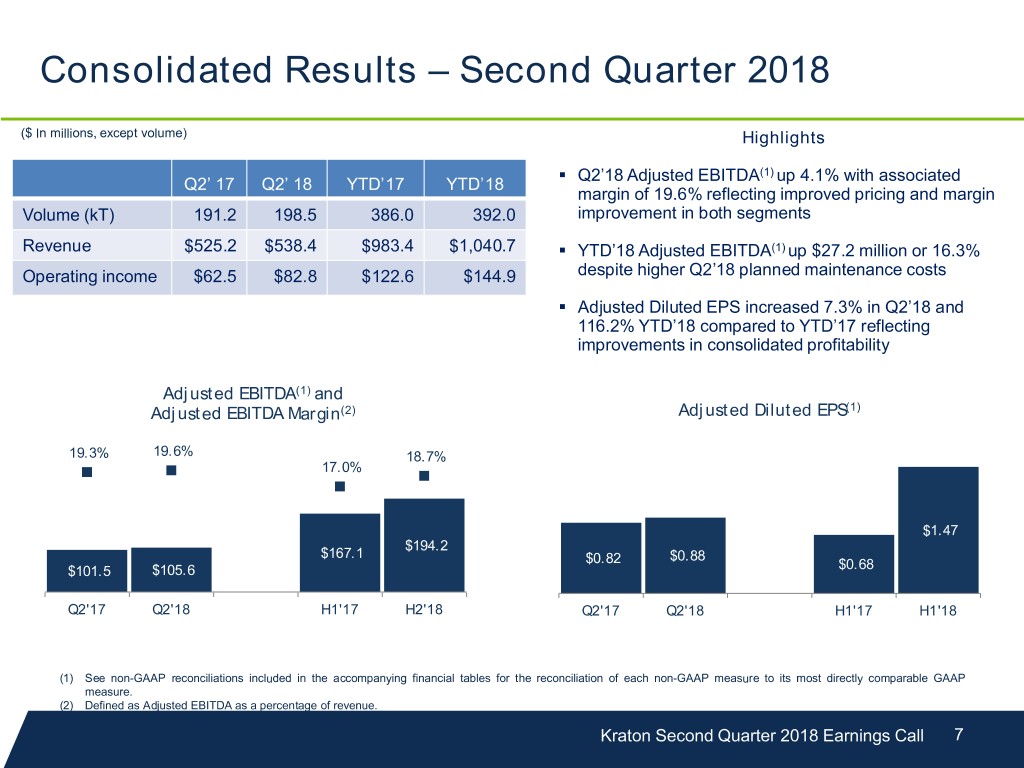
Consolidated Results – Second Quarter 2018 ($ In millions, except volume) Highlights . Q2’18 Adjusted EBITDA(1) up 4.1% with associated Q2’ 17 Q2’ 18 YTD’17 YTD’18 margin of 19.6% reflecting improved pricing and margin Volume (kT) 191.2 198.5 386.0 392.0 improvement in both segments Revenue $525.2 $538.4 $983.4 $1,040.7 . YTD’18 Adjusted EBITDA(1) up $27.2 million or 16.3% Operating income $62.5 $82.8 $122.6 $144.9 despite higher Q2’18 planned maintenance costs . Adjusted Diluted EPS increased 7.3% in Q2’18 and 116.2% YTD’18 compared to YTD’17 reflecting improvements in consolidated profitability Adjusted EBITDA(1) and Adjusted EBITDA Margin(2) Adjusted Diluted EPS(1) 19.3% 19.6% 18.7% 17.0% 20.0% $225.0 18.0% 16.0% 14.0% $175.0 12.0% 10.0% $125.0 $1.47 $194.2 8.0% $167.1 6.0% $0.88 $75.0 $0.82 $101.5 $105.6 4.0% $0.68 2.0% $25.0 0.0% Q2'17 Q2'18 H1'17 H2'18 Q2'17 Q2'18 H1'17 H1'18 (1) See non-GAAP reconciliations included in the accompanying financial tables for the reconciliation of each non-GAAP measure to its most directly comparable GAAP measure. (2) Defined as Adjusted EBITDA as a percentage of revenue. Kraton Second Quarter 2018 Earnings Call 7

Refinancing of 10.5% Senior Notes $ millions . During the second quarter 2018 we refinanced our 10.5% Senior Notes, through . Issuing €290 million of 5.25% Senior Notes due 2026 . Increasing borrowings under existing low-cost facilities . The refinancing extends the maturity profile and provides for an expected reduction in annualized cash interest costs of approximately $24 million . Since the close of the Arizona Chemical acquisition, debt reduction and refinancing activities have reduced annual cash interest(2) from $130 million to $78 million Weighted Average Cost of Total Debt(1) 6.80% 4.60% At Close of AZC Acq. 6/30/2018 (1) See non-GAAP reconciliations included in the accompanying financial tables for the reconciliation of each non-GAAP measure to its most directly comparable GAAP measure (2) Represents the principal balances outstanding at close of the Arizona Chemical acquisition and at June 30, 2018, respectively, times the prevailing interest rates Kraton Second Quarter 2018 Earnings Call 8
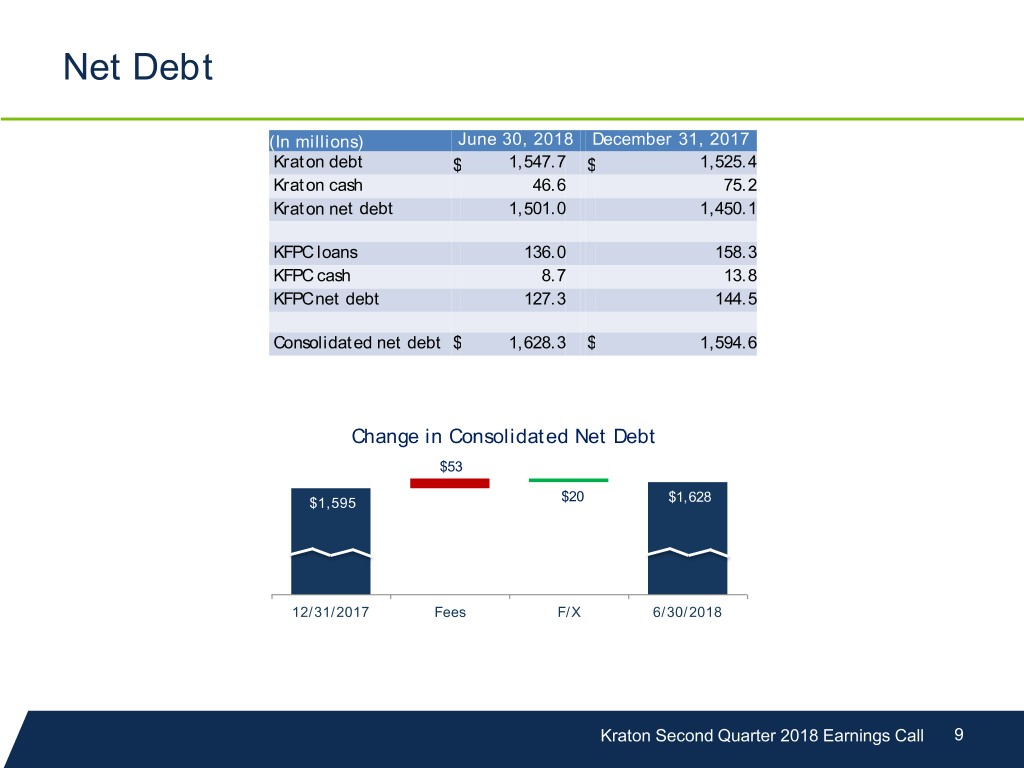
Net Debt (In millions) June 30, 2018 December 31, 2017 Kraton debt $ 1,547.7 $ 1,525.4 Kraton cash 46.6 75.2 Kraton net debt 1,501.0 1,450.1 KFPC loans 136.0 158.3 KFPC cash 8.7 13.8 KFPC net debt 127.3 144.5 Consolidated net debt $ 1,628.3 $ 1,594.6 Change in Consolidated Net Debt $53 $1,595 $20 $1,628 12/31/2017 Fees F/X 6/30/2018 Kraton Second Quarter 2018 Earnings Call 9

Appendix

2018 Modeling Assumptions(1) ($ in millions) Non-cash compensation expense $10 Depreciation & amortization $140 Interest expense $96 Cash interest of approximately $96 million Effective tax rate - Adjusted 20% - 25% Effective tax rate - GAAP - 15%-20% Capex (includes capitalized interest) $110 Reduction in consolidated net debt(2) (3) $75 to $100 Note: Non-cash compensation expense is excluded in determining Adjusted EBITDA and included in determining Adjusted EPS. (1) Management's estimates. These estimates are forward-looking statements and speak only as of July 26, 2018. Management assumes no obligation to update or confirm these estimates in light of new information or future events. (2) We have not reconciled net debt guidance to debt due to high variability and difficulty in making accurate forecasts and projections that are impacted by future decisions and actions. The actual amount of such reconciling items will have a significant impact if they were included in our net debt. Accordingly, a reconciliation of the non-GAAP financial measure guidance to the corresponding GAAP measures is not available without unreasonable effort. (3) Includes the impact of approximately $53 million of costs associated with the 5.25% Senior Notes financing during the second quarter of 2018. Kraton Second Quarter 2018 Earnings Call 11

Polymer Segment - Revenue by Geography and Product Group (TTM June 30, 2018) CARIFLEX SPECIALTY POLYMERS PERFORMANCE PRODUCTS Revenue by by Revenue Geography Pkg. & Ind. Consumer Adhesive & Adhesives 5% Coatings 1% 5% Cable Gels 6% Other Personal 29% Care 5% Industrial 7% Lubricant Medical Additives 9% 20% Polymod 13% Revenue by by Revenue Product Group Kraton Second Quarter 2018 Earnings Call 12

Chemical Segment - Revenue by Geography and Product Group (TTM June 30, 2018) ADHESIVES PERFORMANCE CHEMICALS Asia Pacific 11% Asia Pacific 18% Americas 39% EMEA Americas 34% 55% EMEA 43% TIRES Americas 23% Asia Pacific 29% EMEA 48% Kraton Second Quarter 2018 Earnings Call 13

Polymer Reconciliation of Gross Profit to Adjusted Gross Profit Three Months Three Months Six Months Six Months Ended June 30, Ended June 30, Ended June 30, Ended June 30, 2018 2017 2018 2017 (In thousands) Gross profit $ 109,676 $ 85,903 $ 191,205 $ 175,499 Add (deduct): Restructuring and other charges (a) — 2,554 — 5,500 KFPC startup costs (b) — 3,464 — 5,321 Non-cash compensation expense 133 131 308 309 Spread between FIFO and ECRC (11,824 ) (1,389 ) (19,940 ) (37,882 ) Adjusted gross profit (non-GAAP) $ 97,985 $ 90,664 $ 171,573 $ 148,747 Sales volume (kilotons) 87.7 89.6 165.3 166.2 Adjusted gross profit per ton $ 1,117 $ 1,012 $ 1,038 $ 895 a) Severance expenses and other restructuring related charges. b) Startup costs related to the joint venture company, KFPC. Kraton Second Quarter 2018 Earnings Call 14

Reconciliation of Net Income to Operating Income to Non-GAAP Financial Measures Three Months Ended June 30, 2018 Three Months Ended June 30, 2017 Polymer Chemical Total Polymer Chemical Total (In thousands) Net income (loss) attributable to Kraton $ (14,930 ) $ 25,561 ) Net income (loss) attributable to noncontrolling interest 826 (2,136 ) Consolidated net income (loss) (14,104 ) 23,425 Add (deduct): Income tax benefit (expense) (1,842 ) 3,854 Interest expense, net 25,416 34,444 Earnings of unconsolidated joint venture (120 ) (118 ) Loss on extinguishment of debt 72,330 — Other expense 1,107 863 Operating income $ 60,231 $ 22,556 82,787 $ 37,078 $ 25,390 62,468 Add (deduct): Depreciation and amortization 17,598 17,542 35,140 16,773 17,817 34,590 Other income (expense) (1,318 ) 211 (1,107 ) (936 ) 73 (863 ) Loss on extinguishment of debt (72,330 ) — (72,330 ) — — — Earnings of unconsolidated joint venture 120 — 120 118 — 118 EBITDA 4,301 40,309 44,610 53,033 43,280 96,313 Add (deduct): Transaction, acquisition related costs, restructuring, and other costs (a) 768 473 1,241 4,579 (790 ) 3,789 Loss on extinguishment of debt 72,330 — 72,330 — — — KFPC startup costs (b) 897 — 897 4,419 — 4,419 Non-cash compensation expense 2,223 — 2,223 2,173 — 2,173 Spread between FIFO and ECRC (11,824 ) (3,853 ) (15,677 ) (1,389 ) (3,825 ) (5,214 ) Adjusted EBITDA $ 68,695 $ 36,929 $ 105,624 $ 62,815 $ 38,665 $ 101,480 a) Charges related to the evaluation of acquisition transactions, severance expenses, and other restructuring related charges. b) Startup costs related to the joint venture company. Kraton Second Quarter 2018 Earnings Call 15
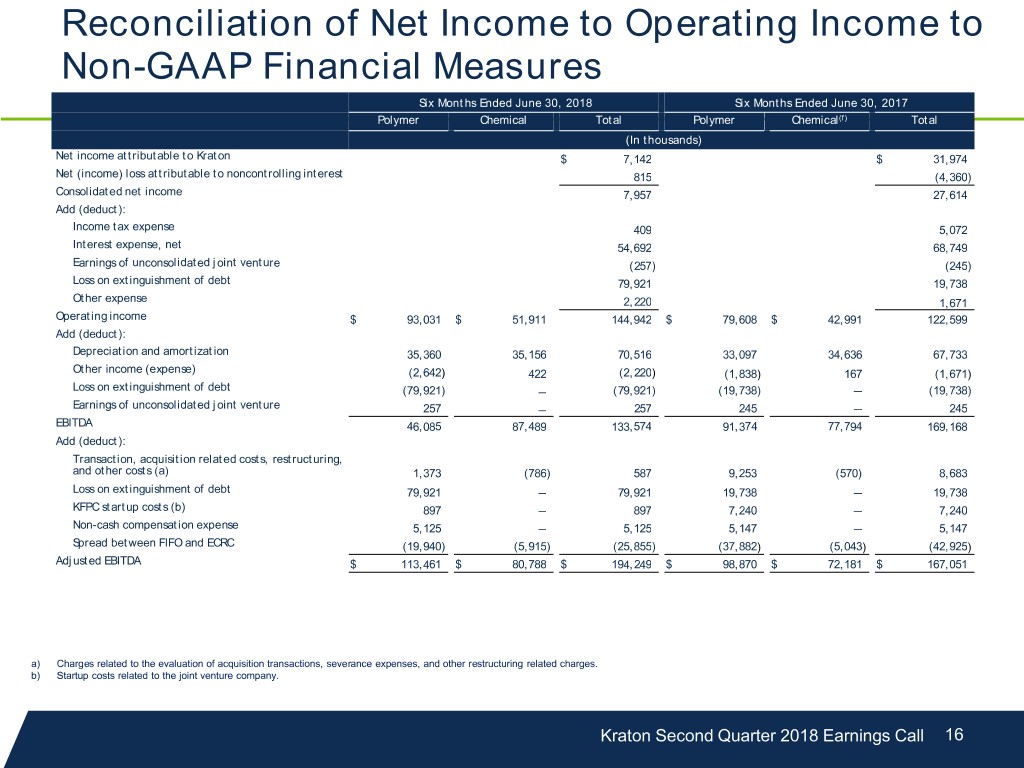
Reconciliation of Net Income to Operating Income to Non-GAAP Financial Measures Six Months Ended June 30, 2018 Six Months Ended June 30, 2017 Polymer Chemical Total Polymer Chemical(f) Total (In thousands) Net income attributable to Kraton $ 7,142 $ 31,974 Net (income) loss attributable to noncontrolling interest 815 (4,360 ) Consolidated net income 7,957 27,614 Add (deduct): Income tax expense 409 5,072 Interest expense, net 54,692 68,749 Earnings of unconsolidated joint venture (257 ) (245 ) Loss on extinguishment of debt 79,921 19,738 Other expense 2,220 1,671 Operating income $ 93,031 $ 51,911 144,942 $ 79,608 $ 42,991 122,599 Add (deduct): Depreciation and amortization 35,360 35,156 70,516 33,097 34,636 67,733 Other income (expense) (2,642 ) 422 (2,220 ) (1,838 ) 167 (1,671 ) Loss on extinguishment of debt (79,921 ) — (79,921 ) (19,738 ) — (19,738 ) Earnings of unconsolidated joint venture 257 — 257 245 — 245 EBITDA 46,085 87,489 133,574 91,374 77,794 169,168 Add (deduct): Transaction, acquisition related costs, restructuring, and other costs (a) 1,373 (786 ) 587 9,253 (570) 8,683 Loss on extinguishment of debt 79,921 — 79,921 19,738 — 19,738 KFPC startup costs (b) 897 — 897 7,240 — 7,240 Non-cash compensation expense 5,125 — 5,125 5,147 — 5,147 Spread between FIFO and ECRC (19,940 ) (5,915 ) (25,855 ) (37,882 ) (5,043 ) (42,925 ) Adjusted EBITDA $ 113,461 $ 80,788 $ 194,249 $ 98,870 $ 72,181 $ 167,051 a) Charges related to the evaluation of acquisition transactions, severance expenses, and other restructuring related charges. b) Startup costs related to the joint venture company. Kraton Second Quarter 2018 Earnings Call 16
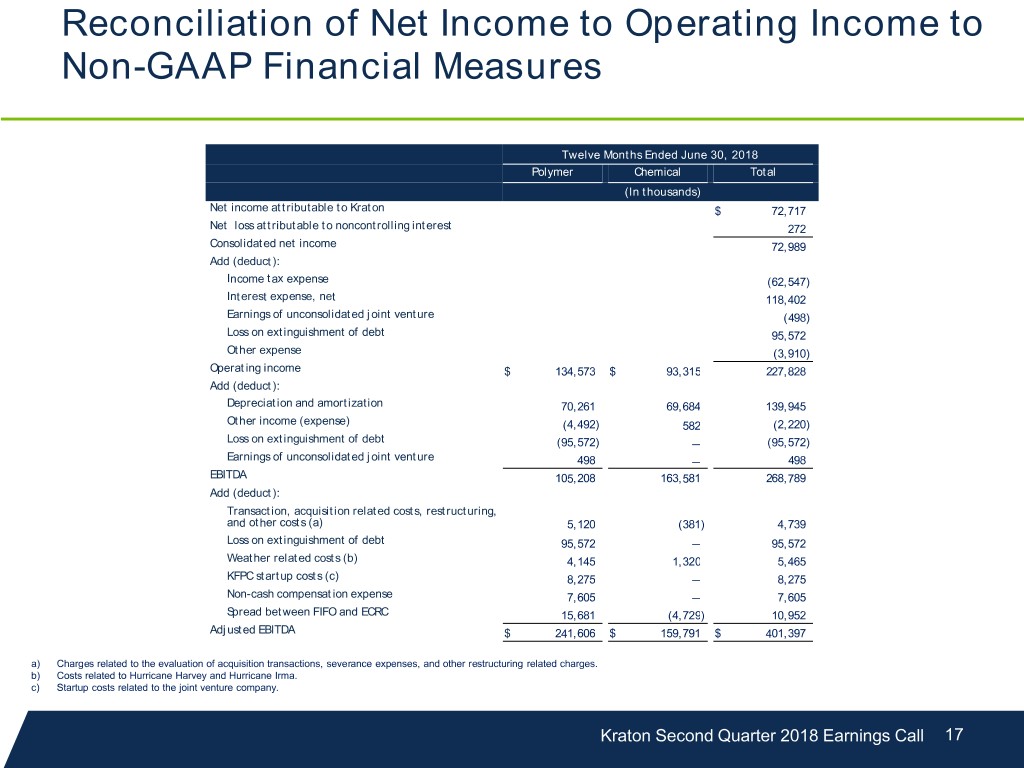
Reconciliation of Net Income to Operating Income to Non-GAAP Financial Measures Twelve Months Ended June 30, 2018 Polymer Chemical Total (In thousands) Net income attributable to Kraton $ 72,717 Net loss attributable to noncontrolling interest 272 Consolidated net income 72,989 Add (deduct): Income tax expense (62,547 ) Interest expense, net 118,402 Earnings of unconsolidated joint venture (498 ) Loss on extinguishment of debt 95,572 Other expense (3,910 ) Operating income $ 134,573 $ 93,315 227,828 Add (deduct): Depreciation and amortization 70,261 69,684 139,945 Other income (expense) (4,492 ) 582 (2,220 ) Loss on extinguishment of debt (95,572 ) — (95,572 ) Earnings of unconsolidated joint venture 498 — 498 EBITDA 105,208 163,581 268,789 Add (deduct): Transaction, acquisition related costs, restructuring, and other costs (a) 5,120 (381 ) 4,739 Loss on extinguishment of debt 95,572 — 95,572 Weather related costs (b) 4,145 1,320 5,465 KFPC startup costs (c) 8,275 — 8,275 Non-cash compensation expense 7,605 — 7,605 Spread between FIFO and ECRC 15,681 (4,729 ) 10,952 Adjusted EBITDA $ 241,606 $ 159,791 $ 401,397 a) Charges related to the evaluation of acquisition transactions, severance expenses, and other restructuring related charges. b) Costs related to Hurricane Harvey and Hurricane Irma. c) Startup costs related to the joint venture company. Kraton Second Quarter 2018 Earnings Call 17
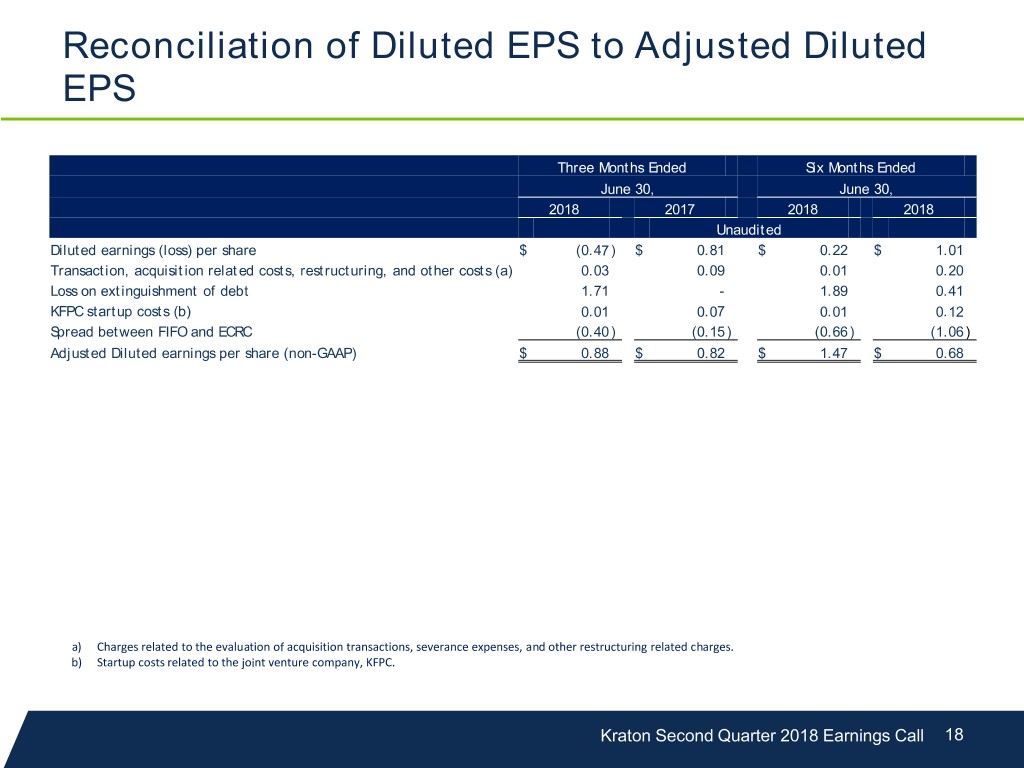
Reconciliation of Diluted EPS to Adjusted Diluted EPS Three Months Ended Six Months Ended June 30, June 30, 2018 2017 2018 2018 Unaudited Diluted earnings (loss) per share $ (0.47 ) $ 0.81 $ 0.22 $ 1.01 Transaction, acquisition related costs, restructuring, and other costs (a) 0.03 0.09 0.01 0.20 Loss on extinguishment of debt 1.71 - 1.89 0.41 KFPC startup costs (b) 0.01 0.07 0.01 0.12 Spread between FIFO and ECRC (0.40 ) (0.15 ) (0.66 ) (1.06 ) Adjusted Diluted earnings per share (non-GAAP) $ 0.88 $ 0.82 $ 1.47 $ 0.68 a) Charges related to the evaluation of acquisition transactions, severance expenses, and other restructuring related charges. b) Startup costs related to the joint venture company, KFPC. Kraton Second Quarter 2018 Earnings Call 18
