Attached files
| file | filename |
|---|---|
| 8-K - FORM 8-K - BAY BANKS OF VIRGINIA INC | tv498160_8k.htm |
Exhibit 99.1

Investor Presentation July 2018
2 This investor presentation contains statements concerning the company's expectations, plans, objectives, future financial performance and other statements that are not historical facts. These statements may constitute "forward - looking statements" as defined by federal securities laws. These statements may address issues that involve estimates and assumptions made by management, risks and uncertainties, and actual results could differ materially from historical results or those anticipated by such statements. Factors that could have a material adverse effect on the operations and future prospects of the company include, but are not limited to: the ability to successfully implement integration plans associated with the Virginia BanCorp merger (the "Merger"), which integration may be more difficult, time - consuming or costly than expected; the ability to achieve the cost savings and synergies contemplated by the Merger within the expected timeframe; disruptions to customer and employee relationships and business operations caused by the Merger; changes in interest rates and general economic conditions; the legislative/regulatory climate; monetary and fiscal policies of the U. S. Government, including policies of the U. S. Treasury and Federal Reserve Board; the quality or composition of the loan or investment portfolios; demand for loan products; deposit flows; competition; demand for financial services in the company's market area; acquisitions and dispositions; and tax and accounting rules, principles, polices and guidelines. These risks and uncertainties should be considered in evaluating the forward - looking statements contained herein, and readers are cautioned not to place undue reliance on such statements, which speak only as of the date they are made. Except to the extent required by applicable law or regulation, the company undertakes no obligation to revise or update publicly any forward - looking statements for any reason. Caution Forward - Looking Statements
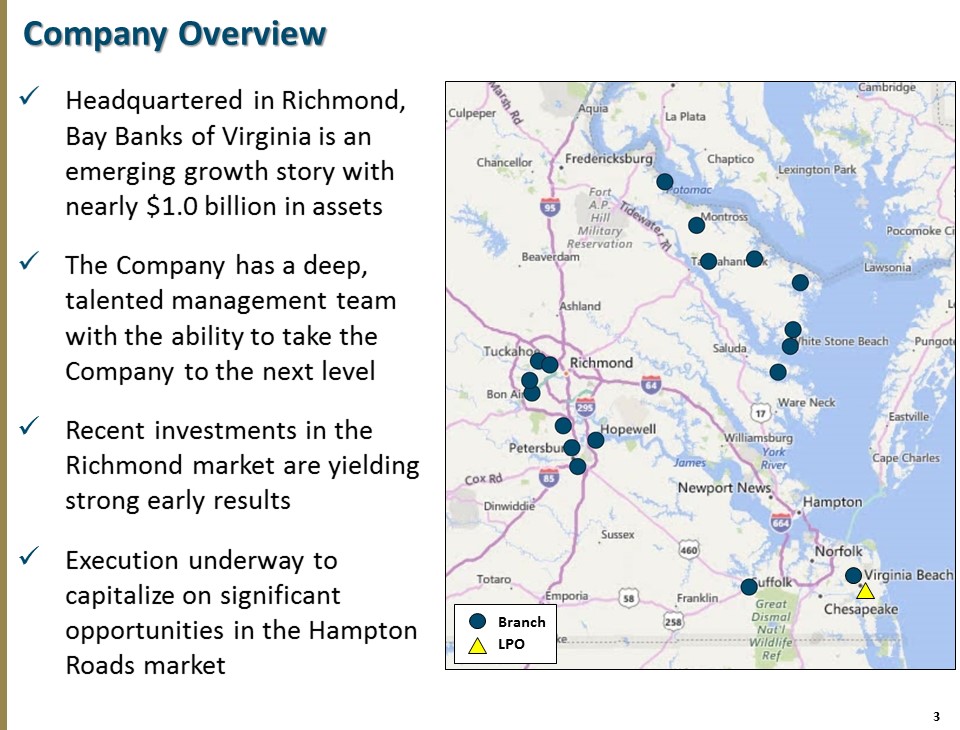
3 Company Overview x Headquartered in Richmond, Bay Banks of Virginia is an emerging growth story with nearly $1.0 billion in assets x The Company has a deep, talented management team with the ability to take the Company to the next level x Recent investments in the Richmond market are yielding strong early results x Execution underway to capitalize on significant opportunities in the Hampton Roads market Branch LPO
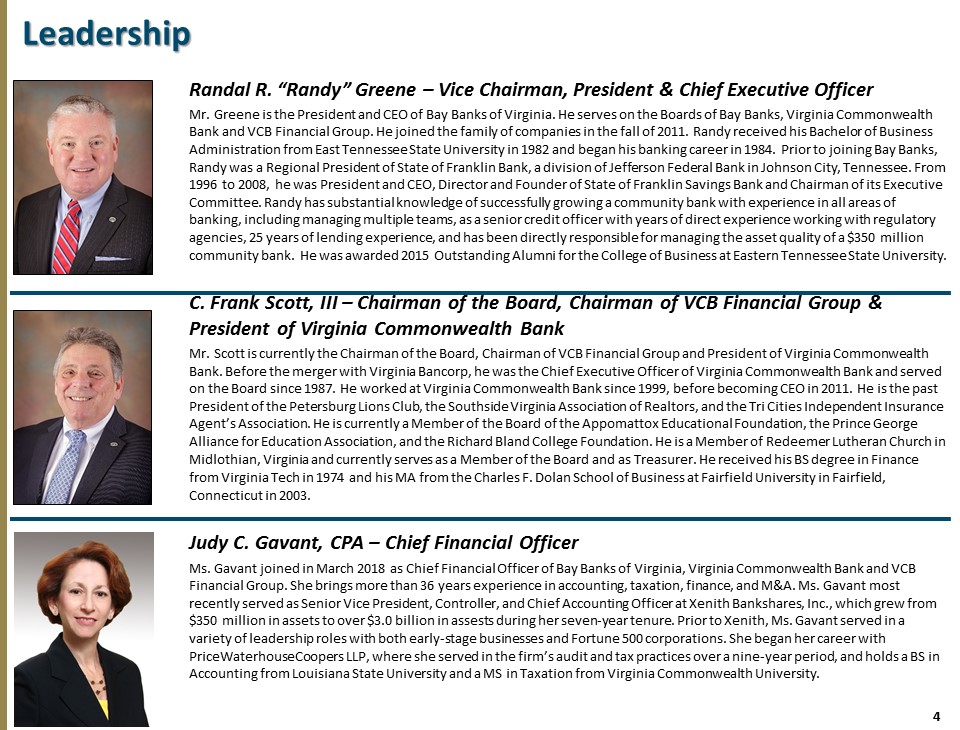
4 Randal R. “Randy” Greene – Vice Chairman, President & Chief Executive Officer Mr. Greene is the President and CEO of Bay Banks of Virginia. He serves on the Boards of Bay Banks, Virginia Commonwealth Bank and VCB Financial Group. He joined the family of companies in the fall of 2011. Randy received his Bachelor of Business Administration from East Tennessee State University in 1982 and began his banking career in 1984. Prior to joining Bay Banks, Randy was a Regional President of State of Franklin Bank, a division of Jefferson Federal Bank in Johnson City, Tennessee. From 1996 to 2008, he was President and CEO, Director and Founder of State of Franklin Savings Bank and Chairman of its Executive Committee. Randy has substantial knowledge of successfully growing a community bank with experience in all areas of banking, including managing multiple teams, as a senior credit officer with years of direct experience working with regulator y agencies, 25 years of lending experience, and has been directly responsible for managing the asset quality of a $350 million community bank. He was awarded 2015 Outstanding Alumni for the College of Business at Eastern Tennessee State University. C. Frank Scott, III – Chairman of the Board, Chairman of VCB Financial Group & President of Virginia Commonwealth Bank Mr. Scott is currently the Chairman of the Board, Chairman of VCB Financial Group and President of Virginia Commonwealth Bank. Before the merger with Virginia Bancorp, he was the Chief Executive Officer of Virginia Commonwealth Bank and served on the Board since 1987. He worked at Virginia Commonwealth Bank since 1999, before becoming CEO in 2011. He is the past President of the Petersburg Lions Club, the Southside Virginia Association of Realtors, and the Tri Cities Independent Insura nce Agent’s Association. He is currently a Member of the Board of the Appomattox Educational Foundation, the Prince George Alliance for Education Association, and the Richard Bland College Foundation. He is a Member of Redeemer Lutheran Church in Midlothian, Virginia and currently serves as a Member of the Board and as Treasurer. He received his BS degree in Finance from Virginia Tech in 1974 and his MA from the Charles F. Dolan School of Business at Fairfield University in Fairfield, Connecticut in 2003. Judy C. Gavant , CPA – Chief Financial Officer Ms. Gavant joined in March 2018 as Chief Financial Officer of Bay Banks of Virginia, Virginia Commonwealth Bank and VCB Financial Group. She brings more than 36 years experience in accounting, taxation, finance, and M&A. Ms. Gavant most recently served as Senior Vice President, Controller, and Chief Accounting Officer at Xenith Bankshares , Inc., which grew from $350 million in assets to over $3.0 billion in assests during her seven - year tenure. Prior to Xenith, Ms. Gavant served in a variety of leadership roles with both early - stage businesses and Fortune 500 corporations. She began her career with PriceWaterhouseCoopers LLP, where she served in the firm’s audit and tax practices over a nine - year period, and holds a BS in Accounting from Louisiana State University and a MS in Taxation from Virginia Commonwealth University. Leadership
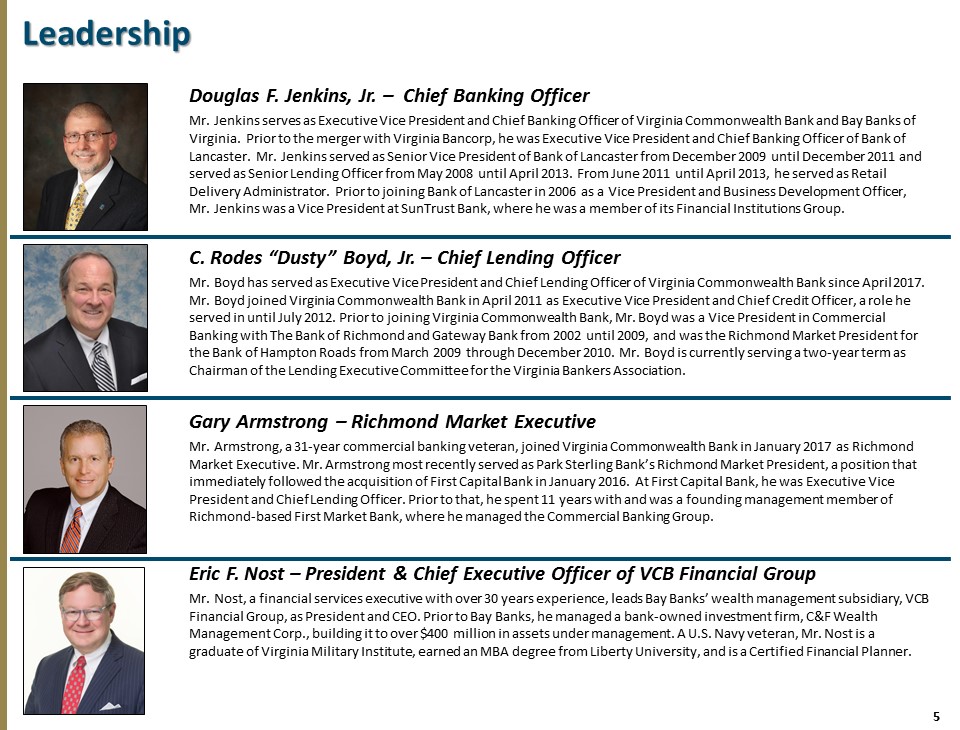
5 Douglas F. Jenkins, Jr. – Chief Banking Officer Mr. Jenkins serves as Executive Vice President and Chief Banking Officer of Virginia Commonwealth Bank and Bay Banks of Virginia. Prior to the merger with Virginia Bancorp, he was Executive Vice President and Chief Banking Officer of Bank of Lancaster. Mr. Jenkins served as Senior Vice President of Bank of Lancaster from December 2009 until December 2011 and served as Senior Lending Officer from May 2008 until April 2013. From June 2011 until April 2013, he served as Retail Delivery Administrator. Prior to joining Bank of Lancaster in 2006 as a Vice President and Business Development Officer, Mr. Jenkins was a Vice President at SunTrust Bank, where he was a member of its Financial Institutions Group. C . Rodes “Dusty” Boyd, Jr . – Chief Lending Officer Mr. Boyd has served as Executive Vice President and Chief Lending Officer of Virginia Commonwealth Bank since April 2017. Mr. Boyd joined Virginia Commonwealth Bank in April 2011 as Executive Vice President and Chief Credit Officer, a role he served in until July 2012. Prior to joining Virginia Commonwealth Bank, Mr. Boyd was a Vice President in Commercial Banking with The Bank of Richmond and Gateway Bank from 2002 until 2009, and was the Richmond Market President for the Bank of Hampton Roads from March 2009 through December 2010. Mr. Boyd is currently serving a two - year term as Chairman of the Lending Executive Committee for the Virginia Bankers Association. Gary Armstrong – Richmond Market Executive Mr. Armstrong, a 31 - year commercial banking veteran, joined Virginia Commonwealth Bank in January 2017 as Richmond Market Executive. Mr. Armstrong most recently served as Park Sterling Bank’s Richmond Market President, a position that immediately followed the acquisition of First Capital Bank in January 2016. At First Capital Bank, he was Executive Vice President and Chief Lending Officer. Prior to that, he spent 11 years with and was a founding management member of Richmond - based First Market Bank, where he managed the Commercial Banking Group. Eric F . Nost – President & Chief Executive Officer of VCB Financial Group Mr. Nost, a financial services executive with over 30 years experience, leads Bay Banks’ wealth management subsidiary, VCB Financial Group, as President and CEO. Prior to Bay Banks, he managed a bank - owned investment firm, C&F Wealth Management Corp., building it to over $400 million in assets under management. A U.S. Navy veteran, Mr. Nost is a graduate of Virginia Military Institute, earned an MBA degree from Liberty University, and is a Certified Financial Planner. Leadership

6 □ Grow organically to over $1.0 billion in assets in 2018 □ Achieve ROAA in the range of 0.90% - 1.00% by the end of 2020 □ Achieve double - digit loan and EPS growth in 2018 by capitalizing on the opportunities in the Richmond and Hampton Roads markets □ Become the community bank of choice in Central and Eastern Virginia by providing exceptional customer service and leveraging the ability to serve larger customers □ Expand presence in the Hampton Roads market with multiple branch locations, having hired a seasoned market executive □ Increase the contribution by the wealth management subsidiary, VCB Financial Group, to 25% of the Company’s total noninterest income by 2020 □ List on the NASDAQ exchange for greater visibility and sponsorship Corporate Goals

7 Financial Performance Since 2012 1 All profitability information excludes merger - related costs of $575 thousand, which are non - GAAP measures. S ee discussion of Non - GAPP measures at end of presentation 2 All profitability information excludes merger - related costs of $1.976 million, which are non - GAAP measures. See discussion of Non - GAPP measures at end of presentation 3 Calculated as gross loans, net of loan loss reserve, divided by deposits Source: S&P Global Market Intelligence, Company documents 2012 2013 2014 2015 2016 1 2017 2 2018Q1 Total Assets ($M) $335 $331 $390 $456 $487 $971 $995 Net Loans ($M) $236 $248 $295 $344 $382 $760 $783 Deposits ($M) $275 $268 $308 $360 $382 $762 $797 Loans/Deposits 3 86% 92% 96% 95% 100% 100% 98% Net Income (000s) $698 $1,222 $1,830 $366 $ 2,916 $32 $1,124 ROAA 0.22% 0.37% 0.53% 0.09% 0.63% 0.00% 0.46% ROAE 2.16% 3.32% 4.76% 0.92% 7.12% 0.04% 3.92% Net Interest Margin 3.61% 3.53% 3.85% 3.48% 3.40% 3.98% 3.83% Diluted Earnings Per Share $0.27 $0.25 $0.38 $0.08 $0.61 $0.00 $ 0.09

8 2.65% 2.01% 1.22% 1.82% 1.60% 1.12% 0.95% 0.0% 0.5% 1.0% 1.5% 2.0% 2.5% 3.0% 3.5% 4.0% 2012 2013 2014 2015 2016 2017 2018Q1 Balance Sheet Trends Net Loans ($M) Total Assets ($M) Loans / Deposits 1 NPA / Assets (excl. TDR) 1 Calculated as gross loans, net of loan loss reserve, divided by deposits Source: S&P Global Market Intelligence, Company documents $335 $331 $390 $456 $487 $971 $995 $0 $100 $200 $300 $400 $500 $600 $700 $800 $900 $1,000 2012 2013 2014 2015 2016 2017 2018Q1 $236 $248 $295 $344 $382 $760 $783 $0 $100 $200 $300 $400 $500 $600 $700 $800 2012 2013 2014 2015 2016 2017 2018Q1 86% 92% 96% 95% 100% 100% 98% 50% 60% 70% 80% 90% 100% 110% 2012 2013 2014 2015 2016 2017 2018Q1

9 $298.4 $347.5 $385.4 $494.0 $790.8 $272.5 $0.0 $100.0 $200.0 $300.0 $400.0 $500.0 $600.0 $700.0 $800.0 $900.0 2014 2015 2016 2017 2018Q1 Loans ($M) Historical Loan Growth 1Q18 Loan Mix Merger With Virginia Commonwealth Bank Note: Dollars in millions ; historical loan growth does not include loans held for sale; loan mix based on regulatory data Source: S&P Global Market Intelligence Loan Portfolio Total $766.5 C&D 9.2% 1 - 4 Fam 36.2% HELOC 4.5% OwnOcc CRE 10.0% Other CRE 16.2% Multifam 2.7% C&I 15.1% Consr & Other 6.2%
10 □ Gary Armstrong, a 31 - year commercial banking veteran, joined in January 2017 as Market Executive to lead the Company’s growth in Richmond □ Additions to the lending team position the Company to be a dominant community bank player in the market □ Since the completion of the merger, loans in the Richmond market have increased by $62.7 million and commercial originations are expected to be approximately $130 million in 2018 □ Barry Almond, a community banking veteran with 30 years experience in the Richmond market, joined as Chief Retail Officer to oversee the retail franchise and focus on core deposit generation Richmond Growth Story Significant Investment is Yielding Strong Early Results Source : Company documents

11 Loan Growth Resulting in Higher Net Interest Income *Annualized first quarter net interest income; chart data in thousands Source: S&P Global Market Intelligence, Company documents □ The Company originated $269 million of new loans in 2017 and $75.7 million in the first quarter of 2018 □ In 2018, originations are expected to be approximately $325 million □ The C ompany is focused on improving deposit makeup and holding deposit costs □ Net interest income is on pace to increase by 24.8% over 2017 $11,935 $13,219 $14,411 $27,699 $34,576 $- $5,000 $10,000 $15,000 $20,000 $25,000 $30,000 $35,000 $40,000 2014 2015 2016 2017 2018* Net Interest Income

12 Note: D ollars in thousands Source: S&P Global Market Intelligence, Company documents Improving Deposit Franchise 1Q18 Deposit Mix □ Since the merger, the Company has grown its deposit base by $147 million (from $650 million to $797 million) □ Time deposits comprise the largest segment of the deposit portfolio at 47% □ Sharp focus on non - interest bearing deposit growth expected to gradually shift the mix from time deposits □ Added a Treasury Management resource to support the commercial lending team in providing enhanced products and solutions and generating new deposits Non Int. Bearing 15.6% NOW Accts 10.5% MMDA & Sav 27.0% Time Deposits < $100k 21.6% Time Deposits > $100k 25.2%

13 Core Earnings *Adjusted pre - tax earnings excludes loan loss provision and merger - related expenses Source : S&P Global Market Intelligence, Company documents Bay Banks of Virginia, Inc. DO NOT TOUCH THIS IS LINKED TO INPUT TAB!!!! MAKE ANY CHANGES IN MANUAL CELLS ON INPUT TAB ($000's) 2017Q1 2017Q2 2017Q3 2017Q4 2018Q1 Net interest income 3,884$ 7,444$ 7,802$ 8,569$ 8,644$ Loan loss provision 190 568 1,075 3,101 320 Non-interest income 953 1,143 1,070 733 1,198 Non-interest expense 4,645 6,523 6,641 7,354 7,785 Merger-related expense (300) (685) (141) (850) (363) Net income before taxes (298) 811 1,015 (2,003) 1,374 Income tax expense / (benefit) (121) 254 273 391 250 Net Income attributable to noncontrolling interest - - - - - Net income (177)$ 557$ 742$ (2,394)$ 1,124$ *Adjusted pre-tax earnings (core) 192 2,064 2,231 1,948 2,057 % of average assets (annualized) 0.16% 0.97% 0.98% 0.81% 0.84% $192 $2,064 $2,231 $1,948 $2,057 $0 $500 $1,000 $1,500 $2,000 $2,500 2017Q1 2017Q2 2017Q3 2017Q4 2018Q1
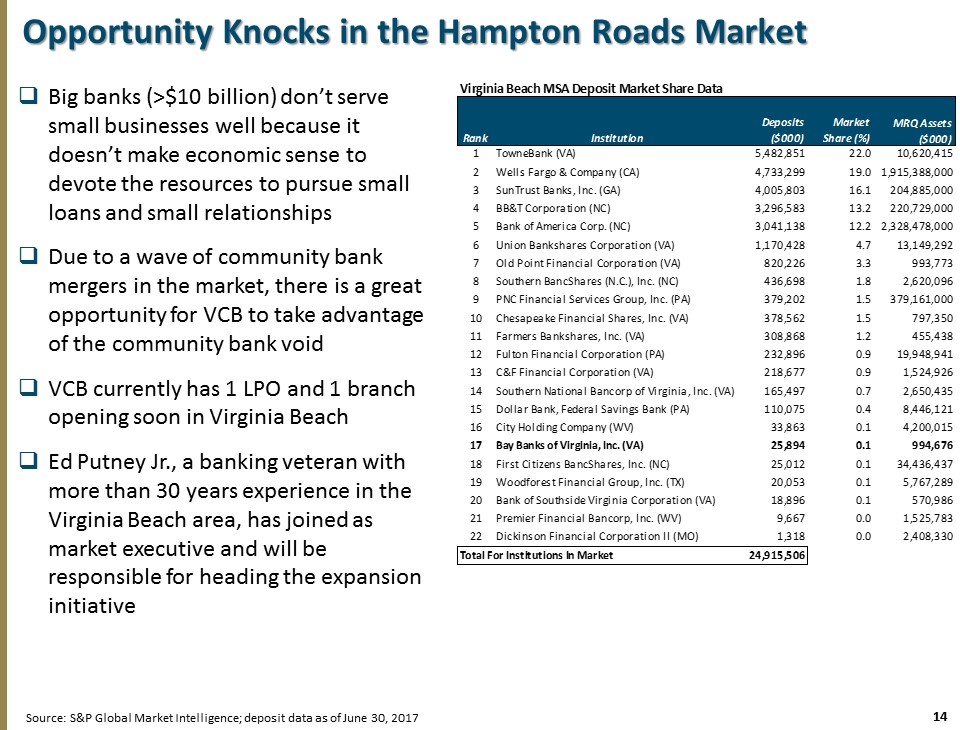
14 Opportunity Knocks in the Hampton Roads Market □ Big banks (>$10 billion) don’t serve small businesses well because it doesn’t make economic sense to devote the resources to pursue small loans and small relationships □ Due to a wave of community bank mergers in the market, there is a great opportunity for VCB to take advantage of the community bank void □ VCB currently has 1 LPO and 1 branch opening soon in Virginia Beach □ Ed Putney Jr., a banking veteran with more than 30 years experience in the Virginia Beach area, has joined as market executive and will be responsible for heading the expansion initiative Source: S&P Global Market Intelligence; deposit data as of June 30, 2017 Institution Deposits ($000) Market Share (%) MRQ Assets ($000) 1 TowneBank (VA) 5,482,851 22.0 10,620,415 2 Wells Fargo & Company (CA) 4,733,299 19.0 1,915,388,000 3 SunTrust Banks, Inc. (GA) 4,005,803 16.1 204,885,000 4 BB&T Corporation (NC) 3,296,583 13.2 220,729,000 5 Bank of America Corp. (NC) 3,041,138 12.2 2,328,478,000 6 Union Bankshares Corporation (VA) 1,170,428 4.7 13,149,292 7 Old Point Financial Corporation (VA) 820,226 3.3 993,773 8 Southern BancShares (N.C.), Inc. (NC) 436,698 1.8 2,620,096 9 PNC Financial Services Group, Inc. (PA) 379,202 1.5 379,161,000 10 Chesapeake Financial Shares, Inc. (VA) 378,562 1.5 797,350 11 Farmers Bankshares, Inc. (VA) 308,868 1.2 455,438 12 Fulton Financial Corporation (PA) 232,896 0.9 19,948,941 13 C&F Financial Corporation (VA) 218,677 0.9 1,524,926 14 Southern National Bancorp of Virginia, Inc. (VA) 165,497 0.7 2,650,435 15 Dollar Bank, Federal Savings Bank (PA) 110,075 0.4 8,446,121 16 City Holding Company (WV) 33,863 0.1 4,200,015 17 Bay Banks of Virginia, Inc. (VA) 25,894 0.1 994,676 18 First Citizens BancShares, Inc. (NC) 25,012 0.1 34,436,437 19 Woodforest Financial Group, Inc. (TX) 20,053 0.1 5,767,289 20 Bank of Southside Virginia Corporation (VA) 18,896 0.1 570,986 21 Premier Financial Bancorp, Inc. (WV) 9,667 0.0 1,525,783 22 Dickinson Financial Corporation II (MO) 1,318 0.0 2,408,330 Total For Institutions In Market 24,915,506 Virginia Beach MSA Deposit Market Share Data Rank
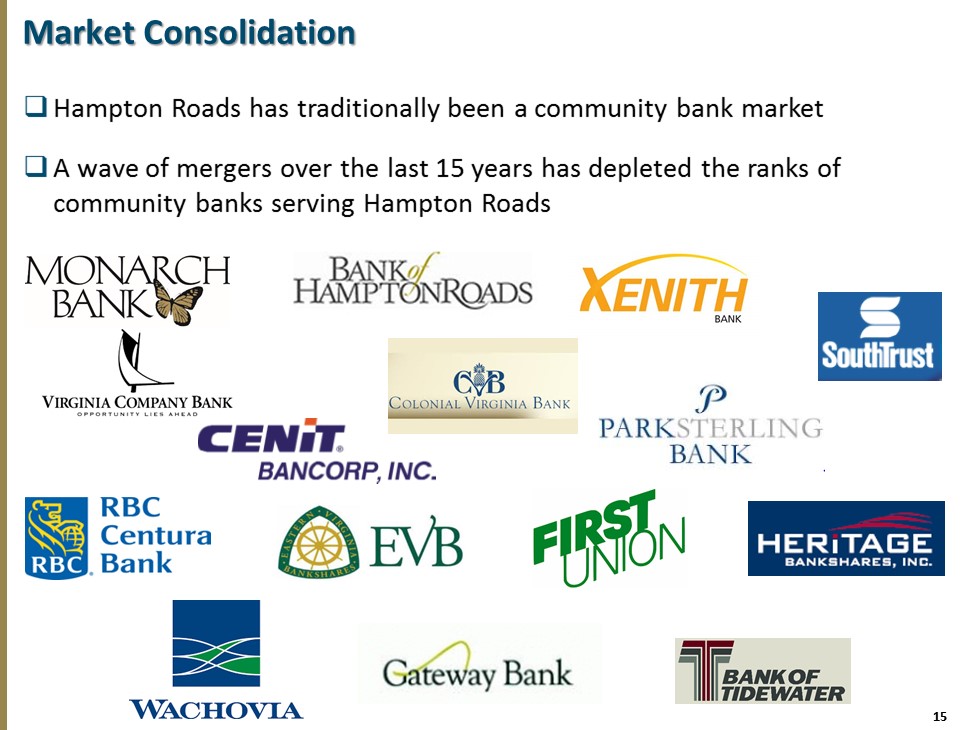
15 Market Consolidation □ Hampton Roads has traditionally been a community bank market □ A wave of mergers over the last 15 years has depleted the ranks of community banks serving Hampton Roads
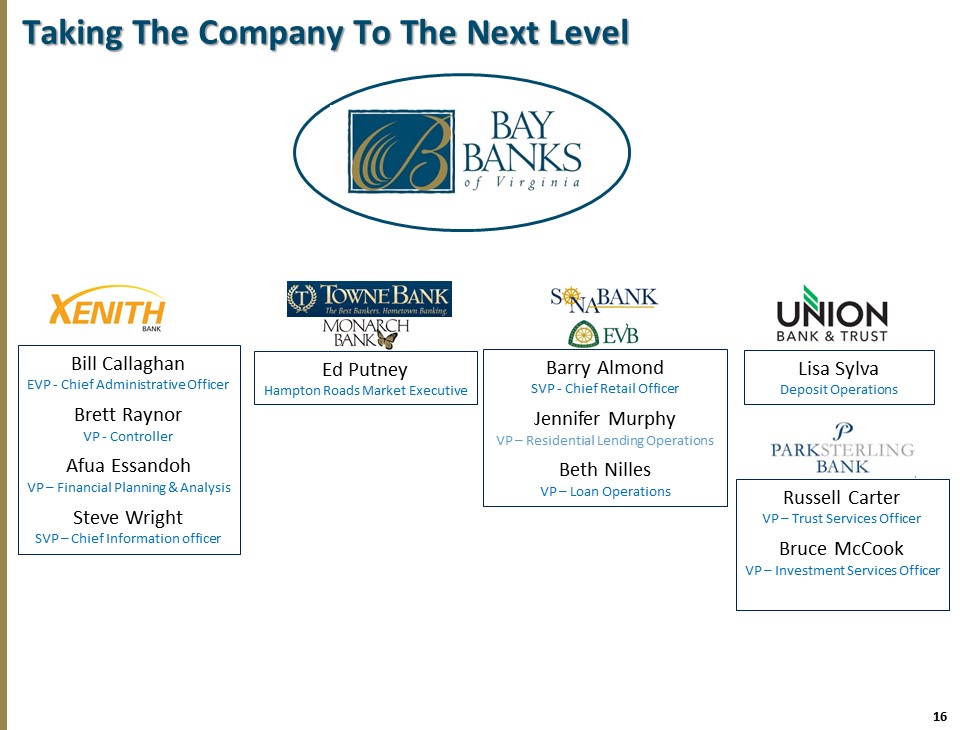
16 Taking The Company To The Next Level Bill Callaghan EVP - Chief Administrative Officer Brett Raynor VP - Controller Afua Essandoh VP – Financial Planning & Analysis Steve Wright SVP – Chief Information officer Ed Putney Hampton Roads Market Executive Barry Almond SVP - Chief Retail Officer Jennifer Murphy VP – Residential Lending Operations Beth Nilles VP – Loan Operations Lisa Sylva Deposit Operations Russell Carter VP – Trust Services Officer Bruce McCook VP – Investment Services Officer
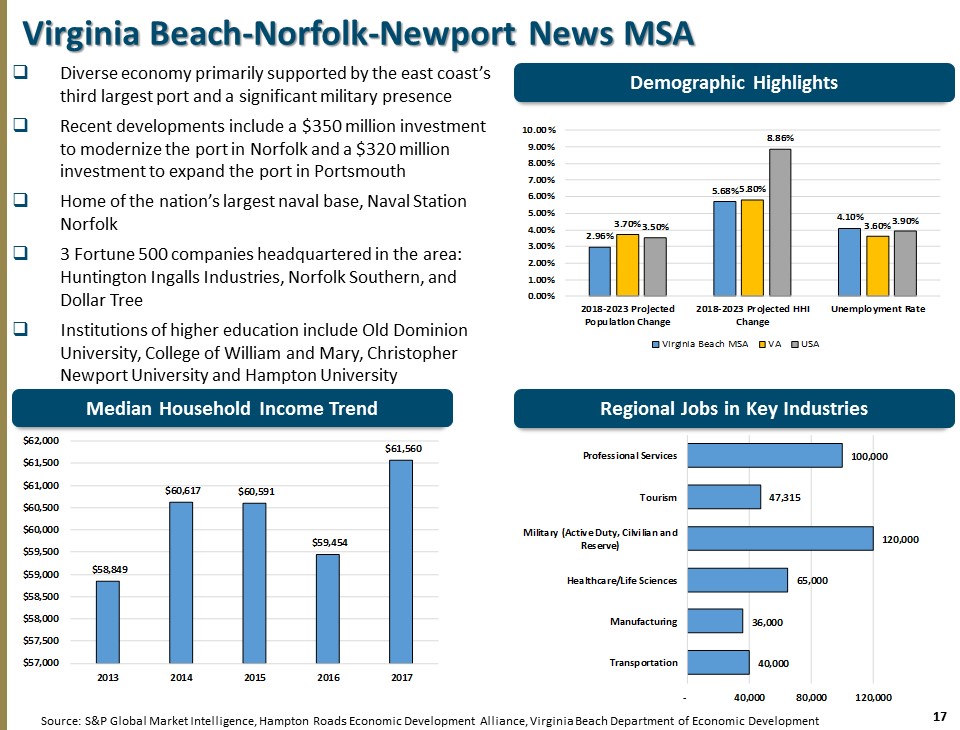
17 $58,849 $60,617 $60,591 $59,454 $61,560 $57,000 $57,500 $58,000 $58,500 $59,000 $59,500 $60,000 $60,500 $61,000 $61,500 $62,000 2013 2014 2015 2016 2017 40,000 36,000 65,000 120,000 47,315 100,000 - 40,000 80,000 120,000 Transportation Manufacturing Healthcare/Life Sciences Military (Active Duty, Cilvilian and Reserve) Tourism Professional Services 2.96% 5.68% 4.10% 3.70% 5.80% 3.60% 3.50% 8.86% 3.90% 0.00% 1.00% 2.00% 3.00% 4.00% 5.00% 6.00% 7.00% 8.00% 9.00% 10.00% 2018-2023 Projected Population Change 2018-2023 Projected HHI Change Unemployment Rate Virginia Beach MSA VA USA Virginia Beach - Norfolk - Newport News MSA Demographic Highlights □ Diverse economy primarily supported by the east coast’s third largest port and a significant military presence □ Recent developments include a $350 million investment to modernize the port in Norfolk and a $320 million investment to expand the port in Portsmouth □ Home of the nation’s largest naval base, Naval Station Norfolk □ 3 Fortune 500 companies headquartered in the area: Huntington Ingalls Industries, Norfolk Southern, and Dollar Tree □ Institutions of higher education include Old Dominion University, College of William and Mary, Christopher Newport University and Hampton University Source: S&P Global Market Intelligence, Hampton Roads Economic Development Alliance, Virginia Beach Department of Economic De vel opment Regional Jobs in Key Industries Median Household Income Trend

18 Wealth Management Initiative □ The goal is for VCB Financial Group to account for 25% of the Company’s total noninterest income by the end of 2020 □ The Company restructured the legacy Bank of Lancaster trust department to increase profitability and rebranded it as VCB Financial Group □ Eric Nost, a financial services executive with over 30 years experience, joined Bay Banks in March 2017 to lead the Wealth Management subsidiary □ Resources have been reallocated to focus on growing assets under management with all new employees in client - facing roles □ Since Q1 2017, assets under management have increased 110% □ Servicing, compliance and other back office responsibilities have been outsourced to National Advisors Trust Source : Company documents
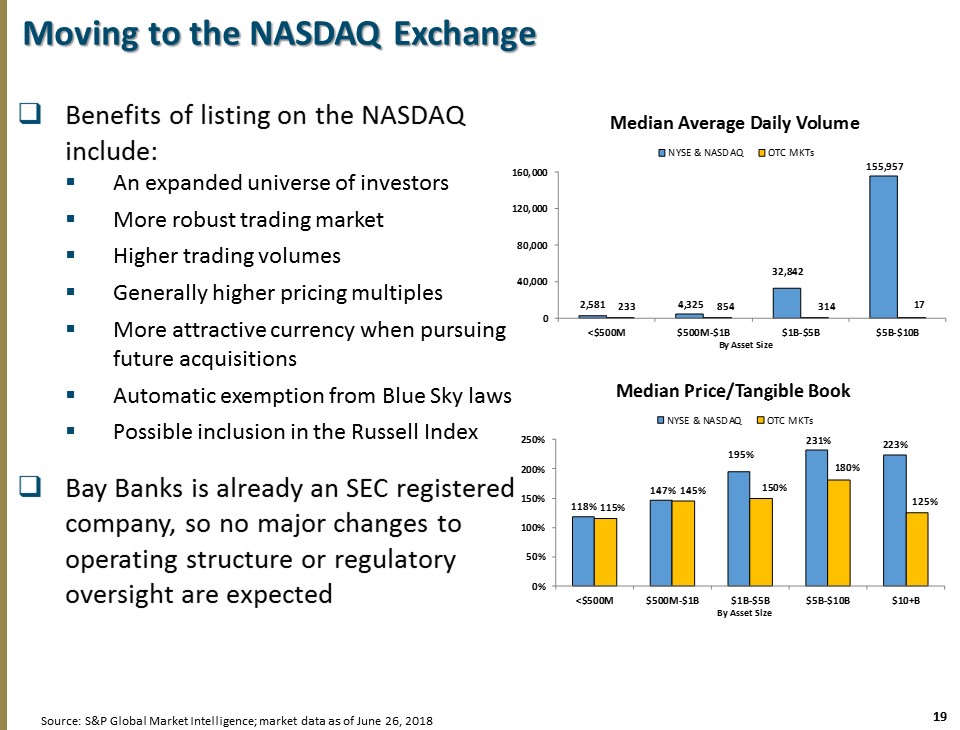
19 Moving to the NASDAQ Exchange □ Benefits of listing on the NASDAQ include: ▪ An expanded universe of investors ▪ More robust trading market ▪ Higher trading volumes ▪ Generally higher pricing multiples ▪ More attractive currency when pursuing future acquisitions ▪ Automatic exemption from Blue Sky laws ▪ Possible inclusion in the Russell Index □ Bay Banks is already an SEC registered company, so no major changes to operating structure or regulatory oversight are expected Source: S&P Global Market Intelligence; market data as of June 26, 2018 2,581 4,325 32,842 155,957 233 854 314 17 0 40,000 80,000 120,000 160,000 <$500M $500M-$1B $1B-$5B $5B-$10B Median Average Daily Volume NYSE & NASDAQ OTC MKTs By Asset Size 118% 147% 195% 231% 223% 115% 145% 150% 180% 125% 0% 50% 100% 150% 200% 250% <$500M $500M-$1B $1B-$5B $5B-$10B $10+B Median Price/Tangible Book NYSE & NASDAQ OTC MKTs By Asset Size
20 Investment Opportunity x With nearly $1.0 billion in assets, Bay Banks is the 3 rd largest community bank headquartered in Richmond and 16 th largest in the Commonwealth of Virginia x Deep, talented leadership team with the ability to take the Company to the next level x Emerging growth story with significant opportunities in the Richmond and Hampton Roads markets x Recent stock offering provides capital to support additional growth to $1.3 - $1.4 billion in assets x The Company expects improved profitability in 2018 as recent investments in Richmond are realized x The move to the NASDAQ exchange is expected to increase institutional sponsorship, trading liquidity, and valuation

21 Non - GAAP Reconciliation Bay Banks of Virginia Non-GAAP Reconciliation (Unaudited) (Dollars in thousands, except per share data) Year Ended, Year Ended, December 31, 2016 December 31, 2017 Net Income - GAAP $2,535 ($1,272) Less: Non-recurring Items Merger-related Expenses (575) (1,976) Tax Adjustment (34%) 195 672 Net Income, excluding Merger-related Expenses $2,916 $32 Average Assets $464,011 $763,443 Adjusted Return on Average Assets 0.63% 0.00% Average Equity $40,974 $80,503 Adjusted Return on Average Equity 7.12% 0.04% Average Diluted Shares Outstanding 4,799,946 9,399,223 Adjusted Diluted Earnings Per Share $0.61 $0.00 Note : Non - GAAP (generally accepted accounting principles) financial measure. Set forth above are calculations of each of the non - GAAP financial measures included in the presentation. Management believes that these Non - GAAP measures are meaningful because management uses them to assess the financial performance of the company. Calculations of these non - GAAP financial measures may not be comparable to the calculation of simila rly titled measures reported by other companies.

www.vcb.bank