Attached files
| file | filename |
|---|---|
| EX-99 - EXHIBIT 99 - FORD MOTOR CREDIT CO LLC | may2018salesfinalfilingversi.pdf |
| 8-K - 8-K - FORD MOTOR CREDIT CO LLC | sales8-kdated06x01x2018.htm |

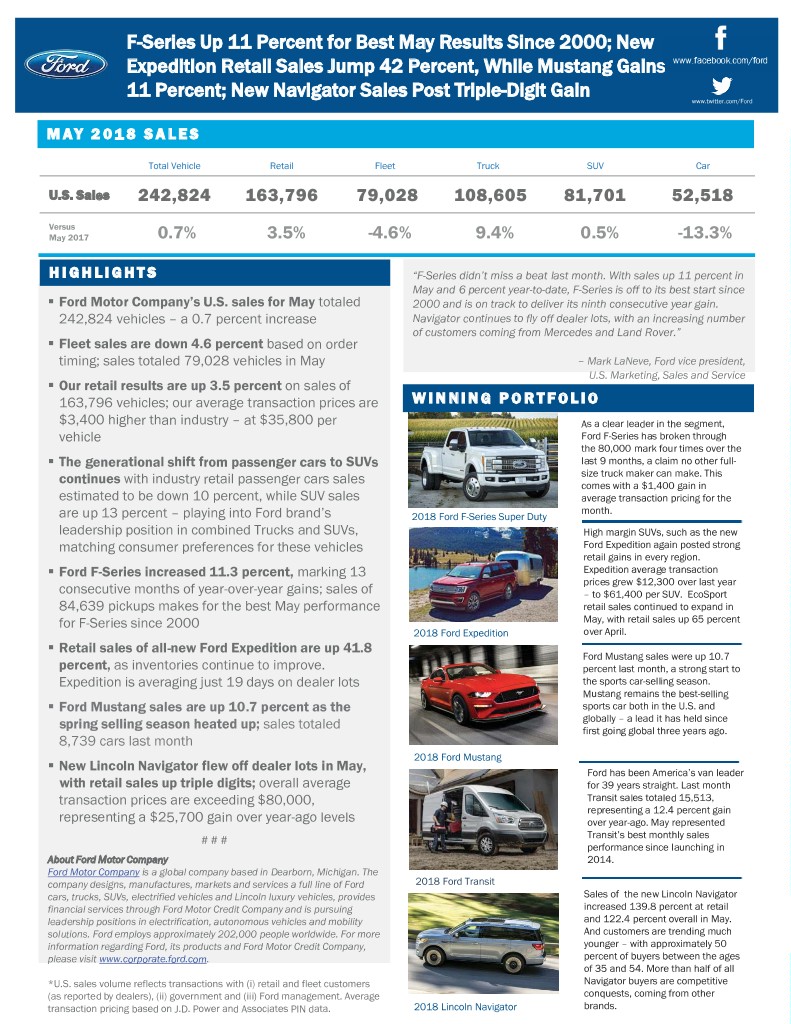
F-Series Up 11 Percent for Best May Results Since 2000; New Expedition Retail Sales Jump 42 Percent, While Mustang Gains 11 Percent; New Navigator Sales Post Triple-Digit Gain www.twitter.com/Ford M A Y 2 0 1 8 S A L E S Total Vehicle Retail Fleet Truck SUV Car U.S. Sales 242,824 163,796 79,028 108,605 81,701 52,518 Versus May 2017 0.7% 3.5% -4.6% 9.4% 0.5% -13.3% H I G H L I G H T S “F-Series didn’t miss a beat last month. With sales up 11 percent in May and 6 percent year-to-date, F-Series is off to its best start since ƒ Ford Motor Company’s U.S. sales for May totaled 2000 and is on track to deliver its ninth consecutive year gain. 242,824 vehicles – a 0.7 percent increase Navigator continues to fly off dealer lots, with an increasing number of customers coming from Mercedes and Land Rover.” ƒ Fleet sales are down 4.6 percent based on order timing; sales totaled 79,028 vehicles in May – Mark LaNeve, Ford vice president, U.S. Marketing, Sales and Service ƒ Our retail results are up 3.5 percent on sales of 163,796 vehicles; our average transaction prices are W I N N I N G P O R T F O L I O $3,400 higher than industry – at $35,800 per As a clear leader in the segment, vehicle Ford F-Series has broken through the 80,000 mark four times over the ƒ The generational shift from passenger cars to SUVs last 9 months, a claim no other full- size truck maker can make. This continues with industry retail passenger cars sales comes with a $1,400 gain in estimated to be down 10 percent, while SUV sales average transaction pricing for the month. are up 13 percent – playing into Ford brand’s 2018 Ford F-Series Super Duty leadership position in combined Trucks and SUVs, High margin SUVs, such as the new matching consumer preferences for these vehicles Ford Expedition again posted strong retail gains in every region. ƒ Ford F-Series increased 11.3 percent, marking 13 Expedition average transaction prices grew $12,300 over last year consecutive months of year-over-year gains; sales of – to $61,400 per SUV. EcoSport 84,639 pickups makes for the best May performance retail sales continued to expand in for F-Series since 2000 May, with retail sales up 65 percent 2018 Ford Expedition over April. ƒ Retail sales of all-new Ford Expedition are up 41.8 Ford Mustang sales were up 10.7 percent, as inventories continue to improve. percent last month, a strong start to Expedition is averaging just 19 days on dealer lots the sports car-selling season. Mustang remains the best-selling ƒ Ford Mustang sales are up 10.7 percent as the sports car both in the U.S. and globally – a lead it has held since spring selling season heated up; sales totaled first going global three years ago. 8,739 cars last month 2018 Ford Mustang ƒ New Lincoln Navigator flew off dealer lots in May, Ford has been America’s van leader with retail sales up triple digits; overall average for 39 years straight. Last month transaction prices are exceeding $80,000, Transit sales totaled 15,513, representing a 12.4 percent gain representing a $25,700 gain over year-ago levels over year-ago. May represented # # # Transit’s best monthly sales performance since launching in About Ford Motor Company 2014. Ford Motor Company is a global company based in Dearborn, Michigan. The company designs, manufactures, markets and services a full line of Ford 2018 Ford Transit cars, trucks, SUVs, electrified vehicles and Lincoln luxury vehicles, provides Sales of the new Lincoln Navigator financial services through Ford Motor Credit Company and is pursuing increased 139.8 percent at retail leadership positions in electrification, autonomous vehicles and mobility and 122.4 percent overall in May. solutions. Ford employs approximately 202,000 people worldwide. For more And customers are trending much information regarding Ford, its products and Ford Motor Credit Company, younger – with approximately 50 please visit www.corporate.ford.com. percent of buyers between the ages of 35 and 54. More than half of all *U.S. sales volume reflects transactions with (i) retail and fleet customers Navigator buyers are competitive (as reported by dealers), (ii) government and (iii) Ford management. Average conquests, coming from other transaction pricing based on J.D. Power and Associates PIN data. 2018 Lincoln Navigator brands.

M A Y 2 0 1 8 I N V E N T O R Y / F L E E T R E S U LT S )25'02725&203$1< MAY 2018 May 2018 May CYTD Fleet Percent of Percent of YOY Change YOY Change Segment Total Sales Total Sales Rental 14.8% (0.9) points 14.9% (0.6) points Commercial 11.5% (0.9) points 12.6% 0.5 points Government 6.2% (0.0) points 5.8% (0.3) points Total Fleet 32.5% (1.8) points 33.3% (0.3) points May 2018 April 2018 May 2017 Gross Stock Units at Units at Units at Days' Supply Days' Supply Days' Supply (incl. in-transit) Month-End Month-End Month-End Cars 161,264 80 175,294 99 165,543 68 SUVs 241,471 77 247,517 85 196,011 60 Trucks 275,661 66 313,600 82 329,711 83 Total 678,396 73 736,411 86 691,265 72 May 2018 April 2018 May 2017 Dealer Stock Units at Units at Units at Days' Supply Days' Supply Days' Supply (on ground) Month-End Month-End Month-End Cars 137,604 68 136,201 77 133,273 55 SUVs 199,526 63 195,019 67 161,170 50 Trucks 231,286 55 248,479 65 279,106 70 Total 568,416 61 579,699 68 573,549 59 C O N TA C T Erich Merkle 313.806.4562 emerkle2@ford.com
