Attached files
| file | filename |
|---|---|
| EX-12 - EXHIBIT 12 - FORD MOTOR CREDIT CO LLC | fmcc12312015ex12.htm |
| EX-23 - EXHIBIT 23 - FORD MOTOR CREDIT CO LLC | fmcc12312015ex23.htm |
| EX-24 - EXHIBIT 24 - FORD MOTOR CREDIT CO LLC | fmcc12312015ex24.htm |
| EX-24.2 - EXHIBIT 24.2 - FORD MOTOR CREDIT CO LLC | fmcc12312015ex242.htm |
| EX-24.3 - EXHIBIT 24.3 - FORD MOTOR CREDIT CO LLC | fmcc12312015ex243.htm |
| EX-31.1 - EXHIBIT 31.1 - FORD MOTOR CREDIT CO LLC | fmcc12312015ex311.htm |
| EX-31.2 - EXHIBIT 31.2 - FORD MOTOR CREDIT CO LLC | fmcc12312015ex312.htm |
| EX-32.1 - EXHIBIT 32.1 - FORD MOTOR CREDIT CO LLC | fmcc12312015ex321.htm |
| EX-32.2 - EXHIBIT 32.2 - FORD MOTOR CREDIT CO LLC | fmcc12312015ex322.htm |
| 10-K - PRINTABLE PDF OF FORM 10-K - FORD MOTOR CREDIT CO LLC | fmcc1231201510k.pdf |
UNITED STATES
SECURITIES AND EXCHANGE COMMISSION
Washington, D.C. 20549
_______________________________
FORM 10-K
(Mark One)
R | Annual report pursuant to Section 13 or 15(d) of the Securities Exchange Act of 1934 | |
For the fiscal year ended December 31, 2015 | ||
or
£ | Transition report pursuant to Section 13 or 15(d) of the Securities Exchange Act of 1934 | |
For the transition period from ____________________ to ____________________ | ||
Commission file number 1-6368 | ||
Ford Motor Credit Company LLC
(Exact name of registrant as specified in its charter)
Delaware | 38-1612444 |
(State of organization) | (I.R.S. employer identification no.) |
One American Road, Dearborn, Michigan | 48126 |
(Address of principal executive offices) | (Zip code) |
(313) 322-3000
(Registrant’s telephone number, including area code)
Securities registered pursuant to Section 12(b) of the Act:
Title of each class | Name of each Exchange on which registered | |
7 1/2% Continuously Offered Bonds for Retail | New York Stock Exchange | |
Accounts due August 20, 2032 | ||
4.05% Notes due December 10, 2018 | New York Stock Exchange | |
Securities registered pursuant to Section 12(g) of the Act: None.
Indicate by check mark if the registrant is a well-known seasoned issuer, as defined in Rule 405 of the Securities Act. þ Yes o No
Indicate by check mark if the registrant is not required to file reports pursuant to Section 13 or Section 15(d) of the Act. o Yes þ No
Indicate by check mark whether the registrant (1) has filed all reports required to be filed by Section 13 or 15(d) of the Securities Exchange Act of 1934 during the preceding 12 months (or for such shorter period that the registrant was required to file such reports), and (2) has been subject to such filing requirements for the past 90 days. þ Yes o No
Indicate by check mark whether the registrant has submitted electronically and posted on its corporate Web site, if any, every Interactive Data File required to be submitted and posted pursuant to Rule 405 of Regulation S-T (§ 232.405 of this chapter) during the preceding 12 months (or for such shorter period that the registrant was required to submit and post such files). þ Yes o No
Indicate by check mark if disclosure of delinquent filers pursuant to Item 405 of Regulation S-K (§ 229.405 of this chapter) is not contained herein, and will not be contained, to the best of registrant’s knowledge, in definitive proxy or information statements incorporated by reference in Part III of this Form 10-K or any amendment to this Form 10-K. þ
Indicate by check mark whether the registrant is a large accelerated filer, an accelerated filer, a non-accelerated filer, or a smaller reporting company. See the definitions of “large accelerated filer,” “accelerated filer” and “smaller reporting company” in Rule 12b-2 of the Exchange Act. (Check one):
Large accelerated filer o | Accelerated filer o | Non-accelerated filer þ | Smaller reporting company o |
Indicate by check mark whether the registrant is a shell company (as defined in Rule 12b-2 of the Act).
o Yes þ No
All of the limited liability company interests in the registrant (“Shares”) are held by an affiliate of the registrant. None of the Shares are publicly traded.
REDUCED DISCLOSURE FORMAT
The registrant meets the conditions set forth in General Instruction I(1)(a) and (b) of Form 10-K and is therefore filing this Form with the reduced disclosure format.
Exhibit Index begins on page 59 |
FORD MOTOR CREDIT COMPANY LLC
ANNUAL REPORT ON FORM 10-K
For the Year Ended December 31, 2015
Table of Contents | Page | ||
Part I | |||
Part II | |||
i
Table of Contents (Continued) | Page | ||
Part III | |||
Part IV | |||
Ford Motor Credit Company LLC and Subsidiaries Financial Statements | |||
ii
PART I
ITEM 1. Business.
Overview
Ford Motor Credit Company LLC (referred to herein as “Ford Credit,” the “Company,” “we,” “our,” or “us”) was incorporated in Delaware in 1959 and converted to a limited liability company in 2007. We are an indirect, wholly owned subsidiary of Ford Motor Company (“Ford”). Our principal executive offices are located at One American Road, Dearborn, Michigan 48126, and our telephone number is (313) 322-3000.
Our annual reports on Form 10-K, quarterly reports on Form 10-Q, and current reports on Form 8-K filed with the Securities and Exchange Commission (“SEC”) pursuant to Section 13(a) or 15(d) of the Securities Exchange Act are available free of charge through our website located at www.fordcredit.com/investor-center. These reports can also be found on the SEC’s website located at www.sec.gov.
Our website and its content are not deemed to be incorporated by reference into this Annual Report on Form 10-K for the year ended December 31, 2015 (“2015 Form 10-K Report” or “Report”) nor filed with the SEC.
Products and Services. We offer a wide variety of automotive financing products to and through automotive dealers throughout the world. The predominant share of our business consists of financing Ford and Lincoln vehicles and supporting the dealers of those brands. We earn our revenue primarily from:
• | Payments made under retail installment sale and lease contracts that we originate and purchase; |
• | Interest rate supplements and other support payments from Ford and affiliated companies; and |
• | Payments made under dealer financing programs. |
As a result of our financing activities, we have a large portfolio of finance receivables and operating leases which we classify into two segments: “consumer” and “non-consumer.”
Finance receivables and operating leases in the consumer segment include products offered to individuals and businesses that finance the acquisition of Ford and Lincoln vehicles from dealers for personal and commercial use. Retail financing includes retail installment sale contracts for new and used vehicles and direct financing leases for new vehicles to retail and commercial customers including leasing companies, government entities, daily rental companies, and fleet customers.
Finance receivables in the non-consumer segment include products offered to automotive dealers, and receivables purchased from Ford and its affiliates. We make wholesale loans to dealers to finance the purchase of vehicle inventory (floorplan financing), as well as loans to dealers to finance working capital and improvements to dealership facilities, finance the purchase of dealership real estate, and finance other dealer vehicle programs. We also purchase receivables from Ford and its affiliates, primarily related to the sale of parts and accessories to dealers, receivables from Ford-related loans, and certain used vehicles from daily rental fleet companies.
We also service the finance receivables and leases we originate and purchase, make loans to Ford affiliates, and provide insurance services related to our financing programs.
Geographic Scope of Operations and Segment Information. We conduct our financing operations directly and indirectly through our subsidiaries and affiliates. We offer substantially similar products and services throughout many different regions, subject to local legal restrictions and market conditions. We divide our business segments based on geographic regions: North America (“North America Segment”) and International (“International Segment”). The North America Segment includes our operations in the United States and Canada. The International Segment includes our operations in all other countries in which we do business directly and indirectly. For additional financial information regarding our operations by business segment and operations by geographic region, see Note 16 of our Notes to the Financial Statements.
1
Item 1. Business (Continued)
North America Segment
Our United States operations accounted for 73% and 71% of our total managed receivables at year-end 2015 and 2014, respectively and our Canadian operations accounted for 8% and 10% at year-end 2015 and 2014, respectively. Managed receivables equal net finance receivables and net investment in operating leases, excluding unearned interest supplements and residual support, allowance for credit losses, and other (primarily accumulated supplemental depreciation). For additional information on how we review our business performance, including on a managed basis, refer to the “Overview” section of Item 7 below. Managed receivables are discussed further in the “Financial Condition” section of Item 7 below.
In the United States and Canada, under the Ford Credit and Lincoln Automotive Financial Services brand names, we provide financing services to and through dealers of Ford and Lincoln vehicles.
International Segment
Our International Segment includes operations in three main regions: Europe, Asia Pacific, and Latin America. Our Europe region is our largest international operation, accounting for 15% of our total managed receivables at year-end 2015 and 2014. Within the International Segment our Europe region accounted for 79% and 78% of our managed receivables at year-end 2015 and 2014, respectively. Our European operations are managed through a United Kingdom-based subsidiary, FCE Bank plc (“FCE”), which operates in the United Kingdom and has branches in 10 other European countries. FCE also has operating subsidiaries in Switzerland, Poland, the Czech Republic, and Hungary that provide a variety of retail and dealer financing. The United Kingdom and Germany are our largest markets in Europe, representing 67% of FCE’s finance receivables and operating leases. Customers and dealers in Italy, France, and Spain are 19% of FCE’s finance receivables and operating leases. FCE, through its Worldwide Trade Financing (“WWTF”) division, provides financing to distributors and importers in about 70 countries where Ford has no national sales company presence. In the Asia Pacific region, we operate in China and India. In the Latin America region, we operate in Mexico, Brazil, and Argentina. Our operations include joint ventures with local financial institutions and other third parties in various locations around the world. In addition, other private label operations and alternative business arrangements exist in some markets.
Dependence on Ford
The predominant share of our business consists of financing Ford and Lincoln vehicles and supporting Ford and Lincoln dealers. Any extended reduction or suspension of Ford’s production or sale of vehicles due to a decline in consumer demand, work stoppage, governmental action, negative publicity or other event, or significant changes to marketing programs sponsored by Ford would have an adverse effect on our business. Additional information about Ford’s business, operations, production, sales, and risks can be found in Ford’s Annual Report on Form 10-K for the year ended December 31, 2015 (“Ford’s 2015 Form 10-K Report”), filed separately with the SEC and incorporated by reference as an exhibit to our 2015 Form 10-K Report (without financial statements and exhibits).
Ford has sponsored special financing programs available only through us. Under these programs, Ford makes interest supplements or other support payments to us. These programs increase our financing volume and share of financing sales of Ford and Lincoln vehicles. Similar programs may be offered in the future. For additional information regarding interest supplements and other support costs received from affiliated companies, see Notes 2 and 3 of our Notes to the Financial Statements.
Competition
The automotive financing business is highly competitive, due in part to web-based credit aggregation systems that permit dealers to send, through standardized systems, retail credit applications to multiple finance sources to evaluate financing options offered by these finance sources. Our principal competitors are:
• | Banks; |
• | Independent finance companies; |
• | Credit unions; |
• | Leasing companies; and |
• | Other automobile manufacturers’ affiliated finance companies. |
2
Item 1. Business (Continued)
We compete mainly on the basis of service and financing rate programs, including those sponsored by Ford. A key foundation of our service is providing broad and consistent purchasing policies for retail installment sale and lease contracts, and consistent support for dealer financing requirements across economic cycles. These policies have helped us build strong relationships with Ford’s dealer network that enhance our competitiveness. Our ability to provide competitive financing rates depends on effectively and efficiently originating, purchasing, and servicing our receivables, and efficiently accessing the capital markets. We routinely monitor the capital markets and develop funding plans to optimize our competitive position. Ford-sponsored special financing programs available only through us give us a competitive advantage in providing financing to Ford dealers and their customers.
Seasonal Variations
As a finance company, we own and manage a large portfolio of receivables that are generated throughout the year and are collected over a number of years, primarily in fixed monthly payments. As a result, our overall financing revenues do not exhibit seasonal variations.
Consumer Financing
Overview and Purchasing Process
We provide financing services to customers for personal and commercial use through automotive dealers that have established relationships with us. Our primary business consists of originating and purchasing retail installment sale and lease contracts for new and used vehicles from Ford and Lincoln dealers. We report in our financial statements the receivables from customers under installment sale contracts and certain leases with fleet customers as finance receivables. We report in our financial statements most of our retail leases as net investment in operating leases with the capitalized cost of the vehicles recorded as depreciable assets.
In general, we purchase from dealers retail installment sale contracts and lease contracts that meet our purchase standards. These contracts primarily relate to the purchase or lease of new vehicles, but some are for used vehicles. Dealers typically submit customer applications electronically. We automatically obtain information on the applicant including a credit bureau score, if available. We evaluate each credit application, the applicant, the terms of the proposed contract, credit bureau information, proprietary risk score, and other information and decide whether to purchase the contract. Purchase decisions are made within a framework of Ford Credit’s purchase quality guidelines and risk factor guidelines. Credit applications are typically evaluated by our electronic decisioning process, which may approve or reject applications.
Retail Financing
The amount we pay for a retail installment sale contract is based on a negotiated vehicle purchase price agreed to between the dealer and the retail customer, less vehicle trade-in allowance or down payment from the customer and special marketing cash payments offered by Ford Credit and Ford, plus any additional products, such as insurance and extended service plans, that are included in the contract. The net purchase price owed by the customer typically is paid over a specified number of months with interest at a fixed rate negotiated between the dealer and the retail customer. The dealer may retain a limited portion of the finance charge.
3
Item 1. Business (Continued)
We offer a variety of retail installment sale financing products. In the United States, retail installment sale contract terms for new vehicles range primarily from 24 to 75 months. The average original term of our retail installment sale contracts in the United States was 64 months and 62 months for contracts purchased in 2015 and 2014, respectively. A small portion of our retail installment sale contracts have non-uniform payment periods and payment amounts to accommodate special cash flow situations. We also offer a retail balloon product in Europe under which the retail customer may finance a vehicle with an installment sale contract with a series of monthly payments followed by paying the amount remaining in a single balloon payment. The customer can satisfy the balloon payment obligation by payment in full of the amount owed, by refinancing the amount owed, or by returning the vehicle to us and paying additional charges for excess mileage as well as excess wear and use, if any. Generally, we sell vehicles returned to us to Ford dealers and non-Ford dealers through auctions.
In most markets, we hold a security interest in the vehicles purchased through retail installment sale contracts. This security interest provides us certain rights and protections. As a result, if our collection efforts fail to bring a delinquent customer’s payments current, we generally can repossess the customer’s vehicle, after satisfying local legal requirements, and sell it at auction. The customer typically remains liable for any deficiency between net auction proceeds and the defaulted contract obligations, including any repossession-related expenses. We generally require retail customers to carry fire, theft, and collision insurance on financed vehicles.
Net Investment in Operating Leases
We offer leasing plans to retail customers through our dealers. Our highest volume retail-leasing plan is called Red Carpet Lease, which is offered in the United States and Canada through dealers of Ford and Lincoln brands. Under these plans, dealers originate the leases and offer them to us for purchase. Upon our purchase of a lease, we take ownership of the lease and title to the leased vehicle from the dealer. After we purchase a lease from a dealer, the dealer generally has no further obligation to us in connection with the lease. The customer is responsible for properly maintaining the vehicle and is obligated to pay for excess wear and use as well as excess mileage, if any. At the end of the lease, the customer has the option to purchase the vehicle for the price specified in the lease contract, or return the vehicle to the dealer. If the customer returns the vehicle to the dealer, the dealer may buy the vehicle from us or return it to us. We sell vehicles returned to us to Ford and non-Ford dealers through auctions.
The amount we pay to a dealer for a retail lease, also called the acquisition cost, is based on the negotiated vehicle price agreed to by the dealer and the retail customer, less any vehicle trade-in allowance or down payment from the customer and special marketing cash payments offered by Ford Credit and Ford, plus any additional products, such as insurance and extended service plans, that are included in the contract. The customer makes monthly lease payments based on the purchase price less the contractual residual value of the vehicle, plus lease charges. Some of our lease programs, such as our Red Carpet Lease Advance Payment Plan, provide certain pricing advantages to customers who make all or some monthly payments at lease inception or purchase refundable higher mileage allowances. We require lease customers to carry fire, theft, liability, and collision insurance on leased vehicles. In the case of a contract default and repossession, the customer typically remains liable for any deficiency between net auction proceeds and the defaulted contract obligations, including any repossession-related expenses.
In the United States, operating lease terms for new vehicles range primarily from 24 to 39 months. In 2015 and 2014, the average original lease term for contracts purchased was 34 months and 33 months, respectively.
Direct Financing Leases and Other Operating Lease Vehicle Financing
We offer vehicle-financing programs to retail and commercial customers including leasing companies, government entities, daily rental companies, and fleet customers. These financings include primarily lease plans for terms of 24 to 60 months. We hold a security interest in financed vehicles in almost all instances and, where appropriate, an assignment of rentals under any related leases. At the end of the finance term, a lease customer may be required to pay any shortfall between the fair market value and the specified end of term value of the vehicle. If the fair market value of the vehicle at the end of the finance term exceeds the specified end of term value, the lease customer may be paid the excess amount. These financings are included in our consumer segment and reported as retail financing or net investment in operating leases in our financial statements.
4
Item 1. Business (Continued)
Non-Consumer Financing
Overview
We extend credit to franchised dealers selling Ford and Lincoln vehicles primarily in the form of approved lines of credit to purchase new and used vehicles. Each lending request is evaluated, taking into consideration the borrower’s financial condition, supporting security, and numerous other financial and qualitative factors. Generally, receivables are secured by the related vehicle or the related property and may also be secured by other dealer assets. Asset verification processes are in place and include physical audits of vehicle inventories with increased audit frequency for higher-risk dealers.
Dealer Financing
Wholesale Financing. We offer a wholesale financing program for qualifying dealers to finance new and used vehicles held in inventory (also known as floorplan financing). We generally finance the vehicle’s wholesale invoice price for new vehicles and up to 100% of the dealer’s purchase price for used vehicles. Dealers generally pay a floating interest rate on wholesale loans. In the United States, the average new wholesale receivable, excluding the time the vehicle was in transit from the assembly plant to the dealership, was outstanding for 60 days in 2015 compared with 67 days in 2014. Our wholesale financing program includes financing of large multi-brand dealer groups.
When a dealer uses our wholesale financing program to purchase vehicles, we obtain a security interest in the vehicles and, in many instances, other assets of the dealer. In the United States and Canada, our wholly owned subsidiary, The American Road Insurance Company (“TARIC”), generally provides insurance for vehicle damage and theft of vehicles held in dealer inventory that are financed by us.
Dealer Loans. We make loans to dealers to finance the purchase of dealership real estate, to make improvements to dealership facilities, and to provide working capital. These loans are typically secured by mortgages on dealership real estate and/or by security interests in other dealership assets. In addition, these loans are generally supported by personal guarantees from the individual owners of the dealership.
Other Dealer Financing. We also provide financing to qualified dealers for vehicles to be utilized for service replacement and retail rental use. In addition, we provide financing to qualified daily rental companies for new and used vehicles used in their operations.
Other Financing
We also purchase receivables from Ford and its affiliates, primarily related to the sale of parts and accessories to dealers, receivables from Ford related loans, and certain used vehicles from daily rental fleet companies. These receivables are excluded from our credit quality reporting since the performance of this group of receivables is generally guaranteed by Ford.
Marketing and Special Programs
We actively market our financing products and services to automotive dealers and customers. We demonstrate to dealers the value of a business relationship with us through personal sales contacts, targeted advertisements in trade publications, and participation in dealer-focused conventions and organizations. Our marketing strategy is based on our belief that we can better assist dealers in achieving their sales, financial, and customer satisfaction goals by being a reliable finance source with knowledgeable automotive and financial professionals offering personal attention and interaction. We demonstrate our commitment to dealer relationships with a variety of materials, measurements, and analyses showing the advantages of a full range of automotive financing products that allows consistent and predictable single source financing. We promote increased dealer transactions through incentives, bonuses, contests, and selected program and rate adjustments.
5
Item 1. Business (Continued)
We promote our retail financing products primarily through pre-approved credit offers to prospective customers, point-of-sale information, and ongoing communications with existing customers. Our communications to these customers promote the advantages of our financing products, the availability of special plans and programs, and the benefits of affiliated products, such as extended warranties, service plans, insurance coverage, gap protection, and excess wear and use waivers. We also emphasize the quality of our customer service and the ease of making payments and transacting business with us. For example, through our web site located at www.fordcredit.com or via our mobile application a customer can make inquiries, review an account balance, examine current incentives, schedule an electronic payment, or qualify for a pre-approved credit offer.
We also market our non-consumer financing services with a specialized group of employees who make direct sales calls on dealers and, often at the request of such dealers, on potential high-volume commercial customers. This group also uses various materials to explain our flexible programs and services specifically directed at the needs of commercial and fleet vehicle customers.
Servicing
Consumer Financing
After we purchase retail installment sale contracts and leases from dealers and other customers, we manage the contracts during their contract terms. This management process is called servicing. We service the finance receivables and leases we originate and purchase. Our servicing duties include the following:
• | Applying monthly payments from customers; |
• | Maintaining a security interest in the financed vehicle; |
• | Providing billing statements to customers; |
• | Responding to customer inquiries; |
• | Releasing our security interest on paid-off finance contracts; |
• | Contacting delinquent customers for payment; |
• | Arranging for the repossession of vehicles; and |
• | Selling repossessed and returned vehicles. |
Customer Payment Operations. Customers may make payments by mailing checks to a bank for deposit in a lockbox account, through electronic payment services, a direct debit program, or a telephonic payment system.
Collections. We design our collection strategies and procedures to keep accounts current and to collect on delinquent accounts. We employ a combination of proprietary and non-proprietary tools to assess the probability and severity of default for all of our finance receivables and leases and implement our collection efforts based on our determination of the credit risk associated with each customer. As each customer develops a payment history, we use an internally developed behavioral scoring model to assist in determining the best collection strategies. Based on data from this scoring model, contracts are categorized by collection risk. Our centralized collection operations are supported by auto-dialing technology and proprietary collection and workflow operating systems. Through our auto-dialer program and our monitoring and call log systems, we target our efforts on contacting customers about missed payments and developing satisfactory solutions to bring accounts current.
Supplier Operations. We engage vendors to perform some of our servicing processes. These processes include depositing monthly payments from customers, monitoring the perfection of security interests in financed vehicles, imaging of contracts and electronic data file maintenance, generating retail and lease billing statements, providing telephonic payment systems for retail customers, handling of some inbound and outbound collections calls, and recovering deficiencies for selected accounts.
Payment Extensions. In our regular course of business we may offer payment extensions to customers. Each month 1% to 2% of our U.S. retail contracts outstanding are granted payment extensions. A payment extension allows the customer to extend the term of the contract, usually by paying a fee that is calculated in a manner specified by law. Before agreeing to a payment extension, the service representative reviews the customer’s payment history and current financial situation and assesses the customer’s desire and capacity to make future payments. The service representative decides whether the proposed payment extension complies with our policies and guidelines. Payment extensions are reviewed regularly by Ford Credit’s servicing managers.
6
Item 1. Business (Continued)
Repossessions and Off-lease Vehicles. We view repossession of a financed or leased vehicle as a final step that we undertake only after all other collection efforts have failed. Our North America systems also employ a web-based network of outside contractors who support the repossession process. In all of our markets we sell repossessed vehicles and apply the proceeds to the amount owed on the customer’s account. We continue to attempt collection of any deficient amounts until the account is paid in full, we obtain mutually satisfactory payment arrangements with the debtor, or we determine that the account is uncollectible.
We manage the sale of repossessed vehicles and returned leased vehicles. Repossessed vehicles are reported in other assets on our balance sheet at values that approximate expected net auction proceeds. We inspect and recondition the vehicle to maximize the net auction value of the vehicle. Typically, repossessed vehicles are sold at open auctions. Returned leased vehicles are predominantly sold through an on-line auction, closed auctions in which only Ford and Lincoln dealers may participate, or at open auctions, in which any licensed dealer can participate.
Non-Consumer Financing
In the United States and Canada, we require dealers to submit monthly financial statements that we monitor for potential credit deterioration. We assign an evaluation rating to each dealer, which among other things determines the frequency of physical audits of vehicle inventory. We electronically audit vehicle inventory utilizing integrated systems allowing us to access information from Ford reported sales. We monitor dealer inventory financing payoffs daily to detect deviations from typical repayment patterns and take appropriate actions. If a dealer fails to make principal or interest payments when due, we may take one or more of the following actions: demand payment of all or a portion of the related receivables; suspend the dealer’s credit lines; secure the dealer’s inventory; require certified funds for all vehicles sold by the dealer; or initiate legal actions to exercise rights under the floorplan financing agreement. If a loss appears imminent, we will attempt to redistribute new vehicle inventory, liquidate all remaining collateral, enforce any third-party guarantees, and charge off any remaining amounts as uncollectible.
We also provide financing to fleet purchasers, leasing companies, daily rental companies, and other commercial customers. We generally review our exposure under these credit arrangements at least annually.
In our international markets, non-consumer financing is governed by the respective regional offices, executed within the local markets, and similar risk management principles are applied.
Insurance
We conduct insurance underwriting operations primarily through TARIC in the United States and Canada and through various other insurance subsidiaries outside the United States and Canada. TARIC offers a variety of products and services, including:
• | Physical damage insurance coverage for Ford Credit financed vehicles at dealer locations; |
• | Physical damage insurance coverage for Ford and Lincoln vehicles in transit between final assembly plants and dealer locations; |
• | Contractual liability insurance on extended service contracts for Ford and its affiliates; and |
• | Commercial automobile and general liability insurance and surety bonds for Ford in the United States. |
TARIC invests premiums and other revenue to fund future claims, and has established investment guidelines and strategies to reflect its risk tolerance, regulatory requirements, and rating agency considerations, among other factors. TARIC is rated by A.M. Best Company on its financial strength and issuer credit rating. Since 2012, TARIC’s rating has been A (Excellent) for its financial strength and “a” on its issuer credit rating.
We also offer various Ford-branded insurance products throughout the world underwritten by non-affiliated insurance companies from which we receive fee income but the underwriting risk remains with the non-affiliated insurance companies. Premiums from our insurance business generated 1% of our total revenues in 2015 and 2014.
7
Item 1. Business (Continued)
Employee Relations
We employed approximately 6,800 and 6,500 full-time employees worldwide at year-end 2015 and 2014, respectively. Most employees are salaried and are not represented by a union. We consider employee relations to be satisfactory.
Governmental Regulations
As a finance company, we are highly regulated by the governmental authorities in the locations where we operate.
United States
Within the United States, our operations are subject to regulation, supervision, and licensing under various federal, state, and local laws and regulations.
Federal Regulation. We are subject to federal regulation, including the Truth-in-Lending Act, the Consumer Leasing Act, the Equal Credit Opportunity Act, and the Fair Credit Reporting Act. These laws require us to provide certain disclosures to prospective purchasers and lessees in consumer retail and lease financing transactions and prohibit discriminatory credit practices. The principal disclosures required under the Truth-in-Lending Act for retail financing transactions include the terms of repayment, the amount financed, the total finance charge, and the annual percentage rate. For retail lease transactions, under the Consumer Leasing Act, we are required to disclose the amount due at lease inception, the terms for payment, and information about lease charges, insurance, excess mileage, wear and use charges, and liability on early termination. The Equal Credit Opportunity Act prohibits creditors from discriminating against credit applicants and customers on a variety of factors, including race, color, sex, age, or marital status. Pursuant to the Equal Credit Opportunity Act, creditors are required to make certain disclosures regarding consumer rights and advise consumers whose credit applications are not approved of the reasons for being denied. In addition, any of the credit scoring systems we use during the application process or other processes must comply with the requirements for such systems under the Equal Credit Opportunity Act. The Fair Credit Reporting Act requires us to provide certain information to consumers whose credit applications are not approved on the basis of a consumer credit report obtained from a national credit bureau and sets forth requirements related to identity theft, privacy, and enhanced accuracy in credit reporting content. In addition, under the Dodd-Frank Wall Street Reform and Consumer Protection Act (“Dodd-Frank Act”), it is unlawful for us to engage in any unfair, deceptive or abusive act or practice. We are also subject to the Servicemembers Civil Relief Act that prohibits us from charging interest in excess of 6% on transactions with customers who subsequently enter into full-time service with the military and request such interest rate modification, and limits our ability to collect future payments from such lease customers who terminate their lease early. We are subject to other federal regulation, including the Gramm-Leach-Bliley Act, that requires us to maintain confidentiality and safeguard certain consumer data in our possession and to communicate periodically with consumers on privacy matters. In addition, the Consumer Financial Protection Bureau (“CFPB”) has broad rule-making and enforcement authority for a wide range of consumer financial protection laws that regulate consumer finance businesses, such as Ford Credit’s retail automotive financing business. For additional discussion of the CFPB, see “Item 1A. Risk Factors” below.
We are also subject to regulation in our funding and securitization activities, including requirements under federal securities laws and specific rules and requirements for asset-backed securities. Derivatives activities are regulated under the Commodities Exchange Act and Dodd-Frank Act. These regulations also impose operational and reporting requirements for these funding transactions.
State Regulation - Licensing. In most states, a consumer credit regulatory agency regulates and enforces laws relating to finance companies. Rules and regulations generally provide for licensing of finance companies, limitations on the amount, duration, and charges, including interest rates, that can be included in finance contracts, requirements as to the form and content of finance contracts and other documentation, and restrictions on collection practices and creditors’ rights. We must renew these licenses periodically. Moreover, several states have laws that limit interest rates on consumer financing. In periods of high interest rates, these rate limitations could have an adverse effect on our operations if we were unable to purchase retail installment sale contracts with finance charges that reflect our increased costs. In certain states, we are subject to periodic examination by state regulatory authorities.
8
Item 1. Business (Continued)
State Regulation - Repossessions. To mitigate our credit losses, sometimes we repossess a financed or leased vehicle. Repossessions are subject to prescribed legal procedures, including peaceful repossession, one or more customer notifications, a prescribed waiting period prior to disposition of the repossessed vehicle, and return of personal items to the customer. Some states provide the customer with reinstatement rights that require us to return a repossessed vehicle to the customer in certain circumstances. Our ability to repossess and sell a repossessed vehicle is restricted if a customer declares bankruptcy.
International
In some countries outside the United States, some of our subsidiaries, including FCE, are regulated and/or licensed banking institutions and are required, among other things, to maintain minimum capital and liquidity. FCE is authorized by the U.K. Prudential Regulation Authority (“PRA”) and regulated by the U.K. Financial Conduct Authority (“FCA”) and the PRA to carry on a range of regulated activities within the U.K. Pursuant to the Capital Requirements Regulation and Directive, CRD IV, FCE operates through a branch and subsidiary network in 14 other European countries. Under FCE’s banking license, consumer credit and leasing activities are also passported to the European branches. In many other locations where we operate, governmental authorities require us to obtain equivalent banking licenses to conduct our business.
Regulatory Compliance Status
Based on our compliance management processes and procedures, we believe that we maintain all material licenses and permits required for our current operations and are in material compliance with all laws and regulations applicable to us and our operations. Failure to satisfy those legal and regulatory requirements could have a material adverse effect on our operations, financial condition, reputation, and/or liquidity. Further, the adoption of new laws or regulations, or the revision of existing laws and regulations, could have a material adverse effect on our operations, financial condition, and/or liquidity.
We actively monitor proposed changes to relevant legal and regulatory requirements in order to maintain our compliance. Through our governmental relations efforts, we also attempt to participate in the legislative and administrative rule-making process on regulatory initiatives that impact finance companies. The cost of our ongoing compliance efforts has not had a material adverse effect on our operations, financial condition, or liquidity.
For additional information on new or increased credit regulations, consumer or data protection regulations, or other regulations, refer to “Item 1A. Risk Factors.”
9
Item 1. Business (Continued)
Certain Agreements with Ford and Affiliates
On April 30, 2015, we and Ford entered into an Amended and Restated Relationship Agreement (the “Relationship Agreement”) relating to our long-standing business practices with Ford. A copy of the Relationship Agreement was filed as an exhibit to our Current Report on Form 8-K dated April 30, 2015, and is incorporated by reference herein as an exhibit. Pursuant to the Relationship Agreement, if our managed leverage for a calendar quarter were to be higher than 11.5 to 1 (as reported in our most recent Form 10-Q Report or Form 10-K Report), we can require Ford to make or cause to be made a capital contribution to us in an amount sufficient to have caused such managed leverage to have been 11.5 to 1. No capital contributions have been made to us pursuant to the Relationship Agreement.
In addition to the foregoing, the other principal terms of the Relationship Agreement include the following:
• | Any extension of credit from us to Ford or any of Ford’s automotive affiliates will be on arm’s length terms and will be enforced by us in a commercially reasonable manner; |
• | We will not guarantee more than $500 million of the indebtedness of, make any investments in, or purchase any real property or manufacturing equipment classified as an automotive asset from Ford or any of Ford’s automotive affiliates; |
• | We will not be required by Ford or any of Ford’s automotive affiliates to accept credit or residual risk beyond what we would be willing to accept acting in a prudent and commercially reasonable manner (taking into consideration any interest rate supplements or residual value support payments, guarantees, or other subsidies that are provided to us by Ford or any of Ford’s automotive affiliates); |
• | We and Ford are separate, legally distinct companies, and we will continue to maintain separate books and accounts. We will prevent our assets from being commingled with Ford’s assets, and hold ourselves out as a separate and distinct company from Ford and Ford’s automotive affiliates; |
• | Allocates to us $2 billion plus any commitments under the Chinese renminbi sub-facility as the amount we may borrow as a Subsidiary Borrower under Ford’s Third Amended and Restated Credit Agreement dated as of April 30, 2015 and as further amended (“Ford’s revolving credit facility”) and requires us to reimburse Ford for a proportionate amount of Ford’s costs under that credit facility; and |
• | Prohibits Ford from terminating Ford’s revolving credit facility prior to its maturity, or taking any other action that would impair our ability to borrow under that credit facility, without our prior written consent. |
We also have an agreement to maintain FCE’s net worth in excess of $500 million. No payments have been made to FCE pursuant to the agreement during the 2001 through 2015 periods.
More information about agreements between us and Ford and other affiliates is contained in our Notes to the Financial Statements, “Business - Overview,” “Business - Consumer Financing - Retail Financing,” “Business - Non-Consumer Financing - Other Financing,” and the description of Ford’s business in Exhibit 99.
10
ITEM 1A. Risk Factors.
We have listed below (not necessarily in order of importance or probability of occurrence) the most significant risk factors applicable to Ford or Ford Credit:
Decline in industry sales volume, particularly in the United States, Europe, or China, due to financial crisis, recession, geopolitical events, or other factors. Because Ford, like other manufacturers, has a high proportion of relatively fixed structural costs, relatively small changes in industry sales volume can have a substantial effect on its cash flow and profitability. If industry vehicle sales were to decline to levels significantly below Ford’s planning assumption, particularly in the United States, Europe, or China, due to financial crisis, recession, geopolitical events, or other factors, such as occurred during 2008 and 2009, Ford’s financial condition and results of operations would be substantially adversely affected.
Decline in Ford’s market share or failure to achieve growth. To maintain competitive economies of scale and grow our global market share, Ford must grow its market share in fast-growing newly developed and emerging markets, particularly in its Asia Pacific region and its Middle East & Africa region, as well as maintain or grow market share in mature markets. Ford’s market share in certain growing markets, such as China, is lower than it is in mature markets. A significant decline in Ford’s market share in mature markets or failure to achieve growth in newly developing or emerging markets, whether due to capacity constraints, competitive pressures, protectionist trade policies, or other factors, could have a substantial adverse effect on Ford’s financial condition and results of operations.
Lower-than-anticipated market acceptance of Ford’s new or existing products or services. Although Ford conducts extensive market research before launching new or refreshed vehicles and introducing new services, many factors both within and outside Ford’s control affect the success of new or existing products and services in the marketplace. Offering vehicles and services that customers want and value can mitigate the risks of increasing price competition and declining demand, but products and services that are perceived to be less desirable (whether in terms of price, quality, styling, safety, overall value, fuel efficiency, or other attributes) can exacerbate these risks. The success of Ford Smart Mobility, Ford’s plan for connectivity, mobility, autonomous vehicles, the customer experience, and data and analytics, likewise depends on many factors, including the amount of capital Ford invests, advancements in technology, regulatory changes, and other factors that are difficult to predict that may significantly affect the future of mobility. With increased consumer interconnectedness through the internet, social media, and other media, mere allegations relating to quality, safety, fuel efficiency, corporate social responsibility, or other key attributes can negatively impact Ford’s reputation or market acceptance of its products or services, even where such allegations prove to be inaccurate or unfounded.
Market shift away from sales of larger, more profitable vehicles beyond Ford’s current planning assumption, particularly in the United States. A shift in consumer preferences away from larger, more profitable vehicles at levels beyond Ford’s current planning assumption could result in an immediate and substantial adverse impact on Ford’s financial condition and results of operations. Although Ford has a balanced portfolio of small, medium, and large cars, utilities, and trucks with competitive fuel efficiency, a shift in consumer preferences away from sales of larger, more profitable vehicles at levels greater than Ford’s current planning assumption—whether because of spiking fuel prices, a decline in the construction industry, government actions or incentives, or other reasons—still could have a substantial adverse effect on Ford’s financial condition and results of operations.
An increase in or continued volatility of fuel prices, or reduced availability of fuel. An increase in fuel prices, continued price volatility, or reduced availability of fuel, particularly in the United States, could result in weakening of demand for relatively more-profitable large cars, utilities, and trucks, while increasing demand for relatively less-profitable small vehicles. Continuation or acceleration of such a trend beyond Ford’s current planning assumption, or volatility in demand across segments, could have a substantial adverse effect on Ford’s financial condition and results of operations.
Continued or increased price competition resulting from industry excess capacity, currency fluctuations, or other factors. The global automotive industry is intensely competitive, with manufacturing capacity far exceeding current demand. According to the December 2015 report issued by IHS Automotive, the global automotive industry is estimated to have had excess capacity of about 31 million units in 2015. Industry overcapacity has resulted in many manufacturers offering marketing incentives on vehicles in an attempt to maintain and grow market share; these incentives historically have included a combination of subsidized financing or leasing programs, price rebates, and other incentives. As a result, Ford is not necessarily able to set its prices to offset higher costs of marketing incentives, commodity or other cost increases, or the impact of adverse currency fluctuations, including pricing advantages foreign competitors may have because of their weaker home market currencies. Continuation of or increased excess capacity could have a substantial adverse effect on Ford’s financial condition and results of operations.
11
Item 1A. Risk Factors (Continued)
Fluctuations in foreign currency exchange rates, commodity prices, and interest rates. As a resource-intensive manufacturing operation, Ford and Ford Credit are exposed to a variety of market and asset risks, including the effects of changes in foreign currency exchange rates, commodity prices, and interest rates. Ford and Ford Credit monitor and manage these exposures as an integral part of their overall risk management program, which recognizes the unpredictability of markets and seeks to reduce potentially adverse effects on our business. Nevertheless, changes in currency exchange rates, commodity prices, and interest rates cannot always be predicted or hedged. In addition, because of intense price competition and Ford’s high level of fixed costs, Ford may not be able to address such changes even if foreseeable. As a result, substantial unfavorable changes in foreign currency exchange rates, commodity prices, or interest rates could have a substantial adverse effect on Ford’s and/or Ford Credit’s financial condition and results of operations.
Adverse effects resulting from economic, geopolitical, or other events. With the increasing interconnectedness of global economic and financial systems, a financial crisis, natural disaster, geopolitical crisis, or other significant event in one area of the world can have an immediate and devastating impact on markets around the world. For example, the financial crisis that began in the United States in 2008 quickly spread to other markets; natural disasters in Japan and Thailand during 2011 caused production interruptions and delays not just in Asia Pacific but other regions around the world; and episodes of increased geopolitical tensions or acts of terrorism have at times caused adverse reactions that may spread to economies around the globe.
Concerns persist regarding the sustainability of the European currency area (“euro area”) and of the larger European Union, which includes the United Kingdom. The pending decision by the U.K. electorate on whether to remain in the European Union has exacerbated concerns regarding the overall stability of the European Union, given the diverse economic and political circumstances of individual euro area countries. If a country within the euro area were to default on its debt or withdraw from the euro currency, or—in a more extreme circumstance—the euro currency were to be dissolved entirely, the impact on markets around the world, and on Ford’s global business, could be immediate and significant. The exit of the United Kingdom from the European Union would have less extreme but still significant implications. Such scenarios—or the perception that such developments are imminent—could adversely affect the value of our euro- and pound-denominated assets and obligations. In addition, such developments could cause financial and capital markets within and outside Europe to constrict, thereby negatively impacting our ability to finance our business, and also could cause a substantial dip in consumer confidence and spending that could negatively impact sales of vehicles. Any one of these impacts could have a substantial adverse effect on Ford’s and/or Ford Credit’s financial condition and results of operations.
In addition, Ford has operations in various markets with volatile economic or political environments and is pursuing growth opportunities in a number of newly developed and emerging markets. These investments may expose Ford to heightened risks of economic, geopolitical, or other events, including governmental takeover (i.e., nationalization) of Ford’s manufacturing facilities or intellectual property, restrictive exchange or import controls, disruption of operations as a result of systemic political or economic instability, outbreak of war or expansion of hostilities, and acts of terrorism, each of which could have a substantial adverse effect on Ford’s financial condition and results of operations. Further, the U.S. government, other governments, and international organizations could impose additional sanctions that could restrict Ford and Ford Credit from doing business directly or indirectly in or with certain countries or parties, which could include affiliates.
Economic distress of suppliers that may require Ford to provide substantial financial support or take other measures to ensure supplies of components or materials and could increase costs, affect liquidity, or cause production constraints or disruptions. The automotive industry supply base experienced increased economic distress due to the sudden and substantial drop in industry sales volumes beginning in 2008. Dramatically lower industry sales volume made existing debt obligations and fixed cost levels difficult for many suppliers to manage, increasing pressure on the supply base. As a result, suppliers not only were less willing to reduce prices, but some requested direct or indirect price increases as well as new and shorter payment terms. At times, Ford has had to provide financial assistance to key suppliers to ensure an uninterrupted supply of materials and components. In addition, suppliers may continue to exit certain lines of business or close facilities due to economic concerns, management turnover, or other reasons. In such cases, Ford generally experiences additional costs associated with transitioning to new suppliers. Each of these factors could have a substantial adverse effect on Ford’s financial condition and results of operations.
12
Item 1A. Risk Factors (Continued)
Work stoppages at Ford or supplier facilities or other limitations on production (whether as a result of labor disputes, natural or man-made disasters, tight credit markets or other financial distress, production constraints or difficulties, or other factors). A work stoppage or other limitation on production could occur at Ford or supplier facilities for any number of reasons, including as a result of disputes under existing collective bargaining agreements with labor unions or in connection with negotiation of new collective bargaining agreements, or as a result of supplier financial distress or other production constraints or difficulties, or for other reasons. Recent examples of situations that have affected industry production to varying degrees include: supplier financial distress due to reduced production volumes during the economic downturn in 2008-2009; capacity constraints as suppliers that restructured or downsized during the downturn work to satisfy growing industry volumes; short-term constraints on production as consumer preferences shift more fluidly across vehicle segments and features; and the impact on certain suppliers of natural disasters during 2011. As indicated, a work stoppage or other limitations on production at Ford or supplier facilities for any reason (including but not limited to labor disputes, natural or man-made disasters, tight credit markets or other financial distress, or production constraints or difficulties) could have a substantial adverse effect on Ford’s financial condition and results of operations.
Single-source supply of components or materials. Many components used in Ford’s vehicles are available only from a single supplier and cannot be re-sourced quickly or inexpensively to another supplier (due to long lead times, new contractual commitments that may be required by another supplier before ramping up to provide the components or materials, etc.). In addition to the general risks described above regarding interruption of supplies, which are exacerbated in the case of single-source suppliers, the exclusive supplier of a key component potentially could exert significant bargaining power over price, quality, warranty claims, or other terms relating to a component.
Labor or other constraints on Ford’s ability to maintain competitive cost structure. Substantially all of the hourly employees in Ford’s Automotive operations in the United States and Canada are represented by unions and covered by collective bargaining agreements. Ford negotiated a four-year agreement with the UAW in 2015 and will negotiate a new agreement with Unifor (formerly the Canadian Auto Workers Union) in 2016. Although Ford has negotiated transformational agreements in recent years, these agreements provide guaranteed wage and benefit levels throughout the contract term and some degree of income security, subject to certain conditions. As a practical matter, these agreements may restrict Ford’s ability to close plants and divest businesses. A substantial number of Ford’s employees in other regions are represented by unions or government councils, and legislation or custom promoting retention of manufacturing or other employment in the state, country, or region may constrain as a practical matter Ford’s ability to sell or close manufacturing or other facilities.
Substantial pension and postretirement health care and life insurance liabilities impairing liquidity or financial condition. Ford has defined benefit retirement plans in the United States that cover many of its hourly and salaried employees. Ford also provides pension benefits to non-U.S. employees and retirees, primarily in Europe. In addition, Ford and certain of its subsidiaries sponsor plans to provide other postretirement benefits (“OPEB”) for retired employees (primarily health care and life insurance benefits). These benefit plans impose significant liabilities on Ford that are not fully funded and will require additional cash contributions, which could impair Ford’s liquidity.
Ford’s qualified U.S. defined benefit pension plans are subject to Title IV of the Employee Retirement Income Security Act of 1974 (“ERISA”). Under Title IV of ERISA, the Pension Benefit Guaranty Corporation (“PBGC”) has the authority under certain circumstances or upon the occurrence of certain events to terminate a qualified underfunded pension plan. One such circumstance is the occurrence of an event that unreasonably increases the risk of unreasonably large losses to the PBGC. Although Ford believes it is unlikely that the PBGC would terminate any of its plans, in the event that Ford’s qualified U.S. pension plans were terminated at a time when the liabilities of the plans exceeded the assets of the plans, Ford would incur a liability to the PBGC that could be equal to the entire amount of the underfunding.
Ford Credit is jointly and severally liable to the PBGC for certain Ford IRS-qualified U.S. defined benefit pension plan liabilities and to any trustee appointed if one or more of these pension plans were to be terminated by the PBGC in a distress termination. Ford Credit is liable to pay any plan deficiencies and could have a lien placed on its assets by the PBGC to collateralize this liability. Ford Credit’s financial condition and ability to repay unsecured debt could be materially adversely affected if Ford Credit were required to pay some or all of these obligations.
If Ford’s cash flows and capital resources were insufficient to fund Ford’s pension or OPEB obligations, Ford could be forced to reduce or delay investments and capital expenditures, suspend dividend payments, seek additional capital, or restructure or refinance its indebtedness.
13
Item 1A. Risk Factors (Continued)
Worse-than-assumed economic and demographic experience for postretirement benefit plans (e.g., discount rates or investment returns). The measurement of Ford’s obligations, costs, and liabilities associated with benefits pursuant to its postretirement benefit plans requires that Ford estimate the present value of projected future payments to all participants. Ford uses many assumptions in calculating these estimates, including assumptions related to discount rates, investment returns on designated plan assets, and demographic experience (e.g., mortality and retirement rates). To the extent actual results are less favorable than Ford’s assumptions, there could be a substantial adverse impact on Ford’s financial condition and results of operations.
Restriction on use of tax attributes from tax law “ownership change.” Section 382 of the U.S. Internal Revenue Code restricts the ability of a corporation that undergoes an ownership change to use its tax attributes, including net operating losses and tax credits (“Tax Attributes”). At December 31, 2015, Ford had Tax Attributes that would offset more than $15 billion of taxable income. For these purposes, an ownership change occurs if 5 percent shareholders of an issuer’s outstanding common stock, collectively, increase their ownership percentage by more than 50 percentage points over a rolling three-year period. In 2015, Ford renewed for an additional three-year period its tax benefit preservation plan (the “Plan”) to reduce the risk of an ownership change under Section 382. Under the Plan, shares held by any person who acquires, without the approval of Ford’s Board of Directors, beneficial ownership of 4.99% or more of Ford’s outstanding Common Stock could be subject to significant dilution. The renewal is subject to shareholder approval at Ford’s annual meeting in May 2016.
The discovery of defects in vehicles resulting in delays in new model launches, recall campaigns, or increased warranty costs. Meeting or exceeding many government-mandated safety standards is costly and often technologically challenging, especially where standards may be in tension with the need to reduce vehicle weight in order to meet government-mandated emissions and fuel-economy standards. Government safety standards also require manufacturers to remedy defects related to vehicle safety through safety recall campaigns, and a manufacturer is obligated to recall vehicles if it determines that the vehicles do not comply with a safety standard. In addition, the introduction of new and innovative features and technology to Ford’s vehicles could increase the risk of defects or customer dissatisfaction. In 2014 and 2015, there was an unprecedented increase in the number of vehicles involved in safety recalls by manufacturers in the United States. The increase reflects the National Highway Traffic Safety Administration’s (“NHTSA”) continued expansion of its definition of safety defects under the Safety Act. In addition, NHTSA’s enforcement strategy shifted to a significant increase in civil penalties levied and the use of consent orders requiring direct oversight by NHTSA of certain manufacturers’ safety processes, a trend that could continue. Should Ford or government safety regulators determine that a safety or other defect or a noncompliance exists with respect to certain of Ford’s vehicles prior to the start of production, the launch of such vehicle could be delayed until such defect is remedied. The costs associated with any protracted delay in new model launches necessary to remedy such defects, or the cost of recall campaigns or warranty costs to remedy such defects in vehicles that have been sold, could be substantial. These recall and warranty costs could be exacerbated to the extent they relate to global platforms. Furthermore, launch delays or recall actions also could adversely affect Ford’s reputation or market acceptance of its products as discussed above under “Lower-than-anticipated market acceptance of Ford’s new or existing products or services.”
Increased safety, emissions, fuel economy, or other regulations resulting in higher costs, cash expenditures, and/or sales restrictions. The worldwide automotive industry is governed by a substantial amount of government regulation, which often differs by state, region, and country. Government regulation has arisen, and proposals for additional regulation are advanced, primarily out of concern for the environment (including concerns about the possibility of global climate change and its impact), vehicle safety, and energy independence. For example, as discussed under “Item 1. Business - Governmental Standards” in Ford’s 2015 Form 10-K Report, in the United States the CAFE standards for light duty vehicles are 35.5 mpg by the 2016 model year, 45 mpg by the 2021 model year, and 54.5 mpg by the 2025 model year; EPA’s parallel CO2 emission regulations impose similar standards. California’s ZEV rules also mandate steep increases in the sale of electric vehicles and other advanced technology vehicles beginning in the 2018 model year. In addition, many governments regulate local product content and/or impose import requirements as a means of creating jobs, protecting domestic producers, and influencing the balance of payments.
14
Item 1A. Risk Factors (Continued)
In recent years, Ford has made significant changes to its product cycle plan to improve the overall fuel economy of vehicles Ford produces, thereby reducing their GHG emissions. There are limits on Ford’s ability to achieve fuel economy improvements over a given time frame, however, primarily relating to the cost and effectiveness of available technologies, consumer acceptance of new technologies and changes in vehicle mix, willingness of consumers to absorb the additional costs of new technologies, the appropriateness (or lack thereof) of certain technologies for use in particular vehicles, the widespread availability (or lack thereof) of supporting infrastructure for new technologies, and the human, engineering, and financial resources necessary to deploy new technologies across a wide range of products and powertrains in a short time. The current fuel economy, CO2, and ZEV standards will be difficult to meet if fuel prices remain relatively low and market conditions do not drive consumers to purchase electric vehicles and other highly fuel-efficient vehicles in large numbers.
The U.S. government has initiated an enforcement action against a major competitor of Ford in connection with its alleged use of “defeat devices” in hundreds of thousands of light duty diesel vehicles. The emergence of this issue has led to increased scrutiny of automaker emission testing by regulators around the world. This may lead to new regulations, more stringent enforcement programs, requests for field actions, and/or delays in regulatory approvals. The cost to comply with existing government regulations is substantial and additional regulations or changes in consumer preferences that affect vehicle mix could have a substantial adverse impact on Ford’s financial condition and results of operations. In addition, a number of governments, as well as non-governmental organizations, publicly assess vehicles to their own protocols. The protocols could change aggressively, and any negative perception regarding the performance of Ford’s vehicles subjected to such tests could reduce future sales.
Unusual or significant litigation, governmental investigations, or adverse publicity arising out of alleged defects in products, perceived environmental impacts, or otherwise. Ford spends substantial resources ensuring that it complies with governmental safety regulations, mobile and stationary source emissions regulations, and other standards. Compliance with governmental standards, however, does not necessarily prevent individual or class actions, which can entail significant cost and risk. In certain circumstances, courts may permit tort claims even where Ford’s vehicles comply with federal and/or other applicable law. Furthermore, simply responding to actual or threatened litigation or government investigations of Ford’s compliance with regulatory standards, whether related to Ford’s products or business or commercial relationships, may require significant expenditures of time and other resources. Litigation also is inherently uncertain, and Ford could experience significant adverse results. In addition, adverse publicity surrounding an allegation may cause significant reputational harm that could have a significant adverse effect on Ford’s sales.
A change in requirements under long-term supply arrangements committing Ford to purchase minimum or fixed quantities of certain parts, or to pay a minimum amount to the seller (“take-or-pay” contracts). Ford has entered into a number of long-term supply contracts that require it to purchase a fixed quantity of parts to be used in the production of Ford’s vehicles. If Ford’s need for any of these parts were to lessen, Ford could still be required to purchase a specified quantity of the part or pay a minimum amount to the seller pursuant to the take-or-pay contract, which could have a substantial adverse effect on Ford’s financial condition or results of operations.
Adverse effects on results from a decrease in or cessation or clawback of government incentives related to investments. Ford receives economic benefits from national, state, and local governments in various regions of the world in the form of incentives designed to encourage manufacturers to establish, maintain, or increase investment, workforce, or production. These incentives may take various forms, including grants, loan subsidies, and tax abatements or credits. The impact of these incentives can be significant in a particular market during a reporting period. For example, most of Ford’s manufacturing facilities in South America are located in Brazil, where the state or federal governments have historically offered, and continue to offer, significant incentives to manufacturers to encourage capital investment, increase manufacturing production, and create jobs. As a result, the performance of Ford’s South American operations has been impacted favorably by government incentives to a substantial extent. In Brazil, however, the federal government has levied assessments against Ford concerning Ford’s calculation of federal incentives it received, and certain states have challenged the grant to Ford of tax incentives by the state of Bahia, including a constitutional challenge of state incentives that is pending in Brazil’s Supreme Court. A decrease in, expiration without renewal of, or other cessation or clawback of government incentives for any of Ford’s business units, as a result of administrative decision or otherwise, could have a substantial adverse impact on Ford’s financial condition and results of operations. See “Item 3. Legal Proceedings” in Ford’s 2015 Form 10-K Report for a discussion of tax proceedings in Brazil and the potential requirement for Ford to post collateral.
15
Item 1A. Risk Factors (Continued)
Inherent limitations of internal controls impacting financial statements and safeguarding of assets. Ford’s and Ford Credit’s internal control over financial reporting and their respective operating internal controls may not prevent or detect misstatements or loss of assets because of inherent limitations, including the possibility of human error, the circumvention or overriding of controls, or fraud. Effective internal controls can provide only reasonable assurance with respect to financial statement accuracy and safeguarding of assets.
Cybersecurity risks to operational systems, security systems, or infrastructure owned by Ford, Ford Credit, or a third-party vendor or supplier. Ford and Ford Credit are at risk for interruptions, outages, and breaches of: (i) operational systems (including business, financial, accounting, product development, consumer receivables, data processing, or manufacturing processes); (ii) facility security systems; and/or (iii) in-vehicle systems or mobile devices. Such cyber incidents could materially disrupt operational systems; result in loss of trade secrets or other proprietary or competitively sensitive information; compromise personally identifiable information of customers, employees, or others; jeopardize the security of Ford’s or Ford Credit’s facilities; and/or affect the performance of in-vehicle systems. A cyber incident could be caused by malicious third parties using sophisticated, targeted methods to circumvent firewalls, encryption, and other security defenses, including hacking, fraud, trickery, or other forms of deception. The techniques used by third parties change frequently and may be difficult to detect for long periods of time. A significant cyber incident could impact production capability, harm Ford’s or Ford Credit’s reputation and/or subject Ford or Ford Credit to regulatory actions or litigation.
Failure of financial institutions to fulfill commitments under committed credit and liquidity facilities. Under Ford’s revolving credit facility, Ford is able to borrow, repay, and then re-borrow up to $13.4 billion. Certain of Ford’s subsidiaries have standby or revolving credit facilities on which they depend for liquidity. If the financial institutions that provide commitments under Ford’s revolving credit facility, Ford’s subsidiaries’ standby or revolving credit facilities, or other committed credit facilities were to default on their obligation to fund the commitments, these facilities would not be available to Ford, which could substantially adversely affect Ford’s liquidity and financial condition. At December 31, 2015, Ford Credit had $17.1 billion of committed asset-backed security (“ABS”) and credit facilities available for use for which Ford Credit pays commitment fees. To the extent the financial institutions that provide these commitments were to default on their obligation to fund the commitments, these funds would not be available to Ford Credit.
Inability of Ford Credit to access debt, securitization, or derivative markets around the world at competitive rates or in sufficient amounts, due to credit rating downgrades, market volatility, market disruption, regulatory requirements, or other factors. Ford Credit’s ability to obtain unsecured funding at a reasonable cost is dependent on its credit ratings or its perceived creditworthiness. Ford Credit’s ability to obtain securitized funding under its committed asset-backed liquidity programs and certain other asset-backed securitization transactions is subject to having a sufficient amount of assets eligible for these programs, as well as Ford Credit’s ability to obtain appropriate credit ratings and, for certain committed programs, derivatives to manage the interest rate risk. Over time, and particularly in the event of any credit rating downgrades, market volatility, market disruption, or other factors, Ford Credit may reduce the amount of receivables it purchases or originates because of funding constraints. In addition, Ford Credit may be limited in the amount of receivables it purchases or originates in certain countries or regions if the local capital markets, particularly in developing countries, do not exist or are not adequately developed. Similarly, Ford Credit may reduce the amount of receivables it purchases or originates if there is a significant decline in the demand for the types of securities it offers or Ford Credit is unable to obtain derivatives to manage the interest rate risk associated with its securitization transactions. A significant reduction in the amount of receivables Ford Credit purchases or originates would significantly reduce its ongoing profits and could adversely affect its ability to support the sale of Ford vehicles.
16
Item 1A. Risk Factors (Continued)
Higher-than-expected credit losses, lower-than-anticipated residual values, or higher-than-expected return volumes for leased vehicles. Credit risk is the possibility of loss from a customer’s or dealer’s failure to make payments according to contract terms. Credit risk (which is heavily dependent upon economic factors including unemployment, consumer debt service burden, personal income growth, dealer profitability, and used car prices) has a significant impact on Ford Credit’s business. The level of credit losses Ford Credit may experience could exceed its expectations and adversely affect its financial condition and results of operations. In addition, Ford Credit projects expected residual values (including residual value support payments from Ford) and return volumes for the vehicles it leases. Actual proceeds realized by Ford Credit upon the sale of returned leased vehicles at lease termination may be lower than the amount projected, which would reduce the profitability of the lease transaction. Among the factors that can affect the value of returned lease vehicles are the volume of vehicles returned, economic conditions, and quality or perceived quality, safety, fuel efficiency, or reliability of the vehicles. Actual return volumes may be higher than expected and can be influenced by contractual lease-end values relative to auction values, marketing programs for new vehicles, and general economic conditions. Each of these factors, alone or in combination, has the potential to adversely affect Ford Credit’s profitability if actual results were to differ significantly from Ford Credit’s projections.
Increased competition from banks, financial institutions, or other third parties seeking to increase their share of financing Ford vehicles. No single company is a dominant force in the automotive finance industry. Most of Ford Credit’s bank competitors in the United States use credit aggregation systems that permit dealers to send, through standardized systems, retail credit applications to multiple finance sources to evaluate financing options offered by these sources. Also, direct on-line or large dealer group financing options provide consumers with alternative finance sources and/or increased pricing transparency. All of these financing alternatives drive greater competition based on financing rates and terms. Competition from such institutions and alternative finance sources could adversely affect Ford Credit’s profitability and the volume of its retail business. In addition, Ford Credit may face increased competition on wholesale financing for Ford dealers.
New or increased credit regulations, consumer or data protection regulations, or other regulations resulting in higher costs and/or additional financing restrictions. As a finance company, Ford Credit is highly regulated by governmental authorities in the locations in which it operates, which can impose significant additional costs and/or restrictions on its business. In the United States, for example, Ford Credit’s operations are subject to regulation, supervision, and licensing under various federal, state, and local laws and regulations, including the federal Truth-in-Lending Act, Consumer Leasing Act, Equal Credit Opportunity Act, and Fair Credit Reporting Act.
Congress also passed the Dodd-Frank Act in 2010 to reform practices in the financial services industries, including automotive financing and securitizations. The Dodd-Frank Act directs federal agencies to adopt rules to regulate the consumer finance industry and the capital markets and, among other things, gives the CFPB broad rule-making and enforcement authority for a wide range of consumer financial protection laws that regulate consumer finance businesses, such as Ford Credit’s retail automotive financing business. Exercise of these powers by the CFPB may increase the costs of, impose additional restrictions on, or otherwise adversely affect companies in the automotive finance business. For example, in March 2013, the CFPB issued a bulletin recommending that indirect vehicle lenders, a class that includes Ford Credit, take steps to monitor and/or impose controls over dealer discretionary pricing. Effective August 31, 2015, the CFPB has authority to supervise and examine the largest nonbank automotive finance companies, such as Ford Credit, for compliance with consumer financial protection laws.
In addition, the Dodd-Frank Act provides that a nonbank financial company could be designated a “systemically important financial institution” by the Financial Stability Oversight Council and thus be subject to supervision by the Board of Governors of the Federal Reserve System. Such a designation would mean that a nonbank finance company such as Ford Credit, in effect, could be regulated like a bank with respect to capital and other requirements, but without the benefits of being a bank—such as the ability to offer Federal Deposit Insurance Corporation (“FDIC”) insured deposits.
The Dodd-Frank Act also creates an alternative liquidation framework under which the FDIC may be appointed as receiver of a nonbank financial company if the U.S. Treasury Secretary (in consultation with the President of the United States) determines that the company is in default or danger of default and the resolution of the company under other applicable law (e.g., U.S. bankruptcy law) would have serious adverse effects on the financial stability of the United States. The FDIC’s powers under this framework may vary from those of a bankruptcy court under U.S. bankruptcy law, which could adversely impact securitization markets, including Ford Credit’s funding activities, regardless of whether Ford Credit ever is determined to be subject to the Dodd-Frank Act’s alternative liquidation framework.
17
Item 1A. Risk Factors (Continued)
In some countries outside the United States, some of Ford Credit’s subsidiaries are regulated banking institutions and are required, among other things, to maintain minimum capital and liquidity. In many other locations, governmental authorities require companies to have licenses in order to conduct financing businesses. Compliance with these laws and regulations imposes additional costs on Ford Credit and affects the conduct of its business. Additional regulation could add significant cost or operational constraints that might impair Ford Credit’s profitability.
ITEM 1B. Unresolved Staff Comments.
We have none to report.
ITEM 2. Properties.
We own our world headquarters in Dearborn, Michigan. We lease our corporate offices in Brentwood, England, from an affiliate of Ford. Most of our automotive finance branches and business centers are located in leased properties. The continued use of any of these leased properties is not material to our operations. At December 31, 2015, our total future rental commitment under leases of real property was $61 million.
We operate through four business centers in the United States and two business centers in Canada.
United States: | Colorado Springs, Colorado | Greenville, South Carolina |
Tampa, Florida | Nashville, Tennessee | |
Canada: | Edmonton, Alberta | Oakville, Ontario |
Each of the U.S. business centers generally services dealers and customers located within its region. All of our U.S. business centers are electronically linked and workload can be allocated across these centers. In addition, our Canadian business centers share a similar electronic linkage and workload allocation capability.
We also have three specialty centers in North America that focus on specific activities:
• | Customer Service Center - Omaha, Nebraska; |
• | Loss Prevention Center - Irving, Texas; and |
• | National Recovery Center - Mesa, Arizona. |
In Europe, we have a service center in Manchester, England that services our U.K. dealers and dealers from several European locations and one in St. Albans, England that services our U.K. customers. We are in the process of migrating our servicing of U.K. customers from the service center in St. Albans to Manchester. We also have a service center in Cologne, Germany to service our German dealers and customers. In other countries, we provide servicing through our local branches and subsidiaries.
18
ITEM 3. Legal Proceedings.
Various legal actions, proceedings, and claims (generally, “matters”) are pending or may be instituted or asserted against us. These include but are not limited to matters arising out of governmental regulations; tax matters; alleged illegal acts resulting in fines or penalties; financial services; employment-related matters; dealer and other contractual relationships; personal injury matters; investor matters; and financial reporting matters. Certain of the pending legal actions are, or purport to be, class actions. Some of the matters involve or may involve claims for compensatory, punitive, or antitrust or other treble damages in very large amounts, sanctions, assessments, or other relief, which, if granted, would require very large expenditures. Our significant pending matter is summarized below:
Ford Motor Credit Company v. Sudesh Agrawal. On January 18, 2011, a state trial court judge in Cuyahoga County, Ohio certified a nationwide class action with an Ohio subclass in a counterclaim arising out of a collection action. Class claimants allege breach of contract, fraud, and statutory violations for Ford Credit’s lease-end wear and use charges. Class claimants allege that the standard applied by Ford Credit in determining the condition of vehicles at lease-end is different than the standard set forth in claimants’ leases. The Court of Appeals of Ohio, Eighth Appellate District, affirmed nationwide class certification and certification of an Ohio subclass. We appealed, and on December 17, 2013, the Supreme Court of Ohio reversed the Court of Appeals and remanded the case for further proceedings. On March 13, 2014, the Court of Appeals reversed the trial court order certifying the classes and remanded the case for further proceedings. On September 28, 2015, the trial court re-certified a nationwide class action with an Ohio subclass. We have filed an appeal.
The litigation process is subject to many uncertainties, and the outcome of individual matters is not predictable with assurance. It is reasonably possible that matters could be decided unfavorably to us. Although the amount of liability at December 31, 2015, with respect to litigation matters cannot be ascertained, we believe that any resulting liability would not materially affect our operations, financial condition, or liquidity.
In addition, any litigation, investigation, proceeding, or claim against Ford that results in Ford incurring significant liability, expenditures, or costs could also have a material adverse effect on our operations, financial condition, or liquidity. For a discussion of pending significant cases against Ford, see Item 3 in Ford’s 2015 Form 10-K Report.
ITEM 4. Mine Safety Disclosures.
Not applicable.
19
PART II
ITEM 5. Market for Registrant’s Common Equity, Related Shareholder Matters and Issuer Purchases of Equity Securities.
At December 31, 2015, all of our Shares were owned by Ford Holdings LLC, a wholly owned subsidiary of Ford. We did not issue or sell any equity interests during 2015, and there is no market for our Shares. We paid cash distributions to our parent of $250 million and $395 million in 2015 and 2014, respectively.
ITEM 6. Selected Financial Data.
Not required.
ITEM 7. Management’s Discussion and Analysis of Financial Condition and Results of Operations.
Overview
Our primary focus is to profitably support the sale of Ford and Lincoln vehicles. We work with Ford to maximize customer and dealer satisfaction and loyalty, offering a wide variety of financing products and outstanding service. We continually improve processes focusing on the customer and the dealer to manage costs and ensure the efficient use of capital. As a result, Ford Credit is uniquely positioned to drive incremental sales, improve customer satisfaction and owner loyalty to Ford, and direct profits and distributions back to Ford to support its overall business, including vehicle development.
We leverage three fundamental strategies in the management of our operations. The first is to employ prudent origination practices while maintaining a managed level of risk. The second is to have efficient and effective servicing and collection practices. The third is to fund the business efficiently while managing our balance sheet risk.
Generation of Revenue, Income, and Cash
The principal factors that influence our earnings are the amount and mix of finance receivables, operating leases, and financing margins. The performance of these receivables and leases over time, mainly through the impact of credit losses and variations in the residual value of leased vehicles, also affects our earnings.
The amount of our finance receivables and operating leases depends on many factors, including:
• | The volume of new and used vehicle sales and leases; |
• | The extent to which we purchase retail installment sale and lease contracts and the extent to which we provide wholesale financing; |
• | The sales price of the vehicles financed; |
• | The level of dealer inventories; |
• | Ford-sponsored special financing programs available exclusively through us; and |
• | The availability of cost-effective funding for the purchase of retail installment sale and lease contracts and to provide wholesale financing. |
For finance receivables, financing margin equals the difference between revenue earned on finance receivables and the cost of borrowed funds. For operating leases, financing margin equals revenue earned on operating leases, less depreciation expense and the cost of borrowed funds. Interest rates earned on most receivables and rental charges on operating leases generally are fixed at the time the contracts are originated. On some receivables, primarily dealer financing, we charge interest at a floating rate that varies with changes in short-term interest rates.
20
Item 7. Management’s Discussion and Analysis of Financial Condition and Results of Operations (Continued)
Business Performance
We review our business performance on a managed basis. Receivables for the North America and International Segments are presented on a managed basis, as it closely approximates the customer’s outstanding balance on the receivables, which is the basis for earning revenue. Our managed receivables equal net finance receivables and net investment in operating leases, excluding unearned interest supplements and residual support, allowance for credit losses, and other (primarily accumulated supplemental depreciation). To evaluate our performance we monitor a number of measures, such as delinquencies, repossession statistics, losses on repossessions, and the number of bankruptcy filings.
We measure the performance of our North America and International Segments primarily on an income before income taxes basis, after excluding the impact to earnings from gains and losses related to market valuation adjustments to derivatives primarily related to movements in interest rates. These adjustments are included in unallocated risk management and are excluded in assessing our North America and International Segment performance because they are carried out on a centralized basis at the corporate level. We also adjust segment performance to re-allocate interest expense between the North America and International Segments reflecting debt and equity levels proportionate to their product risk. For additional information regarding our segments, see Note 16 of our Notes to the Financial Statements.
21
Item 7. Management’s Discussion and Analysis of Financial Condition and Results of Operations (Continued)
Results of Operations
Overview
In general, we measure period-to-period changes in pre-tax results using the causal factors listed below:
• | Volume and Mix – Volume and Mix are primarily reflected within Net financing margin on the income statement. |
◦ | Volume primarily measures changes in net financing margin driven by changes in average finance receivables and net investment in operating leases at prior period financing margin yield (defined below in financing margin) at prior period exchange rates. Volume changes are primarily driven by the volume of new and used vehicle sales and leases, the extent to which we purchase retail installment sale and lease contracts, the extent to which we provide wholesale financing, the sales price of the vehicles financed, the level of dealer inventories, Ford-sponsored special financing programs available exclusively through us, and the availability of cost-effective funding for the purchase of retail installment sale and lease contracts and to provide wholesale financing. |
◦ | Mix primarily measures changes in net financing margin driven by period over period changes in the composition of our average managed receivables by product and by country or region. |
• | Financing Margin – Financing Margin is reflected within Net financing margin on the income statement. |
◦ | Financing margin variance is the period-to-period change in financing margin yield multiplied by the present period average receivables at prior period exchange rates. This calculation is performed at the product and country level and then aggregated. Financing margin yield equals revenue, less interest expense and scheduled depreciation for the period, divided by average receivables for the same period. |
◦ | Financing margin changes are driven by changes in revenue and interest expense. Changes in revenue are primarily driven by the level of market interest rates, cost assumptions in pricing, mix of business, and competitive environment. Changes in interest expense are primarily driven by the level of market interest rates, borrowing spreads, and asset-liability management. |
• | Credit Loss – Credit Loss is reflected within the Provision for credit losses on the income statement. |
◦ | Credit loss is the change in the provision for credit losses at prior period exchange rates. For analysis purposes, management splits the provision for credit losses primarily into net charge-offs and the change in the allowance for credit losses. |
◦ | Net charge-off changes are primarily driven by the number of repossessions, severity per repossession, and recoveries. Changes in the allowance for credit losses are primarily driven by changes in historical trends in credit losses and recoveries, changes in the composition and size of our present portfolio, changes in trends in historical used vehicle values, and changes in economic conditions. For additional information on the allowance for credit losses, refer to the “Critical Accounting Estimates – Allowance for Credit Losses” section below. |
• | Lease Residual – Lease Residual is reflected within Depreciation on vehicles subject to operating leases on the income statement. |
◦ | Lease residual measures changes to residual performance at prior period exchange rates. For analysis purposes, management splits residual performance primarily into residual gains and losses, and the change in accumulated supplemental depreciation. |
◦ | Residual gain and loss changes are primarily driven by the number of vehicles returned to us and sold, and the difference between the auction value and the depreciated value of the vehicles sold. Changes in accumulated supplemental depreciation are primarily driven by changes in our estimate of the number of vehicles that will be returned to us and sold, and changes in our estimate of the expected auction value at the end of the lease term. For additional information on accumulated supplemental depreciation, refer to the “Critical Accounting Estimates – Accumulated Depreciation on Vehicles Subject to Operating Leases” section below. |
• | Exchange – Reflects changes in pre-tax results driven by the effects of converting functional currency income to U.S. dollars and is reflected in all lines on the income statement. |
• | Other – Primarily includes Operating expenses, Other revenue, and Insurance expenses on the income statement at prior period exchange rates. |
◦ | Changes in operating expenses are primarily driven by salaried personnel costs, facilities costs, and costs associated with the origination and servicing of customer contracts. |
◦ | In general, other revenue changes are primarily driven by changes in earnings related to market valuation adjustments to derivatives (primarily related to movements in interest rates), which are included in unallocated risk management, and other miscellaneous items. |
22
Item 7. Management’s Discussion and Analysis of Financial Condition and Results of Operations (Continued)
2015 Compared with 2014
The following chart shows our key metrics:
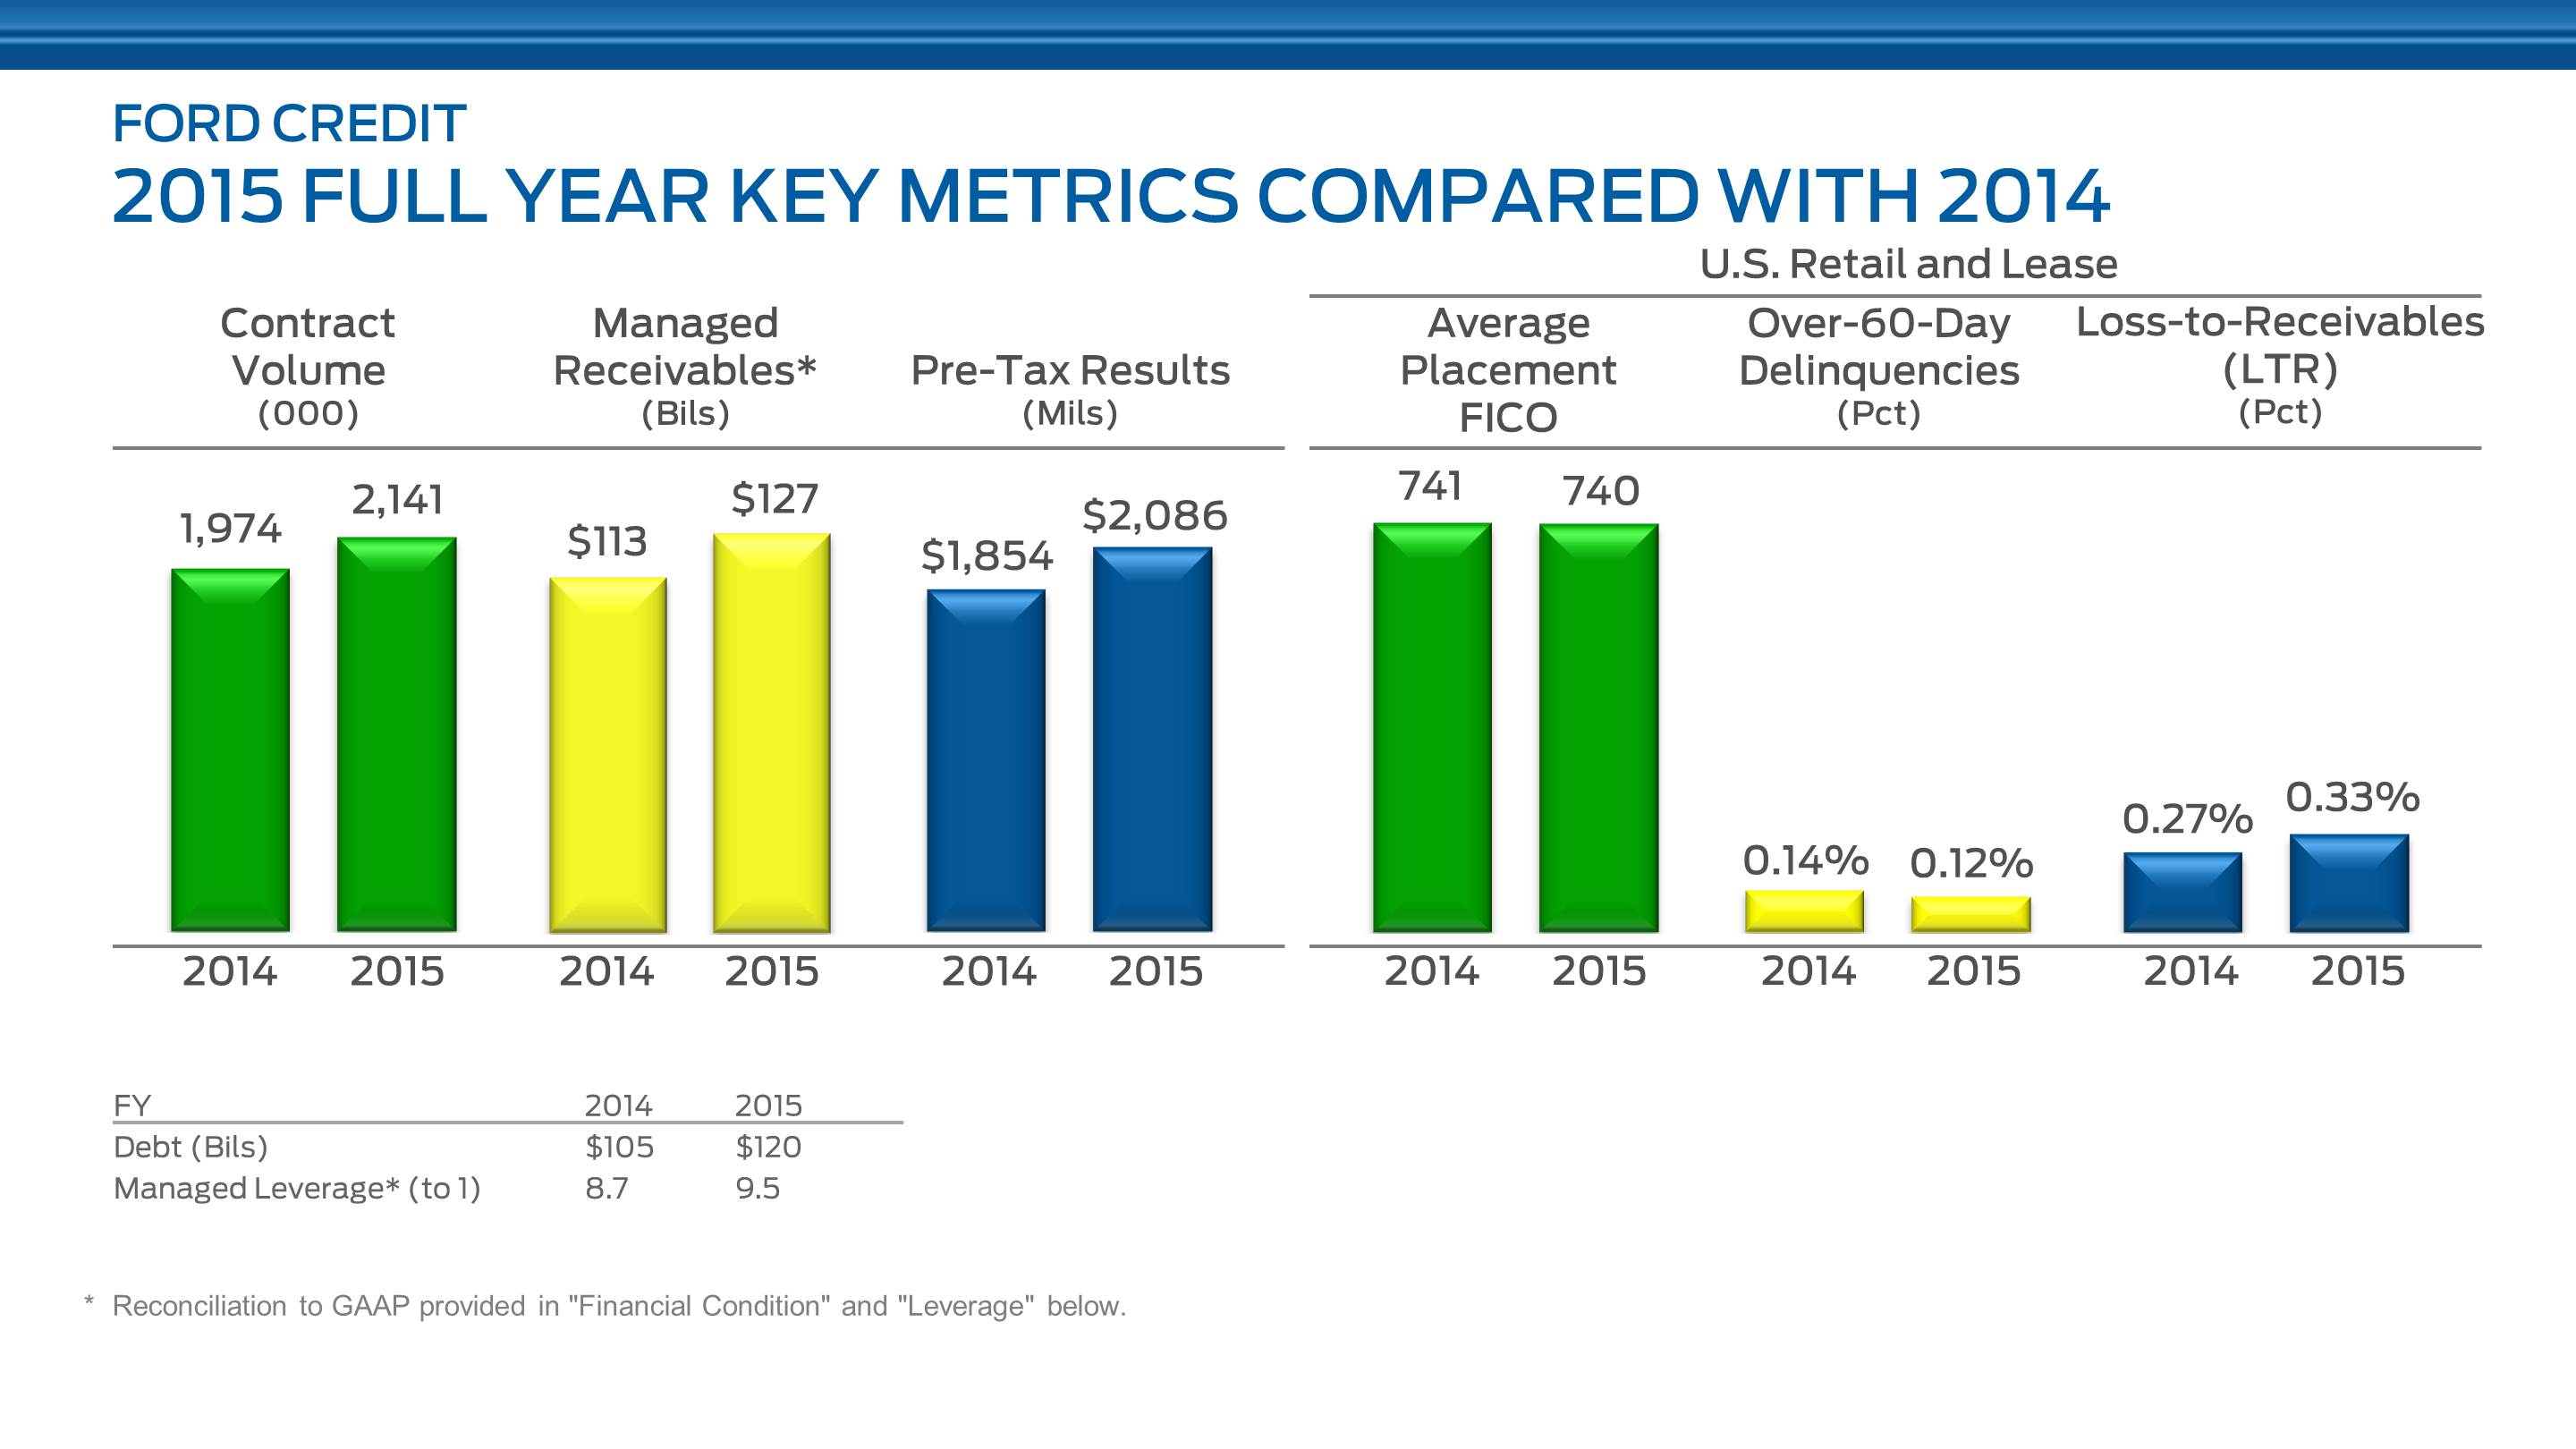
We continue to support Ford’s growth by providing financial products and services to our dealers and customers around the world. Our contract volume grew 8% in 2015, and managed receivables ended the year at $127 billion, up $14 billion from year-end 2014 and at the top of our prior guidance.
On a pre-tax basis we earned $2.1 billion in 2015, up $232 million from 2014. Our net income was $1.4 billion in 2015, compared with $1.7 billion in 2014. The decrease in net income reflects the nonrecurrence of favorable tax items recorded in 2014. For additional information, see Note 10 of our Notes to the Financial Statements. In 2015, we paid distributions of $250 million.
Our purchase policy remains consistent along with a relentless focus on originations, servicing, and collections. As a result, our portfolio performance continues to be robust with our loss-to-receivables ratio at the low end of our historical experience.
23
Item 7. Management’s Discussion and Analysis of Financial Condition and Results of Operations (Continued)
The following chart shows the increase in pre-tax profit by causal factor:
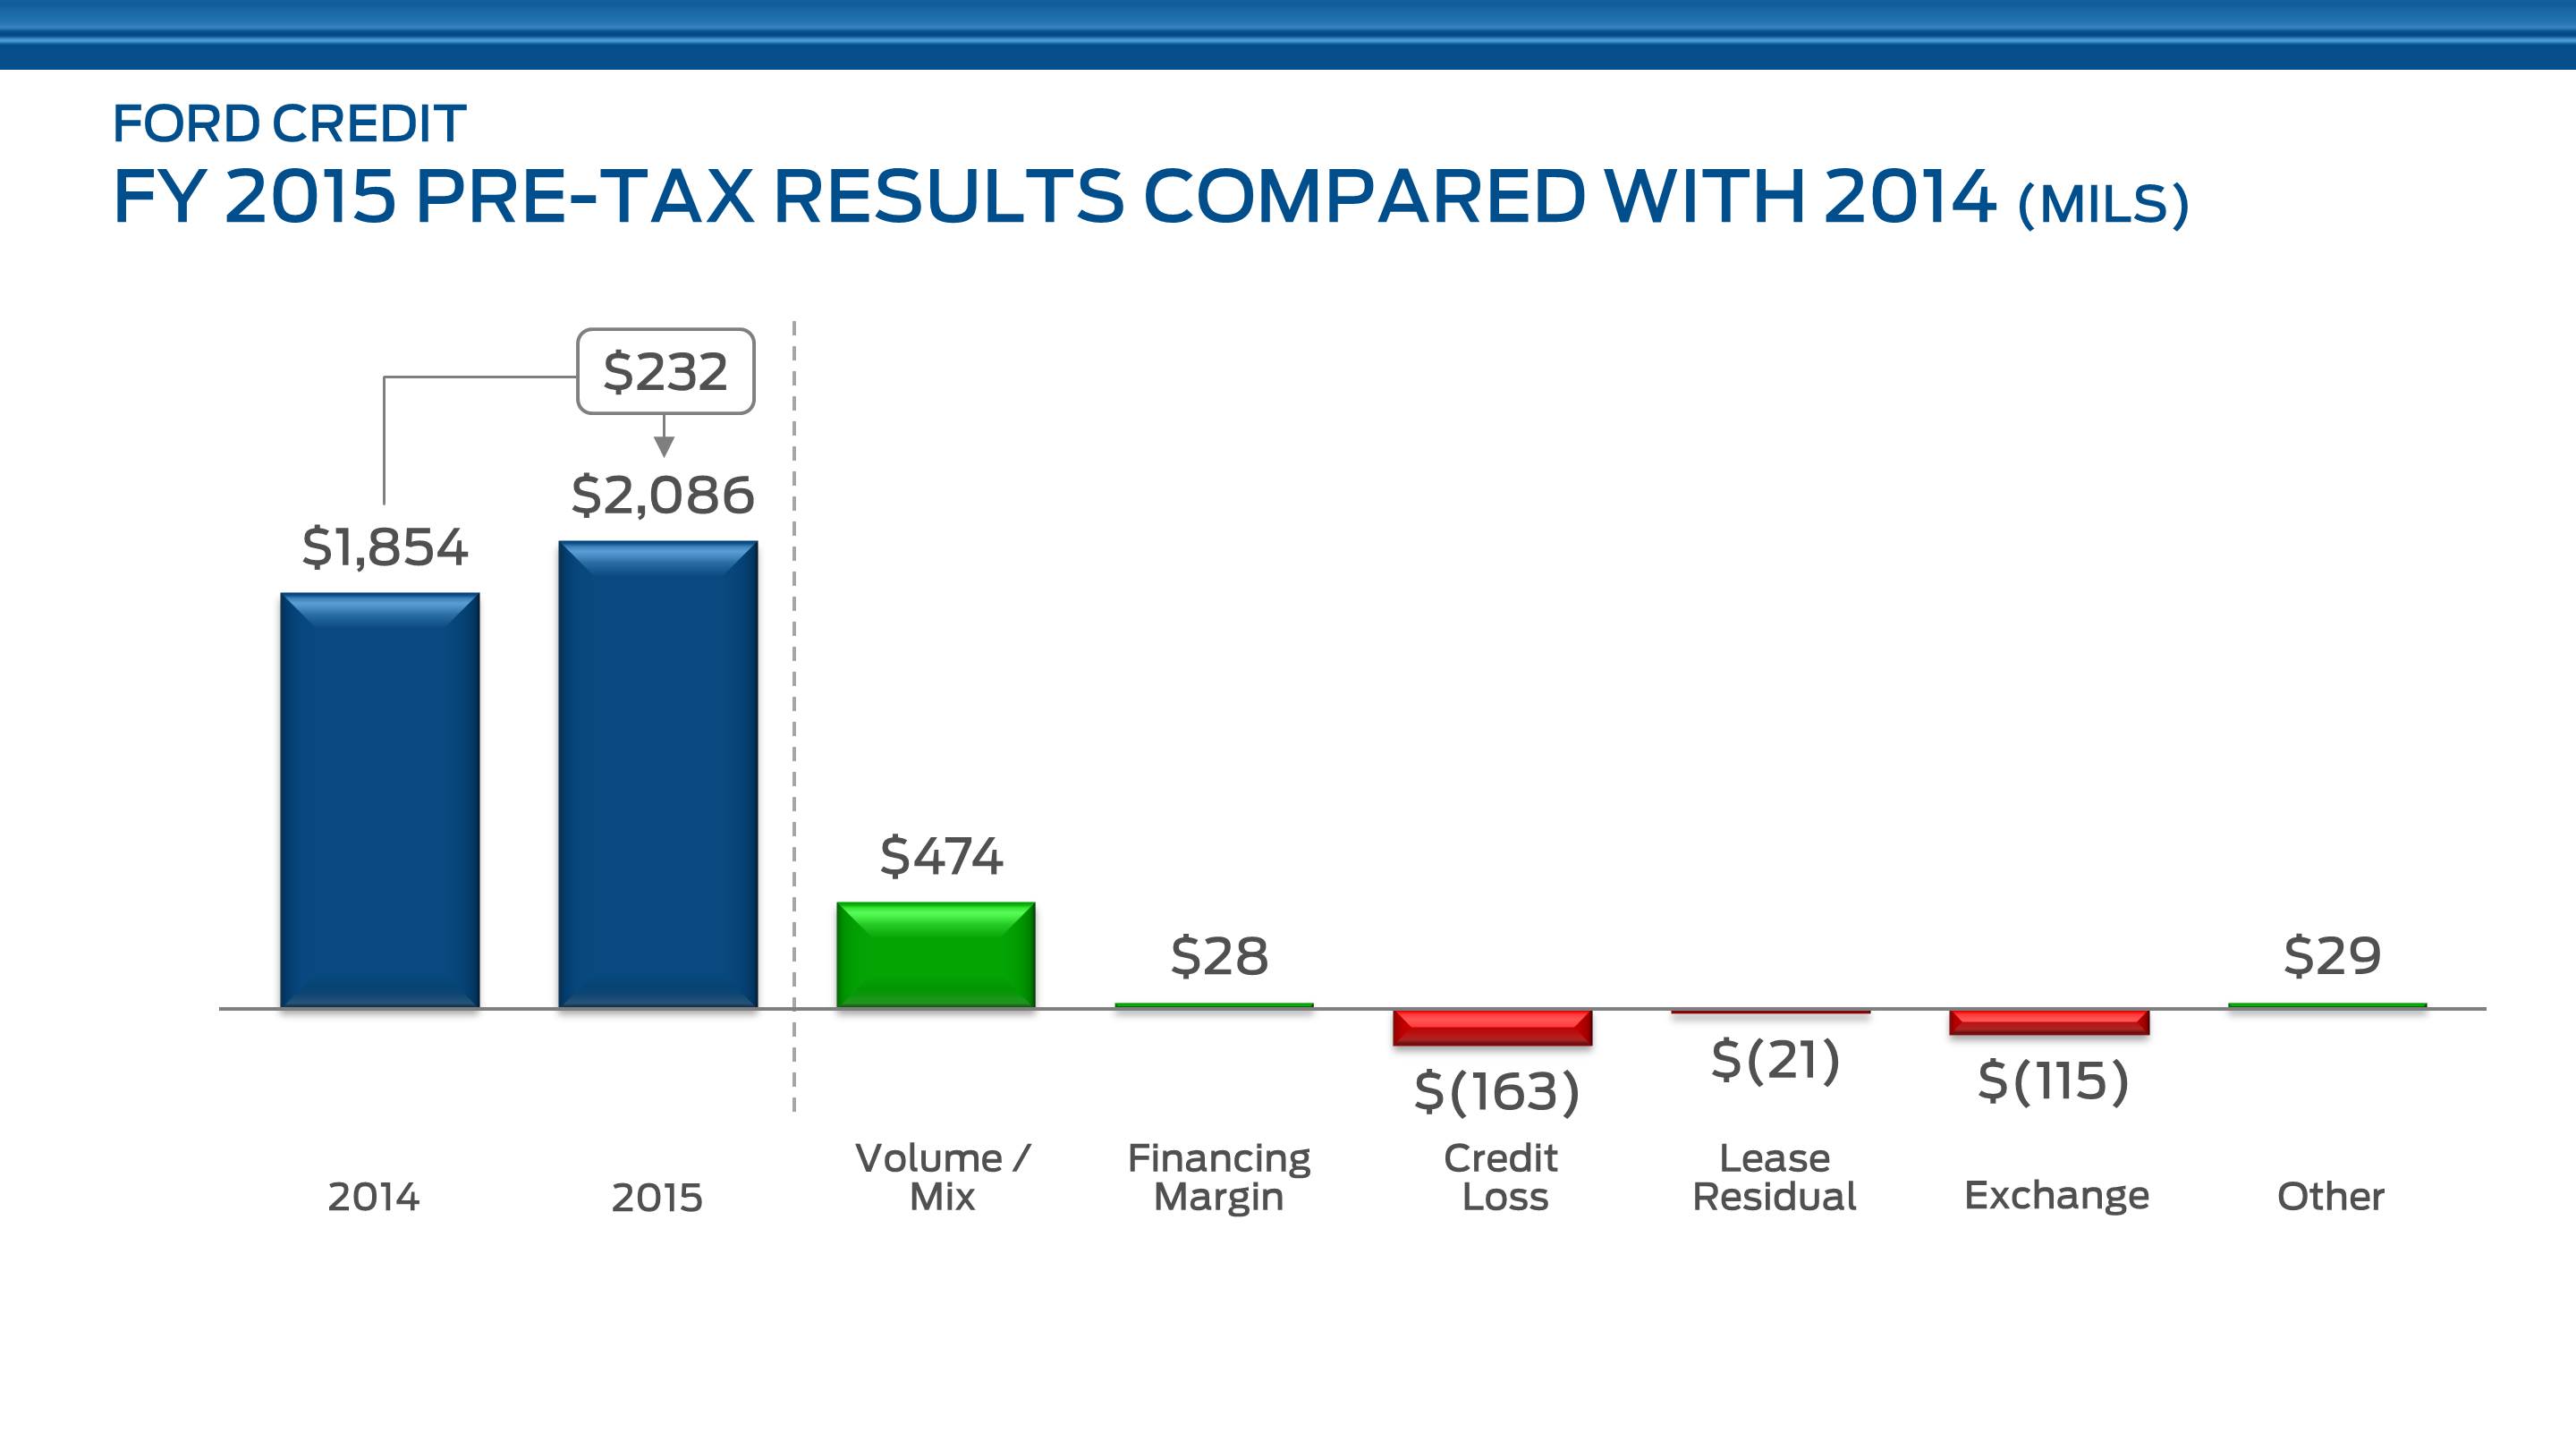
Pre-tax profit improved compared with 2014. The improvement is more than explained by favorable volume and mix, driven by growth in all products globally.
Higher credit losses and the adverse effect of the stronger U.S. dollar were partial offsets. The higher credit losses, primarily in North America, reflect reserve increases in 2015 compared with reserve releases in 2014. Charge-offs were also higher.
24
Item 7. Management’s Discussion and Analysis of Financial Condition and Results of Operations (Continued)
Results of operations by business segment and unallocated risk management for the years ended December 31 are shown below (in millions). For additional information, see Note 16 of our Notes to the Financial Statements.
2015 | 2014 | 2015 Over/(Under) 2014 | ||||||||||
Income before income taxes | ||||||||||||
North America Segment | $ | 1,629 | $ | 1,399 | $ | 230 | ||||||
International Segment | 458 | 461 | (3 | ) | ||||||||
Unallocated risk management | (1 | ) | (6 | ) | 5 | |||||||
Income before income taxes | $ | 2,086 | $ | 1,854 | $ | 232 | ||||||
North America Segment
The North America Segment’s higher full year pre-tax profit is more than explained by favorable volume and mix, driven by growth in all products. A partial offset was higher credit losses, reflecting higher charge-offs and reserve increases in 2015 compared with reserve releases in 2014.
International Segment
The International Segment’s full year pre-tax profit is largely unchanged. Favorable volume and mix, driven by growth in all products, was offset by the adverse effect of the stronger U.S. dollar, lower financing margin, and higher credit losses, reflecting reserve increases in 2015 compared with reserve releases in 2014.
Unallocated Risk Management
Unallocated risk management is largely unchanged. For additional information, see Notes 7 and 16 of our Notes to the Financial Statements.
25
Item 7. Management’s Discussion and Analysis of Financial Condition and Results of Operations (Continued)
2014 Compared with 2013
Our net income was $1.7 billion in 2014, compared with $1.5 billion in 2013. The increase reflects favorable tax items recorded during the year. For additional information, see Note 10 of our Notes to the Financial Statements.
On a pre-tax basis we earned $1.9 billion in 2014, compared with $1.8 billion in 2013. The following chart shows the increase in pre-tax profit by causal factor:

The improvement of $98 million is more than explained by favorable volume and mix, driven by increases in consumer and non-consumer finance receivables globally, as well as an increase in operating leases in North America.
Partial offsets include lower financing margin, reflecting primarily lower portfolio pricing in North America and a one-time reserve in Europe, and unfavorable lease residual performance in North America, resulting from lower relative auction values.
26
Item 7. Management’s Discussion and Analysis of Financial Condition and Results of Operations (Continued)
Results of our operations by business segment and unallocated risk management for the years ended December 31 are shown below (in millions). For additional information, see Note 16 of our Notes to the Financial Statements.
2014 | 2013 | 2014 Over/(Under) 2013 | ||||||||||
Income before income taxes | ||||||||||||
North America Segment | $ | 1,399 | $ | 1,438 | $ | (39 | ) | |||||
International Segment | 461 | 371 | 90 | |||||||||
Unallocated risk management | (6 | ) | (53 | ) | 47 | |||||||
Income before income taxes | $ | 1,854 | $ | 1,756 | $ | 98 | ||||||
North America Segment
The full year decrease in the North America Segment pre-tax profit is primarily explained by unfavorable lease residual performance, resulting from lower relative auction values, and lower financing margin, reflecting lower portfolio pricing. A partial offset was favorable volume and mix, driven by an increase in operating leases and higher consumer finance receivables, both reflecting changes in Ford’s marketing programs, as well as an increase in non-consumer finance receivables, reflecting higher dealer stocks.
International Segment
The full year increase in the International Segment pre-tax profit is primarily explained by favorable volume and mix resulting from an increase in consumer finance receivables reflecting growth in sales of new Ford vehicles and higher financing share, as well as an increase in non-consumer finance receivables, reflecting higher dealer stocks. A partial offset was lower financing margin, reflecting the one-time reserve in Europe.
Unallocated Risk Management
The improvement in unallocated risk management primarily reflects favorable performance in market valuation adjustments to derivatives. For additional information, see Notes 7 and 16 of our Notes to the Financial Statements.
27
Item 7. Management’s Discussion and Analysis of Financial Condition and Results of Operations (Continued)
Contract Placement Volume and Financing Share
Total worldwide consumer financing contract placement volumes for new and used vehicles for the years ended December 31 were as follows (in thousands):
2015 | 2014 | 2013 | ||||||
North America Segment | ||||||||
United States | 1,342 | 1,231 | 1,122 | |||||
Canada | 160 | 149 | 140 | |||||
Total North America Segment | 1,502 | 1,380 | 1,262 | |||||
International Segment | ||||||||
Europe | 505 | 460 | 404 | |||||
Asia Pacific | 108 | 109 | 92 | |||||
Latin America | 26 | 25 | 4 | |||||
Total International Segment | 639 | 594 | 500 | |||||
Total contract placement volume | 2,141 | 1,974 | 1,762 | |||||
Shown below are our financing shares of new Ford- and Lincoln-brand vehicles sold in the United States and new Ford-brand vehicles sold in Europe for the years ended December 31.
Also shown below are our wholesale financing shares of new Ford- and Lincoln-brand vehicles acquired by dealers in the United States, excluding fleet, and of new Ford-brand vehicles acquired by dealers in Europe for the years ended December 31:
2015 | 2014 | 2013 | ||||||
United States | ||||||||
Financing share | ||||||||
Retail installment and lease | 47 | % | 45 | % | 40 | % | ||
Wholesale | 76 | 77 | 77 | |||||
Europe | ||||||||
Financing share | ||||||||
Retail installment and lease | 37 | % | 36 | % | 34 | % | ||
Wholesale | 98 | 98 | 98 | |||||
North America Segment
The increase in contract placement volume primarily reflects higher industry volume and higher financing share. The higher retail installment and lease financing share in the United States was driven primarily by changes in Ford’s marketing programs.
International Segment
The increase in contract placement volume primarily reflects higher industry volume in Europe. Higher retail installment and lease financing share in Europe was driven primarily by changes in Ford’s marketing programs.
28
Item 7. Management’s Discussion and Analysis of Financial Condition and Results of Operations (Continued)
Financial Condition
Finance Receivables and Operating Leases
Our receivables, including finance receivables and operating leases, at December 31 were as follows (in billions):
2015 | 2014 | ||||||
Net Receivables (a) | |||||||
Finance receivables - North America Segment | |||||||
Consumer retail financing | $ | 49.2 | $ | 44.1 | |||
Non-consumer: Dealer financing (b) | 25.5 | 22.5 | |||||
Non-consumer: Other | 0.9 | 1.0 | |||||
Total finance receivables - North America Segment | 75.6 | 67.6 | |||||
Finance receivables - International Segment | |||||||
Consumer retail financing | 12.9 | 11.8 | |||||
Non-consumer: Dealer financing (b) | 10.5 | 9.3 | |||||
Non-consumer: Other | 0.3 | 0.3 | |||||
Total finance receivables - International Segment | 23.7 | 21.4 | |||||
Unearned interest supplements | (2.1 | ) | (1.8 | ) | |||
Allowance for credit losses | (0.4 | ) | (0.3 | ) | |||
Finance receivables, net | 96.8 | 86.9 | |||||
Net investment in operating leases | 25.1 | 21.5 | |||||
Total net receivables | $ | 121.9 | $ | 108.4 | |||
Managed Receivables | |||||||
Total net receivables | $ | 121.9 | $ | 108.4 | |||
Unearned interest supplements and residual support | 4.5 | 3.9 | |||||
Allowance for credit losses | 0.4 | 0.4 | |||||
Other, primarily accumulated supplemental depreciation | 0.4 | 0.1 | |||||
Total managed receivables | $ | 127.2 | $ | 112.8 | |||
__________
(a) | At December 31, 2015 and 2014, includes consumer receivables before allowance for credit losses of $27.6 billion and $24.4 billion, respectively, and non-consumer receivables before allowance for credit losses of $26.1 billion and $21.8 billion, respectively, that have been sold for legal purposes in securitization transactions but continue to be reported in our consolidated financial statements. In addition, at December 31, 2015 and 2014, includes net investment in operating leases before allowance for credit losses of $13.3 billion and $9.6 billion, respectively, that have been included in securitization transactions but continue to be reported in our consolidated financial statements. The receivables and net investment in operating leases are available only for payment of the debt issued by, and other obligations of, the securitization entities that are parties to those securitization transactions; they are not available to pay the other obligations or the claims of Ford Credit’s other creditors. Ford Credit holds the right to receive the excess cash flows not needed to pay the debt issued by, and other obligations of, the securitization entities that are parties to those securitization transactions. For additional information on our securitization transactions, refer to the “Securitization Transactions” and “On-Balance Sheet Arrangements” sections below and Note 5 of our Notes to the Financial Statements. |
(b) | Dealer financing primarily includes wholesale loans to dealers to finance the purchase of vehicle inventory. |
Managed receivables at December 31, 2015 increased from year-end 2014, driven by increases in consumer and non-consumer finance receivables in all geographic segments and operating leases in the North America Segment. The adverse effect of the stronger U.S. dollar was a partial offset.
29
Item 7. Management’s Discussion and Analysis of Financial Condition and Results of Operations (Continued)
Credit Risk
Credit risk is the possibility of loss from a customer’s or dealer’s failure to make payments according to contract terms. Credit risk has a significant impact on our business. We actively manage the credit risk of our consumer (retail financing and operating lease) and non-consumer (dealer financing) receivables to balance our level of risk and return. The allowance for credit losses (also referred to as the credit loss reserve) represents our estimate of the probable credit losses inherent in our finance receivables and operating leases as of the balance sheet date. The allowance for credit losses is estimated using a combination of models and management judgment, and is based on such factors as historical loss performance, portfolio quality, and receivable levels. The adequacy of our allowance for credit losses is assessed quarterly and the assumptions and models used in establishing the allowance are evaluated regularly. A description of our allowance setting process is provided in the “Critical Accounting Estimates - Allowance for Credit Losses” section below.
Most of our charge-offs are related to retail finance and operating lease contracts. Charge-offs are affected by the number of vehicle repossessions, the unpaid balance outstanding at the time of repossession, the auction price of repossessed vehicles, and other charge-offs. We also incur credit losses on our dealer financing, but default rates for these receivables historically have been substantially lower than those for retail finance and operating lease contracts. For additional information on severity, refer to the “Critical Accounting Estimates - Allowance for Credit Losses” section below.
In purchasing retail finance and operating lease contracts, we use a proprietary scoring system that measures the credit quality of the receivables using several factors, such as credit bureau information, consumer credit risk scores (e.g., FICO score), and contract characteristics. In addition to our proprietary scoring system, we consider other factors, such as employment history, financial stability, and capacity to pay. At December 31, 2015 and 2014, we classified between 5% and 6% of the outstanding U.S. retail finance and operating lease contracts in our portfolio as high risk at contract inception. For additional information on the quality of our receivables, see Note 2 of our Notes to the Financial Statements.
30
Item 7. Management’s Discussion and Analysis of Financial Condition and Results of Operations (Continued)
Worldwide Metrics
The following charts show annual trends of charge-offs (credit losses, net of recoveries), loss-to-receivables (“LTR”) ratios (charge-offs divided by average managed receivables), credit loss reserve, and our credit loss reserve as a percentage of EOP managed receivables:

Charge-offs were up from 2014 primarily reflecting higher severities and growth in receivables.
The LTR ratio of 23 basis points remains at the low end of our historical experience.
The reserve as a percent of managed receivables was up one basis point and up $63 million on an absolute basis from a year ago. Our credit loss reserve is based on such factors as historical loss performance, portfolio quality, and receivable levels.
31
Item 7. Management’s Discussion and Analysis of Financial Condition and Results of Operations (Continued)
U.S. Ford- and Lincoln-Brand Retail Installment and Operating Lease
The following charts show the primary drivers of credit losses in the U.S. retail and lease business, which comprised 75% of our worldwide consumer portfolio at December 31, 2015.

Our origination practices remain consistent as evidenced by our average placement FICO score. As a result, we continue to experience very robust credit loss performance.
Our repossession ratio of 0.98% in 2015 was the lowest on record, and over-60-day delinquencies continue at record low levels.
Severities have increased over the last number of years. These increases primarily reflect factors including higher average amount financed, longer-term financing, shorter average time to repossession, and higher principal outstanding at repossession. Our severity performance is generally consistent with our expectations.
Our average severity of $8,900 was $1,000 higher than 2014. About $600 of this increase reflects the underlying factors noted above, while the remainder reflects the inclusion of certain repossession expenses beginning in 2015.
The LTR ratio of 33 basis points was up six basis points from a year ago, primarily as a result of the increase in severity. Despite the increase, the LTR ratio remains near historic lows.
With higher severity and a growing balance sheet, charge-offs were up $60 million from 2014.
32
Item 7. Management’s Discussion and Analysis of Financial Condition and Results of Operations (Continued)
Residual Risk
We are exposed to residual risk on operating leases and similar balloon payment products where the customer may return the financed vehicle to us. Residual risk is the possibility that the amount we obtain from returned vehicles will be less than our estimate of the expected residual value for the vehicle. We estimate the expected residual value by evaluating recent auction values, return volumes for our leased vehicles, industrywide used vehicle prices, marketing incentive plans, and vehicle quality data. Changes in expected residual values impact the depreciation expense, which is recognized on a straight-line basis over the life of the lease.
For additional information on our residual risk on operating leases, refer to “Critical Accounting Estimates - Accumulated Depreciation on Vehicles Subject to Operating Leases” and Note 3 “Net Investment in Operating Leases.”
North America Retail Operating Lease Experience
The North America Segment accounted for 99% of Ford Credit’s total operating leases at December 31, 2015. The following table shows operating lease placement, termination, and return volumes for this segment for the years ended December 31 (in thousands, except for percentages):
2015 | 2014 | 2013 | ||||||
Placements (a) | 461 | 408 | 365 | |||||
Terminations (b) | 273 | 261 | 174 | |||||
Returns (c) | 187 | 193 | 117 | |||||
Memo: | ||||||||
Return rates | 68 | % | 74 | % | 67 | % | ||
__________
(a) | Placement volume measures the number of leases we purchase in a given period. |
(b) | Termination volume measures the number of vehicles for which the lease has ended in a given period. |
(c) | Return volume reflects the number of vehicles returned to us by customers at lease end. |
In 2015, placement volume was up about 53,000 units compared with 2014, primarily reflecting changes in Ford’s marketing programs. Termination volume increased by about 12,000 units compared with 2014, reflecting higher lease placements relative to prior years. Return volume decreased about 6,000 units compared with 2014, reflecting lower return rates.
33
Item 7. Management’s Discussion and Analysis of Financial Condition and Results of Operations (Continued)
U.S. Ford- and Lincoln-Brand Operating Lease Experience
The following charts show annual return volume and auction values at incurred vehicle mix for vehicles returned in the respective periods. In 2015, Ford Credit’s U.S. lease originations represented 22% of total U.S. retail sales of Ford- and Lincoln-brand vehicles, and the U.S. operating lease portfolio accounted for 89% of our total net investment in operating leases at December 31, 2015.
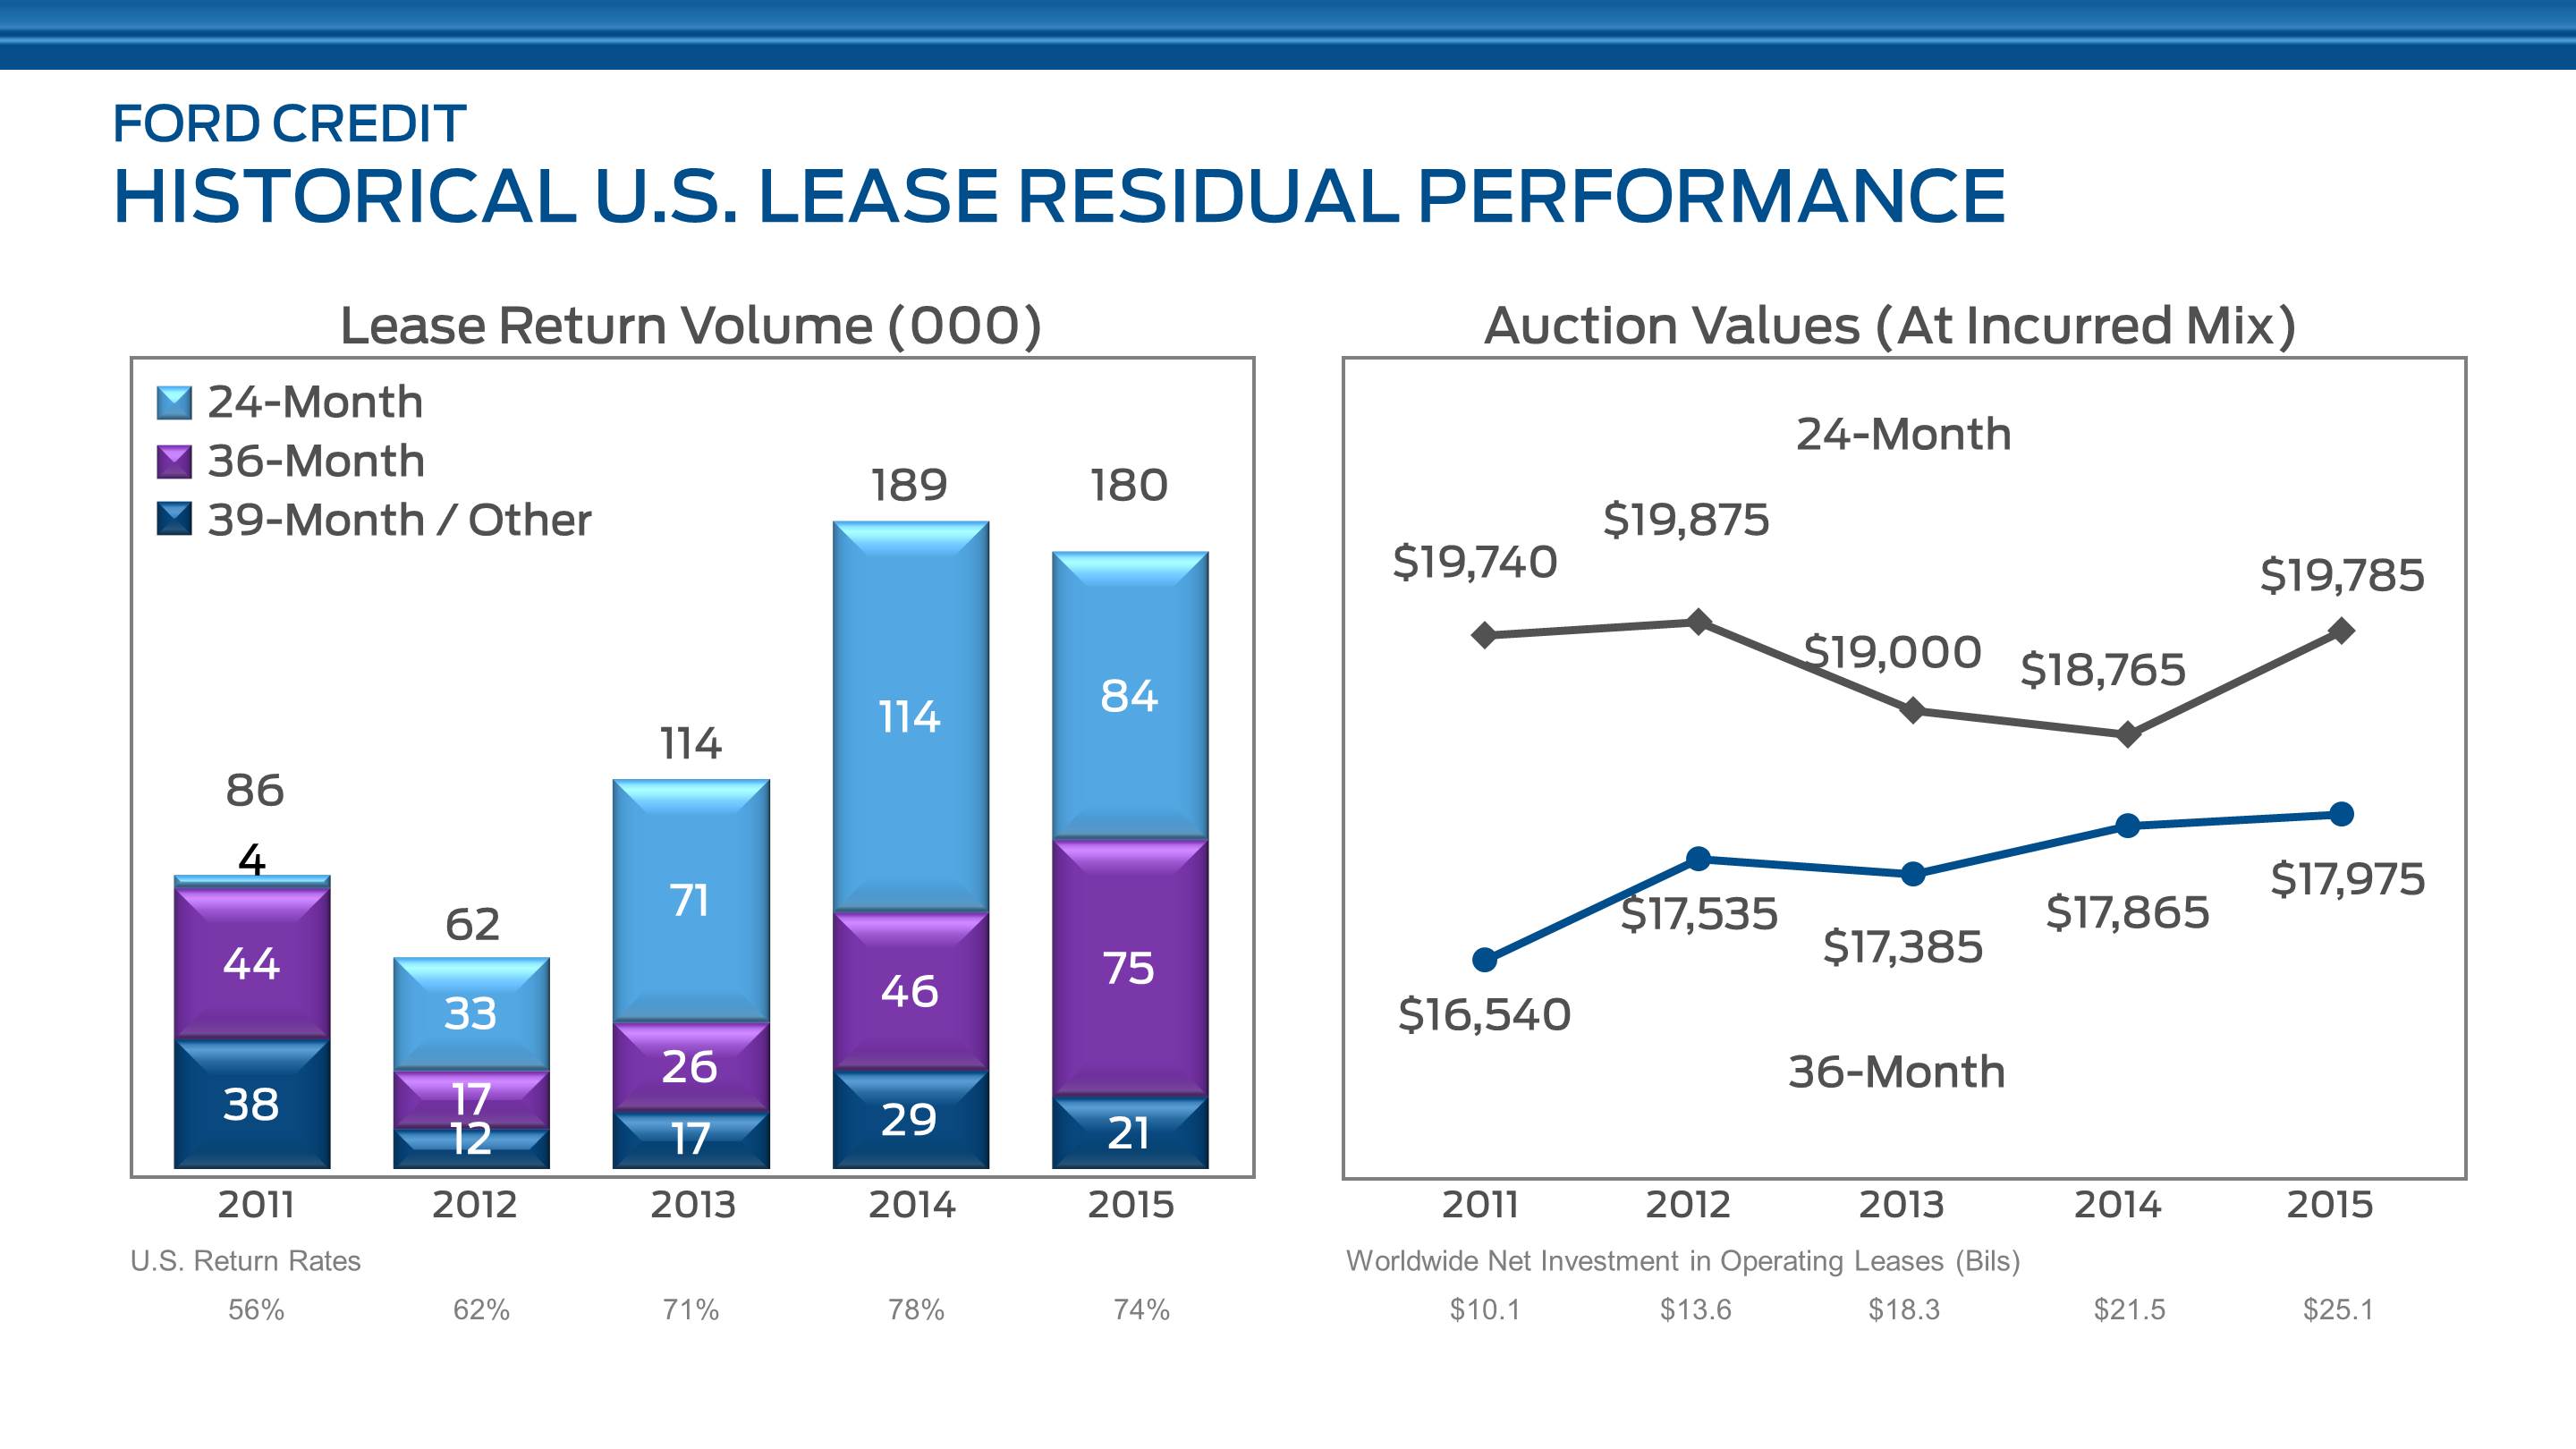
Lease return volume and return rates in 2015 were lower than 2014. The return rate decreased reflecting primarily a larger mix of 36-month placements, which typically have a lower return rate.
In 2015, our auction values were up from 2014 consistent with the industry.
Our worldwide net investment in operating leases was $25.1 billion at the end of 2015, up from $21.5 billion in 2014.
34
Item 7. Management’s Discussion and Analysis of Financial Condition and Results of Operations (Continued)
Credit Ratings
Our short-term and long-term debt is rated by four credit rating agencies designated as nationally recognized statistical rating organizations (“NRSROs”) by the U.S. Securities and Exchange Commission:
• | DBRS Limited (“DBRS”); |
• | Fitch, Inc. (“Fitch”); |
• | Moody’s Investors Service, Inc. (“Moody’s”); and |
• | Standard & Poor’s Ratings Services, a division of McGraw Hill Financial (“S&P”). |
In several markets, locally recognized rating agencies also rate us. A credit rating reflects an assessment by the rating agency of the credit risk associated with a corporate entity or particular securities issued by that entity. Rating agencies’ ratings of us are based on information provided by us and other sources. Credit ratings assigned to us from all of the NRSROs are closely associated with their opinions on Ford. Credit ratings are not recommendations to buy, sell, or hold securities and are subject to revision or withdrawal at any time by the assigning rating agency. Each rating agency may have different criteria for evaluating company risk and, therefore, ratings should be evaluated independently for each rating agency.
The following rating actions have been taken by these NRSROs since the filing of our Quarterly Report on Form 10-Q for the quarter ended September 30, 2015:
• | On November 23, 2015, S&P affirmed its ratings for Ford Credit, and revised the outlook to positive from stable. |
The following chart summarizes certain of the credit ratings and outlook presently assigned by these four NRSROs:
NRSRO RATINGS | |||||||||||||||
Ford Credit | NRSROs | ||||||||||||||
Long-Term Senior Unsecured | Short -Term Unsecured | Outlook/Trend | Minimum Long-Term Investment Grade Rating | ||||||||||||
DBRS | BBB (low) | R-3 | Positive | BBB (low) | |||||||||||
Fitch | BBB- | F3 | Positive | BBB- | |||||||||||
Moody’s | Baa3 | P-3 | Stable | Baa3 | |||||||||||
S&P (a) | BBB- | A-3 | Positive | BBB- | |||||||||||
__________
(a) | S&P assigns FCE Bank plc (“FCE”) a long-term senior unsecured credit rating of BBB, a one-notch higher rating than Ford Credit, with a stable outlook. |
35
Item 7. Management’s Discussion and Analysis of Financial Condition and Results of Operations (Continued)
Funding and Liquidity
Overview
Our primary funding and liquidity objective is to maintain a strong investment grade balance sheet with adequate liquidity to support our financing activities and growth under a variety of market conditions, including short-term and long-term market disruptions.
Our funding strategy remains focused on diversification, and we plan to continue accessing a variety of markets, channels, and investors.
Our liquidity profile continues to be diverse, robust, and focused on maintaining liquidity levels that meet our business and funding requirements. We regularly stress test our balance sheet and liquidity to ensure that we continue to meet our financial obligations through economic cycles.
Funding Sources
Our funding sources include primarily unsecured debt and securitization transactions (including other structured financings). We issue both short-term and long-term debt that is held by both institutional and retail investors, with long-term debt having an original maturity of more than 12 months.
We sponsor a number of securitization programs that can be structured to provide both short-term and long-term funding through institutional investors in the United States and international capital markets. For additional information on our securitization transactions, refer to the “Securitization Transactions” section below.
We obtain short-term unsecured funding from the sale of floating rate demand notes under our Ford Interest Advantage program and by issuing unsecured commercial paper in the United States and other international markets. At December 31, 2015, the principal amount outstanding of Ford Interest Advantage notes, which may be redeemed at any time at the option of the holders thereof without restriction, was $5.9 billion. At December 31, 2015, the principal amount outstanding of our unsecured commercial paper was $1.7 billion, which primarily represents issuance under our commercial paper program in the United States.
We maintain multiple sources of readily available liquidity to fund the payment of our unsecured short-term debt obligations.
Cost of Funding Sources
The cost of securitization transactions and unsecured debt funding is based on a margin or spread over a benchmark interest rate. Spreads are typically measured in basis points. Our asset-backed funding and unsecured long-term debt costs are based on spreads over U.S. Treasury securities of similar maturities, a comparable London Interbank Offered Rate (“LIBOR”), or other comparable benchmark rates. The funding costs of our floating rate demand notes change depending on market conditions.
During 2015, the weighted average spread of the triple-A rated notes offered in our U.S. public retail securitization transactions ranged from 22 to 43 basis points over the relevant benchmark rates and our U.S. institutional unsecured long-term debt transaction spreads ranged from 63 to 185 basis points over the relevant benchmark rates.
36
Item 7. Management’s Discussion and Analysis of Financial Condition and Results of Operations (Continued)
Public Term Funding Plan
The following table shows our planned issuances for full-year 2016, and our global public term funding issuances in 2015, 2014, and 2013 (in billions), excluding short-term funding programs:
Public Term Funding Plan | |||||||||||||||
2016 Forecast | 2015 | 2014 | 2013 | ||||||||||||
Unsecured | $ | 14 | -18 | $ | 17 | $ | 13 | $ | 11 | ||||||
Securitizations (a) | 12 | -15 | 13 | 15 | 14 | ||||||||||
Total | $ | 26 | -33 | $ | 30 | $ | 28 | $ | 25 | ||||||
__________
(a) | Includes Rule 144A offerings. |
In 2015, we completed $30 billion of public term funding in the United States, Canada, Europe, Mexico, China, and Australia including $17 billion of unsecured debt and $13 billion of securitizations.
For 2016, we project full-year public term funding in the range of $26 billion to $33 billion, consisting of $14 billion to $18 billion of unsecured debt and $12 billion to $15 billion of public securitizations.
Funding Portfolio
The following chart shows the trends in funding for our managed receivables:
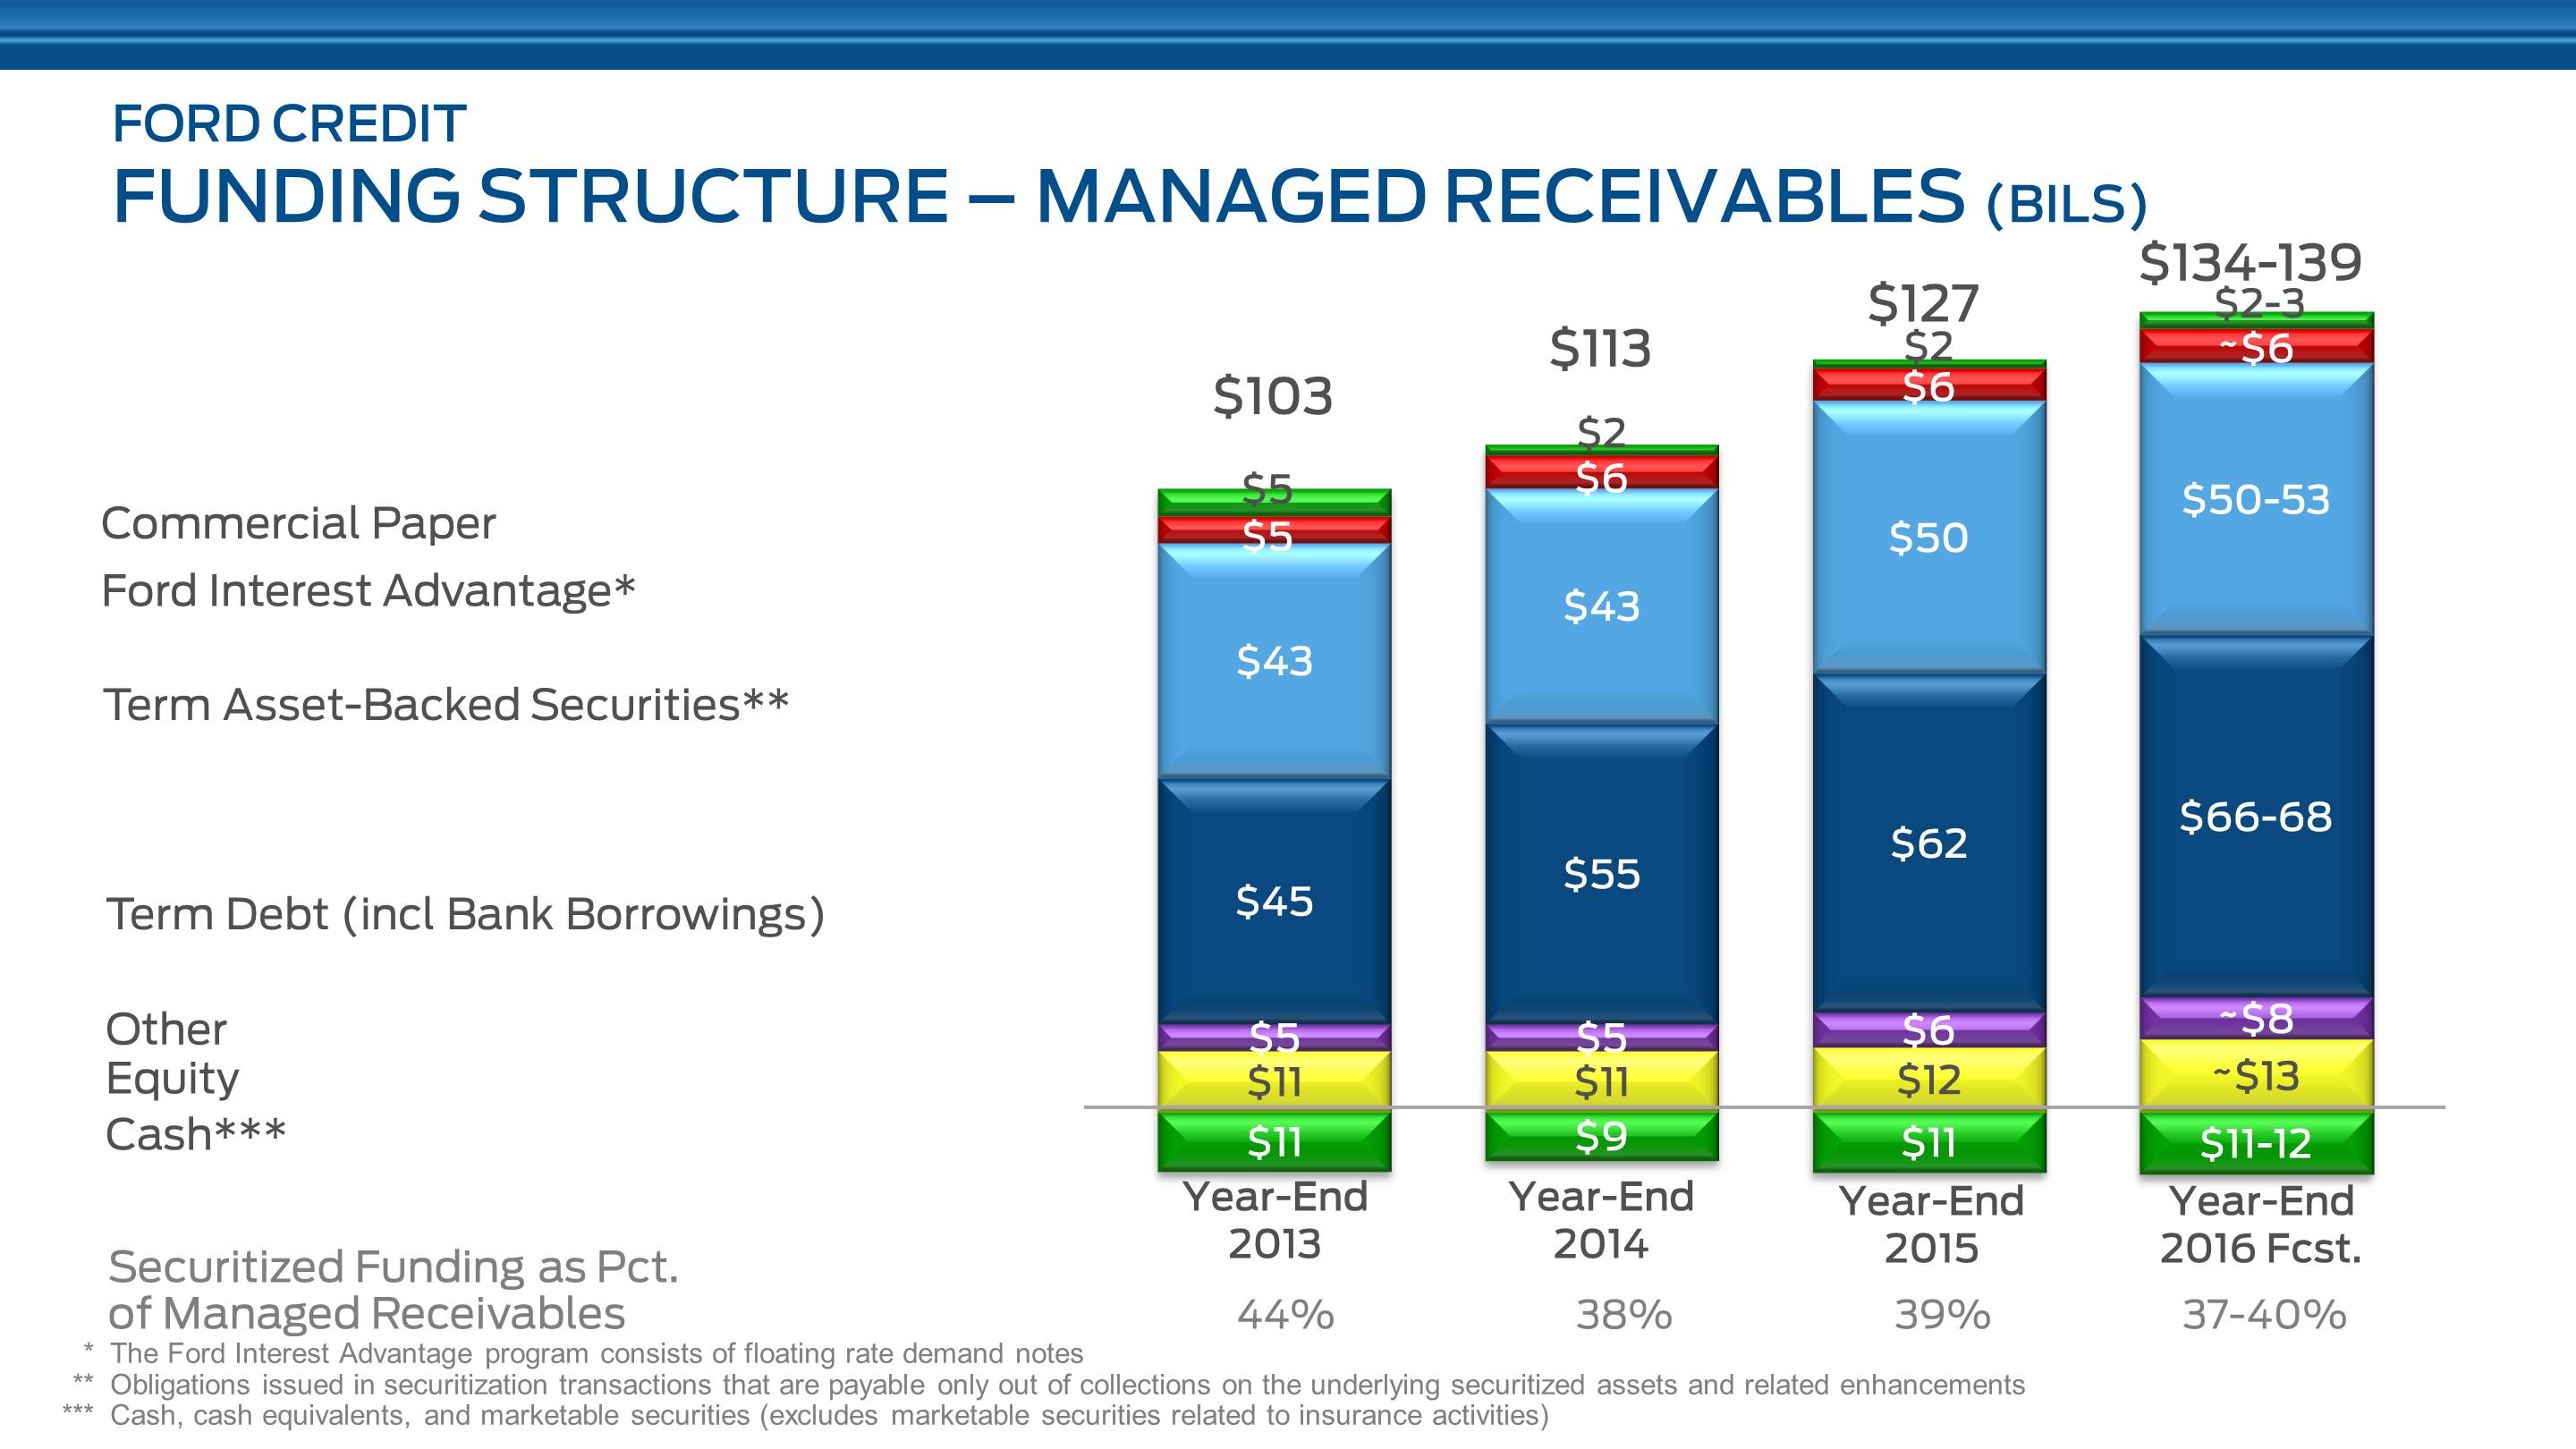
At year-end 2015, managed receivables were $127 billion, and we ended the year with $11 billion in cash. Securitized funding was 39% of managed receivables.
We are projecting 2016 year-end managed receivables of $134 billion to $139 billion and securitized funding as a percent of managed receivables to be between 37% and 40%. We expect this percentage to decline over time; quarterly and annual movements reflect the calendarization of the funding plan.
37
Item 7. Management’s Discussion and Analysis of Financial Condition and Results of Operations (Continued)
Liquidity Sources
We define gross liquidity as cash, cash equivalents, and marketable securities (excluding marketable securities related to insurance activities) and committed capacity (which includes our credit and asset-backed facilities and bank lines), less utilization of liquidity. Utilization of liquidity is the amount funded under our liquidity sources and also includes the cash and cash equivalents required to support securitization transactions. Securitization cash is cash held for the benefit of the securitization investors (for example, a reserve fund). Net liquidity available for use is defined as gross liquidity less certain adjustments for asset-backed capacity in excess of eligible receivables and cash related to the Ford Credit Revolving Extended Variable-utilization program (“FordREV”), which can be accessed through future sales of receivables. While not included in available liquidity, these adjustments represent additional funding sources for future originations.
The following table shows our liquidity sources and utilization at December 31 (in billions):
2015 | 2014 | 2013 | ||||||||||
Liquidity Sources | ||||||||||||
Cash (a) | $ | 11.2 | $ | 8.9 | $ | 10.8 | ||||||
Committed ABS facilities (b) | 33.2 | 33.7 | 29.4 | |||||||||
FCAR bank lines | — | — | 3.5 | |||||||||
FCE/Other unsecured credit facilities | 2.3 | 1.6 | 1.6 | |||||||||
Ford revolving credit facility allocation | 3.0 | 2.0 | — | |||||||||
Total liquidity sources | 49.7 | 46.2 | 45.3 | |||||||||
Utilization of Liquidity | ||||||||||||
Securitization cash (c) | (4.3 | ) | (2.4 | ) | (4.4 | ) | ||||||
Committed ABS facilities | (20.6 | ) | (15.3 | ) | (14.7 | ) | ||||||
FCAR bank lines | — | — | (3.3 | ) | ||||||||
FCE/Other unsecured credit facilities | (0.8 | ) | (0.4 | ) | (0.4 | ) | ||||||
Ford revolving credit facility allocation | — | — | — | |||||||||
Total utilization of liquidity | (25.7 | ) | (18.1 | ) | (22.8 | ) | ||||||
Gross liquidity | 24.0 | 28.1 | 22.5 | |||||||||
Adjustments (d) | (0.5 | ) | (1.6 | ) | (1.1 | ) | ||||||
Net liquidity available for use | $ | 23.5 | $ | 26.5 | $ | 21.4 | ||||||
__________
(a) | Cash, cash equivalents, and marketable securities (excludes marketable securities related to insurance activities). |
(b) | Committed asset-backed security (“ABS”) facilities are subject to availability of sufficient assets, ability to obtain derivatives to manage interest rate risk, and exclude FCE access to the Bank of England’s Discount Window Facility. |
(c) | Used only to support on-balance sheet securitization transactions. |
(d) | Adjustments include other committed ABS facilities in excess of eligible receivables and certain cash within FordREV available through future sales of receivables. |
At December 31, 2015, we had total liquidity sources of $49.7 billion compared with total liquidity sources of $46.2 billion at December 31, 2014. Our liquidity sources of committed capacity and cash are diversified across a variety of markets and platforms. The utilization of our liquidity totaled $25.7 billion at year-end 2015, compared with $18.1 billion at year-end 2014. The increase of $7.6 billion reflects higher securitization cash and usage of our committed ABS facilities.
We ended 2015 with gross liquidity of $24 billion. After adjustments totaling $0.5 billion, total liquidity available for use continues to remain strong at $23.5 billion at year-end 2015, $3 billion lower than year-end 2014.
38
Item 7. Management’s Discussion and Analysis of Financial Condition and Results of Operations (Continued)
Cash, Cash Equivalents, and Marketable Securities. At December 31, 2015, our cash, cash equivalents, and marketable securities (excluding marketable securities related to insurance activities) totaled $11.2 billion, compared with $8.9 billion at year-end 2014. In the normal course of our funding activities, we may generate more proceeds than are required for our immediate funding needs. These excess amounts are held primarily in highly liquid investments, which provide liquidity for our anticipated and unanticipated cash needs and give us flexibility in the use of our other funding programs. Our cash, cash equivalents, and marketable securities (excluding marketable securities related to insurance activities) primarily include U.S. Treasury obligations, federal agency securities, bank time deposits with investment-grade institutions and non-U.S. central banks, corporate investment-grade securities, A-1/P-1 (or higher) rated commercial paper, debt obligations of a select group of non-U.S. governments, non-U.S. government agencies, supranational institutions, and money market funds that carry the highest possible ratings.
The maturity of these investments ranges from about 90 days to up to about one year and is adjusted based on market conditions and liquidity needs. We monitor our cash levels and average maturity on a daily basis. Cash, cash equivalents, and marketable securities include amounts to be used only to support our securitization transactions of $4.3 billion and $2.4 billion at December 31, 2015 and 2014, respectively.
Committed Capacity. At December 31, 2015, our committed capacity totaled $38.5 billion, compared with $37.3 billion at December 31, 2014. Our committed capacity is primarily composed of committed ABS facilities from bank-sponsored commercial paper conduits and other financial institutions, unsecured credit facilities with financial institutions, and allocated commitments under Ford’s revolving credit facility (as defined below).
Committed Asset-Backed Facilities. We and our subsidiaries have entered into agreements with a number of bank-sponsored asset-backed commercial paper conduits and other financial institutions. Such counterparties are contractually committed, at our option, to purchase from us eligible retail receivables or to purchase or make advances under asset-backed securities backed by retail or wholesale finance receivables or operating leases for proceeds of up to $33.2 billion ($17.6 billion of retail financing, $6.7 billion of wholesale financing, and $8.9 billion of operating leases) at December 31, 2015. These committed facilities have varying maturity dates, with $16.2 billion having maturities within the next twelve months and the remaining balance having maturities through 2017. We plan capacity renewals to protect our global funding needs, optimize capacity utilization, and maintain sufficient liquidity.
Our ability to obtain funding under these facilities is subject to having a sufficient amount of eligible assets as well as our ability to obtain interest rate hedging arrangements for certain facilities. Our capacity in excess of eligible receivables protects us against the risk of lower than planned renewal rates. At December 31, 2015, $20.6 billion of these commitments were in use. These programs are free of material adverse change clauses, restrictive financial covenants (for example, debt-to-equity limitations and minimum net worth requirements), and generally, credit rating triggers that could limit our ability to obtain funding. However, the unused portion of these commitments may be terminated if the performance of the underlying assets deteriorates beyond specified levels. Based on our experience and knowledge as servicer of the related assets, we do not expect any of these programs to be terminated due to such events.
Effective June 2015, FCE has pre-positioned retail receivables with the Bank of England which supports access to the Discount Window Facility. Pre-positioned assets are neither pledged to nor held as collateral by the Bank of England unless the Discount Window Facility is accessed. FCE’s eligibility to access the Discount Window Facility is not reflected in the Liquidity Sources and Utilization table above.
Unsecured Credit Facilities. At December 31, 2015, we and our majority-owned subsidiaries had $5.3 billion of contractually committed unsecured credit facilities with financial institutions, including the FCE Credit Agreement (as defined below) and the allocation under Ford’s revolving credit facility (as defined below). At December 31, 2015, $4.5 billion was available for use.
FCE’s £830 million (equivalent to $1.2 billion at December 31, 2015) syndicated credit facility (the “FCE Credit Agreement”) matures in 2018. At December 31, 2015, £380 million (equivalent to $560 million) was available for use. The FCE Credit Agreement contains certain covenants, including an obligation for FCE to maintain its ratio of regulatory capital to risk-weighted assets at no less than the applicable regulatory minimum, and for the support agreement between FCE and Ford Credit to remain in full force and effect (and enforced by FCE to ensure that its net worth is maintained at no less than $500 million). In addition to customary payment, representation, bankruptcy, and judgment defaults, the FCE Credit Agreement contains cross-payment and cross-acceleration defaults with respect to other debt.
39
Item 7. Management’s Discussion and Analysis of Financial Condition and Results of Operations (Continued)
Lenders under Ford’s Third Amended and Restated Credit Agreement dated as of April 30, 2015 and as further amended (“Ford’s revolving credit facility”) have commitments totaling $13.4 billion, with about 75% of the commitments maturing on April 30, 2020 and about 25% of the commitments maturing on April 30, 2018. Ford has allocated $3.0 billion of these commitments, including commitments under a Chinese renminbi sub-facility, to us on an irrevocable and exclusive basis to support our growth and liquidity. At December 31, 2015, all $3.0 billion was available for use.
Funding and Liquidity Risks
Our funding plan is subject to risks and uncertainties, many of which are beyond our control, including disruption in the capital markets that could impact both unsecured debt and asset-backed securities issuance and the effects of regulatory changes on the financial markets.
Despite our diverse sources of funding and liquidity, our ability to maintain liquidity may be affected by the following factors (not necessarily listed in order of importance or probability of occurrence):
• | Prolonged disruption of the debt and securitization markets; |
• | Global capital market volatility; |
• | Market capacity for Ford- and Ford Credit-sponsored investments; |
• | General demand for the type of securities we offer; |
• | Our ability to continue funding through asset-backed financing structures; |
• | Performance of the underlying assets within our asset-backed financing structures; |
• | Inability to obtain hedging instruments; |
• | Accounting and regulatory changes; |
• | Our ability to maintain credit facilities and committed asset-backed facilities; and |
• | Credit ratings assigned to us. |
Stress Tests
We regularly conduct stress testing on our funding and liquidity sources to ensure we can continue to meet our financial obligations and support the sale of Ford vehicles during firm-specific and market-wide stress events. Stress tests are intended to quantify the potential impact of various adverse scenarios on the balance sheet and liquidity. These scenarios include assumptions on access to unsecured and secured debt markets, runoff of short-term funding, and ability to renew expiring liquidity commitments and are measured over various time periods, including 30 days, 90 days, and longer term. We target a sufficient amount and composition of liquidity to withstand such stresses. Our stress test does not assume any additional funding, liquidity, or capital support from Ford. We routinely develop contingency funding plans as part of our liquidity stress testing.
40
Item 7. Management’s Discussion and Analysis of Financial Condition and Results of Operations (Continued)
Balance Sheet Liquidity Profile
We define our balance sheet liquidity profile as the cumulative maturities, including the impact of prepayments, of our finance receivables, investment in operating leases, and cash, less the cumulative debt maturities over upcoming annual periods. Our balance sheet is inherently liquid because of the short-term nature of our finance receivables, investment in operating leases, and cash. We ensure our cumulative debt maturities have a longer tenor than our cumulative asset maturities. This positive maturity profile is intended to provide additional liquidity after all assets have been funded and is in addition to our liquidity stress test.
The following chart shows our cumulative maturities for the periods presented at December 31, 2015:

Maturities of investment in operating leases consist primarily of the portion of rental payments attributable to depreciation over the remaining life of the lease and the expected residual value at lease termination. For additional information on maturities of finance receivables and debt, see Notes 2 and 9 of our Notes to the Financial Statements. Maturities of finance receivables and investment in operating leases in the chart above include expected prepayments for our retail installment sale contracts and investment in operating leases. The 2016 finance receivables maturities in the chart above also include all of the wholesale receivables maturities that are otherwise shown in Note 2 as extending beyond 2016. The chart above also reflects the following adjustments to debt maturities in Note 9 to match all of the asset-backed debt maturities with the underlying asset maturities:
• | The 2016 maturities include all of the wholesale securitization transactions, even if the maturities extend beyond 2016; and |
• | Retail securitization transactions under certain committed asset-backed facilities are assumed to amortize immediately rather than amortizing after the expiration of the commitment period. |
41
Item 7. Management’s Discussion and Analysis of Financial Condition and Results of Operations (Continued)
Securitization Transactions
Overview
We securitize finance receivables and net investment in operating leases through a variety of programs using amortizing, variable funding, and revolving structures. We also sell finance receivables in structured financing transactions. Due to the similarities between securitization and structured financing, we refer to structured financings as securitization transactions. Our securitization programs are targeted to institutional investors in both public and private transactions. We completed our first securitization transaction in 1988, and participate in a number of securitization markets including the United States, Canada, several European countries, Mexico, and China.
Our securitization transactions involve sales to consolidated entities or we maintain control over the assets. As a result, the securitized assets and related debt remain on our balance sheet and affect our financial condition, operating results, and liquidity. New programs and new transaction structures typically require substantial development time before coming to market.
Securitization provides us with a lower cost source of funding compared with unsecured debt and it diversifies our funding among different markets and investors. In the United States, we are able to obtain funding within two days for our unutilized capacity in some of our committed asset-backed facilities.
Use of Special Purpose Entities
In a securitization transaction, the securitized assets are generally held by a bankruptcy-remote special purpose entity (“SPE”) in order to isolate the securitized assets from the claims of our creditors and ensure that the cash flows on the securitized assets are available for the benefit of securitization investors. Payments to securitization investors are made from cash flows on the securitized assets and any enhancements in the SPE, and not by Ford Credit and are not based on our creditworthiness. Senior asset-backed securities issued by the SPEs generally receive the highest credit ratings from the rating agencies that rate them.
Securitization SPEs have limited purposes and generally are only permitted to purchase the securitized assets, issue asset-backed securities, and make payments on the securities. Some SPEs, such as certain trusts that issue securities backed by retail installment sale contracts, only issue a single series of securities and are dissolved when those securities have been paid in full. Other SPEs, such as the trusts that issue securities backed by wholesale receivables, issue multiple series of securities from time to time and are not dissolved until the last series of securities is paid in full.
Our use of SPEs in our securitization transactions is consistent with conventional practices in the consumer asset-backed securitization industry. We sponsor the SPEs used in all of our securitization programs with the exception of bank-sponsored conduits. None of our officers, directors, or employees holds any equity interests in our SPEs or receives any direct or indirect compensation from the SPEs. These SPEs do not own our Shares or shares of any of our affiliates.
Selection of Assets, Enhancements, and Retained Interests
In order to be eligible for inclusion in a securitization transaction, each asset must satisfy certain eligibility criteria designed for the specific transaction. For example, for securitization transactions of retail installment sale contracts, the selection criteria may be based on factors such as location of the obligor, contract term, payment schedule, interest rate, financing program, the type of financed vehicle, and whether the contracts are active and in good standing (e.g., when the obligor is not more than 30-days delinquent or bankrupt). It is our preferred practice to satisfy the applicable eligibility criteria by randomly selecting the assets to be included in a particular securitization from our entire portfolio of assets. However, there may be circumstances in which regulatory or rating agency requirements compel us to intentionally select certain assets.
42
Item 7. Management’s Discussion and Analysis of Financial Condition and Results of Operations (Continued)
We provide various forms of credit and payment enhancements to increase the likelihood of receipt by securitization investors of the full amount of interest and principal due on their asset-backed securities. Credit enhancements include (i) over-collateralization (when the principal amount of the securitized assets exceeds the principal amount of related asset-backed securities), (ii) segregated cash reserve funds, (iii) subordinated securities, (iv) excess spread (when interest collections on the securitized assets exceed the related fees and expenses, including interest payments on the related asset-backed securities), and (v) accelerated payments where all excess spread and all principal collections from the receivables are used to repay the asset-backed securities until such securities are repaid in full or a target over-collateralization amount is attained. Payment enhancements include interest rate swaps and other hedging arrangements, liquidity facilities, and certain cash deposits.
We retain interests in our securitization transactions, including subordinated securities issued by the SPE, rights to cash held for the benefit of the securitization investors, and residual interests. Residual interests represent the right to receive collections on the securitized assets in excess of amounts needed to pay securitization investors and to pay other transaction participants and expenses. We retain credit risk in securitization transactions because our retained interests include the most subordinated interests in the securitized assets and are structured to absorb expected credit losses on the securitized assets before any losses would be experienced by investors. Based on past experience, we expect that any losses in the pool of securitized assets would likely be limited to our retained interests. Our retention of credit risk may be legally required in certain jurisdictions.
Our Continuing Obligations
We are engaged as servicer to service the securitized assets and securitization transactions. Our servicing duties include collecting payments on the securitized assets, preparing monthly investor reports on the performance of the securitized assets and the securitization transaction, and facilitating payments to securitization investors. While servicing securitized assets, we apply the same servicing policies and procedures that we apply to our owned assets and maintain our normal relationship with our financing customers.
We generally have no obligation to repurchase or replace any securitized asset that subsequently becomes delinquent in payment or otherwise is in default. However, as the seller and servicer of the securitized assets and as the administrator of the securitization SPE, we are obligated to provide certain kinds of support to our securitization transactions, which are customary in the securitization industry. These obligations include performing administrative duties for the SPE and some transaction parties, indemnifications, repurchase obligations on assets that do not meet representations or warranties on eligibility criteria or that have been materially modified, the mandatory sale of additional assets in some revolving transactions, the payment or reimbursement of transaction party expenses and, in some cases, servicer advances of certain amounts. Securitization investors have no recourse to us or our other assets and have no right to require us to repurchase the investments. We generally have no obligation to provide liquidity or contribute cash or additional assets to our SPEs either due to the performance of the securitized assets or the credit rating of our short-term or long-term debt. We do not guarantee any asset-backed securities. We may be required to support the performance of certain securitization transactions, however, by increasing cash reserves.
Under new regulations for public offerings of asset-backed securities that came into effect in November 2015, we have additional obligations in the securitization transactions subject to these regulations to report certain information, including investor requests to communicate with other investors, ensure the engagement of an independent asset representations reviewer, cooperate and provide access to information necessary for an asset representations review and participate in dispute resolution proceedings for unresolved asset repurchase requests.
43
Item 7. Management’s Discussion and Analysis of Financial Condition and Results of Operations (Continued)
Structural Features Under Certain Securitization Programs
The following securitization programs contain structural features that could prevent us from using these sources of funding in certain circumstances:
• | Retail Committed Syndicated Facility. Since October 2013, we have maintained a syndicated liquidity facility requiring the committed lenders to purchase rated, floating-rate asset-backed securities backed by retail installment sale contracts originated in the United States. If the over-collateralization and segregated cash reserve fund balance for any outstanding asset-backed security under this facility decreases below a specified level, each committed lender has the option to terminate its commitment. |
• | Revolving Retail Program. Asset-backed securities under the FordREV program may be supported by a combination of a revolving pool of U.S. retail receivables and cash collateral. Cash generated by the receivables during the revolving period in excess of what is needed to pay certain expenses of the trust and interest on the notes may be used to purchase additional receivables provided that certain tests are met after the purchase. The revolving period ends upon the occurrence of certain events that include if credit losses or delinquencies on the pool of assets supporting the securities exceed specified levels, if certain segregated account balances are below their required levels, and if interest is not paid on the securities. |
• | Retail Committed Facilities. If credit losses or delinquencies on a pool of assets held by a facility exceeds specified levels, or if the level of over-collateralization or credit enhancements for that pool decreases below a specified level, we will not have the right to sell additional pools of assets to that facility. |
• | Wholesale Program. If the payment rates on wholesale receivables in the securitization trust are lower than specified levels or if there are significant dealer defaults, we will be unable to obtain additional funding and any existing funding would begin to amortize. |
• | Lease Facility Program. If credit losses or delinquencies in our portfolio of retail lease contracts exceed specified levels, we will be unable to obtain additional funding from the securitization of retail lease contracts through our committed lease facilities. |
44
Item 7. Management’s Discussion and Analysis of Financial Condition and Results of Operations (Continued)
On-Balance Sheet Arrangements
Our securitization transactions involve sales to consolidated entities or we maintain control over the assets and, therefore, the securitized assets and related debt remain on our balance sheet. The securitized assets are available only for payment of the debt issued by, and other obligations of, the securitization entities that are parties to those securitization transactions. They are not available to pay our other obligations or the claims of our other creditors. We hold the right to receive the excess cash flows not needed to pay the debt issued by, and other obligations of, the securitization entities that are parties to those securitization transactions. This debt is the obligation of our consolidated securitization entities and not the obligation of Ford Credit or our other subsidiaries. For additional information on our on-balance sheet arrangements, see Note 5 of our Notes to the Financial Statements.
The following table shows worldwide cash and cash equivalents, receivables, and related debt by segment and product for our on-balance sheet securitization transactions at December 31 (in billions):
2015 | 2014 | ||||||||||||||||||||||
Cash and Cash Equivalents | Finance Receivables and Net Investment in Operating Leases (a) | Related Debt (b) | Cash and Cash Equivalents | Finance Receivables and Net Investment in Operating Leases (a) | Related Debt | ||||||||||||||||||
Finance Receivables | |||||||||||||||||||||||
North America Segment | |||||||||||||||||||||||
Retail financing | $ | 1.4 | $ | 22.4 | $ | 20.7 | $ | 1.3 | $ | 19.6 | $ | 18.6 | |||||||||||
Wholesale financing | 2.0 | 22.0 | 13.8 | 0.2 | 18.3 | 12.0 | |||||||||||||||||
Total North America Segment | 3.4 | 44.4 | 34.5 | 1.5 | 37.9 | 30.6 | |||||||||||||||||
International Segment | |||||||||||||||||||||||
Retail financing | 0.4 | 5.2 | 4.3 | 0.4 | 4.8 | 3.9 | |||||||||||||||||
Wholesale financing | — | 4.1 | 2.3 | 0.1 | 3.5 | 2.2 | |||||||||||||||||
Total International Segment | 0.4 | 9.3 | 6.6 | 0.5 | 8.3 | 6.1 | |||||||||||||||||
Total finance receivables | 3.8 | 53.7 | 41.1 | 2.0 | 46.2 | 36.7 | |||||||||||||||||
Net investment in operating leases | 0.5 | 13.3 | 8.9 | 0.4 | 9.6 | 6.6 | |||||||||||||||||
Total on-balance sheet arrangements | $ | 4.3 | $ | 67.0 | $ | 50.0 | $ | 2.4 | $ | 55.8 | $ | 43.3 | |||||||||||
__________
(a) | Before allowances for credit losses. Unearned interest supplements and residual support are excluded from securitization transactions. |
(b) | Includes unamortized discount and debt issuance costs. |
45
Item 7. Management’s Discussion and Analysis of Financial Condition and Results of Operations (Continued)
Leverage
We use leverage, or the debt-to-equity ratio, to make various business decisions, including evaluating and establishing pricing for finance receivable and operating lease financing, and assessing our capital structure. We refer to our shareholder’s interest as equity.
The following table shows the calculation of our financial statement leverage at December 31 (in billions, except for ratios):
2015 | 2014 | 2013 | |||||||||
Total debt (a) | $ | 119.6 | $ | 105.0 | $ | 98.7 | |||||
Equity | 11.7 | 11.4 | 10.6 | ||||||||
Financial statement leverage (to 1) | 10.2 | 9.2 | 9.3 | ||||||||
__________
(a) | Includes debt issued in securitization transactions and payable only out of collections on the underlying securitized assets and related enhancements. We hold the right to receive the excess cash flows not needed to pay the debt issued by, and other obligations of, the securitization entities that are parties to those securitization transactions. |
The following table shows the calculation of our managed leverage at December 31 (in billions, except for ratios):
2015 | 2014 | 2013 | |||||||||
Total debt (a) | $ | 119.6 | $ | 105.0 | $ | 98.7 | |||||
Adjustments for cash (b) | (11.2 | ) | (8.9 | ) | (10.8 | ) | |||||
Adjustments for derivative accounting (c) | (0.5 | ) | (0.4 | ) | (0.2 | ) | |||||
Total adjusted debt | $ | 107.9 | $ | 95.7 | $ | 87.7 | |||||
Equity | $ | 11.7 | $ | 11.4 | $ | 10.6 | |||||
Adjustments for derivative accounting (c) | (0.3 | ) | (0.4 | ) | (0.3 | ) | |||||
Total adjusted equity | $ | 11.4 | $ | 11.0 | $ | 10.3 | |||||
Managed leverage (to 1) (d) | 9.5 | 8.7 | 8.5 | ||||||||
__________
(a) | Includes debt issued in securitization transactions and payable only out of collections on the underlying securitized assets and related enhancements. We hold the right to receive the excess cash flows not needed to pay the debt issued by, and other obligations of, the securitization entities that are parties to those securitization transactions. |
(b) | Cash, cash equivalents, and marketable securities (excludes marketable securities related to insurance activities). |
(c) | Primarily related to market valuation adjustments to derivatives due to movements in interest rates. Adjustments to debt are related to designated fair value hedges and adjustments to equity are related to retained earnings. |
(d) | Equals total adjusted debt over total adjusted equity. |
We believe that managed leverage is useful to our investors because it reflects the way we manage our business. We deduct cash, cash equivalents, and marketable securities (excluding marketable securities related to insurance activities) because they generally correspond to excess debt beyond the amount required to support our operations and amounts to support on-balance sheet securitization transactions. We make derivative accounting adjustments to our assets, debt, and equity positions to reflect the impact of interest rate instruments we use in connection with our term-debt issuances and securitization transactions. The derivative accounting adjustments related to these instruments vary over the term of the underlying debt and securitized funding obligations based on changes in market interest rates. We generally repay our debt obligations as they mature. As a result, we exclude the impact of these derivative accounting adjustments on both the numerator and denominator in order to exclude the interim effects of changes in market interest rates. For additional information on our use of interest rate instruments and other derivatives, refer to Item 7A.
We plan our managed leverage by considering prevailing market conditions and the risk characteristics of our business. At December 31, 2015, our managed leverage was 9.5:1, compared with 8.7:1 at December 31, 2014, reflecting the strength of the U.S. dollar and year-end receivables at the top end of the forecasted range. In 2016, we expect managed leverage to return to the upper-end of the targeted range of 8:1 to 9:1. In 2015, we paid $250 million in distributions to our parent, Ford Holdings LLC. For information on our planned distributions, refer to the “Outlook” section below. For information regarding income taxes paid to Ford or our deferred tax assets and liabilities, see Notes 8 and 10 of our Notes to the Financial Statements.
46
Item 7. Management’s Discussion and Analysis of Financial Condition and Results of Operations (Continued)
Aggregate Contractual Obligations
We are party to certain contractual obligations involving commitments to make payments to others. Most of these are debt obligations, which are recorded on our balance sheet and disclosed in our Notes to the Financial Statements. Long-term debt may have fixed or variable interest rates. For long-term debt with variable rate interest, we estimate the future interest payments based on projected market interest rates for various floating rate benchmarks received from third parties. In addition, we may enter into contracts with suppliers for purchases of certain services, including operating lease commitments. These arrangements may contain minimum levels of service requirements. Our aggregate contractual obligations at December 31, 2015 are shown below (in millions):
Payments Due by Period | |||||||||||||||||||
2016 | 2017 - 2018 | 2019 - 2020 | 2021 and Thereafter | Total | |||||||||||||||
Long-term debt (a) | $ | 29,109 | $ | 45,540 | $ | 20,374 | $ | 12,148 | $ | 107,171 | |||||||||
Interest payments relating to long-term debt | 2,360 | 3,089 | 1,666 | 976 | 8,091 | ||||||||||||||
Operating lease | 19 | 26 | 11 | 7 | 63 | ||||||||||||||
Purchase obligations | 15 | 16 | — | — | 31 | ||||||||||||||
Total | $ | 31,503 | $ | 48,671 | $ | 22,051 | $ | 13,131 | $ | 115,356 | |||||||||
__________
(a) | Excludes unamortized discounts, unamortized issuance costs, and fair value adjustments. |
Liabilities recognized for unrecognized tax benefits of $91 million are excluded from the table above. Due to the high degree of uncertainty regarding the timing of future cash flows associated with income tax liabilities, we are unable to make a reasonably reliable estimate of the amount and period of payment. For additional information on income taxes, see Note 10 of our Notes to the Financial Statements.
For additional information on our long-term debt and operating lease obligations, see Notes 9 and 18, respectively, of our Notes to the Financial Statements.
Critical Accounting Estimates
We consider an accounting estimate to be critical if 1) the accounting estimate requires us to make assumptions about matters that were highly uncertain at the time the accounting estimate was made; and 2) changes in the estimate that are reasonably likely to occur from period to period, or use of different estimates that we reasonably could have used in the current period, would have a material impact on our financial condition or results of operations.
The accounting estimates that are most important to our business involve:
• | Allowance for credit losses; and |
• | Accumulated depreciation on vehicles subject to operating leases. |
Management has discussed the development and selection of these critical accounting estimates with Ford’s and our audit committees, and these audit committees have reviewed these estimates and disclosures.
Allowance for Credit Losses
The allowance for credit losses represents our estimate of the probable credit loss inherent in finance receivables and operating leases as of the balance sheet date. The adequacy of the allowance for credit losses is assessed quarterly and the assumptions and models used in establishing the allowance are evaluated regularly. Because credit losses can vary substantially over time, estimating credit losses requires a number of assumptions about matters that are uncertain. For additional information regarding our allowance for credit losses, see Note 4 of our Notes to the Financial Statements.
Nature of Estimates Required. We estimate the probable credit losses inherent in finance receivables and operating leases based on several factors.
47
Item 7. Management’s Discussion and Analysis of Financial Condition and Results of Operations (Continued)
Consumer Segment. We estimate the allowance for credit losses on consumer receivables and on operating leases using a combination of measurement models and management judgment. The models consider factors such as historical trends in credit losses and recoveries (including key metrics such as delinquencies, repossessions, and bankruptcies), the composition of the present portfolio (including vehicle brand, term, risk evaluation, and new/used vehicles), trends in historical used vehicle values, and economic conditions. Estimates from these models rely on historical information and may not fully reflect losses inherent in the present portfolio. Therefore, we may adjust the estimate to reflect management judgment regarding observable changes in recent economic trends and conditions, portfolio composition, and other relevant factors.
Assumptions Used. Our allowance for credit losses is based on our assumption regarding:
• | Frequency. The number of finance receivables and operating lease contracts that are expected to default over the loss emergence period, measured as repossessions; and |
• | Loss severity. The expected difference between the amount a customer owes when the finance contract is charged off and the amount received, net of expenses, from selling the repossessed vehicle, including any recoveries from the customer. |
Collective Allowance for Credit Losses. The collective allowance is evaluated primarily using a collective LTR model that, based on historical experience, indicates credit losses have been incurred in the portfolio even though the particular accounts that are uncollectible cannot be specifically identified. The LTR model is based on the most recent years of history. Each LTR is calculated by dividing credit losses by average finance receivables or average operating leases, excluding unearned interest supplements and allowance for credit losses. An average LTR is calculated for each product and multiplied by the end-of-period balances for that given product.
Our largest markets also use a loss projection model to estimate losses inherent in the portfolio. The loss projection model applies recent monthly performance metrics, stratified by contract type (retail or lease), contract term (e.g., 60-month), and risk rating to our active portfolio to estimate the losses that have been incurred.
The loss emergence period (“LEP”) is a key assumption within our models and represents the average amount of time between when a loss event first occurs to when it is charged off. This time period starts when the consumer begins to experience financial difficulty. It is evidenced, typically through delinquency, before eventually resulting in a charge-off. The LEP is a multiplier in the calculation of the collective consumer allowance for credit losses.
For accounts greater than 120 days past due, the uncollectible portion is charged off, such that the remaining recorded investment is equal to the estimated fair value of the collateral less costs to sell.
Specific Allowance for Impaired Receivables. Consumer receivables involved in Troubled Debt Restructurings are specifically assessed for impairment. A specific allowance is estimated based on the present value of the expected future cash flows of the receivable discounted at the contract’s original effective interest rate or the fair value of any collateral adjusted for estimated costs to sell.
After establishing the collective and specific allowance for credit losses, if management believes the allowance does not reflect all losses inherent in the portfolio due to changes in recent economic trends and conditions, or other relevant factors, an adjustment is made based on management judgment.
Sensitivity Analysis. Changes in the assumptions used to derive frequency and severity would affect the allowance for credit losses. The effect of the indicated increase/decrease in the assumptions for our U.S. Ford- and Lincoln-brand retail financing and operating lease portfolio is as follows (in millions, except for percentages):
Increase/(Decrease) | ||||||
Assumption | Percentage Point Change | December 31, 2015 Allowance for Credit Losses | 2016 Expense | |||
Repossession ratios (a) | +/- 0.1 pt. | $37 / $(37) | $37 / $(37) | |||
Loss severity | +/- 1.0 | 4 / (4) | 4 / (4) | |||
__________
(a) | Reflects the number of finance receivables and operating lease contracts that we expect will default over a period of time relative to the average number of contracts outstanding. |
48
Item 7. Management’s Discussion and Analysis of Financial Condition and Results of Operations (Continued)
Non-Consumer Segment. We estimate the allowance for credit losses for non-consumer receivables based on historical LTR ratios, expected future cash flows, and the fair value of collateral.
Collective Allowance for Credit Losses. We estimate an allowance for non-consumer receivables that are not specifically identified as impaired using a LTR model for each financing product based on historical experience. This LTR is an average of the most recent historical experience and is calculated consistent with the consumer receivables LTR approach. All accounts that are specifically identified as impaired are excluded from the calculation of the non-specific or collective allowance.
Specific Allowance for Impaired Receivables. Dealer financing is evaluated by segmenting individual loans by the risk characteristics of the loan (such as the amount of the loan, the nature of the collateral, and the financial status of the debtor). The loans are analyzed to determine whether individual loans are impaired, and a specific allowance is estimated based on the present value of the expected future cash flows of the receivable discounted at the loan’s original effective interest rate or the fair value of the collateral adjusted for estimated costs to sell.
After establishing the collective and specific allowance for credit losses, if management believes the allowance does not reflect all losses inherent in the portfolio due to changes in recent economic trends and conditions, or other relevant factors, an adjustment is made based on management judgment.
Changes in our assumptions affect the Provision for credit losses on our income statement and the allowance for credit losses contained within Finance receivables, net and Net investment in operating leases on our balance sheet.
Accumulated Depreciation on Vehicles Subject to Operating Leases
Accumulated depreciation on vehicles subject to operating leases reduces the value of the leased vehicles in our operating lease portfolio from their original acquisition value to their expected residual value at the end of the lease term. For additional information on net investment in operating leases, including the amount of accumulated depreciation, see Note 3 of our Notes to the Financial Statements.
We monitor residual values each month, and we review the adequacy of our accumulated depreciation on a quarterly basis. If we believe that the expected residual values for our vehicles have changed, we revise depreciation to ensure that our net investment in operating leases (equal to our acquisition value of the vehicles less accumulated depreciation) will be adjusted to reflect our revised estimate of the expected residual value at the end of the lease term. Such adjustments to depreciation expense would result in a change in the depreciation rates of the vehicles subject to operating leases and are recorded prospectively on a straight-line basis.
Each lease customer has the option to buy the leased vehicle at the end of the lease or to return the vehicle to the dealer. For additional information on our residual risk on operating leases, refer to the “Residual Risk” section above.
Nature of Estimates Required. Each operating lease in our portfolio represents a vehicle we own that has been leased to a customer. At the time we purchase a lease, we establish an expected residual value for the vehicle. We estimate the expected residual value by evaluating recent auction values, return volumes for our leased vehicles, industrywide used vehicle prices, marketing incentive plans, and vehicle quality data.
Assumptions Used. Our accumulated depreciation on vehicles subject to operating leases is based on our assumptions regarding:
•Auction value. Our projection of the market value of the vehicles when sold at the end of the lease; and
•Return volumes. Our projection of the number of vehicles that will be returned at lease end.
49
Item 7. Management’s Discussion and Analysis of Financial Condition and Results of Operations (Continued)
Sensitivity Analysis. For returned vehicles, we face a risk that the amount we obtain from the vehicle sold at auction will be less than our estimate of the expected residual value for the vehicle. The effect of the indicated increase/decrease in the assumptions for our U.S. Ford- and Lincoln-brand operating lease portfolio is as follows (in millions, except for percentages):
Increase/(Decrease) | ||||||
Assumption | Percentage Change | December 31, 2015 Accumulated Depreciation on Vehicles Subject to Operating Leases | 2016 Expense | |||
Future auction values | +/- 1.0 | $(101) / $101 | $(35) / $35 | |||
Return volumes | +/- 1.0 | 13 / (13) | 6 / (6) | |||
The impact of the increased accumulated supplemental depreciation in 2015 would be charged to expense in the 2016 - 2019 periods. Adjustments to the amount of accumulated depreciation on operating leases would be reflected on our balance sheet as Net investment in operating leases and on the income statement in Depreciation on vehicles subject to operating leases.
Accounting Standards Issued But Not Yet Adopted
The Financial Accounting Standards Board (“FASB”) has issued the following standards, most of which are not expected to have a material impact (with the exception of standard 2014-09) to our financial statements or financial statement disclosures. We are currently assessing the potential impact of standard 2016-01.
Standard | Effective Date (a) | ||
2015-16 | Business Combinations - Simplifying the Accounting for Measurement-Period Adjustments | January 1, 2016 | |
2015-09 | Insurance - Disclosures about Short-Duration Contracts | January 1, 2016 | |
2015-05 | Internal-Use Software - Customer’s Accounting for Fees Paid in a Cloud Computing Arrangement | January 1, 2016 | |
2015-02 | Consolidation - Amendments to the Consolidation Analysis | January 1, 2016 | |
2015-01 | Extraordinary and Unusual Items - Simplifying Income Statement Presentation by Eliminating the Concept of Extraordinary Items | January 1, 2016 | |
2014-16 | Derivatives and Hedging - Determining Whether the Host Contract in a Hybrid Financial Instrument Issued in the Form of a Share Is More Akin to Debt or to Equity | January 1, 2016 | |
2014-13 | Consolidation - Measuring the Financial Assets and the Financial Liabilities of a Consolidated Collateralized Financing Entity | January 1, 2016 | |
2014-12 | Stock Compensation - Accounting for Share-Based Payments When the Terms of an Award Provide That a Performance Target Could Be Achieved after the Requisite Service Period | January 1, 2016 | |
2014-15 | Going Concern - Disclosure of Uncertainties about an Entity’s Ability to Continue as a Going Concern | December 31, 2016 | |
2015-17 | Income Taxes - Balance Sheet Classification of Deferred Taxes | January 1, 2017 | |
2016-01 | Financial Instruments - Recognition and Measurement of Financial Assets and Financial Liabilities | January 1, 2018 (b) | |
2014-09 | Revenue - Revenue from Contracts with Customers | January 1, 2018 (b) | |
__________
(a) | Early adoption for each of the standards, except standard 2016-01, is permitted. |
(b) | For additional information see Note 1 of our Notes to the Financial Statements. |
Outlook
For 2016, we expect full year pre-tax profit to be equal to or higher than 2015 and year-end managed receivables of $134 billion to $139 billion. We expect managed leverage to return to the upper-end of the targeted range of 8:1 to 9:1. Distributions will be dependent upon leverage which is affected by numerous factors including receivable balance, net income, and exchange.
50
Item 7. Management’s Discussion and Analysis of Financial Condition and Results of Operations (Continued)
Risk Factors
Statements included or incorporated by reference herein may constitute “forward-looking statements” within the meaning of the Private Securities Litigation Reform Act of 1995. Forward-looking statements are based on expectations, forecasts, and assumptions by our management and involve a number of risks, uncertainties, and other factors that could cause actual results to differ materially from those stated, including, without limitation:
• | Decline in industry sales volume, particularly in the United States, Europe, or China, due to financial crisis, recession, geopolitical events, or other factors; |
• | Decline in Ford’s market share or failure to achieve growth; |
• | Lower-than-anticipated market acceptance of Ford’s new or existing products or services; |
• | Market shift away from sales of larger, more profitable vehicles beyond Ford’s current planning assumption, particularly in the United States; |
• | An increase in or continued volatility of fuel prices, or reduced availability of fuel; |
• | Continued or increased price competition resulting from industry excess capacity, currency fluctuations, or other factors; |
• | Fluctuations in foreign currency exchange rates, commodity prices, and interest rates; |
• | Adverse effects resulting from economic, geopolitical, or other events; |
• | Economic distress of suppliers that may require Ford to provide substantial financial support or take other measures to ensure supplies of components or materials and could increase costs, affect liquidity, or cause production constraints or disruptions; |
• | Work stoppages at Ford or supplier facilities or other limitations on production (whether as a result of labor disputes, natural or man-made disasters, tight credit markets or other financial distress, production constraints or difficulties, or other factors); |
• | Single-source supply of components or materials; |
• | Labor or other constraints on Ford’s ability to maintain competitive cost structure; |
• | Substantial pension and postretirement health care and life insurance liabilities impairing liquidity or financial condition; |
• | Worse-than-assumed economic and demographic experience for postretirement benefit plans (e.g., discount rates or investment returns); |
• | Restriction on use of tax attributes from tax law “ownership change;” |
• | The discovery of defects in vehicles resulting in delays in new model launches, recall campaigns, or increased warranty costs; |
• | Increased safety, emissions, fuel economy, or other regulations resulting in higher costs, cash expenditures, and/or sales restrictions; |
• | Unusual or significant litigation, governmental investigations, or adverse publicity arising out of alleged defects in products, perceived environmental impacts, or otherwise; |
• | A change in requirements under long-term supply arrangements committing Ford to purchase minimum or fixed quantities of certain parts, or to pay a minimum amount to the seller (“take-or-pay” contracts); |
• | Adverse effects on results from a decrease in or cessation or clawback of government incentives related to investments; |
• | Inherent limitations of internal controls impacting financial statements and safeguarding of assets; |
• | Cybersecurity risks to operational systems, security systems, or infrastructure owned by Ford, Ford Credit, or a third-party vendor or supplier; |
• | Failure of financial institutions to fulfill commitments under committed credit and liquidity facilities; |
• | Inability of Ford Credit to access debt, securitization, or derivative markets around the world at competitive rates or in sufficient amounts, due to credit rating downgrades, market volatility, market disruption, regulatory requirements, or other factors; |
• | Higher-than-expected credit losses, lower-than-anticipated residual values, or higher-than-expected return volumes for leased vehicles; |
• | Increased competition from banks, financial institutions, or other third parties seeking to increase their share of financing Ford vehicles; and |
• | New or increased credit regulations, consumer or data protection regulations, or other regulations resulting in higher costs and/or additional financing restrictions. |
We cannot be certain that any expectation, forecast, or assumption made in preparing forward-looking statements will prove accurate, or that any projection will be realized. It is to be expected that there may be differences between projected and actual results. Our forward-looking statements speak only as of the date of their initial issuance, and we do not undertake any obligation to update or revise publicly any forward-looking statement, whether as a result of new information, future events, or otherwise. For additional discussion, see “Item 1A. Risk Factors” above.
51
ITEM 7A. Quantitative and Qualitative Disclosures About Market Risk.
Overview
We are exposed to a variety of risks in the normal course of our business. Our financial condition depends on the extent to which we effectively identify, assess, monitor, and manage these risks. The principal types of risk to our business include:
• | Market risk - the possibility that changes in interest and currency exchange rates will adversely affect our cash flow and economic value; |
• | Counterparty risk - the possibility that a counterparty may default on a derivative contract or investment; |
• | Credit risk - the possibility of loss from a customer’s failure to make payments according to contract terms; |
• | Residual risk - the possibility that the actual proceeds we receive at lease termination will be lower than our projections or return volumes will be higher than our projections; |
• | Liquidity risk - the possibility that we may be unable to meet all of our current and future obligations in a timely manner; and |
• | Operating risk - the possibility of errors relating to transaction processing and systems, actions that could result in compliance deficiencies with regulatory standards or contractual obligations, and the possibility of fraud by our employees or outside persons. |
We manage each of these types of risk in the context of its contribution to our overall global risk. We make business decisions on a risk-adjusted basis and price our services consistent with these risks.
Credit, residual, and liquidity risks are discussed in Items 1 and 7. A discussion of market risk (including currency and interest rate risk), counterparty risk, and operating risk follows.
Market Risk
Given the unpredictability of financial markets, we seek to reduce volatility in our cash flow and economic value from changes in interest rates and currency exchange rates. We use various financial instruments, commonly referred to as derivatives, to manage market risks. We do not engage in any trading, market-making, or other speculative activities in the derivative markets.
Our strategies to manage market risks are approved by our Asset Liability Committee (“ALCO”) and the Ford Global Risk Management Committee (“GRMC”). The ALCO is co-chaired by our Chief Financial Officer and the Treasurer of Ford. The GRMC is chaired by the Chief Financial Officer of Ford.
The Ford Treasurer’s Office is responsible for the execution of our market risk management strategies. These strategies are governed by written policies and procedures. Separation of duties is maintained between the strategy and approval of derivatives trades, the execution of derivatives trades, and the settlement of cash flows. Regular audits are conducted to ensure that appropriate controls are in place and that these controls are effective. In addition, the ALCO, GRMC, Ford’s Audit Committee, and Ford Credit’s Board of Directors review our market risk exposures and use of derivatives to manage these exposures.
Interest Rate Risk
Nature of Exposure. Generally, our assets and the related debt have different re-pricing periods, and consequently, respond differently to changes in interest rates.
Our assets consist primarily of fixed-rate retail installment sale and operating lease contracts and floating-rate wholesale receivables. Fixed-rate retail installment sale and operating lease contracts generally require customers to make equal monthly payments over the life of the contract. Wholesale receivables are originated to finance new and used vehicles held in dealers’ inventory and generally require dealers to pay a floating rate.
52
Item 7A. Quantitative and Qualitative Disclosures About Market Risk (Continued)
Debt consists primarily of short-term and long-term unsecured debt and securitization. In the case of unsecured term debt, to support our positive maturity profile, we may borrow at terms longer than the terms of our assets, in most instances with maturities up to ten years. These debt instruments are principally fixed-rate and require fixed and equal interest payments over the life of the instrument and a single principal payment at maturity.
Risk Management. Our interest rate risk management objective is to reduce volatility in our cash flows and volatility in our economic value from changes in interest rates based on an established risk tolerance that may vary by market. We use economic value sensitivity analysis and re-pricing gap analysis to evaluate potential long-term effects of changes in interest rates. We then enter into interest rate swaps to convert portions of our floating-rate debt to fixed or our fixed-rate debt to floating to ensure that our exposure falls within the established tolerances. We also use pre-tax cash flow sensitivity analysis to monitor the level of near-term cash flow exposure. The pre-tax cash flow sensitivity analysis measures the changes in expected cash flows associated with our interest-rate-sensitive assets, liabilities, and derivative financial instruments from hypothetical changes in interest rates over a twelve-month horizon. The ALCO reviews the re-pricing mismatch and exposure every month and approves interest rate swaps required to maintain exposure within approved thresholds prior to execution.
Quantitative Disclosure. To provide a quantitative measure of the sensitivity of our pre-tax cash flow to changes in interest rates, we use interest rate scenarios that assume a hypothetical, instantaneous increase or decrease of one percentage point in all interest rates across all maturities (a “parallel shift”), as well as a base case that assumes that all interest rates remain constant at existing levels. In reality, interest rate changes are rarely instantaneous or parallel and rates could move more or less than the one percentage point assumed in our analysis. As a result, the actual impact to pre-tax cash flow could be higher or lower than the results detailed in the table below. These interest rate scenarios are purely hypothetical and do not represent our view of future interest rate movements.
Under these interest rate scenarios, we expect more assets than debt and liabilities to re-price in the next twelve months. Other things being equal, this means that during a period of rising interest rates, the interest earned on our assets will increase more than the interest paid on our debt, thereby initially increasing our pre-tax cash flow. During a period of falling interest rates, we would expect our pre-tax cash flow to initially decrease. Our pre-tax cash flow sensitivity to interest rate movement is highlighted in the table below.
Our pre-tax cash flow sensitivity at December 31 was as follows (in millions):
Pre-Tax Cash Flow Sensitivity (given a one percentage point instantaneous increase in interest rates) | Pre-Tax Cash Flow Sensitivity (given a one percentage point instantaneous decrease in interest rates) (a) | ||||
December 31, 2015 | $7 | $(7) | |||
December 31, 2014 | (46) | 46 | |||
___________
(a) | Pre-tax cash flow sensitivity given a one percentage point decrease in interest rates requires an assumption of negative interest rates in markets where existing interest rates are below one percent. |
Additional Model Assumptions. While the sensitivity analysis presented is our best estimate of the impacts of the specified assumed interest rate scenarios, our actual results could differ from those projected. The model we use to conduct this analysis is heavily dependent on assumptions. Embedded in the model are assumptions regarding the reinvestment of maturing asset principal, refinancing of maturing debt, replacement of maturing derivatives, exercise of options embedded in debt and derivatives, and predicted repayment of retail installment sale and lease contracts ahead of contractual maturity. Our repayment projections ahead of contractual maturity are based on historical experience. If interest rates or other factors change, our actual prepayment experience could be different than projected.
53
Item 7A. Quantitative and Qualitative Disclosures About Market Risk (Continued)
Currency Exchange Rate Risk
Our policy is to minimize exposure to changes in currency exchange rates. To meet funding objectives, we borrow in a variety of currencies, principally U.S. dollars, Canadian dollars, Euros, Pound Sterling, and Renminbi. We face exposure to currency exchange rates if a mismatch exists between the currency of our receivables and the currency of the debt funding those receivables. When possible, we fund receivables with debt in the same currency, minimizing exposure to exchange rate movements. When a different currency is used, we may use foreign currency swaps and foreign currency forwards to convert substantially all of our foreign currency debt obligations to the local country currency of the receivables. As a result of this policy, we believe our market risk exposure relating to changes in currency exchange rates at December 31, 2015 is insignificant. For additional information on our derivatives, see Note 7 of our Notes to the Financial Statements.
Derivative Notional Values. The outstanding notional value of our derivatives at December 31 was as follows (in billions):
2015 | 2014 | ||||||
Interest rate derivatives | |||||||
Pay-fixed, receive-floating, excluding securitization swaps | $ | 20 | $ | 15 | |||
Pay-floating, receive-fixed, excluding securitization swaps | 40 | 36 | |||||
Securitization swaps | 31 | 29 | |||||
Total interest rate derivatives | 91 | 80 | |||||
Other derivatives | |||||||
Cross-currency swaps | 3 | 2 | |||||
Foreign currency forwards | 2 | 2 | |||||
Total notional value | $ | 96 | $ | 84 | |||
Derivative Fair Values. Net fair value of Ford Credit’s derivative financial instruments at December 31, 2015 was an asset of $681 million, compared to an asset of $692 million at December 31, 2014. For additional information regarding our derivatives, see Note 7 of our Notes to the Financial Statements.
Counterparty Risk
Counterparty risk relates to the loss we could incur if an obligor or counterparty defaulted on an investment or a derivative contract. We enter into master agreements with counterparties that allow netting of certain exposures in order to manage this risk. Exposures primarily relate to investments in fixed income instruments and derivative contracts used for managing interest rate and foreign currency exchange rate risk. We, together with Ford, establish exposure limits for each counterparty to minimize risk and provide counterparty diversification.
Our approach to managing counterparty risk is forward-looking and proactive, allowing us to take risk mitigation actions before risks become losses. Exposure limits are established based on our overall risk tolerance and estimated loss projections, which are calculated from ratings-based historical default probabilities and market-based credit default swap (CDS) spreads. The exposure limits are lower for lower-rated counterparties, counterparties that have relatively higher CDS spreads, and for longer-dated exposures. Our exposures are monitored on a regular basis and are included in periodic reports to Ford’s Treasurer and our Chief Financial Officer.
Substantially all of our counterparty exposures are with counterparties that have an investment grade rating. Investment grade is our guideline for counterparty minimum long-term ratings. For additional information on our derivatives, see Note 7 of our Notes to the Financial Statements.
54
Item 7A. Quantitative and Qualitative Disclosures About Market Risk (Continued)
Operating Risk
We operate in many locations and rely on the abilities of our employees and computer systems to process a large number of transactions. Improper employee actions, improper operation of systems, or unforeseen business interruptions could result in financial loss, regulatory action and damage to our reputation, and breach of contractual obligations. To address this risk, we maintain internal control processes that identify transaction authorization requirements, safeguard assets from misuse or theft, protect the reliability of financial and other data, and minimize the impact of a business interruption on our customers. We also maintain system controls to maintain the accuracy of information about our operations. These controls are designed to manage operating risk throughout our operation.
ITEM 8. Financial Statements and Supplementary Data.
Our Consolidated Financial Statements, the accompanying Notes, and the Report of Independent Registered Public Accounting Firm that are filed as part of this Report are listed under “Item 15. Exhibits and Financial Statement Schedules” and are set forth beginning on page FC-1 immediately following the signature pages of this Report.
Selected quarterly financial data for 2015 and 2014 are provided in Note 17 of our Notes to the Financial Statements.
ITEM 9. Changes in and Disagreements with Accountants on Accounting and Financial Disclosure.
None.
55
ITEM 9A. Controls and Procedures.
Evaluation of Disclosure Controls and Procedures. Bernard B. Silverstone, our Chairman of the Board and Chief Executive Officer (“CEO”), and Marion B. Harris, our Chief Financial Officer (“CFO”) and Treasurer, have performed an evaluation of the Company’s disclosure controls and procedures, as that term is defined in Rule 13a-15(e) of the Securities Exchange Act of 1934, as amended (the “Exchange Act”), as of December 31, 2015, and each has concluded that such disclosure controls and procedures are effective to ensure that information required to be disclosed in our periodic reports filed under the Exchange Act is recorded, processed, summarized, and reported within the time periods specified by SEC rules and forms, and that such information is accumulated and communicated to the CEO and CFO to allow timely decisions regarding required disclosures.
Management’s Report on Internal Control Over Financial Reporting. Our management is responsible for establishing and maintaining adequate internal control over financial reporting, as such term is defined in Exchange Act Rule 13a-15(f). The Company’s internal control over financial reporting is a process designed to provide reasonable assurance regarding the reliability of financial reporting and the preparation of financial statements for external purposes in accordance with generally accepted accounting principles.
Because of its inherent limitations, internal control over financial reporting may not prevent or detect misstatements. Also, projections of any evaluation of effectiveness to future periods are subject to the risk that controls may become inadequate because of changes in conditions or because the degree of compliance with policies or procedures may deteriorate.
Under the supervision and with the participation of our management, including our CEO and CFO, we conducted an assessment of the effectiveness of our internal control over financial reporting as of December 31, 2015. The assessment was based on criteria established in the framework Internal Control - Integrated Framework (2013), issued by the Committee of Sponsoring Organizations of the Treadway Commission. Based on this assessment, management concluded that our internal control over financial reporting was effective as of December 31, 2015.
The effectiveness of the Company’s internal control over financial reporting as of December 31, 2015, has been audited by PricewaterhouseCoopers LLP (“PwC”), an independent registered public accounting firm, as stated in its report which appears herein.
Changes in Internal Control Over Financial Reporting. There were no changes in internal control over financial reporting during the fourth quarter of 2015 that have materially affected, or are reasonably likely to materially affect, our internal control over financial reporting.
ITEM 9B. Other Information.
None.
56
PART III
ITEM 10. Directors, Executive Officers and Corporate Governance.
Not required.
ITEM 11. Executive Compensation.
Not required.
ITEM 12. Security Ownership of Certain Beneficial Owners and Management and Related Shareholder Matters.
Not required.
ITEM 13. Certain Relationships and Related Transactions, and Director Independence.
Not required.
ITEM 14. Principal Accounting Fees and Services.
Our principal accounting fees and services for the years ended December 31 were as follows (in millions):
2015 | 2014 | ||||||
Nature of Services | |||||||
Audit fees - for audit of the financial statements included in our Annual Report on Form 10-K, reviews of the financial statements included in our quarterly reports on Form 10-Q, attestation of the effectiveness of the Company’s internal controls over financial reporting, preparation of statutory audit reports, and providing comfort letters in connection with our funding transactions | $ | 11.5 | $ | 11.1 | |||
Audit-related fees - for support of funding transactions, attestation services, assistance with interpretation of accounting standards, and services related to divestitures | 1.9 | 1.8 | |||||
Tax fees - for tax compliance and the preparation of tax returns, tax consultation, planning and implementation services, assistance in connection with tax audits, and tax advice related to divestitures | 0.7 | 0.7 | |||||
All other fees - for research analysis regarding new markets and strategies | — | 1.3 | |||||
Total fees | $ | 14.1 | $ | 14.9 | |||
Pre-Approval Policies and Procedures
Ford’s audit committee has established pre-approval policies and procedures that govern the engagement of PwC, and the services provided by PwC to Ford Credit are pre-approved in accordance with Ford’s policies and procedures. The policies and procedures are detailed as to the particular services and our audit committee is informed of the services provided to us by PwC, including the audit fee requests for these services that have been submitted to and approved by Ford’s audit committee. The pre-approval policies and procedures do not include delegation of the Ford or Ford Credit audit committees’ responsibilities under the Exchange Act to management.
57
PART IV
ITEM 15. Exhibits and Financial Statements Schedules.
(a) 1. Financial Statements
Report of Independent Registered Public Accounting Firm
Ford Motor Credit Company LLC and Subsidiaries
•Consolidated Income Statement for the Years Ended December 31, 2015, 2014, and 2013
•Consolidated Statement of Comprehensive Income for the Years Ended December 31, 2015, 2014, and 2013
•Consolidated Balance Sheet at December 31, 2015 and 2014
•Consolidated Statement of Shareholder’s Interest for the Years Ended December 31, 2015, 2014, and 2013
•Consolidated Statement of Cash Flows for the Years Ended December 31, 2015, 2014, and 2013
•Notes to the Financial Statements
The Report of Independent Registered Public Accounting Firm, Consolidated Financial Statements, and the Notes to the Financial Statements listed above are filed as part of this Report and are set forth beginning on page FC-1 immediately following the signature pages of this Report.
(a) 2. Consolidated Financial Statement Schedules
Schedules have been omitted because they are not applicable, the information required to be contained in them is disclosed elsewhere in the Financial Statements, or the amounts involved are not sufficient to require submission.
58
(a) 3. Exhibits
Designation | Description | Method of Filing | ||
Exhibit 3-A | Certificate of Formation of Ford Motor Credit Company LLC. | Filed as Exhibit 99.3 to Ford Motor Credit Company LLC Current Report on Form 8-K dated May 1, 2007 and incorporated herein by reference. File No. 1-6368. | ||
Exhibit 3-B | Limited Liability Company Agreement of Ford Motor Credit Company LLC dated as of April 30, 2007. | Filed as Exhibit 99.4 to Ford Motor Credit Company LLC Current Report on Form 8-K dated May 1, 2007 and incorporated herein by reference. File No. 1-6368. | ||
Exhibit 4-A | Form of Indenture dated as of February 1, 1985 between Ford Motor Credit Company and Manufacturers Hanover Trust Company relating to Unsecured Debt Securities. | Filed as Exhibit 4-A to Ford Motor Credit Company Registration Statement No. 2-95568 and incorporated herein by reference. | ||
Exhibit 4-A-1 | Form of First Supplemental Indenture dated as of April 1, 1986 between Ford Motor Credit Company and Manufacturers Hanover Trust Company supplementing the Indenture designated as Exhibit 4-A. | Filed as Exhibit 4-B to Ford Motor Credit Company Current Report on Form 8-K dated April 29, 1986 and incorporated herein by reference. File No. 1-6368. | ||
Exhibit 4-A-2 | Form of Second Supplemental Indenture dated as of September 1, 1986 between Ford Motor Credit Company and Manufacturers Hanover Trust Company supplementing the Indenture designated as Exhibit 4-A. | Filed as Exhibit 4-B to Ford Motor Credit Company Current Report on Form 8-K dated August 28, 1986 and incorporated herein by reference. File No. 1-6368. | ||
Exhibit 4-A-3 | Form of Third Supplemental Indenture dated as of March 15, 1987 between Ford Motor Credit Company and Manufacturers Hanover Trust Company supplementing the Indenture designated as Exhibit 4-A. | Filed as Exhibit 4-E to Ford Motor Credit Company Registration Statement No. 33-12928 and incorporated herein by reference. | ||
Exhibit 4-A-4 | Form of Fourth Supplemental Indenture dated as of April 15, 1988 between Ford Motor Credit Company and Manufacturers Hanover Trust Company supplementing the Indenture designated as Exhibit 4-A. | Filed as Exhibit 4-F to Post-Effective Amendment No. 1 to Ford Motor Credit Company Registration Statement No. 33-20081 and incorporated herein by reference. | ||
Exhibit 4-A-5 | Form of Fifth Supplemental Indenture dated as of September 1, 1990 between Ford Motor Credit Company and Manufacturers Hanover Trust Company supplementing the Indenture designated as Exhibit 4-A. | Filed as Exhibit 4-G to Ford Motor Credit Company Registration Statement No. 33-41060 and incorporated herein by reference. | ||
Exhibit 4-A-6 | Form of Sixth Supplemental Indenture dated as of June 1, 1998 between Ford Motor Credit Company and The Chase Manhattan Bank supplementing the Indenture designated as Exhibit 4-A. | Filed as Exhibit 4.1 to Ford Motor Credit Company Current Report on Form 8-K dated June 15, 1998 and incorporated herein by reference. File No. 1-6368. | ||
Exhibit 4-A-7 | Form of Seventh Supplemental Indenture dated as of January 15, 2002 between Ford Motor Credit Company and JPMorgan Chase Bank supplementing the Indenture designated as Exhibit 4-A. | Filed as Exhibit 4-I to Amendment No. 1 to Ford Motor Credit Company Registration Statement No. 333-75234 and incorporated herein by reference. | ||
Exhibit 4-A-8 | Form of Eighth Supplemental Indenture dated as of June 5, 2006 between Ford Motor Credit Company and JPMorgan Chase Bank N.A. supplementing the Indenture designated as Exhibit 4-A. | Filed as Exhibit 4 to Ford Motor Credit Company Current Report on Form 8-K dated May 25, 2006 and incorporated herein by reference. File No. 1-6368. | ||
Exhibit 4-A-9 | Form of Ninth Supplemental Indenture dated as of September 18, 2012 between Ford Motor Credit Company LLC and The Bank of New York Mellon supplementing the Indenture designated as Exhibit 4-A. | Filed as Exhibit 4 to Ford Motor Credit Company LLC Current Report on Form 8-K dated September 18, 2012 and incorporated herein by reference. File No. 1-6368. | ||
Exhibit 4-B | Form of Indenture dated as of March 16, 2015 between Ford Motor Credit Company LLC and The Bank of New York Mellon relating to Unsecured Debt Securities. | Filed as Exhibit 4-A to Ford Motor Credit Company LLC Registration Statement No. 333-202789 and incorporated by reference herein. | ||
Exhibit 10-A | Copy of Amended and Restated Relationship Agreement dated as of April 30, 2015 between Ford Motor Company and Ford Motor Credit Company LLC. | Filed as Exhibit 10 to Ford Motor Credit Company LLC Current Report on Form 8-K dated April 30, 2015 and incorporated herein by reference. File No. 1-6368. | ||
Exhibit 10-B | Copy of Amended and Restated Support Agreement dated as of September 20, 2004 between Ford Motor Credit Company and FCE Bank plc. | Filed as Exhibit 10 to Ford Motor Credit Company Quarterly Report on Form 10-Q for the quarter ended September 30, 2004 and incorporated herein by reference. File No. 1-6368. | ||
Exhibit 10-C | Copy of Amended and Restated Tax Sharing Agreement dated as of December 12, 2006 between Ford Motor Credit Company and Ford Motor Company. | Filed as Exhibit 10.2 to Ford Motor Credit Company Current Report on Form 8-K dated December 12, 2006 and incorporated herein by reference. File No. 1-6368. | ||
Exhibit 12 | Calculation of Ratio of Earnings to Fixed Charges. | Filed with this Report. | ||
59
Designation | Description | Method of Filing | ||
Exhibit 23 | Consent of Independent Registered Public Accounting Firm. | Filed with this Report. | ||
Exhibit 24 | Powers of Attorney. | Filed with this Report. | ||
Exhibit 31.1 | Rule 15d-14(a) Certification of CEO. | Filed with this Report. | ||
Exhibit 31.2 | Rule 15d-14(a) Certification of CFO. | Filed with this Report. | ||
Exhibit 32.1 | Section 1350 Certification of CEO. | Furnished with this Report. | ||
Exhibit 32.2 | Section 1350 Certification of CFO. | Furnished with this Report. | ||
Exhibit 99 | Parts I, II (other than Items 6 and 8) and III of Ford Motor Company’s Annual Report on Form 10-K for the year ended December 31, 2015. | Incorporated herein by reference to Ford Motor Company’s Annual Report on Form 10-K for the year ended December 31, 2015. File No. 1-3950. | ||
Exhibit 101.INS | XBRL Instance Document. | * | ||
Exhibit 101.SCH | XBRL Taxonomy Extension Schema Document. | * | ||
Exhibit 101.CAL | XBRL Taxonomy Extension Calculation Linkbase Document. | * | ||
Exhibit 101.LAB | XBRL Taxonomy Extension Label Linkbase Document. | * | ||
Exhibit 101.PRE | XBRL Taxonomy Extension Presentation Linkbase Document. | * | ||
Exhibit 101.DEF | XBRL Taxonomy Extension Definition Linkbase Document. | * | ||
__________
* | Submitted electronically with this Report in accordance with the provisions of Regulation S-T. |
Instruments defining the rights of holders of certain issues of long-term debt of Ford Credit have not been filed as exhibits to this Report because the authorized principal amount of any one of such issues does not exceed 10% of the total assets of Ford Credit. Ford Credit will furnish a copy of each such instrument to the SEC upon request.
60
SIGNATURES
Pursuant to the requirements of Section 13 or 15(d) of the Securities Exchange Act of 1934, Ford Motor Credit Company LLC has duly caused this Report to be signed on its behalf by the undersigned, thereunto duly authorized.
FORD MOTOR CREDIT COMPANY LLC
By: | /s/ Marion B. Harris |
Marion B. Harris | |
Chief Financial Officer and Treasurer | |
Date: | February 11, 2016 |
Pursuant to the requirements of the Securities Exchange Act of 1934, this Report has been signed below by the following persons on behalf of Ford Motor Credit Company LLC and in the capacities and on the dates indicated.
Signature | Title | Date | ||
BERNARD B. SILVERSTONE* | Director, Chairman of the Board and Chief Executive Officer (principal executive officer) | February 11, 2016 | ||
Bernard B. Silverstone | ||||
N. JOY FALOTICO* | Director and Chief Operating Officer | February 11, 2016 | ||
N. Joy Falotico | ||||
STUART J. ROWLEY* | Director and Audit Committee Member | February 11, 2016 | ||
Stuart J. Rowley | ||||
NEIL M. SCHLOSS* | Director and Chair of the Audit Committee | February 11, 2016 | ||
Neil M. Schloss | ||||
THOMAS C. SCHNEIDER* | Director and Executive Vice President, Chief Risk Officer | February 11, 2016 | ||
Thomas C. Schneider | ||||
MARION B. HARRIS* | Director, Chief Financial Officer and Treasurer (principal financial officer and principal accounting officer) | February 11, 2016 | ||
Marion B. Harris | ||||
* By /s/ DAVID J. WITTEN | Attorney-in-Fact | February 11, 2016 | ||
David J. Witten | ||||
61
Report of Independent Registered Public Accounting Firm
To the Board of Directors and Shareholder of
Ford Motor Credit Company LLC:
In our opinion, the accompanying consolidated balance sheets and the related consolidated statements of income, comprehensive income, shareholder’s interest and cash flows present fairly, in all material respects, the financial position of Ford Motor Credit Company LLC and its subsidiaries (the “Company”) at December 31, 2015 and December 31, 2014, and the results of their operations and their cash flows for each of the three years in the period ended December 31, 2015 in conformity with accounting principles generally accepted in the United States of America. Also in our opinion, the Company maintained, in all material respects, effective internal control over financial reporting as of December 31, 2015, based on criteria established in Internal Control - Integrated Framework (2013) issued by the Committee of Sponsoring Organizations of the Treadway Commission (COSO). The Company’s management is responsible for these financial statements, for maintaining effective internal control over financial reporting and for its assessment of the effectiveness of internal control over financial reporting, included in Management’s Report on Internal Control over Financial Reporting appearing under Item 9A. Our responsibility is to express opinions on these financial statements and on the Company’s internal control over financial reporting based on our integrated audits. We conducted our audits in accordance with the standards of the Public Company Accounting Oversight Board (United States). Those standards require that we plan and perform the audits to obtain reasonable assurance about whether the financial statements are free of material misstatement and whether effective internal control over financial reporting was maintained in all material respects. Our audits of the financial statements included examining, on a test basis, evidence supporting the amounts and disclosures in the financial statements, assessing the accounting principles used and significant estimates made by management, and evaluating the overall financial statement presentation. Our audit of internal control over financial reporting included obtaining an understanding of internal control over financial reporting, assessing the risk that a material weakness exists, and testing and evaluating the design and operating effectiveness of internal control based on the assessed risk. Our audits also included performing such other procedures as we considered necessary in the circumstances. We believe that our audits provide a reasonable basis for our opinions.
A company’s internal control over financial reporting is a process designed to provide reasonable assurance regarding the reliability of financial reporting and the preparation of financial statements for external purposes in accordance with generally accepted accounting principles. A company’s internal control over financial reporting includes those policies and procedures that (i) pertain to the maintenance of records that, in reasonable detail, accurately and fairly reflect the transactions and dispositions of the assets of the company; (ii) provide reasonable assurance that transactions are recorded as necessary to permit preparation of financial statements in accordance with generally accepted accounting principles, and that receipts and expenditures of the company are being made only in accordance with authorizations of management and directors of the company; and (iii) provide reasonable assurance regarding prevention or timely detection of unauthorized acquisition, use, or disposition of the company’s assets that could have a material effect on the financial statements.
Because of its inherent limitations, internal control over financial reporting may not prevent or detect misstatements. Also, projections of any evaluation of effectiveness to future periods are subject to the risk that controls may become inadequate because of changes in conditions, or that the degree of compliance with the policies or procedures may deteriorate.
/s/ PricewaterhouseCoopers LLP
PricewaterhouseCoopers LLP
Detroit, Michigan
February 11, 2016
FC-1
FORD MOTOR CREDIT COMPANY LLC AND SUBSIDIARIES
CONSOLIDATED INCOME STATEMENT
(in millions)
For the Years Ended December 31, | |||||||||||
2015 | 2014 | 2013 | |||||||||
Financing revenue | |||||||||||
Operating leases | $ | 4,865 | $ | 4,129 | $ | 3,409 | |||||
Retail financing | 2,819 | 2,776 | 2,785 | ||||||||
Dealer financing | 1,539 | 1,620 | 1,519 | ||||||||
Other | 57 | 81 | 92 | ||||||||
Total financing revenue | 9,280 | 8,606 | 7,805 | ||||||||
Depreciation on vehicles subject to operating leases | (3,640 | ) | (3,088 | ) | (2,397 | ) | |||||
Interest expense | (2,416 | ) | (2,656 | ) | (2,730 | ) | |||||
Net financing margin | 3,224 | 2,862 | 2,678 | ||||||||
Other revenue | |||||||||||
Insurance premiums earned (Note 12) | 133 | 125 | 119 | ||||||||
Other income, net (Note 13) | 284 | 265 | 258 | ||||||||
Total financing margin and other revenue | 3,641 | 3,252 | 3,055 | ||||||||
Expenses | |||||||||||
Operating expenses | 1,139 | 1,094 | 1,090 | ||||||||
Provision for credit losses (Note 4) | 347 | 197 | 146 | ||||||||
Insurance expenses (Note 12) | 69 | 107 | 63 | ||||||||
Total expenses | 1,555 | 1,398 | 1,299 | ||||||||
Income before income taxes | 2,086 | 1,854 | 1,756 | ||||||||
Provision for income taxes (Note 10) | 723 | 149 | 277 | ||||||||
Net income | $ | 1,363 | $ | 1,705 | $ | 1,479 | |||||
CONSOLIDATED STATEMENT OF COMPREHENSIVE INCOME
(in millions)
For the Years Ended December 31, | |||||||||||
2015 | 2014 | 2013 | |||||||||
Net income | $ | 1,363 | $ | 1,705 | $ | 1,479 | |||||
Other comprehensive income/(loss), net of tax (Note 11) | |||||||||||
Foreign currency translation | (766 | ) | (547 | ) | (86 | ) | |||||
Total other comprehensive income/(loss), net of tax | (766 | ) | (547 | ) | (86 | ) | |||||
Comprehensive income | 597 | 1,158 | 1,393 | ||||||||
Less: Comprehensive income/(loss) attributable to noncontrolling interests | 1 | — | — | ||||||||
Comprehensive income/(loss) attributable to Ford Motor Credit Company | $ | 596 | $ | 1,158 | $ | 1,393 | |||||
The accompanying notes are part of the financial statements.
FC-2
FORD MOTOR CREDIT COMPANY LLC AND SUBSIDIARIES
CONSOLIDATED BALANCE SHEET
(in millions)
December 31, 2015 | December 31, 2014 | ||||||
ASSETS | |||||||
Cash and cash equivalents | $ | 8,886 | $ | 6,179 | |||
Marketable securities | 2,723 | 3,258 | |||||
Finance receivables, net (Note 2) | 96,823 | 86,915 | |||||
Net investment in operating leases (Note 3) | 25,079 | 21,518 | |||||
Notes and accounts receivable from affiliated companies | 727 | 778 | |||||
Derivative financial instruments (Note 7) | 924 | 859 | |||||
Other assets (Note 8) | 2,286 | 2,601 | |||||
Total assets | $ | 137,448 | $ | 122,108 | |||
LIABILITIES | |||||||
Accounts payable | |||||||
Customer deposits, dealer reserves, and other | $ | 1,104 | $ | 1,148 | |||
Affiliated companies | 313 | 330 | |||||
Total accounts payable | 1,417 | 1,478 | |||||
Debt (Note 9) | 119,601 | 105,037 | |||||
Deferred income taxes | 2,808 | 1,849 | |||||
Derivative financial instruments (Note 7) | 243 | 167 | |||||
Other liabilities and deferred income (Note 8) | 1,665 | 2,210 | |||||
Total liabilities | 125,734 | 110,741 | |||||
SHAREHOLDER’S INTEREST | |||||||
Shareholder’s interest | 5,227 | 5,227 | |||||
Accumulated other comprehensive income/(loss) (Note 11) | (607 | ) | 160 | ||||
Retained earnings | 7,093 | 5,980 | |||||
Total shareholder’s interest attributable to Ford Motor Credit Company | 11,713 | 11,367 | |||||
Shareholder’s interest attributable to noncontrolling interests | 1 | — | |||||
Total shareholder’s interest | 11,714 | 11,367 | |||||
Total liabilities and shareholder’s interest | $ | 137,448 | $ | 122,108 | |||
The following table includes assets to be used to settle the liabilities of the consolidated variable interest entities (“VIEs”). These assets and liabilities are included in the consolidated balance sheet above. See Notes 5 and 6 for additional information on our VIEs.
December 31, 2015 | December 31, 2014 | ||||||
ASSETS | |||||||
Cash and cash equivalents | $ | 3,949 | $ | 2,094 | |||
Finance receivables, net | 45,902 | 39,522 | |||||
Net investment in operating leases | 13,309 | 9,631 | |||||
Derivative financial instruments | 85 | 27 | |||||
LIABILITIES | |||||||
Debt | $ | 43,086 | $ | 37,156 | |||
Derivative financial instruments | 19 | 22 | |||||
The accompanying notes are part of the financial statements.
FC-3
FORD MOTOR CREDIT COMPANY LLC AND SUBSIDIARIES
CONSOLIDATED STATEMENT OF SHAREHOLDER’S INTEREST
(in millions)
Shareholder’s Interest Attributable to Ford Motor Credit Company | ||||||||||||||||||||||||
Shareholder’s Interest | Accumulated Other Comprehensive Income/(Loss) (Note 11) | Retained Earnings | Total | Shareholder’s Interest Attributable to Non-Controlling Interests | Total Shareholder’s Interest | |||||||||||||||||||
Year Ended December 31, 2012 | $ | 5,274 | $ | 743 | $ | 3,636 | $ | 9,653 | $ | — | $ | 9,653 | ||||||||||||
Net income | — | — | 1,479 | 1,479 | — | 1,479 | ||||||||||||||||||
Other changes to shareholder’s interest | 3 | — | — | 3 | — | 3 | ||||||||||||||||||
Other comprehensive income/(loss), net of tax | (60 | ) | (26 | ) | — | (86 | ) | — | (86 | ) | ||||||||||||||
Distributions to parent | — | — | (445 | ) | (445 | ) | — | (445 | ) | |||||||||||||||
Year Ended December 31, 2013 | $ | 5,217 | $ | 717 | $ | 4,670 | $ | 10,604 | $ | — | $ | 10,604 | ||||||||||||
Net income | — | — | 1,705 | 1,705 | — | 1,705 | ||||||||||||||||||
Other comprehensive income/(loss), net of tax | 10 | (557 | ) | — | (547 | ) | — | (547 | ) | |||||||||||||||
Distributions to parent | — | — | (395 | ) | (395 | ) | — | (395 | ) | |||||||||||||||
Year Ended December 31, 2014 | $ | 5,227 | $ | 160 | $ | 5,980 | $ | 11,367 | $ | — | $ | 11,367 | ||||||||||||
Net income | — | — | 1,363 | 1,363 | — | 1,363 | ||||||||||||||||||
Other comprehensive income/(loss), net of tax | — | (767 | ) | — | (767 | ) | 1 | (766 | ) | |||||||||||||||
Distributions to parent | — | — | (250 | ) | (250 | ) | — | (250 | ) | |||||||||||||||
Year Ended December 31, 2015 | $ | 5,227 | $ | (607 | ) | $ | 7,093 | $ | 11,713 | $ | 1 | $ | 11,714 | |||||||||||
The accompanying notes are part of the financial statements.
FC-4
FORD MOTOR CREDIT COMPANY LLC AND SUBSIDIARIES
CONSOLIDATED STATEMENT OF CASH FLOWS
(in millions)
For the Years Ended December 31, | |||||||||||
2015 | 2014 | 2013 | |||||||||
Cash flows from operating activities | |||||||||||
Net income | $ | 1,363 | $ | 1,705 | $ | 1,479 | |||||
Adjustments to reconcile net income to net cash provided by operations | |||||||||||
Provision for credit losses | 347 | 197 | 146 | ||||||||
Depreciation and amortization | 4,465 | 3,955 | 3,198 | ||||||||
Amortization of upfront interest supplements | (1,078 | ) | (1,021 | ) | (993 | ) | |||||
Net change in deferred income taxes | 1,042 | 230 | (22 | ) | |||||||
Net change in other assets | 129 | 106 | (814 | ) | |||||||
Net change in other liabilities | (348 | ) | (294 | ) | 827 | ||||||
All other operating activities | (210 | ) | (63 | ) | (283 | ) | |||||
Net cash provided by/(used in) operating activities | 5,710 | 4,815 | 3,538 | ||||||||
Cash flows from investing activities | |||||||||||
Purchases of finance receivables (excluding wholesale and other) | (39,512 | ) | (35,818 | ) | (32,296 | ) | |||||
Collections of finance receivables (excluding wholesale and other) | 31,560 | 30,341 | 29,155 | ||||||||
Purchases of operating lease vehicles | (14,355 | ) | (12,694 | ) | (11,640 | ) | |||||
Liquidations of operating lease vehicles | 6,570 | 6,152 | 4,428 | ||||||||
Net change in wholesale receivables and other | (5,126 | ) | (2,189 | ) | (3,219 | ) | |||||
Net change in notes receivable from affiliated companies | (1 | ) | 29 | 302 | |||||||
Purchases of marketable securities | (12,199 | ) | (13,598 | ) | (30,317 | ) | |||||
Proceeds from sales and maturities of marketable securities | 12,704 | 12,236 | 30,448 | ||||||||
Settlements of derivatives | 210 | 34 | 65 | ||||||||
All other investing activities | 21 | 4 | (22 | ) | |||||||
Net cash provided by/(used in) investing activities | (20,128 | ) | (15,503 | ) | (13,096 | ) | |||||
Cash flows from financing activities | |||||||||||
Proceeds from issuances of long-term debt | 48,124 | 39,858 | 38,293 | ||||||||
Principal payments on long-term debt | (31,474 | ) | (27,801 | ) | (25,642 | ) | |||||
Change in short-term debt, net | 1,229 | (3,757 | ) | (2,401 | ) | ||||||
Cash distributions to parent | (250 | ) | (395 | ) | (445 | ) | |||||
All other financing activities | (101 | ) | (109 | ) | (29 | ) | |||||
Net cash provided by/(used in) financing activities | 17,528 | 7,796 | 9,776 | ||||||||
Effect of exchange rate changes on cash and cash equivalents | (403 | ) | (353 | ) | 17 | ||||||
Net increase/(decrease) in cash and cash equivalents | $ | 2,707 | $ | (3,245 | ) | $ | 235 | ||||
Cash and cash equivalents at January 1 | $ | 6,179 | $ | 9,424 | $ | 9,189 | |||||
Net increase/(decrease) in cash and cash equivalents | 2,707 | (3,245 | ) | 235 | |||||||
Cash and cash equivalents at December 31 | $ | 8,886 | $ | 6,179 | $ | 9,424 | |||||
Supplementary cash flow information for continuing operations | |||||||||||
Interest paid | $ | 2,239 | $ | 2,652 | $ | 2,623 | |||||
Income taxes paid | 74 | 314 | 206 | ||||||||
The accompanying notes are part of the financial statements.
FC-5
FORD MOTOR CREDIT COMPANY LLC AND SUBSIDIARIES
NOTES TO THE FINANCIAL STATEMENTS
Table of Contents
Footnote | Page | |
Accounting Policies | ||
Note 2 | Finance Receivables | |
Note 3 | Net Investment in Operating Leases | |
Note 4 | Allowance for Credit Losses | |
Note 5 | Transfers of Receivables | |
Note 6 | Variable Interest Entities | |
Note 7 | Derivative Financial Instruments and Hedging Activities | |
Note 8 | Other Assets and Other Liabilities and Deferred Income | |
Note 9 | Debt and Commitments | |
Income Taxes | ||
Accumulated Other Comprehensive Income/(Loss) | ||
Insurance | ||
Other Income, Net | ||
Retirement Benefits | ||
Fair Value Measurements | ||
Note 16 | Segment and Geographic Information | |
Note 17 | Selected Quarterly Financial Data (Unaudited) | |
Note 18 | Commitments and Contingencies | |
FC-6
FORD MOTOR CREDIT COMPANY LLC AND SUBSIDIARIES
NOTES TO THE FINANCIAL STATEMENTS
NOTE 1. ACCOUNTING POLICIES
Principles of Consolidation
The accompanying consolidated financial statements include Ford Motor Credit Company LLC, its controlled domestic and foreign subsidiaries and joint ventures, and consolidated VIEs in which Ford Motor Credit Company LLC is the primary beneficiary (collectively referred to herein as “Ford Credit,” “we,” “our,” or “us”). Affiliates that we do not consolidate, but for which we have significant influence over operating and financial policies, are accounted for using the equity method. We are an indirect, wholly owned subsidiary of Ford Motor Company (“Ford”).
Use of estimates, as determined by management, is required in the preparation of consolidated financial statements in conformity with U.S. generally accepted accounting principles (“GAAP”). Because of the inherent uncertainty involved in making estimates, actual results reported in future periods might be based upon amounts that differ from those estimates. The accounting estimates that are most important to our business include the allowance for credit losses and accumulated depreciation on vehicles subject to operating leases.
We reclassified certain prior period amounts in our consolidated financial statements to conform to current year presentation.
Nature of Operations
We offer a wide variety of automotive financing products to and through automotive dealers throughout the world. Our portfolio consists of finance receivables and net investment in operating leases. We also service the finance receivables and net investment in operating leases we originate and purchase, make loans to Ford affiliates, and provide insurance services related to our financing programs. See Notes 2 and 3 for additional information.
We conduct our financing operations directly and indirectly through our subsidiaries and affiliates. We offer substantially similar products and services throughout many different regions, subject to local legal restrictions and market conditions. See Note 16 for key operating data on our business segments and for geographic information on our regions.
The predominant share of our business consists of financing Ford vehicles and supporting Ford dealers. Any extended reduction or suspension of Ford’s production or sale of vehicles due to a decline in consumer demand, work stoppage, governmental action, negative publicity or other event, or significant changes to marketing programs sponsored by Ford, would have an adverse effect on our business.
Certain subsidiaries are subject to regulatory capital requirements requiring maintenance of certain minimum capital levels that limit the ability of those subsidiaries to pay dividends.
Accounting Policies
For each accounting topic that is addressed in its own footnote, the description of the accompanying accounting policy may be found in the related footnote. The remaining accounting policies are described below.
Foreign Currency. We remeasure monetary assets and liabilities denominated in a currency that is different from a reporting entity’s functional currency from the transactional currency to the legal entity’s functional currency. The effect of this remeasurement process, and the results of our foreign currency hedging activities are reported in Other income, net.
Generally, our foreign subsidiaries use the local currency as their functional currency. We translate the assets and liabilities of our foreign subsidiaries from their respective functional currencies to U.S. dollars using end-of-period exchange rates. Changes in the carrying value of these assets and liabilities attributable to fluctuations in exchange rates are recognized in Accumulated other comprehensive income/(loss). Upon sale or upon complete or substantially complete liquidation of an investment in a foreign subsidiary, the amount of accumulated foreign currency translation related to the entity is reclassified to Net income and recognized as part of the gain or loss on the investment.
FC-7
FORD MOTOR CREDIT COMPANY LLC AND SUBSIDIARIES
NOTES TO THE FINANCIAL STATEMENTS
NOTE 1. ACCOUNTING POLICIES (Continued)
Adoption of New Accounting Standards
We adopted the following standard during 2015, which did not have a material impact to our financial statements or financial statement disclosures:
Standard | Effective Date | ||
2015-03 | Imputation of Interest - Simplifying the Presentation of Debt Issuance Costs - see Note 9 | December 31, 2015 | |
Accounting Standards Issued But Not Yet Adopted
Accounting Standard Update (“ASU”) 2016-01, Financial Instruments - Recognition and Measurement of Financial Assets and Financial Liabilities. In January 2016, the Financial Accounting Standards Board (“FASB”) issued a new accounting standard that addresses certain aspects of recognition, measurement, presentation, and disclosure of financial instruments. The new standard is effective as of January 1, 2018. Early adoption is not permitted except for certain provisions that are not currently applicable to our financial statements and financial statement disclosures. We are currently assessing the potential impact to our financial statements and financial statement disclosures.
ASU 2014-09, Revenue - Revenue from Contracts with Customers. In May 2014, the FASB issued a new accounting standard that requires recognition of revenue to depict the transfer of promised goods or services to customers in an amount that reflects the consideration to which we expect to be entitled in exchange for those goods or services. The new standard supersedes U.S. GAAP guidance on revenue recognition and requires the use of more estimates and judgments than the present standards, as well as additional disclosures. The FASB issued ASU 2015-14 to defer the original effective date from January 1, 2017 to January 1, 2018, while allowing for early adoption as of January 1, 2017. The new accounting standard is expected to have an impact to our income statement, balance sheet, and financial statement disclosures and we are reviewing our arrangements to evaluate the impact and method of adoption.
FC-8
FORD MOTOR CREDIT COMPANY LLC AND SUBSIDIARIES
NOTES TO THE FINANCIAL STATEMENTS
NOTE 2. FINANCE RECEIVABLES
We segment finance receivables into “consumer” and “non-consumer” receivables. The receivables are generally secured by the vehicles, inventory, or other property being financed.
Finance receivables are recorded at the time of origination or purchase at fair value and are subsequently reported at amortized cost, net of any allowance for credit losses.
Revenue from finance receivables is recognized using the interest method and includes the accretion of certain direct origination costs that are deferred and interest supplements received from Ford and affiliated companies. The unearned interest supplements on consumer finance receivables are included in Finance receivables, net on the balance sheet, and the earned interest supplements are included in Financing revenue on the income statement.
Consumer Segment. Receivables in this portfolio segment include products offered to individuals and businesses that finance the acquisition of Ford and Lincoln vehicles from dealers for personal or commercial use. Retail financing includes retail installment contracts for new and used vehicles and direct financing leases with retail customers, government entities, daily rental companies, and fleet customers.
Non-Consumer Segment. Receivables in this portfolio segment include products offered to automotive dealers and receivables purchased from Ford and its affiliates. The products include:
• | Dealer financing – includes wholesale loans to dealers to finance the purchase of vehicle inventory, also known as floorplan financing, as well as loans to dealers to finance working capital and improvements to dealership facilities, finance the purchase of dealership real estate, and finance other dealer programs. Wholesale financing is approximately 95% of our dealer financing. |
• | Other financing – purchased receivables from Ford and its affiliates, primarily related to the sale of parts and accessories to dealers, receivables from Ford related loans, and certain used vehicles from daily rental fleet companies. These receivables are excluded from our credit quality reporting since the performance of this group of receivables is generally guaranteed by Ford. |
Notes and accounts receivable from affiliated companies are presented separately on the balance sheet. These receivables are based on intercompany relationships and the balances are settled regularly. We do not assess these receivables for potential credit losses, nor are they subjected to aging analysis, credit quality reviews, or other formal assessments. As a result, Notes and accounts receivable from affiliated companies are not subject to the following disclosures contained herein.
FC-9
FORD MOTOR CREDIT COMPANY LLC AND SUBSIDIARIES
NOTES TO THE FINANCIAL STATEMENTS
NOTE 2. FINANCE RECEIVABLES (Continued)
Finance Receivables, Net
Finance receivables, net were as follows for the years ended December 31 (in millions):
2015 | 2014 | ||||||
Consumer | |||||||
Retail financing, gross | $ | 62,068 | $ | 55,856 | |||
Unearned interest supplements from Ford and affiliated companies | (2,119 | ) | (1,760 | ) | |||
Consumer finance receivables | 59,949 | 54,096 | |||||
Non-Consumer | |||||||
Dealer financing (a) | 36,037 | 31,875 | |||||
Other financing | 1,210 | 1,265 | |||||
Non-Consumer finance receivables (b) | 37,247 | 33,140 | |||||
Total recorded investment (c) | $ | 97,196 | $ | 87,236 | |||
Recorded investment in finance receivables | $ | 97,196 | $ | 87,236 | |||
Allowance for credit losses | (373 | ) | (321 | ) | |||
Finance receivables, net (a) | $ | 96,823 | $ | 86,915 | |||
Net finance receivables subject to fair value (d) | $ | 95,008 | $ | 85,242 | |||
Fair Value | 96,180 | 86,715 | |||||
__________
(a) | At December 31, 2015 and 2014, includes $4.4 billion and $4.0 billion, respectively, of receivables generated by divisions and affiliates of Ford in connection with vehicle inventories released from Ford and in delivery to the destination dealers and $508 million and $535 million, respectively, of dealer financing receivables with entities (primarily dealers) that are reported as consolidated subsidiaries of Ford. For the years ended December 31, 2015, 2014, and 2013, the interest earned on receivables from consolidated subsidiaries of Ford to which we provide financing was $6 million, $5 million, and $6 million, respectively. Consolidated subsidiaries of Ford include dealerships that are partially owned by Ford as consolidated VIEs and also certain overseas affiliates. The associated vehicles that are being financed by us are reported as inventory on Ford’s balance sheet. |
(b) | The amount of interest earned from Ford and affiliated companies associated with purchased receivables and receivables from gate released vehicles in transit to dealers for the years ended December 31, 2015, 2014, and 2013, were $183 million, $171 million, and $170 million, respectively. |
(c) | The amount of interest supplements from Ford and affiliated companies earned for the years ended December 31, 2015, 2014, and 2013 were $1.3 billion, $1.4 billion, and $1.5 billion, respectively, and the amount of interest supplements cash received related to consumer finance receivables totaled $1.5 billion, $1.3 billion, and $1.0 billion, respectively. |
(d) | At December 31, 2015 and 2014, excludes $1.8 billion and $1.7 billion, respectively, of certain receivables (primarily direct financing leases) that are not subject to fair value disclosure requirements. |
Excluded from finance receivables at December 31, 2015 and 2014 was $209 million and $192 million, respectively, of accrued uncollected interest, which we report in Other assets on our balance sheet.
Included in recorded investment in finance receivables at December 31, 2015 and 2014 were consumer receivables of $27.6 billion and $24.4 billion, respectively, and non-consumer receivables of $26.1 billion and $21.8 billion, respectively, that have been sold for legal purposes in securitization transactions but continue to be reported in our consolidated financial statements. The receivables are available only for payment of the debt issued by, and other obligations of, the securitization entities that are parties to those securitization transactions; they are not available to pay the other obligations or the claims of Ford Credit’s other creditors. Ford Credit holds the right to receive the excess cash flows not needed to pay the debt issued by, and other obligations of, the securitization entities that are parties to those securitization transactions (see Note 5 for additional information).
Included in Finance receivables, net at December 31, 2015 and 2014 was $1.8 billion and $1.7 billion, respectively, of net investment in direct financing leases.
FC-10
FORD MOTOR CREDIT COMPANY LLC AND SUBSIDIARIES
NOTES TO THE FINANCIAL STATEMENTS
NOTE 2. FINANCE RECEIVABLES (Continued)
Contractual maturities of total finance receivables outstanding at December 31, 2015 reflect contractual repayments due from customers or borrowers and were as follows (in millions):
2016 | 2017 | 2018 | Thereafter | Total | |||||||||||||||
Consumer | |||||||||||||||||||
Retail financing, gross (a) | $ | 17,627 | $ | 15,811 | $ | 12,847 | $ | 15,783 | $ | 62,068 | |||||||||
Non-Consumer | |||||||||||||||||||
Dealer financing | 32,899 | 1,823 | 267 | 1,048 | 36,037 | ||||||||||||||
Other financing | 1,210 | — | — | — | 1,210 | ||||||||||||||
Total finance receivables | $ | 51,736 | $ | 17,634 | $ | 13,114 | $ | 16,831 | $ | 99,315 | |||||||||
(a) | Contractual maturities of retail financing, gross include $162 million of estimated unguaranteed residual values related to direct financing leases. |
Our finance receivables are generally pre-payable without penalty, so prepayments may cause actual maturities to differ from contractual maturities. The above table, therefore, is not to be regarded as a forecast of future cash collections. For wholesale receivables, which are included in dealer financing, maturities stated above are estimated based on historical trends, as maturities on outstanding amounts are scheduled upon the sale of the underlying vehicle by the dealer.
At December 31, 2015, finance receivables included $1.6 billion owed by the three customers with the largest receivables balances. These balances are included in non-consumer receivables.
Aging
For all finance receivables, we define “past due” as any payment, including principal and interest, that is at least 31 days past the contractual due date. The recorded investment of consumer receivables greater than 90 days past due and still accruing interest was $16 million and $17 million at December 31, 2015 and 2014, respectively. The recorded investment of non-consumer receivables greater than 90 days past due and still accruing interest was $1 million and $3 million at December 31, 2015 and 2014, respectively.
The aging analysis of finance receivables balances at December 31, 2015 was as follows (in millions):
2015 | 2014 | ||||||
Consumer | |||||||
31-60 days past due | $ | 708 | $ | 718 | |||
61-90 days past due | 108 | 97 | |||||
91-120 days past due | 27 | 29 | |||||
Greater than 120 days past due | 38 | 52 | |||||
Total past due | 881 | 896 | |||||
Current | 59,068 | 53,200 | |||||
Consumer finance receivables | 59,949 | 54,096 | |||||
Non-Consumer | |||||||
Total past due | 116 | 117 | |||||
Current | 37,131 | 33,023 | |||||
Non-Consumer finance receivables | 37,247 | 33,140 | |||||
Total recorded investment | $ | 97,196 | $ | 87,236 | |||
FC-11
FORD MOTOR CREDIT COMPANY LLC AND SUBSIDIARIES
NOTES TO THE FINANCIAL STATEMENTS
NOTE 2. FINANCE RECEIVABLES (Continued)
Credit Quality
Consumer Segment. When originating all classes of consumer receivables, we use a proprietary scoring system that measures the credit quality of the receivables using several factors, such as credit bureau information, consumer credit risk scores (e.g., FICO score), and contract characteristics. In addition to our proprietary scoring system, we consider other individual consumer factors, such as employment history, financial stability, and capacity to pay.
Subsequent to origination, we review the credit quality of retail financing based on customer payment activity. As each customer develops a payment history, we use an internally developed behavioral scoring model to assist in determining the best collection strategies, which allows us to focus collection activity on higher-risk accounts. These models are used to refine our risk-based staffing model to ensure collection resources are aligned with portfolio risk. Based on data from this scoring model, contracts are categorized by collection risk. Our collection models evaluate several factors, including origination characteristics, updated credit bureau data, and payment patterns.
Credit quality ratings for consumer receivables are based on our aging analysis. Refer to the aging table above. Consumer receivables credit quality ratings are as follows:
• | Pass – current to 60 days past due |
• | Special Mention – 61 to 120 days past due and in intensified collection status |
• | Substandard – greater than 120 days past due and for which the uncollectible portion of the receivables has already been charged off, as measured using the fair value of collateral less costs to sell |
Non-Consumer Segment. We extend credit to dealers primarily in the form of lines of credit to purchase new Ford and Lincoln vehicles as well as used vehicles. Payment is required when the dealer has sold the vehicle. Each non-consumer lending request is evaluated by taking into consideration the borrower’s financial condition and the underlying collateral securing the loan. We use a proprietary model to assign each dealer a risk rating. This model uses historical dealer performance data to identify key factors about a dealer that we consider most significant in predicting a dealer’s ability to meet its financial obligations. We also consider numerous other financial and qualitative factors of the dealer’s operations including capitalization and leverage, liquidity and cash flow, profitability, and credit history with ourselves and other creditors.
Dealers are assigned to one of four groups according to risk ratings as follows:
• | Group I – strong to superior financial metrics |
• | Group II – fair to favorable financial metrics |
• | Group III – marginal to weak financial metrics |
• | Group IV – poor financial metrics, including dealers classified as uncollectible |
We generally suspend credit lines and extend no further funding to dealers classified in Group IV.
We regularly review our model to confirm the continued business significance and statistical predictability of the factors and update the model to incorporate new factors or other information that improves its statistical predictability. In addition, we regularly audit dealer inventory and dealer sales records to verify that the dealer is in possession of the financed vehicles and is promptly paying each receivable following the sale of the financed vehicle. The frequency of on-site vehicle inventory audits depends on factors such as the dealer’s risk rating and our security position. Under our policies, on-site vehicle inventory audits of low-risk dealers are conducted only as circumstances warrant. Audits of higher-risk dealers are conducted with increased frequency based on risk ratings and our security position. We perform a credit review of each dealer at least annually and adjust the dealer’s risk rating, if necessary.
The credit quality of dealer financing receivables is evaluated based on our internal dealer risk rating analysis. A dealer has the same risk rating for its entire dealer financing regardless of the type of financing.
FC-12
FORD MOTOR CREDIT COMPANY LLC AND SUBSIDIARIES
NOTES TO THE FINANCIAL STATEMENTS
NOTE 2. FINANCE RECEIVABLES (Continued)
The credit quality analysis of our dealer financing receivables at December 31 was as follows (in millions):
2015 | 2014 | ||||||
Dealer financing | |||||||
Group I | $ | 27,054 | $ | 23,641 | |||
Group II | 7,185 | 6,360 | |||||
Group III | 1,687 | 1,787 | |||||
Group IV | 111 | 87 | |||||
Total recorded investment | $ | 36,037 | $ | 31,875 | |||
Impaired Receivables
Impaired consumer receivables include accounts that have been rewritten or modified in reorganization proceedings pursuant to the U.S. Bankruptcy Code that are considered to be Troubled Debt Restructurings (“TDRs”), as well as all accounts greater than 120 days past due. Impaired non-consumer receivables represent accounts with dealers that have weak or poor financial metrics or dealer financing that has been modified in TDRs. The recorded investment of consumer receivables that were impaired at December 31, 2015 and 2014 was $375 million, or 0.6% of consumer receivables, and $415 million, or 0.8% of consumer receivables, respectively. The recorded investment of non-consumer receivables that were impaired at December 31, 2015 and 2014 was $134 million, or 0.4% of non-consumer receivables, and $110 million, or 0.3% of non-consumer receivables, respectively. Impaired finance receivables are evaluated both collectively and specifically. See Note 4 for additional information related to the development of our allowance for credit losses.
The accrual of revenue is discontinued at the time a receivable is determined to be uncollectible. Accounts may be restored to accrual status only when a customer settles all past-due deficiency balances and future payments are reasonably assured. For receivables in non-accrual status, subsequent financing revenue is recognized only to the extent a payment is received. Payments are generally applied first to outstanding interest and then to the unpaid principal balance.
A restructuring of debt constitutes a TDR if we grant a concession to a debtor for economic or legal reasons related to the debtor’s financial difficulties that we otherwise would not consider. Consumer and non-consumer receivables that have a modified interest rate below market rate or that were modified in reorganization proceedings pursuant to the U.S. Bankruptcy Code, except non-consumer receivables that are current with minimal risk of loss, are considered to be TDRs. We do not grant concessions on the principal balance of our receivables. If a receivable is modified in a reorganization proceeding, all payment requirements of the reorganization plan need to be met before remaining balances are forgiven. Finance receivables involved in TDRs are specifically assessed for impairment.
FC-13
FORD MOTOR CREDIT COMPANY LLC AND SUBSIDIARIES
NOTES TO THE FINANCIAL STATEMENTS
NOTE 3. NET INVESTMENT IN OPERATING LEASES
Net investment in operating leases consist primarily of lease contracts for vehicles with retail customers, daily rental companies, government entities, and fleet customers with terms of 60 months or less.
Revenue from rental payments received on operating leases is recognized on a straight-line basis over the term of the lease. The accrual of revenue on operating leases is discontinued at the time an account is determined to be uncollectible.
We receive interest supplements and residual support payments on certain leasing transactions under agreements with Ford. We recognize these upfront collections from Ford and other vehicle acquisition costs as part of Net investment in operating leases, which are amortized to Depreciation on vehicles subject to operating leases over the term of the lease contract. The amount of unearned interest supplements and residual support included in Net investment in operating leases at December 31, 2015 and 2014 was $2.4 billion and $2.1 billion, respectively. The amount of earned interest supplements and residual support costs included in Depreciation on vehicles subject to operating lease for the years ended December 31, 2015, 2014, and 2013 was $1.5 billion, $1.3 billion, and $0.9 billion, respectively. The amount of interest supplements and residual support cash received totaled $1.9 billion, $1.8 billion, and $1.4 billion for the years ended December 31, 2015, 2014, and 2013, respectively.
Depreciation expense on vehicles subject to operating leases is provided on a straight-line basis in an amount necessary to reduce the leased vehicle value to its estimated residual value at the end of the lease term. Our policy is to promptly sell returned off-lease vehicles. We evaluate our depreciation for leased vehicles on a regular basis taking into consideration various assumptions, such as expected residual values at lease termination (including residual value support payments from Ford) and the estimated number of vehicles that will be returned to us. Adjustments to depreciation expense reflecting revised estimates of expected residual values at the end of the lease terms are recorded prospectively on a straight-line basis. Upon disposition of the vehicle, the difference between net book value and actual proceeds is recorded as an adjustment to Depreciation on vehicles subject to operating leases.
We evaluate the carrying value of held-and-used long-lived asset groups (such as vehicles subject to operating leases) for potential impairment when we determine a triggering event has occurred. When a triggering event occurs, a test for recoverability is performed by comparing projected undiscounted future cash flows to the carrying value of the asset group. If the test for recoverability identifies a possible impairment, the asset group’s fair value is measured in accordance with the fair value measurement framework. An impairment charge is recognized for the amount by which the carrying value of the asset group exceeds its estimated fair value. For the periods presented, we have not recorded any impairment charges.
Net investment in operating leases were as follows (in millions):
December 31, 2015 | December 31, 2014 | ||||||
Vehicles, at cost (a) | $ | 29,673 | $ | 24,952 | |||
Accumulated depreciation | (4,545 | ) | (3,396 | ) | |||
Net investment in operating leases before allowance for credit losses | 25,128 | 21,556 | |||||
Allowance for credit losses | (49 | ) | (38 | ) | |||
Net investment in operating leases | $ | 25,079 | $ | 21,518 | |||
__________
(a) | Includes unearned interest supplements and residual support payments we receive on certain leasing transactions under agreements with Ford and affiliated companies, and other vehicle acquisition costs. |
At December 31, 2015 and 2014, net investment in operating leases before allowance for credit losses includes $13.3 billion and $9.6 billion, respectively, of net investment in operating leases that have been included in securitization transactions but continue to be reported in our consolidated financial statements. These net investment in operating leases are available only for payment of the debt issued by, and other obligations of, the securitization entities that are parties to those securitization transactions; they are not available to pay our other obligations or the claims of our other creditors. We hold the right to receive the excess cash flows not needed to pay the debt issued by, and other obligations of, the securitization entities that are parties to those securitization transactions (see Note 5 for additional information).
FC-14
FORD MOTOR CREDIT COMPANY LLC AND SUBSIDIARIES
NOTES TO THE FINANCIAL STATEMENTS
NOTE 3. NET INVESTMENT IN OPERATING LEASES (Continued)
We have entered into a sale-leaseback agreement with Ford primarily for vehicles that Ford leases to employees of Ford and its subsidiaries. The investment in these vehicles is included in Net investment in operating leases and Ford provides a limited guarantee of the residual value of these vehicles. The amount of employee and company vehicles at December 31, 2015 and 2014 was $652 million and $645 million, respectively. For the years ended December 31, 2015, 2014, and 2013, the operating lease revenue on employee leased vehicles was $284 million, $259 million, and $228 million, respectively.
The amounts contractually due for minimum rentals on operating leases at December 31, 2015 were as follows (in millions):
2016 | 2017 | 2018 | 2019 | 2020 | |||||||||||||||
Minimum rentals on operating leases | $ | 4,021 | $ | 2,504 | $ | 919 | $ | 59 | $ | 3 | |||||||||
NOTE 4. ALLOWANCE FOR CREDIT LOSSES
The allowance for credit losses represents our estimate of the probable credit loss inherent in finance receivables and operating leases as of the balance sheet date. The adequacy of the allowance for credit losses is assessed quarterly and the assumptions and models used in establishing the allowance are evaluated regularly. Because credit losses may vary substantially over time, estimating credit losses requires a number of assumptions about matters that are uncertain. The majority of credit losses are attributable to consumer receivables.
Additions to the allowance for credit losses are made by recording charges to the Provision for credit losses on the income statement. The uncollectible portion of finance receivables and operating leases are charged to the allowance for credit losses at the earlier of when an account is deemed to be uncollectible or when an account is 120 days delinquent, taking into consideration the financial condition of the customer, borrower or lessee, the value of the collateral, recourse to guarantors, and other factors.
In the event we repossess the collateral, the receivable is charged off and we record the collateral at its estimated fair value less costs to sell and report it in Other assets on the balance sheet. Charge-offs on finance receivables and operating leases include uncollected amounts related to principal, interest, rental payments, late fees, and other allowable charges. Recoveries on finance receivables and operating leases previously charged off as uncollectible are credited to the allowance for credit losses.
Consumer Segment and Operating Leases
We estimate the allowance for credit losses on consumer receivables and on operating leases using a combination of measurement models and management judgment. The models consider factors such as historical trends in credit losses and recoveries (including key metrics such as delinquencies, repossessions, and bankruptcies), the composition of the present portfolio (including vehicle brand, term, risk evaluation, and new/used vehicles), trends in historical used vehicle values, and economic conditions. Estimates from these models rely on historical information and may not fully reflect losses inherent in the present portfolio. Therefore, we may adjust the estimate to reflect management judgment regarding observable changes in recent economic trends and conditions, portfolio composition, and other relevant factors.
We make projections of two key assumptions to assist in estimating the consumer allowance for credit losses:
• | Frequency – number of finance receivables and operating lease contracts that are expected to default over the loss emergence period, measured as repossessions |
• | Loss severity – expected difference between the amount a customer owes when the finance contract is charged off and the amount received, net of expenses, from selling the repossessed vehicle, including any recoveries from the customer |
FC-15
FORD MOTOR CREDIT COMPANY LLC AND SUBSIDIARIES
NOTES TO THE FINANCIAL STATEMENTS
NOTE 4. ALLOWANCE FOR CREDIT LOSSES (Continued)
Collective Allowance for Credit Losses. The collective allowance is evaluated primarily using a collective loss-to-receivables (“LTR”) model that, based on historical experience, indicates credit losses have been incurred in the portfolio even though the particular accounts that are uncollectible cannot be specifically identified. The LTR model is based on the most recent years of history. Each LTR is calculated by dividing credit losses by average finance receivables or average operating leases, excluding unearned interest supplements and allowance for credit losses. An average LTR is calculated for each product and multiplied by the end-of-period balances for that given product.
Our largest markets also use a loss projection model to estimate losses inherent in the portfolio. The loss projection model applies recent monthly performance metrics, stratified by contract type (retail or lease), contract term (e.g., 60-month), and risk rating to our active portfolio to estimate the losses that have been incurred.
The loss emergence period (“LEP”) is a key assumption within our models and represents the average amount of time between when a loss event first occurs to when it is charged off. This time period starts when the consumer begins to experience financial difficulty. It is evidenced, typically through delinquency, before eventually resulting in a charge-off. The LEP is a multiplier in the calculation of the collective consumer allowance for credit losses.
For accounts greater than 120 days past due, the uncollectible portion is charged off, such that the remaining recorded investment is equal to the estimated fair value of the collateral less costs to sell.
Specific Allowance for Impaired Receivables. Consumer receivables involved in TDRs are specifically assessed for impairment. A specific allowance is estimated based on the present value of the expected future cash flows of the receivable discounted at the contract’s original effective interest rate or the fair value of any collateral adjusted for estimated costs to sell.
After establishing the collective and specific allowance for credit losses, if management believes the allowance does not reflect all losses inherent in the portfolio due to changes in recent economic trends and conditions, or other relevant factors, an adjustment is made based on management judgment.
Non-Consumer Segment
We estimate the allowance for credit losses for non-consumer receivables based on historical LTR ratios, expected future cash flows, and the fair value of collateral.
Collective Allowance for Credit Losses. We estimate an allowance for non-consumer receivables that are not specifically identified as impaired using a LTR model for each financing product based on historical experience. This LTR is an average of the most recent historical experience and is calculated consistent with the consumer receivables LTR approach. All accounts that are specifically identified as impaired are excluded from the calculation of the non-specific or collective allowance.
Specific Allowance for Impaired Receivables. Dealer financing is evaluated by segmenting individual loans by the risk characteristics of the loan (such as the amount of the loan, the nature of the collateral, and the financial status of the debtor). The loans are analyzed to determine whether individual loans are impaired, and a specific allowance is estimated based on the present value of the expected future cash flows of the receivable discounted at the loan’s original effective interest rate or the fair value of the collateral adjusted for estimated costs to sell.
After establishing the collective and specific allowance for credit losses, if management believes the allowance does not reflect all losses inherent in the portfolio due to changes in recent economic trends and conditions, or other relevant factors, an adjustment is made based on management judgment.
FC-16
FORD MOTOR CREDIT COMPANY LLC AND SUBSIDIARIES
NOTES TO THE FINANCIAL STATEMENTS
NOTE 4. ALLOWANCE FOR CREDIT LOSSES (Continued)
An analysis of the allowance for credit losses related to finance receivables and net investment in operating leases for the years ended December 31 (in millions) was as follows:
2015 | |||||||||||||||||||
Finance Receivables | Net Investment in Operating Leases | Total Allowance | |||||||||||||||||
Consumer | Non-Consumer | Total | |||||||||||||||||
Allowance for credit losses | |||||||||||||||||||
Beginning balance | $ | 305 | $ | 16 | $ | 321 | $ | 38 | $ | 359 | |||||||||
Charge-offs | (333 | ) | (3 | ) | (336 | ) | (123 | ) | (459 | ) | |||||||||
Recoveries | 120 | 6 | 126 | 62 | 188 | ||||||||||||||
Provision for credit losses | 276 | (2 | ) | 274 | 73 | 347 | |||||||||||||
Other (a) | (11 | ) | (1 | ) | (12 | ) | (1 | ) | (13 | ) | |||||||||
Ending balance | $ | 357 | $ | 16 | $ | 373 | $ | 49 | $ | 422 | |||||||||
Analysis of ending balance of allowance for credit losses | |||||||||||||||||||
Collective impairment allowance | $ | 338 | $ | 12 | $ | 350 | $ | 49 | $ | 399 | |||||||||
Specific impairment allowance | 19 | 4 | 23 | — | 23 | ||||||||||||||
Ending balance | 357 | 16 | 373 | 49 | $ | 422 | |||||||||||||
Analysis of ending balance of finance receivables and net investment in operating leases | |||||||||||||||||||
Collectively evaluated for impairment | 59,574 | 37,113 | 96,687 | 25,128 | |||||||||||||||
Specifically evaluated for impairment | 375 | 134 | 509 | — | |||||||||||||||
Recorded investment | 59,949 | 37,247 | 97,196 | 25,128 | |||||||||||||||
Ending balance, net of allowance for credit losses | $ | 59,592 | $ | 37,231 | $ | 96,823 | $ | 25,079 | |||||||||||
__________
(a) | Primarily represents amounts related to translation adjustments. |
2014 | |||||||||||||||||||
Finance Receivables | Net Investment in Operating Leases | Total Allowance | |||||||||||||||||
Consumer | Non-Consumer | Total | |||||||||||||||||
Allowance for credit losses | |||||||||||||||||||
Beginning balance | $ | 327 | $ | 30 | $ | 357 | $ | 23 | $ | 380 | |||||||||
Charge-offs | (294 | ) | (6 | ) | (300 | ) | (111 | ) | (411 | ) | |||||||||
Recoveries | 131 | 9 | 140 | 62 | 202 | ||||||||||||||
Provision for credit losses | 150 | (17 | ) | 133 | 64 | 197 | |||||||||||||
Other (a) | (9 | ) | — | (9 | ) | — | (9 | ) | |||||||||||
Ending balance | $ | 305 | $ | 16 | $ | 321 | $ | 38 | $ | 359 | |||||||||
Analysis of ending balance of allowance for credit losses | |||||||||||||||||||
Collective impairment allowance | $ | 282 | $ | 16 | $ | 298 | $ | 38 | $ | 336 | |||||||||
Specific impairment allowance | 23 | — | 23 | — | 23 | ||||||||||||||
Ending balance | 305 | 16 | 321 | 38 | $ | 359 | |||||||||||||
Analysis of ending balance of finance receivables and net investment in operating leases | |||||||||||||||||||
Collectively evaluated for impairment | 53,681 | 33,030 | 86,711 | 21,556 | |||||||||||||||
Specifically evaluated for impairment | 415 | 110 | 525 | — | |||||||||||||||
Recorded investment | 54,096 | 33,140 | 87,236 | 21,556 | |||||||||||||||
Ending balance, net of allowance for credit losses | $ | 53,791 | $ | 33,124 | $ | 86,915 | $ | 21,518 | |||||||||||
__________
(a) | Primarily represents amounts related to translation adjustments. |
FC-17
FORD MOTOR CREDIT COMPANY LLC AND SUBSIDIARIES
NOTES TO THE FINANCIAL STATEMENTS
NOTE 5. TRANSFERS OF RECEIVABLES
We securitize finance receivables and net investment in operating leases through a variety of programs using amortizing, variable funding, and revolving structures. We also sell finance receivables in structured financing transactions. Due to the similarities between securitization and structured financing, we refer to structured financings as securitization transactions. Our securitization programs are targeted to institutional investors in both public and private transactions in capital markets including the United States, Canada, several European countries, Mexico, and China.
We use special purpose entities (“SPEs”) that are considered VIEs for most of our on-balance sheet securitizations. The SPEs are established for the sole purpose of financing the securitized financial assets. The SPEs are generally financed through the issuance of notes or commercial paper into the public or private markets or directly with conduits. We may purchase subordinated notes of the VIEs in addition to the investment we make as residual interest holder of the transaction.
We continue to recognize our financial assets related to our sales of receivables when the financial assets are sold to a consolidated VIE or a consolidated voting interest entity. We derecognize our financial assets when the financial assets are sold to a non-consolidated entity and we do not maintain control over the financial assets.
Receivables Classification
Receivables are accounted for as held for investment (“HFI”) if management has the intent and ability to hold the receivables for the foreseeable future or until maturity or payoff. Receivables that are classified as HFI are recorded at cost. The determination of intent and ability to hold for the foreseeable future is highly judgmental and requires management to make good faith estimates based on all information available at the time of origination. Once a decision has been made to sell specific receivables not previously classified as held for sale (“HFS”), such receivables are transferred into the HFS classification and carried at the lower of cost or fair value. Any amount by which cost exceeds fair value is accounted for as a valuation allowance with the offset recorded to income. We use internally developed quantitative methods to determine fair value that incorporate appropriate funding pricing and enhancement requirements, as well as estimates concerning credit losses and prepayments.
We classify receivables on a receivable-by-receivable basis. Specific receivables included in off-balance sheet securitizations or whole-loan sale transactions are usually not identified until the month in which the sale occurs. Each quarter, we make a determination of whether it is probable that receivables originated during the quarter will be held for the foreseeable future based on historical receivables sale experience, internal forecasts and budgets, as well as other relevant, reliable information available through the date of evaluation. For purposes of this determination, we define probable to mean at least 70% likely and, consistent with our budgeting and forecasting period, we define foreseeable future to mean twelve months. We also consider off-balance sheet funding channels in connection with our quarterly receivables classification determination.
Held for Investment
Finance receivables originated during the quarter for which we determine that it is probable we will hold for the following twelve months are classified as HFI and carried at amortized cost. All retail and wholesale receivables are classified as HFI at origination during all periods presented. Cash flows resulting from the purchase of these receivables that are originally classified as HFI are recorded as an investing activity. Once a decision has been made to sell specifically identified receivables that were originally classified as HFI and the receivables are sold in the same reporting period, the receivables are reclassified as HFS and simultaneously removed from the balance sheet. The fair value adjustment is incorporated and recognized in the net gain or loss on sale of receivables and reported in Other income, net. In the event that receivables have been selected for an off-balance sheet transaction that has not occurred at the end of the reporting period, the receivables are reclassified as HFS and a valuation adjustment is recorded in Other income, net to recognize the receivables at the lower of cost or fair value. Cash flows resulting from the sale of receivables that were originally classified as HFI are recorded as an investing activity since GAAP requires the statement of cash flows presentation to be based on the original classification of the receivables.
FC-18
FORD MOTOR CREDIT COMPANY LLC AND SUBSIDIARIES
NOTES TO THE FINANCIAL STATEMENTS
NOTE 5. TRANSFERS OF RECEIVABLES (Continued)
Held for Sale
Finance receivables originated during the quarter for which we determine that it is not probable we will hold for the following twelve months are classified as HFS and carried at the lower of cost or fair value. Cash flows resulting from the purchase of these receivables are recorded as an operating activity. The valuation adjustment, if applicable, is recorded in Other income, net to recognize the receivables at the lower of cost or fair value. Once specifically identified receivables that were originally classified as HFS are sold, the receivables are removed from the balance sheet and the fair value adjustment is incorporated into the book value of receivables for purposes of determining the gain or loss on sale. Cash flows resulting from the sale of receivables that were originally classified as HFS are recorded as an operating activity. At December 31, 2015 and 2014, there were no finance receivables classified as HFS.
On-Balance Sheet Securitization Transactions
We engage in securitization transactions to fund operations and to maintain liquidity. Our securitization transactions are recorded as asset-backed debt and the associated assets are not derecognized and continue to be included in our financial statements.
The finance receivables sold for legal purposes and net investment in operating leases included in securitization transactions are available only for payment of the debt issued by, and other obligations of, the securitization entities that are parties to those securitization transactions. They are not available to pay our other obligations or the claims of our other creditors. We hold the right to receive the excess cash flows not needed to pay the debt issued by, and other obligations of, the securitization entities that are parties to those securitization transactions. The debt is the obligation of our consolidated securitization entities and not the obligation of Ford Credit or our other subsidiaries.
FC-19
FORD MOTOR CREDIT COMPANY LLC AND SUBSIDIARIES
NOTES TO THE FINANCIAL STATEMENTS
NOTE 5. TRANSFERS OF RECEIVABLES (Continued)
Most of these securitization transactions utilize VIEs. See Note 6 for additional information concerning VIEs. The following tables show the assets and debt related to our securitization transactions that were included in our financial statements (in billions):
December 31, 2015 | |||||||||||||||||||
Cash and Cash Equivalents | Finance Receivables and Net Investment in Operating Leases (a) | Related Debt (c) | |||||||||||||||||
Before Allowance for Credit Losses | Allowance for Credit Losses | After Allowance for Credit Losses | |||||||||||||||||
VIE (b) | |||||||||||||||||||
Retail financing | $ | 1.4 | $ | 20.9 | $ | 0.1 | $ | 20.8 | $ | 18.9 | |||||||||
Wholesale financing | 2.0 | 25.1 | — | 25.1 | 15.3 | ||||||||||||||
Finance receivables | 3.4 | 46.0 | 0.1 | 45.9 | 34.2 | ||||||||||||||
Net investment in operating leases | 0.5 | 13.3 | — | 13.3 | 8.9 | ||||||||||||||
Total VIE | $ | 3.9 | $ | 59.3 | $ | 0.1 | $ | 59.2 | $ | 43.1 | |||||||||
Non-VIE | |||||||||||||||||||
Retail financing | $ | 0.4 | $ | 6.7 | $ | — | $ | 6.7 | $ | 6.1 | |||||||||
Wholesale financing | — | 1.0 | — | 1.0 | 0.8 | ||||||||||||||
Finance receivables | 0.4 | 7.7 | — | 7.7 | 6.9 | ||||||||||||||
Net investment in operating leases | — | — | — | — | — | ||||||||||||||
Total Non-VIE | $ | 0.4 | $ | 7.7 | $ | — | $ | 7.7 | $ | 6.9 | |||||||||
Total securitization transactions | |||||||||||||||||||
Retail financing | $ | 1.8 | $ | 27.6 | $ | 0.1 | $ | 27.5 | $ | 25.0 | |||||||||
Wholesale financing | 2.0 | 26.1 | — | 26.1 | 16.1 | ||||||||||||||
Finance receivables | 3.8 | 53.7 | 0.1 | 53.6 | 41.1 | ||||||||||||||
Net investment in operating leases | 0.5 | 13.3 | — | 13.3 | 8.9 | ||||||||||||||
Total securitization transactions | $ | 4.3 | $ | 67.0 | $ | 0.1 | $ | 66.9 | $ | 50.0 | |||||||||
__________
(a) | Unearned interest supplements and residual support are excluded from securitization transactions. |
(b) | Includes assets to be used to settle the liabilities of the consolidated VIEs. |
(c) | Includes unamortized discount and debt issuance costs. |
FC-20
FORD MOTOR CREDIT COMPANY LLC AND SUBSIDIARIES
NOTES TO THE FINANCIAL STATEMENTS
NOTE 5. TRANSFERS OF RECEIVABLES (Continued)
December 31, 2014 | |||||||||||||||||||
Cash and Cash Equivalents | Finance Receivables and Net Investment in Operating Leases (a) | Related Debt | |||||||||||||||||
Before Allowance for Credit Losses | Allowance for Credit Losses | After Allowance for Credit Losses | |||||||||||||||||
VIE (b) | |||||||||||||||||||
Retail financing | $ | 1.4 | $ | 18.8 | $ | 0.1 | $ | 18.7 | $ | 17.3 | |||||||||
Wholesale financing | 0.3 | 20.8 | — | 20.8 | 13.3 | ||||||||||||||
Finance receivables | 1.7 | 39.6 | 0.1 | 39.5 | 30.6 | ||||||||||||||
Net investment in operating leases | 0.4 | 9.6 | — | 9.6 | 6.6 | ||||||||||||||
Total VIE | $ | 2.1 | $ | 49.2 | $ | 0.1 | $ | 49.1 | $ | 37.2 | |||||||||
Non-VIE | |||||||||||||||||||
Retail financing | $ | 0.3 | $ | 5.6 | $ | — | $ | 5.6 | $ | 5.2 | |||||||||
Wholesale financing | — | 1.0 | — | 1.0 | 0.9 | ||||||||||||||
Finance receivables | 0.3 | 6.6 | — | 6.6 | 6.1 | ||||||||||||||
Net investment in operating leases | — | — | — | — | — | ||||||||||||||
Total Non-VIE | $ | 0.3 | $ | 6.6 | $ | — | $ | 6.6 | $ | 6.1 | |||||||||
Total securitization transactions | |||||||||||||||||||
Retail financing | $ | 1.7 | $ | 24.4 | $ | 0.1 | $ | 24.3 | $ | 22.5 | |||||||||
Wholesale financing | 0.3 | 21.8 | — | 21.8 | 14.2 | ||||||||||||||
Finance receivables | 2.0 | 46.2 | 0.1 | 46.1 | 36.7 | ||||||||||||||
Net investment in operating leases | 0.4 | 9.6 | — | 9.6 | 6.6 | ||||||||||||||
Total securitization transactions | $ | 2.4 | $ | 55.8 | $ | 0.1 | $ | 55.7 | $ | 43.3 | |||||||||
__________
(a) | Unearned interest supplements and residual support are excluded from securitization transactions. |
(b) | Includes assets to be used to settle the liabilities of the consolidated VIEs. |
Interest expense related to securitization debt for the years ended December 31 was as follows (in millions):
2015 | 2014 | 2013 | |||||||||
VIE | $ | 541 | $ | 504 | $ | 563 | |||||
Non-VIE | 89 | 91 | 77 | ||||||||
Total securitization transactions | $ | 630 | $ | 595 | $ | 640 | |||||
Certain of our securitization entities may enter into derivative transactions to mitigate interest rate exposure, primarily resulting from fixed-rate assets securing floating-rate debt and, in certain instances, currency exposure resulting from assets in one currency and debt in another currency. In certain instances, the counterparty enters into offsetting derivative transactions with us to mitigate its interest rate risk resulting from derivatives with our securitization entities. These related derivatives are not the obligations of our securitization entities. See Note 7 for additional information regarding the accounting for derivatives. Our exposures based on the fair value of derivative instruments with external counterparties related to securitization programs were as follows (in millions):
December 31, 2015 | December 31, 2014 | ||||||||||||||
Derivative Asset | Derivative Liability | Derivative Asset | Derivative Liability | ||||||||||||
Derivatives of the VIEs | $ | 85 | $ | 19 | $ | 27 | $ | 22 | |||||||
Derivatives related to the VIEs | 19 | 29 | 16 | 7 | |||||||||||
Other securitization related derivatives | 12 | — | 5 | 1 | |||||||||||
Total exposures related to securitization | $ | 116 | $ | 48 | $ | 48 | $ | 30 | |||||||
FC-21
FORD MOTOR CREDIT COMPANY LLC AND SUBSIDIARIES
NOTES TO THE FINANCIAL STATEMENTS
NOTE 5. TRANSFERS OF RECEIVABLES (Continued)
Derivative expense/(income) related to our securitization transactions for the years ended December 31 was as follows (in millions):
2015 | 2014 | 2013 | |||||||||
Derivatives of the VIEs | $ | (32 | ) | $ | (9 | ) | $ | 3 | |||
Derivatives related to the VIEs | 12 | (16 | ) | 16 | |||||||
Other securitization related derivatives | 18 | 21 | 6 | ||||||||
Total derivative expense/(income) related to securitization | $ | (2 | ) | $ | (4 | ) | $ | 25 | |||
NOTE 6. VARIABLE INTEREST ENTITIES
A VIE is an entity that either (i) has insufficient equity to permit the entity to finance its activities without additional subordinated financial support or (ii) has equity investors who lack the characteristics of a controlling financial interest. A VIE is consolidated by its primary beneficiary. The primary beneficiary has both the power to direct the activities that most significantly impact the entity’s economic performance and the obligation to absorb losses or the right to receive benefits from the entity that could potentially be significant to the VIE. Nearly all of our VIEs are special purpose entities used for our securitizations.
We have the power to direct the activities of our special purpose entities when we have the ability to exercise discretion in the servicing of financial assets, issue additional debt, exercise a unilateral call option, add assets to revolving structures, or control investment decisions.
Assets recognized as a result of consolidating these VIEs do not represent additional assets that could be used to satisfy claims against our general assets. Conversely, liabilities recognized as a result of consolidating these VIEs do not represent additional claims on our general assets; rather, they represent claims against the specific assets of the consolidated VIEs.
VIEs of Which We Are the Primary Beneficiary
We use special purpose entities to issue asset-backed securities in transactions to public and private investors. We have deemed most of these special purpose entities to be VIEs. The asset-backed securities are backed by finance receivables and interests in net investments in operating leases. The assets continue to be consolidated by us. We retain interests in our securitization VIEs, including subordinated securities issued by the VIEs, rights to cash held for the benefit of the securitization investors, and rights to receive the excess cash flows not needed to pay the debt issued by, and other obligations of, the securitization entities that are parties to those securitization transactions.
The transactions create and pass along risks to the variable interest holders, depending on the assets securing the debt and the specific terms of the transactions. We aggregate and analyze the asset-backed securitization transactions based on the risk profile of the product and the type of funding structure, including:
• | Retail financing – consumer credit risk and pre-payment risk |
• | Wholesale financing – dealer credit risk and Ford risk, as the receivables owned by the VIEs primarily arise from the financing provided by us to Ford-franchised dealers; therefore, the collections depend upon the sale of Ford vehicles |
• | Net investment in operating leases – vehicle residual value risk, consumer credit risk, and pre-payment risk |
As residual interest holder, we are exposed to the underlying residual and credit risk of the collateral and are exposed to interest rate risk in some transactions. The amount of risk absorbed by our residual interests generally is represented by and limited to the amount of overcollateralization of the assets securing the debt and any cash reserves.
FC-22
FORD MOTOR CREDIT COMPANY LLC AND SUBSIDIARIES
NOTES TO THE FINANCIAL STATEMENTS
NOTE 6. VARIABLE INTEREST ENTITIES (Continued)
We have no obligation to repurchase or replace any securitized asset that subsequently becomes delinquent in payment or otherwise is in default, except when representations and warranties about the eligibility of the securitized assets are breached, or when certain changes are made to the underlying asset contracts. Securitization investors have no recourse to us or our other assets and have no right to require us to repurchase the investments. We generally have no obligation to provide liquidity or contribute cash or additional assets to the VIEs and do not guarantee any asset-backed securities. We may be required to support the performance of certain securitization transactions, however, by increasing cash reserves.
VIEs that are exposed to interest rate or currency risk may reduce their risks by entering into derivative transactions. In certain instances, we have entered into derivative transactions with the counterparty to protect the counterparty from risks absorbed through its derivative transactions with the VIEs.
Although not contractually required, we regularly support our wholesale securitization programs by repurchasing receivables of a dealer from a VIE when the dealer’s performance is at risk, which transfers the corresponding risk of loss from the VIE to us. In order to continue to fund the wholesale receivables, we also may contribute additional cash or wholesale receivables if the collateral falls below the required levels. The balances of cash related to these contributions were $0 at December 31, 2015 and 2014, and ranged from $0 to $72 million during 2015 and $0 to $242 million during 2014.
See Note 5 for additional information on the financial position and financial performance of our VIEs and Notes 7 and 15 for additional information regarding derivatives.
VIEs of Which We Are Not the Primary Beneficiary
We have an investment in Forso Nordic AB, a joint venture determined to be a VIE of which we are not the primary beneficiary. The joint venture provides retail and dealer financing in its local markets and is financed by external debt and additional subordinated debt provided by the joint venture partner. The operating agreement indicates that the power to direct economically significant activities is shared with the joint venture partner, and the obligation to absorb losses or right to receive benefits resides primarily with the joint venture partner. Our investment in the joint venture is accounted for as an equity method investment and is included in Other assets. Our maximum exposure to any potential losses associated with this VIE is limited to our equity investment and amounted to $66 million at December 31, 2015 and 2014, respectively.
FC-23
FORD MOTOR CREDIT COMPANY LLC AND SUBSIDIARIES
NOTES TO THE FINANCIAL STATEMENTS
NOTE 7. DERIVATIVE FINANCIAL INSTRUMENTS AND HEDGING ACTIVITIES
In the normal course of business, our operations are exposed to global market risks, including the effect of changes in interest rates and foreign currency exchange rates. To manage these risks, we enter into highly effective derivative contracts:
• | Interest rate contracts, including swaps, that are used to manage the effects of interest rate fluctuations; |
• | Foreign currency exchange contracts, including forwards, that are used to manage foreign exchange exposure; and |
• | Cross-currency interest rate swap contracts that are used to manage foreign currency and interest rate exposures on foreign-denominated debt. |
Our derivatives are over-the-counter customized derivative transactions and are not exchange traded. We review our hedging program, derivative positions, and overall risk management strategy on a regular basis.
Derivative Financial Instruments and Hedge Accounting. Derivative assets and derivative liabilities are recorded in Derivative financial instruments on our balance sheet at fair value and presented on a gross basis.
We have elected to apply hedge accounting to certain derivatives. Derivatives that are designated in hedging relationships are evaluated for effectiveness using regression analysis at the time they are designated and throughout the hedge period. Some derivatives do not qualify for hedge accounting; for others, we elect not to apply hedge accounting.
Fair Value Hedges. We use derivatives to reduce the risk of changes in the fair value of debt. We have designated certain receive-fixed, pay-float interest rate swaps as fair value hedges of fixed-rate debt. The risk being hedged is the risk of changes in the fair value of the hedged debt attributable to changes in the benchmark interest rate. If the hedge relationship is deemed to be highly effective, we record the changes in the fair value of the hedged debt related to the risk being hedged in Debt with the offset in Other income, net. The change in fair value of the related derivative (excluding accrued interest) also is recorded in Other income, net. Net interest settlements and accruals on fair value hedges are excluded from the assessment of hedge effectiveness and are reported in Interest expense. The cash flows associated with fair value hedges are reported in Net cash provided by/(used in) operating activities in our statement of cash flows.
When a fair value hedge is de-designated, or when the derivative is terminated before maturity, the fair value adjustment to the hedged debt continues to be reported as part of the carrying value of the debt and is amortized over its remaining life.
Derivatives Not Designated as Hedging Instruments. We report net interest settlements and accruals and changes in the fair value of interest rate swaps not designated as hedging instruments in Other income, net. Foreign currency revaluation on accrued interest along with gains and losses on foreign exchange contracts and cross currency interest rate swaps are reported in Other income, net. Cash flows associated with non-designated or de-designated derivatives are reported in Net cash provided by/(used in) investing activities in our statement of cash flows.
FC-24
FORD MOTOR CREDIT COMPANY LLC AND SUBSIDIARIES
NOTES TO THE FINANCIAL STATEMENTS
NOTE 7. DERIVATIVE FINANCIAL INSTRUMENTS AND HEDGING ACTIVITIES (Continued)
Income Effect of Derivative Financial Instruments
The gains/(losses), by hedge designation, recorded in income for the years ended December 31 were as follows (in millions):
2015 | 2014 | 2013 | |||||||||
Fair value hedges | |||||||||||
Interest rate contracts | |||||||||||
Net interest settlements and accruals excluded from the assessment of hedge effectiveness | $ | 370 | $ | 304 | $ | 254 | |||||
Ineffectiveness (a) | 3 | 20 | (44 | ) | |||||||
Derivatives not designated as hedging instruments | |||||||||||
Interest rate contracts | (58 | ) | (41 | ) | (28 | ) | |||||
Foreign currency exchange contracts (b) | 66 | 68 | 12 | ||||||||
Cross-currency interest rate swap contracts | 100 | 161 | (88 | ) | |||||||
Total | $ | 481 | $ | 512 | $ | 106 | |||||
__________
(a) | For 2015, 2014, and 2013, hedge ineffectiveness reflects the net change in fair value on derivatives of $72 million gain, $407 million gain, and $658 million loss, respectively, and change in value on hedged debt attributable to the change in benchmark interest rates of $69 million loss, $387 million loss, and $614 million gain, respectively. |
(b) | The gains related to forward contracts between Ford Credit and an affiliated company were $66 million, $68 million, and $10 million for the years ended December 31, 2015, 2014, and 2013, respectively. |
Balance Sheet Effect of Derivative Financial Instruments
Derivative assets and liabilities are recorded on the balance sheet at fair value and are presented on a gross basis. The notional amounts of the derivative instruments do not necessarily represent amounts exchanged by the parties and are not a direct measure of our financial exposure. We also enter into master agreements with counterparties that may allow for netting of exposures in the event of default or breach of the counterparty agreement.
The fair value of our derivative instruments and the associated notional amounts, presented gross, at December 31 were as follows (in millions):
2015 | 2014 | ||||||||||||||||||||||
Notional | Fair Value of Assets | Fair Value of Liabilities | Notional | Fair Value of Assets | Fair Value of Liabilities | ||||||||||||||||||
Fair value hedges | |||||||||||||||||||||||
Interest rate contracts | $ | 28,964 | $ | 670 | $ | 16 | $ | 23,203 | $ | 602 | $ | 38 | |||||||||||
Derivatives not designated as hedging instruments | |||||||||||||||||||||||
Interest rate contracts | 62,638 | 159 | 112 | 56,558 | 168 | 89 | |||||||||||||||||
Foreign currency exchange contracts (a) | 1,713 | 22 | 4 | 1,527 | 18 | 1 | |||||||||||||||||
Cross-currency interest rate swap contracts | 3,137 | 73 | 111 | 2,425 | 71 | 39 | |||||||||||||||||
Total derivative financial instruments, gross | $ | 96,452 | 924 | 243 | $ | 83,713 | 859 | 167 | |||||||||||||||
Counterparty netting and collateral (b) | (167 | ) | (167 | ) | (136 | ) | (136 | ) | |||||||||||||||
Total derivative financial instruments, net | $ | 757 | $ | 76 | $ | 723 | $ | 31 | |||||||||||||||
__________
(a) | Includes forward contracts between Ford Credit and an affiliated company. |
(b) | As of December 31, 2015 and December 31, 2014, we did not receive or pledge any cash collateral. |
FC-25
FORD MOTOR CREDIT COMPANY LLC AND SUBSIDIARIES
NOTES TO THE FINANCIAL STATEMENTS
NOTE 8. OTHER ASSETS AND OTHER LIABILITIES AND DEFERRED INCOME
Other assets and other liabilities and deferred income consist of various balance sheet items that are combined for financial statement presentation due to their respective materiality compared with other individual asset and liability items.
Other assets were as follows (in millions):
December 31, 2015 | December 31, 2014 | ||||||
Accrued interest and other non-finance receivables | $ | 763 | $ | 921 | |||
Collateral held for resale, at net realizable value | 498 | 382 | |||||
Prepaid reinsurance premiums and other reinsurance receivables | 472 | 401 | |||||
Property and equipment, net of accumulated depreciation (a) | 142 | 120 | |||||
Deferred charges – income taxes | 135 | 185 | |||||
Investment in non-consolidated affiliates | 133 | 141 | |||||
Deferred charges | 63 | 268 | |||||
Restricted cash (b) | 56 | 130 | |||||
Other | 24 | 53 | |||||
Total other assets | $ | 2,286 | $ | 2,601 | |||
__________
(a) | Accumulated depreciation was $335 million and $326 million at December 31, 2015 and 2014, respectively. |
(b) | Restricted cash primarily includes cash held to meet certain local governmental and regulatory reserve requirements and cash held under the terms of certain contractual agreements. Restricted cash does not include required minimum balances or cash securing debt issued through securitization transactions. |
Other liabilities and deferred income were as follows (in millions):
December 31, 2015 | December 31, 2014 | ||||||
Interest payable | $ | 553 | $ | 587 | |||
Unearned insurance premiums | 484 | 410 | |||||
Tax related payables to Ford and affiliated companies | 105 | 625 | |||||
Unrecognized tax benefits | 75 | 91 | |||||
Other | 448 | 497 | |||||
Total other liabilities and deferred income | $ | 1,665 | $ | 2,210 | |||
FC-26
FORD MOTOR CREDIT COMPANY LLC AND SUBSIDIARIES
NOTES TO THE FINANCIAL STATEMENTS
NOTE 9. DEBT AND COMMITMENTS
We have a commercial paper program with qualified institutional investors. We also obtain other short-term funding from the issuance of demand notes to retail investors through our floating rate demand notes program. We have certain securitization programs that issue short-term asset-backed debt securities that are sold to institutional investors. Bank borrowings by several of our international affiliates in the ordinary course of business are an additional source of short-term funding. We obtain long-term debt funding through the issuance of a variety of unsecured and asset-backed debt securities in the U.S. and international capital markets.
Asset-backed debt issued in securitizations is the obligation of the consolidated securitization entity that issued the debt and is payable only out of collections on the underlying securitized assets and related enhancements. This asset-backed debt is not the obligation of Ford Credit or our other subsidiaries.
Debt is recorded on our balance sheet at par value adjusted for unamortized discount or premium, unamortized issuance costs and adjustments related to designated fair value hedges (see Note 7 for additional information). Debt due within one year at issuance is classified as short-term. Debt due after one year at issuance is classified as long-term. Discounts, premiums, and costs directly related to the issuance of debt are capitalized and amortized over the life of the debt or to the put date and are recorded in Interest expense using the effective interest method. Gains and losses on the extinguishment of debt are recorded in Other income, net.
Debt outstanding and interest rates were as follows (in millions):
Interest Rates | |||||||||||||||||||
Debt | Average Contractual | Average Effective | |||||||||||||||||
December 31, 2015 | December 31, 2014 | 2015 | 2014 | 2015 | 2014 | ||||||||||||||
Short-term debt | |||||||||||||||||||
Unsecured debt | |||||||||||||||||||
Floating rate demand notes | $ | 5,926 | $ | 5,559 | |||||||||||||||
Commercial paper | 1,722 | 1,651 | |||||||||||||||||
Other short-term debt | 2,708 | 2,564 | |||||||||||||||||
Asset-backed debt | 1,855 | 1,377 | |||||||||||||||||
Total short-term debt | 12,211 | 11,151 | 1.6 | % | 1.9 | % | 1.6 | % | 1.9 | % | |||||||||
Long-term debt | |||||||||||||||||||
Unsecured debt | |||||||||||||||||||
Notes payable within one year | 10,254 | 9,102 | |||||||||||||||||
Notes payable after one year | 48,672 | 42,488 | |||||||||||||||||
Asset-backed debt | |||||||||||||||||||
Notes payable within one year | 18,855 | 16,722 | |||||||||||||||||
Notes payable after one year | 29,390 | 25,197 | |||||||||||||||||
Unamortized discount | (25 | ) | (51 | ) | |||||||||||||||
Unamortized issuance costs (a) | (214 | ) | — | ||||||||||||||||
Fair value adjustments | 458 | 428 | |||||||||||||||||
Total long-term debt | 107,390 | 93,886 | 2.3 | % | 2.7 | % | 2.4 | % | 2.8 | % | |||||||||
Total debt | $ | 119,601 | $ | 105,037 | 2.2 | % | 2.6 | % | 2.3 | % | 2.7 | % | |||||||
Fair value of debt | $ | 120,546 | $ | 107,190 | |||||||||||||||
Interest rate characteristics of debt payable after one year | |||||||||||||||||||
Fixed interest rate | 54,396 | 49,148 | |||||||||||||||||
Variable interest rate (generally based on LIBOR or other short-term rates) | 23,666 | 18,537 | |||||||||||||||||
Total payable after one year | $ | 78,062 | $ | 67,685 | |||||||||||||||
__________
(a) | The new accounting standard regarding the presentation of debt issuance costs was adopted in the current period and applied prospectively. |
FC-27
FORD MOTOR CREDIT COMPANY LLC AND SUBSIDIARIES
NOTES TO THE FINANCIAL STATEMENTS
NOTE 9. DEBT AND COMMITMENTS (Continued)
With the exception of commercial paper, which is issued at a discount, the average contractual rates reflect the stated contractual interest rate. Average effective rates reflect the average contractual interest rate plus amortization of discounts, premiums, and issuance fees. Fair value adjustments relate to designated fair value hedges of unsecured debt.
The fair value of debt reflects interest accrued but not yet paid of $550 million and $586 million at December 31, 2015 and 2014, respectively. Accrued interest is reported in Other liabilities and deferred income for outside debt and Accounts payable - affiliated companies for debt with affiliated companies. The fair value of debt includes $10.4 billion and $9.8 billion of short-term debt at December 31, 2015 and 2014, respectively, carried at cost, which approximates fair value (see Note 15 for additional information).
Debt with affiliated companies included in the above table was as follows (in millions):
December 31, 2015 | December 31, 2014 | ||||||
Other short-term debt | $ | 88 | $ | 13 | |||
Notes payable within one year | 13 | 307 | |||||
Notes payable after one year | 83 | 5 | |||||
Total debt with affiliated companies | $ | 184 | $ | 325 | |||
Interest expense on debt with affiliated companies is reported in Interest expense and was $19 million, $25 million, and $22 million for the years ended December 31, 2015, 2014, and 2013, respectively.
Maturities
Debt maturities at December 31, 2015, were as follows (in millions):
2016 (a) | 2017 | 2018 | 2019 | 2020 | Thereafter (b) | Total | |||||||||||||||||||||
Unsecured debt | $ | 20,610 | $ | 12,503 | $ | 11,288 | $ | 6,151 | $ | 6,882 | $ | 11,848 | $ | 69,282 | |||||||||||||
Asset-backed debt | 20,710 | 17,109 | 4,640 | 3,576 | 3,765 | 300 | 50,100 | ||||||||||||||||||||
Total | 41,320 | 29,612 | 15,928 | 9,727 | 10,647 | 12,148 | 119,382 | ||||||||||||||||||||
Unamortized discount | (25 | ) | |||||||||||||||||||||||||
Unamortized issuance costs | (214 | ) | |||||||||||||||||||||||||
Fair value adjustments | 458 | ||||||||||||||||||||||||||
Total debt | $ | 119,601 | |||||||||||||||||||||||||
__________
(a) | Includes $12,211 million for short-term and $29,109 million for long-term debt. |
(b) | Includes $12,020 million of unsecured debt maturing between 2021 and 2025 with the remaining balance maturing by 2048. |
Committed Asset-Backed Facilities
We and our subsidiaries have entered into agreements with a number of bank-sponsored asset-backed commercial paper conduits and other financial institutions. Such counterparties are contractually committed, at our option, to purchase from us eligible retail receivables or to purchase or make advances under asset-backed securities backed by retail or wholesale finance receivables or operating leases for proceeds of up to $33.2 billion ($17.6 billion of retail financing, $6.7 billion of wholesale financing, and $8.9 billion of operating lease assets) at December 31, 2015. These committed liquidity facilities have varying maturity dates, with $16.2 billion having maturities within the next twelve months and the remaining balance having maturities through 2017. We plan capacity renewals to protect our global funding needs, optimize capacity utilization, and maintain sufficient liquidity.
FC-28
FORD MOTOR CREDIT COMPANY LLC AND SUBSIDIARIES
NOTES TO THE FINANCIAL STATEMENTS
NOTE 9. DEBT AND COMMITMENTS (Continued)
Our ability to obtain funding under these facilities is subject to having a sufficient amount of eligible assets as well as our ability to obtain interest rate hedging arrangements for certain facilities. Our capacity in excess of eligible receivables protects us against the risk of lower than planned renewal rates. At December 31, 2015, $20.6 billion of these commitments were in use. These programs are free of material adverse change clauses, restrictive financial covenants (for example, debt-to-equity limitations and minimum net worth requirements), and generally, credit rating triggers that could limit our ability to obtain funding. However, the unused portion of these commitments may be terminated if the performance of the underlying assets deteriorates beyond specified levels. Based on our experience and knowledge as servicer of the related assets, we do not expect any of these programs to be terminated due to such events.
Effective June 2015, FCE Bank plc (“FCE”) has pre-positioned retail receivables with the Bank of England which supports access to the Discount Window Facility. Pre-positioned assets are neither pledged to nor held as collateral by the Bank of England unless the Discount Window Facility is accessed.
Unsecured Credit Facilities
At December 31, 2015, we and our majority-owned subsidiaries had $5.3 billion of contractually committed unsecured credit facilities with financial institutions, including the FCE Credit Agreement (as defined below) and the allocation under Ford’s revolving credit facility (as defined below). At December 31, 2015, $4.5 billion was available for use.
FCE’s £830 million (equivalent to $1.2 billion at December 31, 2015) syndicated credit facility (the “FCE Credit Agreement”) matures in 2018. At December 31, 2015, £380 million (equivalent to $560 million) was available for use. The FCE Credit Agreement contains certain covenants, including an obligation for FCE to maintain its ratio of regulatory capital to risk-weighted assets at no less than the applicable regulatory minimum, and for the support agreement between FCE and Ford Credit to remain in full force and effect (and enforced by FCE to ensure that its net worth is maintained at no less than $500 million). In addition to customary payment, representation, bankruptcy, and judgment defaults, the FCE Credit Agreement contains cross-payment and cross-acceleration defaults with respect to other debt.
Lenders under Ford’s Third Amended and Restated Credit Agreement dated as of April 30, 2015 and as further amended (“Ford’s revolving credit facility”) have commitments totaling $13.4 billion, with about 75% of the commitments maturing on April 30, 2020 and about 25% of commitments maturing on April 30, 2018. Ford has allocated $3.0 billion of these commitments, including commitments under a Chinese renminbi sub-facility, to us on an irrevocable and exclusive basis to support our growth and liquidity. At December 31, 2015, all $3.0 billion was available for use.
FC-29
FORD MOTOR CREDIT COMPANY LLC AND SUBSIDIARIES
NOTES TO THE FINANCIAL STATEMENTS
NOTE 10. INCOME TAXES
Ford Motor Credit Company LLC is a disregarded entity for United States income tax purposes and Ford’s consolidated United States federal and state income tax returns include certain of our domestic subsidiaries. In accordance with our intercompany tax sharing agreement with Ford, United States income tax liabilities or credits are allocated to us generally on a separate return basis calculated as if we were taxable as a corporation.
The Provision for income taxes for the years ended December 31 was estimated as follows (in millions):
2015 | 2014 | 2013 | |||||||||
Current | |||||||||||
Federal | $ | (454 | ) | $ | (198 | ) | $ | 185 | |||
Non-U.S. | 161 | 154 | 169 | ||||||||
State and local | (26 | ) | (38 | ) | (55 | ) | |||||
Total current | (319 | ) | (82 | ) | 299 | ||||||
Deferred | |||||||||||
Federal | 893 | 193 | — | ||||||||
Non-U.S. | 93 | (6 | ) | (29 | ) | ||||||
State and local | 56 | 44 | 7 | ||||||||
Total deferred | 1,042 | 231 | (22 | ) | |||||||
Provision for income taxes | $ | 723 | $ | 149 | $ | 277 | |||||
A reconciliation of the Provision for income taxes with the United States statutory tax rate as a percentage of Income before income taxes for the years ended December 31 is as follows:
2015 | 2014 | 2013 | ||||||
U.S. statutory tax rate | 35.0 | % | 35.0 | % | 35.0 | % | ||
Effect of (in percentage points): | ||||||||
Non-U.S. tax rates under U.S. rate | (3.0 | ) | (3.0 | ) | (2.3 | ) | ||
State and local income taxes | 1.0 | (0.2 | ) | (1.0 | ) | |||
U.S. tax on non-U.S. earnings (a) | 0.2 | (21.4 | ) | (15.0 | ) | |||
Other | (0.2 | ) | (2.4 | ) | 1.9 | |||
Valuation allowance | 1.7 | — | (2.8 | ) | ||||
Effective tax rate | 34.7 | % | 8.0 | % | 15.8 | % | ||
________
(a) | During 2014, we changed our method for measuring currency gains and losses in computing the earnings of our European operations under U.S. tax law. Implementation of the new method resulted in a reduction of U.S. tax on non-U.S. earnings of approximately $360 million due to realization of additional foreign tax credits. |
At December 31, 2015, $2.9 billion of non-U.S. earnings are considered indefinitely reinvested in operations outside the United States, for which deferred taxes have not been provided. Repatriation of these earnings in their entirety would result in a residual U.S. tax liability of about $600 million. Our measure of the amount of non-U.S. earnings considered indefinitely reinvested in operations outside the United States reflects accumulated earnings determined under U.S. tax law.
FC-30
FORD MOTOR CREDIT COMPANY LLC AND SUBSIDIARIES
NOTES TO THE FINANCIAL STATEMENTS
NOTE 10. INCOME TAXES (Continued)
During 2013, we concluded that $500 million in earnings from our European operations, previously planned for distribution to the United States and for which we recognized U.S. tax expense, will now be indefinitely reinvested outside the United States. These earnings will be used to fund non-U.S. operations, and therefore they are not planned to be distributed to the United States in the foreseeable future.
Deferred tax assets and liabilities are recognized based on the future tax consequences attributable to temporary differences that exist between the financial statement carrying value of assets and liabilities and their respective tax bases, and net operating loss carryforwards and tax credit carryforwards on a taxing jurisdiction basis. We measure deferred tax assets and liabilities using enacted tax rates that will apply in the years in which we expect the temporary differences to be recovered or paid.
Our accounting for deferred tax consequences represents our best estimate of the likely future tax consequences of events that have been recognized in our financial statements or tax returns and their future probability. In assessing the need for a valuation allowance, we consider both positive and negative evidence related to the likelihood of realization of the deferred tax assets. If, based on the weight of available evidence, it is more likely than not that the deferred tax assets will not be realized, we record a valuation allowance.
The components of deferred tax assets and liabilities were as follows (in millions):
December 31, 2015 | December 31, 2014 | ||||||
Deferred tax assets | |||||||
Net operating loss carryforwards | $ | 540 | $ | 227 | |||
Provision for credit losses | 87 | 140 | |||||
Other foreign | 75 | 186 | |||||
Employee benefit plans | 10 | 11 | |||||
Foreign tax credits | 756 | 685 | |||||
Other | 280 | 282 | |||||
Total gross deferred tax assets | 1,748 | 1,531 | |||||
Less: Valuation allowance | (47 | ) | (10 | ) | |||
Total net deferred tax assets | 1,701 | 1,521 | |||||
Deferred tax liabilities | |||||||
Leasing transactions | 3,338 | 2,035 | |||||
Finance receivables | 688 | 647 | |||||
Other foreign | 330 | 480 | |||||
Other | 18 | 23 | |||||
Total deferred tax liabilities | 4,374 | 3,185 | |||||
Net deferred tax liability | $ | 2,673 | $ | 1,664 | |||
At December 31, 2015, we have a valuation allowance of $47 million for deferred tax assets related to our Latin American operations.
In accordance with our intercompany tax sharing agreement with Ford, United States income tax liabilities or credits are allocated to us, generally on a separate return basis. In this regard, the deferred tax assets related to foreign tax credits and net operating loss carryforwards represent amounts primarily due from Ford. Under our tax sharing agreement with Ford, we are generally paid for these assets at the earlier of our use on a separate return basis or their expiration.
Operating loss carryforwards for tax purposes were $1.6 billion at December 31, 2015, resulting in a deferred tax asset of $540 million. These losses begin to expire in 2019 with a substantial portion expiring in 2036. Tax benefits of net operating loss carryforwards and tax credit carryforwards are evaluated on an ongoing basis, including a review of historical and projected future operating results, the eligible carryforward period, and other circumstances.
FC-31
FORD MOTOR CREDIT COMPANY LLC AND SUBSIDIARIES
NOTES TO THE FINANCIAL STATEMENTS
NOTE 10. INCOME TAXES (Continued)
In accordance with our intercompany tax sharing agreement with Ford, we earn interest on net tax assets and pay interest on certain tax liabilities. Interest earned is included in Other income, net while interest expense is included in Interest expense.
The changes in the unrecognized tax benefits for the years ended December 31 were as follows (in millions):
2015 | 2014 | 2013 | |||||||||
Beginning balance | $ | 111 | $ | 159 | $ | 491 | |||||
Increase - tax positions in prior periods | 9 | 28 | 28 | ||||||||
Increase - tax positions in current period | 1 | 1 | 1 | ||||||||
Decrease - tax positions in prior periods | (22 | ) | (44 | ) | (68 | ) | |||||
Settlements | (8 | ) | (33 | ) | (293 | ) | |||||
Ending balance | $ | 91 | $ | 111 | $ | 159 | |||||
The amount of unrecognized tax benefits at December 31, 2015, 2014, and 2013 that would impact the effective tax rate if recognized, was $76 million, $88 million, and $128 million, respectively. We do not believe it is reasonably possible that the total amounts of unrecognized tax benefits will significantly increase or decrease during the next twelve months.
We have settled our U.S. federal income tax matters related to tax years prior to 2012 in accordance with our intercompany tax sharing agreement with Ford. The Ford consolidated tax return is currently under examination for the 2012 and 2013 tax years. Examinations by tax authorities have been completed through 2008 in Germany, 2010 in Canada, and 2013 in the United Kingdom.
We recognize income tax-related penalties in Provision for/(Benefit from) income taxes on our income statement. We recognize accrued interest expense related to unrecognized tax benefits in jurisdictions where we file tax returns separate from Ford in Other income, net on our income statement. For the years ended December 31, 2015, 2014, and 2013, we recorded $3 million in net tax related interest income, $13 million in net tax related interest expense, and $17 million in net tax related interest income, respectively, in our income statement. At December 31, 2015 and 2014, we recorded a net payable of $37 million and $50 million, respectively, for tax related interest in Other liabilities and deferred income.
NOTE 11. ACCUMULATED OTHER COMPREHENSIVE INCOME/(LOSS)
The changes in the balance of Accumulated Other Comprehensive Income/(Loss) (“AOCI”) for the years ended December 31 were as follows (in millions):
2015 | 2014 | 2013 | |||||||||
Foreign currency translation | |||||||||||
Beginning balance | $ | 160 | $ | 717 | $ | 743 | |||||
Net gain/(loss) on foreign currency translation | (767 | ) | (547 | ) | (86 | ) | |||||
Reclassifications from shareholder’s interest (a)(b) | — | (10 | ) | 60 | |||||||
Other comprehensive income/(loss) including reclassification adjustments, net of tax | (767 | ) | (557 | ) | (26 | ) | |||||
Ending balance | $ | (607 | ) | $ | 160 | $ | 717 | ||||
Total AOCI ending balance at December 31 | $ | (607 | ) | $ | 160 | $ | 717 | ||||
__________
(a) | In 2014, we recorded a foreign currency translation adjustment related to the acquisition of a subsidiary of Ford. This adjustment also increased Shareholder’s interest and did not impact the Total Shareholder’s interest on our balance sheet. |
(b) | In 2013, we recorded a foreign currency translation adjustment related to FCE’s acquisition of the net residual assets of an affiliated company. This adjustment also decreased Shareholder’s interest and did not impact the Total shareholder’s interest on our balance sheet. |
FC-32
FORD MOTOR CREDIT COMPANY LLC AND SUBSIDIARIES
NOTES TO THE FINANCIAL STATEMENTS
NOTE 12. INSURANCE
We conduct insurance underwriting operations primarily through The American Road Insurance Company (“TARIC”) and other subsidiaries. TARIC is a wholly owned subsidiary of Ford Credit operating in the United States and Canada. TARIC provides physical damage insurance coverage for Ford Credit financed vehicles at dealer locations and Ford and Lincoln vehicles in transit between final assembly plants and dealer locations. In addition, TARIC provides a variety of insurance products and services to Ford and its affiliates, including contractual liability insurance on extended service contracts. For Ford US, TARIC provides commercial automobile and general liability insurance, and surety bonds.
Insurance premiums earned are reported net of reinsurance as Insurance premiums earned. These premiums are earned over their respective policy periods. Physical damage insurance premiums, including premiums on vehicles financed at wholesale by us, are recognized as income on a monthly basis. Premiums from extended service plan contracts and other contractual liability coverages are earned over the life of the policy based on historical loss experience. Commissions and premium taxes are deferred and amortized over the term of the related policies on the same basis on which premiums are earned.
TARIC is required by law to maintain deposits with regulatory authorities. These deposited securities totaled $12 million and $13 million at December 31, 2015 and 2014, respectively.
Insurance Expenses and Liabilities
Insurance underwriting losses and expenses are reported as Insurance expenses. The components of insurance expenses were as follows for the years ended December 31 (in millions):
2015 | 2014 | 2013 | |||||||||
Insurance losses | $ | 80 | $ | 115 | $ | 70 | |||||
Loss adjustment expenses | 5 | 6 | 6 | ||||||||
Reinsurance income and other expenses, net | (16 | ) | (14 | ) | (13 | ) | |||||
Insurance expenses | $ | 69 | $ | 107 | $ | 63 | |||||
The insurance loss and loss adjustment expenses, net of recoveries, with related parties were $36 million, $30 million, and $26 million for the years ended December 31, 2015, 2014, and 2013, respectively.
Reserves for insurance losses and loss adjustment expenses are established based on actuarial estimates and historical loss development patterns, which represents management’s best estimate. If management believes the reserves do not reflect all losses due to changes in conditions, or other relevant factors, an adjustment is made based on management judgment. The reserve for reported insurance losses and an estimate of unreported insurance losses, based on past experience, was $8 million and $11 million at December 31, 2015 and 2014, respectively, and was included in Other liabilities and deferred income.
Reinsurance
Reinsurance activity primarily consists of ceding a majority of automotive extended service plan contracts for a ceding commission. Amounts recoverable from reinsurers on unpaid losses, including incurred but not reported losses, and amounts paid to reinsurers relating to the unexpired portion of reinsurance contracts are reported in Other assets. Ceded insurance expenses that were deducted from the amounts reported as Insurance expenses were $76 million, $68 million, and $64 million for the years ended December 31, 2015, 2014, and 2013, respectively.
FC-33
FORD MOTOR CREDIT COMPANY LLC AND SUBSIDIARIES
NOTES TO THE FINANCIAL STATEMENTS
NOTE 12. INSURANCE (Continued)
The effect of reinsurance on premiums written and earned was as follows for the years ended December 31 (in millions):
2015 | 2014 | 2013 | |||||||||||||||||||||
Written | Earned | Written | Earned | Written | Earned | ||||||||||||||||||
Direct | $ | 328 | $ | 254 | $ | 293 | $ | 230 | $ | 270 | $ | 216 | |||||||||||
Assumed | — | — | — | — | — | — | |||||||||||||||||
Ceded | (194 | ) | (121 | ) | (166 | ) | (105 | ) | (151 | ) | (97 | ) | |||||||||||
Net premiums | $ | 134 | $ | 133 | $ | 127 | $ | 125 | $ | 119 | $ | 119 | |||||||||||
The insurance premiums earned, net of amounts ceded, with related parties were $90 million, $75 million, and $64 million for the years ended December 31, 2015, 2014, and 2013, respectively. The amount of unearned insurance premiums ceded to related parties were $176 million and $149 million at December 31, 2015 and 2014, respectively.
Commissions on reinsurance ceded are earned on the same basis as related premiums. Reinsurance contracts do not relieve TARIC from its obligations to its policyholders. Failure of reinsurers to honor their obligations could result in losses to TARIC. Therefore, TARIC either directly or indirectly (via insurance brokers) monitors the underlying business and financial performance of the reinsurers. In addition, where deemed necessary, TARIC may require collateral or utilize multiple reinsurers to mitigate concentration risk.
NOTE 13. OTHER INCOME, NET
Other income consists of various line items that are combined on the income statement due to their respective materiality compared with other individual income and expense items.
The amounts included in Other income, net were as follows for the years ended December 31 (in millions):
2015 | 2014 | 2013 | |||||||||
Gains/(Losses) on derivatives | $ | 110 | $ | 208 | $ | (148 | ) | ||||
Currency revaluation gains/(losses) | (161 | ) | (236 | ) | 82 | ||||||
Interest and investment income (a) | 69 | 53 | 50 | ||||||||
Insurance fee income | 88 | 74 | 61 | ||||||||
Other | 178 | 166 | 213 | ||||||||
Total other income, net | $ | 284 | $ | 265 | $ | 258 | |||||
__________
(a) | Includes interest income primarily on notes receivable from affiliated companies of $3 million, $5 million, $11 million for December 31, 2015, 2014, and 2013 respectively. |
FC-34
FORD MOTOR CREDIT COMPANY LLC AND SUBSIDIARIES
NOTES TO THE FINANCIAL STATEMENTS
NOTE 14. RETIREMENT BENEFITS
We are a participating employer in certain retirement plans that are sponsored by Ford. As described below, Ford allocates costs to us under these plans based on the total number of participating or eligible employees at Ford Credit. Further information about these sponsored plans is available in Ford’s Annual Report on Form 10-K for the year ended December 31, 2015, filed separately with the Securities and Exchange Commission.
Benefits earned under certain Ford-sponsored retirement plans are generally based on an employee’s length of service, salary, and contributions. The allocation amount can be impacted by key assumptions (for example, discount rate and average rate of increase in compensation) that Ford uses in determining its retirement plan obligations. Also, we are jointly and severally liable to the Pension Benefit Guaranty Corporation (“PBGC”) for certain Ford IRS-qualified U.S. defined benefit pension plan liabilities and to any trustee appointed if one or more of these pension plans were to be terminated by the PBGC in a distress termination. We are liable to pay any plan deficiencies and could have a lien placed on our assets by the PBGC to collateralize this liability.
Retirement plan service costs allocated to Ford Credit for our employees in the U.S. participating in the Ford-sponsored plans were $30 million, $26 million, and $26 million for the years ended December 31, 2015, 2014, and 2013, respectively, and were charged to Operating expenses. The allocated cost for 2015 was equivalent to 9% of Ford’s total U.S. salaried retirement plan service cost.
NOTE 15. FAIR VALUE MEASUREMENTS
Cash equivalents, marketable securities, and derivative financial instruments are remeasured and presented on our financial statements on a recurring basis at fair value, while other assets and liabilities are measured at fair value on a nonrecurring basis.
Fair Value Measurements
In measuring fair value, we use various valuation methods and prioritize the use of observable inputs. The use of observable and unobservable inputs and their significance in measuring fair value are reflected in our fair value hierarchy.
• | Level 1 – inputs include quoted prices for identical instruments and are the most observable |
• | Level 2 – inputs include quoted prices for similar instruments and observable inputs such as interest rates, currency exchange rates, and yield curves |
• | Level 3 – inputs include data not observable in the market and reflect management judgment about the assumptions market participants would use in pricing the instruments |
Transfers into and transfers out of the hierarchy levels are recognized as if they had taken place at the end of the reporting period.
Valuation Methods
Cash and Cash Equivalents. Included in Cash and cash equivalents are highly liquid investments that are readily convertible to known amounts of cash and are subject to an insignificant risk of change in value due to interest rate, quoted price, or penalty on withdrawal. A debt security is classified as a cash equivalent if it meets these criteria and if it has a remaining time to maturity of three months or less from the date of acquisition. Amounts on deposit and available upon demand, or negotiated to provide for daily liquidity without penalty, are classified as Cash and cash equivalents. Time deposits, certificates of deposit, and money market accounts that meet the above criteria are reported at par value on our balance sheet and are excluded from the table below.
FC-35
FORD MOTOR CREDIT COMPANY LLC AND SUBSIDIARIES
NOTES TO THE FINANCIAL STATEMENTS
NOTE 15. FAIR VALUE MEASUREMENTS (Continued)
Marketable Securities. Investments in securities with a maturity date greater than three months at the date of purchase and other securities for which there is more than an insignificant risk of change in value due to interest rate, quoted price, or penalty on withdrawal are classified as Marketable securities. We generally measure fair value using prices obtained from pricing services. Pricing methods and inputs to valuation models used by the pricing services depend on the security type (i.e., asset class). Where possible, fair values are generated using market inputs including quoted prices (the closing price in an exchange market), bid prices (the price at which a buyer stands ready to purchase), and other market information. For fixed income securities that are not actively traded, the pricing services use alternative methods to determine fair value for the securities, including quotes for similar fixed income securities, matrix pricing, discounted cash flow using benchmark curves, or other factors. In certain cases, when market data are not available, we may use broker quotes to determine fair value.
An annual review is performed on the security prices received from our pricing services, which includes discussion and analysis of the inputs used by the pricing services to value our securities. We also compare the price of certain securities sold close to the quarter end to the price of the same security at the balance sheet date to ensure the reported fair value is reasonable.
Realized and unrealized gains and losses and interest income on our marketable securities are recorded in Other income, net. Realized gains and losses are measured using the specific identification method.
Derivative Financial Instruments. Our derivatives are over-the-counter customized derivative transactions and are not exchange traded. We estimate the fair value of these instruments using industry-standard valuation models such as a discounted cash flow. These models project future cash flows and discount the future amounts to a present value using market-based expectations for interest rates, foreign exchange rates, and the contractual terms of the derivative instruments. The discount rate used is the relevant interbank deposit rate (e.g., LIBOR) plus an adjustment for non-performance risk. The adjustment reflects the full credit default swap (“CDS”) spread applied to a net exposure, by counterparty, considering the master netting agreements and any posted collateral. We use our counterparty’s CDS spread when we are in a net asset position and our own CDS spread when we are in a net liability position.
Finance Receivables. We measure finance receivables at fair value for purposes of disclosure (see Note 2 for additional information) using internal valuation models. These models project future cash flows of financing contracts based on scheduled contract payments (including principal and interest). The projected cash flows are discounted to present value based on assumptions regarding credit losses, pre-payment speed, and applicable spreads to approximate current rates. Our assumptions regarding pre-payment speed and credit losses are based on historical performance. The fair value of finance receivables is categorized within Level 3 of the hierarchy.
On a nonrecurring basis, we also measure at fair value retail contracts greater than 120 days past due or deemed to be uncollectible, and individual dealer loans probable of foreclosure. We use the fair value of collateral, adjusted for estimated costs to sell, to determine the fair value of our receivables. The collateral for a retail receivable is the vehicle financed, and for dealer loans is real estate or other property.
The fair value of collateral for retail receivables is calculated by multiplying the outstanding receivable balances by the average recovery value percentage. The fair value of collateral for dealer loans is determined by reviewing various appraisals, which include total adjusted appraised value of land and improvements, alternate use appraised value, broker’s opinion of value, and purchase offers.
FC-36
FORD MOTOR CREDIT COMPANY LLC AND SUBSIDIARIES
NOTES TO THE FINANCIAL STATEMENTS
NOTE 15. FAIR VALUE MEASUREMENTS (Continued)
Debt. We measure debt at fair value for purposes of disclosure (see Note 9 for additional information) using quoted prices for our own debt with approximately the same remaining maturities. Where quoted prices are not available, we estimate fair value using discounted cash flows and market-based expectations for interest rates, credit risk, and the contractual terms of the debt instruments. For certain short-term debt with an original maturity date of one year or less, we assume that book value is a reasonable approximation of the debt’s fair value. The fair value of debt is categorized within Level 2 of the hierarchy.
Input Hierarchy of Items Measured at Fair Value on a Recurring Basis
The following table categorizes the fair values of items measured at fair value on a recurring basis on our balance sheet, none of which are Level 3 (in millions):
December 31, 2015 | December 31, 2014 | ||||||||||||||||||||||
Level 1 | Level 2 | Total | Level 1 | Level 2 | Total | ||||||||||||||||||
Assets | |||||||||||||||||||||||
Cash equivalents-financial instruments | |||||||||||||||||||||||
Non-U.S. government and agencies | $ | — | $ | 266 | $ | 266 | $ | — | $ | 341 | $ | 341 | |||||||||||
Corporate debt | — | — | — | — | 10 | 10 | |||||||||||||||||
Total cash equivalents-financial instruments (a) | — | 266 | 266 | — | 351 | 351 | |||||||||||||||||
Marketable securities | |||||||||||||||||||||||
U.S. government and agencies | 298 | 1,169 | 1,467 | 17 | 1,251 | 1,268 | |||||||||||||||||
Non-U.S. government and agencies | — | 832 | 832 | — | 405 | 405 | |||||||||||||||||
Corporate debt | — | 384 | 384 | — | 1,555 | 1,555 | |||||||||||||||||
Other marketable securities | — | 40 | 40 | — | 30 | 30 | |||||||||||||||||
Total marketable securities | 298 | 2,425 | 2,723 | 17 | 3,241 | 3,258 | |||||||||||||||||
Derivative financial instruments | |||||||||||||||||||||||
Derivative financial instruments (b) | — | 924 | 924 | — | 859 | 859 | |||||||||||||||||
Total assets at fair value | $ | 298 | $ | 3,615 | $ | 3,913 | $ | 17 | $ | 4,451 | $ | 4,468 | |||||||||||
Liabilities | |||||||||||||||||||||||
Derivative financial instruments (b) | $ | — | $ | 243 | $ | 243 | $ | — | $ | 167 | $ | 167 | |||||||||||
Total liabilities at fair value | $ | — | $ | 243 | $ | 243 | $ | — | $ | 167 | $ | 167 | |||||||||||
__________
(a) | Excludes time deposits, certificates of deposit, and money market accounts reported at par value on our balance sheet totaling $6.3 billion and $3.8 billion at December 31, 2015 and 2014, respectively. In addition to these cash equivalents, we also had cash on hand totaling $2.3 billion and $2.0 billion at December 31, 2015 and 2014, respectively. |
(b) | See Note 7 for additional information regarding derivative financial instruments. |
FC-37
FORD MOTOR CREDIT COMPANY LLC AND SUBSIDIARIES
NOTES TO THE FINANCIAL STATEMENTS
NOTE 16. SEGMENT AND GEOGRAPHIC INFORMATION
We conduct our financing operations directly and indirectly through our subsidiaries and affiliates. We offer substantially similar products and services throughout many different regions, subject to local legal restrictions and market conditions. We divide our business segments based on geographic regions: North America (“North America Segment”) and International (“International Segment”). The North America Segment includes our operations in the United States and Canada. The International Segment includes our operations in all other countries in which we do business directly and indirectly.
We review our business performance on a managed basis. Receivables for the North America and International Segments are presented on a managed basis, as it closely approximates the customer's outstanding balance on the receivables, which is the basis for earning revenue. Our managed receivables equal net finance receivables and net investment in operating leases, excluding unearned interest supplements and residual support, allowance for credit losses, and other (primarily accumulated supplemental depreciation).
We measure the performance of our North America and International Segments primarily on an income before income taxes basis, after excluding the impact to earnings from gains and losses related to market valuation adjustments to derivatives primarily related to movements in interest rates. These adjustments are included in unallocated risk management and are excluded in assessing our North America and International segment performance, because they are carried out on a centralized basis at the corporate level. We also adjust segment performance to re-allocate interest expense between the North America and International segments reflecting debt and equity levels proportionate to their product risk.
FC-38
FORD MOTOR CREDIT COMPANY LLC AND SUBSIDIARIES
NOTES TO THE FINANCIAL STATEMENTS
NOTE 16. SEGMENT AND GEOGRAPHIC INFORMATION (Continued)
Key operating data for our business segments for the years ended or at December 31 were as follows (in millions):
Unallocated/Eliminations | |||||||||||||||||||||||
North America Segment | International Segment | Unallocated Risk Management | Adjustment to Receivables (a) | Total Unallocated/Eliminations | Total | ||||||||||||||||||
2015 | |||||||||||||||||||||||
Total revenue (b) | $ | 8,048 | $ | 1,650 | $ | (1 | ) | $ | — | $ | (1 | ) | $ | 9,697 | |||||||||
Income before income taxes | 1,629 | 458 | (1 | ) | — | (1 | ) | 2,086 | |||||||||||||||
Other disclosures: | |||||||||||||||||||||||
Depreciation on vehicles subject to operating leases | 3,603 | 37 | — | — | — | 3,640 | |||||||||||||||||
Interest expense | 1,811 | 605 | — | — | — | 2,416 | |||||||||||||||||
Provision for credit losses | 294 | 53 | — | — | — | 347 | |||||||||||||||||
Net finance receivables and net investment in operating leases | 103,268 | 23,964 | — | (5,330 | ) | (5,330 | ) | 121,902 | |||||||||||||||
Total assets | 109,339 | 28,109 | — | — | — | 137,448 | |||||||||||||||||
2014 | |||||||||||||||||||||||
Total revenue (b) | $ | 7,351 | $ | 1,651 | $ | (6 | ) | $ | — | $ | (6 | ) | $ | 8,996 | |||||||||
Income before income taxes | 1,399 | 461 | (6 | ) | — | (6 | ) | 1,854 | |||||||||||||||
Other disclosures: | |||||||||||||||||||||||
Depreciation on vehicles subject to operating leases | 3,045 | 43 | — | — | — | 3,088 | |||||||||||||||||
Interest expense | 2,010 | 646 | — | — | — | 2,656 | |||||||||||||||||
Provision for credit losses | 157 | 40 | — | — | — | 197 | |||||||||||||||||
Net finance receivables and net investment in operating leases | 91,021 | 21,762 | — | (4,350 | ) | (4,350 | ) | 108,433 | |||||||||||||||
Total assets | 96,016 | 26,092 | — | — | — | 122,108 | |||||||||||||||||
2013 | |||||||||||||||||||||||
Total revenue (b) | $ | 6,708 | $ | 1,527 | $ | (53 | ) | $ | — | $ | (53 | ) | $ | 8,182 | |||||||||
Income before income taxes | 1,438 | 371 | (53 | ) | — | (53 | ) | 1,756 | |||||||||||||||
Other disclosures: | |||||||||||||||||||||||
Depreciation on vehicles subject to operating leases | 2,369 | 28 | — | — | — | 2,397 | |||||||||||||||||
Interest expense | 2,088 | 642 | — | — | — | 2,730 | |||||||||||||||||
Provision for credit losses | 114 | 32 | — | — | — | 146 | |||||||||||||||||
Net finance receivables and net investment in operating leases | 83,722 | 19,688 | — | (3,497 | ) | (3,497 | ) | 99,913 | |||||||||||||||
Total assets | 90,720 | 24,888 | — | — | — | 115,608 | |||||||||||||||||
__________
(a) | Includes unearned interest supplements and residual support, allowances for credit losses, and other (primarily accumulated supplemental depreciation). |
(b) | Represents Total financing revenue, Insurance premiums earned, and Other income, net. |
FC-39
FORD MOTOR CREDIT COMPANY LLC AND SUBSIDIARIES
NOTES TO THE FINANCIAL STATEMENTS
NOTE 16. SEGMENT AND GEOGRAPHIC INFORMATION (Continued)
Geographic Information
Key data for our geographic operations in the United States, Canada, Europe, and other foreign operations were as follows for the years ended or at December 31 (in millions):
2015 | 2014 | 2013 | |||||||||
Total revenue (a) | |||||||||||
United States | $ | 7,070 | $ | 6,377 | $ | 5,739 | |||||
Canada | 981 | 998 | 909 | ||||||||
Europe | 979 | 1,041 | 1,132 | ||||||||
All other | 667 | 580 | 402 | ||||||||
Total revenue | $ | 9,697 | $ | 8,996 | $ | 8,182 | |||||
Income before income taxes | |||||||||||
United States | $ | 1,298 | $ | 1,199 | $ | 1,160 | |||||
Canada | 247 | 148 | 127 | ||||||||
Europe | 316 | 332 | 319 | ||||||||
All other | 225 | 175 | 150 | ||||||||
Total income before income taxes | $ | 2,086 | $ | 1,854 | $ | 1,756 | |||||
Finance receivables, net and net investment in operating leases | |||||||||||
United States | $ | 88,237 | $ | 76,578 | $ | 70,513 | |||||
Canada | 10,037 | 10,449 | 10,085 | ||||||||
Europe | 18,657 | 16,708 | 15,674 | ||||||||
All other | 4,971 | 4,698 | 3,641 | ||||||||
Total finance receivables, net and net investment in operating leases | $ | 121,902 | $ | 108,433 | $ | 99,913 | |||||
__________
(a) | Represents Total financing revenue, Insurance premiums earned, and Other income, net. |
FC-40
FORD MOTOR CREDIT COMPANY LLC AND SUBSIDIARIES
NOTES TO THE FINANCIAL STATEMENTS
NOTE 17. SELECTED QUARTERLY FINANCIAL DATA (Unaudited)
Selected financial data by calendar quarter were as follows (in millions):
First Quarter | Second Quarter | Third Quarter | Fourth Quarter | Full Year | |||||||||||||||
2015 | |||||||||||||||||||
Total revenue (a) | $ | 2,282 | $ | 2,338 | $ | 2,478 | $ | 2,599 | $ | 9,697 | |||||||||
Depreciation on vehicles subject to operating leases | (816 | ) | (858 | ) | (956 | ) | (1,010 | ) | (3,640 | ) | |||||||||
Interest expense | (638 | ) | (599 | ) | (582 | ) | (597 | ) | (2,416 | ) | |||||||||
Total financing margin and other revenue | 828 | 881 | 940 | 992 | 3,641 | ||||||||||||||
Provision for credit losses | 67 | 72 | 100 | 108 | 347 | ||||||||||||||
Net income | 306 | 340 | 365 | 352 | 1,363 | ||||||||||||||
2014 | |||||||||||||||||||
Total revenue (a) | $ | 2,159 | $ | 2,234 | $ | 2,312 | $ | 2,291 | $ | 8,996 | |||||||||
Depreciation on vehicles subject to operating leases | (705 | ) | (742 | ) | (801 | ) | (840 | ) | (3,088 | ) | |||||||||
Interest expense | (666 | ) | (673 | ) | (663 | ) | (654 | ) | (2,656 | ) | |||||||||
Total financing margin and other revenue | 788 | 819 | 848 | 797 | 3,252 | ||||||||||||||
Provision for credit losses | 31 | 27 | 57 | 82 | 197 | ||||||||||||||
Net income (b) | 312 | 264 | 718 | 411 | 1,705 | ||||||||||||||
__________
(a) | Represents Total financing revenue, Insurance premiums earned, and Other income, net. |
(b) | The third quarter net income includes favorable tax items of approximately $360 million resulting from a change in our method for measuring currency gains and losses in computing earnings of our European operations under U.S. tax law. See Note 10 for additional information. |
NOTE 18. COMMITMENTS AND CONTINGENCIES
Commitments and contingencies primarily consist of lease commitments, guarantees and indemnifications, and litigation and claims.
Lease Commitments
We have rental commitments for certain land, buildings, and equipment that expire over various contractual periods. Minimum non-cancelable operating lease commitments at December 31, 2015 were as follows (in millions):
2016 | 2017 | 2018 | 2019 | 2020 | Thereafter | ||||||||||||||||||
Minimum rentals on operating leases | $ | 19 | $ | 16 | $ | 10 | $ | 6 | $ | 5 | $ | 7 | |||||||||||
Rental expense under cancelable and non-cancelable leases of $27 million, $26 million, and $25 million was recorded in Operating expenses for the years ended December 31, 2015, 2014, and 2013, respectively.
Guarantees and Indemnifications
Guarantees and indemnifications are recorded at fair value at their inception. We regularly review our performance risk under these arrangements, and in the event it becomes probable we will be required to perform under a guarantee or indemnity, the amount of probable payment is recorded.
In some cases, we have guaranteed debt and other financial obligations of outside third parties and unconsolidated affiliates, including Ford. Expiration dates vary, and guarantees will terminate on payment and/or cancellation of the underlying obligation. A payment by us would be triggered by failure of the guaranteed party to fulfill its obligation covered by the guarantee. In some circumstances, we are entitled to recover from Ford, an affiliate of Ford, or a third party amounts paid by us under the guarantee. However, our ability to enforce these rights is sometimes stayed until the guaranteed party is paid in full, and may be limited in the event of insolvency of the third party or other circumstances.
FC-41
FORD MOTOR CREDIT COMPANY LLC AND SUBSIDIARIES
NOTES TO THE FINANCIAL STATEMENTS
NOTE 18. COMMITMENTS AND CONTINGENCIES (Continued)
In the ordinary course of business, we execute contracts involving indemnifications standard in the industry and indemnifications specific to a transaction. These indemnifications might include and are not limited to claims relating to any of the following: environmental, tax, and shareholder matters; intellectual property rights; governmental regulations and employment-related matters; dealer and other commercial contractual relationships; and financial matters, such as securitizations. Performance under these indemnities generally would be triggered by a breach of terms of the contract or by a third-party claim. While some of these indemnifications are limited in nature, many of them do not limit potential payment. Therefore, we are unable to estimate a maximum amount of future payments that could result from claims made under these unlimited indemnities.
The maximum potential payments under these guarantees and limited indemnities totaled $80 million and $107 million at December 31, 2015 and 2014, respectively. Of these values, $74 million and $101 million at December 31, 2015 and 2014, respectively, were counter-guaranteed by Ford to us. There were no recorded liabilities related to guarantees and limited indemnities at December 31, 2015 and 2014.
Litigation and Claims
Various legal actions, proceedings, and claims (generally, “matters”) are pending or may be instituted or asserted against us. These include but are not limited to matters arising out of governmental regulations; tax matters; alleged illegal acts resulting in fines or penalties; financial services; employment-related matters; dealer and other contractual relationships; personal injury matters; investor matters; and financial reporting matters. Certain of the pending legal actions are, or purport to be, class actions. Some of the matters involve or may involve claims for compensatory, punitive, or antitrust or other treble damages in very large amounts, sanctions, assessments, or other relief, which, if granted, would require very large expenditures.
The extent of our financial exposure to these matters is difficult to estimate. Many matters do not specify a dollar amount for damages, and many others specify only a jurisdictional minimum. To the extent an amount is asserted, our historical experience suggests that in most instances the amount asserted is not a reliable indicator of the ultimate outcome.
We accrue for matters when losses are deemed probable and reasonably estimable. In evaluating matters for accrual and disclosure purposes, we take into consideration factors such as our historical experience with matters of a similar nature, the specific facts and circumstances asserted, the likelihood that we will prevail, and the severity of any potential loss. We reevaluate and update our accruals as matters progress over time.
For nearly all of our matters, where our historical experience with similar matters is of limited value (i.e., “non-pattern matters”), we evaluate the matters primarily based on the individual facts and circumstances. For non-pattern matters, we evaluate whether there is a reasonable possibility of a material loss in excess of any accrual that can be estimated. It is reasonably possible that some of the matters for which accruals have not been established could be decided unfavorably to us and could require us to pay damages or make other expenditures. We do not reasonably expect, based on our analysis, that such matters would have a material effect on future financial statements for a particular year, although such an outcome is possible.
As noted, the litigation process is subject to many uncertainties, and the outcome of individual matters is not predictable with assurance. Our assessments are based on our knowledge and experience, but the ultimate outcome of any matter could require payment substantially in excess of the amount that we have accrued and/or disclosed.
FC-42