Attached files
| file | filename |
|---|---|
| 8-K - FORM 8-K - Aleris Corp | d596234d8k.htm |
Exhibit 99.1
|
CONFIDENTIAL PUBLIC LENDER PRESENTATION MAY 2018 DRAFT 5.28.18 STRICTLY PRIVATE AND CONFIDENTIAL
|
CONFIDENTIAL DISCLAIMER IMPORTANT INFORMATION This information is current only as of its date and may have changed. We undertake no obligation to update this information in light of new information, future events or otherwise. This information contains certain forecasts and other forward looking information concerning our business, prospects, financial condition and results of operations, and we are not making any representation or warranty that this information is accurate or complete. See “Forward-Looking Information” below. In particular, this presentation includes Structuring Adj. EBITDA, a non-GAAP financial measure and forward-looking statement, which is being provided for illustrative purposes only in connection with the refinancing transactions. Accordingly, the Company does not intend to update or provide this financial measure on an ongoing basis. BASIS OF PRESENTATION We are a direct wholly owned subsidiary of Aleris Corporation. Aleris Corporation currently conducts its business and operations through us and our consolidated subsidiaries. As used in this presentation, unless otherwise specified or the context otherwise requires, “Aleris,” “we,” “our,” “us,” “ and the “Company” refer to Aleris International, Inc. and its consolidated subsidiaries. Notwithstanding the foregoing, with respect to the financial information presented in this presentation, unless otherwise specified or the context requires, “Aleris,” “we,” “our,” “us,” and the “Company” refer to Aleris Corporation and its consolidated subsidiaries. We completed the sale of our recycling and specification alloys and extrusions businesses in the first quarter of 2015. We have reported these businesses as discontinued operations for all periods presented, and reclassified the results of operations of these businesses as discontinued operations. Except as otherwise indicated, the discussion of the Company’s business and financial information throughout this presentation refers to the Company’s continuing operations and the financial position and results of operations of its continuing operations. FORWARD-LOOKING INFORMATION Certain statements contained in this presentation are “forward-looking statements” within the meaning of the federal securities laws. Statements under the heading “Q2 2018 Outlook” and statements about our beliefs and expectations and statements containing the words “may,” “could,” “would,” “should,” “will,” “believe,” “expect,” “anticipate,” “plan,” “estimate,” “target,” “project,” “look forward to,” “intend” and similar expressions intended to connote future events and circumstances constitute forward-looking statements. Forward-looking statements include statements about future costs and prices of commodities, production volumes, customer commitments, industry trends, anticipated cost savings, anticipated benefits from new products, facilities, acquisitions or divestitures, projected results of operations, achievement of production efficiencies, capacity expansions, future prices and demand for our products and estimated cash flows and sufficiency of cash flows to fund operations, capital expenditures and debt obligations, as well as statements regarding the impact of trade cases, tariffs and other future governmental actions. Forward-looking statements involve known and unknown risks and uncertainties, which could cause actual results to differ materially from those contained in or implied by any forward-looking statement. Important factors that could cause actual results to differ materially from the forward-looking statements include, but are not limited to, the following: (1) our ability to successfully implement our business strategy; (2) the success of past and future acquisitions or divestitures; (3) the cyclical nature of the aluminum industry, material adverse changes in the aluminum industry or our end-uses, such as global and regional supply and demand conditions for aluminum and aluminum products, and changes in our customers’ industries; (4) increases in the cost, or limited availability, of raw materials and energy; (5) our ability to enter into effective metal, energy and other commodity derivatives or arrangements with customers to manage effectively our exposure to commodity price fluctuations and changes in the pricing of metals, especially London Metal Exchange-based aluminum prices; (6) our ability to generate sufficient cash flows to fund our operations and capital expenditure requirements and to meet our debt obligations; (7) competitor pricing activity, competition of aluminum with alternative materials and the general impact of competition in the industry end-uses we serve; (8) our ability to retain the services of certain members of our management; (9) the loss of order volumes from any of our largest customers; (10) our ability to retain customers, a substantial number of whom do not have long-term contractual arrangements with us; (11) risks of investing in and conducting operations on a global basis, including political, social, economic, currency and regulatory factors; (12) variability in general economic or political conditions on a global or regional basis; (13) current environmental liabilities and the cost of compliance with and liabilities under health and safety laws; (14) labor relations (i.e., disruptions, strikes or work stoppages) and labor costs; (15) our internal controls over financial reporting and our disclosure controls and procedures may not prevent all possible errors that could occur; (16) our levels of indebtedness and debt service obligations, including changes in our credit ratings, material increases in our cost of borrowing or the failure of financial institutions to fulfill their commitments to us under committed facilities; (17) our ability to access credit or capital markets; (18) the possibility that we may incur additional indebtedness in the future; (19) limitations on operating our business and incurring additional indebtedness as a result of covenant restrictions under our indebtedness, and our ability to pay amounts due under our outstanding indebtedness; and (20) other factors discussed in our filings with the Securities and Exchange Commission, including the sections entitled “Risk Factors” contained therein. In particular, this presentation contains Structuring Adj. EBITDA, a non-GAAP financial measure and forward-looking statement. Structuring Adj. EBITDA is subject to various risks and uncertainties, many of which are listed above and beyond our control. For example, we have estimated the future financial impact of certain customer purchase commitments net of their expected costs. Actual costs may exceed our projections, which could limit the benefits we expect to realize from these customer purchase commitments. We have also made certain assumptions regarding customer purchase commitments based on our historical experience with such customers and industry practice. Some of these commitments are not subject to contractual arrangements, and these customers may seek to reduce or delay their commitments. In addition, certain of the anticipated benefits contained in Structuring Adj. EBITDA are not expected to be realized until the successful ramp-up of ABS production at our Lewisport facility and of certain aerospace production. As a result, we expect to realize only a portion of the anticipated benefits contained in Structuring Adj. EBITDA during 2018, as ramp-up at these facilities is expected to occur over the next several years. You are urged to consider all these factors carefully in evaluating the forward-looking statements and are cautioned not to place undue reliance on such forward-looking statements. We undertake no obligation to publicly update or revise any forward-looking statements, whether in response to new information, futures events or otherwise, except as otherwise required by law.
|
CONFIDENTIAL DISCLAIMER (CONTINUED) NON-GAAP INFORMATION The non-GAAP financial measures contained in this presentation (including, without limitation, Adj. EBITDA, Pro forma Adj. EBITDA and Structuring Adj. EBITDA) are not measures of financial performance calculated in accordance with U.S. GAAP and should not be considered as alternatives to net income and loss attributable to Aleris Corporation or any other performance measure derived in accordance with GAAP or as alternatives to cash flows from operating activities as a measure of our liquidity. Non-GAAP measures have limitations as analytical tools and should be considered in addition to, not in isolation or as a substitute for, or as superior to, our measures of financial performance prepared in accordance with GAAP. Management believes that certain non-GAAP financial measures may provide additional meaningful comparisons between current results and results in prior periods. Management uses non-GAAP financial measures as performance metrics and believes these measures provide additional information commonly used by the holders of our senior debt securities and parties to the ABL Facility with respect to the ongoing performance of our underlying business activities, as well as our ability to meet our future debt service, capital expenditure and working capital needs. We calculate our non-GAAP financial measures by eliminating the impact of a number of items we do not consider indicative of our ongoing operating performance, and, for certain periods, adding back certain other items. You are encouraged to evaluate each adjustment and the reasons we consider it appropriate for supplemental analysis. For reconciliations of non-GAAP financial measures to their most directly comparable GAAP financial measure, see the tables in the Appendix. INDUSTRY INFORMATION Information regarding market and industry statistics contained in this presentation is based on information from third party sources as well as estimates prepared by us using certain assumptions and our knowledge of these industries. Our estimates, in particular as they relate to our general expectations concerning the aluminum industry, involve risks and uncertainties and are subject to changes based on various factors, including those discussed under “Risk Factors” in our filings with the Securities and Exchange Commission. EXPLANATORY NOTE REGARDING Q2 2018 OUTLOOK Although we do not typically provide quantitative guidance, this presentation includes certain estimates for the quarter ending June 30, 2018. These estimates reflect management’s best estimates based upon currently available information and certain assumptions we believe to be reasonable, including, estimates of tons to be produced and sold during the quarter, commercial margin to be generated from tons sold and conversion costs to be incurred in production. Because we have not yet completed our second quarter of 2018, these estimates are inherently uncertain, subject to risks and uncertainties, many of which are not within our control, have not been reviewed by our independent auditors and may be revised as a result of management’s further review. In addition, these estimates are not a comprehensive statement of our financial results for the quarter ending June 30, 2018, and our actual results may differ materially from these estimates due to developments that may arise between now and the time our second quarter is completed, as well as the time the closing procedures for the fiscal quarter are completed. There can be no assurance that the estimates will be realized, and our results for the quarter ending June 30, 2018 or any future period may vary significantly from the estimates, including as a result of unexpected issues in our business and operations. Accordingly, you should not place undue reliance on such information. See “Forward-Looking Information.”
|
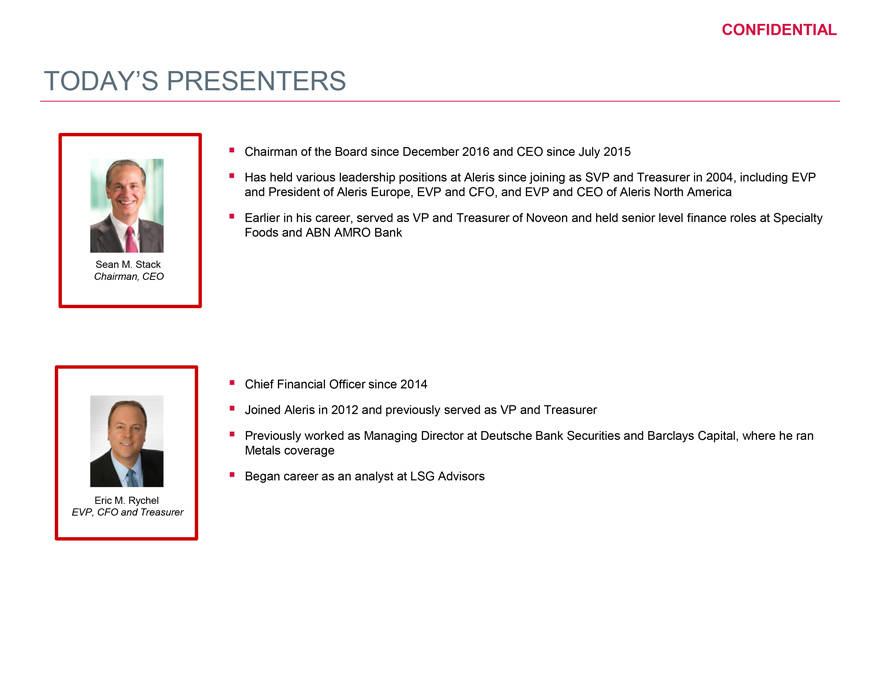
CONFIDENTIAL TODAY’S PRESENTERS Chairman of the Board since December 2016 and CEO since July 2015 Has held various leadership positions at Aleris since joining as SVP and Treasurer in 2004, including EVP and President of Aleris Europe, EVP and CFO, and EVP and CEO of Aleris North America Earlier in his career, served as VP and Treasurer of Noveon and held senior level finance roles at Specialty Foods and ABN AMRO Bank Sean M. Stack Chairman, CEO Chief Financial Officer since 2014 Joined Aleris in 2012 and previously served as VP and Treasurer Previously worked as Managing Director at Deutsche Bank Securities and Barclays Capital, where he ran Metals coverage Began career as an analyst at LSG Advisors Eric M. Rychel EVP, CFO and Treasurer
|
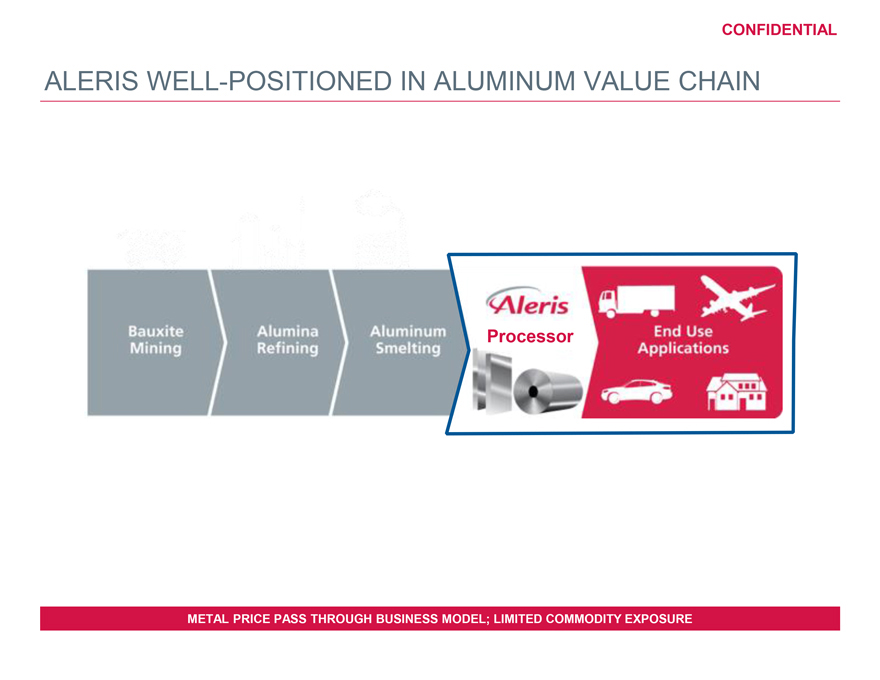
CONFIDENTIAL ALERIS WELL-POSITIONED IN ALUMINUM VALUE CHAIN Processor METAL PRICE PASS THROUGH BUSINESS MODEL; LIMITED COMMODITY EXPOSURE
|
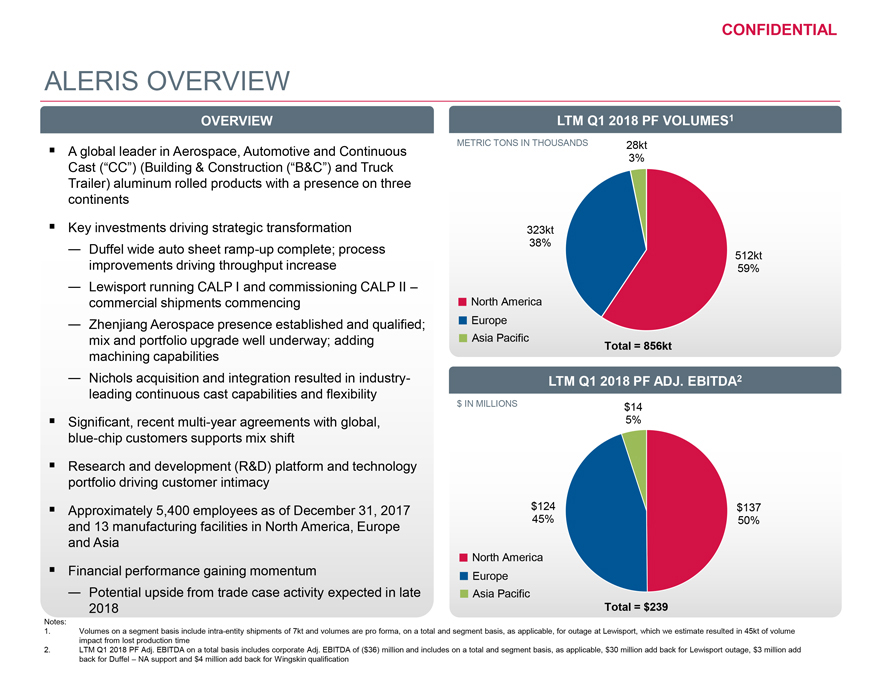
CONFIDENTIAL ALERIS OVERVIEW OVERVIEW LTM Q1 2018 PF VOLUMES1 A global leader in Aerospace, Automotive and Continuous METRIC TONS IN THOUSANDS 28kt 3% Cast (“CC”) (Building & Construction (“B&C”) and Truck Trailer) aluminum rolled products with a presence on three continents Key investments driving strategic transformation 323kt —Duffel wide auto sheet ramp-up complete; process 38% 512kt improvements driving throughput increase 59% —Lewisport running CALP I and commissioning CALP II – commercial shipments commencing North America —Zhenjiang Aerospace presence established and qualified; Europe mix and portfolio upgrade well underway; adding Asia Pacific Total = 856kt machining capabilities —Nichols acquisition and integration resulted in industry- LTM Q1 2018 PF ADJ. EBITDA2 leading continuous cast capabilities and flexibility $ IN MILLIONS $14 Significant, recent multi-year agreements with global, 5% blue-chip customers supports mix shift Research and development (R&D) platform and technology portfolio driving customer intimacy Approximately 5,400 employees as of December 31, 2017 $124 $137 and 13 manufacturing facilities in North America, Europe 45% 50% and Asia North America Financial performance gaining momentum Europe —Potential upside from trade case activity expected in late Asia Pacific 2018 Total = $239 Notes: 1. Volumes on a segment basis include intra-entity shipments of 7kt and volumes are pro forma, on a total and segment basis, as applicable, for outage at Lewisport, which we estimate resulted in 45kt of volume impact from lost production time 2. LTM Q1 2018 PF Adj. EBITDA on a total basis includes corporate Adj. EBITDA of ($36) million and includes on a total and segment basis, as applicable, $30 million add back for Lewisport outage, $3 million add back for Duffel – NA support and $4 million add back for Wingskin qualification
|
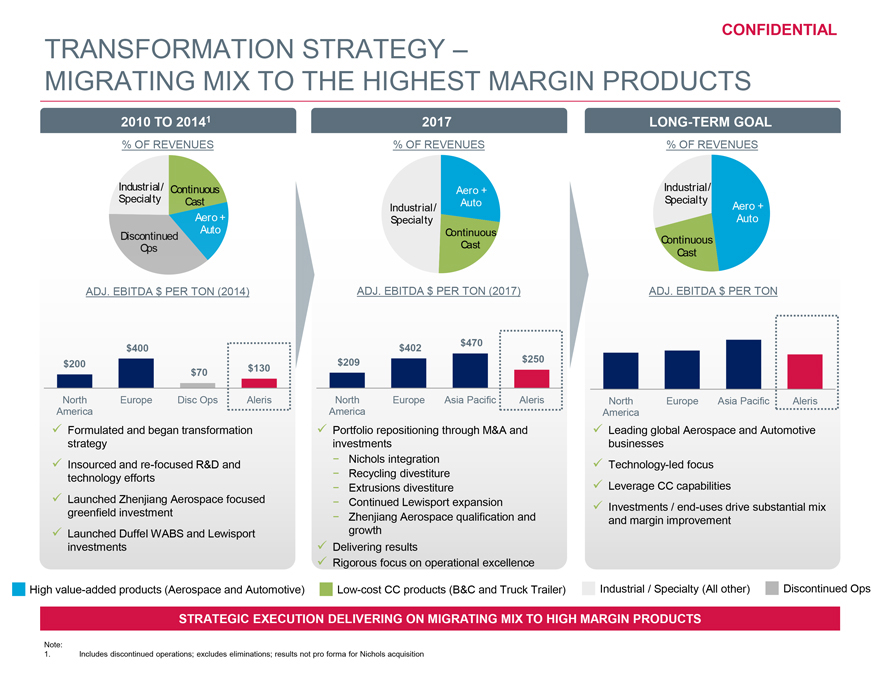
CONFIDENTIAL TRANSFORMATION STRATEGY – MIGRATING MIX TO THE HIGHEST MARGIN PRODUCTS 2010 TO 20141 2017 LONG-TERM GOAL % OF REVENUES % OF REVENUES % OF REVENUES Industrial / Continuous Aero + Industrial/ Specialty Cast Industrial / Auto Specialty Aero + Aero + Specialty Auto Discontinued Auto Continuous Continuous Ops Cast Cast ADJ. EBITDA $ PER TON (2014) ADJ. EBITDA $ PER TON (2017) ADJ. EBITDA $ PER TON $400 $402 $470 $200 $130 $209 $250 $70 North Europe Disc Ops Aleris North Europe Asia Pacific Aleris North Europe Asia Pacific Aleris America America America Formulated and began transformation Portfolio repositioning through M&A and Leading global Aerospace and Automotive strategy investments businesses Insourced and re-focused R&D and—Nichols integration Technology-led focus technology efforts—Recycling divestiture —Extrusions divestiture Leverage CC capabilities Launched Zhenjiang Aerospace focused—Continued Lewisport expansion Investments / end-uses drive substantial mix greenfield investment—Zhenjiang Aerospace qualification and and margin improvement Launched Duffel WABS and Lewisport growth investments Delivering results Rigorous focus on operational excellence High value-added products (Aerospace and Automotive) Low-cost CC products (B&C and Truck Trailer) Industrial / Specialty (All other) Discontinued Ops STRATEGIC EXECUTION DELIVERING ON MIGRATING MIX TO HIGH MARGIN PRODUCTS Note: 1. Includes discontinued operations; excludes eliminations; results not pro forma for Nichols acquisition
|
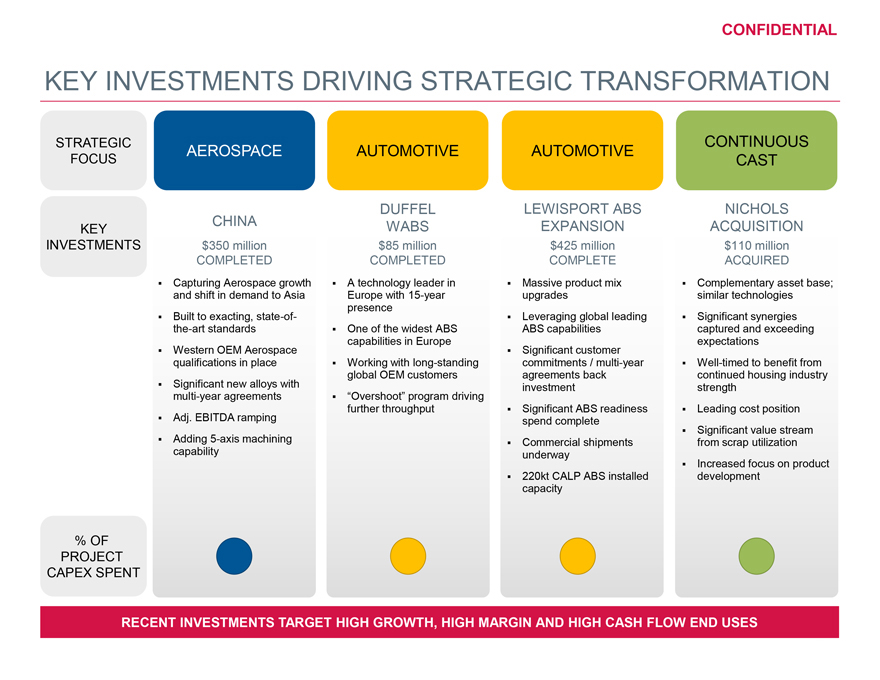
CONFIDENTIAL KEY INVESTMENTS DRIVING STRATEGIC TRANSFORMATION STRATEGIC CONTINUOUS AEROSPACE AUTOMOTIVE AUTOMOTIVE FOCUS CAST DUFFEL LEWISPORT ABS NICHOLS KEY CHINA WABS EXPANSION ACQUISITION INVESTMENTS $350 million $85 million $425 million $110 million COMPLETED COMPLETED COMPLETE ACQUIRED Capturing Aerospace growth A technology leader in Massive product mix Complementary asset base; and shift in demand to Asia Europe with 15-year upgrades similar technologies presence Built to exacting, state-of- Leveraging global leading Significant synergies the-art standards One of the widest ABS ABS capabilities captured and exceeding capabilities in Europe expectations Western OEM Aerospace Significant customer qualifications in place Working with long-standing commitments / multi-year Well-timed to benefit from global OEM customers agreements back continued housing industry Significant new alloys with investment strength multi-year agreements “Overshoot” program driving further throughput Significant ABS readiness Leading cost position Adj. EBITDA ramping spend complete Significant value stream Adding 5-axis machining Commercial shipments from scrap utilization capability underway Increased focus on product 220kt CALP ABS installed development capacity % OF PROJECT CAPEX SPENT RECENT INVESTMENTS TARGET HIGH GROWTH, HIGH MARGIN AND HIGH CASH FLOW END USES
|
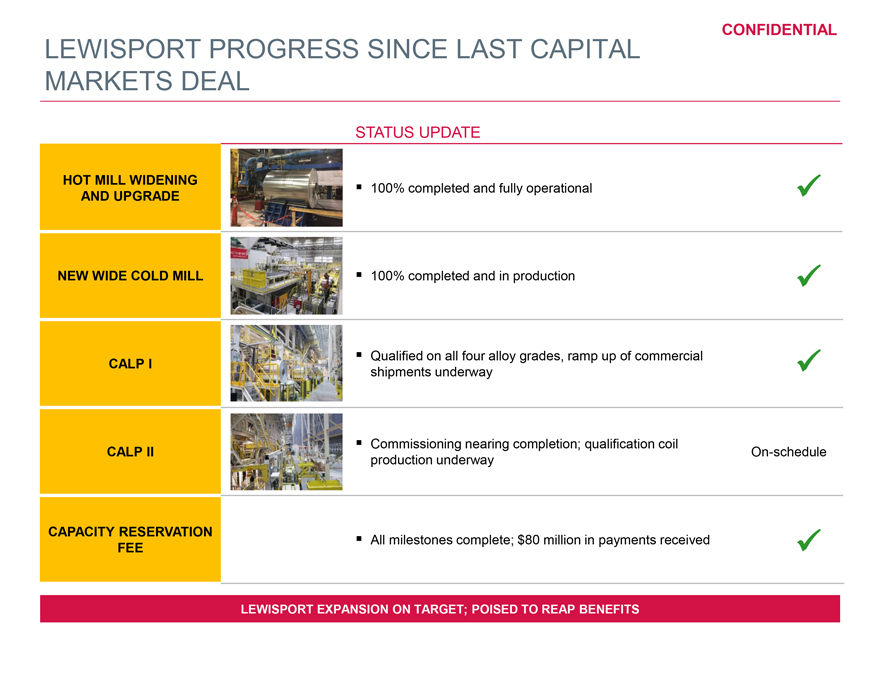
CONFIDENTIAL LEWISPORT PROGRESS SINCE LAST CAPITAL MARKETS DEAL STATUS UPDATE HOT MILL WIDENING 100% completed and fully operational AND UPGRADE NEW WIDE COLD MILL 100% completed and in production CALP I Qualified on all four alloy grades, ramp up of commercial shipments underway Commissioning nearing completion; qualification coil CALP II On-schedule production underway CAPACITY RESERVATION FEE All milestones complete; $80 million in payments received LEWISPORT EXPANSION ON TARGET; POISED TO REAP BENEFITS
|
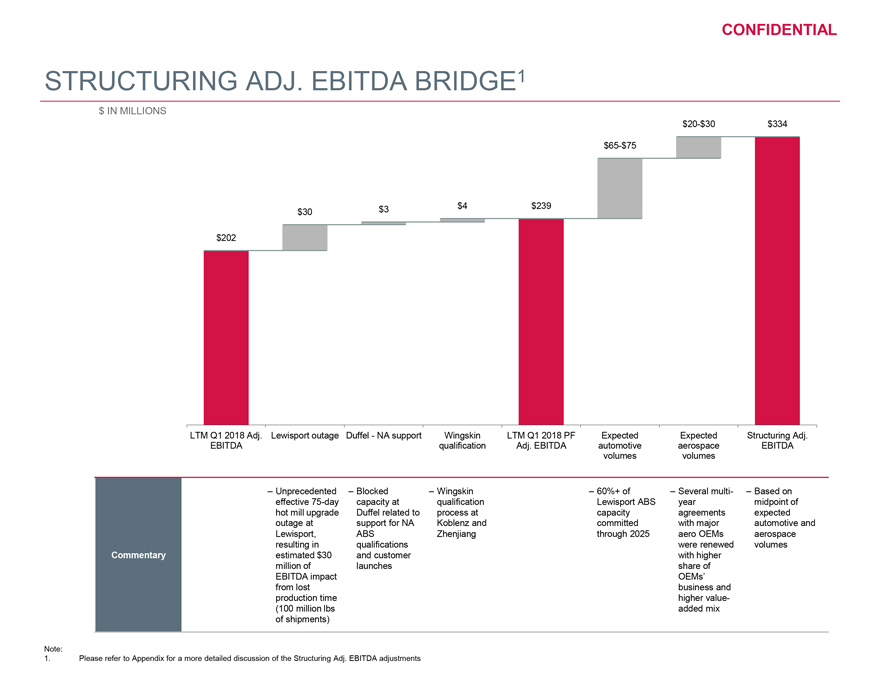
CONFIDENTIAL STRUCTURING ADJ. EBITDA BRIDGE1 $ IN MILLIONS $20-$30 $334 $65-$75 $30 $3 $4 $239 $202 LTM Q1 2018 Adj. Lewisport outage Duffel - NA support Wingskin LTM Q1 2018 PF Expected Expected Structuring Adj. EBITDA qualification Adj. EBITDA automotive aerospace EBITDA volumes volumes – Unprecedented – Blocked – Wingskin – 60%+ of – Several multi- – Based on effective 75-day capacity at qualification Lewisport ABS year midpoint of hot mill upgrade Duffel related to process at capacity agreements expected outage at support for NA Koblenz and committed with major automotive and Lewisport, ABS Zhenjiang through 2025 aero OEMs aerospace resulting in qualifications were renewed volumes Commentary estimated $30 and customer with higher million of launches share of EBITDA impact OEMs’ from lost business and production time higher value- (100 million lbs added mix of shipments) Note: 1. Please refer to Appendix for a more detailed discussion of the Structuring Adj. EBITDA adjustments
|
CONFIDENTIAL KEY INVESTMENT HIGHLIGHTS GLOBAL PLATFORM WITH LEADING POSITIONS ACROSS ATTRACTIVE 1 END-USES 2 ATTRACTIVE DEMAND AND STRONG INDUSTRY FUNDAMENTALS 3 BLUE-CHIP, BROAD AND DIVERSE CUSTOMER BASE 4 BROAD RANGE OF MANUFACTURING CAPABILITIES 5 GLOBAL R&D PLATFORM AND TECHNOLOGY PORTFOLIO RECENT INVESTMENTS EXPECTED TO DRIVE EARNINGS AND CASH FLOW 6 MOMENTUM 7 DEEP BENCH OF OPERATING MANAGEMENT
|
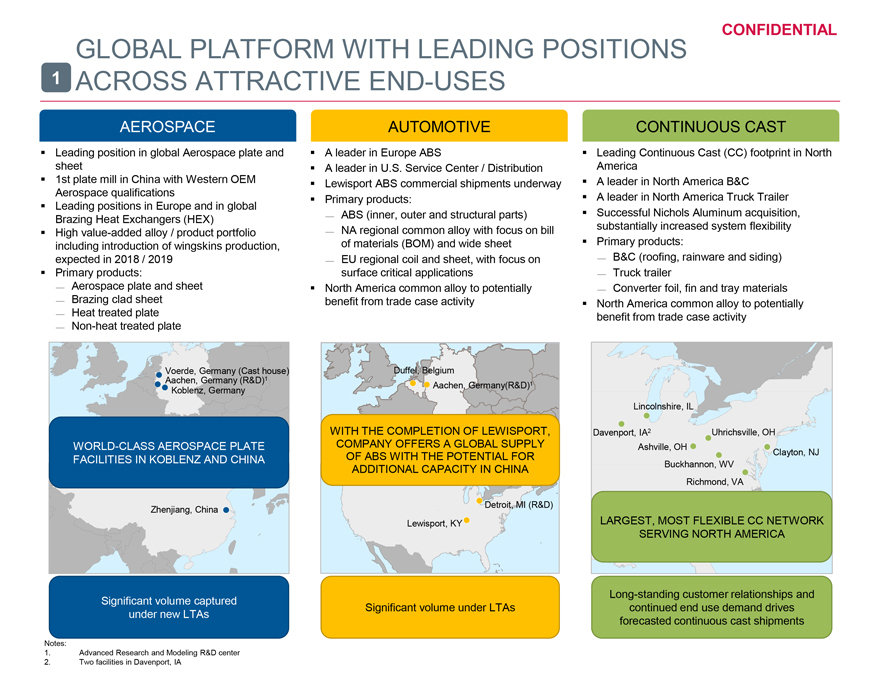
CONFIDENTIAL GLOBAL PLATFORM WITH LEADING POSITIONS 1 ACROSS ATTRACTIVE END-USES AEROSPACE AUTOMOTIVE CONTINUOUS CAST Leading position in global Aerospace plate and A leader in Europe ABS Leading Continuous Cast (CC) footprint in North sheet A leader in U.S. Service Center / Distribution America 1st plate mill in China with Western OEM Lewisport ABS commercial shipments underway A leader in North America B&C Aerospace qualifications Primary products: A leader in North America Truck Trailer Leading positions in Europe and in global Brazing Heat Exchangers (HEX) 3⁄4 ABS (inner, outer and structural parts) Successful Nichols Aluminum acquisition, High value-added alloy / product portfolio 3⁄4 NA regional common alloy with focus on bill substantially increased system flexibility including introduction of wingskins production, of materials (BOM) and wide sheet Primary products: expected in 2018 / 2019 3⁄4 EU regional coil and sheet, with focus on 3⁄4 B&C (roofing, rainware and siding) Primary products: surface critical applications 3⁄4 Truck trailer 3⁄4 Aerospace plate and sheet North America common alloy to potentially 3⁄4 Converter foil, fin and tray materials 3⁄4 Brazing clad sheet benefit from trade case activity North America common alloy to potentially 3⁄4 Heat treated plate benefit from trade case activity 3⁄4 Non-heat treated plate Voerde, Germany (Cast house) Duffel, Belgium Aachen, Germany (R&D)1 Koblenz, Germany Aachen, Germany(R&D)1 Lincolnshire, IL WITH THE COMPLETION OF LEWISPORT, Davenport, IA2 Uhrichsville, OH WORLD-CLASS AEROSPACE PLATE COMPANY OFFERS A GLOBAL SUPPLY Ashville, OH FACILITIES IN KOBLENZ AND CHINA OF ABS WITH THE POTENTIAL FOR Clayton, NJ ADDITIONAL CAPACITY IN CHINA Buckhannon, WV Richmond, VA Zhenjiang, China Detroit, MI (R&D) Lewisport, KY LARGEST, MOST FLEXIBLE CC NETWORK SERVING NORTH AMERICA Significant volume captured Long-standing customer relationships and under new LTAs Significant volume under LTAs continued end use demand drives forecasted continuous cast shipments Notes: 1. Advanced Research and Modeling R&D center 2. Two facilities in Davenport, IA
|
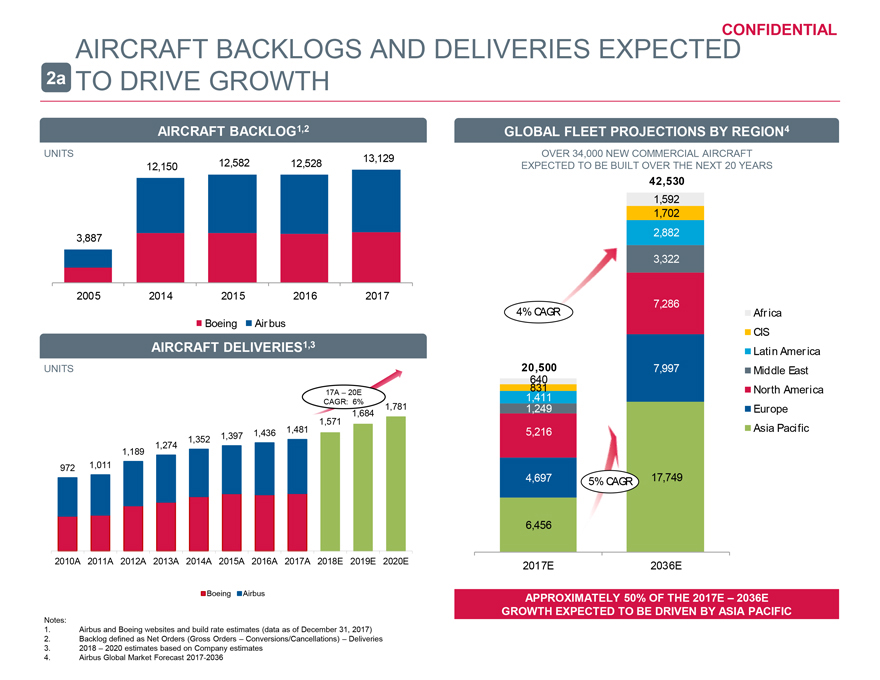
AIRCRAFT BACKLOGS AND DELIVERIES EXPECTEDCONFIDENTIAL 2a TO DRIVE GROWTH AIRCRAFT BACKLOG1,2 GLOBAL FLEET PROJECTIONS BY REGION4 UNITS 13,129 OVER 34,000 NEW COMMERCIAL AIRCRAFT 12,150 12,582 12,528 EXPECTED TO BE BUILT OVER THE NEXT 20 YEARS 42,530 1,592 1,702 3,887 2,882 3,322 2005 2014 2015 2016 2017 7,286 4% CAGR Afr ica Boeing Air bus CIS IRCRAFT DELIVERIES1,3 Latin Amer ica 20,500 7,997 Middle East 640 17A – 20E 831 North America CAGR: 6% 1,411 1,684 1,781 1,249 Europe 1,571 1,436 1,481 5,216 Asia Pacific 1,352 1,397 1,274 1,189 972 1,011 4,697 5% CAGR 17,749 6,456 2010A 2011A 2012A 2013A 2014A 2015A 2016A 2017A 2018E 2019E 2020E 2017E 2036E Boeing Airbus APPROXIMATELY 50% OF THE 2017E – 2036E GROWTH EXPECTED TO BE DRIVEN BY ASIA PACIFIC Notes: 1. Airbus and Boeing websites and build rate estimates (data as of December 31, 2017) 2. Backlog defined as Net Orders (Gross Orders – Conversions/Cancellations) – Deliveries 3. 2018 – 2020 estimates based on Company estimates 4. Airbus Global Market Forecast 2017-2036
|
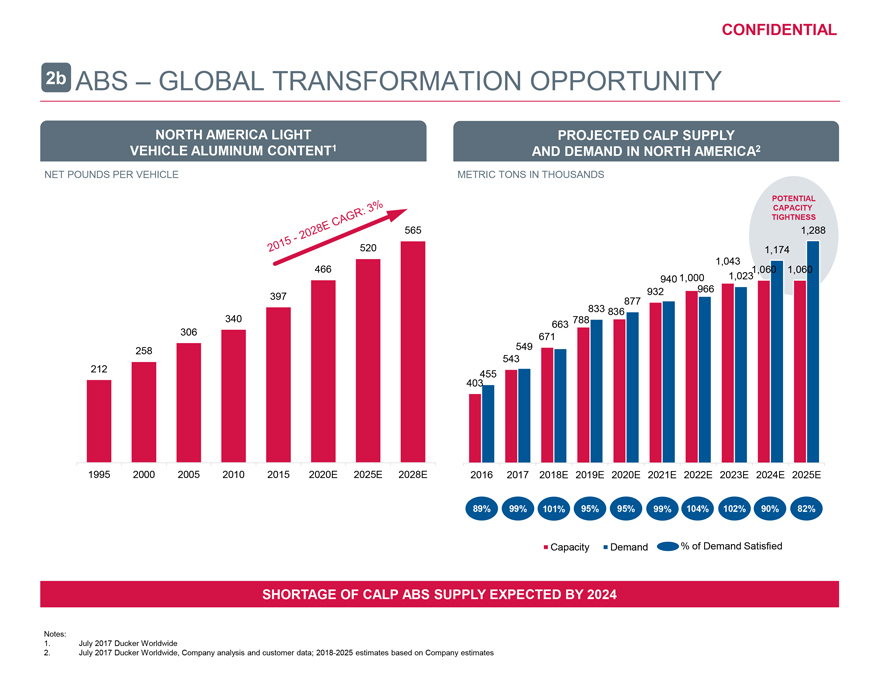
CONFIDENTIAL 2b ABS – GLOBAL TRANSFORMATION OPPORTUNITY NORTH AMERICA LIGHT PROJECTED CALP SUPPLY VEHICLE ALUMINUM CONTENT1 AND DEMAND IN NORTH AMERICA2 NET POUNDS PER VEHICLE METRIC TONS IN THOUSANDS POTENTIAL CAPACITY TIGHTNESS 565 1,288 520 1,174 1,043 466 1,060 1,060 940 1,000 1,023 397 932 966 877 833 836 340 788 663 306 671 258 549 543 212 455 403 1995 2000 2005 2010 2015 2020E 2025E 2028E 2016 2017 2018E 2019E 2020E 2021E 2022E 2023E 2024E 2025E 89% 99% 101% 95% 95% 99% 104% 102% 90% 82% Capacity Demand % of Demand Satisfied SHORTAGE OF CALP ABS SUPPLY EXPECTED BY 2024 Notes: 1. July 2017 Ducker Worldwide 2. July 2017 Ducker Worldwide, Company analysis and customer data; 2018-2025 estimates based on Company estimates
|
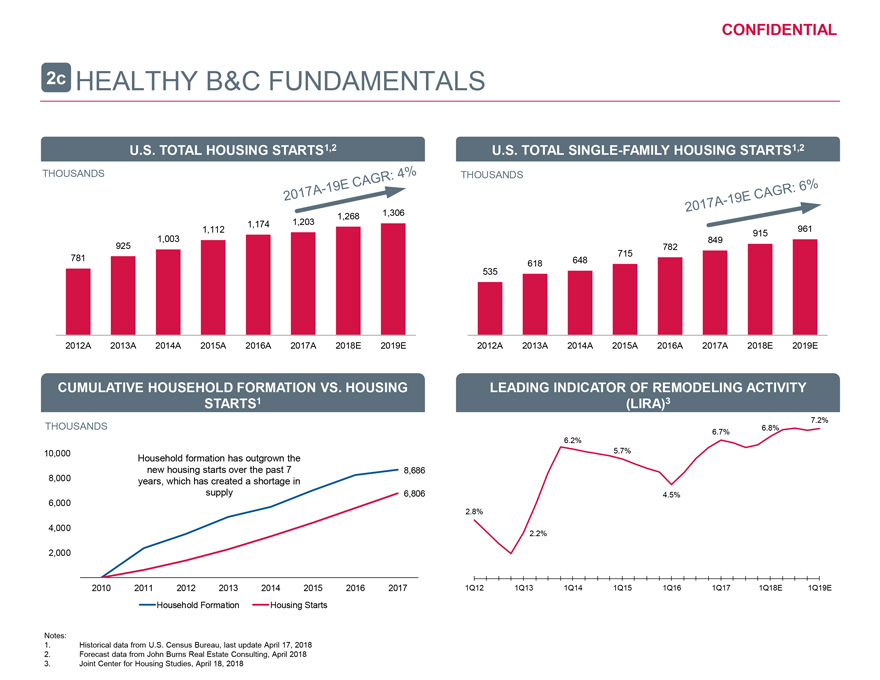
CONFIDENTIAL 2c HEALTHY B&C FUNDAMENTALS U.S. TOTAL HOUSING STARTS1,2 U.S. TOTAL SINGLE-FAMILY HOUSING STARTS1,2 THOUSANDS THOUSANDS 1,268 1,306 1,174 1,203 1,112 915 961 1,003 849 925 782 781 648 715 618 535 2012A 2013A 2014A 2015A 2016A 2017A 2018E 2019E 2012A 2013A 2014A 2015A 2016A 2017A 2018E 2019E CUMULATIVE HOUSEHOLD FORMATION VS. HOUSING LEADING INDICATOR OF REMODELING ACTIVITY STARTS1 (LIRA)3 7.2% THOUSANDS 6.8% 6.7% 6.2% 10,000 5.7% Household formation has outgrown the new housing starts over the past 7 8,686 8,000 years, which has created a shortage in supply 6,806 4.5% 6,000 2.8% 4,000 2.2% 2,000 2010 2011 2012 2013 2014 2015 2016 2017 1Q12 1Q13 1Q14 1Q15 1Q16 1Q17 1Q18E 1Q19E Household Formation Housing Starts Notes: 1. Historical data from U.S. Census Bureau, last update April 17, 2018 2. Forecast data from John Burns Real Estate Consulting, April 2018 3. Joint Center for Housing Studies, April 18, 2018
|
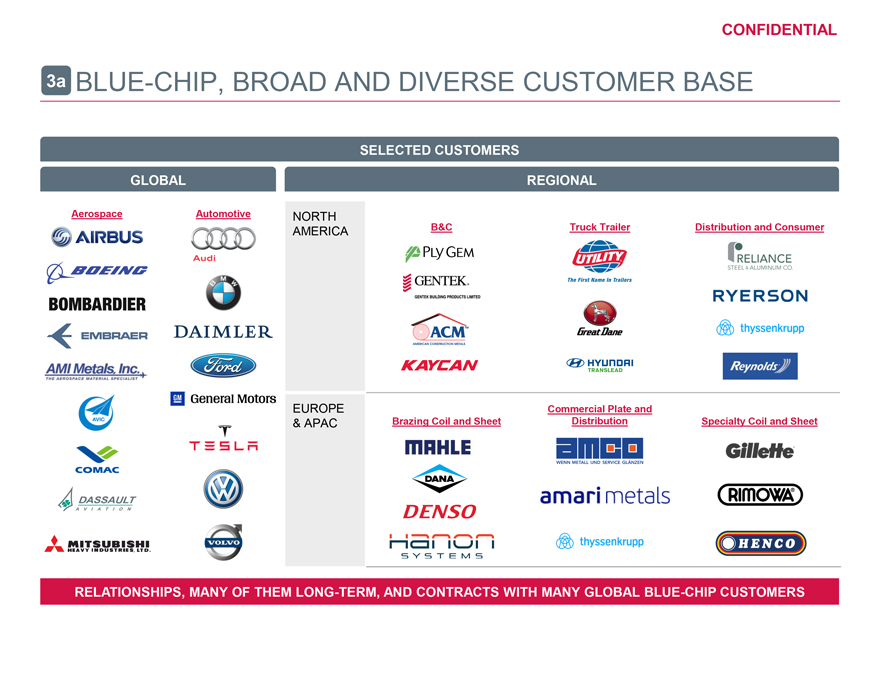
CONFIDENTIAL 3a BLUE-CHIP, BROAD AND DIVERSE CUSTOMER BASE SELECTED CUSTOMERS GLOBAL REGIONAL Aerospace Automotive NORTH AMERICA B&C Truck Trailer Distribution and Consumer EUROPE Commercial Plate and & APAC Brazing Coil and Sheet Distribution Specialty Coil and Sheet RELATIONSHIPS, MANY OF THEM LONG-TERM, AND CONTRACTS WITH MANY GLOBAL BLUE-CHIP CUSTOMERS
|
CONFIDENTIAL 3b KEY MULTI-YEAR AGREEMENTS DRIVE GROWTH AEROSPACE Significant proportion of projected volumes under LTAs with four global OEMs Substantial increased share on all new agreements Higher value alloy composition Wingskins – will supply to Airbus; under discussion on others Adding value through nesting / near net shapes and pre-machining Zhenjiang capability / strategic importance driving contract wins AUTOMOTIVE Significant proportion of projected volumes under LTAs Europe contracts are for specific vehicle programs North America OEM — 2018 through 2025 — Significant take-or-pay provision — Contains $80 million capacity reservation fee (fully collected) Other North America contracts follow industry practice MULTI-YEAR AGREEMENTS SUPPORT INVESTMENTS AND GROWTH
|
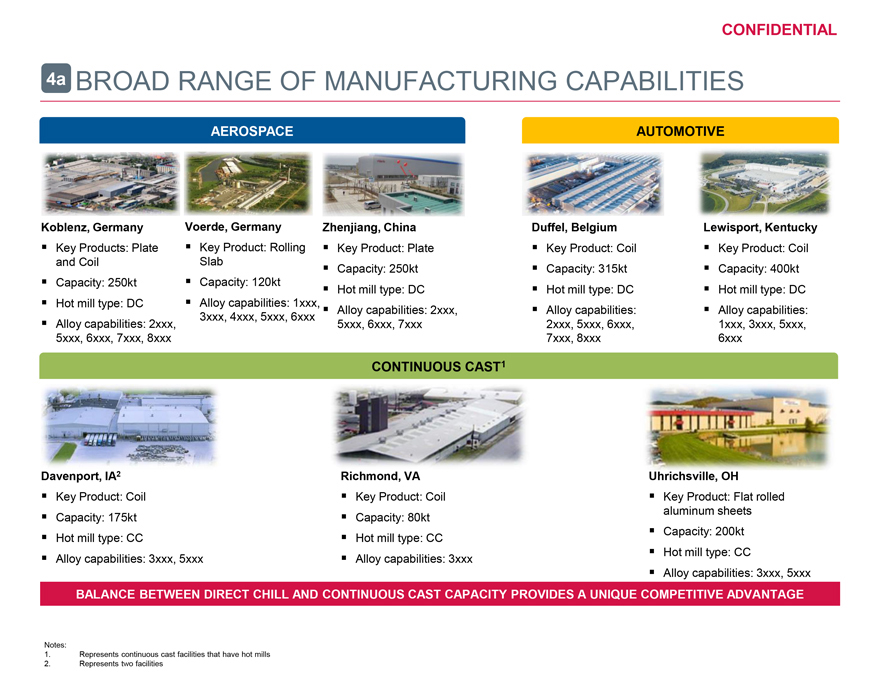
CONFIDENTIAL 4a BROAD RANGE OF MANUFACTURING CAPABILITIES AEROSPACE AUTOMOTIVE Koblenz, Germany Voerde, Germany Zhenjiang, China Duffel, Belgium Lewisport, Kentucky Key Products: Plate Key Product: Rolling Key Product: Plate Key Product: Coil Key Product: Coil and Coil Slab Capacity: 250kt Capacity: 315kt Capacity: 400kt Capacity: 250kt Capacity: 120kt Hot mill type: DC Hot mill type: DC Hot mill type: DC Hot mill type: DC Alloy capabilities: 1xxx, Alloy capabilities: 2xxx, Alloy capabilities: Alloy capabilities: Alloy capabilities: 2xxx, 3xxx, 4xxx, 5xxx, 6xxx 5xxx, 6xxx, 7xxx 2xxx, 5xxx, 6xxx, 1xxx, 3xxx, 5xxx, 5xxx, 6xxx, 7xxx, 8xxx 7xxx, 8xxx 6xxx CONTINUOUS CAST1 Davenport, IA2 Richmond, VA Uhrichsville, OH Key Product: Coil Key Product: Coil Key Product: Flat rolled Capacity: 175kt Capacity: 80kt aluminum sheets Hot mill type: CC Capacity: 200kt Alloy capabilities: 3xxx Hot mill type: CC Alloy capabilities: 3xxx, 5xxx BALANCE BETWEEN DIRECT CHILL AND CONTINUOUS CAST CAPACITY PROVIDES A UNIQUE COMPETITIVE ADVANTAGE Notes: 1. Represents continuous cast facilities that have hot mills 2. Represents two facilities
|
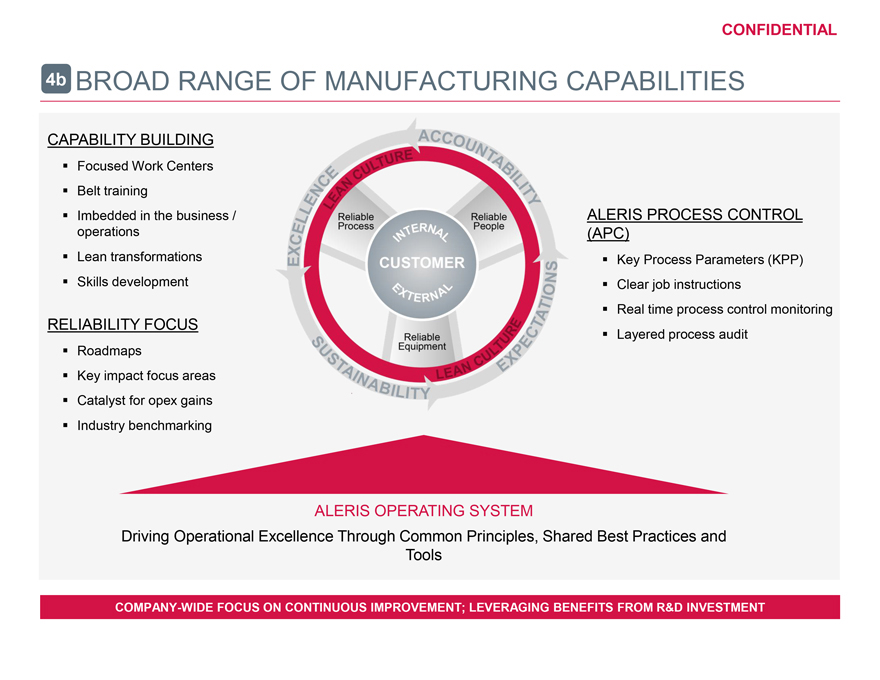
CONFIDENTIAL 4b BROAD RANGE OF MANUFACTURING CAPABILITIES CAPABILITY BUILDING Focused Work Centers Belt training Imbedded in the business / ALERIS PROCESS CONTROL operations (APC) Lean transformations Key Process Parameters (KPP) Skills development Clear job instructions Real time process control monitoring RELIABILITY FOCUS Layered process audit Roadmaps Key impact focus areas Catalyst for opex gains Industry benchmarking ALERIS OPERATING SYSTEM Driving Operational Excellence Through Common Principles, Shared Best Practices and Tools COMPANY-WIDE FOCUS ON CONTINUOUS IMPROVEMENT; LEVERAGING BENEFITS FROM R&D INVESTMENT
|
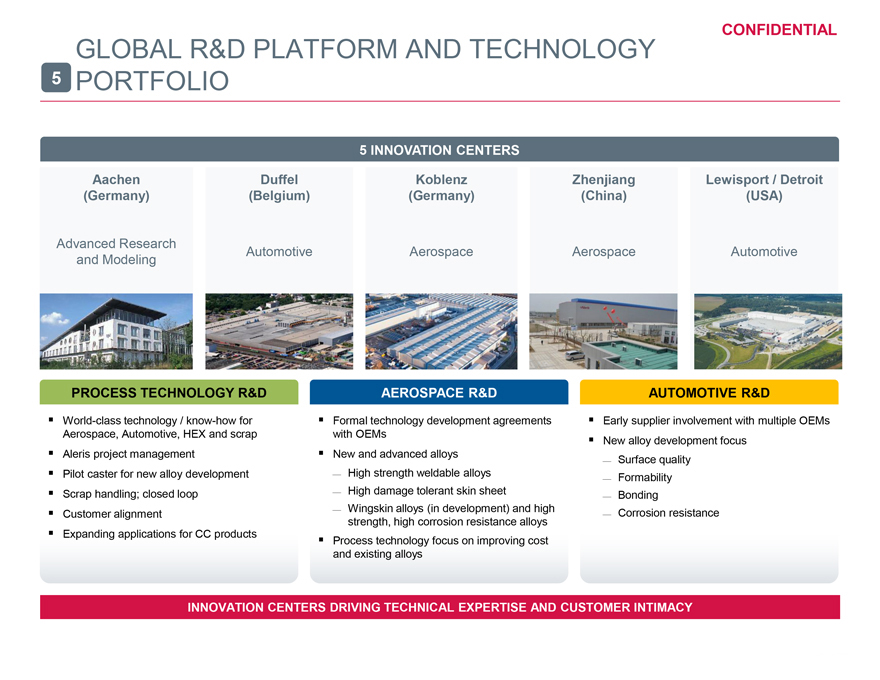
CONFIDENTIAL GLOBAL R&D PLATFORM AND TECHNOLOGY 5 PORTFOLIO 5 INNOVATION CENTERS Aachen Duffel Koblenz Zhenjiang Lewisport / Detroit (Germany) (Belgium) (Germany) (China) (USA) Advanced Research Automotive Aerospace Aerospace Automotive and Modeling PROCESS TECHNOLOGY R&D AEROSPACE R&D AUTOMOTIVE R&D World-class technology / know-how for Formal technology development agreements Early supplier involvement with multiple OEMs Aerospace, Automotive, HEX and scrap with OEMs New alloy development focus Aleris project management New and advanced alloys 3⁄4 Surface quality Pilot caster for new alloy development 3⁄4 High strength weldable alloys 3⁄4 Formability Scrap handling; closed loop 3⁄4 High damage tolerant skin sheet 3⁄4 Bonding Customer alignment 3⁄4 Wingskin alloys (in development) and high 3⁄4 Corrosion resistance strength, high corrosion resistance alloys Expanding applications for CC products Process technology focus on improving cost and existing alloys INNOVATION CENTERS DRIVING TECHNICAL EXPERTISE AND CUSTOMER INTIMACY
|
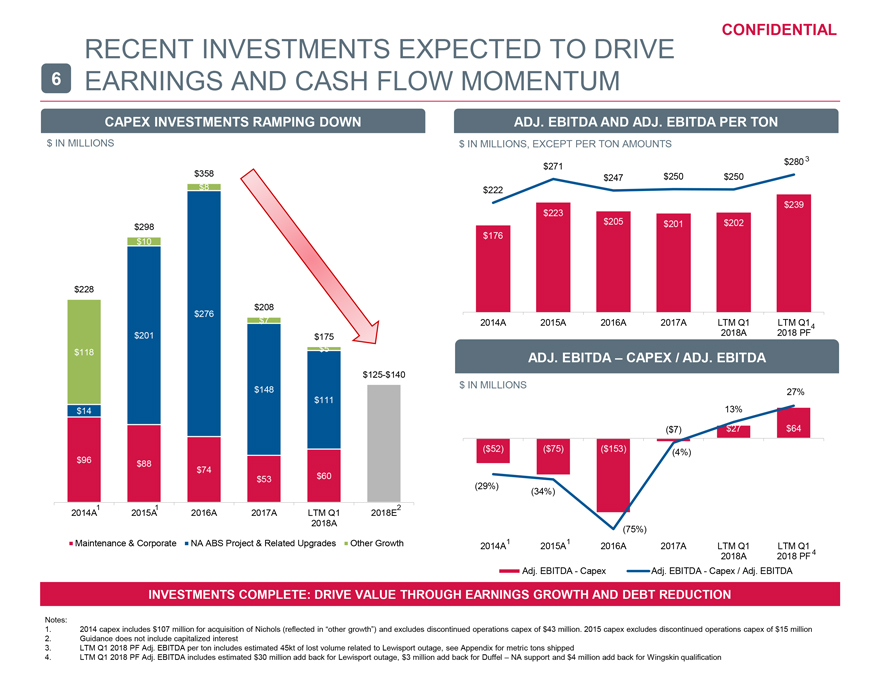
CONFIDENTIAL RECENT INVESTMENTS EXPECTED TO DRIVE 6 EARNINGS AND CASH FLOW MOMENTUM CAPEX INVESTMENTS RAMPING DOWN $ IN MILLIONS $358 $8 $298 $10 $228 $208 $276 $7 $201 $175 $118 $5 $125-$140 $148 $111 $14 $96 $88 $74 $53 $60 2014A1 2015A1 2016A 2017A LTM Q1 2018E2 2018A Maintenance & Corporate NA ABS Project & Related Upgrades Other Growth ADJ. EBITDA AND ADJ. EBITDA PER TON $ IN MILLIONS, EXCEPT PER TON AMOUNTS $280 3 300 $271 $ $247 $250 $250 250 $222 $ $239 200 $223 $ $205 $201 $202 4 5 150 $176 $ 100 $ 50 $ 50 $0 $ 0 2014A 2015A 2016A 2017A LTM Q1 LTM Q1 4 2018A 2018 PF ADJ. EBITDA – CAPEX / ADJ. EBITDA $ IN MILLIONS 100 27% 40% 13% 50 20% ($7) $27 $64 $0 0% ($52) ($75) ($153) (4%) 50) 100) (29%) (34%) 150) (75%) 200) 2014A1 2015A1 2016A 2017A LTM Q1 LTM Q1 2018A 2018 PF 4 Adj. EBITDA - Capex Adj. EBITDA - Capex / Adj. EBITDA INVESTMENTS COMPLETE: DRIVE VALUE THROUGH EARNINGS GROWTH AND DEBT REDUCTION Notes: 1. 2014 capex includes $107 million for acquisition of Nichols (reflected in “other growth”) and excludes discontinued operations capex of $43 million. 2015 capex excludes discontinued operations capex of $15 million 2. Guidance does not include capitalized interest 3. LTM Q1 2018 PF Adj. EBITDA per ton includes estimated 45kt of lost volume related to Lewisport outage, see Appendix for metric tons shipped 4. LTM Q1 2018 PF Adj. EBITDA includes estimated $30 million add back for Lewisport outage, $3 million add back for Duffel – NA support and $4 million add back for Wingskin qualification
|
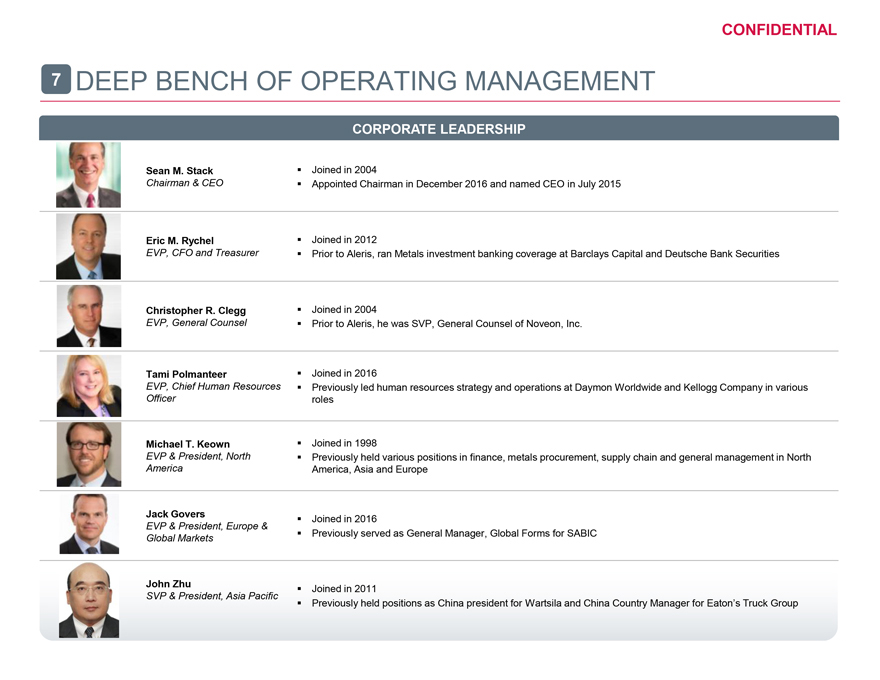
CONFIDENTIAL 7 DEEP BENCH OF OPERATING MANAGEMENT CORPORATE LEADERSHIP Sean M. Stack Joined in 2004 Chairman & CEO Appointed Chairman in December 2016 and named CEO in July 2015 Eric M. Rychel Joined in 2012 EVP, CFO and Treasurer Prior to Aleris, ran Metals investment banking coverage at Barclays Capital and Deutsche Bank Securities Christopher R. Clegg Joined in 2004 EVP, General Counsel Prior to Aleris, he was SVP, General Counsel of Noveon, Inc. Tami Polmanteer Joined in 2016 EVP, Chief Human Resources Previously led human resources strategy and operations at Daymon Worldwide and Kellogg Company in various Officer roles Michael T. Keown Joined in 1998 EVP & President, North Previously held various positions in finance, metals procurement, supply chain and general management in North America America, Asia and Europe Jack Govers Joined in 2016 EVP & President, Europe & Global Markets Previously served as General Manager, Global Forms for SABIC John Zhu Joined in 2011 SVP & President, Asia Pacific Previously held positions as China president for Wartsila and China Country Manager for Eaton’s Truck Group
|
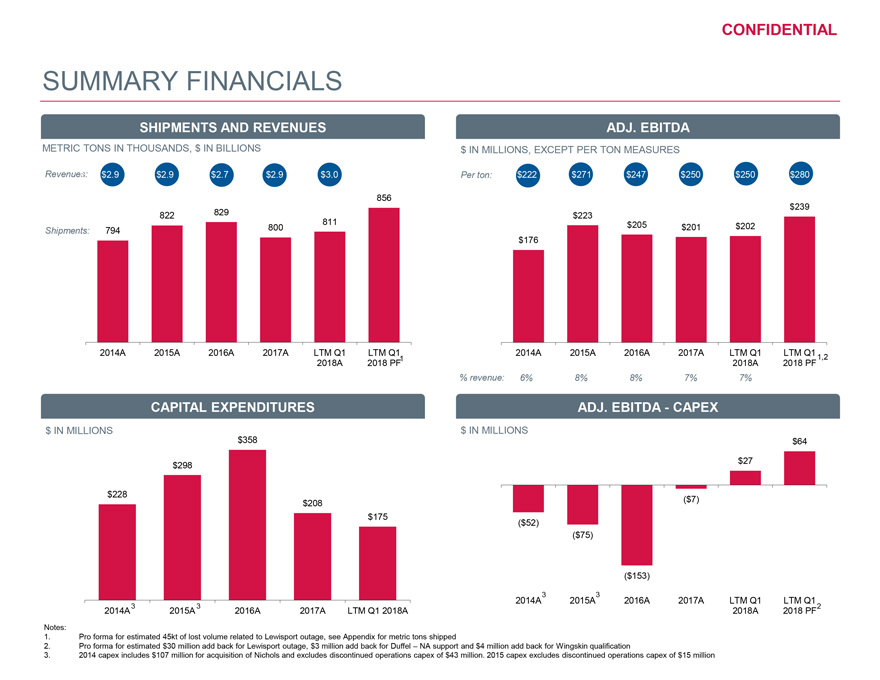
CONFIDENTIAL SUMMARY FINANCIALS SHIPMENTS AND REVENUES ADJ. EBITDA METRIC TONS IN THOUSANDS, $ IN BILLIONS $ IN MILLIONS, EXCEPT PER TON MEASURES Revenues: $2.9 $2.9 $2.7 $2.9 $3.0 Per ton: $222 $271 $247 $250 $250 $280 856 829 $239 822 $223 811 $205 Shipments: 794 800 $201 $202 $176 2014A 2015A 2016A 2017A LTM Q1 LTM Q1 2014A 2015A 2016A 2017A LTM Q1 LTM Q1 2018A 2018 PF1 2018A 2018 PF 1,2 % revenue: 6% 8% 8% 7% 7% CAPITAL EXPENDITURES ADJ. EBITDA—CAPEX $ IN MILLIONS $ IN MILLIONS $358 $64 $298 $27 $228 $208 ($7) $175 ($52) ($75) ($153) 2014A3 2015A3 2016A 2017A LTM Q1 LTM Q1 2014A 3 2015A 3 2016A 2017A LTM Q1 2018A 2018A 2018 PF2 Notes: 1. Pro forma for estimated 45kt of lost volume related to Lewisport outage, see Appendix for metric tons shipped 2. Pro forma for estimated $30 million add back for Lewisport outage, $3 million add back for Duffel – NA support and $4 million add back for Wingskin qualification 3. 2014 capex includes $107 million for acquisition of Nichols and excludes discontinued operations capex of $43 million. 2015 capex excludes discontinued operations capex of $15 million
|
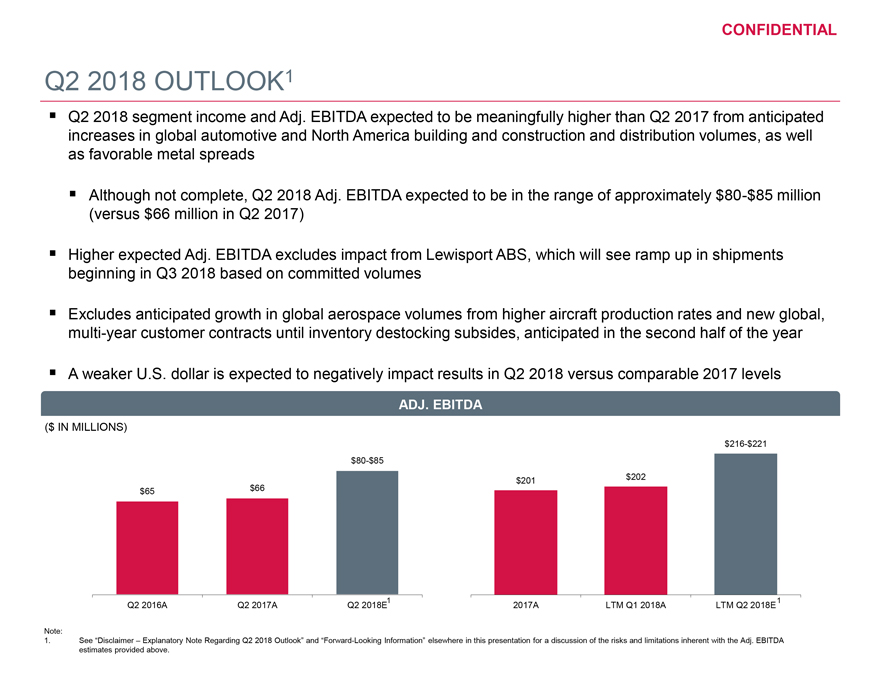
CONFIDENTIAL Q2 2018 OUTLOOK1 Q2 2018 segment income and Adj. EBITDA expected to be meaningfully higher than Q2 2017 from anticipated increases in global automotive and North America building and construction and distribution volumes, as well as favorable metal spreads Although not complete, Q2 2018 Adj. EBITDA expected to be in the range of approximately $80-$85 million (versus $66 million in Q2 2017) Higher expected Adj. EBITDA excludes impact from Lewisport ABS, which will see ramp up in shipments beginning in Q3 2018 based on committed volumes Excludes anticipated growth in global aerospace volumes from higher aircraft production rates and new global, multi-year customer contracts until inventory destocking subsides, anticipated in the second half of the year A weaker U.S. dollar is expected to negatively impact results in Q2 2018 versus comparable 2017 levels ADJ. EBITDA ($ IN MILLIONS) $216-$221 $80-$85 $201 $202 $65 $66 Q2 2016A Q2 2017A Q2 2018E1 2017A LTM Q1 2018A LTM Q2 2018E 1 Note: 1. See “Disclaimer – Explanatory Note Regarding Q2 2018 Outlook” and “Forward-Looking Information” elsewhere in this presentation for a discussion of the risks and limitations inherent with the Adj. EBITDA estimates provided above.

|
CONFIDENTIAL VI. APPENDIX
|
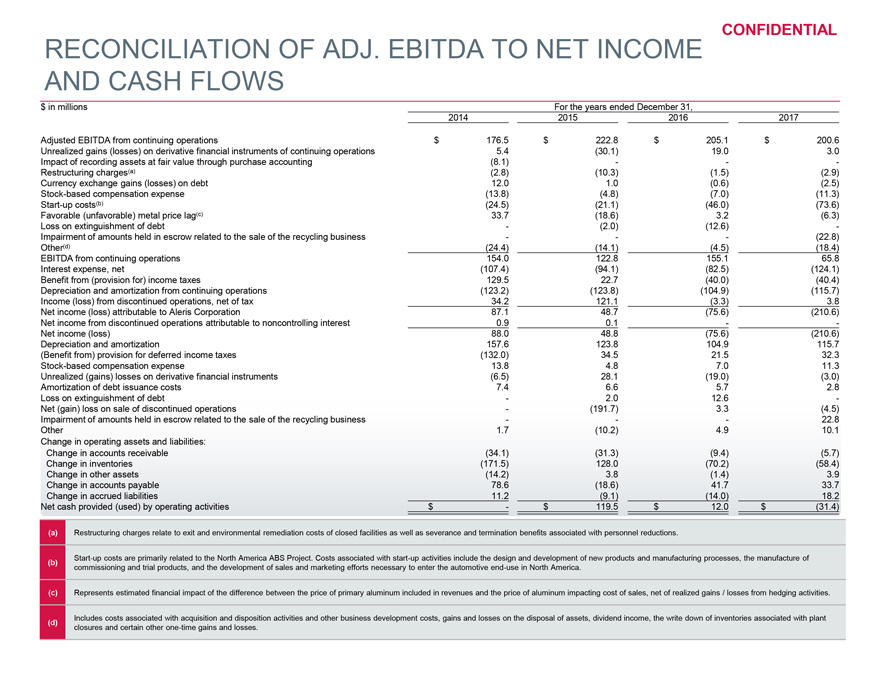
RECONCILIATION OF ADJ. EBITDA TO NET INCOME CONFIDENTIAL AND CASH FLOWS $ in millions For the years ended December 31, 2014 2015 2016 2017 Adjusted EBITDA from continuing operations $ 176.5 $ 222.8 $ 205.1 $ 200.6 Unrealized gains (losses) on derivative financial instruments of continuing operations 5.4 (30.1) 19.0 3.0 Impact of recording assets at fair value through purchase accounting (8.1) - - - Restructuring charges(a) (2.8) (10.3) (1.5) (2.9) Currency exchange gains (losses) on debt 12.0 1.0 (0.6) (2.5) Stock-based compensation expense (13.8) (4.8) (7.0) (11.3) Start-up costs(b) (24.5) (21.1) (46.0) (73.6) Favorable (unfavorable) metal price lag(c) 33.7 (18.6) 3.2 (6.3) Loss on extinguishment of debt - (2.0) (12.6) - Impairment of amounts held in escrow related to the sale of the recycling business - - - (22.8) Other(d) (24.4) (14.1) (4.5) (18.4) EBITDA from continuing operations 154.0 122.8 155.1 65.8 Interest expense, net (107.4) (94.1) (82.5) (124.1) Benefit from (provision for) income taxes 129.5 22.7 (40.0) (40.4) Depreciation and amortization from continuing operations (123.2) (123.8) (104.9) (115.7) Income (loss) from discontinued operations, net of tax 34.2 121.1 (3.3) 3.8 Net income (loss) attributable to Aleris Corporation 87.1 48.7 (75.6) (210.6) Net income from discontinued operations attributable to noncontrolling interest 0.9 0.1 - - Net income (loss) 88.0 48.8 (75.6) (210.6) Depreciation and amortization 157.6 123.8 104.9 115.7 (Benefit from) provision for deferred income taxes (132.0) 34.5 21.5 32.3 Stock-based compensation expense 13.8 4.8 7.0 11.3 Unrealized (gains) losses on derivative financial instruments (6.5) 28.1 (19.0) (3.0) Amortization of debt issuance costs 7.4 6.6 5.7 2.8 Loss on extinguishment of debt - 2.0 12.6 - Net (gain) loss on sale of discontinued operations - (191.7) 3.3 (4.5) Impairment of amounts held in escrow related to the sale of the recycling business - - - 22.8 Other 1.7 (10.2) 4.9 10.1 Change in operating assets and liabilities: Change in accounts receivable (34.1) (31.3) (9.4) (5.7) Change in inventories (171.5) 128.0 (70.2) (58.4) Change in other assets (14.2) 3.8 (1.4) 3.9 Change in accounts payable 78.6 (18.6) 41.7 33.7 Change in accrued liabilities 11.2 (9.1) (14.0) 18.2 Net cash provided (used) by operating activities $ - $ 119.5 $ 12.0 $ (31.4) (a) Restructuring charges relate to exit and environmental remediation costs of closed facilities as well as severance and termination benefits associated with personnel reductions. Start-up costs are primarily related to the North America ABS Project. Costs associated with start-up activities include the design and development of new products and manufacturing processes, the manufacture of (b) commissioning and trial products, and the development of sales and marketing efforts necessary to enter the automotive end-use in North America. (c) Represents estimated financial impact of the difference between the price of primary aluminum included in revenues and the price of aluminum impacting cost of sales, net of realized gains / losses from hedging activities. (d) Includes costs associated with acquisition and disposition activities and other business development costs, gains and losses on the disposal of assets, dividend income, the write down of inventories associated with plant closures and certain other one-time gains and losses.
|
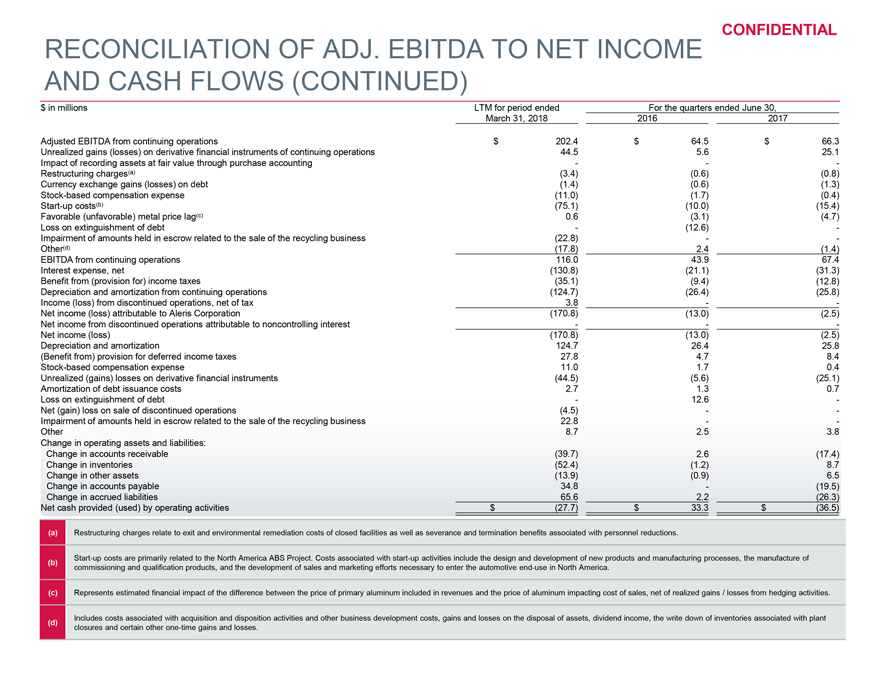
RECONCILIATION OF ADJ. EBITDA TO NET INCOME CONFIDENTIAL AND CASH FLOWS (CONTINUED) $ in millions LTM for period ended For the quarters ended June 30, March 31, 2018 2016 2017 Adjusted EBITDA from continuing operations $ 202.4 $ 64.5 $ 66.3 Unrealized gains (losses) on derivative financial instruments of continuing operations 44.5 5.6 25.1 Impact of recording assets at fair value through purchase accounting - - - Restructuring charges(a) (3.4) (0.6) (0.8) Currency exchange gains (losses) on debt (1.4) (0.6) (1.3) Stock-based compensation expense (11.0) (1.7) (0.4) Start-up costs(b) (75.1) (10.0) (15.4) Favorable (unfavorable) metal price lag(c) 0.6 (3.1) (4.7) Loss on extinguishment of debt - (12.6) - Impairment of amounts held in escrow related to the sale of the recycling business (22.8) - - Other(d) (17.8) 2.4 (1.4) EBITDA from continuing operations 116.0 43.9 67.4 Interest expense, net (130.8) (21.1) (31.3) Benefit from (provision for) income taxes (35.1) (9.4) (12.8) Depreciation and amortization from continuing operations (124.7) (26.4) (25.8) Income (loss) from discontinued operations, net of tax 3.8 - - Net income (loss) attributable to Aleris Corporation (170.8) (13.0) (2.5) Net income from discontinued operations attributable to noncontrolling interest - - - Net income (loss) (170.8) (13.0) (2.5) Depreciation and amortization 124.7 26.4 25.8 (Benefit from) provision for deferred income taxes 27.8 4.7 8.4 Stock-based compensation expense 11.0 1.7 0.4 Unrealized (gains) losses on derivative financial instruments (44.5) (5.6) (25.1) Amortization of debt issuance costs 2.7 1.3 0.7 Loss on extinguishment of debt - 12.6 - Net (gain) loss on sale of discontinued operations (4.5) - - Impairment of amounts held in escrow related to the sale of the recycling business 22.8 - - Other 8.7 2.5 3.8 Change in operating assets and liabilities: Change in accounts receivable (39.7) 2.6 (17.4) Change in inventories (52.4) (1.2) 8.7 Change in other assets (13.9) (0.9) 6.5 Change in accounts payable 34.8 - (19.5) Change in accrued liabilities 65.6 2.2 (26.3) Net cash provided (used) by operating activities $ (27.7) $ 33.3 $ (36.5) (a) Restructuring charges relate to exit and environmental remediation costs of closed facilities as well as severance and termination benefits associated with personnel reductions. Start-up costs are primarily related to the North America ABS Project. Costs associated with start-up activities include the design and development of new products and manufacturing processes, the manufacture of (b) commissioning and qualification products, and the development of sales and marketing efforts necessary to enter the automotive end-use in North America. (c) Represents estimated financial impact of the difference between the price of primary aluminum included in revenues and the price of aluminum impacting cost of sales, net of realized gains / losses from hedging activities. (d) Includes costs associated with acquisition and disposition activities and other business development costs, gains and losses on the disposal of assets, dividend income, the write down of inventories associated with plant closures and certain other one-time gains and losses.
|
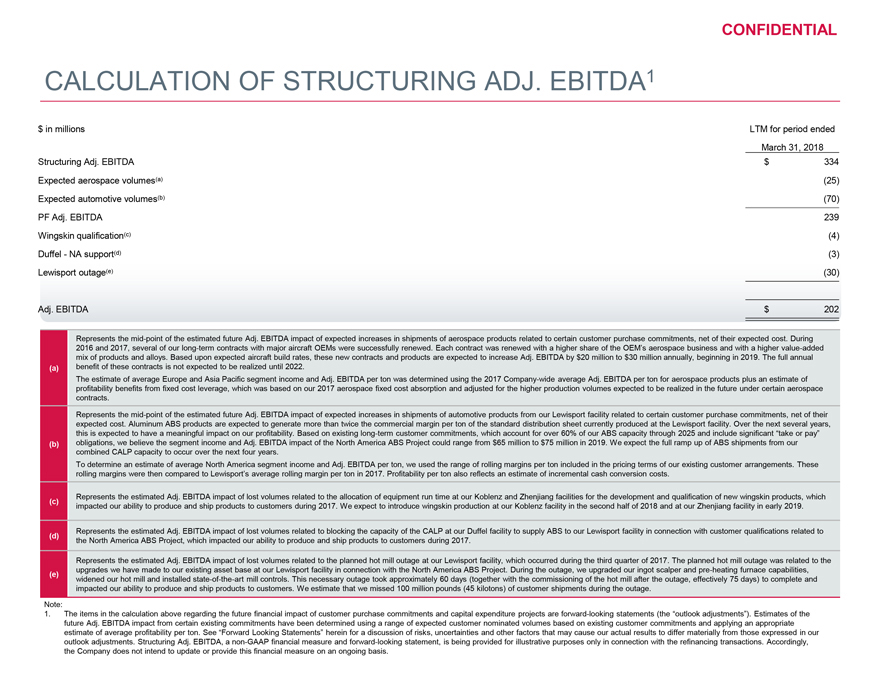
CONFIDENTIAL CALCULATION OF STRUCTURING ADJ. EBITDA1 $ in millions LTM for period ended March 31, 2018 Structuring Adj. EBITDA $ 334 Expected aerospace volumes(a) (25) Expected automotive volumes(b) (70) PF Adj. EBITDA 239 Wingskin qualification(c) (4) Duffel—NA support(d) (3) Lewisport outage(e) (30) Adj. EBITDA $ 202 Represents the mid-point of the estimated future Adj. EBITDA impact of expected increases in shipments of aerospace products related to certain customer purchase commitments, net of their expected cost. During 2016 and 2017, several of our long-term contracts with major aircraft OEMs were successfully renewed. Each contract was renewed with a higher share of the OEM’s aerospace business and with a higher value-added mix of products and alloys. Based upon expected aircraft build rates, these new contracts and products are expected to increase Adj. EBITDA by $20 million to $30 million annually, beginning in 2019. The full annual (a) benefit of these contracts is not expected to be realized until 2022. The estimate of average Europe and Asia Pacific segment income and Adj. EBITDA per ton was determined using the 2017 Company-wide average Adj. EBITDA per ton for aerospace products plus an estimate of profitability benefits from fixed cost leverage, which was based on our 2017 aerospace fixed cost absorption and adjusted for the higher production volumes expected to be realized in the future under certain aerospace contracts. Represents the mid-point of the estimated future Adj. EBITDA impact of expected increases in shipments of automotive products from our Lewisport facility related to certain customer purchase commitments, net of their expected cost. Aluminum ABS products are expected to generate more than twice the commercial margin per ton of the standard distribution sheet currently produced at the Lewisport facility. Over the next several years, this is expected to have a meaningful impact on our profitability. Based on existing long-term customer commitments, which account for over 60% of our ABS capacity through 2025 and include significant “take or pay” (b) obligations, we believe the segment income and Adj. EBITDA impact of the North America ABS Project could range from $65 million to $75 million in 2019. We expect the full ramp up of ABS shipments from our combined CALP capacity to occur over the next four years. To determine an estimate of average North America segment income and Adj. EBITDA per ton, we used the range of rolling margins per ton included in the pricing terms of our existing customer arrangements. These rolling margins were then compared to Lewisport’s average rolling margin per ton in 2017. Profitability per ton also reflects an estimate of incremental cash conversion costs. (c) Represents the estimated Adj. EBITDA impact of lost volumes related to the allocation of equipment run time at our Koblenz and Zhenjiang facilities for the development and qualification of new wingskin products, which impacted our ability to produce and ship products to customers during 2017. We expect to introduce wingskin production at our Koblenz facility in the second half of 2018 and at our Zhenjiang facility in early 2019. (d) Represents the estimated Adj. EBITDA impact of lost volumes related to blocking the capacity of the CALP at our Duffel facility to supply ABS to our Lewisport facility in connection with customer qualifications related to the North America ABS Project, which impacted our ability to produce and ship products to customers during 2017. Represents the estimated Adj. EBITDA impact of lost volumes related to the planned hot mill outage at our Lewisport facility, which occurred during the third quarter of 2017. The planned hot mill outage was related to the (e) upgrades we have made to our existing asset base at our Lewisport facility in connection with the North America ABS Project. During the outage, we upgraded our ingot scalper and pre-heating furnace capabilities, widened our hot mill and installed state-of-the-art mill controls. This necessary outage took approximately 60 days (together with the commissioning of the hot mill after the outage, effectively 75 days) to complete and impacted our ability to produce and ship products to customers. We estimate that we missed 100 million pounds (45 kilotons) of customer shipments during the outage. Note: 1. The items in the calculation above regarding the future financial impact of customer purchase commitments and capital expenditure projects are forward-looking statements (the “outlook adjustments”). Estimates of the future Adj. EBITDA impact from certain existing commitments have been determined using a range of expected customer nominated volumes based on existing customer commitments and applying an appropriate estimate of average profitability per ton. See “Forward Looking Statements” herein for a discussion of risks, uncertainties and other factors that may cause our actual results to differ materially from those expressed in our outlook adjustments. Structuring Adj. EBITDA, a non-GAAP financial measure and forward-looking statement, is being provided for illustrative purposes only in connection with the refinancing transactions. Accordingly, the Company does not intend to update or provide this financial measure on an ongoing basis.
|
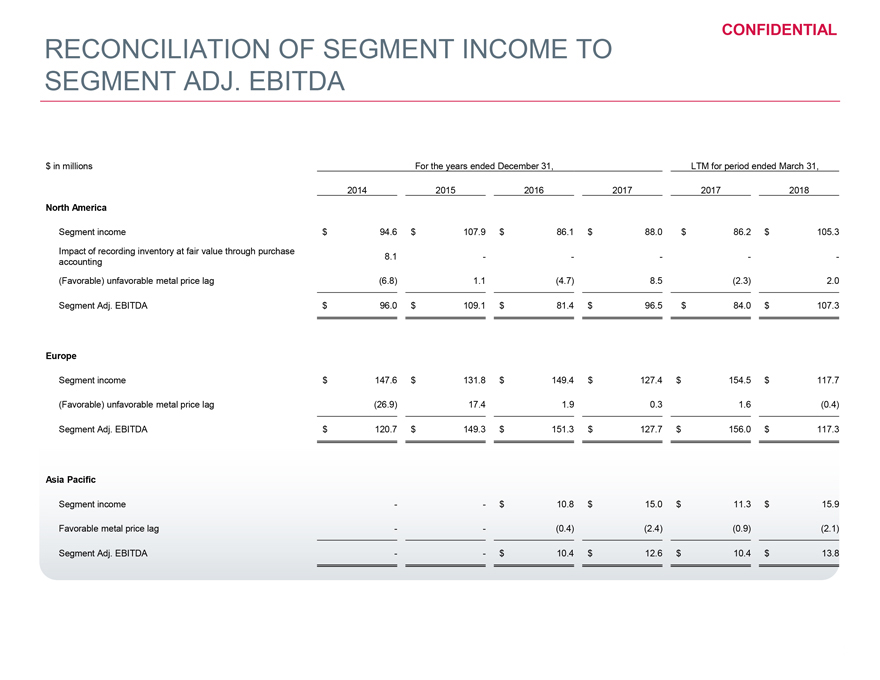
CONFIDENTIAL RECONCILIATION OF SEGMENT INCOME TO SEGMENT ADJ. EBITDA $ in millions For the years ended December 31, LTM for period ended March 31, 2014 2015 2016 2017 2017 2018 North America Segment income $ 94.6 $ 107.9 $ 86.1 $ 88.0 $ 86.2 $ 105.3 Impact of recording inventory at fair value through purchase 8.1 — ——accounting (Favorable) unfavorable metal price lag (6.8) 1.1 (4.7) 8.5 (2.3) 2.0 Segment Adj. EBITDA $ 96.0 $ 109.1 $ 81.4 $ 96.5 $ 84.0 $ 107.3 Europe Segment income $ 147.6 $ 131.8 $ 149.4 $ 127.4 $ 154.5 $ 117.7 (Favorable) unfavorable metal price lag (26.9) 17.4 1.9 0.3 1.6 (0.4) Segment Adj. EBITDA $ 120.7 $ 149.3 $ 151.3 $ 127.7 $ 156.0 $ 117.3 Asia Pacific Segment income — $ 10.8 $ 15.0 $ 11.3 $ 15.9 Favorable metal price lag — (0.4) (2.4) (0.9) (2.1) Segment Adj. EBITDA — $ 10.4 $ 12.6 $ 10.4 $ 13.8
|
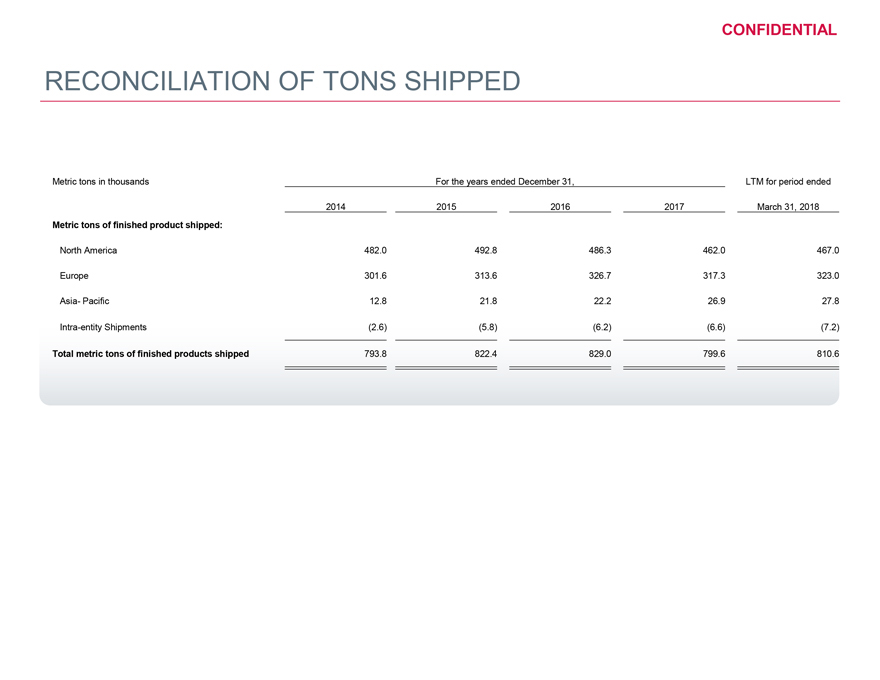
CONFIDENTIAL RECONCILIATION OF TONS SHIPPED Metric tons in thousands For the years ended December 31, LTM for period ended 2014 2015 2016 2017 March 31, 2018 Metric tons of finished product shipped: North America 482.0 492.8 486.3 462.0 467.0 Europe 301.6 313.6 326.7 317.3 323.0 Asia- Pacific 12.8 21.8 22.2 26.9 27.8 Intra-entity Shipments (2.6) (5.8) (6.2) (6.6) (7.2) Total metric tons of finished products shipped 793.8 822.4 829.0 799.6 810.6