Attached files
| file | filename |
|---|---|
| 8-K - 8-K - Williams Industrial Services Group Inc. | f8-k.htm |
| EX-99.1 - EX-99.1 - Williams Industrial Services Group Inc. | ex-99d1.htm |
Exhibit 99.2
|
|
May 21, 2018 First Quarter 2018 Financial Results and Strategic Update Tracy Pagliara President and CEO Erin Gonzalez Chief Financial Officer |
|
|
Cautionary Notes 1 Forward-looking Statement Disclaimer This presentation contains “forward-looking statements” within the meaning of the term set forth in the Private Securities Litigation Reform Act of 1995. The forward-looking statements include statements or expectations regarding the timing or outcome of the Electrical Solutions strategic review process, if any, the ability to close on an asset-based loan, the outcome of a strategic review process for Global Power, the Company’s ability to comply with the terms of its debt instruments, the impact of planned cost reductions, reorganization and restructuring efforts, the Company’s ability to implement its liquidity plan, expectations for growth of the business in 2018 and ability to realize the inherent value in the Company’s capabilities, ability to compete well in Global Power’s markets, and other related matters. These statements reflect the Company’s current views of future events and financial performance and are subject to a number of risks and uncertainties, including its ability to comply with the terms of its credit facility and enter into new lending facilities and access letters of credit, ability to timely file its periodic reports with the U.S. Securities and Exchange Commission (“the SEC”), ability to implement strategic initiatives, business plans, and liquidity plans, and ability to maintain effective internal control over financial reporting and disclosure controls and procedures. Actual results, performance or achievements may differ materially from those expressed or implied in the forward-looking statements. Additional risks and uncertainties that could cause or contribute to such material differences include, but are not limited to, decreased demand for new gas turbine power plants, reduced demand for, or increased regulation of, nuclear power, loss of any of the Company’s major customers, whether pursuant to the loss of pending or future bids for either new business or an extension of existing business, termination of customer or vendor relationships, cost increases and project cost overruns, unforeseen schedule delays, poor performance by its subcontractors, cancellation of projects, competition, including competitors being awarded business by current customers, damage to the Company’s reputation, warranty or product liability claims, increased exposure to environmental or other liabilities, failure to comply with various laws and regulations, failure to attract and retain highly-qualified personnel, loss of customer relationships with critical personnel, effective integration of acquisitions, volatility of the Company’s stock price, deterioration or uncertainty of credit markets, changes in the economic and social and political conditions in the United States, including the banking environment or monetary policy, and any suspension of the Company’s continued reporting obligations under the Securities Exchange Act of 1934, as amended. Other important factors that may cause actual results to differ materially from those expressed in the forward-looking statements are discussed in the Company’s filings with the SEC, including the section of the Annual Report on Form 10-K for its 2017 fiscal year titled “Risk Factors.” Any forward-looking statement speaks only as of the date of this presentation. Except as may be required by applicable law, Global Power undertakes no obligation to publicly update or revise any forward-looking statements, whether as a result of new information, future events or otherwise, and you are cautioned to not to rely upon them unduly. Non-GAAP Financial Measures This presentation will discuss some non-GAAP financial measures, which Global Power believes are useful in evaluating our performance. You should not consider the presentation of this additional information in isolation or as a substitute for results compared in accordance with GAAP. The Company has provided reconciliations of comparable GAAP to non-GAAP measures in tables found on the EBITDA Reconciliation slide of this presentation. |
|
|
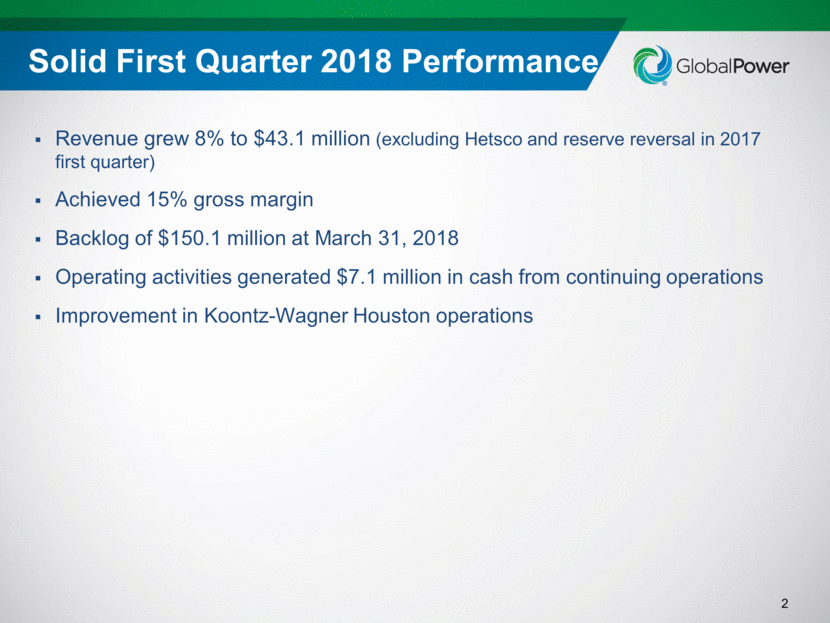
Solid First Quarter 2018 Performance 2 Revenue grew 8% to $43.1 million (excluding Hetsco and reserve reversal in 2017 first quarter) Achieved 15% gross margin Backlog of $150.1 million at March 31, 2018 Operating activities generated $7.1 million in cash from continuing operations Improvement in Koontz-Wagner Houston operations |
|
|
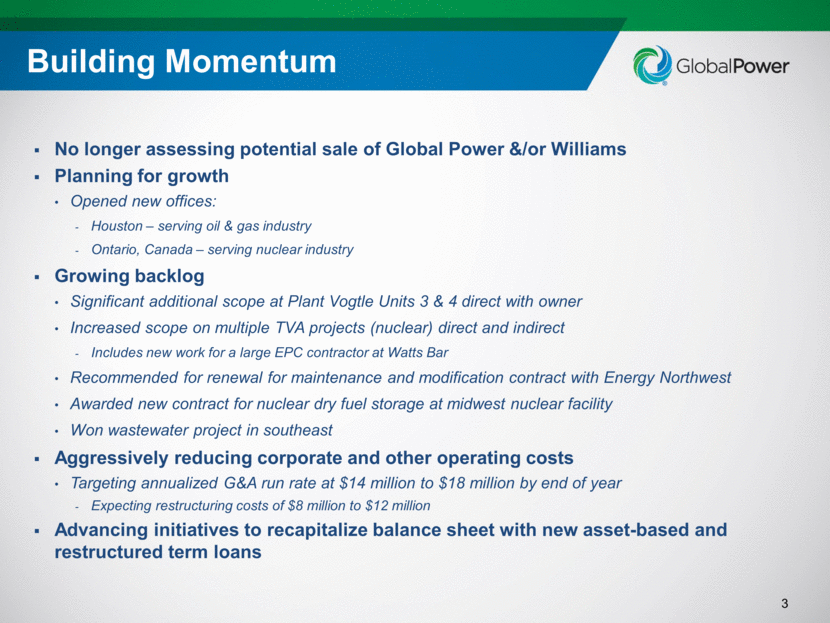
Building Momentum 3 No longer assessing potential sale of Global Power &/or Williams Planning for growth Opened new offices: Houston – serving oil & gas industry Ontario, Canada – serving nuclear industry Growing backlog Significant additional scope at Plant Vogtle Units 3 & 4 direct with owner Increased scope on multiple TVA projects (nuclear) direct and indirect Includes new work for a large EPC contractor at Watts Bar Recommended for renewal for maintenance and modification contract with Energy Northwest Awarded new contract for nuclear dry fuel storage at midwest nuclear facility Won wastewater project in southeast Aggressively reducing corporate and other operating costs Targeting annualized G&A run rate at $14 million to $18 million by end of year Expecting restructuring costs of $8 million to $12 million Advancing initiatives to recapitalize balance sheet with new asset-based and restructured term loans |
|
|
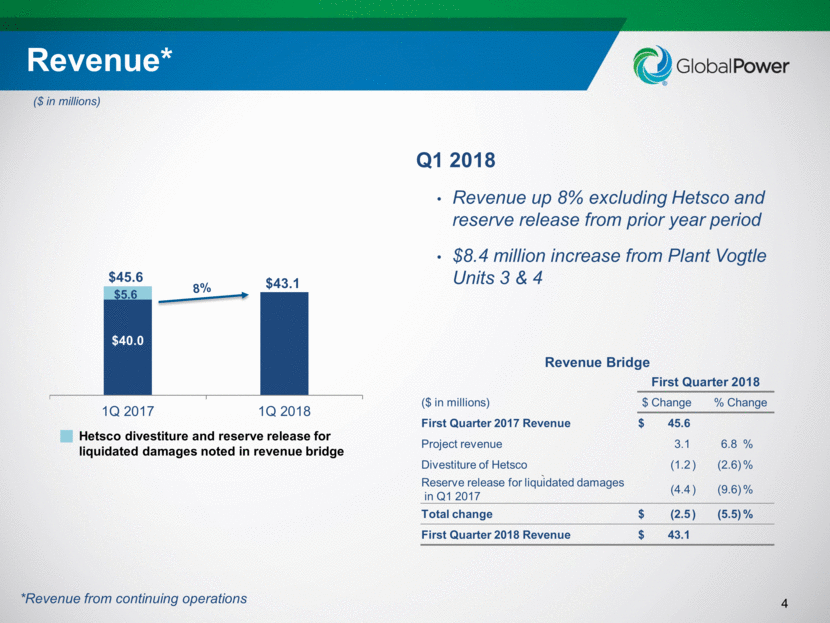
($ in millions) 4 Revenue* Q1 2018 Revenue up 8% excluding Hetsco and reserve release from prior year period $8.4 million increase from Plant Vogtle Units 3 & 4 *Revenue from continuing operations Revenue Bridge First Quarter 2018 ($ in millions) $ Change % Change First Quarter 2017 Revenue $ 45.6 Project revenue 3.1 6.8 % Divestiture of Hetsco (1.2 ) (2.6) % Reserve release for liquidated damages in Q1 2017 (4.4 ) (9.6) % Total change $ (2.5 ) (5.5) % First Quarter 2018 Revenue $ 43.1 Hetsco divestiture and reserve release for liquidated damages noted in revenue bridge 8% $5.6 |
|
|
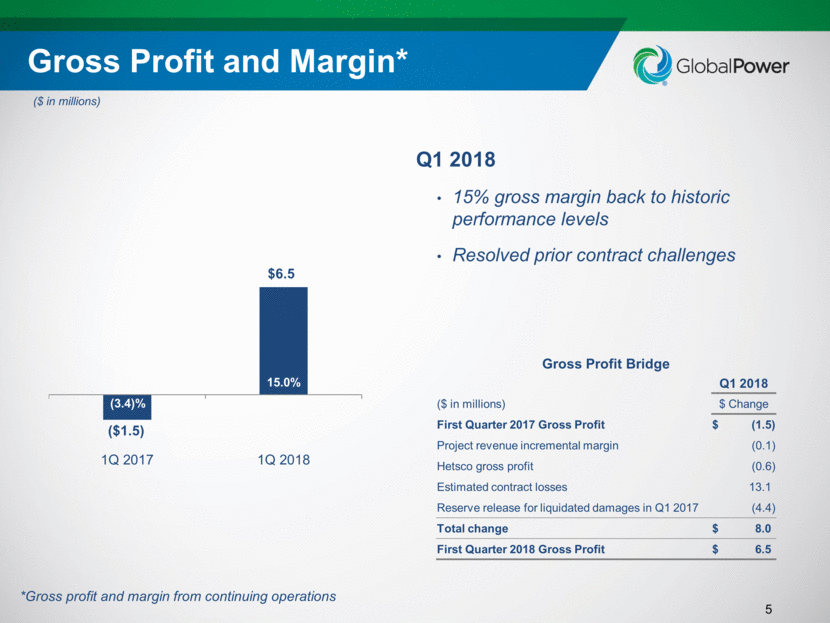
($ in millions) 5 Gross Profit and Margin* Q1 2018 15% gross margin back to historic performance levels Resolved prior contract challenges (3.4)% *Gross profit and margin from continuing operations Gross Profit Bridge Q1 2018 ($ in millions) $ Change First Quarter 2017 Gross Profit $ (1.5) Project revenue incremental margin (0.1) Hetsco gross profit (0.6) Estimated contract losses 13.1 Reserve release for liquidated damages in Q1 2017 (4.4) Total change $ 8.0 First Quarter 2018 Gross Profit $ 6.5 |
|
|
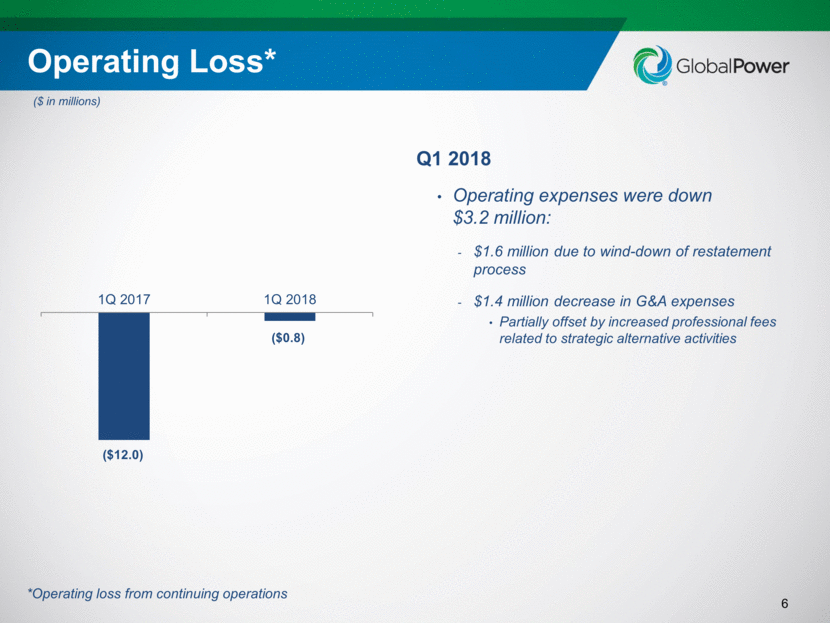
($ in millions) 6 Operating Loss* Q1 2018 Operating expenses were down $3.2 million: $1.6 million due to wind-down of restatement process $1.4 million decrease in G&A expenses Partially offset by increased professional fees related to strategic alternative activities *Operating loss from continuing operations |
|
|
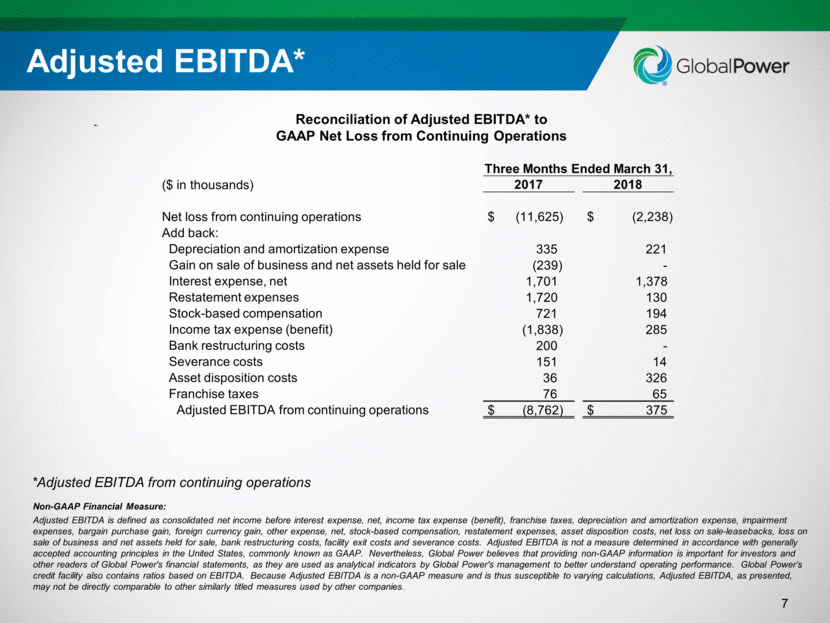
7 Adjusted EBITDA* Reconciliation of Adjusted EBITDA* to GAAP Net Loss from Continuing Operations Three Months Ended March 31, ($ in thousands) 2017 2018 Net loss from continuing operations $ (11,625) $ (2,238) Add back: Depreciation and amortization expense 335 221 Gain on sale of business and net assets held for sale (239) - Interest expense, net 1,701 1,378 Restatement expenses 1,720 130 Stock-based compensation 721 194 Income tax expense (benefit) (1,838) 285 Bank restructuring costs 200 - Severance costs 151 14 Asset disposition costs 36 326 Franchise taxes 76 65 Adjusted EBITDA from continuing operations $ (8,762) $ 375 Non-GAAP Financial Measure: Adjusted EBITDA is defined as consolidated net income before interest expense, net, income tax expense (benefit), franchise taxes, depreciation and amortization expense, impairment expenses, bargain purchase gain, foreign currency gain, other expense, net, stock-based compensation, restatement expenses, asset disposition costs, net loss on sale-leasebacks, loss on sale of business and net assets held for sale, bank restructuring costs, facility exit costs and severance costs. Adjusted EBITDA is not a measure determined in accordance with generally accepted accounting principles in the United States, commonly known as GAAP. Nevertheless, Global Power believes that providing non-GAAP information is important for investors and other readers of Global Power's financial statements, as they are used as analytical indicators by Global Power's management to better understand operating performance. Global Power’s credit facility also contains ratios based on EBITDA. Because Adjusted EBITDA is a non-GAAP measure and is thus susceptible to varying calculations, Adjusted EBITDA, as presented, may not be directly comparable to other similarly titled measures used by other companies. *Adjusted EBITDA from continuing operations |
|
|
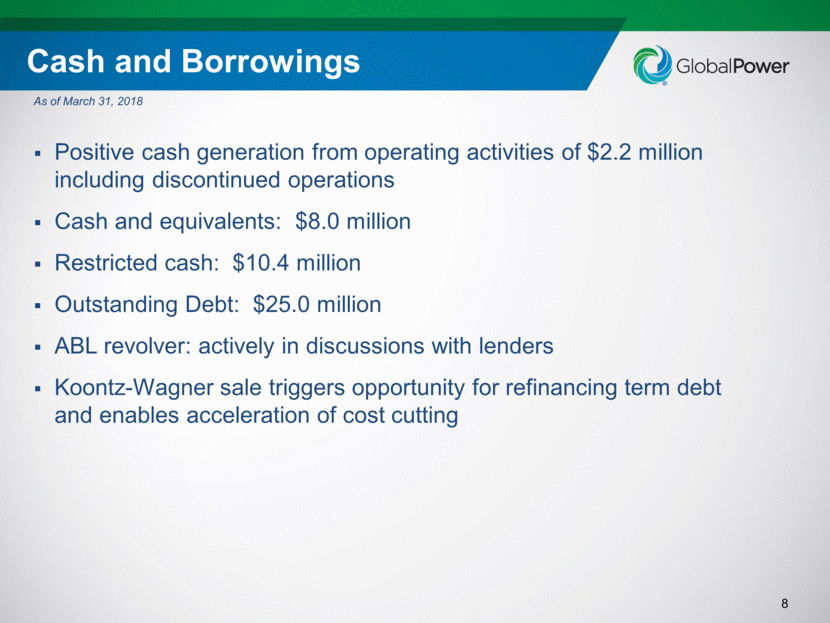
Cash and Borrowings 8 Positive cash generation from operating activities of $2.2 million including discontinued operations Cash and equivalents: $8.0 million Restricted cash: $10.4 million Outstanding Debt: $25.0 million ABL revolver: actively in discussions with lenders Koontz-Wagner sale triggers opportunity for refinancing term debt and enables acceleration of cost cutting As of March 31, 2018 |
|
|
Supplemental Information |

|
|
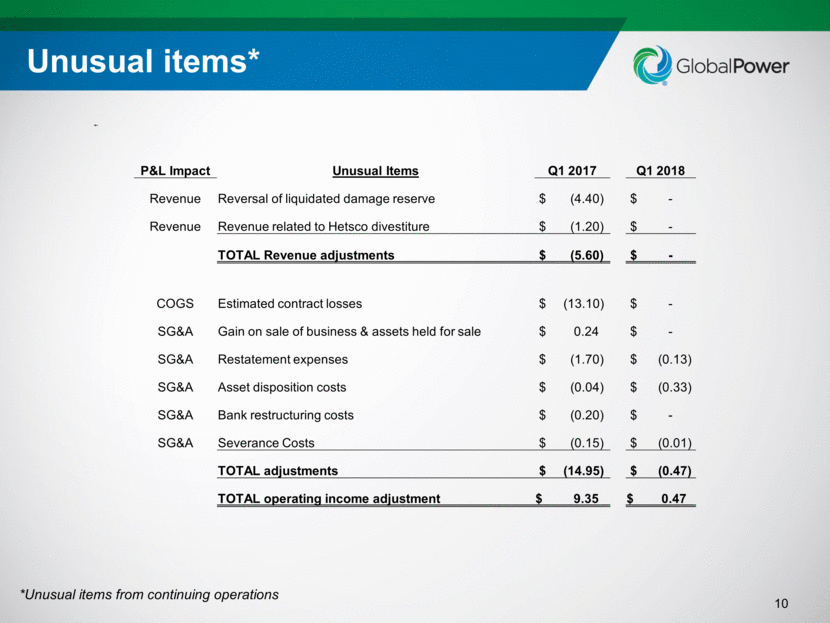
10 Unusual items* *Unusual items from continuing operations P&L Impact Unusual Items Q1 2017 Q1 2018 Revenue Reversal of liquidated damage reserve $ (4.40) $ - Revenue Revenue related to Hetsco divestiture $ (1.20) $ - TOTAL Revenue adjustments $ (5.60) $ - COGS Estimated contract losses $ (13.10) $ - SG&A Gain on sale of business & assets held for sale $ 0.24 $ - SG&A Restatement expenses $ (1.70) $ (0.13) SG&A Asset disposition costs $ (0.04) $ (0.33) SG&A Bank restructuring costs $ (0.20) $ - SG&A Severance Costs $ (0.15) $ (0.01) TOTAL adjustments $ (14.95) $ (0.47) TOTAL operating income adjustment $ 9.35 $ 0.47 |