Attached files
| file | filename |
|---|---|
| EX-99.1 - EXHIBIT 99.1 - BROADWIND, INC. | exh_991.htm |
| 8-K - FORM 8-K - BROADWIND, INC. | f8k_050418.htm |
Exhibit 99.2

Q1 2018 Earnings Call May 4, 2018

Industry Data and Forward - Looking Statements Disclaimer ▪ Broadwind obtained the industry and market data used throughout this presentation from our own research, internal surveys and st udies conducted by third parties, independent industry associations or general publications and other publicly available informatio n. Independent industry publications and surveys generally state that they have obtained information from sources believed to be reliable, but do not gu arantee the accuracy or completeness of such information. Forecasts are particularly likely to be inaccurate, especially over long periods of time. W e a re not aware of any misstatements in the industry data we have presented herein, but estimates involve risks and uncertainties and a re subject to change based on various factors beyond our control. ▪ This presentation contains “forward - looking statements ”, as defined in Section 21E of the Securities Exchange Act of 1934, as amended. Forward - looking statements include any statement that does not directly relate to a current or historical fact. Our forward - look ing statements may include or relate to our beliefs, expectations, plans and/or assumptions with respect to the following: (i ) state, local and federal regulatory frameworks affecting the industries in which we compete, including the wind energy industry, and the related extension, conti nua tion or renewal of federal tax incentives and grants and state renewable portfolio standards; (ii) our customer relationships and efforts to div ers ify our customer base and sector focus and leverage customer relationships across business units; (iii) our ability to continue to grow our busines s o rganically and through acquisitions; (iv) the sufficiency of our liquidity and alternate sources of funding, if necessary; (v) our ability t o r ealize revenue from customer orders and backlog; (vi) our ability to operate our business efficiently, manage capital expenditures and costs effe cti vely, and generate cash flow; (vii) the economy and the potential impact it may have on our business, including our customers; (viii) the state of the wind energy market and other energy and industrial markets generally and the impact of competition and economic volatility in those marke ts; (ix) the effects of market disruptions and regular market volatility, including fluctuations in the price of oil, gas and other commodities; (x) the effects of the recent change of administrations in the U.S. federal government; (xi) our ability to successfully integrate and operate the business of Red Wolf Company, LLC and to identify, negotiate and execute future acquisitions; and (xii) the potential loss of tax benefits if we experience an “ownership change” under Section 382 of the Internal Revenue Code of 1986, as amended. These statements are based on information currently available to us and are subject to various risks, uncertainties and other factors. We are under no duty to update any of these statements. You sh oul d not consider any list of such factors to be an exhaustive statement of all of the risks, uncertainties or other factors that could cause our c urr ent beliefs, expectations, plans and/or assumptions to change. ▪ This presentation contains non - GAAP financial information. We believe that certain non - GAAP financial measures may provide users of this financial information with meaningful comparisons between current results and results in prior operating periods. We believe tha t these non - GAAP financial measures can provide additional meaningful reflection of underlying trends of the business because they provide a c omp arison of historical information that excludes certain infrequently occurring or non - operational items that impact the overall comparabili ty. Non - GAAP financial measures should be viewed in addition to, and not as an alternative to, our reported results prepared in accordance wi th GAAP. Please see our earnings release dated May 4, 2018 for a reconciliation of certain non - GAAP measures presented in this presentation. May 4, 2018 2 © 2018 Broadwind Energy, Inc. All rights reserved.

Q1 2018 Highlights May 4, 2018 ▪ Order intake recovering ▪ Successful ramp up of tower facilities following near shut down in Q4 17 ▪ Q1 18 revenue of $30 million up 69% sequentially as tower production recovers ▪ Customer diversification efforts on track ▪ Initiated restructuring plan following exit of CNG business ▪ Eric Blashford appointed COO 3 © 2018 Broadwind Energy, Inc. All rights reserved.

Orders and Backlog ($ Millions) Orders ▪ Initial tower order following inventory correction that began in Q2 17 ▪ Rising demand for heavy fabrications for mining in 2018 ▪ Strong Gearing orders from oil & gas customers ▪ Process Systems - timing of acquisition Backlog ▪ 3/31/18 backlog $136M ▪ Current multi - year tower order booked in 2016 supports baseload production through 2019 ~$50 M per year May 4, 2018 Q1 2017 Q1 2018 YTD 2018 Book:Bill Towers & Heavy Fabrications 29.1 7.8 .47 Gearing 7.3 15.4 1.75 Process Systems 3.6 4.9 1.13 Total 40.0 28.1 .94 4 © 2018 Broadwind Energy, Inc. All rights reserved. - 50 100 150 200 250 300 350 Q1 12 Q1 13 Q1 14 Q1 15 Q1 16 Q1 17 Q1 18 Millions

US Wind Market Update Source : MAKE Global Wind Market Outlook Update – Q1 2018 Forecast Development Pipeline - GW Source: AWEA Q4 2017 Market Report ▪ Wind development pipeline remains robust – 40% increase vs. Q1 2017 ▪ Adv. dev means turbines ordered, PPA signed or utility owned ▪ The majority of pipeline projects will qualify for 100% or 80% PTC ▪ Slight shift of demand toward PTC - expiration year ▪ 2021 outlook strengthening with 80% PTC qualifications of 10 GW ▪ Post - PTC uncertainty remains for 2022 and beyond © 2018 Broadwind Energy, Inc. All rights reserved. Forecast – GW Installations May 4, 2018 5 8.0 8.2 6.4 8.4 10.9 12.9 6 7 8 9 10 11 12 13 14 2015a 2016a 2017a 2018e 2019e 2020e GW 0 5 10 15 20 25 30 35 40 Q1 16 Q2 16 Q3 16 Q4 16 Q1 17 Q2 17 Q3 17 Q4 17 Q1 18 GW Under construction at QE Adv. Development

Tariff and Trade Uncertainties © 2018 Broadwind Energy, Inc. All rights reserved. 6 ▪ Steel accounts for nearly half of material content of a wind turbine ▪ Fluctuating US vs Chinese steel prices influence tower sourcing for US OEM’s – depending on location of windfarm and shipping costs (also highly variable) ▪ Steel price differential on ~200 ton/tower material content ranges from $16k (low in Q4 2017) to $75k (recent prices) ▪ Section 232 announcement has triggered domestic steel price spike; final tariff/quota outcome remains highly uncertain – to - date countries accounting for ~ 65% of steel imports are exempted Wind Turbine Materials Cost Breakdown 200 300 400 500 600 700 800 900 1000 Q1 17 Q2 17 Q3 17 Q4 17 Q1 18 18-Apr Relative Steel Price $/ST * US China Source: Platts May 4, 2018

0 500 1,000 1,500 2,000 2,500 3,000 3,500 4,000 2015a 2016a 2017a 2018e 2019e 2020e $M US Gear Production *Excluding automotive 7 Demand for U.S. gearing remains healthy Sources: AGMA & IHS ▪ U.S. market reached inflection point in 2016 ▪ For BWEN, oil and gas resurgence has dominated, but mining is becoming healthier as well ▪ Fracking equipment market strong – horsepower additions up 60% drives demands for gearboxes 9 .0% CAGR Source: IHS Markit December 2017 Markets excluded: farm machinery, aerospace, railroad, shipbuilding and machine tools % market 2014 - 2017 CAGR 2017 - 2019 CAGR Turbines & Power 10% - 6% +5% Oil & Gas 6% - 13% +22% Mining & Const 7% - 6% +7% Other Industrial 38% +1.5% +1% May 4, 2018 © 2018 Broadwind Energy, Inc. All rights reserved.

8 © 2018 Broadwind Energy, Inc. All rights reserved. Global Gas Turbine Market May 4, 2018 ▪ Low power pricing environment has strained both n ew unit and aftermarket activity ▪ New unit deliveries in 2017 fell well short of PY and industry forecast ▪ Q1 18 orders up slightly – 10MW and 92 units, although not expected to be sustained ▪ Red Wolf focus on customer diversification outside of gas turbine OEM’s Source: McCoy Power Reports 0 10 20 30 40 50 60 70 0 50 100 150 200 250 300 350 400 2014 2015 2016 2017 Capacity (GW) # of Units > 10MW Global Gas Turbine Sales (Utility and IPP Class > 10MW) # of Units > 10MW GW

BWEN Consolidated Financial Results May 4, 2018 ▪ Q1 18 sales down from Q1 17 but up 69% sequentially – tower production begins to ramp up and continued strength in Gearing sales ▪ Operating loss for Q1 18 due primarily to low tower volume but recovery is evident ▪ Adj. EBITDA loss of $1.6 million in Q1 18 – weak tower results, partially offset by improvements in other businesses, 17pp improvement sequentially 9 © 2018 Broadwind Energy, Inc. All rights reserved. Q1 17 Q4 17 Q1 18 Total Sales $56.1 $17.8 $30.0 Gross Profit 6.4 (3.1) (.1) Gross Profit % 11.4% (17.5%) (.4%) Operating Expense 4.8 3.6 4.4 Operating Income/(Loss) 1.6 (6.7) (4.5) % of sales 2.9% (37.6%) (15.1%) Adj. EBITDA 3.9 (4.0) (1.6) % of sales 7.0% (22.2%) (5.3%) EPS, Continuing .43 (.45) (.32) $M except as noted otherwise

356 352 344 387 400 264 126 30 143 Q1 16 Q2 16 Q3 16 Q4 16 Q1 17 Q2 17 Q3 17 Q4 17 Q1 18 Quarterly Tower Section Sales Towers and Heavy Fabrications Q1 2017 Q4 2017 Q1 2018 Orders ($M) $29.1 $2.5 $7.8 Sections Sold (#) 400 9 143 Revenue ($M) 48.9 4.2 16.8 Operating Inc/(Loss) ($M) 5.8 (4.5) (1.5) - % of Sales 12.0% n/m (9.0%) EBITDA* ($M) 7.0 (3.0) (.1) - % of Sales 14.3% n/m n/m Q1 Results ▪ Initial tower order received after very weak 2017, continued demand for mining fabrications ▪ Q1 18 sections sold significantly below prior year, but up sequentially as production restarts from near shut down ▪ Operating loss due to low tower volume, less favorable product mix and significant start - up costs 2018 Objectives ▪ Diversify tower customer base and grow heavy fabrications business ▪ Cost out to offset margin pressure ▪ Build capabilities and customer base for heavy fabrications May 4, 2018 * Reconciliation to non - GAAP measure included in Appendix 10 © 2018 Broadwind Energy, Inc. All rights reserved.

Gearing Q1 2017 Q4 2017 Q1 2018 Orders ($M) $7.3 $7.4 $15.4 Revenue ($M) 3.9 8.5 8.8 Operating (Loss)/ Income ($M) (1.5) (.1) (.6) EBITDA* ($M) (.9) .6 - Q1 Results ▪ Orders continue to be strong primarily from oil & gas customers ▪ Revenue more than double Q1 17 ▪ Generated small positive EBITDA during Q1 18 May 4, 2018 2018 Objectives ▪ Optimize production flow through plants ▪ Continue diversification of customer base ▪ Achieve consistent operating pattern ▪ Generate positive operating income * Reconciliation to non - GAAP measure included in Appendix 11 © 2018 Broadwind Energy, Inc. All rights reserved. 0.0 2.0 4.0 6.0 8.0 10.0 12.0 2013 2014 2015 2016 2017 Q1 18 $M Quarterly Avg. Gearing Revenue by Market Oil & Gas Mining Wind Industrial Steel
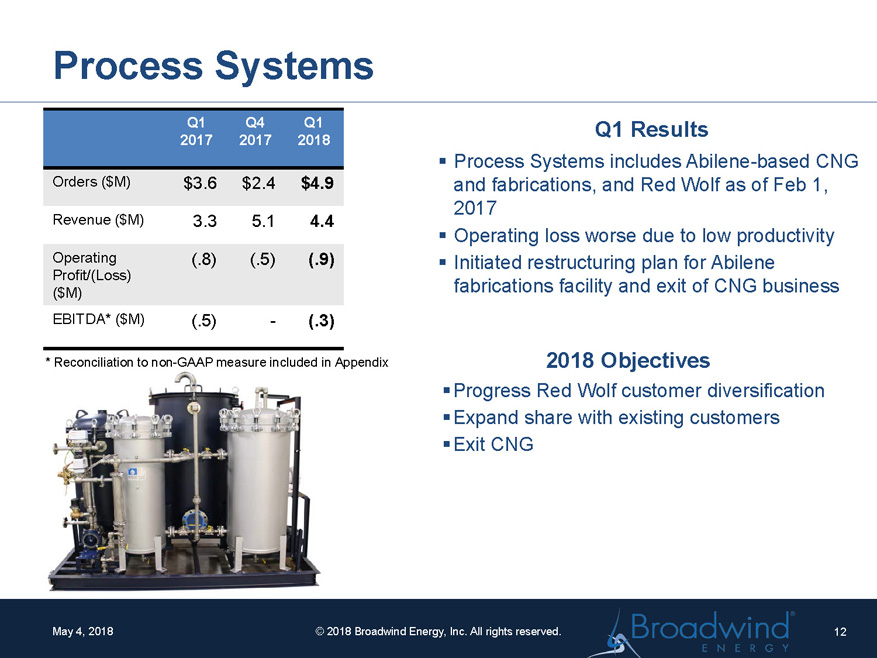
May 4, 2018 Process Systems Q1 2017 Q4 2017 Q1 2018 Orders ($M) $3.6 $2.4 $4.9 Revenue ($M) 3.3 5.1 4.4 Operating Profit/(Loss) ($M) (.8) (.5) (.9) EBITDA* ($M) (.5) - (.3) * Reconciliation to non - GAAP measure included in Appendix Q1 Results ▪ Process Systems includes Abilene - based CNG and fabrications, and Red Wolf as of Feb 1, 2017 ▪ Operating loss worse due to low productivity ▪ Initiated restructuring plan for Abilene fabrications facility and exit of CNG business 2018 Objectives ▪ Progress Red Wolf customer diversification ▪ Expand share with existing customers ▪ Exit CNG 12 © 2018 Broadwind Energy, Inc. All rights reserved.

Operating Working Capital (OWC) May 4, 2018 ▪ Reduction in AR past dues since year end ▪ Inventory turns improving because of elevated production levels * Operating Working Capital = Trade A/R + Inventories – Trade Payables – Customer Deposits 12/31/17 3/31/18 DSO 70 48 Inv. Turns 5.0 5.4 DPO 44 42 Cash Conv. (days) 48 44 OWC $M 11.4 14.3 OWC* Historical Trend – cents/$ sales OWC* Management 13 © 2018 Broadwind Energy, Inc. All rights reserved. $(0.05) $- $0.05 $0.10 $0.15 $0.20

Balance Sheet and Capital Expenditures May 4, 2018 $1.6 $6.2 $6.6 2015 2016 2017 2018e 2015 2016 2017 2018e 1.5 - 2.5% Capital Expenditures (net) ▪ Cash applied to balance on credit line ▪ CIBC (previously The Private Bank) $25M credit line had $10M of additional availability at quarter - end ▪ Capital expenditures minimal in 2018 – Abilene tower facility expansion complete in 2017 14 © 2018 Broadwind Energy, Inc. All rights reserved. % of sales 0.8% 3.4% 4.5% 3/31/201712/31/20173/31/2018 Cash Assets 0.3$ 0.1$ -$ Accounts Receivable 23.7 13.6 15.9 Inventory 25.8 19.3 22.3 PPE 56.0 55.7 53.7 Other 25.9 23.7 23.3 Total Assets 131.7 112.4 115.2 Accounts Payable 19.5 11.8 13.9 Customer Deposits 13.6 9.8 10.0 Debt + Cap Leases 10.5 16.7 21.2 Other 13.0 8.1 8.4 Total Liabilities 56.6 46.4 53.5 Equity 75.1 66.0 61.7 (In Millions)

2018 Priorities May 4, 2018 15 © 2018 Broadwind Energy, Inc. All rights reserved. ▪ Customer diversification ▪ Manufacturing footprint r eduction ▪ Restructure systems to support changing sales mix ▪ CI to offset margin compression ▪ Manage through steel escalation risk

Appendix May 4, 2018 16 © 2018 Broadwind Energy, Inc. All rights reserved. Consolidated 2018 2017 Net (Loss)/Income from continuing operations…………………………….(4,811)$ 6,482$ Interest Expense………………………………………………. 298 139 Income Tax Provision/(Benefit)……………………………… (27) (5,018) Depreciation and Amortization………………………………………………………………2,357 2,101 Share-based Compensation and Other Stock Payments………………………………………………………………429 222 Restructuring Costs…………………………………………. 151 - Adjusted EBITDA (Non-GAAP)…………………………. (1,603)$ 3,926$ Three Months Ended March 31, Towers and Heavy Fabrications Segment 2018 2017 Net (Loss)/Income…………………………………………. (1,115)$ 4,003$ Interest Expense/(Benefit)…………………………………. 31 15 Income Tax (Benefit)/Provision……………………………… (419) 1,831 Depreciation and Amortization………………………………………………………………1,255 1,092 Share-based Compensation and Other Stock Payments………………………………………………………………143 58 Adjusted EBITDA (Non-GAAP)…………………. (105)$ 6,999$ Three Months Ended March 31, Gearing Segment 2018 2017 Net Income/(Loss)…………...……………………………. (631)$ (1,537)$ Interest Expense…………………………………………… 3 4 Income Tax Provision/(Benefit)……………………………… 3 2 Depreciation and Amortization………………………………………………………………590 625 Share-based Compensation and Other Stock Payments………………………………………………………………66 19 Adjusted EBITDA (Non-GAAP)……………………….. 31$ (887)$ Three Months Ended March 31,

Appendix May 4, 2018 17 © 2018 Broadwind Energy, Inc. All rights reserved. Process Systems 2018 2017 Net Income/(Loss)……………………………………….. (644)$ (699)$ Interest Expense………………………………………….. 1 1 Income Tax Provision/(Benefit)…………………………. (253) (125) Depreciation and Amortization…………………………… 451 334 Share-based Compensation and Other Stock Payments…. 28 6 Restructuring Expense 152 - Adjusted EBITDA (Non-GAAP)……………………… (265)$ (483)$ Three Months Ended March 31, Corporate and Other 2018 2017 Net(Loss)/Income………………………………………………….. (2,421)$ 4,715$ Interest Expense………………………………………………… 263 119 Income Tax Provision/(Benefit)……………………………… 642 (6,726) Depreciation and Amortization………………………………………………………………61 51 Share-based Compensation and Other Stock Payments………………………………………………………………192 138 Adjusted EBITDA (Non-GAAP)……………………………. (1,263)$ (1,703)$ Three Months Ended March 31,

Broadwind Energy is a precision manufacturer of structures, equipment & components for clean tech and other specialized applications . www.BWEN.com May 4, 2018 18 © 2018 Broadwind Energy, Inc. All rights reserved.