Attached files
| file | filename |
|---|---|
| EX-99.1 - EXHIBIT 99.1 - INSIGHT ENTERPRISES INC | d563298dex991.htm |
| 8-K - FORM 8-K - INSIGHT ENTERPRISES INC | d563298d8k.htm |

Insight Enterprises, Inc. First Quarter 2018 Earnings Conference Call and Webcast Exhibit 99.2
Agenda Opening comments CEO commentary First Quarter 2018 Results Consolidated Segments CFO commentary Q1 Effective Tax Rate Adoption of ASC 606 2018 Cash Flow Performance Closing comments & 2018 Guidance
Disclosures Safe harbor statement This presentation includes “forward-looking statements” within the meaning of the Private Securities Litigation Reform Act of 1995 related to Insight’s plans and expectations. Statements that are not historical facts, including statements about future trends in the IT market and our opportunities for growth, are forward-looking statements. These forward-looking statements are subject to assumptions, risks and uncertainties which could cause actual results or future events to differ materially from such statements. The Company undertakes no obligation to update publicly or revise any of the forward-looking statements, except as otherwise required by law. More detailed information about risk factors are discussed in the Company’s Annual Report on Form 10-K for the year ended December 31, 2017. Non-GAAP measures This presentation will reference certain non-GAAP financial information as ‘Adjusted’. A reconciliation of non-GAAP financial measures presented in this document is attached to back of this presentation and included in the press release issued today which you may find on the Investor Relations section of our website at investor.insight.com.
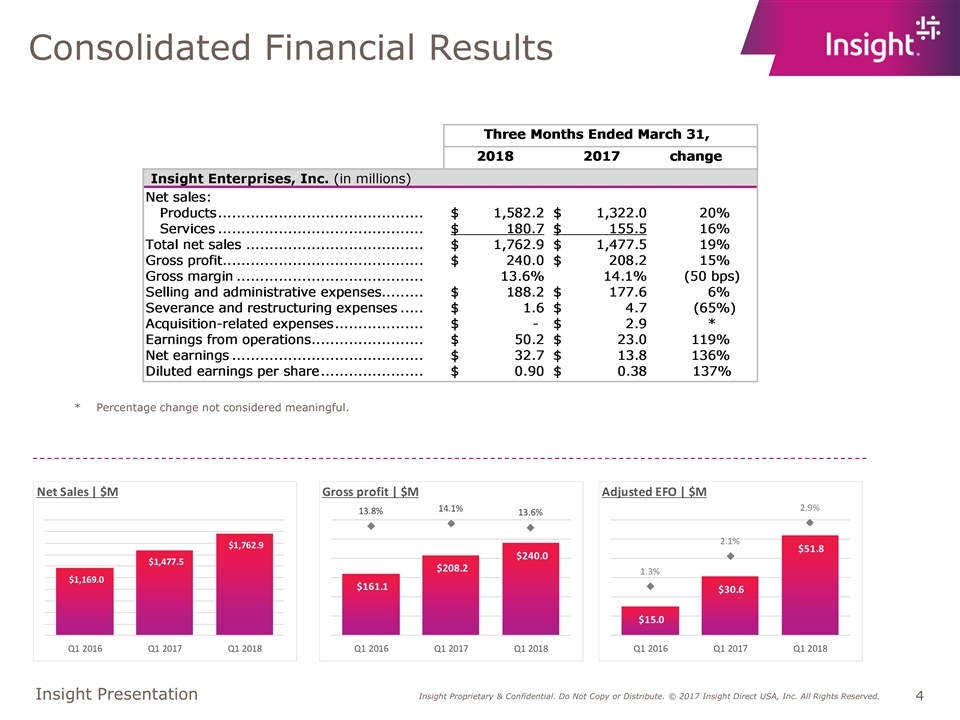
Consolidated Financial Results * Percentage change not considered meaningful.
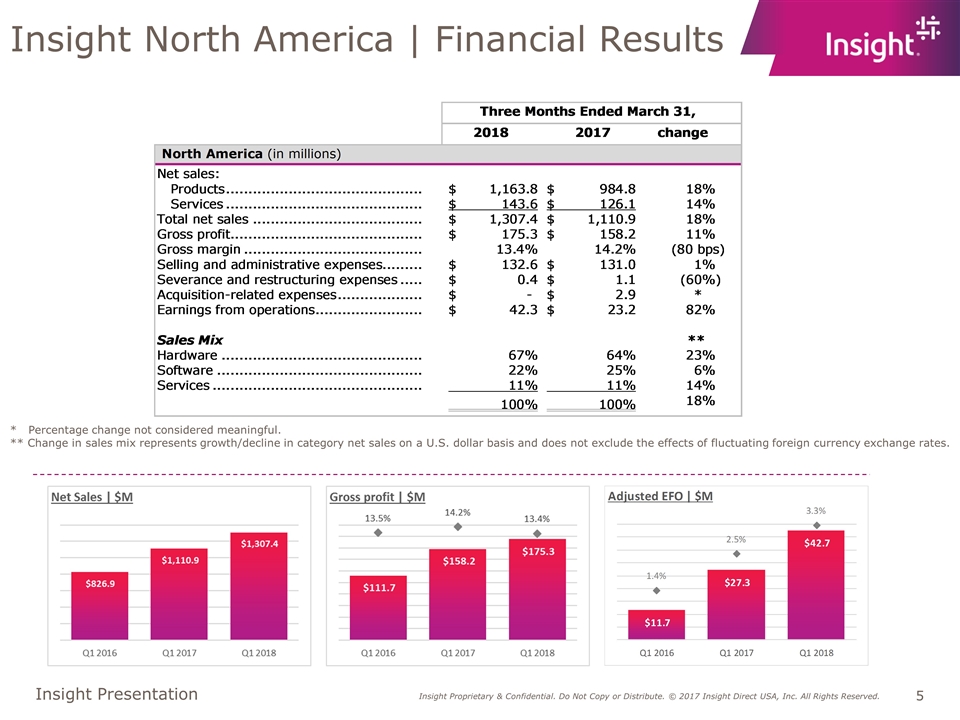
Insight North America | Financial Results * Percentage change not considered meaningful. ** Change in sales mix represents growth/decline in category net sales on a U.S. dollar basis and does not exclude the effects of fluctuating foreign currency exchange rates.
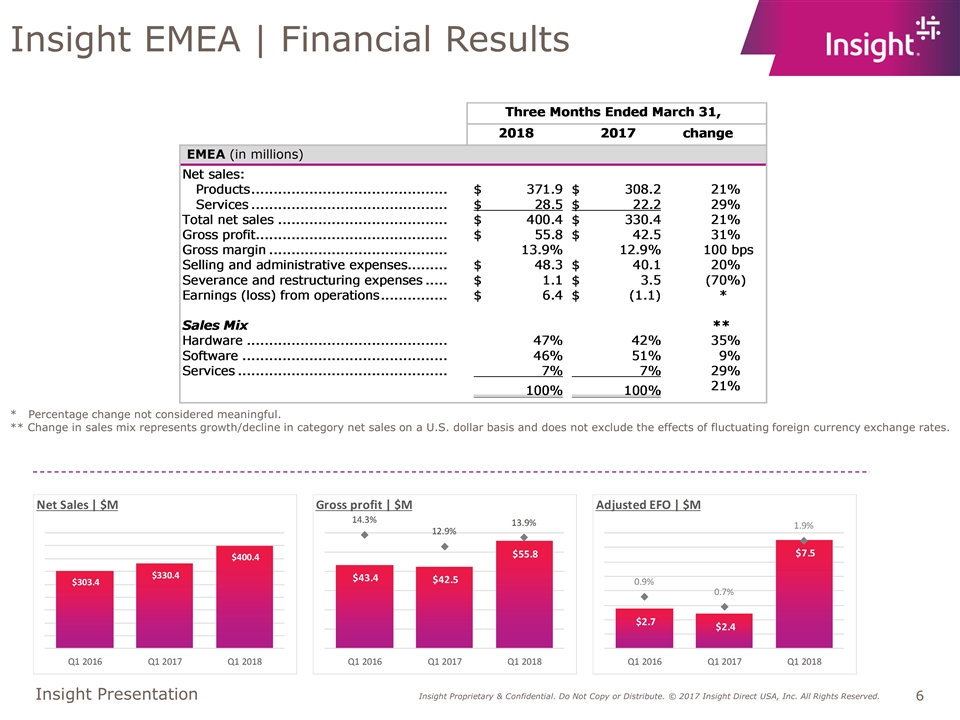
Insight EMEA | Financial Results * Percentage change not considered meaningful. ** Change in sales mix represents growth/decline in category net sales on a U.S. dollar basis and does not exclude the effects of fluctuating foreign currency exchange rates.
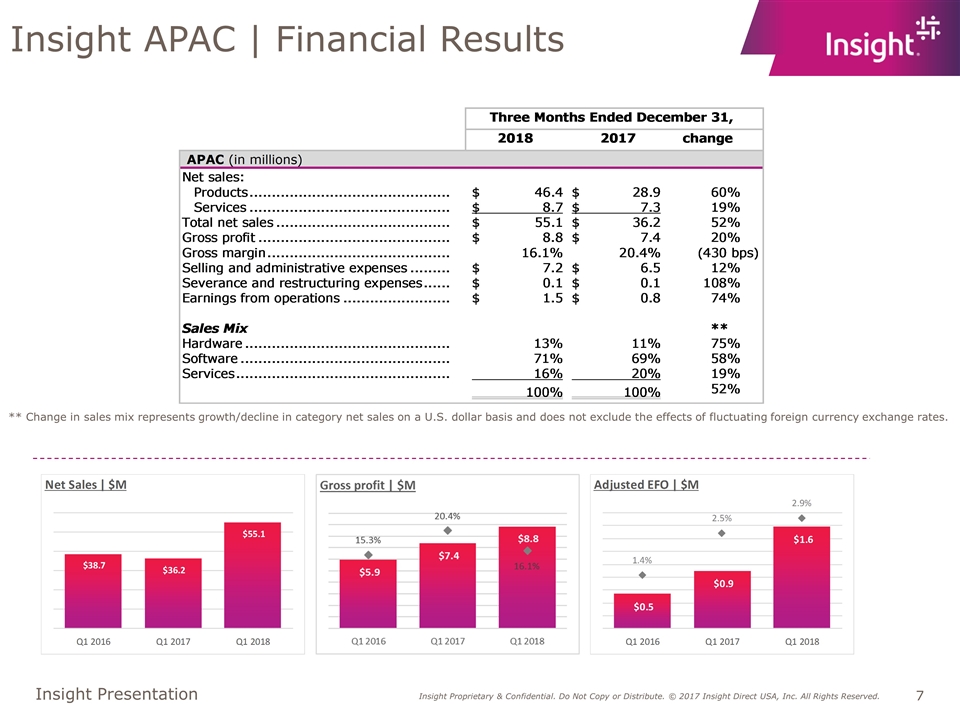
Insight APAC | Financial Results ** Change in sales mix represents growth/decline in category net sales on a U.S. dollar basis and does not exclude the effects of fluctuating foreign currency exchange rates.
CFO Commentary Q1 2018 Tax rate ASC 606 – Revenue Recognition Q1 2018 Cash Flow Performance
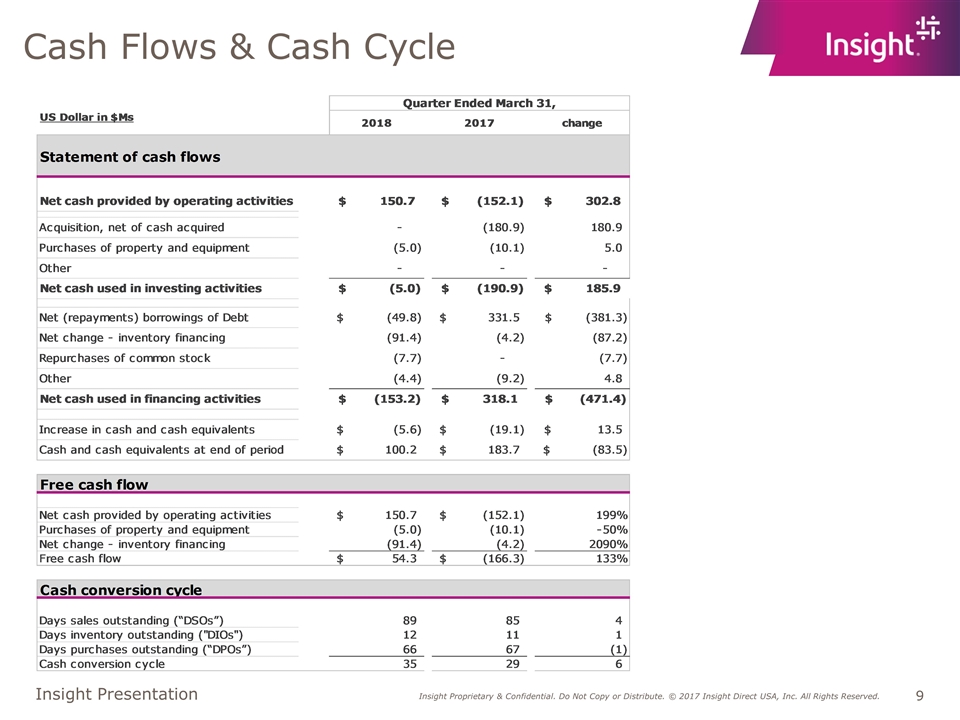
Cash Flows & Cash Cycle
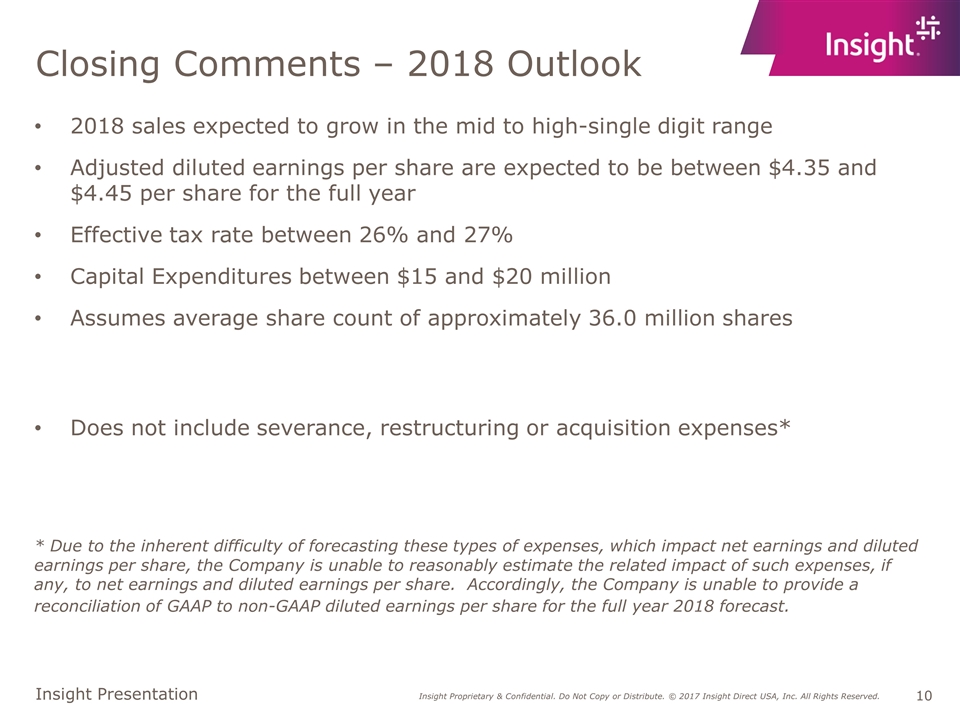
Closing Comments – 2018 Outlook 2018 sales expected to grow in the mid to high-single digit range Adjusted diluted earnings per share are expected to be between $4.35 and $4.45 per share for the full year Effective tax rate between 26% and 27% Capital Expenditures between $15 and $20 million Assumes average share count of approximately 36.0 million shares Does not include severance, restructuring or acquisition expenses* * Due to the inherent difficulty of forecasting these types of expenses, which impact net earnings and diluted earnings per share, the Company is unable to reasonably estimate the related impact of such expenses, if any, to net earnings and diluted earnings per share. Accordingly, the Company is unable to provide a reconciliation of GAAP to non-GAAP diluted earnings per share for the full year 2018 forecast.
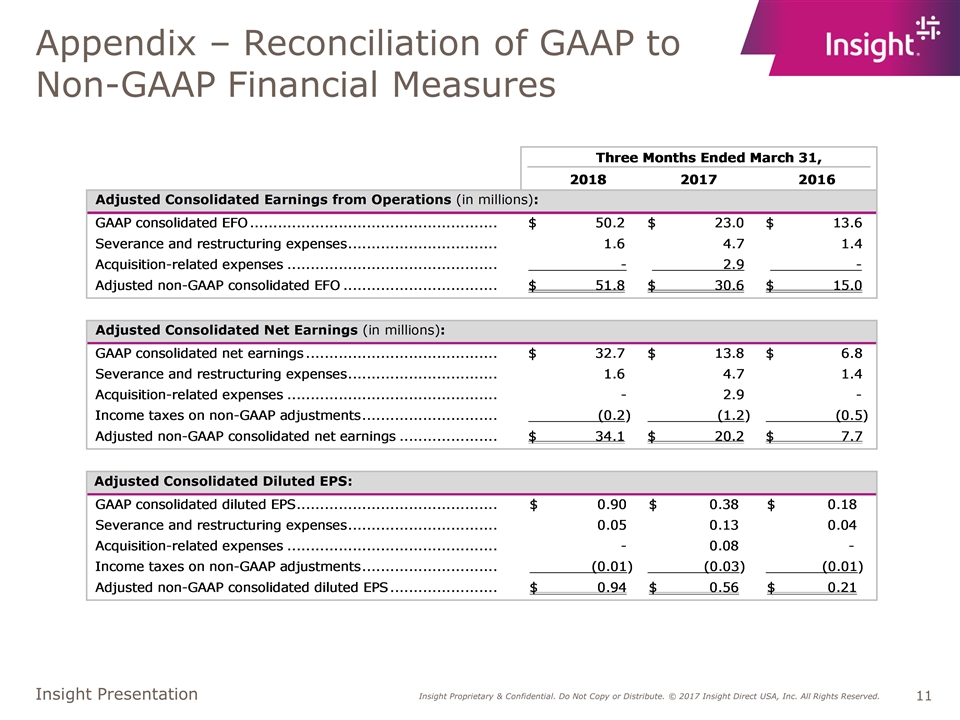
Appendix – Reconciliation of GAAP to Non-GAAP Financial Measures
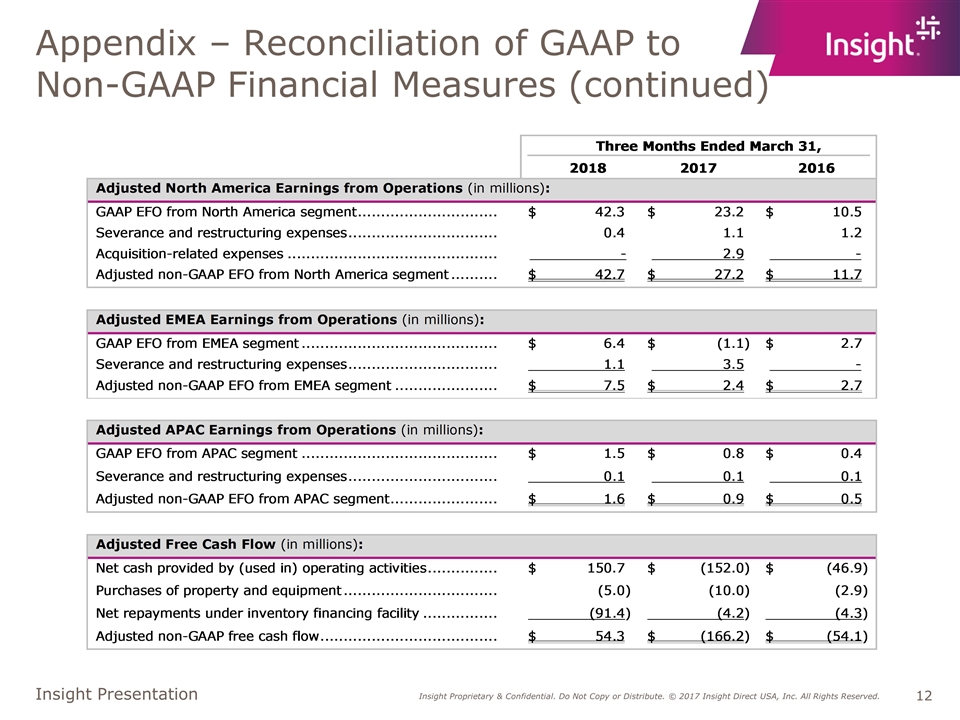
Appendix – Reconciliation of GAAP to Non-GAAP Financial Measures (continued)
