Attached files
| file | filename |
|---|---|
| EX-99 - EXHIBIT 99 - FORD MOTOR CREDIT CO LLC | april2018salesfinalfilingver.pdf |
| 8-K - 8-K - FORD MOTOR CREDIT CO LLC | sales8-kdated05x01x2018.htm |

? Ford Motor Company U.S. sales for April totaled
204,651 vehicles – a 4.7 percent decline
? Fleet performance is down 8.6 percent due to order
timing, with sales of 67,602 vehicles
? Ford’s overall transaction prices are almost $4,000
higher than the industry average, at $36,300 per
vehicle, while retail sales declined 2.6 percent
? Ford F-Series now marks 12 straight months of
year-over-year gains, posting its best April
performance since 2000 on total sales of 73,104
trucks
? Retail sales of the all-new Ford Expedition jumped
25.8 percent last month, as dealer inventories
continue to expand. Expedition is spending just 17
days on dealer lots on average
? All-new Ford EcoSport sales had it’s best monthly
sales to date; sales totaled 5,277 SUVs for April.
Some of our strongest sales regions for EcoSport last
month were New York, Boston, and Philadelphia
? Retail sales of Lincoln Navigator soared in April,
with the all-new SUV up 135.0 percent; customer
orders continue to exceed supply, with overall
average transaction prices up $26,300 over year-ago
levels
# # #
About Ford Motor Company
Ford Motor Company is a global company based in Dearborn, Michigan. The
company designs, manufactures, markets and services a full line of Ford
cars, trucks, SUVs, electrified vehicles and Lincoln luxury vehicles, provides
financial services through Ford Motor Credit Company and is pursuing
leadership positions in electrification, autonomous vehicles and mobility
solutions. Ford employs approximately 202,000 people worldwide. For more
information regarding Ford, its products and Ford Motor Credit Company,
please visit www.corporate.ford.com.
*U.S. sales volume reflects transactions with (i) retail and fleet customers
(as reported by dealers), (ii) government and (iii) Ford management. Average
transaction pricing based on J.D. Power and Associates PIN data.
A P R I L 2 0 1 8 S A L E S
“The industry continues to operate at
historically strong levels. We are seeing
this with our F-Series trucks, which
have now posted 12 consecutive
months of year-over-year gains. The
market continues to strongly favor well-
equipped SUVs and trucks and our
F-Series and new Expedition and
Lincoln Navigator are capitalizing on
this generational shift.”
– Mark LaNeve, Ford vice president,
U.S. Marketing, Sales and Service
F-Series Posts Best April Results in 18 Years While New
Expedition Climbs 26 Percent At Retail; New Navigator Retail
Sales Jump 135 Percent
Total Vehicle Retail Fleet Truck SUV Car
U.S. Sales 204,651 137,049 67,602 92,338 69,940 42,373
Versus
April 2017 -4.7% -2.6% -8.6% 0.9% -4.6% -15.0%
H I G H L I G H T S
K E Y V E H I C L E S
F-Series is now reporting 12
consecutive months of year-over-
year increases, with top trim level
Lariat, King Ranch, Platinum and
Limited Super Duty pickups
representing 49 percent of sales.
Overall F-Series average transaction
pricing gained $900 last month.
2018 Ford Super Duty
2018 Ford Expedition
2018 Lincoln Navigator
EcoSport volumes continue to grow,
with April marking the highest
volumes yet – 5,277 SUVs sold. We
continue to see a strong mix of
1.0-liter EcoBoost®-powered
vehicles, at more than 40 percent.
Navigator sales are up 135 percent
at retail and 122 percent overall.
Average time on dealer lots remains
a quick 13 days overall, just 10
days for Black Label. We’re seeing
triple-digit increases in every region,
with the West producing the most
sizable gains - 188 percent.
Average transaction pricing is up
$26,300, at $81,200.
www.twitter.com/Ford
Expedition is spending an average of
just 17 days on dealer lots, as retail
sales show a gain of 25.8 percent
last month. Our West region is
reporting the highest growth, with
retail sales up 59 percent. Average
transaction prices are up $12,100
over year-ago levels.
2018 Ford EcoSport

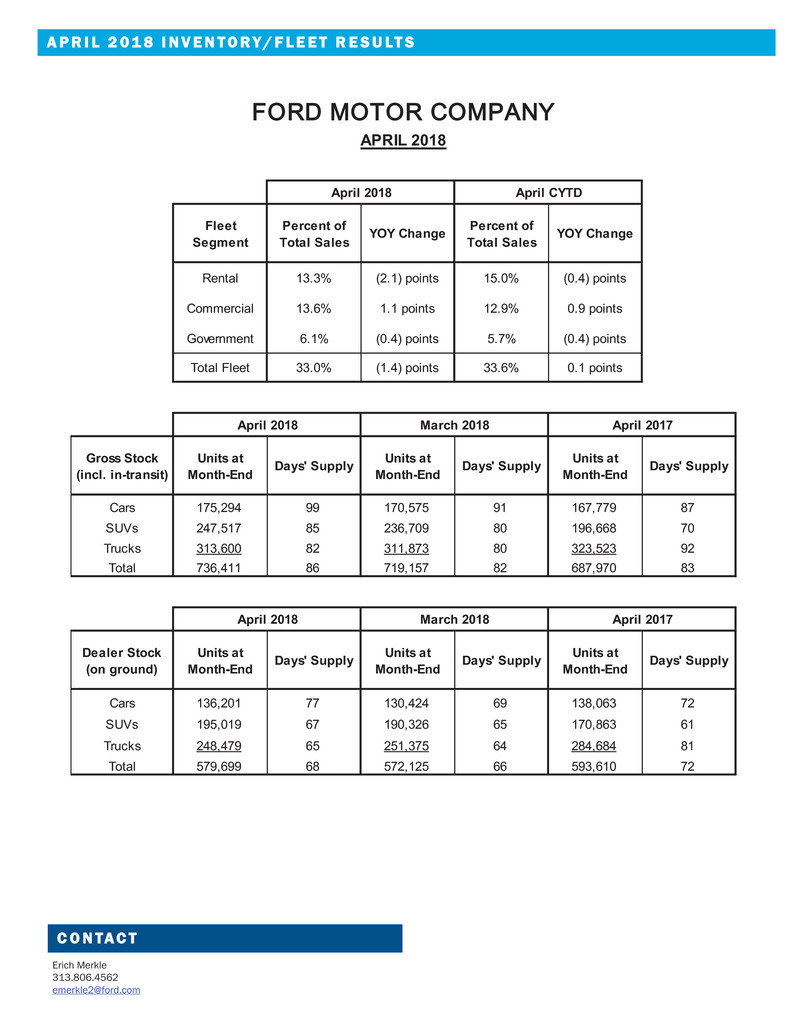
A P R I L 2 0 1 8 I N V E N T O R Y / F L E E T R E S U LT S
C O N TA C T
Erich Merkle
313.806.4562
emerkle2@ford.com
Fleet
Segment
Percent of
Total Sales YOY Change
Percent of
Total Sales YOY Change
Rental 13.3% (2.1) points 15.0% (0.4) points
Commercial 13.6% 1.1 points 12.9% 0.9 points
Government 6.1% (0.4) points 5.7% (0.4) points
Total Fleet 33.0% (1.4) points 33.6% 0.1 points
Gross Stock
(incl. in-transit)
Units at
Month-End Days' Supply
Units at
Month-End Days' Supply
Units at
Month-End Days' Supply
Cars 175,294 99 170,575 91 167,779 87
SUVs 247,517 85 236,709 80 196,668 70
Trucks 313,600 82 311,873 80 323,523 92
Total 736,411 86 719,157 82 687,970 83
Dealer Stock
(on ground)
Units at
Month-End Days' Supply
Units at
Month-End Days' Supply
Units at
Month-End Days' Supply
Cars 136,201 77 130,424 69 138,063 72
SUVs 195,019 67 190,326 65 170,863 61
Trucks 248,479 65 251,375 64 284,684 81
Total 579,699 68 572,125 66 593,610 72
April 2018 March 2018 April 2017
??????????????????
APRIL 2018
April 2018 April CYTD
April 2018 March 2018 April 2017
