Attached files
| file | filename |
|---|---|
| EX-99.1 - EXHIBIT 99.1 - Luther Burbank Corp | exh_991.htm |
| 8-K - FORM 8-K - Luther Burbank Corp | f8k_042618.htm |
Exhibit 99.2
Investor Presentation March 31, 2018 John Biggs President & Chief Executive Officer Laura Tarantino Executive Vice President & Chief Financial Officer
2 Forward - Looking Statement This communication contains a number of forward - looking statements within the meaning of the Private Securities Litigation Reform Act of 1995 . These forward - looking statements reflect our current views with respect to, among other things, future events and our results of operations, financial condition and financial performance . All statements contained in this communication that are not clearly historical in nature are forward - looking, and the words such as "anticipate," "believe," “continue,” "could," "estimate," "expect," “impact,” "intend," "seek," "may," "outlook," "plan," "potential," "predict," "project," "should," "will," "would" and similar terms and phrases are generally intended to identify forward - looking statements . These forward - looking statements are not historical facts, and are based on current expectations, estimates and projections about our industry, management’s beliefs and certain assumptions made by management, many of which, by their nature, are inherently uncertain and beyond our control . Accordingly, we caution you that any such forward - looking statements are not guarantees of future performance and are subject to risks, assumptions and uncertainties that are difficult to predict . Although we believe that the expectations reflected in these forward - looking statements are reasonable as of the date made, actual results may prove to be materially different from the results expressed or implied by the forward - looking statements . Such factors include, without limitation, the “Risk Factors” referenced in our Registration Statement on Form S - 1 filed with the Securities and Exchange Commission (“SEC”) . The risks and uncertainties listed from time to time in our reports and documents filed with the SEC, and the following factors : business and economic conditions generally and in the financial services industry, nationally and within our current and future geographic market areas ; economic, market, operational, liquidity, credit and interest rate risks associated with our business ; the occurrence of significant natural or man - made disasters , including fires, earthquakes, and terrorist acts ; our management of risks inherent in our real estate loan portfolio, and the risk of a prolonged downturn in the real estate market ; our ability to achieve organic loan and deposit growth and the composition of such growth ; the fiscal position of the U . S federal government and the soundness of other financial institutions ; changes in consumer spending and savings habits ; technological and social media changes ; the laws and regulations applicable to our business ; increased competition in the financial services industry ; changes in the level of our nonperforming assets and charge - offs ; our involvement from time to time in legal proceedings and examination and remedial actions by regulators ; the composition of our management team and our ability to attract and retain key personnel ; material weaknesses in our internal control over financial reporting ; systems failures or interruptions involving our information technology and telecommunications systems ; and potential exposure to fraud, negligence, computer theft and cyber - crime . The Company can give no assurance that any goal or expectation set forth in forward - looking statements can be achieved and readers are cautioned not to place undue reliance on such statements . These forward - looking statements are made as of the date of this communication, and the Company does not intend, and assumes no obligation, to update any forward - looking statement to reflect events or circumstances after the date on which the statement is made or to reflect the occurrence of unanticipated events or circumstances, except as required by law .
3 Use of Non - GAAP Financial Measures This investor presentation contains certain financial measures that are not measures recognized under U . S . generally accepted accounting principles (GAAP) and therefore are considered non - GAAP financial measures . The Company’s management uses these non - GAAP financial measures in their analysis of the Company’s performance, financial condition and the efficiency of its operations . Management believes that these non - GAAP financial measures provide a greater understanding of ongoing operations and enhance comparability of results with prior periods as well as demonstrate the effects of significant gains and changes in the current period . The Company’s management also believes that investors find these non - GAAP financial measures useful as they assist investors in understanding our underlying operations performance and the analysis of ongoing operating trends . However, the non - GAAP financial measures discussed herein should not be considered in isolation or as a substitute for the most directly comparable or other financial measures calculated in accordance with GAAP . Moreover, the manner in which we calculate the non - GAAP financial measures discussed herein may differ from that of other companies reporting measures with similar names . You should understand how such other banking organizations calculate their financial measures similar or with names similar to the non - GAAP financial measures we have discussed herein when comparing such non - GAAP financial measures . Below is a listing of the non - GAAP financial measures used in this investor presentation . • Pro forma net income, return on average assets, return on average equity and per share amounts are calculated by adding back our franchise S Corporation tax to net income, and using a combined C Corporation effective tax rate for Federal and California income taxes of 42 . 0 % . This calculation reflects only the changes in our status as an S Corporation and does not give effect to any other transaction . Efficiency ratio is defined as noninterest expenses divided by operating revenue, which is equal to net interest income plus noninterest income . • Tangible book value and tangible stockholders’ equity to tangible assets are non - GAAP measures that exclude the impact of goodwill and are used by the Company’s management to evaluate capital adequacy . Because intangible assets such as goodwill vary extensively from company to company, we believe that the presentation of these non - GAAP financial measures allows investors to more easily compare the Company’s capital position to other companies . A reconciliation to these non - GAAP financial measures to the most directly comparable GAAP measures are provided in the appendix to this investor presentation .

4 2017: Q3 - Completed $626 million MFR securitization; Q4 – Closed IPO at $10.75 per share & raised $138 million net proceeds or $98 million after special dividend Luther Burbank’s More Than 34 - Year History Note: Branch deposits as of 03/31/2018 1983: Luther Burbank S&LA was chartered in Santa Rosa, CA; an initial $2 million is the only equity raise, prior to our recent IPO, in our 34 - year history 1996: Completed acquisition of New Horizon S&LA, our only acquisition 2000: Converted to a federal savings association and changed our name to Luther Burbank Savings 2006: Issued $61.9 million in notes related to Trust Preferred Securities 2014: Issued $95 million in senior notes with a 6.50% fixed coupon to refinance the notes issued between 2009 and 2011 2016: Converted to a state - chartered commercial bank (OCC to FDIC) 2009 - 2011: Issued $62.7 million in senior notes with a 9.875% fixed coupon to friends and family 1996 - 2006: Migration to apartment lending; expanded products to include jumbo single - family lending 1990’s 1980’s 2000’s 2010’s 1983: Opened Santa Rosa Total Deposits: $1.2bn 1996: Opened San Rafael Total Deposits: $523mm 2015: Opened Long Beach Total Deposits: $153mm 2007: Opened Encino Total Deposits: $397mm 2010: Opened Beverly Hills Total Deposits: $343mm 2000: Opened Los Altos Total Deposits: $298mm 2008: Opened Toluca Lake Total Deposits: $237mm 2009: Opened Pasadena Total Deposits: $258mm 2012: Opened San Jose Total Deposits: $138mm 1983 - 1989: Specialty CRE lender including land, C&D, joint ventures and commercial 2018: FDIC Approved Bellevue, WA Opening ETA: June 2018

5 Franchise Overview and Financial Highlights (1) Financial data as of or for the three months ended 03/31/2018. See non - GAAP reconciliation in Appendix hereto. (2) Includes multifamily residential, commercial real estate, and construction loans. Financial Highlights 03/31/2018 (1) Total Assets ($mm) $6,034 Total Loans ($mm) $5,326 Total Deposits ($mm) $4,114 Loans / Deposits 129% Tangible Book Value / Tang. Assets 9.1% Leverage Capital Ratio 10.6% Total Risk - Based Capital Ratio 18.2% Total CRE Loans (2) / Total Risk - Based Capital 498% ROAA 0.76% ROAE 7.98% Net Interest Margin 2.11% EPS – Fully Diluted $0.20 Efficiency Ratio 46.7% Noninterest Expense / Avg. Assets 1.01% NPAs / Assets 0.12% ALLL / Loans HFI 0.60% Full - Time Equivalent Employees 267 Branch (10) Loan Production Office (9) * Highlighted counties indicate current lending markets Our Small Network of Large Branches OR CA WA San Francisco Los Angeles 1 2 5 9 3 6 7 8 4 A 1 5 9 4 3 7 6 8 2 10
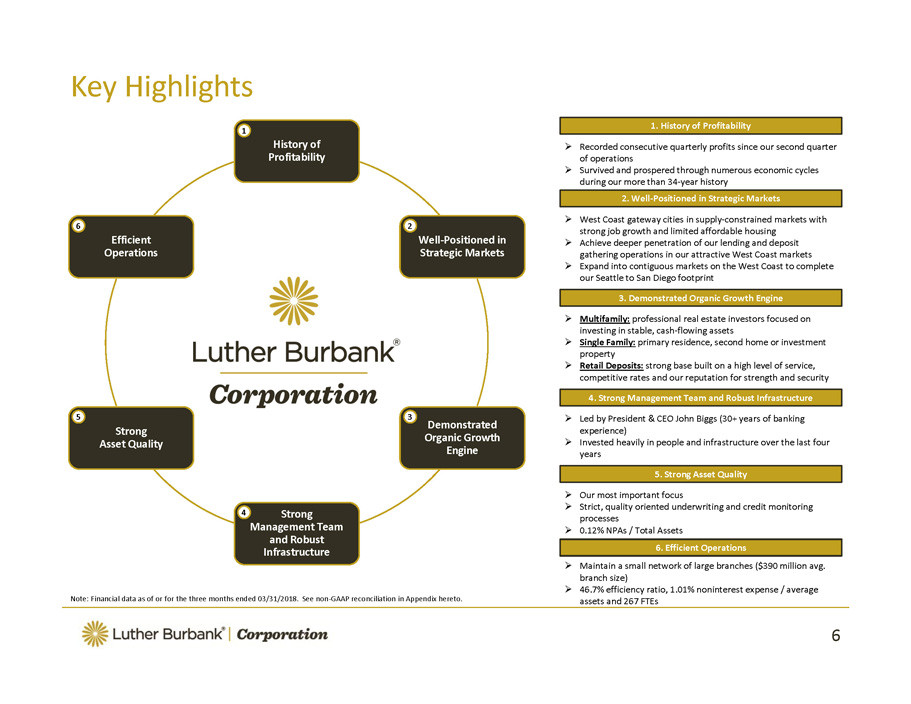
6 History of Profitability Well - Positioned in Strategic Markets Demonstrated Organic Growth Engine Strong Management Team and Robust Infrastructure Strong Asset Quality Efficient Operations Key Highlights Note: Financial data as of or for the three months ended 03/31/2018. See non - GAAP reconciliation in Appendix hereto. 4 3 2 1 6 5 » Recorded consecutive quarterly profits since our second quarter of operations » Survived and prospered through numerous economic cycles during our more than 34 - year history » West Coast gateway cities in supply - constrained markets with strong job growth and limited affordable housing » Achieve deeper penetration of our lending and deposit gathering operations in our attractive West Coast markets » Expand into contiguous markets on the West Coast to complete our Seattle to San Diego footprint » Multifamily: professional real estate investors focused on investing in stable, cash - flowing assets » Single Family: primary residence, second home or investment property » Retail Deposits: strong base built on a high level of service, competitive rates and our reputation for strength and security » Led by President & CEO John Biggs (30+ years of banking experience) » Invested heavily in people and infrastructure over the last four years » Our most important focus » Strict, quality oriented underwriting and credit monitoring processes » 0.12% NPAs / Total Assets » Maintain a small network of large branches ($390 million avg. branch size) » 46.7% efficiency ratio, 1.01% noninterest expense / average assets and 267 FTEs 1. History of Profitability 2. Well - Positioned in Strategic Markets 3. Demonstrated Organic Growth Engine 4. Strong Management Team and Robust Infrastructure 5. Strong Asset Quality 6. Efficient Operations

7 Top Multifamily Lenders in the United States Source: SNL Financial. (1) Represents delinquent multifamily loans as a percentage of total multifamily loans. Delinquent loans include 30+ days past due and nona ccr ual loans. (2) Includes all U.S. commercial banks, savings banks and savings and loan associations. Top 25 Banks and Thrifts by Multifamily Loans

8 Luther Burbank Peer Group Source: SNL Financial. GAAP data when available, otherwise FR Y - 9C’s and bank call reports as of or for the twelve months ended 12/31/2017. Note that SNL earnings ratios may differ from Company as SNL annualizes one qu arter rather than using data for 12 months and SNL does not pro forma C Corporation earnings for S Corporations. (1) Non - performing assets (“NPA”) exclude performing troubled debt restructurings. (2) Compound annual growth rate (“CAGR”) from 12/31/2014 to 12/31/2017. » Includes all major exchange - traded banks and thrifts nationwide with : x Total assets $ 1 billion - $ 100 billion x Multifamily loans > $1 billion x Multifamily loans / total loans > 20 %

9 Our Lending Business Note: Data as of 03/31/2018. Multifamily Residential Loans Markets: » High barrier to entry for new development; little land to develop » Limited supply of new housing » High variance between cost to own and rent Deals: » Stabilized and seasoned assets » Older, smaller properties with rents at/below market levels, catering to lower and middle income renters Sponsors: » Experienced real estate professionals who desire regular income/cash flow streams and are focused on building wealth steadily over time Single - Family Residential Loans Property Types: » Both owner - occupied and investor owned Broker Network: » Primarily third party mortgage brokers with the intention of retaining these loans in our portfolio Originations: » Majority are for purchase transactions » Also provide refinancing Underwriting Focus: » Debt ratios » Loan to Value » Credit scores » Borrower’s liquidity and cash reserves 0.12% NPAs / Assets 0.13% NPLs / Loans Multifamily Portfolio Highlights » $1.5 million average loan balance » 15.6 units average » 56.7% average loan - to - value ratio » 1.58x average debt service coverage ratio Single - Family Portfolio Highlights » $881 thousand average loan balance » 64.9% average loan - to - value ratio » 749 average credit score

10 » First Mortgages » Hybrid Structures • 25 - or 30 - year amortization • 10 - , 25 - or 30 - year maturities • 3 - , 5 - or 7 - year fixed periods » Interest Only Option • Lower loan - to - value ratios • Underwrite at amortizing payment » Investor - Owner Purchase or Refinance Our Lending Products Multifamily / Commercial Real Estate Lending Single - Family Residential Lending » First Mortgages » Hybrid Structures • 30 - or 40 - year amortization • 30 - or 40 - year maturities • 3 - , 5 - or 7 - year fixed periods » Full Documentation » Purchase or Refinance Transactions » Primary Residence, Second Home or Investor programs » Grow Program • First - time homebuyer
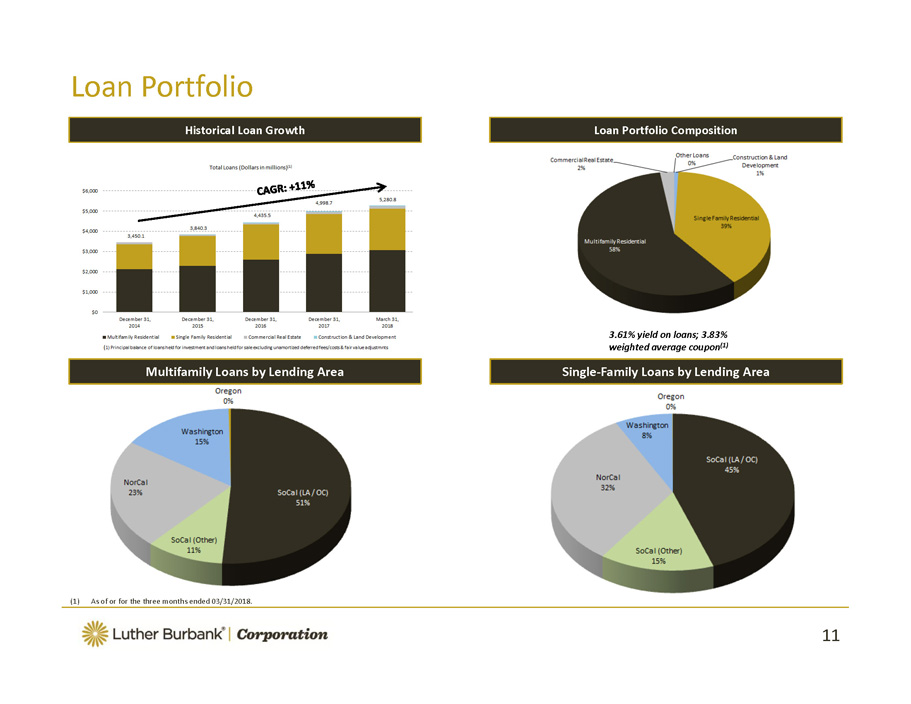
11 Loan Portfolio (1) As of or for the three months ended 03/31/2018. Historical Loan Growth 3.61% yield on loans; 3.83% weighted average coupon (1) Loan Portfolio Composition Multifamily Loans by Lending Area Single - Family Loans by Lending Area

12 Asset Quality » Risk management is a core competency of our business » Extensive expertise among our lending and credit administration staff and executive officers » Credit decisions are made efficiently and consistent with our underwriting standards » Continuous evaluation of risk & return » Strict separation between business development and credit decisions » Vigilant response to adverse economic conditions and specific problem credits » Strict, quality oriented underwriting and credit monitoring processes » 03/31/2018 NPAs / Total Assets of 0.12%; NPLs / Total Loans of 0.13% » Decrease in NPAs and loans 90+ days past due to total assets over each of the three years ended December 31, 2016 » Only one foreclosure in the past three years Culture Approach Results (1) Excludes performing troubled debt restructurings. Nonperforming Assets (1) / Total Assets

13 LOAN ORIGINATION VOLUME AND RATES Pipeline: • Total loan pipeline at March 31, 2018 is $375.7 million ($260.1 million CRE at 4.541% WAC & $ 148.3 million SFR at 4.89% WAC.) A portion of our pipeline will ultimately fallout/ not fund and loans without rate locks are subject to ongoing rate increases/ decreas es.

14 CRE Loan Origination Composition YTD Loan Volume & WAC 12 Months Ended December 31, 2017 3 Months Ended March 31, 2018 3.970% 4.200% 4.600% 4.730% 4.270% 4.340% 4.840% 5.350%

15 SFR Loan Origination Composition YTD Loan Volume & WAC 5.15% 12 Months Ended December 31, 2017 3 Months Ended March 31, 2018 3.990% 3.910% 4.198% 4.341%
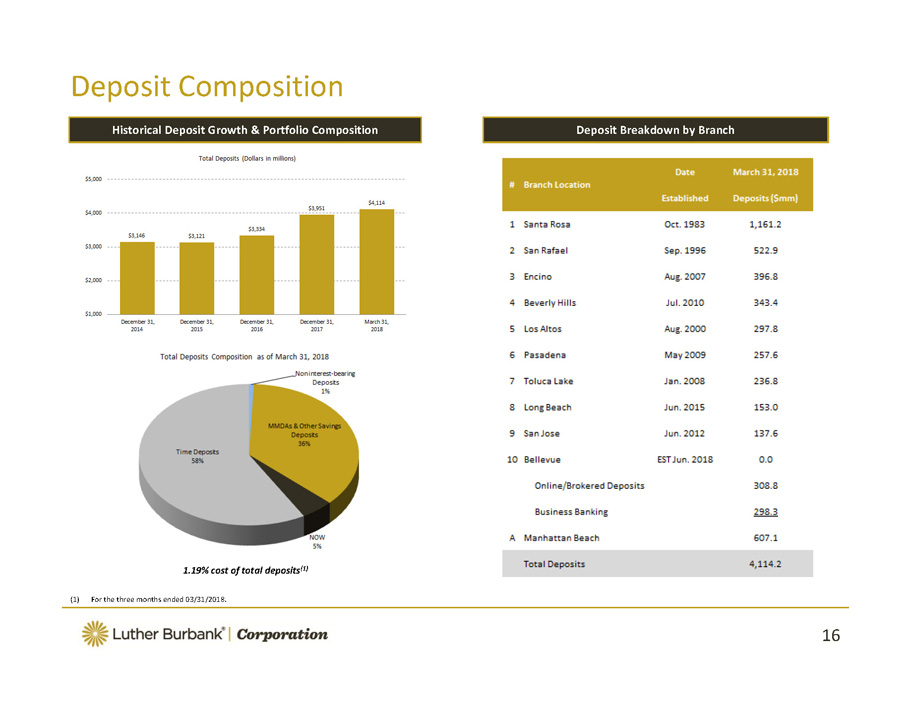
16 Deposit Composition (1) For the three months ended 03/31/2018. Historical Deposit Growth & Portfolio Composition 1.19% cost of total deposits (1) Deposit Breakdown by Branch

17 Deposit Growth (1) Business/online includes $25.6 million of brokered/ wholesale funds, sourced by the unit. (2) In the first quarter of 2018, we transferred $19 million of zero interest accounts from Consumer to Business /Online Banking for purposes of reporting and management. All prior periods above have incorporated the same product reclassification for comparative purposes. Quarterly Trend $60.5MM $182.2MM $87.8MM $162.8MM

18 Business / Online Composition (1) Represents brokered funds sourced by Business Banking. Total Bank brokered deposits at March 31, 2018 are $295.9 million or 7. 19% of total deposits. By Vertical 1.572% 1.572% 1.220% 1.082% 0.830% December 31, 2017 March 31, 2018 Total Business/Online Accounts at 12/31/17 are $256.3 million or 6.49% of total deposits. Total Business/Online Accounts at 3/31/18 are $355.6 million or 8.64% of total deposits.

19 Efficient Operations Result in Consistent Profitability (1) Net income adjusted for C - Corp status; prior to 2018 assumes 42% tax rate. See non - GAAP reconciliation in Appendix hereto. Return on Average Assets (1) Return on Average Equity (1) Net Interest Margin Efficiency Ratio

20 Interest Rate Risk Analysis On a quarterly basis, the Company measures and reports NII at Risk to isolate the change in income related solely to interest earning assets and interest - bearing liabilities. It models instantaneous parallel shifts in market interest rates, implied by the forward yield curve over the next one year period. NII Impact EVE Impact

21 Deposits - Cost of Funds Comparison

22 Liquidity Management Other Borrowings Securities Portfolio

23 Executive Management John G . Biggs . Mr . Biggs serves as our President and Chief Executive Officer . He leads the Executive Committee and is a member of the Bank’s board of directors . During his 30 - plus year tenure with the Bank, Mr . Biggs has held the positions of Chief Financial Officer and Chief Operating Officer, before assuming his current role in September 2007 . Since becoming President and Chief Executive Officer, Mr . Biggs has spearheaded the initiatives that have seen our total assets increase from $ 2 . 7 billion at December 31 , 2007 to $ 6 . 0 billion at March 31 , 2018 , equity increase from $ 182 . 4 million to $ 553 . 8 million over that period, expansion of the branch network in Northern and Southern California from three branches to nine, establishment and expansion of our headquarters infrastructure in Santa Rosa and Manhattan Beach, and our entry into the Seattle market, in which we have over $ 627 . 6 million in loans as of March 31 , 2018 . A Certified Public Accountant (inactive), Mr . Biggs previously served as Vice President of Finance and Controller for Columbus Marin Savings & Loan Association and as a public accountant specializing in auditing broker/dealers for the firms of Arthur Andersen, San Francisco, and KPMG LLP, Los Angeles . Mr . Biggs graduated summa cum laude in Accounting from Woodbury University . John A . Cardamone . Mr . Cardamone joined the Bank as Chief Credit Officer in 2014 . He oversees the Bank’s credit and special assets activities as well as loan operations ; he is also a member of the Bank’s Executive Committee . Prior to joining the Bank, Mr . Cardamone served as Senior Vice President & Divisional Credit Manager – Commercial Real Estate at Bank of the West from 2008 until joining the Bank, Chief Credit Officer at GreenPoint Mortgage, Senior Vice President – Global Risk Management at GE Capital’s Mortgage Insurance Unit and Managing Director and Chief Credit Officer at the Federal Home Loan Bank of San Francisco . Mr . Cardamone holds an M . B . A . in Finance from The Wharton School at the University of Pennsylvania, an M . B . A . in Management from St . Mary’s College and a B . B . A . in Business Statistics from Temple University . Tammy Mahoney . Ms . Mahoney joined the Bank as Chief Compliance Officer in early 2016 and was appointed Chief Risk Officer later that year . In her role, Ms . Mahoney oversees the Bank’s compliance, internal audit and risk management functions, including information security and project management ; she is also a member of its Executive Committee . Prior to joining the Bank, Ms . Mahoney served as Senior Vice President of Enterprise Risk and Compliance at Opus Bank from August 2011 to December 2015 ; as Director, Risk Advisory Services at KPMG from June 1995 to August 2004 ; and as Associate National Bank Examiner with the Office of the Comptroller of the Currency . A Certified Regulatory Compliance Manager and Certified Internal Auditor, Ms . Mahoney holds a B . S . in Business Administration - Finance from San Diego State University .

24 Executive Management Continued Liana Prieto . Ms . Prieto joined as General Counsel of the Company and Bank in 2014 . In this role she is responsible for leading a team of legal, human resources, Bank Secrecy Act, and third party risk management professionals ; she is also a member of the Bank’s Executive Committee . Prior to joining us, Ms . Prieto served as Associate and then Counsel at Buckley Sandler LLP from 2009 to 2014 , and as a trial attorney in the Enforcement & Compliance Division of the Office of the Comptroller of the Currency . In addition to her role at the Company and Bank, Ms . Prieto serves as Vice Chair of the Enforcement, Insider Liability and Troubled Banks Subcommittee of the American Bar Association’s Business Law Section . She also serves on the American Association of Bank Directors’ Board of Advisors and on their General Counsel and Corporate Secretary Committee . Ms . Prieto holds a J . D . from Fordham Law School and a B . A . from Georgetown University . Laura Tarantino . Ms . Tarantino currently serves as Executive Vice President and Chief Financial Officer of the Company and Bank, a position she has held since 2006 . In this role, she oversees all aspects of financial reporting including strategic planning, asset/liability management, taxation and regulatory filings ; she is also a member of the Bank’s Executive Committee . Ms . Tarantino has over 25 years of experience with the Company and Bank, having joined as Controller in 1992 . She previously served as Audit Manager for KPMG LLP, San Francisco specializing in the financial services industry . In addition to her role at the Company and Bank, Ms . Tarantino has served as an Audit Committee member for the Santa Rosa Council on Aging since 2012 . Ms . Tarantino is a California Chartered CPA (inactive) and earned a B . S . in Business Administration – Finance & Accounting with summa cum laude honors from San Francisco State University . Robert Armstrong, III . Mr . Armstrong currently serves as Senior Vice President and Director of Business and Online Banking, a position he has held since joining the Bank in January 2016 . Mr . Armstrong is responsible for expanding the Bank’s deposit offerings and creating greater access to its products and services, including deposit generation across commercial and consumer online banking platforms, as well as business banking activities . Prior to joining us, Mr . Armstrong served as Senior Vice President of Business Banking at BofI Federal Bank from October 2013 to December 2015 and a Senior Partner at Cappetta Capital from 2010 to 2013 . Mr . Armstrong’s background also includes positions as CEO/President of San Diego Private Bank, Market President at US Bank and Managing Director at Bank of America . Mr . Armstrong holds a B . S . in Economics from the University of California, Los Angeles .

25 Board of Directors John C . Erickson . Mr . Erickson has more than 30 years of financial services experience . Most recently, he served as President, Consumer Banking and President, California, for CIT Group, Inc . ( 2016 ) . Until 2014 , he served for over 30 years at Union Bank, N . A .. He held a number of senior roles across the firm, culminating in two vice chairman positions (Chief Risk Officer and Chief Corporate and Banking Officer) . As Chief Corporate Banking Officer, he oversaw commercial banking, real estate, global treasury management, wealth management and global capital markets . He was a director of Zions Bancorporation (NASDAQ : ZION) from 2014 to 2016 , and chair of that board’s risk committee, as well as a member of the audit committee . We believe Mr . Erickson’s extensive banking experience, leadership and board experience qualify him to serve on our board of directors . Jack Krouskup . Mr . Krouskup , a certified public accountant (inactive), has more than 35 years’ experience serving customers in a variety of industries . At Deloitte, LLP, or Deloitte, he served as partner - in - charge of the company’s Northern California financial services practice and also served on Deloitte’s financial services advisory committee . Mr . Krouskup has years of boardroom experience representing Deloitte with numerous global and highly complex organizations . Consequently, he has an extensive corporate governance background and deep familiarity with board and audit committee best practices . Mr . Krouskup retired from Deloitte in 2011 . He currently serves on the board of directors of Verity Health System and on the Board of Trustees of the University of California, Santa Barbara, Alumni Association board of directors . We believe Mr . Krouskup’s extensive experience as an auditor enhances the skill set of our board . Mr . Krouskup qualifies as an ‘‘audit committee financial expert’’ as defined in SEC rules, and the financial sophistication requirements of NASDAQ’s listing requirements . Anita Gentle Newcomb . Ms . Newcomb’s experience spans over three decades in the financial services industry as a commercial banker, investment banker, and strategic consultant . She has advised a range of banks and financial services companies on a wide range of corporate development initiatives from strategic planning, consumer and business banking strategy, and corporate governance best practices, to mutual conversions and valuing and structuring acquisitions . Ms . Newcomb is president of A . G . Newcomb & Co . , a financial services consultancy . She also served on the board of the Federal Reserve Bank of Richmond – Baltimore Branch from 2010 through 2015 . Ms . Newcomb is a member of the Advisory Board of the American Association of Bank Directors’ Institute for Bank Director Education . She is also a certified public accountant (inactive) . We believe Ms . Newcomb’s broad financial services consulting and strategic planning expertise bring a valuable perspective to our board and qualifies her to serve on our board of directors .
26 Board of Directors Continued Bradley M . Shuster . Mr . Shuster currently serves as Chairman of the board of directors and Chief Executive Officer of NMI Holdings, Inc . and its principal subsidiary, National Mortgage Insurance Corporation, positions he has held since 2012 . From 2008 to 2011 , Mr . Shuster has held various consulting positions assisting private investors with evaluating opportunities in the insurance industry . Mr . Shuster was an executive of The PMI Group, Inc . , or PMI, from 1995 to 2008 , where he served as president of International and Strategic Investments and chief executive officer of PMI Capital Corporation . Prior to that, he served as PMI’s executive vice president of Corporate Development and senior vice president, treasurer and chief investment officer . Before joining PMI in 1995 , Mr . Shuster was a partner at Deloitte, where he served as partner - in - charge of Deloitte’s Northern California Insurance Practice and Mortgage Banking Practice . He is a member of the board of directors of McGrath Rentcorp (NASDAQ : MRGC), and serves as a member of its audit and governance committees . We believe Mr . Shuster’s substantial experience in leadership and management of a public company in the mortgage sector qualifies him to serve on our board of directors . Victor S . Trione . Mr . Trione serves as Chairman of the board of directors Luther Burbank Savings, a position he has held since founding Luther Burbank Savings and Loan Association in 1983 and of the Company . In addition to serving as Chairman of the Company and Bank, Mr . Trione is President of Vimark , Inc . , a real estate development and vineyard management company, and co - proprietor of Trione Winery . Mr . Trione serves as Director and Chairman of the Executive Committee – Empire College ; sits on the Advisory Board – Stanford Institute for Economic Policy Research ; Board of Overseers – Stanford University’s Hoover Institution ; serves as Trustee – Angela Merici and John Newman Foundation, Inc .; Trustee – U . S . Navy Memorial Foundation, Washington, D . C .; Director – Navy Supply Corps Foundation . As one of our founders, Mr . Trione brings continuity and deep historic knowledge of the Company to the board . Thomas C . Wajnert . Mr . Wajnert launched his career in 1968 with US Leasing, a NYSE - listed company . For over 40 years, Mr . Wajnert has navigated the changing currents of the equipment leasing industry and built an impressive list of accomplishments, including serving as CEO and Chairman of AT&T Capital Corporation, an international, full - service equipment leasing and commercial finance company, from 1984 to 1996 . Mr . Wajnert also has extensive public company board experience at Reynolds American as Chairman and Solera, UDR, Inc . , NYFIX, JLG Industries as a director . Mr . Wajnert also serves on the board of International Finance Group, one of the largest privately owned P&C insurance company in the U . S . For many years he served as a Trustee of Wharton’s Center for Financial Institutions . We believe Mr . Wajnert’s substantial experience in leadership of public companies, both as an executive and as a director, qualifies him to serve on our board of directors .

Appendix

28 Balance Sheet ($ in 000’s) (1) Unaudited
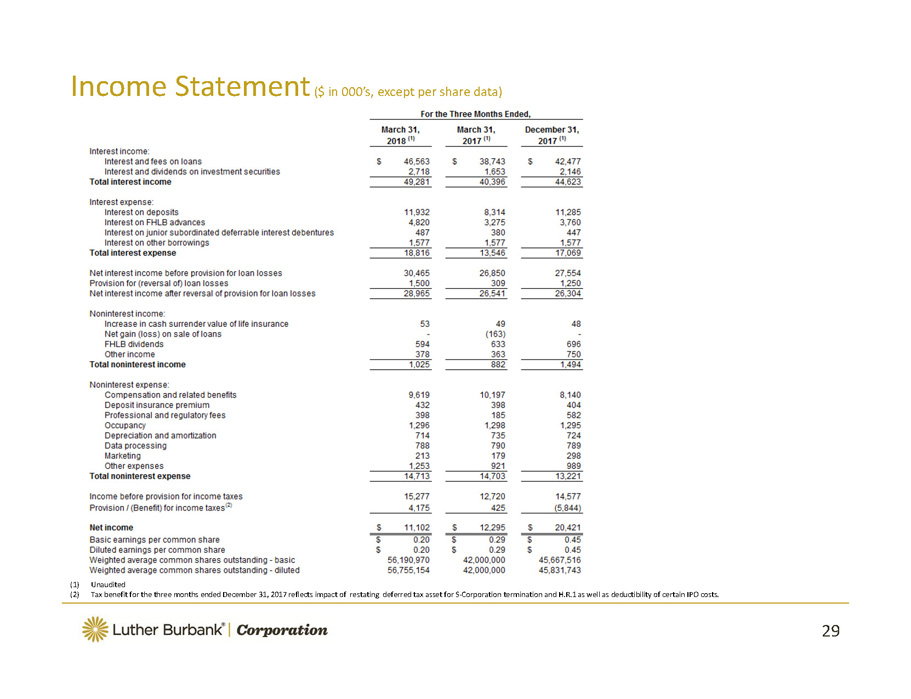
29 Income Statement ($ in 000’s, except per share data) (1) Unaudited (2) Tax benefit for the three months ended December 31, 2017 reflects impact of restating deferred tax asset for S - Corporation ter mination and H.R.1 as well as deductibility of certain IPO costs.
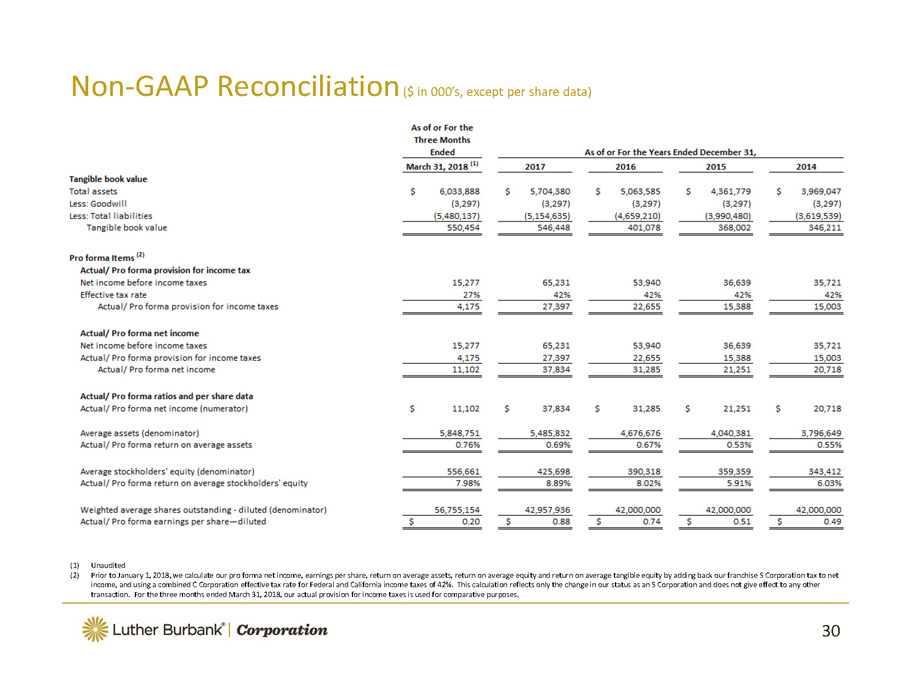
30 Non - GAAP Reconciliation ($ in 000’s, except per share data) (1) Unaudited (2) Prior to January 1, 2018, we calculate our pro forma net income, earnings per share, return on average assets, return on aver age equity and return on average tangible equity by adding back our franchise S Corporation tax to net income, and using a combined C Corporation effective tax rate for Federal and California income taxes of 42%. This calculati on reflects only the change in our status as an S Corporation and does not give effect to any other transaction. For the three months ended March 31, 2018, our actual provision for income taxes is used for comparative purpos es.

31 Non - GAAP Reconciliation ($ in 000’s) (1) Unaudited