Attached files
| file | filename |
|---|---|
| 8-K - FORM 8-K - US ECOLOGY, INC. | usecology_8k.htm |
Exhibit 99.1
1 April 2018 Investor Presentation
2 Safe Harbor During the course of this presentation the Company will be making forward - looking statements (as such term is defined in the Private Securities Litigation Reform Act of 1995 ) that are based on our current expectations, beliefs and assumptions about the industry and markets in which US Ecology, Inc . and its subsidiaries operate . Such statements may include, but are not limited to, statements regarding our financial and operating results, strategic objectives and means to achieve those objectives, the amount and timing of capital expenditures, repurchases of its stock under approved stock repurchase plans, the amount and timing of interest expense, the likelihood of our success in expanding our business, financing plans, budgets, working capital needs and sources of liquidity . Such statements involve known and unknown risks, uncertainties and other factors that could cause the actual results of the Company to differ materially from the results expressed or implied by such statements, including general economic and business conditions, conditions affecting the industries served by US Ecology, EQ and their respective subsidiaries, conditions affecting our customers and suppliers, competitor responses to our products and services, the overall market acceptance of such products and services, the integration and performance of acquisitions (including the acquisition of EQ) and other factors disclosed in the Company's periodic reports filed with the Securities and Exchange Commission . For information on other factors that could cause actual results to differ materially from expectations, please refer to US Ecology, Inc . 's December 31 , 2017 Annual Report on Form 10 - K and other reports filed with the Securities and Exchange Commission . Many of the factors that will determine the Company's future results are beyond the ability of management to control or predict . Readers should not place undue reliance on forward - looking statements, which reflect management's views only as of the date such statements are made . The Company undertakes no obligation to revise or update any forward - looking statements, or to make any other forward - looking statements, whether as a result of new information, future events or otherwise . Important assumptions and other important factors that could cause actual results to differ materially from those set forth in the forward - looking information include the replacement of non - recurring event clean - up projects, a loss of a major customer, our ability to permit and contract for timely construction of new or expanded disposal cells, our ability to renew our operating permits or lease agreements with regulatory bodies, loss of key personnel, compliance with and changes to applicable laws, rules, or regulations, failure to realize anticipated benefits and operational performance from acquired operations, access to insurance, surety bonds and other financial assurances, a deterioration in our labor relations or labor disputes, our ability to perform under required contracts, adverse economic or market conditions, government funding or competitive pressures, incidents or adverse weather conditions that could limit or suspend specific operations, access to cost effective transportation services, fluctuations in foreign currency markets, lawsuits, our willingness or ability to repurchase shares or pay dividends, implementation of new technologies, limitations on our available cash flow as a result of our indebtedness and our ability to effectively execute our acquisition strategy and integrate future acquisitions .
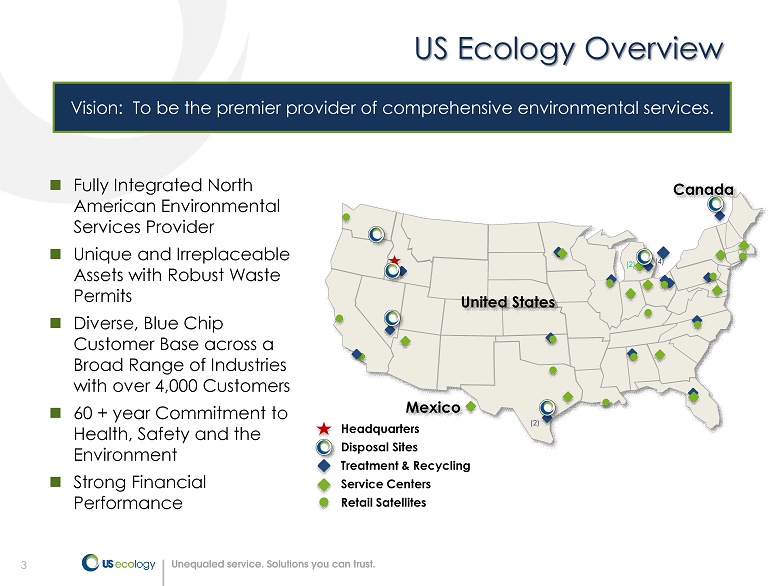
3 US Ecology Overview Vision : To be the premier provider of comprehensive environmental services. Fully Integrated North American Environmental Services Provider Unique and Irreplaceable Assets with Robust Waste Permits Diverse, Blue Chip Customer Base across a Broad Range of Industries with over 4,000 Customers 60 + year Commitment to Health, Safety and the Environment Strong Financial Performance (4) Mexico Canada (2) (2) United States Treatment & Recycling Disposal Sites Service Centers Headquarters Retail Satellites
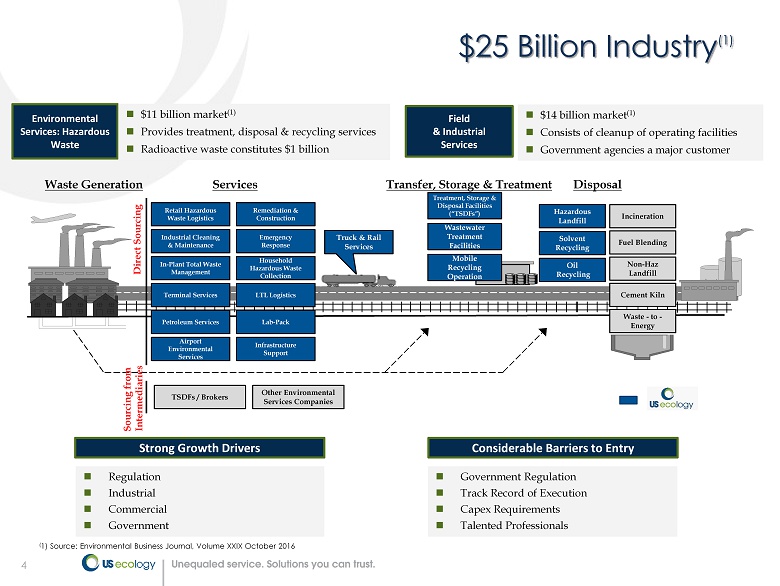
4 $25 Billion Industry (1) Strong Growth Drivers Considerable Barriers to Entry Government Regulation Track Record of Execution Capex Requirements Talented Professionals Regulation Industrial Commercial Government Environmental Services: Hazardous Waste Field & Industrial Services $11 billion market (1) Provides treatment, disposal & recycling services Radioactive waste constitutes $1 billion $14 billion market (1) Consists of cleanup of operating facilities Government agencies a major customer Retail Hazardous Waste Logistics Industrial Cleaning & Maintenance In - Plant Total Waste Management Terminal Services Petroleum Services Airport Environmental Services Remediation & Construction Emergency Response Household Hazardous Waste Collection Lab - Pack TSDFs / Brokers Other Environmental Services Companies Truck & Rail Services Treatment, Storage & Disposal Facilities (“TSDFs”) Wastewater Treatment Facilities Mobile Recycling Operation Hazardous Landfill Solvent Recycling Oil Recycling Incineration Fuel Blending Non - Haz Landfill Cement Kiln Waste - to - Energy Sourcing from Intermediaries Direct Sourcing Waste Generation Services Transfer, Storage & Treatment Disposal Infrastructure Support LTL Logistics ( 1) Source: Environmental Business Journal, Volume XXIX October 2016
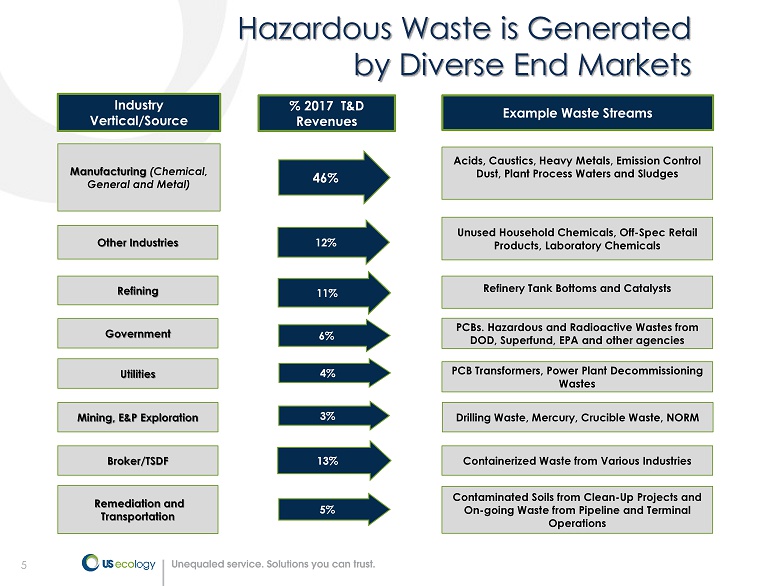
5 Hazardous Waste is Generated by Diverse End Markets Acids, Caustics, Heavy Metals, Emission Control Dust, Plant Process Waters and Sludges Industry Vertical/Source Example Waste Streams Drilling Waste, Mercury, Crucible Waste, NORM Refinery Tank Bottoms and Catalysts Unused Household Chemicals, Off - Spec Retail Products, Laboratory Chemicals PCB Transformers, Power Plant Decommissioning Wastes PCBs. Hazardous and Radioactive Wastes from DOD, Superfund, EPA and other agencies Manufacturing (Chemical, General and Metal) % 2017 T&D Revenues 46% 6% 4% 11% Other Industries 12% 3% Containerized Waste from Various Industries 13% Contaminated Soils from Clean - Up Projects and On - going Waste from Pipeline and Terminal Operations Remediation and Transportation 5% Refining Government Utilities Mining, E&P Exploration Broker/TSDF
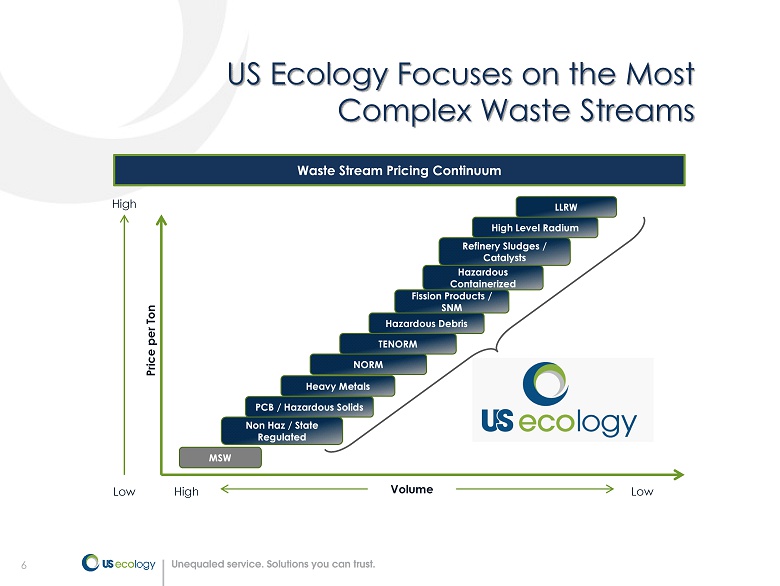
6 US Ecology Focuses on the Most Complex Waste Streams Waste Stream Pricing Continuum Price per Ton MSW LLRW Refinery Sludges / Catalysts Hazardous Containerized Fission Products / SNM Hazardous Debris NORM PCB / Hazardous Solids High Low Volume Low High Non Haz / State Regulated TENORM Heavy Metals High Level Radium 6
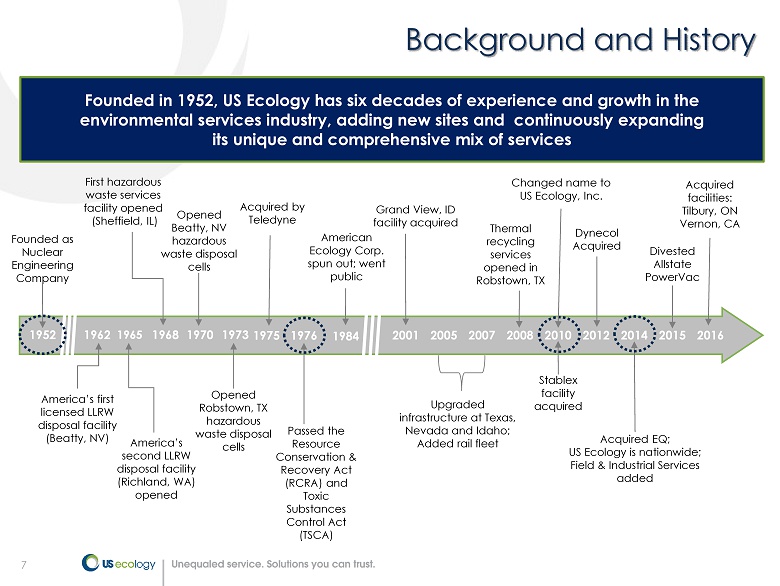
7 Stablex facility acquired Grand View, ID facility acquired 2001 2008 Thermal recycling services opened in Robstown, TX 1984 1952 1965 Founded as Nuclear Engineering Company America’s second LLRW disposal facility ( Richland, WA) opened 1968 First hazardous waste services facility opened (Sheffield, IL) 1962 America’s first licensed LLRW disposal facility (Beatty, NV) 1973 Opened Robstown, TX hazardous waste disposal cells 2007 2005 Changed name to US Ecology, Inc. 2010 American Ecology Corp. spun out; went public 1970 Opened Beatty, NV hazardous waste disposal cells 1975 1976 Acquired by Teledyne Passed the Resource Conservation & Recovery Act (RCRA) and Toxic Substances Control Act (TSCA) Upgraded infrastructure at Texas, Nevada and Idaho; Added rail fleet 2012 Dynecol Acquired Founded in 1952, US Ecology has six decades of experience and growth in the environmental services industry, adding new sites and continuously expanding its unique and comprehensive mix of services 2014 Acquired EQ; US Ecology is nationwide; Field & Industrial Services added 7 2016 Acquired facilities: Tilbury, ON Vernon, CA Divested Allstate PowerVac 2015 Background and History
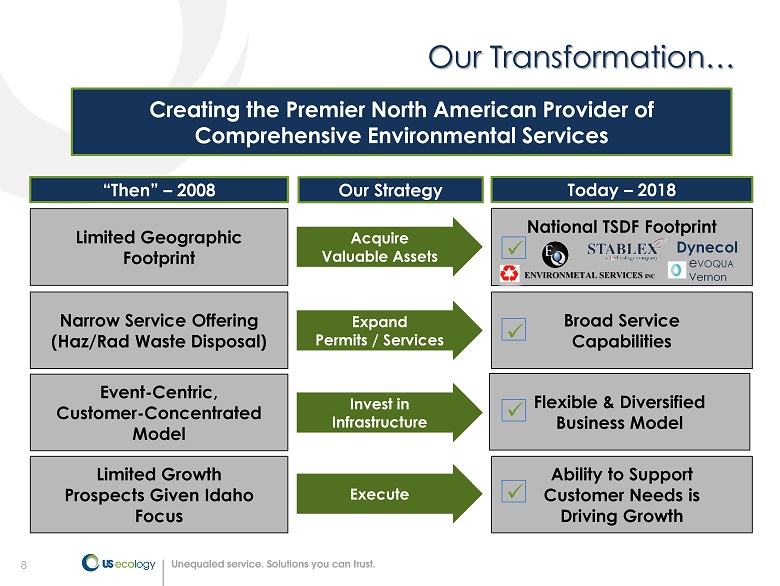
8 Our Transformation… Limited Geographic Footprint Acquire Valuable Assets Narrow Service Offering (Haz/Rad Waste Disposal) Event - Centric, Customer - Concentrated Model Limited Growth Prospects Given Idaho Focus National TSDF Footprint Broad Service Capabilities Flexible & Diversified Business Model Ability to Support Customer Needs is Driving Growth Expand Permits / Services Invest in Infrastructure Execute x x x x Dynecol Creating the Premier North American Provider of Comprehensive Environmental Services Our Strategy “Then” – 2008 Today – 2018 ENVIRONMETAL SERVICES INC e VOQUA Vernon
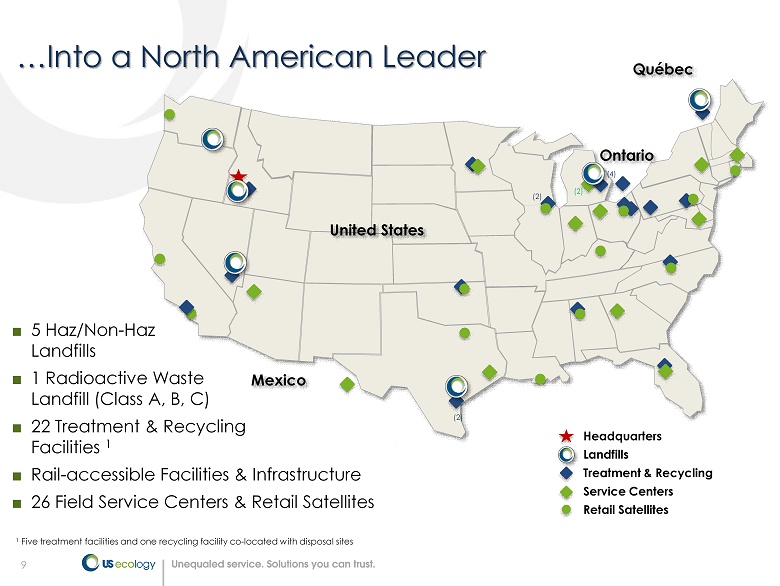
9 …Into a North American Leader ■ 5 Haz/Non - Haz Landfills ■ 1 Radioactive Waste Landfill (Class A, B, C) ■ 22 Treatment & Recycling Facilities 1 ■ Rail - accessible Facilities & Infrastructure ■ 26 Field Service Centers & Retail Satellites 1 Five treatment facilities and one recycling facility co - located with disposal sites Landfills Treatment & Recycling Service Centers Headquarters Retail Satellites (4) Mexico Québec (2) (2) United States (2) Ontario
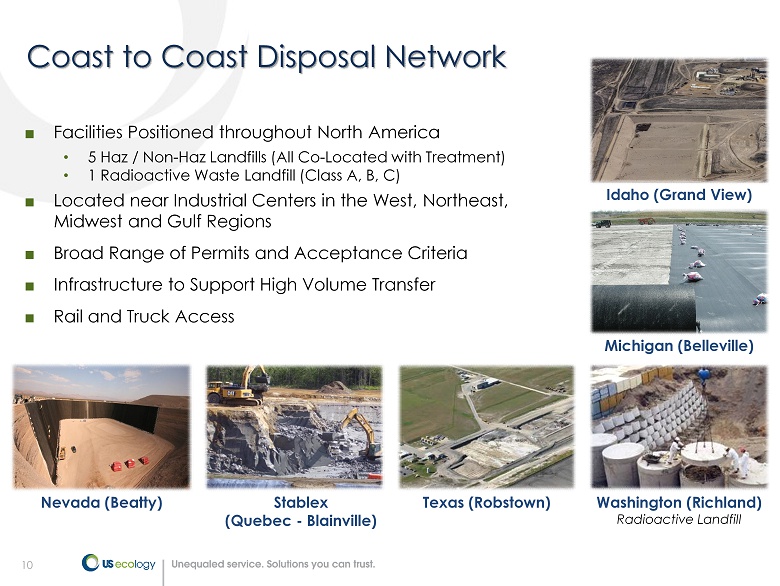
10 Coast to Coast Disposal Network ■ Facilities Positioned throughout North America • 5 Haz / Non - Haz Landfills (All Co - Located with Treatment) • 1 Radioactive Waste Landfill (Class A, B, C) ■ Located near Industrial Centers in the West, Northeast, Midwest and Gulf Regions ■ Broad Range of Permits and Acceptance Criteria ■ Infrastructure to Support High Volume Transfer ■ Rail and Truck Access Idaho (Grand View) Washington (Richland) Radioactive Landfill Michigan (Belleville) Nevada (Beatty) Texas (Robstown) Stablex (Quebec - Blainville)
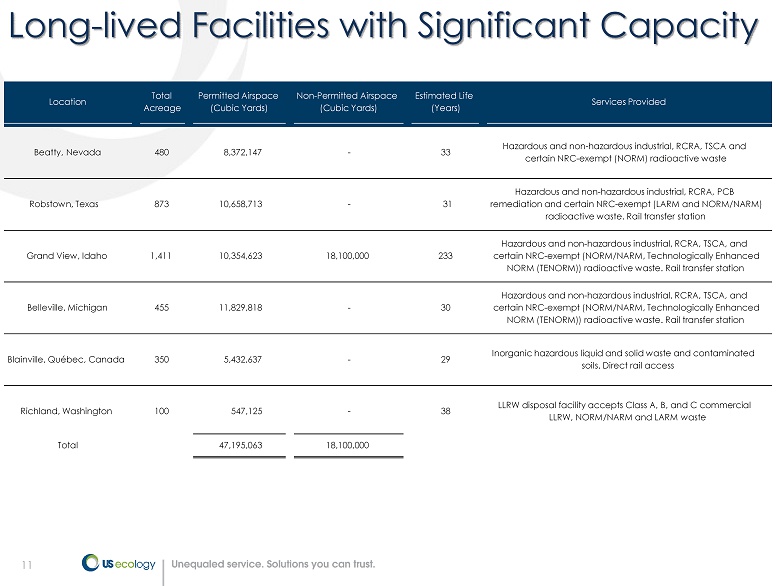
11 Long - lived Facilities with Significant Capacity Location Total Acreage Permitted Airspace (Cubic Yards) Non - Permitted Airspace (Cubic Yards) Estimated Life (Years) Services Provided Beatty, Nevada 480 8,372,147 - 33 Hazardous and non - hazardous industrial, RCRA, TSCA and certain NRC - exempt (NORM) radioactive waste Robstown, Texas 873 10,658,713 - 31 Hazardous and non - hazardous industrial, RCRA, PCB remediation and certain NRC - exempt (LARM and NORM/NARM) radioactive waste. Rail transfer station Grand View, Idaho 1,411 10,354,623 18,100,000 233 Hazardous and non - hazardous industrial, RCRA, TSCA, and certain NRC - exempt (NORM/NARM, Technologically Enhanced NORM (TENORM)) radioactive waste. Rail transfer station Belleville, Michigan 455 11,829,818 - 30 Hazardous and non - hazardous industrial, RCRA, TSCA, and certain NRC - exempt (NORM/NARM, Technologically Enhanced NORM (TENORM)) radioactive waste. Rail transfer station Blainville, Québec, Canada 350 5 ,432,637 - 29 Inorganic hazardous liquid and solid waste and contaminated soils. Direct rail access Richland, Washington 100 547,125 - 38 LLRW disposal facility accepts Class A, B, and C commercial LLRW, NORM/NARM and LARM waste Total 4 7,195,063 18,100,000
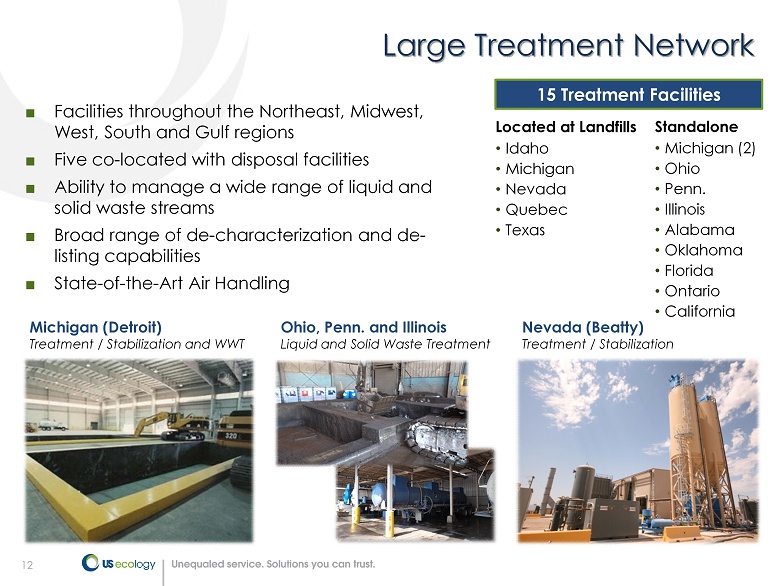
12 Large Treatment Network ■ Facilities throughout the Northeast, Midwest, West, South and Gulf regions ■ Five co - located with disposal facilities ■ Ability to manage a wide range of liquid and solid waste streams ■ Broad range of de - characterization and de - listing capabilities ■ State - of - the - Art Air Handling 15 Treatment Facilities Located at Landfills • Idaho • Michigan • Nevada • Quebec • Texas Standalone • Michigan (2) • Ohio • Penn. • Illinois • Alabama • Oklahoma • Florida • Ontario • California Michigan (Detroit) Treatment / Stabilization and WWT Ohio, Penn. and Illinois Liquid and Solid Waste Treatment Nevada (Beatty) Treatment / Stabilization
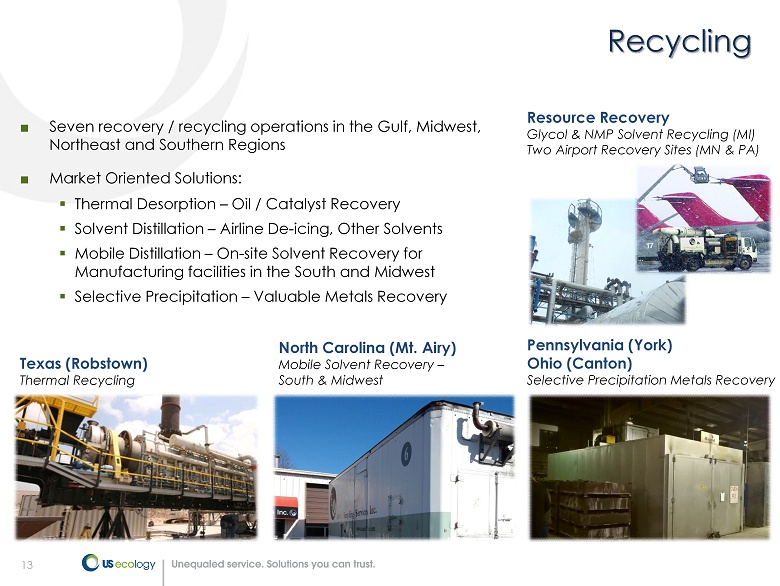
13 Recycling ■ Seven recovery / recycling operations in the Gulf, Midwest, Northeast and Southern Regions ■ Market Oriented Solutions: ▪ Thermal Desorption – Oil / Catalyst Recovery ▪ Solvent Distillation – Airline De - icing, Other Solvents ▪ Mobile Distillation – On - site Solvent Recovery for Manufacturing facilities in the South and Midwest ▪ Selective Precipitation – Valuable Metals Recovery Resource Recovery Glycol & NMP Solvent Recycling (MI) Two Airport Recovery Sites (MN & PA) Texas (Robstown) Thermal Recycling North Carolina (Mt. Airy) Mobile Solvent Recovery – South & Midwest Pennsylvania (York) Ohio (Canton) Selective Precipitation Metals Recovery
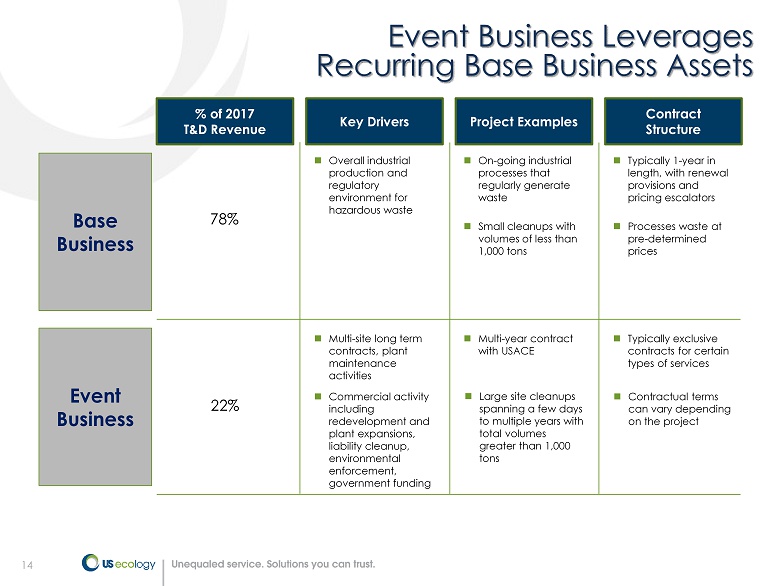
14 Event Business Leverages Recurring Base Business Assets Base Business % of 2017 T&D Revenue Key Drivers Project Examples Overall industrial production and regulatory environment for hazardous waste Multi - site long term contracts, plant maintenance activities Commercial activity including redevelopment and plant expansions, liability cleanup, environmental enforcement, government funding On - going industrial processes that regularly generate waste Multi - year contract with USACE Large site cleanups spanning a few days to multiple years with total volumes greater than 1,000 tons 78% 22% Contract Structure Typically 1 - year in length, with renewal provisions and pricing escalators Typically exclusive contracts for certain types of services Contractual terms can vary depending on the project Event Business Processes waste at pre - determined prices Small cleanups with volumes of less than 1,000 tons
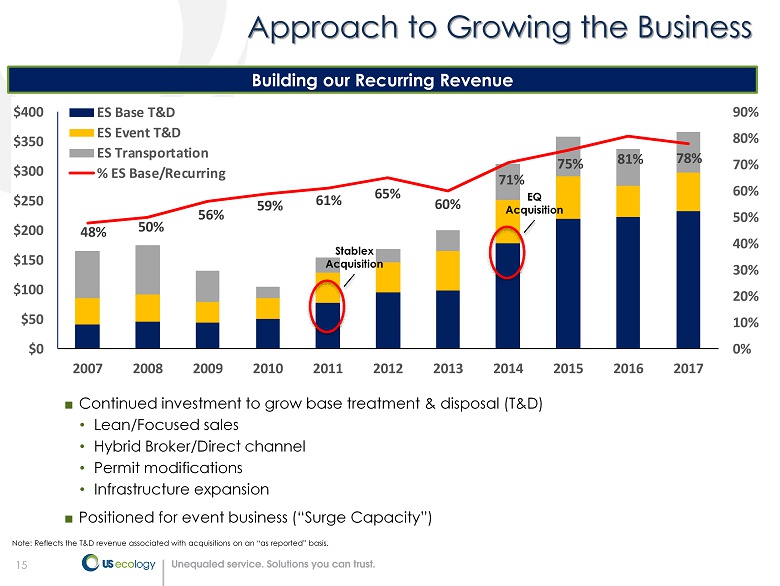
15 48% 50% 56% 59% 61% 65% 60% 71% 75% 81% 78% 0% 10% 20% 30% 40% 50% 60% 70% 80% 90% $0 $50 $100 $150 $200 $250 $300 $350 $400 2007 2008 2009 2010 2011 2012 2013 2014 2015 2016 2017 ES Base T&D ES Event T&D ES Transportation % ES Base/Recurring Approach to Growing the Business Building our Recurring Revenue ■ Continued investment to grow base treatment & disposal (T&D) • Lean/Focused sales • Hybrid Broker/Direct channel • Permit modifications • Infrastructure expansion ■ Positioned for event business (“Surge Capacity”) Note: Reflects the T&D revenue associated with acquisitions on an “as reported” basis. EQ Acquisition Stablex Acquisition
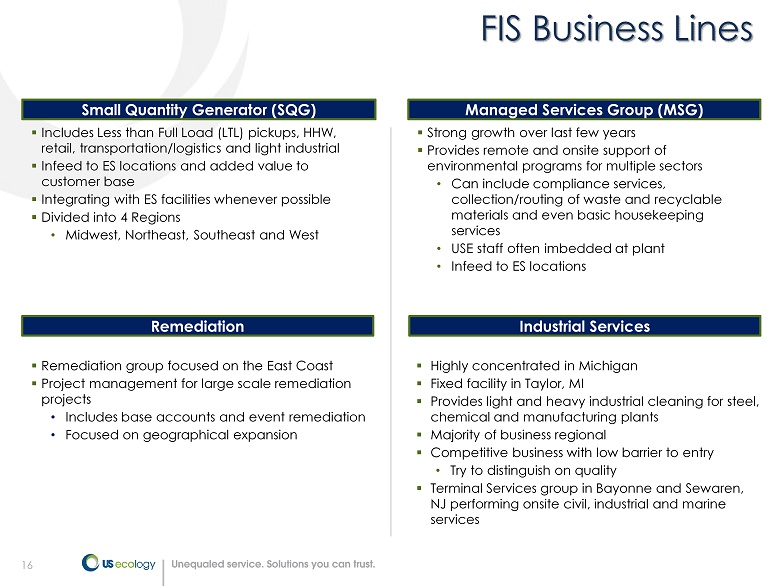
16 ▪ Includes Less than Full Load (LTL) pickups, HHW, retail, transportation/logistics and light industrial ▪ Infeed to ES locations and added value to customer base ▪ Integrating with ES facilities whenever possible ▪ Divided into 4 Regions • Midwest, Northeast, Southeast and West Small Quantity Generator (SQG) Managed Services Group (MSG) Remediation ▪ Strong growth over last few years ▪ Provides remote and onsite support of environmental programs for multiple sectors • Can include compliance services, collection/routing of waste and recyclable materials and even basic housekeeping services • USE staff often imbedded at plant • Infeed to ES locations Industrial Services 16 FIS Business Lines ▪ Remediation group focused on the East Coast ▪ Project management for large scale remediation projects • Includes base accounts and event remediation • Focused on geographical expansion ▪ Highly concentrated in Michigan ▪ Fixed facility in Taylor, MI ▪ Provides light and heavy industrial cleaning for steel, chemical and manufacturing plants ▪ Majority of business regional ▪ Competitive business with low barrier to entry • Try to distinguish on quality ▪ Terminal Services group in Bayonne and Sewaren, NJ performing onsite civil, industrial and marine services
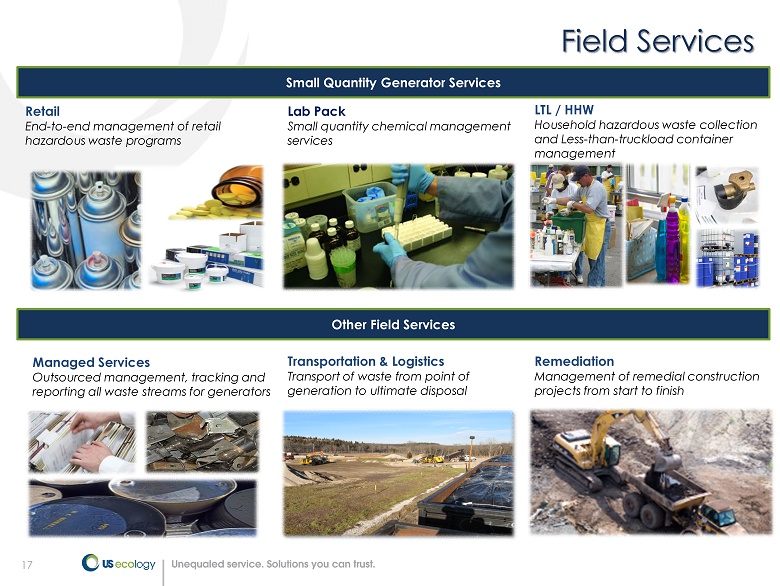
17 Field Services Remediation Management of remedial construction projects from start to finish Retail End - to - end management of retail hazardous waste programs Transportation & Logistics Transport of waste from point of generation to ultimate disposal Lab Pack Small quantity chemical management services LTL / HHW Household hazardous waste collection and Less - than - truckload container management Managed Services Outsourced management, tracking and reporting all waste streams for generators Small Quantity Generator Services Other Field Services
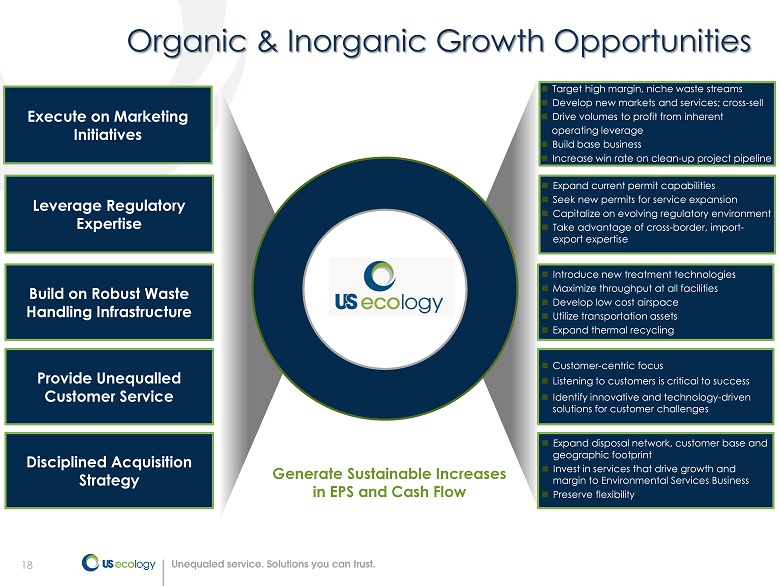
18 Organic & Inorganic Growth Opportunities Build on Robust Waste Handling Infrastructure Leverage Regulatory Expertise Provide Unequalled Customer Service Generate Sustainable Increases in EPS and Cash Flow Focus on High Value Waste Streams Target high margin, niche waste streams Develop new markets and services; cross - sell Drive volumes to profit from inherent operating leverage Build base business Increase win rate on clean - up project pipeline Expand current permit capabilities Seek new permits for service expansion Capitalize on evolving regulatory environment Take advantage of cross - border, import - export expertise Introduce new treatment technologies Maximize throughput at all facilities Develop low cost airspace Utilize transportation assets Expand thermal recycling Customer - centric focus Listening to customers is critical to success Identify innovative and technology - driven solutions for customer challenges Disciplined Acquisition Strategy Expand disposal network, customer base and geographic footprint Invest in services that drive growth and margin to Environmental Services Business Preserve flexibility Execute on Marketing Initiatives
19 Financial Overview
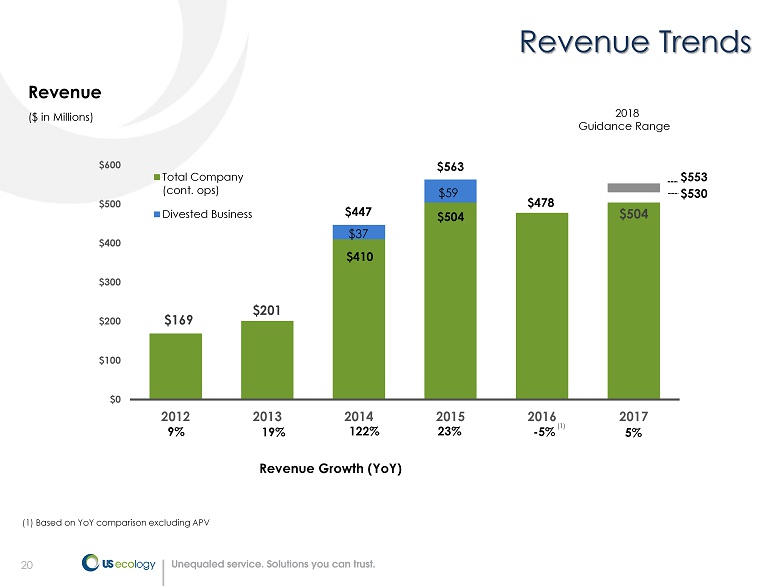
20 ($ in Millions) Revenue Growth (YoY) $169 $201 $504 $0 $100 $200 $300 $400 $500 $600 2012 2013 2014 2015 2016 2017 Total Company (cont. ops) Divested Business Revenue 9% 19% 122% 23% - 5% (1) Based on YoY comparison excluding APV Revenue Trends $410 $37 $504 $59 $478 $447 $563 2018 Guidance Range $530 $553 5 % (1)
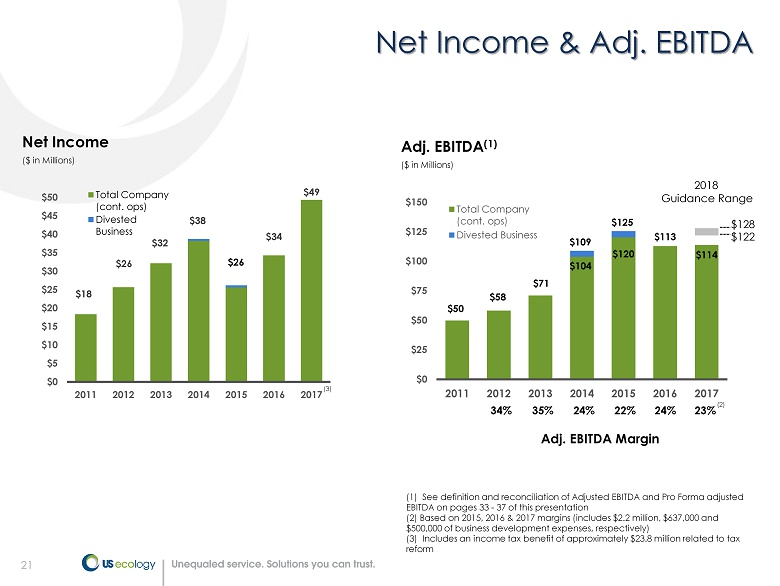
21 ($ in Millions) $18 $26 $32 $38 $34 $49 $0 $5 $10 $15 $20 $25 $30 $35 $40 $45 $50 2011 2012 2013 2014 2015 2016 2017 Total Company (cont. ops) Divested Business Net Income Net Income & Adj. EBITDA (1) See definition and reconciliation of Adjusted EBITDA and Pro Forma adjusted EBITDA on pages 33 - 37 of this presentation (2) Based on 2015, 2016 & 2017 margins (includes $2.2 million, $637,000 and $500,000 of business development expenses, respectively ) (3) Includes an income tax benefit of approximately $23.8 million related to tax reform $50 $58 $113 $114 $0 $25 $50 $75 $100 $125 $150 2011 2012 2013 2014 2015 2016 2017 Total Company (cont. ops) Divested Business $104 $120 ($ in Millions) Adj. EBITDA (1) 34% 24% 22% 24% Adj. EBITDA Margin (2) 35% 2018 Guidance Range $ 122 $ 128 $26 $109 $125 $71 (3) 23%
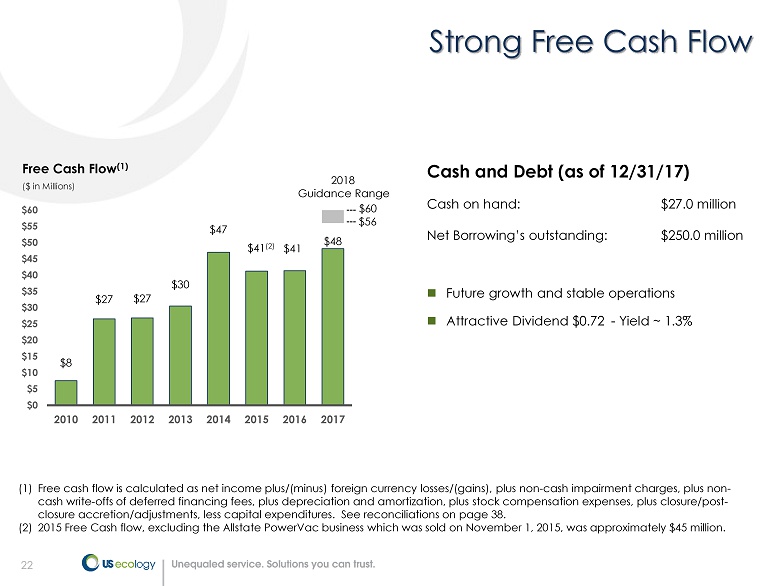
22 Strong Free Cash Flow Cash on hand: $27.0 million Net Borrowing’s outstanding: $250.0 million Free Cash Flow (1) ($ in Millions) $8 $27 $27 $30 $47 $41 (2) $41 $48 $0 $5 $10 $15 $20 $25 $30 $35 $40 $45 $50 $55 $60 2010 2011 2012 2013 2014 2015 2016 2017 $56 $60 2018 Guidance Range Future growth and stable operations Attractive Dividend $0.72 - Yield ~ 1.3% Cash and Debt (as of 12/31/17) (1) Free cash flow is calculated as net income plus/(minus) foreign currency losses/(gains), plus non - cash impairment charges, plus non - cash write - offs of deferred financing fees, plus depreciation and amortization, plus stock compensation expenses, plus closure/p ost - closure accretion/adjustments, less capital expenditures. See reconciliations on page 38. (2) 2015 Free Cash flow, excluding the Allstate PowerVac business which was sold on November 1, 2015, was approximately $45 milli on.
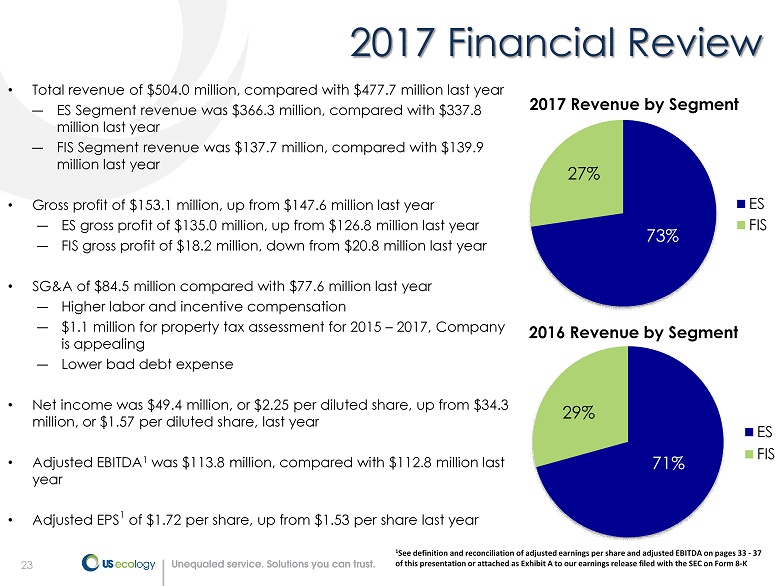
23 • Total revenue of $504.0 million, compared with $477.7 million last year ― ES Segment revenue was $366.3 million , compared with $337.8 million last year ― FIS Segment revenue was $137.7 million , compared with $139.9 million last year • Gross profit of $153.1 million , up from $147.6 million last year ― ES gross profit of $135.0 million , up from $126.8 million last year ― FIS gross profit of $18.2 million , down from $20.8 million last year • SG&A of $84.5 million compared with $77.6 million last year ― Higher labor and incentive compensation ― $1.1 million for property tax assessment for 2015 – 2017, Company is appealing ― Lower bad debt expense • Net income was $49.4 million , or $2.25 per diluted share, up from $34.3 million , or $1.57 per diluted share, last year • Adjusted EBITDA 1 was $113.8 million, compared with $112.8 million last year • Adjusted EPS 1 of $1.72 per share, up from $1.53 per share last year 23 2017 Financial Review 1 See definition and reconciliation of adjusted earnings per share and adjusted EBITDA on pages 33 - 37 of this presentation or attached as Exhibit A to our earnings release filed with the SEC on Form 8 - K 73% 27% 2017 Revenue by Segment ES FIS 71% 29% 2016 Revenue by Segment ES FIS
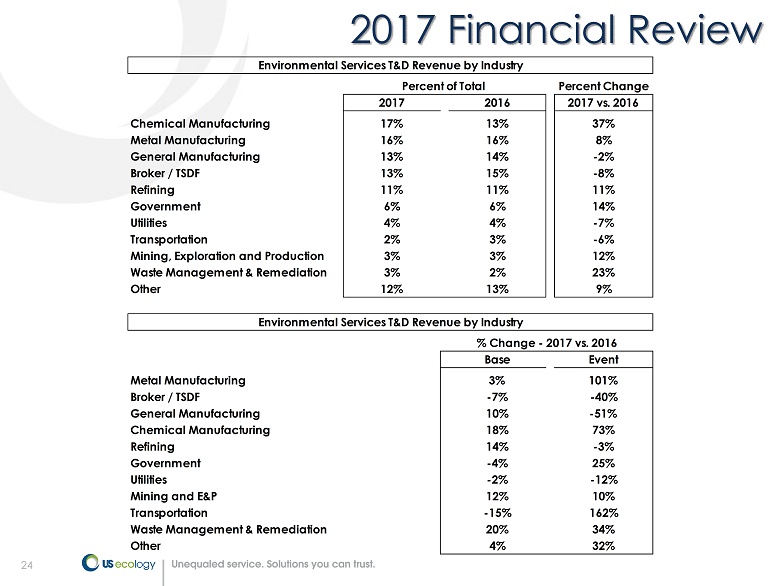
24 2017 Financial Review Percent Change 2017 2016 2017 vs. 2016 Chemical Manufacturing 17% 13% 37% Metal Manufacturing 16% 16% 8% General Manufacturing 13% 14% -2% Broker / TSDF 13% 15% -8% Refining 11% 11% 11% Government 6% 6% 14% Utilities 4% 4% -7% Transportation 2% 3% -6% Mining, Exploration and Production 3% 3% 12% Waste Management & Remediation 3% 2% 23% Other 12% 13% 9% Base Event Metal Manufacturing 3% 101% Broker / TSDF -7% -40% General Manufacturing 10% -51% Chemical Manufacturing 18% 73% Refining 14% -3% Government -4% 25% Utilities -2% -12% Mining and E&P 12% 10% Transportation -15% 162% Waste Management & Remediation 20% 34% Other 4% 32% Environmental Services T&D Revenue by Industry Percent of Total Environmental Services T&D Revenue by Industry % Change - 2017 vs. 2016
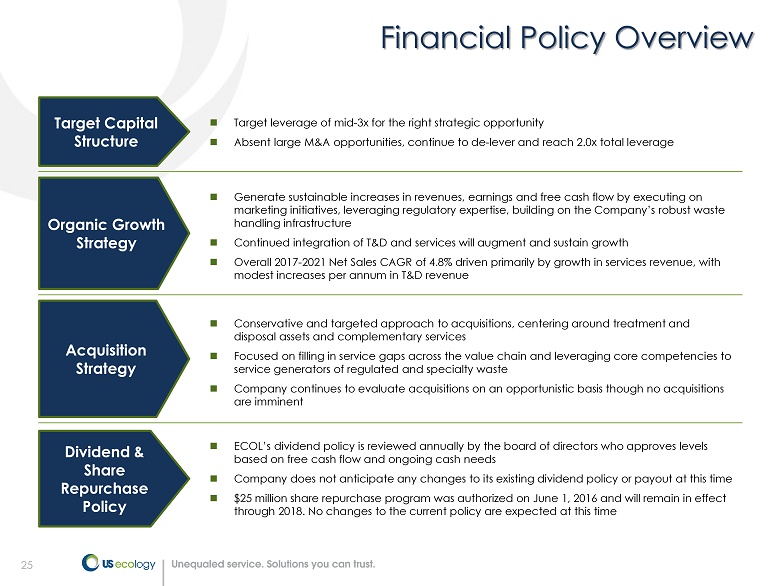
25 Financial Policy Overview 25 Acquisition Strategy Conservative and targeted approach to acquisitions, centering around treatment and disposal assets and complementary services Focused on filling in service gaps across the value chain and leveraging core competencies to service generators of regulated and specialty waste Company continues to evaluate acquisitions on an opportunistic basis though no acquisitions are imminent Organic Growth Strategy Generate sustainable increases in revenues, earnings and free cash flow by executing on marketing initiatives, leveraging regulatory expertise, building on the Company’s robust waste handling infrastructure Continued integration of T&D and services will augment and sustain growth Overall 2017 - 2021 Net Sales CAGR of 4.8% driven primarily by growth in services revenue, with modest increases per annum in T&D revenue Target Capital Structure Target leverage of mid - 3x for the right strategic opportunity Absent large M&A opportunities, continue to de - lever and reach 2.0x total leverage Dividend & Share Repurchase Policy ECOL’s dividend policy is reviewed annually by the board of directors who approves levels based on free cash flow and ongoing cash needs Company does not anticipate any changes to its existing dividend policy or payout at this time $25 million share repurchase program was authorized on June 1, 2016 and will remain in effect through 2018. No changes to the current policy are expected at this time
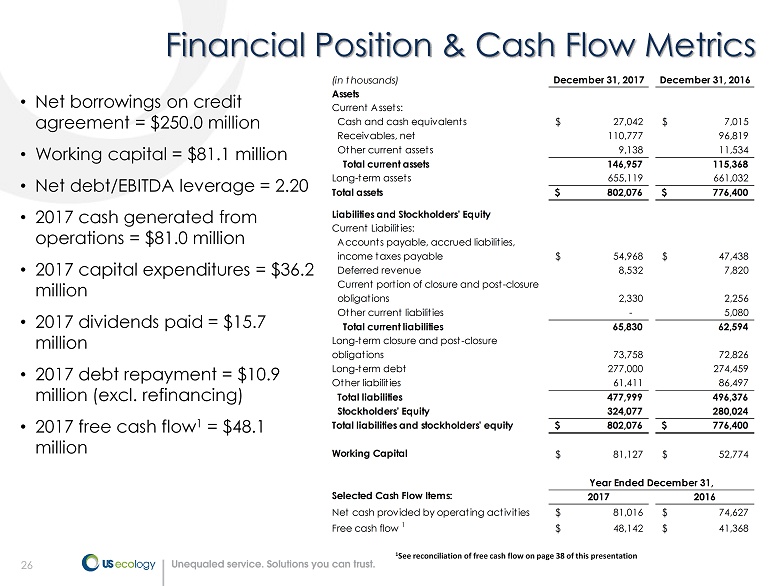
26 26 Financial Position & Cash Flow Metrics • Net borrowings on credit agreement = $250.0 million • Working c apital = $81.1 million • Net debt/EBITDA l everage = 2.20 • 2017 cash generated from operations = $81.0 million • 2017 capital expenditures = $36.2 million • 2017 dividends paid = $15.7 million • 2017 debt repayment = $10.9 million (excl. refinancing) • 2017 free c ash flow 1 = $48.1 million 1 See reconciliation of free cash flow on page 38 of this presentation (in thousands) December 31, 2017 December 31, 2016 Assets Current Assets: Cash and cash equivalents 27,042$ 7,015$ Receivables, net 110,777 96,819 Other current assets 9,138 11,534 Total current assets 146,957 115,368 Long-term assets 655,119 661,032 Total assets 802,076$ 776,400$ Liabilities and Stockholders’ Equity Current Liabilities: Accounts payable, accrued liabilities, income taxes payable 54,968$ 47,438$ Deferred revenue 8,532 7,820 Current portion of closure and post-closure obligations 2,330 2,256 Other current liabilities - 5,080 Total current liabilities 65,830 62,594 Long-term closure and post-closure obligations 73,758 72,826 Long-term debt 277,000 274,459 Other liabilities 61,411 86,497 Total liabilities 477,999 496,376 Stockholders’ Equity 324,077 280,024 Total liabilities and stockholders' equity 802,076$ 776,400$ Working Capital 81,127$ 52,774$ Selected Cash Flow Items: 2017 2016 Net cash provided by operating activities 81,016$ 74,627$ Free cash flow 1 48,142$ 41,368$ Year Ended December 31,
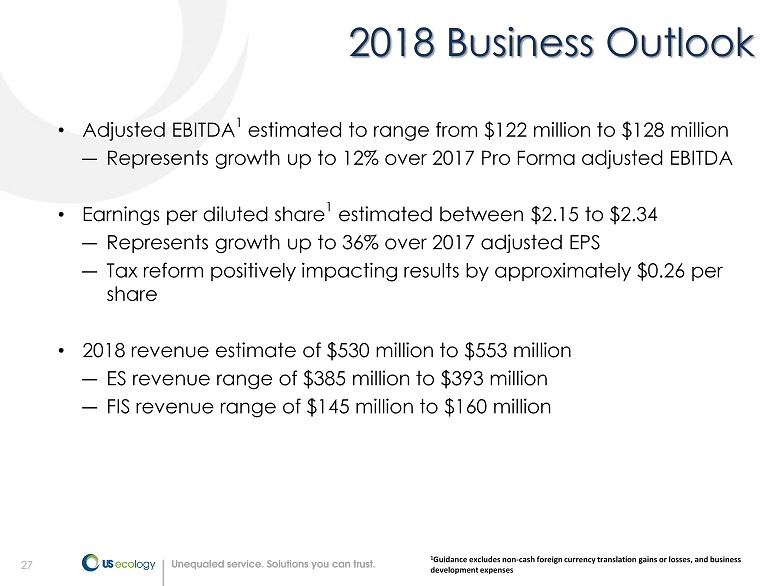
27 27 2018 Business Outlook • Adjusted EBITDA 1 estimated to range from $122 million to $128 million ― Represents growth up to 12% over 2017 Pro Forma adjusted EBITDA • Earnings p er d iluted share 1 estimated between $2.15 to $2.34 ― Represents growth up to 36% over 2017 adjusted EPS ― Tax reform positively impacting results by approximately $ 0.26 per share • 2018 revenue estimate of $530 million to $553 million ― ES revenue range of $385 million to $393 million ― FIS revenue range of $145 million to $160 million 1 Guidance excludes non - cash foreign currency translation gains or losses, and business development expenses
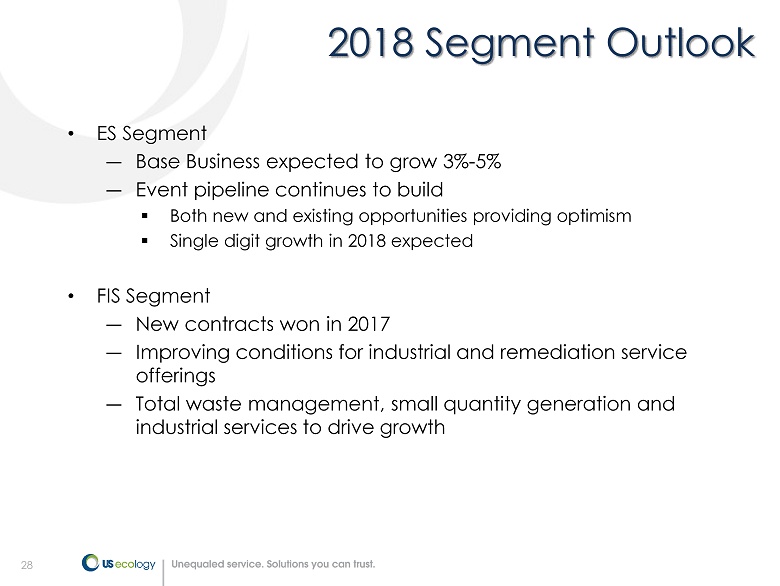
28 28 2018 Segment Outlook • ES Segment ― Base Business expected to grow 3% - 5% ― Event pipeline continues to build ▪ Both new and existing opportunities providing optimism ▪ Single digit growth in 2018 expected • FIS Segment ― New contracts won in 2017 ― Improving conditions for industrial and remediation service offerings ― Total waste management, small quantity generation and industrial services to drive growth
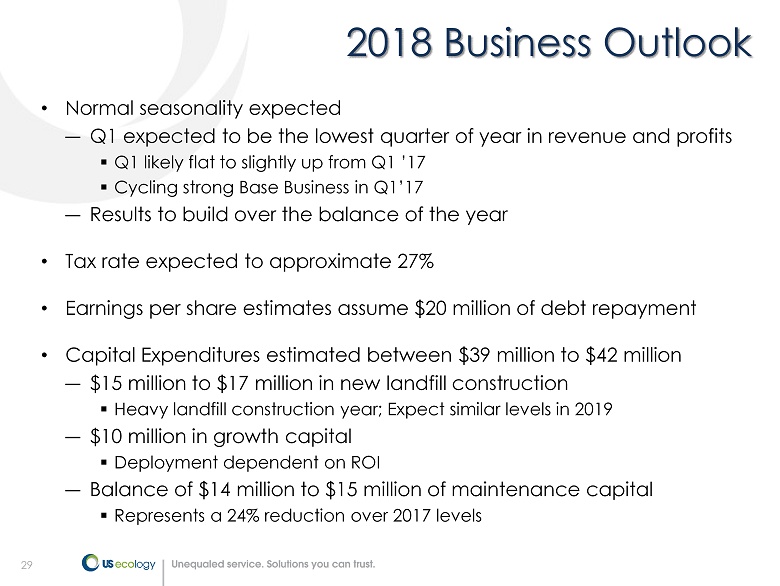
29 29 2018 Business Outlook • Normal seasonality expected ― Q1 expected to be the lowest quarter of year in revenue and profits ▪ Q1 likely flat to slightly up from Q1 ’17 ▪ Cycling strong Base Business in Q1’17 ― Results to build over the balance of the year • Tax rate expected to approximate 27% • Earnings per share estimates assume $20 million of debt repayment • Capital Expenditures estimated between $39 million to $42 million ― $15 million to $17 million in new landfill construction ▪ Heavy landfill construction year; Expect similar levels in 2019 ― $10 million in growth capital ▪ Deployment dependent on ROI ― Balance of $14 million to $15 million of maintenance capital ▪ Represents a 24% reduction over 2017 levels
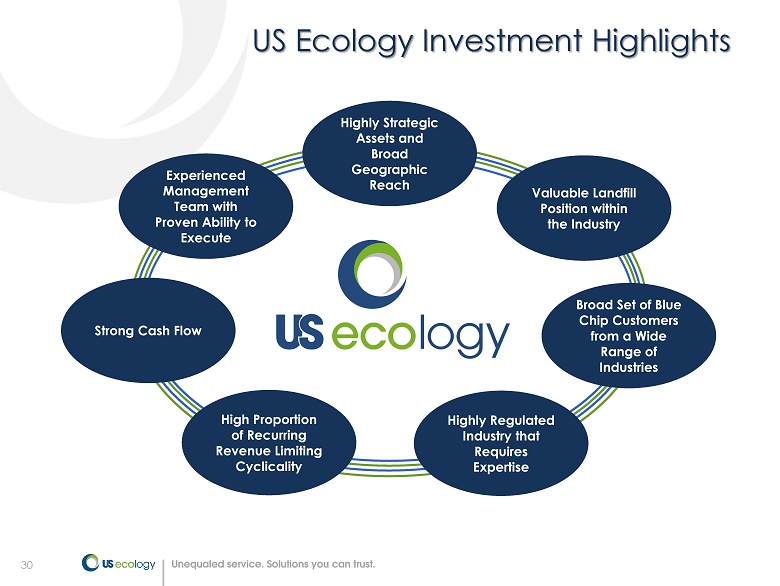
30 Experienced Management Team with Proven Ability to Execute Valuable Landfill Position within the Industry Broad Set of Blue Chip Customers from a Wide Range of Industries Strong Cash Flow Highly Strategic Assets and Broad Geographic Reach US Ecology Investment Highlights High Proportion of Recurring Revenue Limiting Cyclicality Highly Regulated Industry that Requires Expertise

31 Appendix
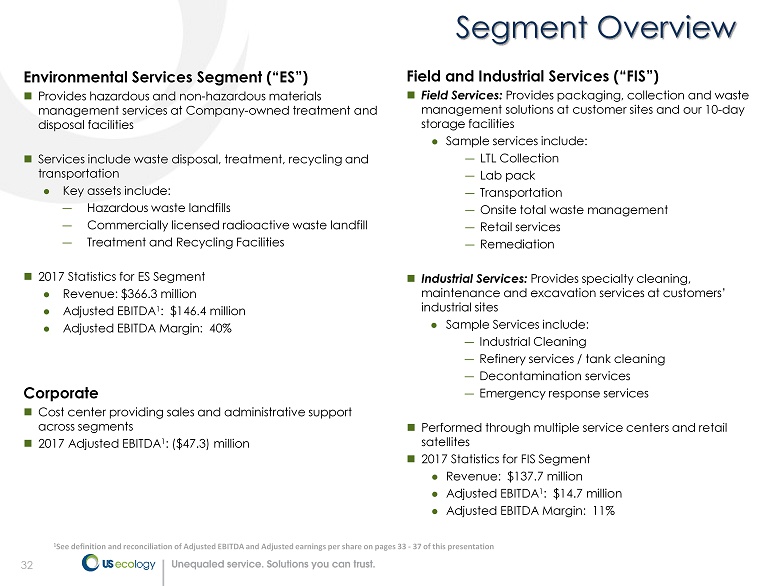
32 Environmental Services Segment (“ES”) Provides hazardous and non - hazardous materials management services at Company - owned treatment and disposal facilities Services include waste disposal, treatment, recycling and transportation Key assets include: ― Hazardous waste landfills ― Commercially licensed radioactive waste landfill ― Treatment and Recycling Facilities 2017 Statistics for ES Segment Revenue: $ 366.3 million Adjusted EBITDA 1 : $146.4 million Adjusted EBITDA Margin: 40% 32 Field and Industrial Services (“FIS”) Field Services: Provides packaging, collection and waste management solutions at customer sites and our 10 - day storage facilities Sample services include: ― LTL Collection ― Lab pack ― Transportation ― Onsite total waste management ― Retail services ― Remediation Industrial Services: Provides specialty cleaning, maintenance and excavation services at customers’ industrial sites Sample Services include: ― Industrial Cleaning ― Refinery services / tank cleaning ― Decontamination services ― Emergency response services Performed through multiple service centers and retail satellites 2017 Statistics for FIS Segment Revenue: $ 137.7 million Adjusted EBITDA 1 : $14.7 million Adjusted EBITDA Margin: 11% Corporate Cost center providing sales and administrative support across segments 2017 Adjusted EBITDA 1 : ($47.3) million Segment Overview 1 See definition and reconciliation of Adjusted EBITDA and Adjusted earnings per share on pages 33 - 37 of this presentation
33 US Ecology reports adjusted EBITDA, Pro Forma adjusted EBITDA, adjusted earnings per diluted share and free cash flow results, which are non - GAAP financial measures, as a complement to results provided in accordance with generally accepted accounting principles in the United States (GAAP) and believes that such information provides analysts, stockholders, and other users information to better understand the Company’s operating performance . Because adjusted EBITDA, Pro Forma adjusted EBITDA, adjusted earnings per diluted share and free cash flow are not measurements determined in accordance with GAAP and are thus susceptible to varying calculations they may not be comparable to similar measures used by other companies . Items excluded from adjusted EBITDA , Pro Forma adjusted EBITDA, adjusted earnings per diluted share and free cash flow are significant components in understanding and assessing financial performance . Adjusted EBITDA, Pro Forma adjusted EBITDA, adjusted earnings per diluted share and free cash flow should not be considered in isolation or as an alternative to, or substitute for, net income, cash flows generated by operations, investing or financing activities, or other financial statement data presented in the consolidated financial statements as indicators of financial performance or liquidity . Adjusted EBITDA, Pro Forma adjusted EBITDA, adjusted earnings per diluted share and free cash flow have limitations as analytical tools and should not be considered in isolation or a substitute for analyzing our results as reported under GAAP . 33 Non - GAAP Financial Measures
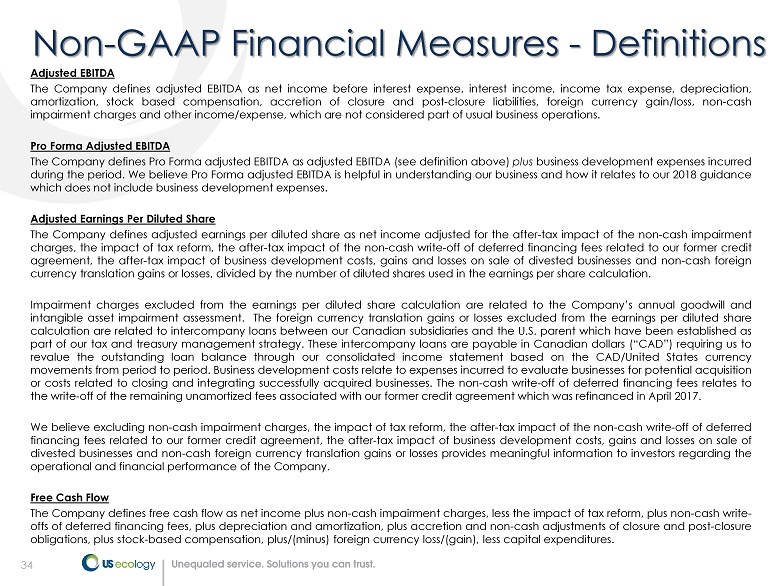
34 Adjusted EBITDA The Company defines adjusted EBITDA as net income before interest expense, interest income, income tax expense, depreciation, amortization, stock based compensation, accretion of closure and post - closure liabilities, foreign currency gain/loss, non - cash impairment charges and other income/expense, which are not considered part of usual business operations . Pro Forma Adjusted EBITDA The Company defines Pro Forma adjusted EBITDA as adjusted EBITDA (see definition above) plus business development expenses incurred during the period . We believe Pro Forma adjusted EBITDA is helpful in understanding our business and how it relates to our 2018 guidance which does not include business development expenses . Adjusted Earnings Per Diluted Share The Company defines adjusted earnings per diluted share as net income adjusted for the after - tax impact of the non - cash impairment charges, the impact of tax reform, the after - tax impact of the non - cash write - off of deferred financing fees related to our former credit agreement, the after - tax impact of business development costs, gains and losses on sale of divested businesses and non - cash foreign currency translation gains or losses, divided by the number of diluted shares used in the earnings per share calculation . Impairment charges excluded from the earnings per diluted share calculation are related to the Company’s annual goodwill and intangible asset impairment assessment . The foreign currency translation gains or losses excluded from the earnings per diluted share calculation are related to intercompany loans between our Canadian subsidiaries and the U . S . parent which have been established as part of our tax and treasury management strategy . These intercompany loans are payable in Canadian dollars (“CAD”) requiring us to revalue the outstanding loan balance through our consolidated income statement based on the CAD/United States currency movements from period to period . Business development costs relate to expenses incurred to evaluate businesses for potential acquisition or costs related to closing and integrating successfully acquired businesses . The non - cash write - off of deferred financing fees relates to the write - off of the remaining unamortized fees associated with our former credit agreement which was refinanced in April 2017 . We believe excluding non - cash impairment charges, the impact of tax reform, the after - tax impact of the non - cash write - off of deferred financing fees related to our former credit agreement, the after - tax impact of business development costs, gains and losses on sale of divested businesses and non - cash foreign currency translation gains or losses provides meaningful information to investors regarding the operational and financial performance of the Company . Free Cash Flow The Company defines free cash flow as net income plus non - cash impairment charges, less the impact of tax reform, plus non - cash write - offs of deferred financing fees, plus depreciation and amortization, plus accretion and non - cash adjustments of closure and post - closure obligations , plus stock - based compensation, plus /(minus) foreign currency loss/(gain), less capital expenditures . 34 Non - GAAP Financial Measures - Definitions
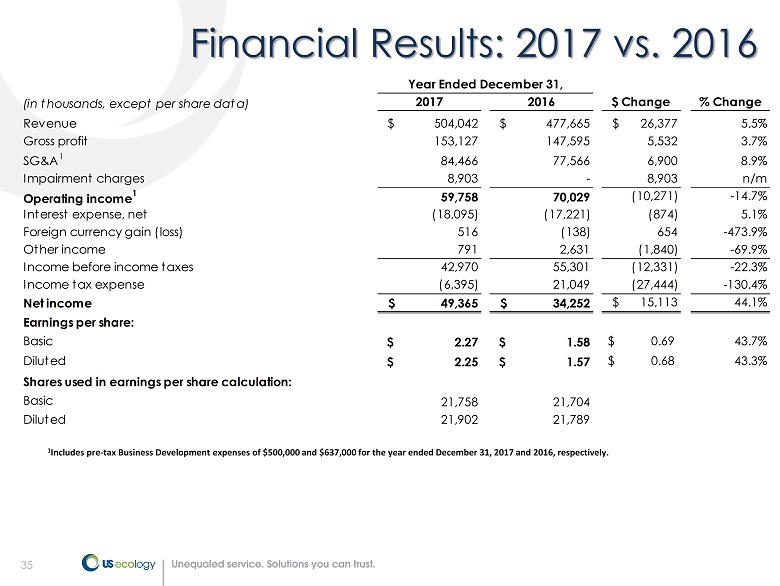
35 35 Financial Results: 2017 vs . 2016 1 Includes pre - tax Business Development expenses of $500,000 and $637,000 for the year ended December 31, 2017 and 2016, respectively. (in thousands, except per share data) 2017 2016 $ Change % Change Revenue $ 504,042 $ 477,665 $ 26,377 5.5% Gross profit 153,127 147,595 5,532 3.7% SG&A 1 84,466 77,566 6,900 8.9% Impairment charges 8,903 - 8,903 n/m Operating income 1 59,758 70,029 (10,271) -14.7% Interest expense, net (18,095) (17,221) (874) 5.1% Foreign currency gain (loss) 516 (138) 654 -473.9% Other income 791 2,631 (1,840) -69.9% Income before income taxes 42,970 55,301 (12,331) -22.3% Income tax expense (6,395) 21,049 (27,444) -130.4% Net income $ 49,365 $ 34,252 $ 15,113 44.1% Earnings per share: Basic $ 2.27 $ 1.58 $ 0.69 43.7% Diluted $ 2.25 $ 1.57 $ 0.68 43.3% Shares used in earnings per share calculation: Basic 21,758 21,704 Diluted 21,902 21,789 Year Ended December 31,
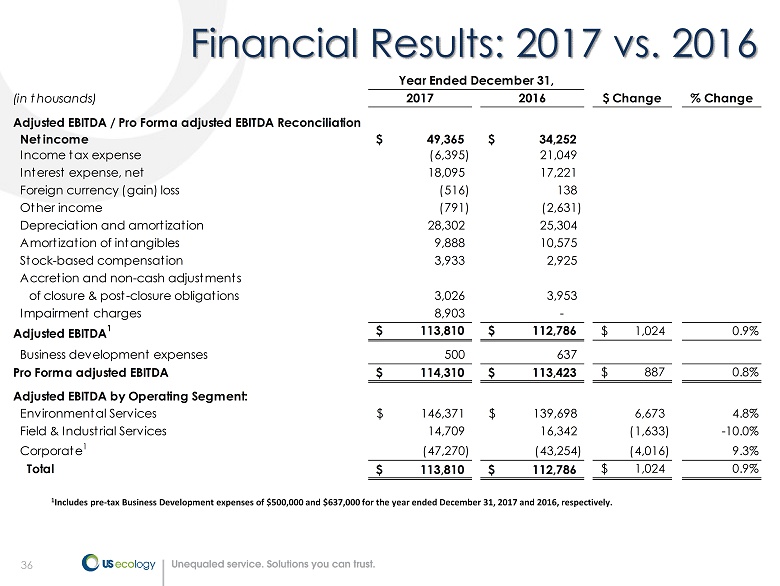
36 36 Financial Results: 2017 vs. 2016 1 Includes pre - tax Business Development expenses of $500,000 and $637,000 for the year ended December 31, 2017 and 2016, respectively. (in thousands) 2017 2016 $ Change % Change Adjusted EBITDA / Pro Forma adjusted EBITDA Reconciliation Net income 49,365$ 34,252$ Income tax expense (6,395) 21,049 Interest expense, net 18,095 17,221 Foreign currency (gain) loss (516) 138 Other income (791) (2,631) Depreciation and amortization 28,302 25,304 Amortization of intangibles 9,888 10,575 Stock-based compensation 3,933 2,925 Accretion and non-cash adjustments of closure & post-closure obligations 3,026 3,953 Impairment charges 8,903 - Adjusted EBITDA 1 113,810$ 112,786$ 1,024$ 0.9% Business development expenses 500 637 Pro Forma adjusted EBITDA 114,310$ 113,423$ 887$ 0.8% Adjusted EBITDA by Operating Segment: Environmental Services 146,371$ 139,698$ 6,673 4.8% Field & Industrial Services 14,709 16,342 (1,633) -10.0% Corporate 1 (47,270) (43,254) (4,016) 9.3% Total 113,810$ 112,786$ 1,024$ 0.9% Year Ended December 31,
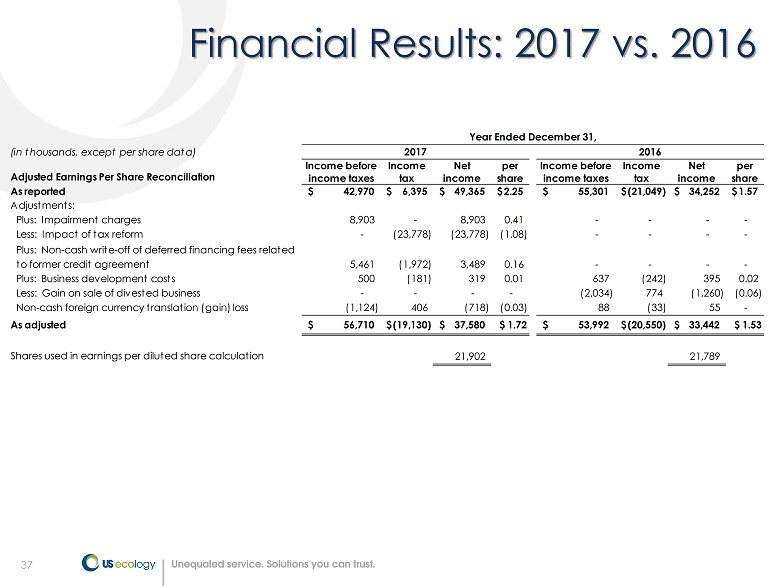
37 37 Financial Results: 2017 vs . 2016 (in thousands, except per share data) Adjusted Earnings Per Share Reconciliation Income before income taxes Income tax Net income per share Income before income taxes Income tax Net income per share As reported 42,970$ 6,395$ 49,365$ 2.25$ 55,301$ (21,049)$ 34,252$ 1.57$ Adjustments: Plus: Impairment charges 8,903 - 8,903 0.41 - - - - Less: Impact of tax reform - (23,778) (23,778) (1.08) - - - - Plus: Non-cash write-off of deferred financing fees related to former credit agreement 5,461 (1,972) 3,489 0.16 - - - - Plus: Business development costs 500 (181) 319 0.01 637 (242) 395 0.02 Less: Gain on sale of divested business - - - - (2,034) 774 (1,260) (0.06) Non-cash foreign currency translation (gain) loss (1,124) 406 (718) (0.03) 88 (33) 55 - As adjusted 56,710$ (19,130)$ 37,580$ $ 1.72 53,992$ (20,550)$ 33,442$ $ 1.53 Shares used in earnings per diluted share calculation 21,902 21,789 Year Ended December 31, 2017 2016
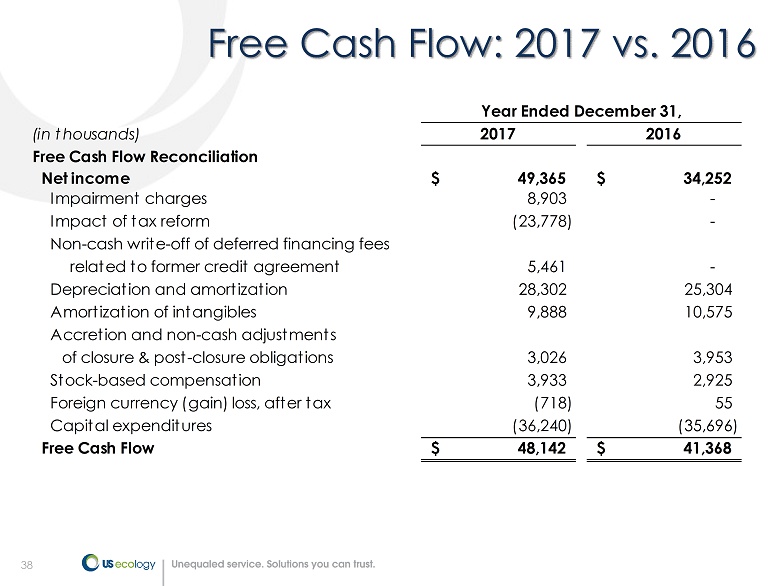
38 38 Free Cash Flow: 2017 vs . 2016 (in thousands) 2017 2016 Free Cash Flow Reconciliation Net income 49,365$ 34,252$ Impairment charges 8,903 - Impact of tax reform (23,778) - Non-cash write-off of deferred financing fees related to former credit agreement 5,461 - Depreciation and amortization 28,302 25,304 Amortization of intangibles 9,888 10,575 Accretion and non-cash adjustments of closure & post-closure obligations 3,026 3,953 Stock-based compensation 3,933 2,925 Foreign currency (gain) loss, after tax (718) 55 Capital expenditures (36,240) (35,696) Free Cash Flow 48,142$ 41,368$ Year Ended December 31,