Attached files
| file | filename |
|---|---|
| EX-32.2 - EX-32.2 - US ECOLOGY, INC. | a2231029zex-32_2.htm |
| EX-32.1 - EX-32.1 - US ECOLOGY, INC. | a2231029zex-32_1.htm |
| EX-31.2 - EX-31.2 - US ECOLOGY, INC. | a2231029zex-31_2.htm |
| EX-31.1 - EX-31.1 - US ECOLOGY, INC. | a2231029zex-31_1.htm |
| EX-23.1 - EX-23.1 - US ECOLOGY, INC. | a2231029zex-23_1.htm |
| EX-21 - EX-21 - US ECOLOGY, INC. | a2231029zex-21.htm |
| EX-12.1 - EX-12.1 - US ECOLOGY, INC. | a2231029zex-12_1.htm |
Use these links to rapidly review the document
TABLE OF CONTENTS
ITEM 8. FINANCIAL STATEMENTS AND SUPPLEMENTARY DATA
UNITED STATES
SECURITIES AND EXCHANGE COMMISSION
Washington, D.C. 20549
FORM 10-K
ý |
ANNUAL REPORT PURSUANT TO SECTION 13 or 15(d) OF THE SECURITIES EXCHANGE ACT OF 1934 |
|
For the fiscal year ended December 31, 2016 |
||
OR |
||
o |
TRANSITION REPORT PURSUANT TO Section 13 or 15(d) OF THE SECURITIES EXCHANGE ACT OF 1934 |
|
For the transition period from to . |
||
Commission file number: 0000-11688

US ECOLOGY, INC.
(Exact name of registrant as specified in its charter)
| Delaware (State or other jurisdiction of incorporation or organization) |
95-3889638 (I.R.S. Employer Identification No.) |
|
251 E. Front St., Suite 400 Boise, Idaho (Address of principal executive offices) |
83702 (Zip Code) |
Registrant's telephone number, including area code: (208) 331-8400
Securities registered pursuant to Section 12(b) of the Act:
| |
Common Stock, $0.01 par value | |
||
|---|---|---|---|---|
| (Title of class) |
Securities registered pursuant to Section 12(g) of the Act: None
Indicate by check mark if the registrant is a well-known seasoned issuer, as defined in Rule 405 of the Securities Act. Yes ý No o
Indicate by check mark if the registrant is not required to file reports pursuant to Section 13 or Section 15(d) of the Act. Yes o No ý
Indicate by check mark whether the registrant (1) has filed all reports required to be filed by Section 13 or 15(d) of the Securities Exchange Act of 1934 during the preceding 12 months (or for such shorter period that the Registrant was required to file such reports), and (2) has been subject to such filing requirements for the past 90 days. Yes ý No o
Indicate by check mark whether the registrant has submitted electronically and posted on its corporate Web site, if any, every Interactive Data File required to be submitted and posted pursuant to Rule 405 of Regulation S-T (§ 232.405 of this chapter) during the preceding 12 months (or for such shorter period that the registrant was required to submit and post such files). Yes ý No o
Indicate by check mark if disclosure of delinquent filers pursuant to Item 405 of Regulation S-K (§229.405 of this chapter) is not contained herein, and will not be contained, to the best of registrant's knowledge, in definitive proxy or information statements incorporated by reference in Part III of this Form 10-K or any amendment to this Form 10-K. ý
Indicate by check mark whether the registrant is a large accelerated filer, an accelerated filer, a non-accelerated filer, or a smaller reporting company. See the definitions of "large accelerated filer," "accelerated filer," and "smaller reporting company" in Rule 12b-2 of the Exchange Act.
| Large accelerated filer ý | Accelerated filer o | Non-accelerated filer o (Do not check if a smaller reporting company) |
Smaller reporting company o |
Indicate by check mark whether the registrant is a shell company (as defined in Rule 12b-2 of the Act). Yes o No ý
The aggregate market value of the registrant's voting stock held by non-affiliates on June 30, 2016 was approximately $992.0 million based on the closing price of $45.95 per share as reported on the NASDAQ Global Market System.
At February 17, 2017, there were 21,798,917 shares of the registrant's Common Stock outstanding.
Documents Incorporated by Reference
Listed hereunder are the documents, any portions of which are incorporated by reference and the Parts of this Form 10-K into which such portions are incorporated:
1. |
The registrant's definitive proxy statement for use in connection with the Annual Meeting of Stockholders to be held on or about May 23, 2017 to be filed within 120 days after the registrant's fiscal year ended December 31, 2016,
portions of which are incorporated by reference into Part III of this Form 10-K. |
2
Cautionary Statement for Purposes of Safe Harbor Provisions of the Private Securities Litigation Reform Act of 1995
This annual report on Form 10-K contains forward-looking statements within the meaning of the federal securities laws. Statements that are not historical facts, including statements about the Company's beliefs and expectations, are forward-looking statements. Forward-looking statements include statements preceded by, followed by or that include the words "may," "could," "would," "should," "believe," "expect," "anticipate," "plan," "estimate," "target," "project," "intend" and similar expressions. These statements include, among others, statements regarding our financial and operating results, strategic objectives and means to achieve those objectives, the amount and timing of capital expenditures, repurchases of its stock under approved stock repurchase plans, the amount and timing of interest expense, the likelihood of our success in expanding our business, financing plans, budgets, working capital needs and sources of liquidity.
Forward-looking statements are only predictions and are not guarantees of performance. These statements are based on management's beliefs and assumptions, which in turn are based on currently available information. Important assumptions include, among others, those regarding demand for Company services, expansion of service offerings geographically or through new or expanded service lines, the timing and cost of planned capital expenditures, competitive conditions and general economic conditions. These assumptions could prove inaccurate. Forward-looking statements also involve known and unknown risks and uncertainties, which could cause actual results to differ materially from those contained in any forward-looking statement. Many of these factors are beyond our ability to control or predict. Such factors include the replacement of non-recurring event cleanup projects, a loss of a major customer, our ability to permit and contract for timely construction of new or expanded disposal cells, our ability to renew our operating permits or lease agreements with regulatory bodies, loss of key personnel, compliance with and changes to applicable laws, rules, or regulations, access to insurance, surety bonds and other financial assurances, a deterioration in our labor relations or labor disputes, our ability to perform under required contracts, failure to realize anticipated benefits and operational performance from acquired operations, adverse economic or market conditions, government funding or competitive pressures, incidents or adverse weather conditions that could limit or suspend specific operations, access to cost effective transportation services, fluctuations in foreign currency markets, lawsuits, our willingness or ability to repurchase stock or pay dividends, implementation of new technologies, limitations on our available cash flow as a result of our indebtedness and our ability to effectively execute our acquisition strategy and integrate future acquisitions.
Except as required by applicable law, including the securities laws of the United States and the rules and regulations of the Securities and Exchange Commission (the "SEC"), we are under no obligation to publicly update or revise any forward-looking statements, whether as a result of new information, future events or otherwise. You should not place undue reliance on our forward-looking statements. Although we believe that the expectations reflected in forward-looking statements are reasonable, we cannot guarantee future results or performance. Before you invest in our common stock, you should be aware that the occurrence of the events described in the "Risk Factors" section in this report could harm our business, prospects, operating results, and financial condition.
Investors should also be aware that while we do, from time to time, communicate with securities analysts, it is against our policy to disclose to them any material non-public information or other confidential commercial information. Accordingly, stockholders should not assume that we agree with any statement or report issued by any analyst irrespective of the content of the statement or report. Furthermore, we have a policy against issuing or confirming financial forecasts or projections issued by others. Thus, to the extent that reports issued by securities analysts contain any projections, forecasts or opinions, such reports are not the responsibility of US Ecology, Inc.
3
General
The table below contains definitions that are used throughout this Annual Report on Form 10-K.
Term
|
Meaning | |
|---|---|---|
| US Ecology, the Company, "we," "our," "us" | US Ecology, Inc., and its subsidiaries | |
AEA |
Atomic Energy Act of 1954, as amended |
|
CEPA |
Canadian Environmental Protection Act (1999) |
|
CERCLA or "Superfund" |
Comprehensive Environmental Response, Compensation and Liability Act of 1980 |
|
CWA |
Clean Water Act of 1977 |
|
LARM |
Low-activity radioactive material exempt from federal Atomic Energy Act regulation for disposal |
|
LLRW |
Low-level radioactive waste regulated under the federal Atomic Energy Act for disposal |
|
NORM/NARM |
Naturally occurring and accelerator produced radioactive material |
|
NRC |
U.S. Nuclear Regulatory Commission |
|
PCBs |
Polychlorinated biphenyls |
|
QEQA |
Québec Environmental Quality Act |
|
RCRA |
Resource Conservation and Recovery Act of 1976 |
|
SEC |
U. S. Securities and Exchange Commission |
|
TSCA |
Toxic Substances Control Act of 1976 |
|
TSDF |
Treatment, Storage and Disposal Facility |
|
USACE |
U.S. Army Corps of Engineers |
|
USEPA |
U.S. Environmental Protection Agency |
|
WUTC |
Washington Utilities and Transportation Commission |
US Ecology, Inc. is a leading North American provider of environmental services to commercial and government entities. The Company addresses the complex waste management needs of its customers, offering treatment, disposal and recycling of hazardous, non-hazardous and radioactive waste, as well as a wide range of complementary field and industrial services. US Ecology's comprehensive knowledge of the waste business, its collection of waste management facilities and focus on safety, environmental compliance, and customer service enables us to effectively meet the needs of our customers and to build long-lasting relationships. US Ecology and its predecessor companies have been in business for more than 60 years. As of December 31, 2016, we employed approximately 1,450 people.
US Ecology was most recently incorporated as a Delaware corporation in May 1987 as American Ecology Corporation. On February 22, 2010, the Company changed its name from American Ecology Corporation to US Ecology, Inc. Our filings with the SEC are posted on our website at www.usecology.com. The information found on our website is not part of this or any other report we file with or furnish to the SEC.
4
The public can also obtain copies of these filings by visiting the SEC's Public Reference Room at 100 F Street NE, Washington DC 20549, or by calling the SEC at 1-800-SEC-0330 or by accessing the SEC's website at www.sec.gov.
We have fixed facilities and service centers operating in the United States, Canada and Mexico. Our fixed facilities include five permitted hazardous waste landfills and one LLRW landfill located near Beatty, Nevada; Richland, Washington; Robstown, Texas; Grand View, Idaho; Detroit, Michigan and Blainville, Québec, Canada. These facilities generate revenue from fees charged to treat and dispose of waste and to perform various field and industrial services for our customers.
On June 17, 2014, the Company acquired 100% of the outstanding shares of EQ Holdings, Inc. and its wholly-owned subsidiaries (collectively "EQ"). EQ is a fully integrated environmental services company providing waste treatment and disposal, wastewater treatment, remediation, recycling, industrial cleaning and maintenance, transportation, total waste management, technical services, and emergency response services to a variety of industries and customers in North America.
On November 1, 2015, we sold our Allstate Power Vac, Inc. ("Allstate") subsidiary to a private investor group. See Note 5 to the Consolidated Financial Statements in "Part II, Item 8. Financial Statements and Supplementary Data" of this Annual Report on Form 10-K for additional information.
Our operations are managed in two reportable segments reflecting our internal management reporting structure and nature of services offered as follows:
Environmental Services—This segment provides a broad range of hazardous material management services including transportation, recycling, treatment and disposal of hazardous and non-hazardous waste at Company-owned landfill, wastewater and other treatment facilities.
Field & Industrial Services—This segment provides packaging and collection of hazardous waste and total waste management solutions at customer sites and through our 10-day transfer facilities. Services include on-site management, waste characterization, transportation and disposal of non-hazardous and hazardous waste. This segment also provides specialty services such as high-pressure cleaning, tank cleaning, decontamination, remediation, transportation, spill cleanup and emergency response and other services to commercial and industrial facilities and to government entities.
Financial information with respect to each segment is further discussed in Note 20 to the Consolidated Financial Statements in "Part II, Item 8. Financial Statements and Supplementary Data" of this Annual Report on Form 10-K.
Environmental Services Segment
Our Environmental Services involve the transportation, treatment, recycling and disposal of hazardous and non-hazardous wastes, and include physical treatment, recycling, landfill disposal and wastewater treatment services.
Waste Treatment & Disposal
We recycle, treat and dispose of hazardous and non-hazardous industrial wastes. The wastes handled include substances which are classified as "hazardous" because of their corrosive, ignitable, reactive or toxic properties, and other wastes subject to federal, state and provincial environmental regulation. The wastes we handle come in solid, liquid and sludge form and can be received in a variety of containerized and bulk forms and transported to our facilities by truck and rail.
We own and operate five permitted hazardous waste treatment and disposal landfills in the United States and Canada used primarily for the disposal of wastes treated at Company-owned onsite and offsite treatment facilities. The United States landfills are regulated under RCRA by the respective states in which they are located and the USEPA while our Canadian landfill is regulated by the Quebec Ministry of
5
Environment. We also operate a commercial LLRW landfill in Richland, Washington that is licensed by the Washington Department of Health through delegated authority of the NRC. The WUTC sets disposal rates for LLRW. Rates are set at an amount sufficient to cover operating costs and provide us with a reasonable profit. The current rate agreement with the WUTC was extended in 2013 and is effective until January 1, 2020.
As of December 31, 2016, the capacity used in the calculation of the useful economic lives of our six landfills includes approximately 39.5 million cubic yards of remaining permitted airspace capacity and approximately 18.1 million cubic yards of additional unpermitted airspace capacity included in the footprints of these landfills. We believe it is probable that this unpermitted airspace capacity will be permitted in the future based on our analysis of site conditions, past regulatory approvals on adjacent property, and our interactions with regulators on applicable regulations, although there can be no assurance that any additional unpermitted airspace capacity will be permitted in the future.
Treatment and disposal ("T&D") revenue can be broken down into two categories, based on the underlying nature of the revenue source: "Base Business" and "Event Business." We define Event Business as non-recurring projects that are expected to equal or exceed 1,000 tons, with Base Business defined as all other business not meeting the definition of Event Business. The duration of Event Business projects can last from a several-week cleanup of a contaminated site to a multiple year cleanup project.
A significant portion of our T&D revenue is attributable to discrete Event Business projects which vary widely in size, duration and unit pricing. For the year ended December 31, 2016, approximately 18% of our T&D revenue was derived from Event Business projects. The one-time nature of Event Business, diverse spectrum of waste types received and widely varying unit pricing necessarily creates variability in revenue and earnings. This variability may be influenced by general and industry-specific economic conditions, funding availability, changes in laws and regulations, government enforcement actions or court orders, public controversy, litigation, weather, commercial real estate, closed military bases and other project timing, government appropriation and funding cycles and other factors. The types and amounts of Base Business waste received also vary quarter to quarter, sometimes significantly, but are generally more predictable than Event Business.
The types of waste received, also referred to as "service mix," can produce significant quarter-to-quarter and year-to-year variations in revenue, average selling price, gross profit, gross margin, operating profit and net income for both Base Business and Event Business. Base Business represented approximately 82% and 75% of disposal revenue (excluding transportation) for the years ended December 31, 2016 and 2015, respectively. Event Business contributed approximately 18% and 25% of disposal revenue (excluding transportation) for the years ended December 31, 2016 and 2015, respectively. Our strategy is to expand our Base Business while securing both short-term and extended-duration Event Business. When Base Business covers our fixed overhead costs, a significant portion of disposal revenue generated from Event Business is generally realized as operating income and net income. This strategy takes advantage of the operating leverage inherent to the largely fixed-cost nature of the waste disposal business. Contribution margin is influenced by whether the waste is directly disposed ("direct disposal") or requires the application of chemical reagents, absorbents or other additives (variable costs) to treat the waste prior to disposal.
Wastewater Treatment
We operate wastewater treatment facilities that offer a range of wastewater treatment technologies. These wastewater treatment operations involve processing hazardous and non-hazardous wastes through the use of physical and chemical treatment methods. Our wastewater treatment facilities treat a broad range of industrial liquid and semi-liquid wastes containing heavy metals, organics and suspended solids.
6
The following table summarizes the locations and services of our active Environmental Services waste treatment and/or disposal facilities:
Location
|
Onsite Landfill | Services | ||
|---|---|---|---|---|
| Beatty, Nevada | Yes | Hazardous and non-hazardous industrial waste treatment, storage and disposal facility permitted under Subtitle C of RCRA and TSCA to treat and dispose RCRA, TSCA and certain NRC-exempt (NORM) radioactive waste. | ||
Robstown, Texas |
Yes |
Hazardous and non-hazardous industrial waste treatment, storage and disposal facility permitted under Subtitle C of RCRA to treat and dispose RCRA, PCB remediation and certain NRC-exempt (LARM and NORM/NARM) radioactive waste. PCB waste storage for off-site shipment. Features a thermal desorption system permitted as a Subpart X RCRA treatment unit that treats and recycles organic materials including recoverable oils and metal catalysts from petroleum wastes. Rail transfer station. |
||
Grand View, Idaho |
Yes |
Hazardous and non-hazardous industrial waste treatment, storage and disposal facility permitted under Subtitle C of RCRA and TSCA to treat RCRA and TSCA wastes and certain NRC-exempt (NORM/NARM, Technologically Enhanced NORM (TENORM)) radioactive waste. Rail transfer station. |
||
Belleville, Michigan |
Yes |
Hazardous and non-hazardous industrial waste treatment, storage and disposal facility permitted under Subtitle C of RCRA to treat and dispose RCRA wastes and certain NRC-exempt (NORM/NARM, Technologically Enhanced NORM (TENORM)) radioactive waste. Permitted under TSCA to dispose TSCA wastes. Features a regenerative thermal oxidation air pollution control system that is compliant with RCRA Subpart CC air emissions standards. Rail transfer station. |
||
Blainville, Québec, Canada |
Yes |
Permitted by the Canadian Ministry of Environment and authorized under the Environmental Quality Act by Order-in-Council to treat and stabilize inorganic hazardous liquid and solid waste and contaminated soils to produce a non-leachable concrete-like material for disposal in the onsite landfill. Specializes in processing hard-to-treat materials, such as cyanides, mercury compounds, strong acids, non-organic oxidizers, lab packs, contaminated debris and batteries. Direct rail access. |
||
Richland, Washington |
Yes |
LLRW disposal facility accepts Class A, B, and C commercial LLRW from within the Northwest Interstate and Rocky Mountain Compacts, NORM/NARM and LARM waste including radium sources produced by customers nationwide. One of only three full-service Class A, B, and C disposal facilities in the nation. |
7
Location
|
Onsite Landfill | Services | ||
|---|---|---|---|---|
| Detroit, Michigan | No | RCRA Part B and Centralized Wastewater Treatment ("CWT") permitted industrial hazardous and non-hazardous treatment of liquid wastes, stabilization, solidification, chemical oxidation/reduction and deactivation of hazardous and non-hazardous solid and liquid wastes. Direct rail access. | ||
Canton, Ohio |
No |
RCRA Part B and CWT permitted wastewater treatment of hazardous and non-hazardous liquid wastes and stabilization, solidification, chemical oxidation/reduction, deactivation and metals recovery of hazardous and non-hazardous liquid and solid wastes. Specializes in a delisting process that converts industrial inorganic wastes into non-hazardous residuals. |
||
Harvey, Illinois |
No |
RCRA Part B and CWT permitted wastewater treatment of hazardous and non-hazardous liquid wastes and stabilization, solidification, chemical oxidation/reduction, deactivation, metals recovery of hazardous and non-hazardous liquid and solid wastes and industrial cleaning. Specializes in a delisting process that converts industrial inorganic wastes into non-hazardous residuals. |
||
York, Pennsylvania |
No |
RCRA Part B and CWT permitted wastewater treatment of hazardous and non-hazardous liquid wastes and stabilization, solidification, chemical oxidation/reduction, deactivation and metals recovery of hazardous and non-hazardous liquid and solid wastes. Specializes in a delisting process that converts industrial inorganic wastes into non-hazardous residuals. |
||
Tulsa, Oklahoma |
No |
RCRA Part B and CWT permitted wastewater treatment of hazardous and non-hazardous liquid wastes and stabilization, solidification, chemical oxidation/reduction and deactivation of hazardous and non-hazardous liquid and solid wastes. |
||
Tilbury, Ontario, Canada |
No |
Hazardous and non-hazardous industrial waste treatment, storage, and disposal facility permitted by the Ontario Ministry of Environment. Provides bulking, blending and solidification services. Treatment of non-hazardous hydrocarbon contaminated solids to industrial re-use standards. Full licensed and permitted fleet of hazardous and non-hazardous transportation equipment. Also provides heavy industrial cleaning and confined space entry and rescue services along with emergency response. |
||
Vernon, California |
No |
RCRA Part B and CWT permitted wastewater treatment of hazardous and non-hazardous liquid wastes. Storage and consolidation of hazardous and non-hazardous wastes. California State certified laboratory. Direct rail access. |
8
Recycling Services
We operate recycling technologies designed to reclaim valuable commodities from hazardous waste, including oil-bearing hazardous waste, certain metal-bearing waste, batteries, and solvent-based wastes for industrial clients, metal finishing and other manufacturing processes. Resource recovery involves the treatment of wastes using various methods to effectively remove contaminants from the original material to restore its usefulness and to reduce the volume of waste requiring disposal.
We offer full-service storm water management and propylene glycol recovery at major airports. We currently operate deicing fluid collection systems at the Minneapolis-St. Paul International, Pittsburgh and Detroit airports. We also receive deicing fluids from the Grand Rapids airport in the Great Lakes Region. Recovered fluids are transported to our RCRA Part B and CWT permitted chemical recycling facility in Romulus, Michigan where they are recycled into a greater than 99% pure material that is sold to industrial users.
We also operate a thermal desorption unit at our Robstown, Texas facility that recovers oil and metal bearing catalyst from refinery waste. The recycled oil and recycled catalyst are sold to third parties.
We operate a fleet of mobile solvent recycling stills that provide on-site recycling services throughout the Eastern United States. The trailer-mounted stills are self-contained units that perform solvent distillation at the point of generation. Waste solvents are processed in 500 - 7,500 gallon batches, and clean solvent is returned for reuse. Our Mobile Recycling services are based in Mt. Airy, North Carolina.
Transportation
For waste transported by rail from locations distant from our facilities, transportation-related revenue can vary significantly and can account for as much as 75% of total project revenue. While bundling transportation and disposal services may reduce overall gross profit as a percentage of total revenue ("gross margin"), this value-added service has allowed us to win multiple projects that we believe we could not have otherwise competed for successfully. Our Company-owned fleet of gondola railcars, which is periodically supplemented with railcars obtained under operating leases, has reduced our transportation expenses by largely eliminating reliance on more costly short-term rentals. These Company-owned railcars also help us to win business during times of demand-driven railcar scarcity. We also utilize a variety of specially designed and constructed Company-owned tanker trucks and trailers as well as various third-party transporters to support this activity. Further, to maximize utilization of our railcar fleet, we periodically deploy available railcars to transport waste from cleanup sites to disposal facilities operated by other companies. Such transportation services may also be bundled with logistics and field services support work.
Field & Industrial Services Segment
Our Field & Industrial Services include a wide range of industrial maintenance and specialty services at refineries, chemical plants, steel and automotive plants, and other government, commercial and industrial facilities. Onsite specialty services include excavation, high-pressure cleaning, tank cleaning, decontamination, remediation, transportation, spill cleanup and emergency response. We provide these services through a network of facilities located throughout the Eastern United States that are organized into service lines including Small Quantity Generation, Remediation Services, Managed Services, Emergency Response, Transfer and Processing and Terminal Services and Industrial Services.
Small Quantity Generation
Our small quantity generation service offerings consist of retail services, laboratory packing and Household Hazardous Waste ("HHW") collection. Retail services, laboratory packing and HHW are full-service waste characterization, packaging, collection and transportation programs. Services are provided to small, medium and large industrial and commercial customers. These programs are built on our network of
9
service centers, employ highly trained staff and provide a high level of service to the customer. As an integral part of our services, we operate a network of service centers that characterize, package and collect hazardous and non-hazardous wastes from customers and transport such wastes to and between our facilities for treatment or bulking for shipment to final disposal locations. Customers typically accumulate wastes in containers, such as 55 gallon drums, bulk storage tanks or 20 cubic yard roll-off containers. We utilize a variety of specially designed and constructed tank trucks and semi-trailers as well as third-party transporters, including railroads. Depending on customer needs and competitive economics, transportation services may be offered at or near our cost to help secure new business.
Remediation Services
Our remediation service offerings include RCRA and TSCA closures, surgical excavations, wastewater management, building decontamination and radiological site remediation.
Managed Services
Our managed service offerings consist of Total Waste Management ("TWM") programs. Through our TWM program, customers outsource the management of their waste compliance program to us, allowing us to organize and coordinate their waste management disposal activities and environmental compliance.
Emergency Response
Our primary emergency response offerings include spill response, waste analysis and treatment and disposal planning. We also offer product transfers, spill contingency planning and yearly service agreements with first responder status. Trained, experienced professionals operate the Company's Emergency Response Service 24 hours per day, 7 days per week.
Transfer and Processing
Our transfer and processing stations stage and consolidate non-bulk loads of hazardous, non-hazardous and universal waste into full loads for more efficient shipment to Company-owned or third-party treatment and disposal facilities. This allows us to offer a broader geographic presence without having a dedicated, Company-owned treatment or disposal facility in the region.
Terminal Services
Our terminal services include petroleum and chemical tank cleaning and other services, including emergency response, construction and industrial maintenance. The Company services several major petroleum terminals around New York Harbor.
Industrial Services
Our primary industrial service offerings include emergency response, industrial cleaning and maintenance for railroads, refineries, chemical plants, steel and automotive plants, as well as tank cleaning and temporary storage.
Waste Services Industry
During the 1970s and 1980s, waste services industry growth in the United States was driven by new environmental laws and actions by federal and state agencies to regulate existing hazardous waste management facilities and direct the cleanup of contaminated sites under the federal Superfund law. By the early 1990s, excess hazardous waste management capacity had been constructed by the industry. Over this same period, to better manage risk and reduce expenses, many waste generators instituted industrial
10
process changes and other methods to reduce waste production. These factors led to highly competitive market conditions that still apply today.
In the U.S., hazardous waste is regulated under the RCRA, which created a cradle-to-grave system governing defined hazardous waste from the point of generation to ultimate disposal. RCRA requires waste generators to distinguish between "hazardous" and "non-hazardous" wastes, and to treat, store and dispose of hazardous waste in accordance with specific regulations. Generally, entities that treat, store, or dispose of hazardous waste must obtain a permit, either from the USEPA or from a state agency to which the USEPA has delegated such authority. Similar regulations and management methods apply to hazardous waste generation in Canada, which is regulated by the Canada Ministry of Environment and delegated to provincial agencies.
Disposal facilities are typically designed to permanently contain the waste and prevent the release of harmful pollutants into the environment. The most common hazardous waste disposal practice is placement in an engineered disposal unit such as a landfill, surface impoundment or deep injection well. RCRA's hazardous waste permitting program establishes specific requirements that must be followed when managing those wastes.
We believe that a baseline demand for hazardous waste services will continue into the future with fluctuations driven by general and industry-specific economic conditions, identification and prioritization of new cleanup needs, cleanup project schedules, funding availability, regulatory changes and other public policy decisions. We further believe that the ability to deliver specialized niche services while aggressively competing for large volume cleanup projects and non-niche commodity business opportunities differentiates successful from less successful companies. We seek to control variable costs, expand service lines, increase waste throughput efficiency, employ innovative treatment techniques, provide complementary transportation and logistics services, build market share and increase profitability.
Our Richland, Washington disposal facility, serving the Northwest and Rocky Mountain LLRW Compacts, is one of three operating Compact disposal facilities in the U.S. While our Washington disposal facility has substantial unused capacity, it can only accept LLRW from the 11 western states comprising the two Compacts served. The Barnwell, South Carolina site, operated by Energy Solutions, Inc. ("Energy Solutions"), exclusively serves the three-state Atlantic Compact. A third LLRW disposal facility, licensed by Waste Control Specialists, LLC and located near Andrews, Texas serves the two-state Texas Compact and approved out-of-compact waste generators. Class A LLRW from states outside the Northwest Compact region may also be disposed at a non-compact, commercial disposal site in Clive, Utah, also operated by Energy Solutions.
Increases in pricing at AEA licensed LLRW disposal facilities heightened demand for more cost-effective disposal options for soil, debris, consumer products, industrial wastes and other materials containing LARM, including "mixed wastes," exhibiting both hazardous and radioactive properties. In addition to commercial demand, a substantial amount of LARM is generated by government cleanup projects. The NRC, USEPA and USACE have authorized the use of hazardous waste disposal facilities to dispose of certain LARM, encouraging expansion of this compliant, cost-effective alternative. We have been successful at expanding our permits at four of our RCRA hazardous waste facilities to allow acceptance of additional LARM wastes.
Industrial Services Industry
The industrial services industry is highly fragmented with thousands of small companies performing a variety of cleaning, maintenance and other services to industrial based companies such as refineries, chemical plants and steel and automotive plants. We believe customers increasingly desire to shift high fixed costs to lower variable costs by outsourcing waste management and industrial services. Some companies, such as power generation plants, petroleum refineries and chemical processors, are required to perform specialized "turnaround" maintenance only once or twice per year, making it impractical and
11
cost-prohibitive to purchase expensive, specialized equipment, comply with complex permits and employ full-time specialized technicians required to perform those services. Similarly, the regulatory requirements of characterizing, manifesting, transporting and properly disposing of waste has led many companies to outsource this function to specialists. Our network of service centers and treatment, recycling and storage facilities provides a national footprint allowing us to serve these customers, while at the same time internalizing the waste to our own facilities.
Industrial services generally have low barriers to entry and customers are frequently won based on quality of service, reputation, health and safety record, logistics and price. This low barrier to entry has fostered a fragmented and competitive market place.
Strategy
Our strategy is to capitalize on our difficult-to-replicate combination of treatment and disposal assets and complementary service lines to provide a full service offering to customers and increase market share in the diverse markets we serve. We are focused on safety, environmental compliance and a commitment to customer service excellence. In addition to organic growth initiatives, we actively pursue acquisition opportunities to expand our geographic reach, service lines and customer base. The principal elements of our business strategy are to:
Execute Best-in-Class Safety and Environmental Compliance Programs. We pursue best-in-class safety and environmental compliance at US Ecology. Not only is it the cornerstone of our business, but our customers and regulators rely on our expertise when they select us as a vendor or grant us permits and licenses. We deploy significant resources in terms of human capital, programs and facility investment to achieve safe and compliant operations. The Company has dedicated professionals who oversee and manage safety and environmental programs including, but not limited to, employee training, internal and independent external audits, safety incentive programs, Voluntary Protection Programs ("VPP"), the Safety & Health Achievement Recognition Program, and ISO 9001 and ISO 14001 programs. Dedicated senior managers regularly review and discuss environmental and safety results with operational staff, management and the Board of Directors to improve our safety results and focus on regulatory compliance.
Leverage Regulatory Expertise to Expand Permit Capabilities and Broaden Cost-Effective Service Offerings. We have a proven track record of leveraging more than six decades of regulatory experience to broaden our service offerings. Working with customers, we assess market opportunities in relation to existing laws, regulations and permit conditions. Our engineering, operational and regulatory affairs personnel then seek authority to implement innovative processes and technologies and accept additional types of waste by modifying our existing permits or obtaining new permits.
Continue to Build on Our Robust Waste Handling Infrastructure to Increase Revenue from Existing Assets. We believe we have a difficult to replicate set of treatment, recycling and disposal assets in the highly regulated hazardous and radioactive waste industry. We aim to enhance treatment capabilities at our existing facilities to handle additional waste streams and increase throughput. We also continue to invest in equipment and infrastructure to ensure that we have ample throughput capacity to expand our Event Business while continuing to support our Base Business customers.
Execute on Marketing Initiatives to Grow Organically. Our sales team is focused on high margin, niche wastes that our competitors may not be able to obtain the necessary regulatory authorizations for or handle cost-effectively. We seek to expand into new markets and offer new services allowing us to cross-sell or bundle services and ultimately drive incremental volume into our existing disposal facilities. Our strategy is to have our Base Business cover our fixed overhead costs and deliver a reasonable profit, which allows the majority of our Event Business revenue to be realized as operating profit. We aim to continue building our Base Business while remaining flexible enough to handle large cleanup events.
12
Deliver Innovative Technological Solutions: We challenge ourselves to identify innovative and technology-driven solutions to solve our customers' waste management challenges. Past examples include leveraging our expertise in developing waste treatment recipes for organic and metals-bearing wastes, utilizing waste as a reagent to treat other wastes, beneficial reuse of select wastes, partnering with an innovative technology provider to deploy thermal desorption technology to recover oil and metal catalyst from refinery waste, and stabilizing mercury laden waste and other wastes using patented treatment process.
Pursue a Disciplined Acquisition Strategy to Add Complementary Capabilities. We pursue selective acquisitions to expand our disposal network, customer base and geographic footprint. We have had success achieving this in recent years through our targeted acquisition strategy, acquiring Stablex Canada Inc. ("Stablex") in 2010, Dynecol, Inc. in 2012, EQ in 2014 and Environmental Services Inc. ("ESI") and the Vernon, California based RCRA Part B, liquids and solids waste treatment and storage facility of Evoqua Water Technologies LLC in 2016. The acquisition of EQ also provided us with an entirely new line of complementary field and industrial service offerings. We continue to seek acquisition opportunities to further expand our service offerings across the hazardous waste value chain while maintaining our commitment to compliance, safety and customer service excellence.
Competitive Strengths
Difficult-to-Replicate Infrastructure. We consider our disposal facilities to be difficult to replicate due to the longstanding regulatory and public policy environment for hazardous waste processing facilities, which includes the generally high cost of obtaining permits, multi-year permitting timeframes, uncertainty of outcome, high initial capital expenditures and the potential for both broad-based and local community opposition to the development of new facilities. As a result, it has been more than 20 years since a new hazardous waste landfill has been built in the United States. We operate five of twenty landfills in the U.S. and Canada that are permitted to accept RCRA wastes. Our Richland, Washington LLRW facility is one of only three full-service Class A, B, and C disposal facilities in the U. S. Our personnel have extensive experience safely managing certain radioactive waste requiring the use of shielding and remote handling devices.
Significant Regulatory and Operating Expertise. We operate in a highly regulated marketplace. The permitting process for operating disposal assets in our industry is lengthy and complex, requiring a deep understanding of federal and state hazardous and radioactive waste laws and regulations. We maintain a regulatory compliance and permitting program at our disposal facilities that has allowed us to obtain approvals to expand our service offering in terms of the types, amounts and concentrations of wastes that we are authorized to accept. Our track record of successfully navigating government regulatory and permitting processes has been a consistent competitive advantage.
A Market Leader in Hazardous & Non-Hazardous Waste Treatment and Disposal. We are a leader in the North American hazardous waste services sector with more than six decades of experience. Our collection of disposal assets combined with our transportation network provides us with coast-to-coast treatment and disposal capabilities, allowing us to serve a diverse mix of customers and industries across the United States, Canada and Mexico.
Comprehensive Waste Services. Our comprehensive waste service offerings allow us to act as a full-service provider to our customers. Our full-service orientation creates incremental revenue growth as customers seek to minimize the number of outside vendors through "one-stop" service providers.
Diverse Markets and Customer Base. In 2016, we serviced more than 4,000 commercial and governmental entities, such as refineries, chemical production facilities, heavy manufacturers, steel mills, waste brokers and medical and academic institutions. Our broad range of end-markets gives us exposure to a variety of industrial cycles, lessening the impact of market volatility.
13
Solid Safety and Compliance Record. Safety and environmental compliance is a cornerstone of US Ecology's business. The Company has dedicated environmental professionals who oversee and manage safety and environmental programs including, but not limited to, employee training, internal and independent external audits, safety incentive programs, VPP, the Safety & Health Achievement Recognition Program, and ISO 9001 and ISO 14001 programs. Dedicated senior managers regularly review and discuss environmental and safety results with operational staff, management and the Board of Directors to improve our safety results and focus on regulatory compliance. In addition, we have received multiple operating site safety awards including the VPP Star Worksite Award, Thoroughbred Safety Award and the CSX Chemical Safety Award.
Competition
Our Environmental Services segment competes with large and small companies in each of the commercial markets we serve. While niche services apply, the radioactive, hazardous and non-hazardous industrial waste management industry is generally very competitive. We believe that our primary hazardous waste and PCB disposal competitors are Clean Harbors, Inc., Heritage Environmental Services and Waste Management, Inc. Other hazardous waste disposal competitors include, but are not limited to, Peoria Disposal Company, Envirosafe Services of Ohio, Tradebe, Ross Environmental, Perma-Fix Environmental Services and Veolia Environmental Services. We believe that our primary radioactive material disposal competitors are Energy Solutions, Inc. and Waste Control Specialists, Inc. We believe the principal competitive factors applicable to these businesses are:
- •
- price;
- •
- specialized permits and "niche" service offerings;
- •
- customer service;
- •
- operational efficiency and technical expertise;
- •
- regulatory compliance and worker safety;
- •
- industry reputation and brand name recognition;
- •
- transportation distance; and
- •
- State or Province and local community support.
Competition within our Field & Industrial Services segment varies by locality and type of service rendered, with competition coming from large national and regional service providers and hundreds of privately-owned firms that offer field or industrial services. We believe that our primary field and industrial services competitors are Clean Harbors, Inc.; Stericycle, Inc., Veolia Environmental Services and Waste Management, Inc. Each of these competitors is able to provide most if not all of the field and industrial services we offer.
We believe that we are competitive in all markets we serve and that we offer a unique mix of services, including niche technologies and services that favorably distinguish us from competitors. We also believe that our strong brand name recognition from six decades of experience, compliance and safety record, customer service reputation and positive relations with regulators and local communities enhance our competitive position. Advantages exist for competitors that are larger in scale or have technology, permits or equipment to handle a broader range of waste, that operate in jurisdictions imposing lower disposal fees and/or are located closer to where wastes are generated.
Permits, Licenses and Regulatory Requirements
Obtaining authorization to construct and operate new hazardous or radioactive waste facilities is a lengthy and complex process. We believe we have demonstrated significant expertise in this area over multiple
14
decades. We also believe we possess all permits, licenses and regulatory approvals required to maintain regulatory compliance and operate our facilities and have the specialized expertise required to obtain additional approvals to continue growing our business in the future.
We incur costs and make capital investments to comply with environmental regulations. These regulations require that we operate our facilities in accordance with permit-specific requirements. Most of our facilities are also required to provide financial assurance for closure and post-closure obligations should our facilities cease operations. Both human resource and capital investments are required to maintain compliance with these requirements.
United States Hazardous Waste Regulation
Our hazardous, industrial, non-hazardous and radioactive waste treatment, disposal and handling business is subject to extensive federal and state environmental, health, safety, and transportation laws, regulations, permits and licenses. Local government controls may also apply. The responsible government regulatory agencies regularly inspect our operations to monitor compliance. They have authority to enforce compliance through the suspension or revocation of operating licenses and permits and the imposition of civil or criminal penalties in case of violations. We believe that these laws and regulations, as well as the specialized services we provide, contribute to demand and create barriers to new competitors seeking to enter the markets we serve.
RCRA provides a comprehensive framework for regulating hazardous waste transportation, treatment, storage and disposal. RCRA regulation is the responsibility of the USEPA, which may delegate authority to state agencies. Chemical compounds and residues derived from USEPA-listed industrial processes are subject to RCRA standards unless they are delisted through rulemaking. RCRA liability may be imposed for improper waste management or failure to take corrective action for releases of hazardous substances. To the extent wastes are recycled or beneficially reused, regulatory controls and permitting requirements under RCRA diminish. LARM and NORM/NARM may also be managed to varying degrees under RCRA permits, as is authorized for our facilities in Grand View, Idaho; Beatty, Nevada; Belleville, Michigan and Robstown, Texas.
CWA legislation prohibits discharge of pollutants into the waters of the United States without governmental authorization and regulates the discharge of pollutants into surface waters and sewers from a variety of sources, including disposal sites and treatment facilities. The USEPA has promulgated "pretreatment" regulations under the CWA, which establish pretreatment standards for introduction of pollutants into publicly owned treatment works. In the course of the treatment process, our wastewater treatment facilities generate wastewater, which we discharge to publicly owned treatment works pursuant to permits issued by the appropriate governmental authority. We are required to obtain discharge permits and conduct sampling and monitoring programs.
CERCLA and its amendments impose strict, joint and several liability on owners or operators of facilities where a release of hazardous substances has occurred, on parties who generated hazardous substances released at such facilities and on parties who arranged for the transportation of hazardous substances. Liability under CERCLA may be imposed if releases of hazardous substances occur at treatment, storage or disposal sites. Since waste generators, transporters and those who arrange transportation are subject to the same liabilities, we believe they are motivated to minimize the number of disposal sites used. In addition, hazardous waste generated during the remediation of CERCLA cleanup projects and transferred offsite must be managed by a treatment and disposal facility authorized by EPA to manage CERCLA waste.
TSCA regulates the treatment, storage and disposal of PCBs. U.S. regulation and licensing of PCB wastes is the responsibility of the USEPA. Our Grand View, Idaho and Beatty, Nevada facilities have TSCA treatment, storage and disposal permits. Our Belleville, Michigan facility has a TSCA disposal permit. Our
15
Robstown, Texas facility has a TSCA storage permit and may dispose of PCB-contaminated waste in limited concentrations not requiring a TSCA disposal permit.
The AEA assigns the NRC regulatory authority over receipt, possession, use and transfer of certain radioactive materials, including disposal. The NRC has adopted regulations for licensing commercial LLRW disposal and has delegated regulatory authority to certain states including Washington, where our Richland facility is located. The NRC and U.S. Department of Transportation regulate the transport of radioactive materials. Shippers must comply with both the general requirements for hazardous materials transportation and specific requirements for transporting radioactive materials.
The Energy Policy Act of 2005 amended the AEA to classify discrete (i.e. concentrated versus diffuse) NORM/NARM as byproduct material. The law does not apply to interstate Compacts ratified by Congress pursuant to the LLRW Policy Act.
Canadian Hazardous Waste Regulation
The Canadian federal government regulates issues of national scope where activities cross provincial boundaries and affect Canada's relations with other nations. The Provinces retain control over environmental matters within their boundaries including primary responsibility for regulation and management of hazardous waste.
The main federal laws governing hazardous waste management are CEPA and the Transportation of Dangerous Goods Act. Environment and Climate Change Canada is the federal agency with responsibility for environmental matters. CEPA charges Environment Canada and Health Canada with the protection of human health and the environment and seeks to control the production, importation and use of substances in Canada and their impact on the environment. The Export and Import of Hazardous Waste Regulations under CEPA govern trans-border movement of hazardous waste and hazardous recyclable materials. These regulations require that anyone proposing to export or import hazardous waste or hazardous recyclable materials or transport them through Canada notify the Minister of the Environment and obtain a permit to do so.
Our Stablex facility is located in Blainville, Québec, Canada and is subject to QEQA. This Act, independently developed by the Province, regulates the generation, characterization, transport, treatment and disposal of hazardous wastes. QEQA also provides for the establishment of waste management facilities which are controlled by the provincial statutes and regulations governing releases to air, groundwater and surface water.
Our Tilbury, Ontario, Canada facility is subject to Regulation 347 of the Ontario Environmental Protection Act. Regulation 347, independently developed by the Province, regulates the collection, storage, transportation, treatment, recovery and disposal of hazardous wastes.
Waste transporters require a permit to operate under the Province's regulations and are also subject to the requirements of the Federal Transportation of Dangerous Goods law which requires reporting of quantities and disposition of materials shipped.
A major difference between the United States regulatory regime and that in Canada relates to ownership and liability. Under Canadian federal regulation, ownership changes when waste is transferred to a properly permitted third-party carrier and subsequently to an approved treatment and disposal facility. As a result, the generator is no longer liable for proper handling, treatment or disposal. In the United States, joint and several liability is retained by the waste generator as well as the transporter and the treatment and disposal facility.
16
Insurance, Financial Assurance and Risk Management
We carry a broad range of insurance coverage, including general liability, automobile liability, real and personal property, workers compensation, directors and officers liability, environmental impairment liability and other coverage customary to the industry. We do not expect the impact of any known casualty, property, environmental or other contingency to be material to our financial condition, results of operations or cash flows.
As noted above, applicable regulations require financial assurance to cover the cost of final closure and post-closure obligations at certain of our operating and non-operating disposal facilities. Acceptable forms of financial assurance include third-party standby letters of credit, surety bonds and insurance. Alternatively, we may be required to collect fees from waste generators to fund dedicated, state-controlled escrow or trust accounts during the operating life of the facility. Through December 31, 2016, we have met our financial assurance requirements through insurance, surety bonds, standby letters of credit and self-funded restricted trusts.
Insurance policies covering our U.S. closure and post-closure obligations expire in December 2017. While we expect to timely renew these policies as we have in the past, if we are unable to obtain adequate closure, post-closure or environmental insurance, any partial or completely uninsured claim against us, if successful, could have a material adverse effect on our financial condition, results of operations and cash flows. Failure to maintain adequate financial assurance could also result in regulatory action including early closure of facilities. As of December 31, 2016, we have provided collateral of $5.8 million in funded trust agreements, $12.0 million in surety bonds, issued $2.7 million in letters of credit for financial assurance and have insurance policies of approximately $81.6 million for closure and post-closure obligations. Financial assurance, premium and collateral cost requirement increases may have an adverse impact on our results of operations.
We maintain a surety bond for closure costs associated with the Blainville facility. Our lease agreement with the Province of Québec requires that the surety bond be maintained for 25 years after the lease expires. At December 31, 2016 we had $686,000 in commercial surety bonds dedicated for closure obligations.
Primary casualty insurance programs generally do not cover accidental environmental contamination losses. To provide insurance protection for potential claims, we maintain pollution legal liability insurance and professional environmental consultant's liability insurance for non-nuclear occurrences. For nuclear liability coverage, we maintain Facility Form and Workers' Form nuclear liability insurance provided under the federal Price Anderson Act. This insurance covers the operations of our facilities, suppliers and transporters. We purchase primary property, casualty and excess liability policies through traditional third-party insurance carriers.
Significant Customers
No customer accounted for more than 10% of total revenue for the years ended December 31, 2016 or 2015. Revenue from a single customer accounted for approximately 10% of total revenue for the year ended December 31, 2014.
Geographical Information
For the year ended December 31, 2016, we derived $428.8 million or 90% of our revenue in the United States and $48.9 million or 10% of our revenue in Canada. For the year ended December 31, 2015, we derived $521.1 million or 93% of our revenue in the United States and $42.0 million or 7% of our revenue in Canada. For the year ended December 31, 2014, we derived $388.1 million or 87% of our revenue in the United States and $59.3 million or 13% of our revenue in Canada. Additional information about the geographical areas in which our revenues are derived and in which our assets are located is presented in
17
Note 20 to the Consolidated Financial Statements in "Part II, Item 8. Financial Statements and Supplementary Data" of this Annual Report on Form 10-K.
Seasonal Effects
Seasonal fluctuations due to weather and budgetary cycles can influence the timing of customer spending for our services. Typically, in the first quarter of each calendar year there is less demand for our services due to reduced construction activities related to weather. While large, multi-year cleanup projects may continue in winter months, the pace of waste shipments may be slower, or stop temporarily, due to weather. Market conditions and federal funding decisions generally have a greater influence on the business than seasonality.
Personnel
On December 31, 2016, we had approximately 1,450 employees, of which approximately 200 in the United States and 100 in Canada were represented by various labor unions.
Executive Officers of Registrant
The following table sets forth the names, ages and titles, as well as a brief account of the business experience of each person who is currently an executive officer of US Ecology:
Name
|
Age | Title | |||
|---|---|---|---|---|---|
Jeffrey R. Feeler |
47 | President and Chief Executive Officer | |||
Simon G. Bell |
46 | Executive Vice President and Chief Operating Officer | |||
Eric L. Gerratt |
46 | Executive Vice President, Chief Financial Officer and Treasurer | |||
Steven D. Welling |
58 | Executive Vice President of Sales and Marketing | |||
Jeffrey R. Feeler was appointed President and Chief Executive Officer in May 2013. Mr. Feeler was previously the Company's senior executive as President and Chief Operating Officer from October 2012 to May 2013 and as the Company's Vice President and Chief Financial Officer from May 2007 to October 2012. He joined US Ecology in 2006 as Vice President, Controller, Chief Accounting Officer, Treasurer and Secretary. He previously held financial and accounting management positions with MWI Veterinary Supply, Inc., Albertson's, Inc. and Hewlett-Packard Company. From 1993 to 2002, he held various accounting and auditing positions for PricewaterhouseCoopers LLP. Mr. Feeler is a Certified Public Accountant and holds a BBA of Accounting and a BBA of Finance from Boise State University.
Simon G. Bell was appointed Executive Vice President and Chief Operating Officer in November 2016. Mr. Bell previously served as the Company's Executive Vice President of Operations, Environmental Services from June 2014 to November 2016. From May 2013 to June 2014, he was Executive Vice President of Operations and Technology Development. From August 2007 to May 2013, he was Vice President of Operations. From 2005 to August 2007, he was Vice President of Hazardous Waste Operations. From 2002 to 2005, he was our Idaho facility General Manager and Environmental Manager. His 20 years of industry experience includes service as general manager of a competitor disposal facility and mining industry experience in Idaho, Nevada and South Dakota. He holds a BS in Geology from Colorado State University.
Eric L. Gerratt was appointed Executive Vice President, Chief Financial Officer and Treasurer in May 2013. Mr. Gerratt previously served as the Company's Vice President, Chief Financial Officer, Treasurer and Chief Accounting Officer from October 2012 to May 2013. He joined US Ecology in August 2007 as Vice President and Controller. He previously held various financial and accounting management positions at SUPERVALU, Inc. and Albertson's, Inc. From 1997 to 2003, he held various accounting and auditing positions for PricewaterhouseCoopers LLP. Mr. Gerratt is a Certified Public Accountant and holds a BS in Accounting from the University of Idaho.
18
Steven D. Welling was appointed Executive Vice President of Sales and Marketing in May 2013. Mr. Welling previously served as the Company's Senior Vice President, Sales and Marketing from January 2010 to May 2013. He joined US Ecology in 2001 through the Envirosafe Services of Idaho acquisition. He previously served as National Accounts Manager for Envirosource Technologies and Western Sales Manager for Envirosafe Services of Idaho and before that managed new market development and sales for a national bulk chemical transportation company. Mr. Welling holds a BS from California State University-Stanislaus.
In addition to the factors discussed elsewhere in this Form 10-K, the following are important factors which could cause actual results or events to differ materially from those contained in any forward-looking statements made by or on behalf of us.
Risks Affecting All of Our Businesses
The completion of, loss of or failure to renew one or more significant contracts could adversely affect our profitability.
We provide disposal and transportation services to customers on discrete Event Business (non-recurring project based work) which varies widely in size, duration and unit pricing. Some of these multi-year projects can account for a significant portion of our revenue and profit. The replacement of 2016 Event Business revenue and earnings depends on multiple factors, many of which are outside of our control including, but not limited to, general and industry-specific economic conditions, capital in the commercial credit markets, general level of government funding on environmental matters, real estate development and other industrial investment opportunities. Our inability to replace the contribution from 2016 Event Business projects with new business could result in a material adverse effect on our financial condition and results of operations.
Our market is highly competitive. Failure to compete successfully could have a material adverse effect on our business, financial condition and results of operations.
We face competition from companies with greater resources than us, companies with closer geographic proximity to waste sites, companies with service offerings we do not provide and companies that can provide lower pricing than we can in certain instances. An increase in the number or location of commercial treatment or disposal facilities for hazardous or radioactive waste, significant expansion of existing competitor permitted capabilities, acquisitions by competitors or a decrease in the treatment or disposal fees charged by competitors could materially and adversely affect our results of operations. Our business is also heavily affected by waste disposal fees imposed by government agencies. These fees, which vary from state to state and are periodically adjusted, may adversely impact the competitive environment in which we operate.
Adverse economic conditions, government funding or competitive pressures affecting our customers could harm our business.
We serve oil refineries, chemical production plants, steel mills, real estate developers, waste brokers/aggregators serving small manufacturers and other industrial customers that are, or may be, affected by changing economic conditions and competition. These customers may be significantly impacted by deterioration in the general economy and may curtail waste production and/or delay spending on plant maintenance, waste cleanup projects and other discretionary work. Spending by government customers may also be reduced or temporarily suspended due to declining tax revenues that may result from a general deterioration in economic conditions or other federal or state fiscal policy. Factors that can impact general economic conditions and the level of spending by customers include the general level of consumer and industrial spending, increases in fuel and energy costs, residential and commercial real estate and mortgage
19
market conditions, labor and healthcare costs, access to credit, consumer confidence and other macroeconomic factors affecting spending behavior. Market forces may also compel customers to cease or reduce operations, declare bankruptcy, liquidate or relocate to other countries, any of which could adversely affect our business.
Our operations are significantly affected by the commencement and completion of large and small cleanup projects; potential seasonal fluctuations due to weather; budgetary decisions and cash flow limitations influencing the timing of customer spending for remedial activities; the timing of regulatory agency decisions and judicial proceedings; changes in government regulations and enforcement policies and other factors that may delay or cause the cancellation of cleanup projects. We do not control such factors, which can cause our revenue and income to vary significantly from quarter to quarter and year to year.
If we fail to comply with applicable laws and regulations our business could be adversely affected.
The changing regulatory framework governing our business creates significant risks. We could be held liable if our operations cause contamination of air, groundwater or soil or expose our employees or the public to contamination. Under current law, we may be held liable for damage caused by conditions that existed before we acquired the assets or operations involved. Also, we may be liable if we arrange for the transportation, disposal or treatment of hazardous substances that cause environmental contamination at facilities operated by others, or if a predecessor made such arrangements and we are a successor. Liability for environmental damage could have a material adverse effect on our financial condition, results of operations and cash flows.
Stringent regulations of federal, state or provincial governments have a substantial impact on our business. Local government controls may also apply. Many complex laws, rules, orders and regulatory interpretations govern environmental protection, health, safety, noise, visual impact, odor, land use, zoning, transportation and related matters. Failure to obtain on a timely basis or comply with applicable federal, state, provincial and local governmental regulations, licenses, permits or approvals for our waste treatment and disposal facilities could prevent or restrict our ability to provide certain services, resulting in a potentially significant loss of revenue and earnings. Changes in environmental regulations may require us to make significant capital or other expenditures, or limit operations. Changes in laws or regulations or changes in the enforcement or interpretation of existing laws, regulations or permitted activities may require us to modify existing operating licenses or permits, or obtain additional approvals or limit operations. New governmental requirements that raise compliance standards or require changes in operating practices or technology may impose significant costs and/or limit operations.
Our revenue is primarily generated as a result of requirements imposed on our customers under federal, state, and provincial laws and regulations to protect public health and the environment. If requirements to comply with laws and regulations governing management of PCB, hazardous or radioactive waste were relaxed or less vigorously enforced, demand for our services could materially decrease and our revenues and earnings could be significantly reduced.
Failure to realize the anticipated benefits and operational performance from previously acquired operations could lead to an impairment of goodwill or other intangible assets.
As a result of acquisitions in 2016, 2014, 2012 and 2010, we have goodwill of $193.6 million and indefinite-lived intangible assets of $51.8 million at December 31, 2016. We are required to test goodwill and intangible assets with indefinite useful lives at least annually to determine if impairment has occurred. The testing of goodwill and other intangible assets for impairment requires us to make significant estimates about future performance and cash flows, as well as other assumptions. These estimates can be affected by numerous factors, including potential changes in economic, industry or market conditions, changes in laws or regulations, changes in business operations, changes in competition or changes in our stock price and market capitalization. Changes in these factors, or changes in actual performance compared with estimates
20
of our future performance, may affect the fair value of goodwill or other intangible assets, which may result in an impairment charge.
Estimates of the future performance of our reporting units assume a certain level of revenue and earnings growth over the projection period. The projected revenue and earnings growth is based on various factors and assumptions that we consider to be reasonable, including, but not limited to, growth in the industries served by the Field Services and Resource Recovery reporting units, successful implementation of our business and marketing strategies for these reporting units and continuing favorable market conditions for the customers we serve. Should any of these assumptions turn out not to be true and the projected growth not occur for these or other reasons, or the reporting units otherwise fail to meet their current financial plans, or there are changes to any other key assumptions used in the estimates, the financial performance of these reporting units could result in a future goodwill impairment.
We cannot accurately predict the amount and timing of any impairment of assets. Should the value of goodwill or other intangible assets become impaired as a result of a failure to realize the anticipated benefits and operational performance of acquired operations, our financial condition and results of operations could be adversely impacted.
Our indebtedness may limit the amount of cash flow available to invest in the ongoing needs of our business, and our Credit Agreement restricts our ability to engage in certain corporate and financial transactions.
On June 17, 2014 we entered into a new $540.0 million senior secured credit agreement (the "Credit Agreement") with a syndicate of banks, which substantially increased our outstanding indebtedness. As of December 31, 2016, we had total indebtedness of $285.2 million, comprised entirely of outstanding borrowings under the Credit Agreement. Our Credit Agreement requires us to dedicate a portion of our cash flow from operations to payments on our indebtedness, potentially reducing the availability of our cash flow to fund working capital, capital expenditures, development activity, acquisitions, and other general corporate purposes; increases our vulnerability to adverse general economic or industry conditions; makes us more vulnerable to increases in interest rates, as borrowings under our senior secured credit facilities are at variable rates; and limits our ability to obtain additional financing in the future for working capital or other purposes.
In addition, the Credit Agreement and related ancillary agreements with our lenders contain certain covenants that, among other things, restrict our ability to incur additional indebtedness, pay dividends and make other restricted payments, repurchase shares of outstanding stock, create certain liens and engage in certain types of transactions. Our ability to borrow under the Credit Agreement depends upon our compliance with the restrictions contained in the Credit Agreement and events beyond our control could affect our ability to comply with these covenants.
Failure to perform under our contracts may adversely harm our business.
Certain contracts require us to meet specified performance criteria. Our ability to meet these criteria requires that we expend significant resources. If we or our subcontractors are unable to perform as required, we could be subject to substantial monetary penalties and/or loss of the affected contracts which may adversely affect our business.
Loss of key management or sales personnel could harm our business.
We have an experienced management team including general managers at our operating facilities and rely on the continued service of these senior managers to achieve our objectives. Our objective is to retain our present management and sales teams and identify, hire, train, motivate and retain other highly skilled personnel. The loss of any key management employee or sales personnel could adversely affect our business and results of operations.
21
A change or deterioration in labor relations could disrupt our business or increase costs, which could have a material adverse effect on our business, financial condition and results of operations.
The Company is a party to collective bargaining agreements covering approximately 300, or approximately 21%, of our employees. The agreements expire on April 30, 2017, May 31, 2018 and November 30, 2020, respectively. While we believe the Company will maintain good working relations with its employees on acceptable terms, there can be no assurance that we will be able to negotiate the terms of future agreements in a manner acceptable to the Company. Potential work disruptions from labor disputes may disrupt our businesses and adversely affect our financial condition and results of operations.
Our participation in multi-employer pension plans may subject us to liabilities that could materially adversely affect our liquidity, cash flows and results of operations.
Certain of the Company's wholly-owned subsidiaries participate in multi-employer defined benefit pension plans under the terms of collective bargaining agreements covering most of the subsidiaries' union employees. To the extent that those plans are underfunded, the Employee Retirement Income Security Act of 1974, as amended by the Multi-Employer Pension Plan Amendments Act of 1980 ("ERISA"), may subject us to substantial liabilities if we withdraw from such multi-employer plans or if they are terminated. Under current law regarding multi-employer defined benefit plans, a plan's termination, an employer's voluntary partial or complete withdrawal from, or the mass withdrawal of all contributing employers from, an underfunded multi-employer defined benefit plan requires participating employers to make payments to the plan for their proportionate share of the multi-employer plan's unfunded vested liabilities. Furthermore, the Pension Protection Act of 2006 added new funding rules generally applicable to plan years beginning after 2007 for multi-employer plans that are classified as "endangered," "seriously endangered," or "critical" status. If plans in which we participate are in critical status, benefit reductions may apply and/or we could be required to make additional contributions. Contributions to these funds could also increase as a result of future collective bargaining with the unions, a shrinking contribution base as a result of the insolvency of other companies who currently contribute to these funds, failure of the Plan to meet ERISA's minimum funding requirements, lower than expected returns on pension fund assets, or other funding deficiencies. Any of the foregoing events could materially adversely affect our liquidity, cash flows and results of operations.
Based upon the information available to us from plan administrators as of April 30, 2016, certain of the multi-employer pension plans in which we participate are underfunded. The Pension Protection Act requires that underfunded pension plans improve their funding ratios within prescribed intervals based on the level of their underfunding. In addition, if a multi-employer defined benefit plan fails to satisfy certain minimum funding requirements, the Internal Revenue Service may impose a nondeductible excise tax of 5% on the amount of the accumulated funding deficiency for those employers contributing to the fund. We have been notified that certain plans to which our subsidiaries contribute are in "critical" status and these plans may require additional contributions in the form of a surcharge on future benefit contributions required for future work performed by union employees covered by these plans. As a result, we expect our required contributions to these plans to increase in the future. The amount of additional funds we may be obligated to contribute in the future cannot be estimated, as such amounts will be based on future levels of work that require the specific use of the union employees covered by these plans, investment returns and the level of underfunding of such plans.
We may not be able or willing to pay future dividends.
Our ability to pay dividends is subject to our future financial condition and certain conditions such as continued compliance with covenants contained in our Credit Agreement. Our Board of Directors must also approve any dividends at their sole discretion. Pursuant to our Credit Agreement, we may only declare quarterly or annual dividends if on the date of declaration, no event of default has occurred and no other event or condition has occurred that would constitute an event of default due to the payment of the
22
dividend. Unforeseen events or situations could cause non-compliance with these covenants, or cause the Board of Directors to discontinue or reduce the amount of any future dividend payment.
Future stock issuances could adversely affect common stock ownership interest and rights in comparison with those of other security holders.
Our board of directors has the authority to issue additional shares of common stock or preferred stock without stockholder approval. If additional funds are raised through the issuance of equity or securities convertible into common stock, or we use shares of our common stock to pay a portion of the purchase price in any future acquisition, the percentage of ownership of our existing stockholders would be reduced, and these newly issued securities may have rights, preferences or privileges senior to those of existing stockholders. If we issue additional common stock or securities convertible into common stock, such issuance would reduce the proportionate ownership and voting power of each other stockholder. In addition, such stock issuances might result in a reduction of the book value of our common stock.
Anti-takeover provisions in our organizational documents and under Delaware law may impede or discourage a takeover, which could cause the market price of our common stock to decline.
We are a Delaware corporation, and the anti-takeover provisions of Delaware law impose various impediments to the ability of a third party to acquire control of us, even if a change in control would be beneficial to our existing stockholders, which, under certain circumstances, could reduce the market price of our common stock. In addition, protective provisions in our Restated Certificate of Incorporation and Amended and Restated Bylaws or the implementation by our Board of Directors of a stockholder rights plan could prevent a takeover, which could harm our stockholders.
The price of our common stock has fluctuated in the past and this may make it difficult for stockholders to resell shares of common stock at times or may make it difficult for stockholders to sell shares of common stock at prices they find attractive.
The trading price of our common stock may fluctuate widely as a result of a number of factors, many of which are outside our control. In addition, the stock market is subject to fluctuations in share prices and trading volumes that affect the market prices of the shares of many companies. These broad market fluctuations have adversely affected, and may in the future adversely affect, the market price of our common stock. Among the factors that could affect our stock price are:
- •
- changes in financial estimates and buy/sell recommendations by securities analysts or our failure to meet analysts' revenue or earnings
estimates;
- •
- actual or anticipated variations in our operating results;
- •
- our earnings releases and financial performance;
- •
- market conditions in our industry and the general state of the securities markets;
- •
- fluctuations in the stock price and operating results of our competitors;
- •
- actions by institutional stockholders;
- •
- investor perception of us and the industry and markets in which we operate;
- •
- general economic conditions in the United States and Canada;
- •
- international disorder and instability in foreign financial markets, including but not limited to potential sovereign defaults; and
- •
- other factors described in "Risk Factors."
23
A cybersecurity incident could negatively impact our business and our relationships with customers.
We use computers in substantially all aspects of our business operations. We also use mobile devices and other online activities to connect with our employees and our customers. Such uses of technology give rise to cybersecurity risks, including security breach, espionage, system disruption, theft and inadvertent release of information. Our business involves the storage and transmission of numerous classes of sensitive and/or confidential information and intellectual property, including customers' personal information, private information about employees, and financial and strategic information about the Company and its business partners. Further, if the Company in the future pursues acquisitions or new initiatives that require expanding or improving our information technologies, this may result in a larger technological presence and corresponding exposure to cybersecurity risk. If we fail to assess and identify cybersecurity risks associated with acquisitions and new initiatives, we may become increasingly vulnerable to such risks. Further, despite these security measures, the Company's computer systems and infrastructure may be vulnerable to attacks by hackers or breached due to employee error, malfeasance, or other disruptions. Additionally, while we have implemented measures to prevent security breaches and cyber incidents, our preventative measures and incident response efforts may not be entirely effective. The theft, destruction, loss, misappropriation, or release of sensitive and/or confidential information or intellectual property, or interference with our information technology systems or the technology systems of third parties on which we rely, could result in business disruption, negative publicity, brand damage, violation of privacy laws, loss of customers, potential liability and competitive disadvantage.
Additional Risks of Our Environmental Services Business
A significant portion of our business depends upon non-recurring event cleanup projects over which we have no control.
A significant portion of our disposal revenue is attributable to discrete Event Business which varies widely in size, duration and unit pricing. For the year ended December 31, 2016, approximately 18% of our T&D revenue was derived from Event Business projects. The one-time nature of Event Business, diverse spectrum of waste types received and widely varying unit pricing necessarily creates variability in revenue and earnings. This variability may be influenced by general and industry-specific economic conditions, funding availability, changes in laws and regulations, government enforcement actions or court orders, public controversy, litigation, weather, commercial real estate, closed military bases and other project timing, government appropriation and funding cycles and other factors. This variability can cause significant quarter-to-quarter and year-to-year differences in revenue, gross profit, gross margin, operating income and net income. Also, while we pursue many large projects months or years in advance of work performance, both large and small cleanup project opportunities routinely arise with little or no prior notice. These market dynamics are inherent to the waste disposal business and are factored into our projections and externally communicated business outlook statements. Our projections combine historical experience with identified sales pipeline opportunities, new or expanded service line projections and prevailing market conditions. A reduction in the number and size of new cleanup projects won to replace completed work could have a material adverse effect on our financial condition and results of operations.
If we are unable to obtain regulatory approvals and contracts for construction of additional disposal space by the time our current disposal capacity is exhausted, our business would be adversely affected.
Construction of new disposal capacity at our operating disposal facilities beyond currently permitted capacity requires state and provincial regulatory agency approvals. Administrative processes for such approval reviews vary. The State of Texas, which regulates our Robstown facility, provides for an adjudicatory hearing process administered by a hearing officer appointed by the State. There can be no assurance that we will be successful in obtaining future expansion approvals in a timely manner or at all. If we are not successful in receiving these approvals, our disposal capacity could eventually be exhausted,
24
preventing us from accepting additional waste at an affected facility. This would have a material adverse effect on our business.
If we are unable to renew our operating permits or lease agreements with regulatory bodies, our business would be adversely affected.
Our facilities operate using permits and licenses issued by various regulatory bodies at various state, provincial and federal government levels. In addition, three of our facilities operate on land leased from government agencies. Failure to renew our permits and licenses necessary to operate our facilities or failure to renew or maintain compliance with our site lease agreements would have a material adverse effect on our business. There can be no assurance we will continue to be successful in obtaining timely permit applications approval, maintaining compliance with our lease agreements and obtaining timely lease renewals.
Our business requires the handling of dangerous substances. Improper handling of such substances could result in an adverse impact on our financial condition and results of operations.
We are subject to unexpected occurrences related, or unrelated, to the routine handling of dangerous substances. A fire or other incident could impair the ability of one or more facilities to continue to perform normal operations, which could have a material adverse impact on our financial condition and results of operations. Improper handling of these substances could also violate laws and regulations resulting in fines and/or suspension of operations.
If we are unable to obtain at a reasonable cost or under reasonable terms and conditions the necessary levels of insurance and financial assurances required for operations, our business and results of operations would be adversely affected.
We are required by law, license, permit and prudence to maintain various insurance instruments and financial assurances. We carry a broad range of insurance coverages that we believe are customary for a company of our size in our business. We obtain these coverages to mitigate risk of loss, allowing us to manage our self-insured exposure from potential claims. We are self-insured for employee health-care coverage. Stop-loss insurance is carried covering liability on claims in excess of $150,000 per individual or on an aggregate basis for the monthly population. Accrued costs related to the self-insured health care coverage were $1.0 million and $1.1 million at December 31, 2016 and 2015, respectively. We also maintain a Pollution and Remediation Legal Liability Policy pursuant to RCRA regulations subject to a $250,000 self-insured retention. In addition, we are insured for consultant's environmental liability subject to a $100,000 self-insured retention. We are also insured for losses or damage to third party property or people subject to a $100,000 self-insured retention. If our insurers were unable to meet their obligations, or our own obligations for claims were more than expected, there could be a material adverse effect to our financial condition and results of operation.
Through December 31, 2016, we have met our financial assurance requirements through a combination of insurance policies, commercial surety bonds and trust funds. Our insurance policies covering closure and post-closure activities expire in December 2017 for covered U.S. operating facilities (dedicated state-controlled closure and post-closure funds provide financial assurance for our Washington and Nevada facilities). We continue to use self-funded trust accounts for our post-closure obligations at our U.S. non-operating sites. We use commercial surety bonds for our Canadian operations that expire in November and December 2017, respectively. We currently have in place all financial assurance instruments necessary for our operations. While we expect to continue renewing these policies and surety bonds, if we were unable to obtain adequate closure, post-closure or environmental insurance, bonds or other instruments in the future, any partially or completely uninsured claim against us, if successful and of sufficient magnitude, could have a material adverse effect on our results of operations and cash flows. Additionally, continued access to casualty and pollution legal liability insurance with sufficient limits, at
25
acceptable terms, is important to obtaining new business. Failure to maintain adequate financial assurance could also result in regulatory action including early closure of facilities. As of December 31, 2016, we have provided collateral of $5.8 million in funded trust agreements, $12.0 million in surety bonds, issued $2.7 million in letters of credit for financial assurance and have insurance policies of approximately $81.6 million for closure and post-closure obligations at covered U.S. operating facilities. We have $686,000 in commercial surety bonds dedicated for closure obligations at our Canadian operating facility. While we believe we will be able to maintain the requisite financial assurance policies at a reasonable cost, premium and collateral requirements may materially increase. Such increases could have a material adverse effect on our financial condition and results of operations.
The hazardous and radioactive waste industries in which we operate are subject to litigation risk.
The handling of radioactive, PCBs and hazardous material subjects us to potential liability claims by employees, contractors, property owners, neighbors and others. There can be no assurance that our existing liability insurance is adequate to cover claims asserted against us or that we will be able to maintain adequate insurance in the future. Adverse rulings in judicial or administrative proceedings could also have a material adverse effect on our financial condition and results of operations.
We may not be able to obtain timely or cost effective transportation services which could adversely affect our profitability.
Revenue at each of our facilities is subject to potential risks from disruptions in rail or truck transportation services relied upon to deliver waste to our facilities. Increases in fuel costs and unforeseen events such as labor disputes, public health pandemics, severe weather, natural disasters and other acts of God, war or terror could prevent or delay shipments and reduce both volumes and revenue. Our rail transportation service agreements with our customers generally allow us to pass on fuel surcharges assessed by the railroads. This may decrease or eliminate our exposure to fuel cost increases. Transportation services may be limited by economic conditions, including increased demand for rail or trucking services, resulting in periods of slower service to the point that individual customer needs cannot be met. No assurance can be given that we can procure transportation services in a timely manner at competitive rates or pass through fuel cost increases in all cases. Such factors could also limit our ability to achieve revenue and earnings objectives.
We may not be able to effectively adopt or adapt to new or improved technologies.
We expect to continue implementing new or improved technologies at our facilities to meet customer service demands and expand our business. If we are unable to identify and implement new technologies in response to market conditions and customer requirements in a timely, cost effective manner, our financial condition and results of operations could be adversely impacted.
Our financial results could be adversely affected by foreign exchange fluctuations.
We operate in the United States and Canada but report revenue, costs and earnings in U.S. dollars. Exchange rates between the U.S. dollar and the Canadian dollar are likely to fluctuate from period to period. Because our financial results are reported in U.S. dollars, we are subject to the risk of non-cash translation losses for reporting purposes. If we continue to expand our international operations, we will conduct more transactions in currencies other than the U.S. dollar. To the extent that foreign revenue and expense transactions are not denominated in the local currency, we are further subject to the risk of transaction losses. We have not entered into derivative instruments to offset the impact of foreign exchange fluctuations. Fluctuations in foreign currency exchange rates could have a material adverse effect on our financial condition and results of operations.
26
We are subject to risks associated with operating in a foreign country.
Our Canadian subsidiaries' facilities are located in Blainville, Québec and Tilbury, Ontario, Canada and use the Canadian dollar as their functional currency. International operations are subject to risks that may have material adverse effects on our financial condition and results of operations. The risks that our international operations are subject to include, among other things:
- •
- difficulties and costs relating to staffing and managing foreign operations;
- •
- foreign labor union relations;
- •
- fluctuations in the value of the Canadian dollar;
- •
- repatriation of cash from Canadian subsidiaries to the United States;
- •
- imposition of additional taxes on our foreign income; and
- •
- regulatory, economic and public policy changes.
Additional Risks of Our Field & Industrial Services Business
A significant portion of our Field & Industrial Services segment depends upon the demand for cleanup of major spills and other remedial projects and regulatory developments over which we have no control.
A significant portion of our Field & Industrial Services segment consists of remediation, recycling, industrial cleaning and maintenance, transportation, total waste management, technical services, and emergency response services. Demand for these services can be affected by the commencement and completion of cleanup of major spills and other events, customers' decisions to undertake remedial projects, seasonal fluctuations due to weather and budgetary cycles influencing the timing of customers' spending for remedial activities, the timing of regulatory decisions relating to hazardous waste management projects, changes in regulations governing the management of hazardous waste, changes in the waste processing industry towards waste minimization and the propensity for delays in the demand for remedial services, and changes in governmental regulations relevant to our diverse operations. We do not control such factors and, as a result, our revenue and income can vary from quarter to quarter or year to year, and past financial performance may not be a reliable indicator of future performance.
Additional Risks of Completed and Potential Acquisitions
Acquisitions that we undertake could be difficult to integrate, disrupt our business, dilute stockholder value and adversely affect our results of operations.
Acquisitions involve multiple risks. Our inability to successfully integrate an acquired business could have a material adverse effect on our financial condition and results of operations. These risks include but are not limited to:
- •
- failure of the acquired company to achieve anticipated revenues, earnings or cash flows;
- •
- assumption of liabilities, including those related to environmental matters, that were not disclosed to us or that exceed our estimates;
- •
- problems integrating the purchased operations with our own, which could result in substantial costs and delays or other operational, technical
or financial problems;
- •
- potential compliance issues relating to the protection of health and the environment, compliance with securities laws and regulations, adequacy
of internal controls and other matters;
- •
- diversion of management's attention or other resources from our existing business;
27
- •
- risks associated with entering markets or product/service areas in which we have limited prior experience;
- •
- increases in working capital investment to fund the growth of acquired operations;
- •
- unexpected capital expenditures to upgrade waste handling or other infrastructure or replace equipment to operate safely and efficiently;
- •
- potential loss of key employees and customers of the acquired company; and
- •
- future write-offs of intangible and other assets, including goodwill, if the acquired operations fail to generate sufficient cash flows.
If we are not able to achieve these objectives, the anticipated benefits of the acquisition may not be realized fully, if at all, or may take longer to realize than expected. It is possible that the integration process could result in the loss of key employees, the disruption of our ongoing business, failure to implement the business plan for the combined businesses, unanticipated issues in integrating service offerings, logistics information, communications and other systems or other unanticipated issues, expenses and liabilities, any or all of which could adversely affect our ability to maintain relationships with customers and employees or to achieve the anticipated benefits of the acquisition.
In the event that we undertake future acquisitions, we may not be able to successfully execute our acquisition strategy.
We may experience delays in making acquisitions or be unable to make acquisitions we desire for a number of reasons. Suitable acquisition candidates may not be available at purchase prices that are attractive to us or on terms that are acceptable to us. In pursuing acquisition opportunities, we typically compete with other companies, some of which have greater financial and other resources than we do. We may not have available funds or common stock with a sufficient market price to complete an acquisition. If we are unable to secure sufficient funding for potential acquisitions, we may not be able to complete acquisitions that we otherwise find advantageous.
The timing and number of acquisitions we pursue may cause volatility in our financial results.
We are unable to predict the size, timing and number of acquisitions we may complete, if any. In addition, we may incur expenses associated with sourcing, evaluating and negotiating acquisitions (including those that are not completed), and we also may pay fees and expenses associated with financing acquisitions to investment banks and others. Any of these amounts may be substantial, and together with the size, timing and number of acquisitions we pursue, may negatively impact and cause significant volatility in our financial results and the price of our common stock.
ITEM 1B. UNRESOLVED STAFF COMMENTS
None.
28
The following table describes our principal physical properties and facilities at December 31, 2016 owned or leased by us. We believe that our existing properties are in good condition and suitable for conducting our business.
Location
|
Segment | Function | Own/Lease | |||
|---|---|---|---|---|---|---|
Beatty, Nevada |
Environmental Svcs. | Waste treatment and landfill disposal | Lease | |||
Robstown, Texas |
Environmental Svcs. | Waste treatment and landfill disposal | Own | |||
Grand View, Idaho |
Environmental Svcs. | Waste treatment and landfill disposal | Own | |||
Belleville, Michigan |
Environmental Svcs. | Waste treatment and landfill disposal | Own | |||
Blainville, Québec, Canada |
Environmental Svcs. | Waste treatment and landfill disposal | Own/Lease | |||
Richland, Washington |
Environmental Svcs. | Landfill disposal | Sublease | |||
Detroit, Michigan |
Environmental Svcs. | Waste treatment | Own | |||
Canton, Ohio |
Environmental Svcs. | Waste treatment | Own | |||
Harvey, Illinois |
Environmental Svcs. | Waste treatment | Own | |||
York, Pennsylvania |
Environmental Svcs. | Waste treatment | Own | |||
Tulsa, Oklahoma |
Environmental Svcs. | Waste treatment | Own | |||
Romulus, Michigan |
Environmental Svcs. | Waste treatment | Own | |||
Mt. Airy, North Carolina |
Environmental Svcs. | Waste treatment | Own | |||
Tilbury, Ontario, Canada |
Environmental Svcs. | Waste treatment | Own | |||
Vernon, California |
Environmental Svcs. | Waste treatment | Own | |||
Sulligent, Alabama |
Field & Industrial Svcs. | Field and industrial waste management | Own | |||
Tampa, Florida |
Field & Industrial Svcs. | Field and industrial waste management | Own | |||
Taylor, Michigan |
Field & Industrial Svcs. | Field and industrial waste management | Own | |||
Bayonne, New Jersey |
Field & Industrial Svcs. | Field and industrial waste management | Lease | |||
Atlanta, Georgia |
Field & Industrial Svcs. | Field and industrial waste management | Lease | |||
Wrentham, Massachusetts |
Field & Industrial Svcs. | Field and industrial waste management | Own | |||
Boise, Idaho |
Corporate | Corporate Office | Lease | |||
Livonia, Michigan |
Corporate | Regional Office | Lease |
In addition to the principal physical properties detailed in the table above, the Company owns or leases a number of smaller (less than 20,000 sq. ft.) properties supporting our Field & Industrial Services segment.
The following table provides additional information for our treatment facilities with onsite landfills including total acreage owned or controlled by us at each facility, estimated amount of permitted airspace available at each facility, the estimated amount of non-permitted airspace and the estimated life at each facility. All estimates are as of December 31, 2016.
Location
|
Total Acreage |
Permitted Airspace (Cubic Yards) |
Non-Permitted Airspace (Cubic Yards) |
Estimated Life (Years) |
||||||
|---|---|---|---|---|---|---|---|---|---|---|
Beatty, Nevada(1) |
480 | 8,826,464 | — | 51 | ||||||
Robstown, Texas(2) |
873 | 1,003,649 | — | 6 | ||||||
Grand View, Idaho(3) |
1,411 | 10,476,524 | 18,100,000 | 160 | ||||||
Belleville, Michigan(4) |
455 | 12,230,638 | — | 39 | ||||||
Blainville, Québec, Canada(5) |
350 | 6,342,357 | — | 28 | ||||||
Richland, Washington(6) |
100 | 646,768 | — | 39 | ||||||
| | | | | | | | | | | |
Total |
39,526,400 | 18,100,000 | ||||||||
| | | | | | | | | | | |
| | | | | | | | | | | |
| | | | | | | | | | | |
- (1)
- Our Beatty, Nevada facility, which began receiving hazardous waste in 1970, is located in the Amargosa Desert approximately 120 miles northwest of Las Vegas, Nevada and approximately 30 miles east of Death Valley, California. The facility operates through an operating agreement with the State of Nevada on 480 acres owned by the State. In 2016, the facility secured permit modifications from the Nevada Division of Environmental Protection and the USEPA authorizing the construction of a new landfill unit at the facility. The first phase of this new landfill is anticipated to be
29
completed in early 2017. In April 2007, we renewed our lease with the State of Nevada as a year-to-year periodic tenancy until (i) that area reaches full capacity and can no longer accept waste (an estimated life of 51 years using 2016 volume); (ii) the lease is terminated by us at our option; or (iii) the State terminates the lease due to our breach of the lease terms. The State of Nevada assesses disposal fees to fund a dedicated trust account to pay for future closure and post-closure costs.
- (2)
- Our
Robstown, Texas facility began operations in 1973. It is located on 240 acres owned by the Company approximately 10 miles west of Corpus Christi, Texas. We own
an additional 633 acres of adjacent land for future expansion. We also own 174 acres of land five miles west of the facility adjacent to a rail line where we have operated a rail transfer station
since 2006. We are currently working with the Texas Commission of Environmental Quality to permit 180 acres of adjacent land that we anticipate will add approximately 10 million cubic yards, or
30 years, of future airspace. We expect our permit to be approved in 2017.
- (3)
- Our
Grand View, Idaho facility, purchased in 2001, is located on 1,252 acres of Company-owned land approximately 60 miles southeast of Boise, Idaho in the Owyhee
Desert. We own an additional 159 acres approximately two miles east of the facility that provides a clay source for site operations (liner construction and waste treatment). We also own 189 acres
where our rail transfer station is located approximately 30 miles northeast of the disposal facility. This site has two enclosed rail-to-truck waste transfer facilities located adjacent to the main
line of the Union Pacific Railroad.
- (4)
- Our
Belleville, Michigan facility began operations in 1957 and began disposing of waste in the onsite landfill in 1969. The facility is located on 455 acres owned by
the Company approximately 30 miles from Detroit, Michigan. We also own 12 acres of land nine miles from the facility adjacent to a rail line where we have operated a rail transfer station since 1998.
- (5)
- Our
Blainville, Québec, Canada facility has been in operation since 1983 and is located approximately 30 miles northwest of Montreal,
Québec, Canada. The facility includes an indoor hazardous and industrial waste treatment and storage facility and a rail transfer station located on 25 acres adjacent to a 325 acre
disposal site. The treatment processing facility is on land owned by the Company. The disposal site which is adjacent to the owned treatment processing facility is leased from the Province of
Québec with a term through 2018 and one five-year renewal option. The site is permitted to accept up to 875,000 metric tons (962,500 U.S. tons) over the five-year permit period. Of this
amount, up to 350,000 metric tons (385,000 U.S. tons) can be accepted as soil. While there are no specific restrictions on waste soils received from the U.S., non-soil waste received from the U.S. is
limited to 350,000 metric tons (385,000 U.S. tons) over the five-year permit period. The Province assesses fees to fund a dedicated government trust account to pay for post-closure costs at the
disposal site.
- (6)
- Our Richland, Washington LLRW facility has been in operation since 1965 and is located on 100 acres of land leased by the State of Washington from the federal government on the U.S. Department of Energy Hanford Reservation approximately 35 miles west of Richland, Washington. We sublease this property from the State of Washington. The lease between the State of Washington and the federal government expires in 2063. We renewed our sublease with the State in 2005 for ten years with four ten-year renewal options, giving us control of the property until the year 2055 provided that we meet our obligations and operate in a compliant manner. The facility's intended operating life is equal to the period of the sublease. The State assesses user fees for local economic development, state regulatory agency expenses and a dedicated trust account to pay for long-term care after the facility closes. The State maintains separate, dedicated trust funds for future closure and post-closure costs.
30
In the ordinary course of business, we are involved in judicial and administrative proceedings involving federal, state, provincial or local governmental authorities, including regulatory agencies that oversee and enforce compliance with permits. Fines or penalties may be assessed by our regulators for non-compliance. Actions may also be brought by individuals or groups in connection with permitting of planned facilities, modification or alleged violations of existing permits, or alleged damages suffered from exposure to hazardous substances purportedly released from our operated sites, as well as other litigation. We maintain insurance intended to cover property and damage claims asserted as a result of our operations. Periodically, management reviews and may establish reserves for legal and administrative matters, or other fees expected to be incurred in relation to these matters.
We are not currently a party to any material pending legal proceedings and are not aware of any other claims that could, individually or in the aggregate, have a materially adverse effect on our financial position, results of operations or cash flows.
ITEM 4. MINE SAFETY DISCLOSURES
Not applicable.
31
ITEM 5. MARKET FOR REGISTRANT'S COMMON EQUITY, RELATED STOCKHOLDER MATTERS AND ISSUER PURCHASES OF EQUITY SECURITIES
Common Stock Price
Our common stock is listed on the NASDAQ Global Select Market under the symbol ECOL. As of January 4, 2017 there were approximately 13,923 beneficial owners of our common stock. High and low sales prices for the common stock for each quarter in the last two years are shown below:
| |
2016 | 2015 | |||||||||||
|---|---|---|---|---|---|---|---|---|---|---|---|---|---|
| |
High | Low | High | Low | |||||||||
First Quarter |
$ | 44.68 | $ | 29.89 | $ | 52.42 | $ | 38.58 | |||||
Second Quarter |
$ | 49.39 | $ | 40.62 | $ | 51.93 | $ | 45.30 | |||||
Third Quarter |
$ | 48.84 | $ | 42.13 | $ | 52.99 | $ | 43.28 | |||||
Fourth Quarter |
$ | 50.25 | $ | 38.00 | $ | 48.01 | $ | 32.76 | |||||
Dividend History
We have paid the following dividends on our common stock ($s in thousands except per share amounts):
| |
2016 | 2015 | |||||||||||
|---|---|---|---|---|---|---|---|---|---|---|---|---|---|
| |
Per share | Dollars | Per share | Dollars | |||||||||
First Quarter |
$ | 0.18 | $ | 3,918 | $ | 0.18 | $ | 3,894 | |||||
Second Quarter |
0.18 | 3,917 | 0.18 | 3,899 | |||||||||
Third Quarter |
0.18 | 3,919 | 0.18 | 3,907 | |||||||||
Fourth Quarter |
0.18 | 3,919 | 0.18 | 3,912 | |||||||||
| | | | | | | | | | | | | | |
Total |
$ | 0.72 | $ | 15,673 | $ | 0.72 | $ | 15,612 | |||||
| | | | | | | | | | | | | | |
| | | | | | | | | | | | | | |
| | | | | | | | | | | | | | |
On January 3, 2017, the Company declared a dividend of $0.18 per common share for stockholders of record on January 20, 2017. The dividend was paid from cash on hand on January 27, 2016 in an aggregate amount of $3.9 million.
Pursuant to the Credit Agreement, we may only declare quarterly or annual dividends if on the date of declaration, no event of default has occurred and no other event or condition has occurred that would constitute an event of default due to the payment of the dividend. No events of default under the Credit Agreement have occurred to date.
Stock Performance Graph
The following graph compares the five-year cumulative total return on our common stock with the comparable five-year cumulative total returns of the NASDAQ Composite Index and Dow Jones Waste & Disposal Services Index for the period from the end of fiscal 2011 to the end of fiscal 2016. The stock price performance shown below is not necessarily indicative of future performance.
32
Comparison of Cumulative Total Stockholder Return(1) Among
US Ecology, Inc., NASDAQ Composite Index and
Dow Jones Waste & Disposal Services Index
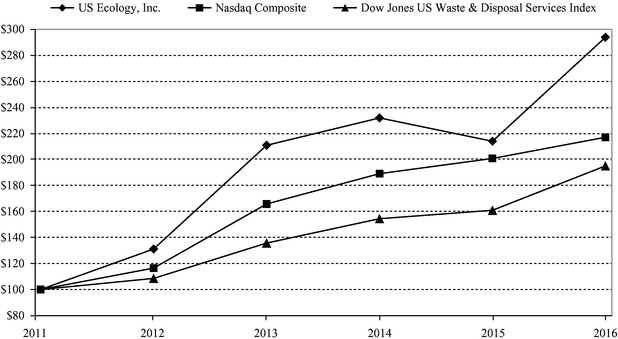
Date
|
US Ecology, Inc. | Nasdaq Composite |
Dow Jones US Waste & Disposal Services Index |
|||||||
|---|---|---|---|---|---|---|---|---|---|---|
December 31, 2011 |
$ | 100.00 | $ | 100.00 | $ | 100.00 | ||||
December 31, 2012 |
$ | 131.01 | $ | 116.41 | $ | 108.50 | ||||
December 31, 2013 |
$ | 210.40 | $ | 165.47 | $ | 135.56 | ||||
December 31, 2014 |
$ | 231.36 | $ | 188.69 | $ | 154.20 | ||||
December 31, 2015 |
$ | 213.49 | $ | 200.32 | $ | 160.66 | ||||
December 31, 2016 |
$ | 293.07 | $ | 216.54 | $ | 194.63 | ||||
- (1)
- Total return assuming $100 invested on December 31, 2011 and reinvestment of dividends on the day they were paid.
The performance graph above is being furnished solely to accompany this Annual Report on Form 10-K pursuant to Item 201(e) of Regulation S-K, is not being filed for purposes of Section 18 of the Exchange Act, and is not to be incorporated by reference into any filing of the Company, whether made before or after the date hereof, regardless of any general incorporation language in such filing.
Securities Authorized for Issuance Under Equity Compensation Plans
Information with respect to compensation plans under which our equity securities are authorized for issuance is discussed in Item 12 of Part III of this Annual Report on Form 10-K.
Issuer Purchases of Equity Securities
On June 1, 2016, the Company's Board of Directors authorized the repurchase of $25.0 million of the Company's outstanding common stock. Repurchases may be made from time to time in the open market or through privately negotiated transactions. The timing of any repurchases will be based upon prevailing
33
market conditions and other factors. The Company did not repurchase any shares of common stock under the repurchase program during the year ended December 31, 2016. The repurchase program will remain in effect until June 2, 2018, unless extended by our Board of Directors.
The following table summarizes the purchases of shares of our common stock during the year ended December 31, 2016:
Period
|
Total Number of Shares Purchased(1) |
Average Price Paid per Share |
Total Number of Shares Purchased as Part of Publicly Announced Plan or Program |
Approximate Dollar Value of Shares that May Yet be Purchased Under the Plans or Programs |
|||||||||
|---|---|---|---|---|---|---|---|---|---|---|---|---|---|
January 1 to 31, 2016 |
— | $ | — | — | $ | — | |||||||
February 1 to 29, 2016 |
— | — | — | — | |||||||||
March 1 to 31, 2016 |
5,564 | 40.49 | — | — | |||||||||
April 1 to 30, 2016 |
— | — | — | — | |||||||||
May 1 to 31, 2016 |
— | — | — | — | |||||||||
June 1 to 30, 2016 |
103 | 45.95 | — | 25,000,000 | |||||||||
July 1 to 31, 2016 |
— | — | — | 25,000,000 | |||||||||
August 1 to 31, 2016 |
922 | 43.20 | — | 25,000,000 | |||||||||
September 1 to 30, 2016 |
— | — | — | 25,000,000 | |||||||||
October 1 to 31, 2016 |
— | — | — | 25,000,000 | |||||||||
November 1 to 30, 2016 |
— | — | — | 25,000,000 | |||||||||
December 1 to 31, 2016 |
— | — | — | 25,000,000 | |||||||||
| | | | | | | | | | | | | | |
Total |
6,589 | $ | 40.95 | — | $ | 25,000,000 | |||||||
| | | | | | | | | | | | | | |
| | | | | | | | | | | | | | |
| | | | | | | | | | | | | | |
- (1)
- Represents shares surrendered or forfeited in connection with certain employees' tax withholding obligations related to the vesting of shares of restricted stock.
34
ITEM 6. SELECTED FINANCIAL DATA
This summary should be read in conjunction with the consolidated financial statements and related notes.
$s in thousands, except per share amounts
|
2016(2) | 2015(2) | 2014(1) | 2013 | 2012 | |||||||||||
|---|---|---|---|---|---|---|---|---|---|---|---|---|---|---|---|---|
Revenue |
$ | 477,665 | $ | 563,070 | $ | 447,411 | $ | 201,126 | $ | 169,138 | ||||||
Impairment charges |
— | 6,700 | — | — | — | |||||||||||
Operating income |
70,029 | 71,631 | 72,450 | 52,931 | 40,638 | |||||||||||
Foreign currency gain (loss) |
(138 | ) | (2,196 | ) | (1,499 | ) | (2,327 | ) | 1,213 | |||||||
Income tax expense |
21,049 | 21,244 | 22,814 | 17,996 | 16,059 | |||||||||||
Net income |
$ | 34,252 | $ | 25,611 | $ | 38,236 | $ | 32,151 | $ | 25,659 | ||||||
Earnings per share—basic: |
$ |
1.58 |
$ |
1.18 |
$ |
1.78 |
$ |
1.73 |
$ |
1.41 |
||||||
Earnings per share—diluted: |
$ | 1.57 | $ | 1.18 | $ | 1.77 | $ | 1.72 | $ | 1.40 | ||||||
Shares used in earnings per share calculation: |
||||||||||||||||
Basic |
21,704 | 21,637 | 21,537 | 18,592 | 18,238 | |||||||||||
Diluted |
21,789 | 21,733 | 21,655 | 18,676 | 18,281 | |||||||||||
Dividends paid per share |
$ |
0.72 |
$ |
0.72 |
$ |
0.72 |
$ |
0.54 |
$ |
0.90 |
||||||
Total assets |
$ |
776,400 |
$ |
771,987 |
$ |
910,047 |
$ |
300,556 |
$ |
218,694 |
||||||
Working capital(3) |
$ | 52,774 | $ | 54,516 | $ | 76,869 | $ | 85,356 | $ | 13,021 | ||||||
Long-term debt |
$ | 277,362 | $ | 293,740 | $ | 384,381 | $ | — | $ | 44,797 | ||||||
Stockholders' equity |
$ | 280,024 | $ | 256,135 | $ | 251,337 | $ | 231,538 | $ | 112,022 | ||||||
Return on invested capital(4) |
6.1 | % | 6.2 | % | 6.0 | % | 17.3 | % | 14.6 | % | ||||||
Adjusted EBITDA(5) |
$ | 112,786 | $ | 125,450 | $ | 108,976 | $ | 71,186 | $ | 58,352 | ||||||
- (1)
- 2014
financial data reflects the acquisition of EQ on June 17, 2014.
- (2)
- 2015
and 2016 financial data reflects the divestiture of Allstate on November 1, 2015.
- (3)
- Calculated
as current assets minus current liabilities.
- (4)
- Calculated
as operating income less applicable taxes divided by the sum of stockholders' equity, long-term debt, closure and post-closure obligations and monetized
operating leases, less cash and short-term investments.
- (5)
- We define Adjusted EBITDA as net income before interest expense, interest income, income tax expense, depreciation, amortization, stock based compensation, accretion of closure and post-closure liabilities, foreign currency gain/loss, non-cash impairment charges, loss on divestiture and other income/expense. See "Adjusted EBITDA" under Item 7. Management's Discussion and Analysis of Financial Condition and Results of Operations of this report for further discussion of Adjusted EBITDA and a reconciliation to the most directly comparable GAAP measure, net income.
ITEM 7. MANAGEMENT'S DISCUSSION AND ANALYSIS OF FINANCIAL CONDITION AND RESULTS OF OPERATIONS
General
US Ecology, Inc. is a leading North American provider of environmental services to commercial and government entities. The Company addresses the complex waste management needs of its customers, offering treatment, disposal and recycling of hazardous, non-hazardous and radioactive waste, as well as a wide range of complementary field and industrial services. US Ecology's comprehensive knowledge of the waste business, its collection of waste management facilities and focus on safety, environmental
35
compliance, and customer service enables us to effectively meet the needs of our customers and to build long-lasting relationships.
We have fixed facilities and service centers operating in the United States, Canada and Mexico. Our fixed facilities include five RCRA subtitle C hazardous waste landfills and one LLRW landfill located near Beatty, Nevada; Richland, Washington; Robstown, Texas; Grand View, Idaho; Detroit, Michigan and Blainville, Québec, Canada. These facilities generate revenue from fees charged to treat and dispose of waste and from fees charged to perform various field and industrial services for our customers.
On June 17, 2014, the Company acquired 100% of the outstanding shares of EQ Holdings, Inc. and its wholly-owned subsidiaries (collectively "EQ"). EQ is a fully integrated environmental services company providing waste treatment and disposal, wastewater treatment, remediation, recycling, industrial cleaning and maintenance, transportation, total waste management, technical services, and emergency response services to a variety of industries and customers in North America.
On November 1, 2015, we sold our Allstate Power Vac, Inc. ("Allstate") subsidiary to a private investor group. See Note 5 to the Consolidated Financial Statements in "Part II, Item 8. Financial Statements and Supplementary Data" of this Annual Report on Form 10-K for additional information.
Our operations are managed in two reportable segments reflecting our internal management reporting structure and nature of services offered as follows:
Environmental Services—This segment provides a broad range of hazardous material management services including transportation, recycling, treatment and disposal of hazardous and non-hazardous waste at Company-owned landfill, wastewater and other treatment facilities.
Field & Industrial Services—This segment provides packaging and collection of hazardous waste and total waste management solutions at customer sites and through our 10-day transfer facilities. Services include on-site management, waste characterization, transportation and disposal of non-hazardous and hazardous waste. This segment also provides specialty services such as high-pressure cleaning, tank cleaning, decontamination, remediation, transportation, spill cleanup and emergency response and other services to commercial and industrial facilities and to government entities.
Effective January 1, 2016, we changed our internal reporting structure by moving the financial results of our Sulligent, Alabama and Tampa, Florida facilities from our Environmental Services segment to our Field & Industrial Services segment. The purpose of this change is to align our internal reporting structure with how we manage our business based on the primary service offering of each facility. Throughout this Annual Report on Form 10-K, our segment results for all periods presented have been recast to reflect this change.
In order to provide insight into the underlying drivers of our waste volumes and related treatment and disposal ("T&D") revenues, we evaluate period-to-period changes in our T&D revenue for our Environmental Services segment based on the industry of the waste generator, based on North American Industry Classification System ("NAICS") codes.
36
The composition of the Environmental Services segment T&D revenues by waste generator industry for the years ended December 31, 2016 and 2015 were as follows:
| |
% of Treatment and Disposal Revenue(1) for the Years Ended December 31, |
||||||
|---|---|---|---|---|---|---|---|
Generator Industry
|
2016 | 2015 | |||||
Metal Manufacturing |
16 | % | 16 | % | |||
Broker / TSDF |
15 | % | 14 | % | |||
General Manufacturing |
14 | % | 12 | % | |||
Chemical Manufacturing |
13 | % | 19 | % | |||
Refining |
11 | % | 10 | % | |||
Government |
6 | % | 7 | % | |||
Utilities |
4 | % | 4 | % | |||
Mining, Exploration and Production |
3 | % | 3 | % | |||
Transportation |
3 | % | 3 | % | |||
Waste Management & Remediation |
2 | % | 2 | % | |||
Other(2) |
13 | % | 10 | % | |||
- (1)
- Excludes
all transportation service revenue
- (2)
- Includes retail and wholesale trade, rate regulated, construction and other industries
We also categorize our Environmental Services T&D revenue as either "Base Business" or "Event Business" based on the underlying nature of the revenue source. We define Event Business as non-recurring projects that are expected to equal or exceed 1,000 tons, with Base Business defined as all other business not meeting the definition of Event Business.
A significant portion of our disposal revenue is attributable to discrete Event Business projects which vary widely in size, duration and unit pricing. For the year ended December 31, 2016, approximately 18% of our T&D revenue was derived from Event Business projects. The one-time nature of Event Business, diverse spectrum of waste types received and widely varying unit pricing necessarily creates variability in revenue and earnings. This variability may be influenced by general and industry-specific economic conditions, funding availability, changes in laws and regulations, government enforcement actions or court orders, public controversy, litigation, weather, commercial real estate, closed military bases and other project timing, government appropriation and funding cycles and other factors. The types and amounts of waste received from Base Business also vary from quarter to quarter. This variability can also cause significant quarter-to-quarter and year-to-year differences in revenue, gross profit, gross margin, operating income and net income. While we pursue many projects months or years in advance of work performance, cleanup project opportunities routinely arise with little or no prior notice. These market dynamics are inherent to the waste disposal business and are factored into our projections and externally communicated business outlook statements. Our projections combine historical experience with identified sales pipeline opportunities, new or expanded service line projections and prevailing market conditions.
During 2016, Base Business revenue growth was up 2% compared to 2015. Base Business revenue was approximately 82% of total 2016 T&D revenue, up from 75% in 2015. Our business is highly competitive and no assurance can be given that we will maintain these revenue levels or increase our market share.
Depending on project-specific customer needs and competitive economics, transportation services may be offered at or near our cost to help secure new business. For waste transported by rail from the eastern United States and other locations distant from our Grand View, Idaho and Robstown, Texas facilities, transportation-related revenue can account for as much as 75% of total project revenue. While bundling
37
transportation and disposal services reduces overall gross profit as a percentage of total revenue ("gross margin"), this value-added service has allowed us to win multiple projects that management believes we could not have otherwise competed for successfully. Our Company-owned fleet of gondola railcars, which is periodically supplemented with railcars obtained under operating leases, has reduced our transportation expenses by largely eliminating reliance on more costly short-term rentals. These Company-owned railcars also help us to win business during times of demand-driven railcar scarcity.
The increased waste volumes resulting from projects won through this bundled service strategy further drive operating leverage benefits inherent to the disposal business, increasing profitability. While waste treatment and other variable costs are project-specific, the incremental earnings contribution from large and small projects generally increases as overall disposal volumes increase. Based on past experience, management believes that maximizing operating income, net income and earnings per share is a higher priority than maintaining or increasing gross margin. We intend to continue aggressively bidding bundled transportation and disposal services based on this proven strategy.
We serve oil refineries, chemical production plants, steel mills, waste brokers/aggregators serving small manufacturers and other industrial customers that are generally affected by the prevailing economic conditions and credit environment. Adverse conditions may cause our customers as well as those they serve to curtail operations, resulting in lower waste production and/or delayed spending on off-site waste shipments, maintenance, waste cleanup projects and other work. Factors that can impact general economic conditions and the level of spending by customers include, but are not limited to, consumer and industrial spending, increases in fuel and energy costs, conditions in the real estate and mortgage markets, labor and healthcare costs, access to credit, consumer confidence and other global economic factors affecting spending behavior. Market forces may also induce customers to reduce or cease operations, declare bankruptcy, liquidate or relocate to other countries, any of which could adversely affect our business. To the extent business is either government funded or driven by government regulations or enforcement actions, we believe it is less susceptible to general economic conditions. Spending by government agencies may be reduced due to declining tax revenues resulting from a weak economy or changes in policy. Disbursement of funds appropriated by Congress may also be delayed for various reasons.
Our results of operations have been affected by certain significant events during the past three fiscal years including, but not limited to:
2016 Events
Divestiture of Augusta, Georgia Facility: On April 5, 2016, we completed the divestiture of our Augusta, Georgia facility for cash proceeds of $1.9 million. The Augusta, Georgia facility was reported as part of our Environmental Services segment. Sales, net income and total assets of the Augusta, Georgia facility are not material to our consolidated financial position or results of operations in any period presented. We recognized a $1.9 million pre-tax gain on the divestiture of the Augusta, Georgia facility, which is included in Other income (expense) in our consolidated statements of operations for the year ended December 31, 2016.
Acquisition of Environmental Services Inc.: On May 2, 2016, the Company acquired 100% of the outstanding shares of Environmental Services Inc., ("ESI"), an environmental services company based in Tilbury, Ontario, Canada. The total purchase price was $4.9 million, net of cash acquired, and was funded with cash on hand. Revenues and total assets of ESI are not material to our consolidated financial position or results of operations. We recorded $1.5 million of intangible assets and $1.0 million of goodwill on the consolidated balance sheets as a result of the acquisition. Definite-lived intangibles will be amortized over a weighted average life of approximately 14 years. Goodwill and indefinite-lived intangibles are tested for impairment at least annually.
Acquisition of Vernon, California Facility: On October 1, 2016, the Company acquired the Vernon, California based RCRA Part B, liquids and solids waste treatment and storage facility of Evoqua Water
38
Technologies LLC. The total purchase price was $5.0 million and was funded with cash on hand. Revenues and total assets of the Vernon, California facility are not material to our consolidated financial position or results of operations. We recorded $3.2 million of intangible assets and $354,000 of goodwill on the consolidated balance sheets as a result of the acquisition. Definite-lived intangibles will be amortized over a weighted average life of approximately 20 years. Goodwill and indefinite-lived intangibles are tested for impairment at least annually.
2015 Events
Full Year of EQ Operations: 2015 includes a full year of operating results for EQ, which was acquired on June 17, 2014.
Sale of Allstate Power Vac, Inc. ("Allstate") and Goodwill Impairment: On November 1, 2015, we sold our Allstate subsidiary to a private investor group for cash proceeds of $58.8 million. Allstate represented the majority of the industrial services business we acquired with the acquisition of EQ. As a result of this divestiture and management's strategic review, we evaluated the recoverability of the assets associated with our industrial services business. Based on this analysis, we recorded a non-cash goodwill impairment charge of $6.7 million, or $0.31 per diluted share, in the second quarter of 2015. We recognized a pre-tax loss on the divestiture of Allstate, including transaction-related costs, of $542,000 in the fourth quarter of 2015. In the second quarter of 2016, we received additional cash proceeds of $827,000 in settlement of final post-closing adjustments and recognized an additional $178,000 pre-tax gain. Gains and losses related to the sale of Allstate are included in Other income (expense) in our consolidated statements of operations. Cash proceeds from the transaction were used to repay debt. See Note 5 to the Consolidated Financial Statements in "Part II, Item 8. Financial Statements and Supplementary Data" of this Annual Report on Form 10-K for additional information on the sale of Allstate.
2014 Events
Acquisition of EQ Holdings, Inc.: On June 17, 2014, the Company acquired 100% of the outstanding shares of EQ. EQ is a fully integrated environmental services company providing waste treatment and disposal, wastewater treatment, remediation, recycling, industrial cleaning and maintenance, transportation, total waste management, technical services, and emergency response services to a variety of industries and customers in North America. The total purchase price was $460.9 million, net of cash acquired, and was funded through a combination of cash on hand and borrowings under a new $415.0 million term loan. The acquisition of EQ affects the comparability of 2014 with other years, including as follows:
- •
- Revenue and operating income from the legacy EQ business for the period from June 17, 2014 to December 31, 2014 included in the
Company's consolidated statements of operations for the year ended December 31, 2014 were $228.2 million and $18.5 million, respectively.
- •
- We incurred $6.4 million of business development expenses during the year ended December 31, 2014 in connection with the EQ
acquisition primarily for due diligence and business integration purposes.
- •
- We recorded $252.9 million of intangible assets and $197.6 million of goodwill on our Consolidated Balance Sheet as a result of the acquisition. Acquired finite-lived intangibles will be amortized over their estimated useful life ranging from one to 45 years. Goodwill and indefinite-lived intangibles are tested for impairment at least annually.
39
Results of Operations
Our operating results and percentage of revenues for the years ended December 31, 2016, 2015 and 2014 were as follows:
| |
Year Ended December 31, | 2016 vs. 2015 | 2015 vs. 2014 | ||||||||||||||||||||||||||||
|---|---|---|---|---|---|---|---|---|---|---|---|---|---|---|---|---|---|---|---|---|---|---|---|---|---|---|---|---|---|---|---|
$s in thousands
|
2016 | % | 2015 | % | 2014 | % | $ Change | % Change | $ Change | % Change | |||||||||||||||||||||
Revenue |
|||||||||||||||||||||||||||||||
Environmental Services |
$ | 337,771 | 71 | % | $ | 359,040 | 64 | % | $ | 311,486 | 70 | % | $ | (21,269 | ) | –6 | % | $ | 47,554 | 15 | % | ||||||||||
Field & Industrial Services |
139,894 | 29 | % | 204,030 | 36 | % | 135,925 | 30 | % | (64,136 | ) | –31 | % | 68,105 | 50 | % | |||||||||||||||
| | | | | | | | | | | | | | | | | | | | | | | | | | | | | | | | |
Total |
477,665 | 100 | % | 563,070 | 100 | % | 447,411 | 100 | % | (85,405 | ) | –15 | % | 115,659 | 26 | % | |||||||||||||||
| | | | | | | | | | | | | | | | | | | | | | | | | | | | | | | | |
| | | | | | | | | | | | | | | | | | | | | | | | | | | | | | | | |
| | | | | | | | | | | | | | | | | | | | | | | | | | | | | | | | |
Gross Profit |
|||||||||||||||||||||||||||||||
Environmental Services |
126,818 | 38 | % | 137,633 | 38 | % | 123,769 | 40 | % | (10,815 | ) | –8 | % | 13,864 | 11 | % | |||||||||||||||
Field & Industrial Services |
20,777 | 15 | % | 33,777 | 17 | % | 22,017 | 16 | % | (13,000 | ) | –38 | % | 11,760 | 53 | % | |||||||||||||||
| | | | | | | | | | | | | | | | | | | | | | | | | | | | | | | | |
Total |
147,595 | 31 | % | 171,410 | 30 | % | 145,786 | 33 | % | (23,815 | ) | –14 | % | 25,624 | 18 | % | |||||||||||||||
| | | | | | | | | | | | | | | | | | | | | | | | | | | | | | | | |
| | | | | | | | | | | | | | | | | | | | | | | | | | | | | | | | |
| | | | | | | | | | | | | | | | | | | | | | | | | | | | | | | | |
Selling, General & Administrative Expenses |
|||||||||||||||||||||||||||||||
Environmental Services |
21,418 | 6 | % | 22,752 | 6 | % | 18,591 | 6 | % | (1,334 | ) | –6 | % | 4,161 | 22 | % | |||||||||||||||
Field & Industrial Services |
10,115 | 7 | % | 21,961 | 11 | % | 14,499 | 11 | % | (11,846 | ) | –54 | % | 7,462 | 51 | % | |||||||||||||||
Corporate |
46,033 | n/m | 48,366 | n/m | 40,246 | n/m | (2,333 | ) | –5 | % | 8,120 | 20 | % | ||||||||||||||||||
| | | | | | | | | | | | | | | | | | | | | | | | | | | | | | | | |
Total |
77,566 | 16 | % | 93,079 | 17 | % | 73,336 | 16 | % | (15,513 | ) | –17 | % | 19,743 | 27 | % | |||||||||||||||
| | | | | | | | | | | | | | | | | | | | | | | | | | | | | | | | |
| | | | | | | | | | | | | | | | | | | | | | | | | | | | | | | | |
| | | | | | | | | | | | | | | | | | | | | | | | | | | | | | | | |
Adjusted EBITDA |
|||||||||||||||||||||||||||||||
Environmental Services |
139,698 | 41 | % | 150,067 | 42 | % | 123,086 | 40 | % | (10,369 | ) | –7 | % | 26,981 | 22 | % | |||||||||||||||
Field & Industrial Services |
16,342 | 12 | % | 21,388 | 10 | % | 8,638 | 6 | % | (5,046 | ) | –24 | % | 12,750 | 148 | % | |||||||||||||||
Corporate |
(43,254 | ) | n/m | (46,005 | ) | n/m | (22,748 | ) | n/m | 2,751 | –6 | % | (23,257 | ) | 102 | % | |||||||||||||||
| | | | | | | | | | | | | | | | | | | | | | | | | | | | | | | | |
Total |
$ | 112,786 | 24 | % | $ | 125,450 | 22 | % | $ | 108,976 | 24 | % | $ | (12,664 | ) | –10 | % | $ | 16,474 | 15 | % | ||||||||||
| | | | | | | | | | | | | | | | | | | | | | | | | | | | | | | | |
| | | | | | | | | | | | | | | | | | | | | | | | | | | | | | | | |
| | | | | | | | | | | | | | | | | | | | | | | | | | | | | | | | |
The primary financial measure used by management to assess segment performance is Adjusted EBITDA. Adjusted EBITDA is defined as net income before interest expense, interest income, income tax expense, depreciation, amortization, stock based compensation, accretion of closure and post-closure liabilities, foreign currency gain/loss, non-cash impairment charges, loss on divestiture and other income/expense.
40
The reconciliation of Net Income to Adjusted EBITDA for the years ended December 31, 2016, 2015 and 2014 is as follows:
| |
Year Ended December 31, | 2016 vs. 2015 | 2015 vs. 2014 | |||||||||||||||||||
|---|---|---|---|---|---|---|---|---|---|---|---|---|---|---|---|---|---|---|---|---|---|---|
$s in thousands
|
2016 | 2015 | 2014 | $ Change | % Change | $ Change | % Change | |||||||||||||||
Net Income |
$ | 34,252 | $ | 25,611 | $ | 38,236 | $ | 8,641 | 34 | % | $ | (12,625 | ) | –33 | % | |||||||
Income tax expense |
21,049 | 21,244 | 22,814 | (195 | ) | –1 | % | (1,570 | ) | –7 | % | |||||||||||
Interest expense |
17,317 | 23,370 | 10,677 | (6,053 | ) | –26 | % | 12,693 | 119 | % | ||||||||||||
Interest income |
(96 | ) | (65 | ) | (107 | ) | (31 | ) | 48 | % | 42 | –39 | % | |||||||||
Foreign currency loss |
138 | 2,196 | 1,499 | (2,058 | ) | –94 | % | 697 | 46 | % | ||||||||||||
Loss (gain) on divestiture |
(2,034 | ) | 542 | — | (2,576 | ) | –475 | % | 542 | n/m | ||||||||||||
Other income |
(597 | ) | (1,267 | ) | (669 | ) | 670 | –53 | % | (598 | ) | 89 | % | |||||||||
Impairment charges |
— | 6,700 | — | (6,700 | ) | –100 | % | 6,700 | n/m | |||||||||||||
Depreciation and amortization of plant and equipment |
25,304 | 27,931 | 24,413 | (2,627 | ) | –9 | % | 3,518 | 14 | % | ||||||||||||
Amortization of intangibles |
10,575 | 12,307 | 8,207 | (1,732 | ) | –14 | % | 4,100 | 50 | % | ||||||||||||
Stock-based compensation |
2,925 | 2,297 | 1,250 | 628 | 27 | % | 1,047 | 84 | % | |||||||||||||
Accretion and non-cash adjustment of closure and post-closure liabilities |
3,953 | 4,584 | 2,656 | (631 | ) | –14 | % | 1,928 | 73 | % | ||||||||||||
| | | | | | | | | | | | | | | | | | | | | | | |
Adjusted EBITDA |
$ | 112,786 | $ | 125,450 | $ | 108,976 | $ | (12,664 | ) | –10 | % | $ | 16,474 | 15 | % | |||||||
| | | | | | | | | | | | | | | | | | | | | | | |
| | | | | | | | | | | | | | | | | | | | | | | |
| | | | | | | | | | | | | | | | | | | | | | | |
Adjusted EBITDA is a complement to results provided in accordance with accounting principles generally accepted in the United States ("GAAP") and we believe that such information provides additional useful information to analysts, stockholders and other users to understand the Company's operating performance. Since Adjusted EBITDA is not a measurement determined in accordance with GAAP and is thus susceptible to varying calculations, Adjusted EBITDA as presented may not be comparable to other similarly titled measures of other companies. Items excluded from Adjusted EBITDA are significant components in understanding and assessing our financial performance. Adjusted EBITDA should not be considered in isolation or as an alternative to, or substitute for, net income, cash flows generated by operations, investing or financing activities, or other financial statement data presented in the consolidated financial statements as indicators of financial performance or liquidity.
Adjusted EBITDA has limitations as an analytical tool and should not be considered in isolation or a substitute for analyzing our results as reported under GAAP. Some of the limitations are:
- •
- Adjusted EBITDA does not reflect changes in, or cash requirements for, our working capital needs;
- •
- Adjusted EBITDA does not reflect our interest expense, or the requirements necessary to service interest or principal payments on our debt;
- •
- Adjusted EBITDA does not reflect our income tax expenses or the cash requirements to pay our taxes;
- •
- Adjusted EBITDA does not reflect our cash expenditures or future requirements for capital expenditures or contractual commitments; and
- •
- Although depreciation and amortization charges are non-cash charges, the assets being depreciated and amortized will often have to be replaced in the future, and Adjusted EBITDA does not reflect any cash requirements for such replacements.
41
2016 Compared to 2015
Revenue
Total revenue decreased 15% to $477.7 million in 2016, compared with $563.1 million in 2015.
Environmental Services
Environmental Services segment revenue decreased 6% to $337.8 million in 2016, compared to $359.0 million in 2015. T&D revenue decreased 5% in 2016, primarily as a result of a 30% decrease in project-based Event Business. Transportation and logistics service revenue decreased 8% in 2016 compared to 2015, reflecting fewer Event Business projects utilizing the Company's transportation and logistics services. Tons of waste disposed of or processed decreased 14% in 2016 compared to 2015.
T&D revenue from recurring Base Business waste generators increased 2% in 2016 compared to 2015 and comprised 82% of total T&D revenue. During 2016, increases in Base Business T&D revenue from the refining, "Other", utilities and general manufacturing industry groups were partially offset by decreases in T&D revenue from Base Business in the chemical manufacturing and broker/TSDF industry groups.
T&D revenue from Event Business waste generators decreased 30% in 2016 compared to 2015 and comprised 18% of total T&D revenue. The decrease in Event Business T&D revenue compared to the prior year primarily reflects lower T&D revenue from the chemical manufacturing, refining and government industry groups, partially offset by higher T&D revenue from the general manufacturing and "Other" industry groups. The decrease in revenue from the chemical manufacturing industry group is primarily attributable to the completion of a large East Coast remedial cleanup project in the third quarter of 2015 and the completion of a nuclear fuels fabrication plant decommissioning in the first quarter of 2016. The decrease in revenue from the refining and government industry groups is primarily attributable to lower Event Business volumes.
The following table summarizes combined Base Business and Event Business T&D revenue growth, within the Environmental Services segment, by waste generator industry for 2016 compared to 2015:
| |
T&D Revenue Growth 2016 vs. 2015 |
|
|---|---|---|
Other |
15% | |
General Manufacturing |
14% | |
Waste Management & Remediation |
10% | |
Utilities |
9% | |
Refining |
0% | |
Metal Manufacturing |
–3% | |
Broker / TSDF |
–3% | |
Mining and E&P |
–4% | |
Transportation |
–5% | |
Government |
–28% | |
Chemical Manufacturing |
–35% |
Field & Industrial Services
Field & Industrial Services segment revenue decreased 31% to $139.9 million in 2016 compared with $204.0 million in 2015. The decrease is primarily attributable to the divested Allstate business which contributed segment revenue of $59.1 million for our period of ownership in 2015.
42
Gross Profit
Total gross profit decreased 14% to $147.6 million in 2016, down from $171.4 million in 2015. Total gross margin was 31% for 2016 compared with 30% for 2015.
Environmental Services
Environmental Services segment gross profit decreased 8% to $126.8 million in 2016, down from $137.6 million in 2015. This decrease primarily reflects lower T&D volumes in 2016 compared to 2015. Total segment gross margin was 38% for both 2016 and 2015. T&D gross margin was 42% for 2016 compared with 43% for 2015.
Field & Industrial Services
Field & Industrial Services segment gross profit decreased 38% to $20.8 million in 2016, down from $33.8 million in 2015. Total segment gross margin was 15% for 2016 compared with 17% for 2015. The divested Allstate business contributed segment gross profit of $12.4 million for our period of ownership in 2015.
Selling, General and Administrative Expenses ("SG&A")
Total SG&A decreased to $77.6 million, or 16% of total revenue, in 2016 compared with $93.1 million, or 17% of total revenue, in 2015.
Environmental Services
Environmental Services segment SG&A decreased 6% to $21.4 million, or 6% of segment revenue, in 2016 compared with $22.8 million, or 6% of segment revenue, in 2015, primarily reflecting higher gains on sales of assets in 2016 compared to 2015.
Field & Industrial Services
Field & Industrial Services segment SG&A decreased 54% to $10.1 million, or 7% of segment revenue, in 2016 compared with $22.0 million, or 11% of segment revenue, in 2015. The divested Allstate business contributed segment SG&A of $10.9 million for our period of ownership in 2015. The remaining decrease in segment SG&A primarily reflects lower employee labor costs in 2016 compared to 2015.
Corporate
Corporate SG&A was $46.0 million, or 10% of total revenue, in 2016 compared with $48.4 million, or 9% of total revenue, in 2015, primarily reflecting lower business development expenses and lower professional services expenses in 2016 compared to 2015.
Components of Adjusted EBITDA
Income tax expense
Our effective income tax rate for 2016 was 38.1% compared with 45.3% in 2015. The decrease reflects nonrecurring non-deductible goodwill impairment charges incurred in 2015, a nondeductible loss on the sale of the Allstate business recorded during 2015 and a decrease in our U.S. effective tax rate, driven by a lower overall effective state tax rate. The lower effective state tax rate was driven by changes in apportionment of income and deferred taxes between the various states in which we operate. The decrease in the effective tax rate was partially offset by a lower proportion of earnings from our Canadian operations in 2016, which are taxed at a lower corporate tax rate. As of December 31, 2016, we had approximately $12.7 million in state and local net operating loss carry forwards ("NOLs") for which we
43
maintain a valuation allowance on the majority of the balance. We maintain a valuation allowance on state and local NOLs when we no longer do business within a state or locality or determine it is unlikely that we will utilize these NOLs in the future. We consider it more likely than not that we will not utilize the majority of these NOLs in the future.
Interest expense
Interest expense was $17.3 million in 2016 compared with $23.4 million in 2015. The decrease is primarily due to $291,000 of incremental non-cash amortization of deferred financing fees associated with debt principal payments in 2016 compared with $2.4 million of incremental amortization in 2015. The remaining decrease is attributable to lower debt levels in 2016 compared with 2015.
Foreign currency gain (loss)
We recognized a $138,000 non-cash foreign currency loss in 2016 compared with a $2.2 million non-cash foreign currency loss in 2015. Foreign currency gains and losses reflect changes in business activity conducted in a currency other than the USD, our functional currency. Our Canadian subsidiaries' facilities are located in Blainville, Québec and Tilbury, Ontario, Canada and use the Canadian dollar ("CAD") as their functional currency. Additionally, we established intercompany loans between our Canadian subsidiaries, whose functional currency is the CAD, and our parent company, US Ecology, as part of a tax and treasury management strategy allowing for repayment of third-party bank debt. These intercompany loans are payable by our Canadian subsidiaries to US Ecology in CAD requiring us to revalue the outstanding loan balance through our statements of operations based on USD/CAD currency movements from period to period. At December 31, 2016, we had $20.8 million of intercompany loans subject to currency revaluation.
Gain on divestiture
Other income in 2016 includes approximately $2.0 million related to the gain on sale of the Augusta, Georgia facility in April 2016 and final closing adjustments on the Allstate divestiture.
Depreciation and amortization of plant and equipment
Depreciation and amortization expense was $25.3 million in 2016 compared with $27.9 million in 2015. The divested Allstate business contributed depreciation and amortization expense of $2.2 million for our period of ownership in 2015.
Amortization of intangibles
Intangible assets amortization expense was $10.6 million in 2016 compared with $12.3 million in 2015. The divested Allstate business contributed intangible assets amortization expense of $1.4 million for our period of ownership in 2015.
Stock-based compensation
Stock-based compensation expense increased 27% to $2.9 million in 2016, compared with $2.3 million 2015 as a result of an increase in equity-based awards granted to employees.
Accretion and non-cash adjustment of closure and post-closure liabilities
Accretion and non-cash adjustment of closure and post-closure liabilities was $4.0 million in 2016 compared with $4.6 million in 2015.
44
Impairment charges
On August 4, 2015, we entered into a definitive agreement to sell Allstate to a private investor group. Allstate represented the majority of the industrial services business we acquired with the acquisition of EQ. As a result of this agreement and management's strategic review, we evaluated the recoverability of the assets associated with our industrial services business. Based on this analysis, we recorded a non-cash goodwill impairment charge of $6.7 million in the second quarter of 2015. See Note 5 to the Consolidated Financial Statements in "Part II, Item 8. Financial Statements and Supplementary Data" of this Annual Report on Form 10-K for additional information on the sale of Allstate.
2015 Compared to 2014
Revenue
Total revenue increased 26% to $563.1 million in 2015, compared with $447.4 million in 2014. The acquired EQ operations contributed $359.0 million of revenue in 2015, compared with $228.2 million for our period of ownership in 2014. Excluding EQ operations, total revenue decreased 7% to $204.1 million in 2015, compared with $219.2 million in 2014. Revenue from EQ is excluded from percentages of Base and Event Business and waste generator industry information in the following paragraphs.
Environmental Services
Environmental Services segment revenue increased 15% to $359.0 million in 2015, compared to $311.5 million in 2014. The acquired EQ operations contributed $154.9 million of segment revenue in 2015 compared with $92.3 million of segment revenue for our period of ownership in 2014. Excluding EQ operations, segment revenue decreased 7% to $204.1 million in 2015, compared with $219.2 million in 2014. T&D revenue (excluding EQ) decreased 8% in 2015 compared to 2014, primarily as a result of a 23% decrease in project-based Event Business. Transportation service revenue (excluding EQ) increased 2% compared to 2014, reflecting more Event Business projects utilizing our transportation and logistics services. Tons of waste disposed of or processed increased 5% in 2015 compared to 2014. Excluding EQ, tons of waste disposed of or processed decreased 20% in 2015 compared to 2014.
Growth in T&D revenue from recurring Base Business waste generators was flat compared to 2014 and comprised 74% of total T&D revenue in 2015. During 2015, increases in Base Business T&D revenue from the refining and broker/TSDF industries were offset by decreases in T&D revenue from Base Business in the chemical manufacturing, utilities, and mining, exploration and production industries.
T&D revenue from Event Business waste generators decreased 23% in 2015 compared to 2014 and comprised 26% of total T&D revenue in 2015. The decrease in Event Business T&D revenue compared to the prior year primarily reflects lower T&D revenue from the chemical and metal manufacturing, transportation, broker/TSDF, and mining, exploration and production industries, partially offset by higher T&D revenue from the utilities, government and refining industries. The decrease in T&D revenue from the chemical manufacturing industry is primarily attributable to reductions in volume from a large East Coast remedial cleanup project and lower overall industry activity in 2015. The decrease in T&D revenue from the metal manufacturing industry is primarily attributable to lower domestic production of metal related products and services. The decrease in T&D revenue from the mining, exploration and production industry primarily reflects lower industry activity due to lower commodity prices.
45
The following table summarizes combined Base Business and Event Business T&D revenue growth by waste generator industry for 2015 compared to 2014:
| |
T&D Revenue Growth(1) 2015 vs. 2014 |
|
|---|---|---|
Utilities |
25% | |
Refining |
20% | |
Government |
15% | |
Other |
5% | |
Waste Management & Remediation |
4% | |
General Manufacturing |
2% | |
Broker / TSDF |
1% | |
Metal Manufacturing |
–12% | |
Mining and E&P |
–31% | |
Chemical Manufacturing |
–35% | |
Transportation |
–44% |
- (1)
- Excludes EQ Holdings, Inc. which was acquired on June 17, 2014
Field & Industrial Services
Our Field & Industrial Services segment was added subsequent to, and as a result of, our acquisition of EQ on June 17, 2014. This segment includes all of the field and industrial service business of the legacy EQ operations and none of the legacy US Ecology operations. Field & Industrial Services segment revenue was $204.0 million in 2015 compared with $135.9 million for our period of ownership in 2014. The divested Allstate business contributed segment revenue of $59.1 million for our period of ownership in 2015 compared with $37.0 million for our period of ownership in 2014.
Gross Profit
Total gross profit increased 18% to $171.4 million in 2015, up from $145.8 million in 2014. The acquired EQ operations contributed $91.7 million of gross profit in 2015, compared with $57.4 million for our period of ownership in 2014. Excluding EQ operations, total gross profit decreased 10% to $79.7 million in 2015, compared with $88.4 million in 2014. Total gross margin in 2015 was 30%. Excluding EQ operations, total gross margin was 39%.
Environmental Services
Environmental Services segment gross profit increased 11% to $137.6 million in 2015, up from $123.8 million in 2014. The acquired EQ operations contributed $57.9 million of segment gross profit in 2015 compared with $35.4 million of segment gross profit for our period of ownership in 2014. Excluding EQ operations, segment gross profit decreased 10% to $79.7 million in 2015, compared with $88.4 million in 2014. This decrease primarily reflects lower T&D volumes in 2015 compared to 2014. Total segment gross margin in 2015 was 38%. Excluding EQ operations, total segment margin was 39%. Excluding EQ operations, T&D gross margin was 48% in 2015 compared to 49% in 2014.
Field & Industrial Services
Our Field & Industrial Services segment was added in 2014 as a result of our acquisition of EQ on June 17, 2014. This segment includes all of the field and industrial service business of the legacy EQ operations and none of the legacy US Ecology operations. Field & Industrial Services segment gross profit and gross margin were $33.8 million and 17%, respectively, in 2015 compared with $22.0 million and 16%, respectively, for our period of ownership in 2014. The divested Allstate business contributed segment gross
46
profit of $12.4 million for our period of ownership in 2015 compared with $8.2 million for our period of ownership in 2014.
Selling, General and Administrative Expenses ("SG&A")
Total SG&A increased 27% to $93.1 million in 2015, up from $73.3 million in 2014. The acquired EQ operations contributed $56.6 million of SG&A in 2015, compared with $38.9 million for our period of ownership in 2014. Excluding EQ operations, total SG&A was $36.5 million, or 18% of total revenue in 2015, compared with $34.4 million, or 16% of total revenue, in 2014.
Environmental Services
Environmental Services segment SG&A increased 22% to $22.8 million, or 6% of segment revenue, in 2015, up from $18.6 million, or 6% of segment revenue, in 2014. The acquired EQ operations contributed $11.6 million of segment SG&A in 2015 compared with $6.8 million of segment SG&A for our period of ownership in 2014. Excluding EQ operations, total segment SG&A was $11.1 million, or 5% of segment revenue, in 2015 compared with $11.8 million, or 5% of segment revenue, in 2014.
Field & Industrial Services
Our Field & Industrial Services segment was added in 2014 as a result of our acquisition of EQ on June 17, 2014. This segment includes all of the field and industrial service business of the legacy EQ operations and none of the legacy US Ecology operations. Field & Industrial Services segment SG&A was $22.0 million in 2015 compared with $14.5 million for our period of ownership in 2014. The divested Allstate business contributed segment SG&A of $10.9 million for our period of ownership in 2015 compared with $6.6 million for our period of ownership in 2014.
Corporate
Corporate SG&A increased 20% to $48.4 million in 2015, up from $40.2 million in 2014. The acquired EQ operations contributed $23.0 million of corporate SG&A in 2015 compared with $17.6 million of corporate SG&A for our period of ownership in 2014. Excluding EQ operations, total corporate SG&A was $25.4 million, or 12% of total revenue in 2015, compared with $22.6 million, or 10% of total revenue in 2014, primarily reflecting higher labor costs and professional fees and expenses, partially offset by lower business development expenses in 2015 compared to 2014.
Components of Adjusted EBITDA
Income tax expense
Our effective income tax rate for 2015 was 45.3% compared to 37.4% in 2014. The increase reflects non-deductible goodwill impairment charges, a non-deductible loss on the sale of the Allstate business recorded during 2015 and an increase in our U.S. effective tax rate, primarily driven by a higher overall effective state tax rate. The higher effective state tax rate was driven by changes in apportionment of income and deferred taxes between the various states in which we operate. The increase in the effective tax rate was also partially attributable to a lower proportion of earnings from our Canadian operations in 2015, which are taxed at a lower corporate tax rate. As of December 31, 2015, we had approximately $161,000 in federal NOLs acquired from EQ. As of December 31, 2015, we had approximately $34.2 million in state and local NOLs for which we maintain a substantial valuation allowance. We maintain a valuation allowance on state and local NOLs when we no longer do business within a state or locality or determine it is unlikely that we will utilize these NOLs in the future. We consider it unlikely that we will utilize the majority of these NOLs in the future.
47
Interest expense
Interest expense was $23.4 million in 2015 compared with $10.7 million in 2014. The increase is a result of higher outstanding debt levels and the related interest expense on borrowings under our Revolving Credit Facility used to finance the acquisition of EQ in June 2014. Additionally, we recorded $2.4 million of incremental non-cash amortization of deferred financing fees in 2015 primarily as a result of significant debt principal payments during the year.
Foreign currency gain (loss)
We recognized a $2.2 million non-cash foreign currency loss in 2015 compared with a $1.5 million non-cash foreign currency loss in 2014. Foreign currency gains and losses reflect changes in business activity conducted in a currency other than the USD, our functional currency. Our Stablex facility is located in Blainville, Québec, Canada and uses the CAD as its functional currency. Also, as part of our treasury management strategy we established intercompany loans between our parent company, US Ecology and Stablex. These intercompany loans are payable by Stablex to US Ecology in CAD requiring us to revalue the outstanding loan balance through our statements of operations based on USD/CAD currency movements from period to period. At December 31, 2015, we had $15.0 million of intercompany loans subject to currency revaluation.
Loss on divestiture
On November 1, 2015, we completed the divestiture of Allstate for cash proceeds of $58.8 million, subject to post-closing adjustments. We recognized a pre-tax loss on the divestiture of Allstate, including transaction-related costs, of $542,000 during the fourth quarter of 2015.
Impairment charges
On August 4, 2015, we entered into a definitive agreement to sell Allstate to a private investor group. Allstate represented the majority of the industrial services business we acquired with the acquisition of EQ. As a result of this agreement and management's strategic review, we evaluated the recoverability of the assets associated with our industrial services business. Based on this analysis, we recorded a non-cash goodwill impairment charge of $6.7 million in the second quarter of 2015. See Note 5 to the Consolidated Financial Statements in "Part II, Item 8. Financial Statements and Supplementary Data" of this Annual Report on Form 10-K for additional information on the sale of Allstate.
Depreciation and amortization of plant and equipment
Depreciation and amortization expense was $27.9 million in 2015, an increase of 14% compared to 2014. The acquired EQ operations contributed $13.9 million of depreciation and amortization expense in 2015 compared with $9.0 million of depreciation and amortization expense for our period of ownership in 2014. Excluding EQ operations, depreciation and amortization expense was $14.0 million in 2015, compared with $15.4 million in 2014.
Amortization of intangibles
Intangible assets amortization expense was $12.3 million in 2015, an increase of 50% compared to 2014. Excluding intangible assets amortization expense of $11.1 million and $6.8 million recorded in 2015 and 2014, respectively, on new intangible assets recorded as a result of the acquisition of EQ, intangible assets amortization expense was $1.2 million in 2015, compared with $1.4 million in 2014.
48
Stock-based compensation
Stock-based compensation expense increased 84% to $2.3 million in 2015, compared with $1.3 million 2014 as a result of an increase in equity-based awards granted to employees.
Accretion and non-cash adjustment of closure and post-closure liabilities
Accretion and non-cash adjustment of closure and post-closure liabilities increased 73% to $4.6 million in 2015, compared with $2.7 million in 2014. The acquired EQ operations contributed $2.5 million of accretion and non-cash adjustment of closure and post-closure liabilities in 2015 compared with $1.2 million of accretion and non-cash adjustment of closure and post-closure liabilities for our period of ownership in 2014. Excluding EQ operations, accretion and non-cash adjustment of closure and post-closure liabilities was $2.1 million in 2015, compared with $1.5 million in 2014.
Liquidity and Capital Resources
Our primary sources of liquidity are cash and cash equivalents, cash generated from operations and borrowings under the Credit Agreement. At December 31, 2016, we had $7.0 million in cash and cash equivalents immediately available and $116.8 million of borrowing capacity available under our Revolving Credit Facility. We assess our liquidity in terms of our ability to generate cash to fund our operating, investing and financing activities. Our primary ongoing cash requirements are funding operations, capital expenditures, paying interest and required principal payments of our long-term debt, and paying declared dividends pursuant to our dividend policy. We believe future operating cash flows will be sufficient to meet our future operating, investing and dividend cash needs for the foreseeable future. Furthermore, existing cash balances and availability of additional borrowings under our Credit Agreement provide additional sources of liquidity should they be required.
Operating Activities. In 2016, net cash provided by operating activities was $74.6 million. This primarily reflects net income of $34.3 million, non-cash depreciation, amortization and accretion of $39.8 million, a decrease in accounts receivable of $10.9 million, share-based compensation expense of $2.9 million, non-cash amortization of debt issuance costs of $2.0 million, and a decrease in other assets of $1.2 million, partially offset by a decrease in accounts payable and accrued liabilities of $7.7 million, a decrease in deferred income taxes of $2.7 million, the gain recognized on the divestiture of the Augusta, Georgia facility in April 2016, final closing adjustments on the Allstate divestiture of $2.0 million, and a decrease in income taxes receivable of $2.0 million. Impacts on net income are due to the factors discussed above under "Results of Operations." The decrease in receivables is primarily attributable to the timing of customer payments. Changes in income taxes receivable and payable are primarily attributable to the timing of income tax payments.
Days sales outstanding were 73 days as of December 31, 2016, compared to 68 days as of December 31, 2015. The increase in days sales outstanding compared to December 31, 2015 is primarily attributable to a decrease in revenue in 2016, compared to 2015, which resulted in a higher proportion of accounts receivable as a percentage of revenues.
In 2015, net cash provided by operating activities was $71.5 million. This primarily reflects net income of $25.6 million, non-cash depreciation, amortization and accretion of $44.8 million, non-cash impairment charges of $6.7 million, a decrease in income taxes receivable of $4.8 million, non-cash amortization of debt issuance costs of $4.4 million, unrealized foreign currency losses of $3.3 million, share-based compensation expense of $2.3 million and a decrease in accounts receivable of $1.6 million, partially offset by a decrease in accounts payable and accrued liabilities of $6.5 million, a decrease in closure and post-closure obligations of $5.7 million, a decrease in deferred revenue of $4.4 million, a decrease in income taxes payable of $3.9 million and a decrease in deferred income taxes of $2.7 million. Impacts on net income are due to the factors discussed above under Results of Operations. The decrease in receivables and deferred revenue is primarily attributable to the timing of the treatment and disposal of
49
waste associated with a significant East Coast remedial cleanup project. The changes in income taxes receivable and payable are primarily attributable to the timing of income tax payments. The decrease in closure and post-closure obligations is primarily attributable to payments made for closure and post-closure activities primarily at our closed landfills.
In 2014, net cash provided by operating activities was $71.4 million. This primarily reflects net income of $38.2 million, non-cash depreciation, amortization and accretion of $35.3 million, unrealized foreign currency losses of $2.4 million, an increase in deferred revenue of $1.9 million and an increase in deferred income taxes of $2.0 million, partially offset by an increase in receivables of $4.4 million, a decrease in accounts payable and accrued liabilities of $2.9 million and an increase in income taxes receivable of $1.8 million. Impacts on net income are due to the factors discussed above under Results of Operations. Non-cash foreign currency losses reflect a weaker CAD relative to the USD in 2014. The increase in deferred revenue and receivables is primarily attributable to the timing of the treatment and disposal of waste associated with a significant East Coast remedial cleanup project. The changes in income taxes receivable are primarily attributable to the timing of income tax payments.
Investing Activities. In 2016, net cash used in investing activities was $42.0 million, primarily related to capital expenditures of $35.7 million, the purchase of the Vernon, California based RCRA Part B, liquids and solids waste treatment and storage facility of Evoqua Water Technologies LLC for $5.0 million and the purchase of Environmental Services Inc., ("ESI"), for $4.9 million, net of cash acquired, partially offset by proceeds from the divestiture of our Augusta, Georgia facility for $2.7 million, net of cash divested. Significant capital projects included construction of additional disposal capacity at our Blainville, Québec, Canada, Beatty, Nevada and Robstown, Texas facilities and equipment purchases and infrastructure upgrades at our corporate and operating facilities.
In 2015, net cash provided by investing activities was $20.3 million, primarily related to the divestiture of Allstate for $58.7 million, net of cash divested, partially offset by capital expenditures of $39.4 million. Significant capital projects included construction of additional disposal capacity at our Blainville, Québec, Canada and Robstown, Texas locations and equipment purchases and infrastructure upgrades at all of our corporate and operating facilities.
In 2014, net cash used in investing activities was $488.5 million, primarily related to the purchase of EQ for $460.9 million, net of cash acquired, and capital expenditures of $28.4 million. Significant capital projects included construction of additional disposal capacity at our Blainville, Québec, Canada location and equipment purchases and infrastructure upgrades at all of our corporate and operating facilities.
Financing Activities. During 2016, net cash used in financing activities was $31.6 million, consisting primarily of $18.0 million of payments on our Term Loan and $15.7 million of dividend payments to our stockholders, partially offset by $2.2 million of net proceeds on our Revolving Credit Facility to fund working capital requirements.
During 2015, net cash used in financing activities was $108.4 million, consisting primarily of $94.6 million of payments on our Term Loan and $15.6 million of dividend payments to our stockholders.
During 2014, net cash provided by financing activities was $366.8 million, consisting primarily of $414.0 million of net proceeds from our new Term Loan used to partially finance the acquisition of EQ, offset in part by $19.4 million of term loan repayments, $15.5 million of dividend payments to our stockholders and $14.0 million of deferred financing costs associated with our Credit Agreement.
Credit Facility
On June 17, 2014, in connection with the acquisition of EQ, the Company entered into a new $540.0 million senior secured credit agreement (the "Credit Agreement") with a syndicate of banks comprised of a $415.0 million term loan (the "Term Loan") with a maturity date of June 17, 2021 and a $125.0 million revolving line of credit (the "Revolving Credit Facility") with a maturity date of June 17,
50
2019. Upon entering into the Credit Agreement, the Company terminated its existing credit agreement with Wells Fargo, dated October, 29, 2010, as amended (the "Former Agreement"). Immediately prior to the termination of the Former Agreement, there were no outstanding borrowings under the Former Agreement. No early termination penalties were incurred as a result of the termination of the Former Agreement.
Term Loan
The Term Loan provides an initial commitment amount of $415.0 million, the proceeds of which were used to acquire 100% of the outstanding shares of EQ and pay related transaction fees and expenses. The Term Loan bears interest at a base rate (as defined in the Credit Agreement) plus 2.00% or LIBOR plus 3.00%, at the Company's option. The Term Loan is subject to amortization in equal quarterly installments in an aggregate annual amount equal to 1.00% of the original principal amount of the Term Loan. At December 31, 2016, the effective interest rate on the Term Loan, including the impact of our interest rate swap, was 4.76%. Interest only payments are due either monthly or on the last day of any interest period, as applicable. As set forth in the Credit Agreement, the Company is required to enter into one or more interest rate hedge agreements in amounts sufficient to fix the interest rate on at least 50% of the principal amount of the $415.0 million Term Loan. In October 2014, the Company entered into an interest rate swap agreement with Wells Fargo, effectively fixing the interest rate on $210.0 million, or 74%, of the Term Loan principal outstanding as of December 31, 2016.
Revolving Credit Facility
The Revolving Credit Facility provides up to $125.0 million of revolving credit loans or letters of credit with the use of proceeds restricted solely for working capital and other general corporate purposes. Under the Revolving Credit Facility, revolving loans are available based on a base rate (as defined in the Credit Agreement) or LIBOR, at the Company's option, plus an applicable margin which is determined according to a pricing grid under which the interest rate decreases or increases based on our ratio of funded debt to consolidated earnings before interest, taxes, depreciation and amortization (as defined in the Credit Agreement). The Company is required to pay a commitment fee of 0.50% per annum on the unused portion of the Revolving Credit Facility, with such commitment fee to be reduced based upon the Company's total leverage ratio (as defined in the Credit Agreement). The maximum letter of credit capacity under the Revolving Credit Facility is $50.0 million and the Credit Agreement provides for a letter of credit fee equal to the applicable margin for LIBOR loans under the Revolving Credit Facility. Interest payments are due either monthly or on the last day of any interest period, as applicable. At December 31, 2016, there were $2.2 million of working capital borrowings outstanding on the Revolving Credit Facility. These borrowings are due "on demand" and presented as short-term debt in the consolidated balance sheets. The availability under the Revolving Credit Facility was $116.8 million with $6.0 million of the Revolving Credit Facility issued in the form of standby letters of credit utilized as collateral for closure and post-closure financial assurance and other assurance obligations.
See Note 15 to the Consolidated Financial Statements in "Part II, Item 8. Financial Statements and Supplementary Data" of this Annual Report on Form 10-K for additional information on the Company's debt.
51
Contractual Obligations and Guarantees
Contractual Obligations
US Ecology's contractual obligations at December 31, 2016 become due as follows:
| |
Payments Due by Period | |||||||||||||||
|---|---|---|---|---|---|---|---|---|---|---|---|---|---|---|---|---|
$s in thousands
|
Total | 2017 | 2018 - 2019 | 2020 - 2021 | Thereafter | |||||||||||
Closure and post-closure obligations(1) |
$ | 310,553 | $ | 2,735 | $ | 5,239 | $ | 18,977 | $ | 283,602 | ||||||
Operating lease commitments |
13,194 | 6,189 | 6,246 | 430 | 329 | |||||||||||
Credit agreement obligations(2) |
283,040 | 2,903 | 5,806 | 274,331 | — | |||||||||||
Interest expense(3) |
56,575 | 13,350 | 25,523 | 17,702 | — | |||||||||||
| | | | | | | | | | | | | | | | | |
Total contractual obligations |
$ | 663,362 | $ | 25,177 | $ | 42,814 | $ | 311,440 | $ | 283,931 | ||||||
| | | | | | | | | | | | | | | | | |
| | | | | | | | | | | | | | | | | |
| | | | | | | | | | | | | | | | | |
- (1)
- For
the purposes of the table above, closure and post-closure obligations are shown on an undiscounted basis and inflated using an estimated annual inflation rate of
2.6%. Cash payments for closure and post-closure obligation extend to the year 2105.
- (2)
- The
Term Loan portion of the Credit Agreement with Wells Fargo matures on June 17, 2021 and is subject to amortization in equal quarterly installments in an
aggregate annual amount of $2.9 million beginning March 31, 2017, with a final payment for the remaining principal balance due upon maturity.
- (3)
- Interest expense has been calculated using the effective interest rate of 3.75% in effect at December 31, 2016 on the unhedged variable rate portion of the outstanding principal and 5.17% on the fixed rate hedged portion of the outstanding principal beginning December 31, 2014, the effective date of the Company's interest rate swap agreement with Wells Fargo. The interest expense calculation reflects assumed principal reductions consistent with the disclosures in footnote (2) above.
Guarantees
We enter into a wide range of indemnification arrangements, guarantees and assurances in the ordinary course of business and have evaluated agreements that contain guarantees and indemnification clauses. These include tort indemnities, tax indemnities, indemnities against third-party claims arising out of arrangements to provide services to us and indemnities related to the sale of our securities. We also indemnify individuals made party to any suit or proceeding if that individual was acting as an officer or director of US Ecology or was serving at the request of US Ecology or any of its subsidiaries during their tenure as a director or officer. We also provide guarantees and indemnifications for the benefit of our wholly-owned subsidiaries to satisfy performance obligations, including closure and post-closure financial assurances. It is difficult to quantify the maximum potential liability under these indemnification arrangements; however, we are not currently aware of any material liabilities to the Company or any of its subsidiaries arising from these arrangements.
Environmental Matters
We maintain funded trusts agreements, surety bonds and insurance policies for future closure and post-closure obligations at both current and formerly operated disposal facilities. These funded trust agreements, surety bonds and insurance policies are based on management estimates of future closure and post-closure monitoring using engineering evaluations and interpretations of regulatory requirements which are periodically updated. Accounting for closure and post-closure costs includes final disposal cell capping and revegetation, soil and groundwater monitoring and routine maintenance and surveillance required after a site is closed.
52
We estimate that our undiscounted future closure and post-closure costs for all facilities was approximately $310.6 million at December 31, 2016, with a median payment year of 2061. Our future closure and post-closure estimates are our best estimate of current costs and are updated periodically to reflect current technology, cost of materials and services, applicable laws, regulations, permit conditions or orders and other factors. These current costs are adjusted for anticipated annual inflation, which we assumed to be 2.6% as of December 31, 2016. These future closure and post-closure estimates are discounted to their present value for financial reporting purposes using our credit-adjusted risk-free interest rate, which approximates our incremental long-term borrowing rate in effect at the time the obligation is established or when there are upward revisions to our estimated closure and post-closure costs. At December 31, 2016, our weighted-average credit-adjusted risk-free interest rate was 5.9%. For financial reporting purposes, our recorded closure and post-closure obligations were $75.1 million and $71.2 million as of December 31, 2016 and 2015, respectively.
Through December 31, 2016, we have met our financial assurance requirements through insurance, surety bonds, standby letters of credit and self-funded restricted trusts.
US Operating and Non-Operating Facilities
We cover our closure and post-closure obligations for our U.S. operating facilities through the use of third-party insurance policies, surety bonds and standby letters of credit. Insurance policies covering our closure and post-closure obligations expire in December 2017. Our total policy limits are approximately $81.6 million. At December 31, 2016 our trust accounts had $5.8 million for our closure and post-closure obligations and are identified as Restricted cash and investments on our consolidated balance sheets.
All closure and post-closure funding obligations for our Beatty, Nevada and Richland, Washington facilities revert to the respective State. Volume based fees are collected from our customers and remitted to state controlled trust funds to cover the estimated cost of closure and post-closure obligations.
Stablex
We use commercial surety bonds to cover our closure obligations for our Stablex facility located in Blainville, Québec, Canada. Our lease agreement with the Province of Québec requires that the surety bond be maintained for 25 years after the lease expires in 2023. At December 31, 2016 we had $686,000 in commercial surety bonds dedicated for closure obligations. These bonds were renewed in November and December 2016 and expire in November and December 2017. Post-closure funding obligations for the Stablex landfill revert back to the Province of Québec through a dedicated trust account that is funded based on a per-metric-ton disposed fee by Stablex.
We expect to renew insurance policies and commercial surety bonds in the future. If we are unable to obtain adequate closure, post-closure or environmental liability insurance and/or commercial surety bonds in future years, any partial or completely uninsured claim against us, if successful and of sufficient magnitude, could have a material adverse effect on our financial condition, results of operations or cash flows. Additionally, continued access to casualty and pollution legal liability insurance with sufficient limits, at acceptable terms, is important to obtaining new business. Failure to maintain adequate financial assurance could also result in regulatory action including early closure of facilities. While we believe we will be able to maintain the requisite financial assurance policies at a reasonable cost, premium and collateral requirements may materially increase.
Operation of disposal facilities creates operational, closure and post-closure obligations that could result in unplanned monitoring and corrective action costs. We cannot predict the likelihood or effect of all such costs, new laws or regulations, litigation or other future events affecting our facilities. We do not believe that continuing to satisfy our environmental obligations will have a material adverse effect on our financial condition or results of operations.
53
Seasonal Effects
Seasonal fluctuations due to weather and budgetary cycles can influence the timing of customer spending for our services. Typically, in the first quarter of each calendar year there is less demand for our services due to reduced construction and business activities related to weather while we experience improvement in our second and third quarters of each calendar year as weather conditions and other business activity improves.
Critical Accounting Policies
Our discussion and analysis of our financial condition and results of operations are based upon our consolidated financial statements, which have been prepared in accordance with GAAP. The preparation of these financial statements require us to make estimates and judgments that affect the reported amounts of assets, liabilities, revenues and expenses and related disclosure of contingent assets and liabilities. On an ongoing basis, we evaluate our estimates included in our critical accounting policies discussed below and those accounting policies and use of estimates discussed in Notes 2 and 3 to the Consolidated Financial Statements located in "Part II, Item 8. Financial Statements and Supplementary Data" of this Annual Report on Form 10-K. We base our estimates on historical experience and on various assumptions and other factors we believe to be reasonable, the results of which form the basis for making judgments about the carrying values of assets and liabilities that are not readily apparent from other sources. We make adjustments to judgments and estimates based on current facts and circumstances on an ongoing basis. Historically, actual results have not deviated significantly from those determined using the estimates described below or in Notes 2 and 3 to the Consolidated Financial Statements located in "Part II, Item 8. Financial Statements and Supplementary Data" to this Annual Report on Form 10-K. However, actual amounts could differ materially from those estimated at the time the consolidated financial statements are prepared.
We believe the following critical accounting policies are important to understand our financial condition and results of operations and require management's most difficult, subjective or complex judgments, often as a result of the need to estimate the effect of matters that are inherently uncertain.
Revenue Recognition
We recognize revenue when persuasive evidence of an arrangement exists, delivery and disposal have occurred or services have been rendered, the price is fixed or determinable and collection is reasonably assured. We recognize revenue from three primary sources: 1) waste treatment, recycling and disposal, 2) field and industrial waste management services and 3) waste transportation services.
Waste treatment and disposal revenue results primarily from fees charged to customers for treatment and/or disposal or recycling of specified wastes. Waste treatment and disposal revenue is generally charged on a per-ton or per-yard basis based on contracted prices and is recognized when services are complete.
Field and industrial waste management services revenue results primarily from specialty onsite services such as high-pressure cleaning, tank cleaning, decontamination, remediation, transportation, spill cleanup and emergency response at refineries, chemical plants, steel and automotive plants, and other government, commercial and industrial facilities. These services are provided based on purchase orders or agreements with the customer and include prices based upon daily, hourly or job rates for equipment, materials and personnel. Revenues are recognized over the term of the agreements or as services are performed. Revenue is recognized on contracts with retainage when services have been rendered and collectability is reasonably assured.
Transportation revenue results from delivering customer waste to a disposal facility for treatment and/or disposal or recycling. Transportation services are generally not provided on a stand-alone basis and instead are bundled with other Company services. However, in some instances we provide transportation and
54
logistics services for shipment of waste from cleanup sites to disposal facilities operated by other companies. We account for our bundled arrangements as multiple deliverable arrangements and determine the amount of revenue recognized for each deliverable (unit of accounting) using the relative fair value method. Transportation revenue is recognized when the transported waste is received at the disposal facility. Waste treatment and disposal revenue under bundled arrangements is recognized when services are complete and the waste is disposed in the landfill.
Burial fees collected from customers for each ton or cubic yard of waste disposed in our landfills are paid to the respective local and/or state government entity and are not included in revenue. Revenue and associated costs from waste that has been received but not yet treated and disposed of in our landfills are deferred until disposal occurs.
Our Richland, Washington disposal facility is regulated by the WUTC, which approves our rates for disposal of LLRW. Annual revenue levels are established based on a six-year rate agreement with the WUTC at amounts sufficient to cover the costs of operation and provide us with a reasonable profit. Per-unit rates charged to LLRW customers during the year are based on our evaluation of disposal volume and radioactivity projections submitted to us by waste generators. Our proposed rates are then reviewed and approved by the WUTC. If annual revenue exceeds the approved levels set by the WUTC, we are required to refund excess collections to facility users on a pro-rata basis. The current rate agreement with the WUTC was extended in 2013 and is effective until January 1, 2020.
Disposal Facility Accounting
We amortize landfill and disposal assets and certain related permits over their estimated useful lives. The units-of-consumption method is used to amortize landfill cell construction and development costs and asset retirement costs. Under the units-of-consumption method, we include costs incurred to date as well as future estimated construction costs in the amortization base of the landfill assets. Additionally, where appropriate, as discussed below, we also include probable expansion airspace that has yet to be permitted in the calculation of the total remaining useful life of the landfill asset. If we determine that expansion capacity should no longer be considered in calculating the total remaining useful life of a landfill asset, we may be required to recognize an asset impairment or incur significantly higher amortization expense over the remaining estimated useful life of the landfill asset. If at any time we make the decision to abandon the expansion effort, the capitalized costs related to the expansion effort would be expensed in the period of abandonment.
Our landfill assets and liabilities fall into the following two categories, each of which require accounting judgments and estimates:
- •
- Landfill assets comprised of capitalized landfill development costs.
- •
- Disposal facility retirement obligations relating to our capping, closure and post-closure liabilities that result in corresponding retirement assets.
Landfill Assets
Landfill assets include the costs of landfill site acquisition, permits and cell design and construction incurred to date. Landfill cells represent individual disposal areas within the overall treatment and disposal site and may be subject to specific permit requirements in addition to the general permit requirements associated with the overall site.
To develop, construct and operate a landfill cell, we must obtain permits from various regulatory agencies at the local, state and federal levels. The permitting process requires an initial site study to determine whether the location is feasible for landfill operations. The initial studies are reviewed by our environmental management group and then submitted to the regulatory agencies for approval. During the
55
development stage we capitalize certain costs that we incur after site selection but before the receipt of all required permits if we believe that it is probable that the landfill cell will be permitted.
Upon receipt of regulatory approval, technical landfill cell designs are prepared. The technical designs, which include the detailed specifications to develop and construct all components of the landfill cell including the types and quantities of materials that will be required, are reviewed by our environmental management group. The technical designs are submitted to the regulatory agencies for approval. Upon approval of the technical designs, the regulatory agencies issue permits to develop and operate the landfill cell.
The types of costs that are detailed in the technical design specifications generally include excavation, natural and synthetic liners, construction of leachate collection systems, installation of groundwater monitoring wells, construction of leachate management facilities and other costs associated with the development of the site. We review the adequacy of our cost estimates at least annually. These development costs, together with any costs incurred to acquire, design and permit the landfill cell, including personnel costs of employees directly associated with the landfill cell design, are recorded to the landfill asset on the balance sheet as incurred.
To match the expense related to the landfill asset with the revenue generated by the landfill operations, we amortize the landfill asset on a units-of-consumption basis over its operating life, typically on a cubic yard or cubic meter of disposal space consumed. The landfill asset is fully amortized at the end of a landfill cell's operating life. The per-unit amortization rate is calculated by dividing the sum of the landfill asset net book value plus estimated future development costs (as described above) for the landfill cell, by the landfill cell's estimated remaining disposal capacity. Amortization rates are influenced by the original cost basis of the landfill cell, including acquisition costs, which in turn is determined by geographic location and market values. We have secured significant landfill assets through business acquisitions and valued them at the time of acquisition based on fair value.
Included in the technical designs are factors that determine the ultimate disposal capacity of the landfill cell. These factors include the area over which the landfill cell will be developed, such as the depth of excavation, the height of the landfill cell elevation and the angle of the side-slope construction. Landfill cell capacity used in the determination of amortization rates of our landfill assets includes both permitted and unpermitted disposal capacity. Unpermitted disposal capacity is included when management believes achieving final regulatory approval is probable based on our analysis of site conditions and interactions with applicable regulatory agencies.
We review the estimates of future development costs and remaining disposal capacity for each landfill cell at least annually. These costs and disposal capacity estimates are developed using input from independent engineers and internal technical and accounting managers and are reviewed and approved by our environmental management group. Any changes in future estimated costs or estimated disposal capacity are reflected prospectively in the landfill cell amortization rates.
We assess our long-lived landfill assets for impairment when an event occurs or circumstances change that indicate the carrying amount may not be recoverable. Examples of events or circumstances that may indicate impairment of any of our landfill assets include, but are not limited to, the following:
- •
- Changes in legislative or regulatory requirements impacting the landfill site permitting process making it more difficult and costly to obtain
and/or maintain a landfill permit;
- •
- Actions by neighboring parties, private citizen groups or others to oppose our efforts to obtain, maintain or expand permits, which could result in denial, revocation or suspension of a permit and adversely impact the economic viability of the landfill. As a result of opposition to our obtaining a permit, improved technical information as a project progresses, or changes in the anticipated economics associated with a project, we may decide to reduce the scope of, or abandon, a project, which could result in an asset impairment; and
56
- •
- Unexpected significant increases in estimated costs, significant reductions in prices we are able to charge our customers or reductions in disposal capacity that affect the ongoing economic viability of the landfill.
Disposal Facility Retirement Obligations
Disposal facility retirement obligations include the cost to close, maintain and monitor landfill cells and support facilities. As individual landfill cells reach capacity, we must cap and close the cells in accordance with the landfill cell permits. These capping and closure requirements are detailed in the technical design of each landfill cell and included as part of our approved regulatory permit. After the entire landfill cell has reached capacity and is certified closed, we must continue to maintain and monitor the landfill cell for a post-closure period, which generally extends for 30 years. Costs associated with closure and post-closure requirements generally include maintenance of the landfill cell and groundwater systems, and other activities that occur after the landfill cell has ceased accepting waste. Costs associated with post-closure monitoring generally include groundwater sampling, analysis and statistical reports, transportation and disposal of landfill leachate, and erosion control costs related to the final cap.
We have a legally enforceable obligation to operate our landfill cells in accordance with the specific requirements, regulations and criteria set forth in our permits. This includes executing the approved closure/post-closure plan and closing/capping the entire landfill cell in accordance with the established requirements, design and criteria contained in the permit. As a result, we record the fair value of our disposal facility retirement obligations as a liability in the period in which the regulatory obligation to retire a specific asset is triggered. For our individual landfill cells, the required closure and post-closure obligations under the terms of our permits and our intended operation of the landfill cell are triggered and recorded when the cell is placed into service and waste is initially disposed in the landfill cell. The fair value is based on the total estimated costs to close the landfill cell and perform post-closure activities once the landfill cell has reached capacity and is no longer accepting waste, discounted using a credit-adjusted risk-free rate. Retirement obligations are increased each year to reflect the passage of time by accreting the balance at the weighted average credit-adjusted risk-free rate that is used to calculate the recorded liability, with accretion charged to direct operating costs. Actual cash expenditures to perform closure and post-closure activities reduce the retirement obligation liabilities as incurred. After initial measurement, asset retirement obligations are adjusted at the end of each period to reflect changes, if any, in the estimated future cash flows underlying the obligation. Disposal facility retirement assets are capitalized as the related disposal facility retirement obligations are incurred. Disposal facility retirement assets are amortized on a units-of-consumption basis as the disposal capacity is consumed.
Our disposal facility retirement obligations represent the present value of current cost estimates to close, maintain and monitor landfills and support facilities as described above. Cost estimates are developed using input from independent engineers, internal technical and accounting managers, as well as our environmental management group's interpretation of current legal and regulatory requirements, and are intended to approximate fair value. We estimate the timing of future payments based on expected annual disposal airspace consumption and then inflate the current cost estimate by an inflation rate, estimated at December 31, 2016 to be 2.6%. Inflated current costs are then discounted using our credit-adjusted risk-free interest rate, which approximates our incremental borrowing rate in effect at the time the obligation is established or when there are upward revisions to our estimated closure and post-closure costs. Our weighted-average credit-adjusted risk-free interest rate at December 31, 2016 was approximately 5.9%. Final closure and post-closure obligations are currently estimated as being paid through the year 2105. During 2016 we updated several assumptions, including estimated costs and timing of closing our disposal cells. These updates resulted in a net increase to our post-closure obligations of $1.7 million.
We update our estimates of future capping, closure and post-closure costs and of future disposal capacity for each landfill cell on an annual basis. Changes in inflation rates or the estimated costs, timing or extent of the required future activities to close, maintain and monitor landfills and facilities result in both: (i) a
57
current adjustment to the recorded liability and related asset and (ii) a change in accretion and amortization rates which are applied prospectively over the remaining life of the asset. A hypothetical 1% increase in the inflation rate would increase our closure/post-closure obligation by $18.0 million. A hypothetical 10% increase in our cost estimates would increase our closure/post-closure obligation by $8.1 million.
Goodwill and Intangible Assets
As of December 31, 2016, the Company's goodwill balance was $193.6 million. We assess goodwill for impairment during the fourth quarter as of October 1 of each year, and also if an event occurs or circumstances change that would more likely than not reduce the fair value of a reporting unit below its carrying amount. The assessment consists of comparing the fair value of the reporting unit to the carrying value of the net assets assigned to the reporting unit, including goodwill. Some of the factors that could indicate impairment include a significant adverse change in legal factors or in the business climate, an adverse action or assessment by a regulator, or failure to generate sufficient cash flows at the reporting unit. For example, field and industrial services represents an emerging business for the Company and has been the focus of a shift in strategy since the acquisition of EQ. Failure to execute on planned growth initiatives within this business could lead to the impairment of goodwill and intangible assets in future periods.
We determine our reporting units by identifying the components of each operating segment, and then aggregate components having similar economic characteristics based on quantitative and/or qualitative factors. At December 31, 2016, we had 15 reporting units, 10 of which had allocated goodwill.
Fair values are generally determined by using both the market approach, applying a multiple of earnings based on guideline for publicly traded companies, and the income approach, discounting projected future cash flows based on our expectations of the current and future operating environment. Estimating future cash flows requires significant judgment about factors such as general economic conditions and projected growth rates, and our estimates often vary from the cash flows eventually realized. The rates used to discount projected future cash flows reflect a weighted average cost of capital based on our industry, capital structure and risk premiums including those reflected in the current market capitalization. In the event the fair value of a reporting unit exceeds its carrying amount, goodwill of the reporting unit is considered not impaired. If the carrying amount of a reporting unit exceeds its fair value, the second step of the goodwill test would be performed to measure the amount of impairment loss. In the event that we determine that the value of goodwill has become impaired, we will incur an accounting charge for the amount of impairment during the period in which the determination has been made.
The result of the annual assessment of goodwill undertaken in the fourth quarter of 2016 indicated that the fair value of each of our reporting units was substantially in excess of its respective carrying value.
We review intangible assets with indefinite useful lives for impairment during the fourth quarter as of October 1 of each year. Fair value is generally determined by considering an internally developed discounted projected cash flow analysis. Estimating future cash flows requires significant judgment about factors such as general economic conditions and projected growth rates, and our estimates often vary from the cash flows eventually realized. If the fair value of an asset is determined to be less than the carrying amount of the intangible asset, an impairment in the amount of the difference is recorded in the period in which the annual assessment occurs.
The result of the annual assessment of intangible assets with indefinite useful lives undertaken in the fourth quarter of 2016 indicated no impairment charges were required.
We also review finite-lived intangible assets for impairment whenever events or changes in circumstances indicate that the carrying value of an intangible asset may not be recoverable. In order to assess whether a potential impairment exists, the assets' carrying values are compared with their undiscounted expected
58
future cash flows. Estimating future cash flows requires significant judgment about factors such as general economic conditions and projected growth rates, and our estimates often vary from the cash flows eventually realized. Impairments are measured by comparing the fair value of the asset to its carrying value. Fair value is generally determined by considering: (i) the internally developed discounted projected cash flow analysis; (ii) a third-party valuation; and/or (iii) information available regarding the current market environment for similar assets. If the fair value of an intangible asset is determined to be less than the carrying amount of the intangible asset, an impairment in the amount of the difference is recorded in the period in which the events or changes in circumstances that indicated the carrying value of the intangible assets may not be recoverable occurred.
The result of the assessment of finite-lived intangible assets undertaken in 2016 indicated no impairment charges were required.
On August 4, 2015, we entered into a definitive agreement to sell Allstate to a private investor group. Allstate represents the majority of the industrial services business we acquired with the acquisition of EQ. As a result of this agreement and management's strategic review, we evaluated the recoverability of the assets associated with our industrial services business. Our interim goodwill impairment test which included both Step I and Step II analysis was performed and resulted in a non-cash goodwill impairment charge of $6.7 million being recognized in the second quarter of 2015. See Note 5 to the Consolidated Financial Statements in "Part II, Item 8. Financial Statements and Supplementary Data" of this Annual Report on Form 10-K for additional information on the sale of Allstate.
No events or circumstances occurred during 2016 that would indicate that our intangible assets may be impaired, therefore no other impairment tests were performed during 2016 other than the annual assessment of goodwill and intangible assets with indefinite useful lives conducted in the fourth quarter of every year.
Our acquired permits and licenses generally have renewal terms of approximately 5-10 years. We have a history of renewing these permits and licenses as demonstrated by the fact that each of the sites' treatment permits and licenses have been renewed regularly since the facility began operations. We intend to continue to renew our permits and licenses as they come up for renewal for the foreseeable future. Costs incurred to renew or extend the term of our permits and licenses are recorded in Selling, general and administrative expenses in our consolidated statements of operations.
Share Based Payments
On May 27, 2015, our stockholders approved the Omnibus Incentive Plan ("Omnibus Plan"), which was approved by our Board of Directors on April 7, 2015. The Omnibus Plan was developed to provide additional incentives through equity ownership in US Ecology and, as a result, encourage employees and directors to contribute to our success. The Omnibus Plan provides, among other things, the ability for the Company to grant restricted stock, performance stock, options, stock appreciation rights, restricted stock units, performance stock units ("PSUs") and other stock-based awards or cash awards to officers, employees, consultants and non-employee directors. Subsequent to the approval of the Omnibus Plan in May 2015, we stopped granting equity awards under our 2008 Stock Option Incentive Plan and our 2006 Restricted Stock Plan ("Previous Plans"), and the Previous Plans will remain in effect solely for the settlement of awards granted under the Previous Plans. No shares that are reserved but unissued under the Previous Plans or that are outstanding under the Previous Plans and reacquired by the Company for any reason will be available for issuance under the Omnibus Plan. The Omnibus Plan expires on April 7, 2025 and authorizes 1,500,000 shares of common stock for grant over the life of the Omnibus Plan.
As of December 31, 2016, we have PSUs outstanding under the Omnibus Plan. Each PSU represents the right to receive, on the settlement date, one share of the Company's common stock. The total number of PSUs each participant is eligible to earn ranges from 0% to 200% of the target number of PSUs granted. The actual number of PSUs that will vest and be settled in shares is determined at the end of a three-year
59
performance period, based on total stockholder return relative to a set of peer companies and the S&P 600. The fair value of the PSUs is determined using a Monte Carlo simulation. Refer to Note 18 to the Consolidated Financial Statements in "Part II, Item 8. Financial Statements and Supplementary Data" of this Annual Report on Form 10-K for a summary of the assumptions utilized in the Monte Carlo valuation of awards granted during 2016 and 2015.
As of December 31, 2016, we have stock option awards outstanding under the 1992 Stock Option Plan for Employees ("1992 Employee Plan") and the 2008 Stock Option Incentive Plan ("2008 Stock Option Plan"). Subsequent to the approval of the Omnibus Plan in May 2015, we stopped granting equity awards under the 2008 Stock Option Plan. The 2008 Stock Option Plan will remain in effect solely for the settlement of awards previously granted. In April 2013, the 1992 Employee Plan expired and was cancelled except for options then outstanding.
The determination of fair value of stock option awards on the date of grant using the Black-Scholes model is affected by our stock price and subjective assumptions. These assumptions include, but are not limited to, the expected term of stock options and expected stock price volatility over the term of the awards. Refer to Note 18 to the Consolidated Financial Statements in "Part II, Item 8. Financial Statements and Supplementary Data" of this Annual Report on Form 10-K for a summary of the assumptions utilized in 2016, 2015 and 2014. Our stock options have characteristics significantly different from those of traded options, and changes in the assumptions can materially affect the fair value estimates.
Forfeitures are estimated at the time of grant and revised, if necessary, in subsequent periods if actual forfeitures differ from those estimates. When actual forfeitures vary from our estimates, we recognize the difference in compensation expense in the period the actual forfeitures occur or when options vest.
Income Taxes
Income taxes are accounted for using an asset and liability approach whereby we recognize deferred tax assets and liabilities for the expected future tax consequences of temporary differences between the financial statement and tax basis of assets and liabilities at the applicable tax rates. The effect of a change in tax rates on deferred tax assets and liabilities is recognized in the period that includes the enactment date. Deferred tax assets are evaluated for the likelihood of use in future periods. A valuation allowance is recorded against deferred tax assets if, based on the weight of the available evidence, it is more likely than not that some or all of the deferred tax assets will not be realized. The determination of the need for a valuation allowance, if any, requires our judgment and the use of estimates. If we determine that we would be able to realize our deferred tax assets in the future in excess of their net recorded amount, we would make an adjustment to the deferred tax asset valuation allowance, which would reduce the provision for income taxes. As of December 31, 2016, we have deferred tax assets totaling approximately $24.3 million, a valuation allowance of $3.1 million and deferred tax liabilities totaling approximately $102.6 million.
The application of income tax law is inherently complex. Tax laws and regulations are voluminous and at times ambiguous and interpretations of guidance regarding such tax laws and regulations change over time. This requires us to make many subjective assumptions and judgments regarding the timing and amounts of deductible and taxable items and the probability of sustaining uncertain tax positions. A liability for uncertain tax positions is recorded in our financial statements on the basis of a two-step process whereby (1) we determine whether it is more likely than not that the tax position taken will be sustained based on the technical merits of the position and (2) for those tax positions that meet the more likely than not recognition threshold, we recognize the largest amount of tax benefit that is greater than 50% likely to be realized upon ultimate settlement with the related tax authority. As facts and circumstances change, we reassess these probabilities and record any changes in the financial statements as appropriate. Changes in our assumptions and judgments can materially affect our financial position, results of operations and cash flows. We recognize interest assessed by taxing authorities or interest associated with uncertain tax positions as a component of interest expense. We recognize any penalties assessed by taxing authorities or
60
penalties associated with uncertain tax positions as a component of selling, general and administrative expenses.
Litigation
We have, in the past, been involved in litigation requiring estimates of timing and loss potential whose timing and ultimate disposition is controlled by the judicial process. As of December 31, 2016, we did not have any ongoing, pending or threatened legal action that management believes, either individually or in the aggregate, would have a material adverse effect on our financial position, results of operations or cash flows. The decision to accrue costs or write off assets is based on the pertinent facts and our evaluation of present circumstances.
Off Balance Sheet Arrangements
We do not have any off balance sheet arrangements or interests in variable interest entities that would require consolidation. US Ecology operates through wholly-owned subsidiaries.
ITEM 7A. QUANTITATIVE AND QUALITATIVE DISCLOSURES ABOUT MARKET RISK
Interest Rate Risk
We do not maintain equities, commodities, derivatives, or any other similar instruments for trading purposes. We have minimal interest rate risk on investments or other assets due to our preservation of capital approach to investments. At December 31, 2016, $5.8 million of restricted cash was invested in fixed-income U.S. Treasury and U.S. government agency securities and money market accounts.
We are exposed to changes in interest rates as a result of our borrowings under the Credit Agreement. Under the Credit Agreement, Term Loan borrowings incur interest at a base rate (as defined in the Credit Agreement) or LIBOR, at the Company's option, plus an applicable margin. Revolving loans under the Revolving Credit Facility are available based on a base rate (as defined in the Credit Agreement) or LIBOR, at the Company's option, plus an applicable margin which is determined according to a pricing grid under which the interest rate decreases or increases based on our ratio of funded debt to consolidated earnings before interest, taxes, depreciation and amortization (as defined in the Credit Agreement). On October 29, 2014, the Company entered into an interest rate swap agreement with Wells Fargo with the intention of hedging the Company's interest rate exposure on a portion of the Company's outstanding LIBOR-based variable rate debt. Under the terms of the swap, effective December 31, 2014, the Company will pay to Wells Fargo interest at the fixed effective rate of 5.17% and will receive from Wells Fargo interest at the variable one-month LIBOR rate on an initial notional amount of $250.0 million.
As of December 31, 2016, there were $283.0 million of borrowings outstanding under the Term Loan and $2.2 million of working capital borrowings outstanding under the Revolving Credit Facility. If interest rates were to rise and outstanding balances remain unchanged, we would be subject to higher interest payments on our outstanding debt. Subsequent to the effective date of the interest rate swap on December 31, 2014, we would be subject to higher interest payments on only the unhedged borrowings under the Credit Agreement.
Based on the outstanding indebtedness of $285.2 million under our Credit Agreement at December 31, 2016 and the impact of our interest rate hedge, if market rates used to calculate interest expense were to average 1% higher in the next twelve months, our interest expense would increase by approximately $665,000 for the corresponding period.
Foreign Currency Risk
We are subject to currency exposures and volatility because of currency fluctuations. The majority of our transactions are in USD; however, our Canadian subsidiaries conduct business in both Canada and the
61
United States. In addition, contracts for services that our Canadian subsidiaries provide to U.S. customers are generally denominated in USD. During 2016, our Canadian subsidiaries transacted approximately 54% of their revenue in USD and at any time have cash on deposit in USD and outstanding USD trade receivables and payables related to these transactions. These USD cash, receivable and payable accounts are subject to non-cash foreign currency translation gains or losses. Exchange rate movements also affect the translation of Canadian generated profits and losses into USD.
We established intercompany loans between our Canadian subsidiaries and our parent company, US Ecology, as part of a tax and treasury management strategy allowing for repayment of third-party bank debt. These intercompany loans are payable using CAD and are subject to mark-to-market adjustments with movements in the CAD. At December 31, 2016, we had $20.8 million of intercompany loans outstanding between our Canadian subsidiaries and US Ecology. During 2016, the CAD weakened as compared to the USD resulting in a $107,000 non-cash foreign currency translation loss being recognized in the Company's consolidated statements of operations related to the intercompany loans. Based on intercompany balances as of December 31, 2016, a $0.01 CAD increase or decrease in currency rate compared to the USD at December 31, 2016 would have generated a gain or loss of approximately $208,000 for the year ended December 31, 2016.
We had a total pre-tax foreign currency loss of $138,000 for the year ended December 31, 2016. We currently have no foreign exchange contracts, option contracts or other foreign currency hedging arrangements. Management evaluates our risk position on an ongoing basis to determine whether foreign exchange hedging strategies should be employed.
62
ITEM 8. FINANCIAL STATEMENTS AND SUPPLEMENTARY DATA
63
REPORT OF INDEPENDENT REGISTERED PUBLIC ACCOUNTING FIRM
To
the Board of Directors and Stockholders of
US Ecology, Inc.
Boise, Idaho
We have audited the accompanying consolidated balance sheets of US Ecology, Inc. and subsidiaries (the "Company") as of December 31, 2016 and 2015, and the related consolidated statements of operations, comprehensive income, stockholders' equity, and cash flows for each of the three years in the period ended December 31, 2016. We also have audited the Company's internal control over financial reporting as of December 31, 2016, based on criteria established in Internal Control—Integrated Framework (2013) issued by the Committee of Sponsoring Organizations of the Treadway Commission. The Company's management is responsible for these financial statements, for maintaining effective internal control over financial reporting, and for its assessment of the effectiveness of internal control over financial reporting, included in the accompanying Management's Annual Report on Internal Controls over Financial Reporting. Our responsibility is to express an opinion on these financial statements and an opinion on the Company's internal control over financial reporting based on our audits.
As described in Management's Annual Report on Internal Controls over Financial Reporting, management excluded from its assessment the internal control over financial reporting at Environmental Services Inc. ("ESI") and the Vernon, California based RCRA Part B, liquids and solids waste treatment and storage facility of Evoqua Water Technologies LLC ("Vernon"), which were acquired May 2, 2016 and October 1, 2016 and whose financial statements constitute 1% and 1% of total assets, respectively, and 1% and less than 1% of revenues, respectively, of the consolidated financial statement amounts as of and for the year ended December 31, 2016. Accordingly, our audits did not include the internal control over financial reporting at ESI and Vernon.
We conducted our audits in accordance with the standards of the Public Company Accounting Oversight Board (United States). Those standards require that we plan and perform the audit to obtain reasonable assurance about whether the financial statements are free of material misstatement and whether effective internal control over financial reporting was maintained in all material respects. Our audits of the financial statements included examining, on a test basis, evidence supporting the amounts and disclosures in the financial statements, assessing the accounting principles used and significant estimates made by management, and evaluating the overall financial statement presentation. Our audit of internal control over financial reporting included obtaining an understanding of internal control over financial reporting, assessing the risk that a material weakness exists, and testing and evaluating the design and operating effectiveness of internal control based on the assessed risk. Our audits also included performing such other procedures as we considered necessary in the circumstances. We believe that our audits provide a reasonable basis for our opinions.
A company's internal control over financial reporting is a process designed by, or under the supervision of, the company's principal executive and principal financial officers, or persons performing similar functions, and effected by the company's board of directors, management, and other personnel to provide reasonable assurance regarding the reliability of financial reporting and the preparation of financial statements for external purposes in accordance with generally accepted accounting principles. A company's internal control over financial reporting includes those policies and procedures that (1) pertain to the maintenance of records that, in reasonable detail, accurately and fairly reflect the transactions and dispositions of the assets of the company; (2) provide reasonable assurance that transactions are recorded as necessary to permit preparation of financial statements in accordance with generally accepted accounting principles, and that receipts and expenditures of the company are being made only in accordance with authorizations of management and directors of the company; and (3) provide reasonable assurance regarding prevention or timely detection of unauthorized acquisition, use, or disposition of the company's assets that could have a material effect on the financial statements.
64
Because of the inherent limitations of internal control over financial reporting, including the possibility of collusion or improper management override of controls, material misstatements due to error or fraud may not be prevented or detected on a timely basis. Also, projections of any evaluation of the effectiveness of the internal control over financial reporting to future periods are subject to the risk that the controls may become inadequate because of changes in conditions, or that the degree of compliance with the policies or procedures may deteriorate.
In our opinion, the consolidated financial statements referred to above present fairly, in all material respects, the financial position of US Ecology, Inc. and subsidiaries as of December 31, 2016 and 2015, and the results of their operations and their cash flows for each of the three years in the period ended December 31, 2016, in conformity with accounting principles generally accepted in the United States of America. Also, in our opinion, the Company maintained, in all material respects, effective internal control over financial reporting as of December 31, 2016, based on the criteria established in Internal Control—Integrated Framework (2013) issued by the Committee of Sponsoring Organizations of the Treadway Commission.
/s/ DELOITTE & TOUCHE LLP
Boise,
Idaho
February 27, 2017
65
US ECOLOGY, INC.
CONSOLIDATED BALANCE SHEETS
(In thousands, except per share amounts)
| |
As of December 31, | ||||||
|---|---|---|---|---|---|---|---|
| |
2016 | 2015 | |||||
Assets |
|||||||
Current Assets: |
|||||||
Cash and cash equivalents |
$ | 7,015 | $ | 5,989 | |||
Receivables, net |
96,819 | 106,380 | |||||
Prepaid expenses and other current assets |
7,458 | 8,484 | |||||
Income taxes receivable |
4,076 | 2,017 | |||||
| | | | | | | | |
Total current assets |
115,368 | 122,870 | |||||
Property and equipment, net |
226,237 |
210,334 |
|||||
Restricted cash and investments |
5,787 | 5,748 | |||||
Intangible assets, net |
234,356 | 239,571 | |||||
Goodwill |
193,621 | 191,823 | |||||
Other assets |
1,031 | 1,641 | |||||
| | | | | | | | |
Total assets |
$ | 776,400 | $ | 771,987 | |||
| | | | | | | | |
| | | | | | | | |
| | | | | | | | |
Liabilities And Stockholders' Equity |
|||||||
Current Liabilities: |
|||||||
Accounts payable |
$ | 13,948 | $ | 17,169 | |||
Deferred revenue |
7,820 | 8,078 | |||||
Accrued liabilities |
22,605 | 25,634 | |||||
Accrued salaries and benefits |
10,720 | 11,513 | |||||
Income taxes payable |
165 | 117 | |||||
Current portion of closure and post-closure obligations |
2,256 | 2,787 | |||||
Revolving credit facility |
2,177 | — | |||||
Current portion of long-term debt |
2,903 | 3,056 | |||||
| | | | | | | | |
Total current liabilities |
62,594 | 68,354 | |||||
Long-term closure and post-closure obligations |
72,826 |
68,367 |
|||||
Long-term debt |
274,459 | 290,684 | |||||
Other long-term liabilities |
5,164 | 5,825 | |||||
Deferred income taxes |
81,333 | 82,622 | |||||
| | | | | | | | |
Total liabilities |
496,376 | 515,852 | |||||
Commitments and contingencies |
|||||||
Stockholders' Equity: |
|||||||
Common stock $0.01 par value, 50,000 authorized; 21,780 and 21,744 shares issued, respectively |
218 | 217 | |||||
Additional paid-in capital |
172,704 | 169,873 | |||||
Retained earnings |
121,879 | 103,300 | |||||
Treasury stock, at cost, 7 and 5 shares, respectively |
(52 | ) | (189 | ) | |||
Accumulated other comprehensive loss |
(14,725 | ) | (17,066 | ) | |||
| | | | | | | | |
Total stockholders' equity |
280,024 | 256,135 | |||||
| | | | | | | | |
Total liabilities and stockholders' equity |
$ | 776,400 | $ | 771,987 | |||
| | | | | | | | |
| | | | | | | | |
| | | | | | | | |
The accompanying notes are an integral part of these financial statements.
66
US ECOLOGY, INC.
CONSOLIDATED STATEMENTS OF OPERATIONS
(In thousands, except per share amounts)
| |
For the Year Ended December 31, | |||||||||
|---|---|---|---|---|---|---|---|---|---|---|
| |
2016 | 2015 | 2014 | |||||||
Revenue |
$ | 477,665 | $ | 563,070 | $ | 447,411 | ||||
Direct operating costs |
330,070 | 391,660 | 301,625 | |||||||
| | | | | | | | | | | |
Gross profit |
147,595 | 171,410 | 145,786 | |||||||
Selling, general and administrative expenses |
77,566 | 93,079 | 73,336 | |||||||
Impairment charges |
— | 6,700 | — | |||||||
| | | | | | | | | | | |
Operating income |
70,029 | 71,631 | 72,450 | |||||||
Other income (expense), net: |
||||||||||
Interest income |
96 | 65 | 107 | |||||||
Interest expense |
(17,317 | ) | (23,370 | ) | (10,677 | ) | ||||
Foreign currency loss |
(138 | ) | (2,196 | ) | (1,499 | ) | ||||
Gain (loss) on divestiture |
2,034 | (542 | ) | — | ||||||
Other |
597 | 1,267 | 669 | |||||||
| | | | | | | | | | | |
Total other income (expense), net |
(14,728 | ) | (24,776 | ) | (11,400 | ) | ||||
Income before income taxes |
55,301 | 46,855 | 61,050 | |||||||
Income tax expense |
21,049 | 21,244 | 22,814 | |||||||
| | | | | | | | | | | |
Net income |
$ | 34,252 | $ | 25,611 | $ | 38,236 | ||||
| | | | | | | | | | | |
| | | | | | | | | | | |
| | | | | | | | | | | |
Earnings per share: |
||||||||||
Basic |
$ | 1.58 | $ | 1.18 | $ | 1.78 | ||||
Diluted |
$ | 1.57 | $ | 1.18 | $ | 1.77 | ||||
Shares used in earnings per share calculation: |
||||||||||
Basic |
21,704 | 21,637 | 21,537 | |||||||
Diluted |
21,789 | 21,733 | 21,655 | |||||||
The accompanying notes are an integral part of these financial statements.
67
US ECOLOGY, INC.
CONSOLIDATED STATEMENTS OF COMPREHENSIVE INCOME
(In thousands)
| |
For the Year Ended December 31, | |||||||||
|---|---|---|---|---|---|---|---|---|---|---|
| |
2016 | 2015 | 2014 | |||||||
Net income |
$ | 34,252 | $ | 25,611 | $ | 38,236 | ||||
Other comprehensive income (loss): |
||||||||||
Foreign currency translation gain (loss) |
1,379 | (8,380 | ) | (3,863 | ) | |||||
Net changes in interest rate hedge, net of taxes of $517, ($539) and ($1,098), respectively |
962 | (1,000 | ) | (2,038 | ) | |||||
| | | | | | | | | | | |
Comprehensive income, net of tax |
$ | 36,593 | $ | 16,231 | $ | 32,335 | ||||
| | | | | | | | | | | |
| | | | | | | | | | | |
| | | | | | | | | | | |
The accompanying notes are an integral part of these financial statements.
68
US ECOLOGY, INC.
CONSOLIDATED STATEMENTS OF CASH FLOWS
(In thousands)
| |
For the Year Ended December 31, | |||||||||
|---|---|---|---|---|---|---|---|---|---|---|
| |
2016 | 2015 | 2014 | |||||||
Cash flows from operating activities: |
||||||||||
Net income |
$ | 34,252 | $ | 25,611 | $ | 38,236 | ||||
Adjustments to reconcile net income to net cash provided by operating activities: |
||||||||||
Impairment charges |
— | 6,700 | — | |||||||
Depreciation and amortization of property and equipment |
25,304 | 27,931 | 24,413 | |||||||
Amortization of intangible assets |
10,575 | 12,307 | 8,207 | |||||||
Accretion of closure and post-closure obligations |
3,953 | 4,584 | 2,656 | |||||||
Unrealized foreign currency loss |
65 | 3,271 | 2,427 | |||||||
Deferred income taxes |
(2,704 | ) | (2,714 | ) | 2,035 | |||||
Share-based compensation expense |
2,925 | 2,297 | 1,250 | |||||||
Unrecognized tax benefits |
— | — | (480 | ) | ||||||
Loss (gain) on disposition of business |
(2,034 | ) | 542 | — | ||||||
Net loss (gain) on disposition of assets |
(569 | ) | 741 | 421 | ||||||
Amortization of debt issuance costs |
2,006 | 4,428 | 1,037 | |||||||
Amortization of debt discount |
148 | 148 | 74 | |||||||
Changes in assets and liabilities (net of effects of business acquisitions and divestitures): |
||||||||||
Receivables |
10,912 | 1,565 | (4,400 | ) | ||||||
Income taxes receivable |
(2,043 | ) | 4,830 | (1,798 | ) | |||||
Other assets |
1,149 | 734 | (921 | ) | ||||||
Accounts payable and accrued liabilities |
(7,735 | ) | (6,481 | ) | (2,878 | ) | ||||
Deferred revenue |
(281 | ) | (4,449 | ) | 1,890 | |||||
Accrued salaries and benefits |
(864 | ) | (901 | ) | 771 | |||||
Income taxes payable |
49 | (3,918 | ) | (389 | ) | |||||
Closure and post-closure obligations |
(481 | ) | (5,679 | ) | (1,182 | ) | ||||
| | | | | | | | | | | |
Net cash provided by operating activities |
74,627 | 71,547 | 71,369 | |||||||
Cash flows from investing activities: |
||||||||||
Proceeds from divestitures (net of cash divested) |
2,723 | 58,728 | — | |||||||
Purchases of property and equipment |
(35,696 | ) | (39,370 | ) | (28,434 | ) | ||||
Purchases of restricted cash and investments |
(2,317 | ) | (2,075 | ) | (1,060 | ) | ||||
Proceeds from sale of restricted cash and investments |
2,278 | 2,057 | 1,023 | |||||||
Proceeds from sale of short term investments |
— | — | 654 | |||||||
Proceeds from sale of property and equipment |
991 | 948 | 201 | |||||||
Business acquisitions (net of cash acquired) |
(9,983 | ) | — | (460,874 | ) | |||||
| | | | | | | | | | | |
Net cash provided by (used in) investing activities |
(42,004 | ) | 20,288 | (488,490 | ) | |||||
Cash flows from financing activities: |
||||||||||
Payments on long-term debt |
(17,954 | ) | (94,623 | ) | (19,384 | ) | ||||
Dividends paid |
(15,673 | ) | (15,612 | ) | (15,532 | ) | ||||
Proceeds from revolving credit facility |
49,405 | 10,316 | — | |||||||
Payments on revolving credit facility |
(47,228 | ) | (10,316 | ) | — | |||||
Proceeds from exercise of stock options |
229 | 1,823 | 1,542 | |||||||
Proceeds from issuance of long-term debt |
— | — | 413,962 | |||||||
Deferred financing costs paid |
— | — | (14,001 | ) | ||||||
Payment of equipment financing obligations |
(179 | ) | — | — | ||||||
Other |
(189 | ) | 54 | 206 | ||||||
| | | | | | | | | | | |
Net cash (used in) provided by financing activities |
(31,589 | ) | (108,358 | ) | 366,793 | |||||
Effect of foreign exchange rate changes on cash |
(8 | ) | (459 | ) | (641 | ) | ||||
Increase (decrease) in cash and cash equivalents |
1,026 | (16,982 | ) | (50,969 | ) | |||||
Cash and cash equivalents at beginning of year |
5,989 | 22,971 | 73,940 | |||||||
| | | | | | | | | | | |
Cash and cash equivalents at end of year |
$ | 7,015 | $ | 5,989 | $ | 22,971 | ||||
| | | | | | | | | | | |
| | | | | | | | | | | |
| | | | | | | | | | | |
The accompanying notes are an integral part of these financial statements.
69
US ECOLOGY, INC.
CONSOLIDATED STATEMENTS OF STOCKHOLDERS' EQUITY
(In thousands, except share amounts)
| |
Common Shares Issued |
Common Stock |
Additional Paid-In Capital |
Retained Earnings |
Treasury Stock |
Accumulated Other Comprehensive Income (Loss) |
Total | |||||||||||||||
|---|---|---|---|---|---|---|---|---|---|---|---|---|---|---|---|---|---|---|---|---|---|---|
Balance at December 31, 2013 |
21,537,576 | $ | 215 | $ | 162,830 | $ | 70,597 | $ | (319 | ) | $ | (1,785 | ) | $ | 231,538 | |||||||
Net income |
— | — | — | 38,236 | — | — | 38,236 | |||||||||||||||
Other comprehensive loss |
— | — | — | — | — | (5,901 | ) | (5,901 | ) | |||||||||||||
Dividend paid |
— | — | — | (15,532 | ) | — | — | (15,532 | ) | |||||||||||||
Tax benefit of equity based awards |
— | — | 667 | — | — | — | 667 | |||||||||||||||
Share-based compensation |
— | — | 1,250 | — | — | — | 1,250 | |||||||||||||||
Stock option exercises |
93,621 | 1 | 1,264 | — | — | — | 1,265 | |||||||||||||||
Repurchase of common stock: 4,860 shares |
— | — | — | — | (186 | ) | — | (186 | ) | |||||||||||||
Issuance of restricted common stock |
1,246 | — | — | — | — | — | — | |||||||||||||||
Issuance of restricted common stock from treasury shares |
— | — | (487 | ) | — | 487 | — | — | ||||||||||||||
| | | | | | | | | | | | | | | | | | | | | | | |
Balance at December 31, 2014 |
21,632,443 | 216 | 165,524 | 93,301 | (18 | ) | (7,686 | ) | 251,337 | |||||||||||||
Net income |
— | — | — | 25,611 | — | — | 25,611 | |||||||||||||||
Other comprehensive loss |
— | — | — | — | — | (9,380 | ) | (9,380 | ) | |||||||||||||
Dividend paid |
— | — | — | (15,612 | ) | — | — | (15,612 | ) | |||||||||||||
Tax benefit of equity based awards |
— | — | 376 | — | — | — | 376 | |||||||||||||||
Share-based compensation |
— | — | 2,297 | — | — | — | 2,297 | |||||||||||||||
Stock option exercises |
80,112 | 1 | 1,822 | — | — | — | 1,823 | |||||||||||||||
Repurchase of common stock: 6,150 shares |
— | — | — | — | (317 | ) | — | (317 | ) | |||||||||||||
Issuance of restricted common stock |
31,417 | — | — | — | — | — | — | |||||||||||||||
Issuance of restricted common stock from treasury shares |
— | — | (146 | ) | — | 146 | — | — | ||||||||||||||
| | | | | | | | | | | | | | | | | | | | | | | |
Balance at December 31, 2015 |
21,743,972 | 217 | 169,873 | 103,300 | (189 | ) | (17,066 | ) | 256,135 | |||||||||||||
Net income |
— | — | — | 34,252 | — | — | 34,252 | |||||||||||||||
Other comprehensive gain |
— | — | — | — | — | 2,341 | 2,341 | |||||||||||||||
Dividend paid |
— | — | — | (15,673 | ) | — | — | (15,673 | ) | |||||||||||||
Tax benefit of equity based awards |
— | — | 85 | — | — | — | 85 | |||||||||||||||
Share-based compensation |
— | — | 2,925 | — | — | — | 2,925 | |||||||||||||||
Stock option exercises |
11,856 | — | 229 | — | — | — | 229 | |||||||||||||||
Repurchase of common stock: 6,589 shares |
— | — | — | — | (271 | ) | — | (271 | ) | |||||||||||||
Issuance of restricted common stock |
23,888 | 1 | — | — | — | — | 1 | |||||||||||||||
Issuance of restricted common stock from treasury shares |
— | — | (408 | ) | — | 408 | — | — | ||||||||||||||
| | | | | | | | | | | | | | | | | | | | | | | |
Balance at December 31, 2016 |
21,779,716 | $ | 218 | $ | 172,704 | $ | 121,879 | $ | (52 | ) | $ | (14,725 | ) | $ | 280,024 | |||||||
| | | | | | | | | | | | | | | | | | | | | | | |
| | | | | | | | | | | | | | | | | | | | | | | |
| | | | | | | | | | | | | | | | | | | | | | | |
The accompanying notes are an integral part of these financial statements.
70
US ECOLOGY, INC.
NOTES TO CONSOLIDATED FINANCIAL STATEMENTS
NOTE 1. DESCRIPTION OF BUSINESS
US Ecology, Inc. was most recently incorporated as a Delaware corporation in May 1987 as American Ecology Corporation. On February 22, 2010 the Company changed its name from American Ecology Corporation to US Ecology, Inc. US Ecology, Inc., through its subsidiaries, is a leading North American provider of environmental services to commercial and government entities. The Company addresses the complex waste management needs of its customers, offering treatment, disposal and recycling of hazardous and radioactive waste, as well as a wide range of complementary field and industrial services. Headquartered in Boise, Idaho, with operations in the United States, Canada and Mexico, US Ecology, Inc. has been protecting the environment since 1952. Throughout these financial statements words such as "we," "us," "our," "US Ecology" and the "Company" refer to US Ecology, Inc. and its subsidiaries.
On June 17, 2014, the Company acquired 100% of the outstanding shares of EQ Holdings, Inc. and its wholly-owned subsidiaries (collectively "EQ"). The acquisition of EQ significantly expanded the Company's service offerings, specifically in the areas of field and industrial services. As such, we have made changes to the manner in which we manage our business, make operating decisions and assess our performance. Under our new structure, our operations are managed in two reportable segments reflecting our internal reporting structure and nature of services offered: Environmental Services and Field & Industrial Services.
Our Environmental Services segment provides a broad range of hazardous material management services including the transportation, recycling, treatment and disposal of hazardous and non-hazardous waste at Company-owned landfill, wastewater and other treatment facilities.
Our Field & Industrial Services segment provides packaging and collection of hazardous waste and total waste management solutions at customer sites and through our 10-day storage facilities. Services include on-site management, waste characterization, transportation and disposal of non-hazardous and hazardous waste. This segment also provides specialty services such as high-pressure cleaning, tank cleaning, decontamination, remediation, transportation, spill cleanup and emergency response and other services to commercial and industrial facilities and to government entities. On November 1, 2015, we sold our Allstate Power Vac, Inc. ("Allstate") subsidiary, which was previously reported as part of our Field & Industrial Services segment, to a private investor group. See Note 5 for additional information.
NOTE 2. SUMMARY OF SIGNIFICANT ACCOUNTING POLICIES
Principles of Consolidation
The accompanying financial statements are prepared on a consolidated basis. All inter-company balances and transactions have been eliminated in consolidation. Our year-end is December 31.
Cash and Cash Equivalents
Cash and cash equivalents consist primarily of cash on deposit, money market accounts or short-term investments with remaining maturities of 90 days or less at the date of acquisition. Cash and cash equivalents totaled $7.0 million and $6.0 million at December 31, 2016 and 2015, respectively. At December 31, 2016 and 2015, we had $4.8 million and $2.1 million, respectively, of cash at our operations outside the United States.
71
US ECOLOGY, INC.
NOTES TO CONSOLIDATED FINANCIAL STATEMENTS (Continued)
NOTE 2. SUMMARY OF SIGNIFICANT ACCOUNTING POLICIES (Continued)
Receivables
Receivables are stated at an amount management expects to collect. Based on management's assessment of the credit history of the customers having outstanding balances and factoring in current economic conditions, management has concluded that potential unidentified losses on balances outstanding at year-end will not be material.
Unbilled receivables are recorded for work performed under contracts that have not yet been invoiced to customers and arise due to the timing of billings. Substantially all unbilled receivables at December 31, 2016, were billed in the following month.
Restricted Cash and Investments
Restricted cash and investments of $5.8 million and $5.7 million at December 31, 2016 and 2015, represent funds held in third-party managed trust accounts as collateral for our financial assurance obligations for post-closure activities at our non-operating facilities. These funds are invested in fixed-income U.S. Treasury and government agency securities and money market accounts. The balances are adjusted monthly to fair market value based on quoted prices in active markets for identical or similar assets.
Revenue Recognition
We recognize revenue when persuasive evidence of an arrangement exists, delivery and disposal have occurred or services have been rendered, the price is fixed or determinable and collection is reasonably assured. We recognize revenue from three primary sources: 1) waste treatment, recycling and disposal, 2) field and industrial waste management services and 3) waste transportation services.
Waste treatment and disposal revenue results primarily from fees charged to customers for treatment and/or disposal or recycling of specified wastes. Waste treatment and disposal revenue is generally charged on a per-ton or per-yard basis based on contracted prices and is recognized when services are complete.
Field and industrial waste management services revenue results primarily from specialty onsite services such as high-pressure cleaning, tank cleaning, decontamination, remediation, transportation, spill cleanup and emergency response at refineries, chemical plants, steel and automotive plants, and other government, commercial and industrial facilities. These services are provided based on purchase orders or agreements with the customer and include prices based upon daily, hourly or job rates for equipment, materials and personnel. Revenues are recognized over the term of the agreements or as services are performed. Revenue is recognized on contracts with retainage when services have been rendered and collectability is reasonably assured.
Transportation revenue results from delivering customer waste to a disposal facility for treatment and/or disposal or recycling. Transportation services are generally not provided on a stand-alone basis and instead are bundled with other Company services. However, in some instances we provide transportation and logistics services for shipment of waste from cleanup sites to disposal facilities operated by other companies. We account for our bundled arrangements as multiple deliverable arrangements and determine the amount of revenue recognized for each deliverable (unit of accounting) using the relative fair value method. Transportation revenue is recognized when the transported waste is received at the disposal facility. Waste treatment and disposal revenue under bundled arrangements is recognized when services are complete and the waste is disposed in the landfill.
72
US ECOLOGY, INC.
NOTES TO CONSOLIDATED FINANCIAL STATEMENTS (Continued)
NOTE 2. SUMMARY OF SIGNIFICANT ACCOUNTING POLICIES (Continued)
Burial fees collected from customers for each ton or cubic yard of waste disposed in our landfills are paid to the respective local and/or state government entity and are not included in revenue. Revenue and associated cost from waste that has been received but not yet treated and disposed of in our landfills are deferred until disposal occurs.
Our Richland, Washington disposal facility is regulated by the Washington Utilities and Transportation Commission ("WUTC"), which approves our rates for disposal of low-level radioactive waste ("LLRW"). Annual revenue levels are established based on a rate agreement with the WUTC at amounts sufficient to cover the costs of operation, including facility maintenance, equipment replacement and related costs, and provide us with a reasonable profit. Per-unit rates charged to LLRW customers during the year are based on our evaluation of disposal volume and radioactivity projections submitted to us by waste generators. Our proposed rates are then reviewed and approved by the WUTC. If annual revenue exceeds the approved levels set by the WUTC, we are required to refund excess collections to facility users on a pro-rata basis. Refundable excess collections, if any, are recorded in Accrued liabilities in the consolidated balance sheets. The current rate agreement with the WUTC was extended in 2013 and is effective until January 1, 2020.
Deferred Revenue
Revenue from waste that has been received but not yet treated or disposed or advance billings prior to treatment and disposal services are deferred until such services are completed.
Property and Equipment
Property and equipment are recorded at cost and depreciated on the straight-line method over estimated useful lives. Replacements and major repairs of property and equipment are capitalized and retirements are made when assets are disposed of or when the useful life has been exhausted. Minor components and parts are expensed as incurred. Repair and maintenance expenses were $11.8 million, $13.9 million and $12.2 million for the years ended December 31, 2016, 2015 and 2014, respectively.
We assume no salvage value for our depreciable fixed assets. The estimated useful lives for significant property and equipment categories are as follows:
| |
Useful Lives | |
|---|---|---|
Vehicles and other equipment |
3 to 10 years | |
Disposal facility and equipment |
3 to 20 years | |
Buildings and improvements |
5 to 40 years | |
Railcars |
40 years |
Disposal Cell Accounting
Qualified disposal cell development costs such as personnel and equipment costs incurred to construct new disposal cells are recorded and capitalized at cost. Capitalized cell development costs, net of recorded amortization, are added to estimated future costs of the permitted disposal cell to be incurred over the remaining construction of the cell, to determine the amount to be amortized over the remaining estimated cell life. Estimates of future costs are developed using input from independent engineers and internal technical and accounting managers. We review these estimates at least annually. Amortization is recorded
73
US ECOLOGY, INC.
NOTES TO CONSOLIDATED FINANCIAL STATEMENTS (Continued)
NOTE 2. SUMMARY OF SIGNIFICANT ACCOUNTING POLICIES (Continued)
on a unit of consumption basis, typically applying cost as a rate per cubic yard disposed. Disposal facility costs are expected to be fully amortized upon final closure of the facility, as no salvage value applies. Costs associated with ongoing disposal operations are charged to expense as incurred.
We have material financial commitments for closure and post-closure obligations for certain facilities we own or operate. We estimate future cost requirements for closure and post-closure monitoring based on RCRA and conforming state requirements and facility permits. RCRA requires that companies provide the responsible regulatory agency acceptable financial assurance for closure work and subsequent post-closure monitoring of each facility for 30 years following closure. Estimates for final closure and post-closure costs are developed using input from our technical and accounting managers as well as independent engineers and are reviewed by management at least annually. These estimates involve projections of costs that will be incurred after the disposal facility ceases operations, through the required post-closure care period. The present value of the estimated closure and post-closure costs are accreted using the interest method of allocation to direct costs in our consolidated statements of operations so that 100% of the future cost has been incurred at the time of payment.
Business Combinations
We account for business combinations under the acquisition method of accounting. The cost of an acquired company is assigned to the tangible and identifiable intangible assets purchased and the liabilities assumed on the basis of their fair values at the date of acquisition. Any excess of purchase price over the fair value of net tangible and intangible assets acquired is assigned to goodwill. The transaction costs associated with business combinations are expensed as they are incurred.
Goodwill
Goodwill represents the excess of the fair value of the consideration transferred over the fair value of the underlying identifiable assets and liabilities acquired. Goodwill is not amortized, but instead is assessed for impairment annually in the fourth quarter as of October 1 and also if an event occurs or circumstances change that may indicate a possible impairment. In the event that we determine that the value of goodwill has become impaired, we will incur an accounting charge for the amount of impairment during the period in which the determination has been made. See Note 3 for additional information related to the Company's goodwill impairment tests. Goodwill was recognized in connection with our acquisitions of Environmental Services Inc. ("ESI") and the Vernon, California based RCRA Part B, liquids and solids waste treatment and storage facility of Evoqua Water Technologies LLC in 2016, EQ in 2014, Dynecol in 2012 and Stablex in 2010.
Intangible Assets
Intangible assets are stated at the fair value assigned in a business combination net of amortization. We amortize our finite-lived intangible assets using the straight-line method over their estimated economic lives ranging from 1 to 45 years. We review intangible assets with indefinite useful lives for impairment during the fourth quarter as of October 1 of each year. We also review both indefinite-lived and finite-lived intangible assets for impairment whenever events or changes in circumstances indicate that the carrying value of an intangible asset may not be recoverable.
Our acquired permits and licenses generally have renewal terms of approximately 5-10 years. We have a history of renewing these permits and licenses as demonstrated by the fact that each of the sites' treatment
74
US ECOLOGY, INC.
NOTES TO CONSOLIDATED FINANCIAL STATEMENTS (Continued)
NOTE 2. SUMMARY OF SIGNIFICANT ACCOUNTING POLICIES (Continued)
permits and licenses have been renewed regularly since the facility began operations. We intend to continue to renew our permits and licenses as they come up for renewal for the foreseeable future. Costs incurred to renew or extend the term of our permits and licenses are recorded in Selling, general and administrative expenses in our consolidated statements of operations.
Impairment of Long-Lived Assets
Long-lived assets consist primarily of property and equipment facility development costs and finite-lived intangible assets. The recoverability of long-lived assets is evaluated periodically through analysis of operating results and consideration of other significant events or changes in the business environment. If an operating unit had indications of possible impairment, we would evaluate whether impairment exists on the basis of undiscounted expected future cash flows from operations over the remaining amortization period. If an impairment loss were to exist, the carrying amount of the related long-lived assets would be reduced to their estimated fair value.
Deferred Financing Costs
Deferred financing costs are amortized over the life of our Credit Agreement. Amortization of deferred financing costs is included as a component of interest expense in the consolidated statements of operations. In April 2015, the FASB issued ASU No. 2015-03, Interest—Imputation of Interest (Subtopic 835-30), Simplifying the Presentation of Debt Issuance Costs. We elected to adopt this guidance in the fourth quarter of 2015. Deferred financing costs associated with our Term Loan were $5.0 million and $6.4 million, net of accumulated amortization and have been recorded to Long-term debt in the consolidated balance sheets as of December 31, 2016 and 2015, respectively.
Deferred financing costs associated with our Revolving Credit Facility were $1.4 million and $2.0 million, net of accumulated amortization and continue to be recorded in Prepaid expenses and other current assets and Other assets in the consolidated balance sheets as of December 31, 2016 and 2015, respectively.
Derivative Instruments
In order to manage interest rate exposure, we entered into an interest rate swap agreement in October 2014 that effectively converts a portion of our variable-rate debt to a fixed interest rate. Changes in the fair value of the interest rate swap are recorded as a component of accumulated other comprehensive income within stockholders' equity, and are recognized in interest expense in the period in which the payment is settled. The interest rate swap has an effective date of December 31, 2014 in an initial notional amount of $250.0 million. The Company does not hold or issue derivative financial instruments for trading or speculative purposes.
Foreign Currency
We have operations in Canada. The functional currency of our Canadian operations is the Canadian dollar ("CAD"). Assets and liabilities are translated to U.S. dollars ("USD") at the exchange rate in effect at the balance sheet date and revenue and expenses at the average exchange rate for the period. Gains and losses from the translation of the consolidated financial statements of our Canadian subsidiaries into USD are included in stockholders' equity as a component of Accumulated other comprehensive income. Gains and losses resulting from foreign currency transactions are recognized in the consolidated statements of operations. Recorded balances that are denominated in a currency other than the functional currency are
75
US ECOLOGY, INC.
NOTES TO CONSOLIDATED FINANCIAL STATEMENTS (Continued)
NOTE 2. SUMMARY OF SIGNIFICANT ACCOUNTING POLICIES (Continued)
re-measured to the functional currency using the exchange rate at the balance sheet date and gains or losses are recorded in the statements of operations.
Income Taxes
Income taxes are accounted for using an asset and liability approach. This requires the recognition of deferred tax assets and liabilities for the expected future tax consequences of temporary differences between the financial statement and tax basis of assets and liabilities at the applicable tax rates. The effect of a change in tax rates on deferred tax assets and liabilities is recognized in the period that includes the enactment date.
We recognize net deferred tax assets to the extent that we believe these assets are more likely than not to be realized. In making such a determination, we consider all available positive and negative evidence, including future reversals of existing taxable temporary differences, projected future taxable income, tax-planning strategies, and results of recent operations. If we determine that we would be able to realize our deferred tax assets in the future in excess of their net recorded amount, we would make an adjustment to the deferred tax asset valuation allowance, which would reduce the provision for income taxes.
The application of income tax law is inherently complex. Tax laws and regulations are voluminous and at times ambiguous and interpretations of guidance regarding such tax laws and regulations change over time. This requires us to make many subjective assumptions and judgments regarding the timing and amounts of deductible and taxable items and the probability of sustaining uncertain tax positions. A liability for uncertain tax positions is recorded in our consolidated financial statements on the basis of a two-step process whereby (1) we determine whether it is more likely than not that the tax position taken will be sustained based on the technical merits of the position and (2) for those tax positions that meet the more likely than not recognition threshold, we recognize the largest amount of tax benefit that is greater than 50% likely to be realized upon ultimate settlement with the related tax authority. As facts and circumstances change, we reassess these probabilities and record any changes in the financial statements as appropriate. Our tax returns are subject to audit by the Internal Revenue Service ("IRS"), various states in the U.S. and the Canadian Revenue Agency.
Insurance
Accrued costs for our self-insured health care coverage were $1.0 million and $1.1 million at December 31, 2016 and 2015, respectively.
Earnings Per Share
Basic earnings per share is calculated based on the weighted-average number of outstanding common shares during the applicable period. Diluted earnings per share is based on the weighted-average number of outstanding common shares plus the weighted-average number of potential outstanding common shares. Potential common shares that would increase earnings per share or decrease loss per share are anti-dilutive and are excluded from earnings per share computations. Earnings per share is computed separately for each period presented.
76
US ECOLOGY, INC.
NOTES TO CONSOLIDATED FINANCIAL STATEMENTS (Continued)
NOTE 2. SUMMARY OF SIGNIFICANT ACCOUNTING POLICIES (Continued)
Treasury Stock
Shares of common stock repurchased by us are recorded at cost as treasury stock and result in a reduction of stockholders' equity in our consolidated balance sheets. Treasury shares are reissued using the weighted average cost method for determining the cost of the shares reissued. The difference between the cost of the shares reissued and the issuance price is added or deducted from additional paid-in capital.
Recently Issued Accounting Pronouncements
In January 2017, the Financial Accounting Standards Board ("FASB") issued Accounting Standards Update ("ASU") No. 2017-04, Simplifying the Test for Goodwill Impairment (Topic 350). This ASU removes the requirement to compare the implied fair value of goodwill with its carrying amount as part of step 2 of the goodwill impairment test. As a result, under the ASU, "an entity should perform its annual, or interim, goodwill impairment test by comparing the fair value of a reporting unit with its carrying amount and should recognize an impairment charge for the amount by which the carrying amount exceeds the reporting unit's fair value; however, the loss recognized should not exceed the total amount of goodwill allocated to that reporting unit." The guidance is effective prospectively for annual and interim periods beginning after December 15, 2019. Early adoption is permitted. We are assessing the impact the adoption of ASU 2017-04 may have on our consolidated financial position, results of operations and cash flows.
In November 2016, the FASB issued ASU No. 2016-18, Restricted Cash (Topic 230). This ASU amends the guidance in Accounting Standards Codification ("ASC") 230 to add or clarify guidance on the classification and presentation of restricted cash in the statement of cash flows. The classification of restricted cash in the statement of cash flows, along with eight other cash flow-related issues, was initially addressed by the Emerging Issues Task Force ("EITF") in Issue 15-F. However, after deliberation of those issues, the EITF decided to address the diversity in practice related to the cash flow classification of restricted cash separately, in Issue 16-A. ASU 2016-18 is based on the EITF's consensuses reached on that Issue. The guidance is effective for annual and interim periods beginning after December 15, 2017. The guidance must be applied retrospectively to all periods presented. Early adoption is permitted. We are assessing the impact the adoption of ASU 2016-18 may have on our consolidated financial position and consolidated cash flows.
In August 2016, the FASB issued ASU No. 2016-15, Statements of Cash Flows (Topic 230). This ASU amends the guidance in ASC 230 on the classification of certain cash receipts and payments in the statement of cash flows. The primary purpose of the ASU is to reduce the diversity in practice that has resulted from the lack of consistent principles on this topic. The guidance is effective for annual and interim periods beginning after December 15, 2017. The guidance must be applied retrospectively to all periods presented. Early adoption is permitted. We are assessing the impact the adoption of ASU 2016-15 may have on our consolidated cash flows.
In March 2016, the FASB issued ASU No. 2016-09, Compensation—Stock Compensation (Topic 718). This ASU simplifies several aspects of the accounting for employee share-based transactions, including the accounting for income taxes, forfeitures and statutory tax withholding requirements, as well as classification in the statement of cash flows. The guidance is effective for annual and interim periods beginning after December 15, 2016. Early adoption is permitted in any interim or annual period, with any adjustments reflected as of the beginning of the fiscal year of adoption. We are assessing the impact the adoption of ASU 2016-09 may have on our consolidated financial position, results of operations and cash flows.
77
US ECOLOGY, INC.
NOTES TO CONSOLIDATED FINANCIAL STATEMENTS (Continued)
NOTE 2. SUMMARY OF SIGNIFICANT ACCOUNTING POLICIES (Continued)
In February 2016, the FASB issued ASU No. 2016-02, Leases (Topic 842). The ASU significantly changes the accounting model used by lessees to account for leases, requiring that all material leases be presented on the balance sheet. Lessees will recognize substantially all leases on the balance sheet as a right-of-use asset and a corresponding lease liability. The liability will be equal to the present value of lease payments. The asset will be based on the liability, subject to adjustment, such as for initial direct costs. The guidance is effective for annual and interim periods beginning after December 15, 2018. The guidance must be applied using the modified retrospective approach. Early adoption is permitted. We are assessing the impact the adoption of ASU 2016-02 may have on our consolidated financial position, results of operations and cash flows.
In May 2014, the FASB issued ASU No. 2014-09, Revenue from Contracts with Customers (Topic 606), which provides guidance for revenue recognition. The ASU's core principle is that a company will recognize revenue when it transfers promised goods or services to customers in an amount that reflects the consideration to which the company expects to be entitled in exchange for those goods or services. The guidance permits the use of either the retrospective or cumulative effect transition method. The ASU also requires enhanced disclosures regarding the nature, amount, timing, and uncertainty of revenues and cash flows from contracts with customers. In August 2015, the FASB issued ASU 2015-14: Revenue from Contracts with Customers (Topic 606): Deferral of the Effective Date, which deferred the effective date established in ASU 2014-09. The amendments in ASU 2014-09 are now effective for annual reporting periods beginning after December 15, 2017, including interim periods within that reporting period. Early adoption is permitted but not before annual periods beginning after December 15, 2016. The Company is in the process of evaluating the impact of adopting ASU 2014-19 on its consolidated financial statements. The Company is currently reviewing customer contracts in each of its operating segments for all services provided, assessing the impact of applying ASU 2014-19, and comparing this to the Company's historical revenue recognition criteria. Based upon the preliminary review of customer contracts, the Company believes that the Company's revenue recognition policies are consistent with the requirements of ASU 2014-19. While the Company continues to assess all potential impacts of adopting ASU 2014-19, based upon information available to date, the Company does not expect the adoption of ASU 2014-19 to have a significant impact either on the timing or recognition of revenues.
NOTE 3. USE OF ESTIMATES
The preparation of financial statements in conformity with accounting principles generally accepted in the United States requires management to make estimates and assumptions that affect the reported amounts of assets and liabilities and the disclosure of contingent assets and liabilities at the date of the financial statements, as well as the reported amounts of revenue and expenses during the reporting period. Listed below are the estimates and assumptions that we consider to be significant in the preparation of our consolidated financial statements.
- •
- Allowance for Doubtful Accounts—We estimate losses for uncollectible accounts based
on the aging of the accounts receivable and an evaluation of the likelihood of success in collecting the receivable.
- •
- Recovery of Long-Lived Assets—We evaluate the recovery of our long-lived assets
periodically by analyzing our operating results and considering significant events or changes in the business environment.
- •
- Income Taxes—We assume the deductibility of certain costs in our income tax filings, estimate our income tax rate and estimate the future recovery of deferred tax assets.
78
US ECOLOGY, INC.
NOTES TO CONSOLIDATED FINANCIAL STATEMENTS (Continued)
NOTE 3. USE OF ESTIMATES (Continued)
- •
- Legal and Environmental Accruals—We estimate the amount of potential exposure we
may have with respect to litigation and environmental claims and assessments.
- •
- Disposal Cell Development and Final Closure/Post-Closure Amortization—We expense
amounts for disposal cell usage and closure and post-closure costs for each cubic yard of waste disposed of at our operating facilities. In determining the amount to expense for each cubic yard of
waste disposed, we estimate the cost to develop each disposal cell and the closure and post-closure costs for each disposal cell and facility. The expense for each cubic yard is then calculated based
on the remaining permitted capacity and total permitted capacity. Estimates for closure and post-closure costs are developed using input from third-party engineering consultants, and our internal
technical and accounting personnel. Management reviews estimates at least annually. Estimates for final disposal cell closure and post-closure costs consider when the costs would actually be paid and,
where appropriate, inflation and discount rates.
- •
- Business Acquisitions—The Company records assets and liabilities of the acquired
business at their fair values. Acquisition-related transaction and restructuring costs are expensed rather than treated as part of the cost of the acquisition. Goodwill represents the excess of the
cost of an acquired business over the fair value of the identifiable tangible and intangible assets acquired and liabilities assumed in a business acquisition.
- •
- Goodwill—We assess goodwill for impairment during the fourth quarter as of
October 1 of each year or sooner if an event occurs or circumstances change that would more likely than not reduce the fair value of a reporting unit below its carrying amount. The assessment
consists of comparing the estimated fair value of the reporting unit to the carrying value of the net assets assigned to the reporting unit, including goodwill. Fair values are generally determined by
using both the market approach, applying a multiple of earnings based on guideline for publicly traded companies, and the income approach, discounting projected future cash flows based on our
expectations of the current and future operating environment. The rates used to discount projected future cash flows reflect a weighted average cost of capital based on our industry, capital structure
and risk premiums including those reflected in the current market capitalization. Estimating future cash flows requires significant judgment about factors such as general economic conditions and
projected growth rates, and our estimates often vary from the cash flows eventually realized. Failure to execute on planned growth initiatives within the related reporting units, coupled with the
other factors mentioned above, could lead to the impairment of goodwill and other long-lived assets in future periods.
- •
- Intangible Assets—We review intangible assets with indefinite useful lives for
impairment during the fourth quarter as of October 1 of each year. Fair value is generally determined by considering an internally-developed discounted projected cash flow analysis. If the fair
value of an asset is determined to be less than the carrying amount of the intangible asset, an impairment in the amount of the difference is recorded in the period in which the annual assessment
occurs.
We also review finite-lived intangible assets for impairment whenever events or changes in circumstances indicate that the carrying value of an intangible asset may not be recoverable. In order to assess whether a potential impairment exists, the assets' carrying values are compared with their undiscounted expected future cash flows. Estimating future cash flows requires significant judgment about factors such as general economic conditions and projected growth rates, and our estimates often vary from the cash flows eventually realized. Impairments are measured by comparing the fair value of the asset to its carrying value. Fair value is generally determined by considering: (i) the internally-developed discounted
79
US ECOLOGY, INC.
NOTES TO CONSOLIDATED FINANCIAL STATEMENTS (Continued)
NOTE 3. USE OF ESTIMATES (Continued)
projected cash flow analysis; (ii) a third-party valuation; and/or (iii) information available regarding the current market environment for similar assets. If the fair value is determined to be less than the carrying amount of the intangible assets, an impairment in the amount of the difference is recorded in the period in which the events or changes in circumstances that indicated the carrying value of the intangible assets may not be recoverable occurred.
Actual results could differ materially from the estimates and assumptions that we use in the preparation of our consolidated financial statements. As it relates to estimates and assumptions in amortization rates and environmental obligations, significant engineering, operations and accounting judgments are required. We review these estimates and assumptions no less than annually. In many circumstances, the ultimate outcome of these estimates and assumptions will not be known for decades into the future. Actual results could differ materially from these estimates and assumptions due to changes in applicable regulations, changes in future operational plans and inherent imprecision associated with estimating environmental impacts far into the future.
NOTE 4. BUSINESS COMBINATIONS
Environmental Services Inc.
On May 2, 2016, the Company acquired 100% of the outstanding shares of Environmental Services Inc., ("ESI"), an environmental services company based in Tilbury, Ontario, Canada. ESI is focused primarily on hazardous and non-hazardous transportation and disposal, hazardous and non-hazardous waste treatment, industrial services, confined space rescue and emergency response work throughout Ontario. The total purchase price was $4.9 million, net of cash acquired, and was funded with cash on hand. ESI is reported as part of our Environmental Services segment, however, revenues, net income, earnings per share and total assets of ESI are not material to our consolidated financial position or results of operations.
We allocated the purchase price to the assets acquired and liabilities assumed based on estimates of the fair value at the date of the acquisition, resulting in $1.0 million allocated to goodwill (which is not deductible for tax purposes), $813,000 allocated to intangible assets (primarily customer relationships) to be amortized over a weighted average life of approximately 14 years, and $686,000 allocated to indefinite-lived environmental permits.
Acquisition of Vernon, California Facility
On October 1, 2016, we acquired the Vernon, California based RCRA Part B, liquids and solids waste treatment and storage facility of Evoqua Water Technologies LLC for $5.0 million. The Vernon, California facility is reported as part of our Environmental Services segment, however, revenues, net income, earnings per share and total assets of the Vernon, California facility are not material to our consolidated financial position or results of operations.
We allocated the purchase price to the assets acquired and liabilities assumed based on estimates of the fair value at the date of the acquisition, resulting in $354,000 allocated to goodwill, $1.9 million allocated to intangible assets (primarily customer relationships) to be amortized over a weighted average life of approximately 20 years, and $1.3 million allocated to indefinite-lived environmental permits.
80
US ECOLOGY, INC.
NOTES TO CONSOLIDATED FINANCIAL STATEMENTS (Continued)
NOTE 4. BUSINESS COMBINATIONS (Continued)
EQ Holdings, Inc.
On June 17, 2014, the Company acquired 100% of the outstanding shares of EQ. EQ is a fully integrated environmental services company providing waste treatment and disposal, wastewater treatment, remediation, recycling, industrial cleaning and maintenance, transportation, total waste management, technical services, and emergency response services to a variety of industries and customers in North America. The total purchase price was $460.9 million, net of cash acquired, and was funded through a combination of cash on hand and borrowings under a new $415.0 million term loan.
As of June 30, 2015, the Company finalized the purchase accounting for the acquisition of EQ. The following table summarizes the final EQ purchase price allocation:
$s in thousands
|
Purchase Price Allocation |
|||
|---|---|---|---|---|
Current assets |
$ | 112,009 | ||
Property and equipment |
101,543 | |||
Identifiable intangible assets |
252,874 | |||
Current liabilities |
(58,312 | ) | ||
Other liabilities |
(139,068 | ) | ||
| | | | | |
Total identifiable net assets |
269,046 | |||
Goodwill |
197,600 | |||
| | | | | |
Total purchase price |
$ | 466,646 | ||
| | | | | |
| | | | | |
| | | | | |
Goodwill of $197.6 million arising from the acquisition is the result of several factors. EQ has an assembled workforce that serves the U.S. industrial market utilizing state-of-the-art technology to treat a wide range of industrial and hazardous waste. The acquisition of EQ increases our geographic base providing a coast-to-coast presence and an expanded service platform to better serve key North American hazardous waste markets. In addition, the acquisition of EQ provides us with an opportunity to compete for additional waste cleanup project work; expand penetration with national accounts; improve and enhance transportation, logistics, and service offerings with existing customers and attract new customers. $132.4 million of the goodwill recognized was allocated to reporting units in our Environmental Services segment and $65.2 million of the goodwill recognized was allocated to reporting units in our Field & Industrial Services segment. None of the goodwill recognized is expected to be deductible for income tax purposes.
81
US ECOLOGY, INC.
NOTES TO CONSOLIDATED FINANCIAL STATEMENTS (Continued)
NOTE 4. BUSINESS COMBINATIONS (Continued)
The fair value estimate of identifiable intangible assets by major intangible asset class and related weighted average amortization period are as follows:
$s in thousands
|
Fair Value | Weighted Average Amortization Period (Years) |
|||||
|---|---|---|---|---|---|---|---|
Customer relationships |
$ | 98,400 | 15 | ||||
Permits and licenses |
89,600 | 45 | |||||
Permits and licenses, nonamortizing |
49,000 | — | |||||
Tradename |
5,481 | 3 | |||||
Customer backlog |
4,600 | 10 | |||||
Developed software |
3,443 | 9 | |||||
Non-compete agreements |
900 | 1 | |||||
Internet domain and website |
869 | 19 | |||||
Database |
581 | 15 | |||||
| | | | | | | | |
Total identifiable intangible assets |
$ | 252,874 | |||||
| | | | | | | | |
| | | | | | | | |
| | | | | | | | |
The following unaudited pro forma financial information presents the combined results of operations as if EQ had been combined with us at the beginning of 2014. The pro forma financial information includes the accounting effects of the business combination, including the amortization of intangible assets, depreciation of property, plant and equipment, and interest expense. The unaudited pro forma financial information is presented for informational purposes only and is not indicative of the results of operations that would have been achieved if the acquisition had taken place at the beginning of the periods presented, nor should it be taken as indication of our future consolidated results of operations.
| |
(unaudited) | |||
|---|---|---|---|---|
$s in thousands, except per share amounts
|
2014 | |||
Pro forma combined: |
||||
Revenue |
$ | 615,264 | ||
Net income |
$ | 37,347 | ||
Earnings per share |
||||
Basic |
$ | 1.73 | ||
Diluted |
$ | 1.72 | ||
Revenue from EQ included in the Company's consolidated statements of operations was $228.2 million for the year ended December 31, 2014. Operating income from EQ included in the Company's consolidated statements of operations was $18.5 million for the year ended December 31, 2014. Acquisition-related costs of $1.2 million and $6.4 million were included in Selling, general and administrative expenses in the Company's consolidated statements of operations for the years ended December 31, 2015 and 2014, respectively.
NOTE 5. DIVESTITURES
Divestiture of Augusta, Georgia Facility
On April 5, 2016, we completed the divestiture of our Augusta, Georgia facility for cash proceeds of $1.9 million. The Augusta, Georgia facility was reported as part of our Environmental Services segment.
82
US ECOLOGY, INC.
NOTES TO CONSOLIDATED FINANCIAL STATEMENTS (Continued)
NOTE 5. DIVESTITURES (Continued)
Sales, net income and total assets of the Augusta, Georgia facility are not material to our consolidated financial position or results of operations in any period presented. We recognized a $1.9 million pre-tax gain on the divestiture of the Augusta, Georgia facility, which is included in Other income (expense) in our consolidated statements of operations for the year ended December 31, 2016.
Divestiture of Allstate
On November 1, 2015, we completed the divestiture of Allstate for cash proceeds at closing of $58.8 million. For the year ended December 31, 2015, we recognized a pre-tax loss on the divestiture of Allstate, including transaction-related costs, of $542,000, which was included in Other income (expense) in our consolidated statements of operations. On April 25, 2016, we received additional cash proceeds of $827,000 in settlement of final post-closing adjustments. We recognized a $178,000 pre-tax gain on the divestiture of Allstate, which is included in Other income (expense) in our consolidated statements of operations for the year ended December 31, 2016.
Prior to the divesture, Allstate represented the majority of the industrial services business included in our Field & Industrial Services segment. As a result of this divestiture and management's strategic review, we evaluated the recoverability of the assets associated with our industrial services business. Based on this analysis, we recorded a non-cash goodwill impairment charge of $6.7 million in the second quarter of 2015. The sale of Allstate did not meet the requirements to be reported as a discontinued operation as defined in ASU No. 2014-08, Presentation of Financial Statements (Topic 205) and Property, Plant and Equipment (Topic 360), Reporting Discontinued Operations and Disclosures of Disposals of Components of an Entity.
Loss before income taxes from Allstate of $4.9 million and income before income taxes from Allstate of $1.6 million were included in the Company's consolidated statements of operations for the years ended December 31, 2015 and 2014, respectively. Loss before income taxes for the year ended December 31, 2015, includes a non-cash goodwill impairment charge of $6.4 million.
The following table presents the carrying amounts of major classes of assets and liabilities of Allstate classified as held for sale immediately preceding the disposition on November 1, 2015, which are excluded from the Company's consolidated balance sheet at December 31, 2015:
$s in thousands
|
November 1, 2015 |
|||
|---|---|---|---|---|
Cash and cash equivalents |
$ | 46 | ||
Receivables, net |
25,407 | |||
Prepaid expenses and other current assets |
1,469 | |||
Property and equipment, net |
19,760 | |||
Intangible assets, net |
21,825 | |||
Goodwill |
13,572 | |||
| | | | | |
Total assets held for sale |
$ | 82,079 | ||
| | | | | |
| | | | | |
| | | | | |
Accounts payable |
7,253 | |||
Accrued liabilities |
1,784 | |||
Accrued salaries and benefits |
594 | |||
Deferred income taxes |
13,601 | |||
| | | | | |
Total liabilities held for sale |
$ | 23,232 | ||
| | | | | |
| | | | | |
| | | | | |
83
US ECOLOGY, INC.
NOTES TO CONSOLIDATED FINANCIAL STATEMENTS (Continued)
NOTE 6. ACCUMULATED OTHER COMPREHENSIVE INCOME (LOSS)
Changes in accumulated other comprehensive income (loss) ("AOCI") consisted of the following:
$s in thousands
|
Foreign Currency Translation Adjustments |
Unrealized Loss on Interest Rate Hedge |
Total | |||||||
|---|---|---|---|---|---|---|---|---|---|---|
Balance at December 31, 2014 |
$ | (5,648 | ) | $ | (2,038 | ) | $ | (7,686 | ) | |
Other comprehensive loss before reclassifications, net of tax |
(8,380 | ) | (3,269 | ) | (11,649 | ) | ||||
Amounts reclassified out of AOCI, net of tax(1) |
— | 2,269 | 2,269 | |||||||
| | | | | | | | | | | |
Other comprehensive loss, net |
(8,380 | ) | (1,000 | ) | (9,380 | ) | ||||
| | | | | | | | | | | |
Balance at December 31, 2015 |
$ | (14,028 | ) | $ | (3,038 | ) | $ | (17,066 | ) | |
| | | | | | | | | | | |
Other comprehensive loss before reclassifications, net of tax |
1,379 | (1,121 | ) | 258 | ||||||
Amounts reclassified out of AOCI, net of tax(2) |
— | 2,083 | 2,083 | |||||||
| | | | | | | | | | | |
Other comprehensive income, net |
1,379 | 962 | 2,341 | |||||||
| | | | | | | | | | | |
Balance at December 31, 2016 |
$ | (12,649 | ) | $ | (2,076 | ) | $ | (14,725 | ) | |
| | | | | | | | | | | |
| | | | | | | | | | | |
| | | | | | | | | | | |
- (1)
- Before-tax
reclassifications of $3.5 million ($2.3 million after-tax) for the year ended December 31, 2015 were included in Interest expense in
the Company's consolidated statements of operations. Amount relates to the Company's interest rate swap which is designated as a cash flow hedge. Changes in fair value of the swap recognized in AOCI
are reclassified to interest expense when hedged interest payments on the underlying long-term debt are made. Amounts in AOCI expected to be recognized in interest expense over the next
12 months total approximately $3.5 million ($2.3 million after tax).
- (2)
- Before-tax reclassifications of $3.2 million ($2.1 million after-tax) for the year ended December 31, 2016 were included in Interest expense in the Company's consolidated statements of operations. Amount relates to the Company's interest rate swap which is designated as a cash flow hedge. Changes in fair value of the swap recognized in AOCI are reclassified to interest expense when hedged interest payments on the underlying long-term debt are made. Amounts in AOCI expected to be recognized in interest expense over the next 12 months total approximately $3.2 million ($2.1 million after tax).
NOTE 7. DISCLOSURE OF SUPPLEMENTAL CASH FLOW INFORMATION
| |
For the Year Ended December 31, | |||||||||
|---|---|---|---|---|---|---|---|---|---|---|
$s in thousands
|
2016 | 2015 | 2014 | |||||||
Income taxes and interest paid: |
||||||||||
Income taxes paid, net of receipts |
$ | 25,729 | $ | 27,252 | $ | 22,754 | ||||
Interest paid |
14,304 | 18,587 | 9,298 | |||||||
Non-cash investing and financing activities: |
||||||||||
Closure/Post-closure retirement asset |
426 | (349 | ) | 7,157 | ||||||
Capital expenditures in accounts payable |
2,906 | 3,805 | 6,101 | |||||||
Acquisition of equipment with financing arrangements |
1,156 | — | — | |||||||
Restricted stock issuances from treasury shares |
408 | 127 | 487 | |||||||
84
US ECOLOGY, INC.
NOTES TO CONSOLIDATED FINANCIAL STATEMENTS (Continued)
NOTE 8. FAIR VALUE MEASUREMENTS
Fair value is defined as the price that would be received to sell an asset or paid to transfer a liability in an orderly transaction between market participants at the measurement date. Assets and liabilities recorded at fair value are categorized using defined hierarchical levels directly related to the amount of subjectivity associated with the inputs to fair value measurements, as follows:
Level 1—Quoted prices in active markets for identical assets or liabilities; |
Level 2—Inputs other than quoted prices included within Level 1 that are either directly or indirectly observable; |
Level 3—Unobservable inputs in which little or no market activity exists, requiring an entity to develop its own assumptions that market participants would use to value the asset or liability. |
The Company's financial instruments consist of cash and cash equivalents, accounts receivable, restricted cash and investments, accounts payable and accrued liabilities, debt and interest rate swap agreements. The estimated fair value of cash and cash equivalents, accounts receivable, accounts payable and accrued liabilities approximate their carrying value due to the short-term nature of these instruments.
The Company estimates the fair value of its variable-rate debt using Level 2 inputs, such as interest rates, related terms and maturities of similar obligations. At December 31, 2016, the fair value of the Company's variable-rate debt was estimated to be $283.7 million.
The Company's assets and liabilities measured at fair value on a recurring basis at December 31, 2016 and 2015 consisted of the following:
| |
2016 | ||||||||||||
|---|---|---|---|---|---|---|---|---|---|---|---|---|---|
$s in thousands
|
Quoted Prices in Active Markets (Level 1) |
Other Observable Inputs (Level 2) |
Unobservable Inputs (Level 3) |
Total | |||||||||
Assets: |
|||||||||||||
Fixed-income securities(1) |
$ | 607 | $ | 3,473 | $ | — | $ | 4,080 | |||||
Money market funds(2) |
1,707 | — | — | 1,707 | |||||||||
| | | | | | | | | | | | | | |
Total |
$ | 2,314 | $ | 3,473 | $ | — | $ | 5,787 | |||||
| | | | | | | | | | | | | | |
| | | | | | | | | | | | | | |
| | | | | | | | | | | | | | |
Liabilities: |
|||||||||||||
Interest rate swap agreement(3) |
$ | — | $ | 3,198 | $ | — | $ | 3,198 | |||||
| | | | | | | | | | | | | | |
Total |
$ | — | $ | 3,198 | $ | — | $ | 3,198 | |||||
| | | | | | | | | | | | | | |
| | | | | | | | | | | | | | |
| | | | | | | | | | | | | | |
85
US ECOLOGY, INC.
NOTES TO CONSOLIDATED FINANCIAL STATEMENTS (Continued)
NOTE 8. FAIR VALUE MEASUREMENTS (Continued)
| |
2015 | ||||||||||||
|---|---|---|---|---|---|---|---|---|---|---|---|---|---|
$s in thousands
|
Quoted Prices in Active Markets (Level 1) |
Other Observable Inputs (Level 2) |
Unobservable Inputs (Level 3) |
Total | |||||||||
Assets: |
|||||||||||||
Fixed-income securities(1) |
$ | 403 | $ | 3,573 | $ | — | $ | 3,976 | |||||
Money market funds(2) |
1,772 | — | — | 1,772 | |||||||||
| | | | | | | | | | | | | | |
Total |
$ | 2,175 | $ | 3,573 | $ | — | $ | 5,748 | |||||
| | | | | | | | | | | | | | |
| | | | | | | | | | | | | | |
| | | | | | | | | | | | | | |
Liabilities: |
|||||||||||||
Interest rate swap agreement(3) |
$ | — | $ | 4,676 | $ | — | $ | 4,676 | |||||
| | | | | | | | | | | | | | |
Total |
$ | — | $ | 4,676 | $ | — | $ | 4,676 | |||||
| | | | | | | | | | | | | | |
| | | | | | | | | | | | | | |
| | | | | | | | | | | | | | |
- (1)
- We
invest a portion of our Restricted cash and investments in fixed-income securities, including U.S. Treasury and U.S. agency securities. We measure the fair value
of U.S. Treasury securities using quoted prices for identical assets in active markets. We measure the fair value of U.S. agency securities using observable market activity for similar assets. The
fair value of our fixed-income securities approximates our cost basis in the investments.
- (2)
- We
invest a portion of our Restricted cash and investments in money market funds. We measure the fair value of these money market fund investments using quoted
prices for identical assets in active markets.
- (3)
- In order to manage interest rate exposure, we entered into an interest rate swap agreement in October 2014 that effectively converts a portion of our variable-rate debt to a fixed interest rate. The swap is designated as a cash flow hedge, with gains and losses deferred in other comprehensive income to be recognized as an adjustment to interest expense in the same period that the hedged interest payments affect earnings. The interest rate swap has an effective date of December 31, 2014 with an initial notional amount of $250.0 million. The fair value of the interest rate swap agreement represents the difference in the present value of cash flows calculated at the contracted interest rates and at current market interest rates at the end of the period. We calculate the fair value of the interest rate swap agreement quarterly based on the quoted market price for the same or similar financial instruments. The fair value of the interest rate swap agreement is included in Other long-term liabilities in the Company's consolidated balance sheet as of December 31, 2016 and 2015.
NOTE 9. CONCENTRATIONS AND CREDIT RISK
Major Customers
No customer accounted for more than 10% of total revenue for the years ended December 31, 2016 or 2015. Revenue from a single customer accounted for approximately 10% of total revenue for the year ended December 31, 2014.
No customer accounted for more than 10% of total receivables as of December 31, 2016 or 2015.
86
US ECOLOGY, INC.
NOTES TO CONSOLIDATED FINANCIAL STATEMENTS (Continued)
NOTE 9. CONCENTRATIONS AND CREDIT RISK (Continued)
Credit Risk Concentration
We maintain most of our cash and cash equivalents with nationally recognized financial institutions like Wells Fargo Bank, National Association ("Wells Fargo") and Comerica, Inc. Substantially all balances are uninsured and are not used as collateral for other obligations. Concentrations of credit risk on accounts receivable are believed to be limited due to the number, diversification and character of the obligors and our credit evaluation process.
Labor Concentrations
As of December 31, 2016, 13 employees at our Richland, Washington facility were represented by the Paper, Allied-Industrial Chemical & Energy Workers International Union, AFL-CIO, CLC (PACE); 105 employees at our Blainville, Québec, Canada facility were represented by the Communications, Energy and Paperworkers Union of Canada; 137 employees were represented by the Local 324 Operating Engineers Union; and 10 employees were represented by the Teamsters and the Operating Engineers Union. As of December 31, 2016, our 1,188 other employees did not belong to a union.
NOTE 10. RECEIVABLES
Receivables as of December 31, 2016 and 2015 consisted of the following:
$s in thousands
|
2016 | 2015 | |||||
|---|---|---|---|---|---|---|---|
Trade |
$ | 84,487 | $ | 95,055 | |||
Unbilled revenue |
13,835 | 11,983 | |||||
Other |
831 | 2,568 | |||||
| | | | | | | | |
Total receivables |
99,153 | 109,606 | |||||
Allowance for doubtful accounts |
(2,334 | ) | (3,226 | ) | |||
| | | | | | | | |
Receivables, net |
$ | 96,819 | $ | 106,380 | |||
| | | | | | | | |
| | | | | | | | |
| | | | | | | | |
The allowance for doubtful accounts is a provision for uncollectible accounts receivable and unbilled receivables. The allowance is evaluated and adjusted to reflect our collection history and an analysis of the accounts receivables aging. The allowance is decreased by accounts receivable as they are written off. The allowance is adjusted periodically to reflect actual experience. The change in the allowance during 2016, 2015 and 2014 was as follows:
$s in thousands
|
Balance at Beginning of Period |
Charged (Credited) to Costs and Expenses |
Recoveries (Deductions/ Write-offs) |
Adjustments | Balance at End of Period |
|||||||||||
|---|---|---|---|---|---|---|---|---|---|---|---|---|---|---|---|---|
Year ended December 31, 2016 |
$ | 3,226 | $ | (186 | ) | $ | (705 | ) | $ | (1 | ) | $ | 2,334 | |||
Year ended December 31, 2015 |
$ | 704 | $ | 2,224 | $ | 848 | $ | (550 | )(1) | $ | 3,226 | |||||
Year ended December 31, 2014 |
$ | 525 | $ | 1,391 | $ | (1,211 | ) | $ | (1 | ) | $ | 704 | ||||
- (1)
- Adjustment for the year ended December 31, 2015 relates to the sale of Allstate on November 1, 2015. For additional information on the sale of Allstate, see Note 5.
87
US ECOLOGY, INC.
NOTES TO CONSOLIDATED FINANCIAL STATEMENTS (Continued)
NOTE 11. PROPERTY AND EQUIPMENT
Property and equipment as of December 31, 2016 and 2015 consisted of the following:
$s in thousands
|
2016 | 2015 | |||||
|---|---|---|---|---|---|---|---|
Cell development costs |
$ | 128,821 | $ | 121,473 | |||
Land and improvements |
34,285 | 31,606 | |||||
Buildings and improvements |
78,081 | 70,990 | |||||
Railcars |
17,299 | 17,375 | |||||
Vehicles and other equipment |
110,267 | 92,797 | |||||
Construction in progress |
24,392 | 20,067 | |||||
| | | | | | | | |
Total property and equipment |
393,145 | 354,308 | |||||
Accumulated depreciation and amortization |
(166,908 | ) | (143,974 | ) | |||
| | | | | | | | |
Property and equipment, net |
$ | 226,237 | $ | 210,334 | |||
| | | | | | | | |
| | | | | | | | |
| | | | | | | | |
Depreciation and amortization expense was $25.3 million, $27.9 million and $24.4 million for the years ended December 31, 2016, 2015 and 2014, respectively.
NOTE 12. GOODWILL AND INTANGIBLE ASSETS
Goodwill and intangible assets as of December 31, 2016, were the result of our acquisitions of ESI and the Vernon, California based RCRA Part B, liquids and solids waste treatment and storage facility of Evoqua Water Technologies LLC in 2016, EQ in 2014, Dynecol in 2012 and Stablex in 2010. Changes in goodwill for the years ended December 31, 2016 and 2015 were as follows:
$s in thousands
|
Environmental Services |
Field & Industrial Services |
Total | |||||||
|---|---|---|---|---|---|---|---|---|---|---|
Balance at December 31, 2015 |
$ | 147,692 | $ | 44,131 | $ | 191,823 | ||||
ESI acquisition |
1,011 | — | 1,011 | |||||||
Vernon acquisition |
354 | — | 354 | |||||||
Foreign currency translation and other adjustments |
433 | — | 433 | |||||||
| | | | | | | | | | | |
Balance at December 31, 2016 |
$ | 149,490 | $ | 44,131 | $ | 193,621 | ||||
| | | | | | | | | | | |
| | | | | | | | | | | |
| | | | | | | | | | | |
88
US ECOLOGY, INC.
NOTES TO CONSOLIDATED FINANCIAL STATEMENTS (Continued)
NOTE 12. GOODWILL AND INTANGIBLE ASSETS (Continued)
Intangible assets as of December 31, 2016 and 2015 consisted of the following:
| |
2016 | 2015 | |||||||||||||||||
|---|---|---|---|---|---|---|---|---|---|---|---|---|---|---|---|---|---|---|---|
$s in thousands
|
Cost | Accumulated Amortization |
Net | Cost | Accumulated Amortization |
Net | |||||||||||||
Amortizing intangible assets: |
|||||||||||||||||||
Permits, licenses and lease |
$ | 110,341 | $ | (9,462 | ) | $ | 100,879 | $ | 109,652 | $ | (6,682 | ) | $ | 102,970 | |||||
Customer relationships |
84,711 | (14,519 | ) | 70,192 | 82,021 | (9,015 | ) | 73,006 | |||||||||||
Technology—formulae and processes |
6,770 | (1,305 | ) | 5,465 | 6,560 | (1,054 | ) | 5,506 | |||||||||||
Customer backlog |
3,652 | (926 | ) | 2,726 | 3,652 | (561 | ) | 3,091 | |||||||||||
Tradename |
4,318 | (3,650 | ) | 668 | 4,318 | (2,210 | ) | 2,108 | |||||||||||
Developed software |
2,907 | (994 | ) | 1,913 | 2,899 | (678 | ) | 2,221 | |||||||||||
Non-compete agreements |
747 | (742 | ) | 5 | 732 | (732 | ) | — | |||||||||||
Internet domain and website |
540 | (72 | ) | 468 | 540 | (44 | ) | 496 | |||||||||||
Database |
387 | (118 | ) | 269 | 385 | (85 | ) | 300 | |||||||||||
| | | | | | | | | | | | | | | | | | | | |
Total amortizing intangible assets |
214,373 | (31,788 | ) | 182,585 | 210,759 | (21,061 | ) | 189,698 | |||||||||||
Nonamortizing intangible assets: |
|||||||||||||||||||
Permits and licenses |
51,645 | — | 51,645 | 49,750 | — | 49,750 | |||||||||||||
Tradename |
126 | — | 126 | 123 | — | 123 | |||||||||||||
| | | | | | | | | | | | | | | | | | | | |
Total intangible assets |
$ | 266,144 | $ | (31,788 | ) | $ | 234,356 | $ | 260,632 | $ | (21,061 | ) | $ | 239,571 | |||||
| | | | | | | | | | | | | | | | | | | | |
| | | | | | | | | | | | | | | | | | | | |
| | | | | | | | | | | | | | | | | | | | |
Amortization expense of amortizing intangible assets was $10.6 million, $12.3 million and $8.2 million for the years ended December 31, 2016, 2015 and 2014, respectively. Foreign intangible asset carrying amounts are affected by foreign currency translation. Future amortization expense of amortizing intangible assets is expected to be as follows:
$s in thousands
|
Expected Amortization |
|||
|---|---|---|---|---|
2017 |
$ | 9,848 | ||
2018 |
9,139 | |||
2019 |
9,139 | |||
2020 |
9,139 | |||
2021 |
9,139 | |||
Thereafter |
136,181 | |||
| | | | | |
|
$ | 182,585 | ||
| | | | | |
| | | | | |
| | | | | |
NOTE 13. EMPLOYEE BENEFIT PLANS
Defined Contribution Plans
We maintain the US Ecology, Inc., 401(k) Savings and Retirement Plan ("the Plan") for employees who voluntarily contribute a portion of their compensation, thereby deferring income for federal income tax purposes. The Plan covers substantially all of our employees in the United States. Participants may contribute a percentage of salary up to the IRS limitations. The Company contributes a matching
89
US ECOLOGY, INC.
NOTES TO CONSOLIDATED FINANCIAL STATEMENTS (Continued)
NOTE 13. EMPLOYEE BENEFIT PLANS (Continued)
contribution equal to 55% of participant contributions up to 6% of eligible compensation. The Company contributed matching contributions to the Plan of $1.9 million, $2.3 million and $521,000 in 2016, 2015 and 2014, respectively.
During 2014, EQ sponsored a defined contribution 401(k) plan for its nonunion employees. The plan allowed all eligible employees to make elective pretax contributions in an amount not to exceed limits established by the IRS. Additionally, EQ made matching contributions to the plan on behalf of the employee in the amount of 50% of the employee's elected contributions, not to exceed 3% of the employee's compensation. The Company contributed matching contributions to this plan of $649,000, for the post-acquisition period from June 17, 2014 through December 31, 2014. Effective January 1, 2015, the EQ defined contribution 401(k) plan was discontinued and all eligible employees were transitioned to the Plan.
We also maintain the Stablex Canada Inc. Simplified Pension Plan ("the SPP"). This defined contribution plan covers substantially all of our employees at our Blainville, Québec facility in Canada. Participants receive a Company contribution equal to 5% of their annual salary. The Company contributed $507,000, $515,000 and $510,000 to the SPP in 2016, 2015 and 2014, respectively.
Multi-Employer Defined Benefit Pension Plans
Certain of the Company's wholly-owned subsidiaries acquired in connection with the acquisition of EQ on June 17, 2014 participate in three multi-employer defined benefit pension plans under the terms of collective bargaining agreements covering most of the subsidiaries' union employees. Contributions are determined in accordance with the provisions of negotiated labor contracts and are generally based on stipulated rates per hours worked. Benefits under these plans are generally based on compensation levels and years of service.
The financial risks of participating in multi-employer plans are different from single employer defined benefit pension plans in the following respects:
- •
- Assets contributed to the multi-employer plan by one employer may be used to provide benefits to employees of other participating employers.
- •
- If a participating employer discontinues contributions to a plan, the unfunded obligations of the plan may be borne by the remaining
participating employers.
- •
- If a participating employer chooses to stop participating in a plan, a withdrawal liability may be created based on the unfunded vested benefits for all employees in the plan.
Information regarding significant multi-employer pension benefit plans in which the Company participates is shown in the following table:
| |
|
|
Pension Protection Act Certified Zone Status |
|||||||
|---|---|---|---|---|---|---|---|---|---|---|
| |
Plan Employer ID Number |
Plan Number |
||||||||
Name of Plan
|
2016 | 2015 | ||||||||
Operating Engineers Local 324 Pension Fund |
38-1900637 | 001 | Red | Red | ||||||
90
US ECOLOGY, INC.
NOTES TO CONSOLIDATED FINANCIAL STATEMENTS (Continued)
NOTE 13. EMPLOYEE BENEFIT PLANS (Continued)
The Company contributed $933,000 and $941,000 to the Operating Engineers Local 324 Pension Fund (the "Local 324 Plan") in 2016 and 2015, respectively. The Company also contributed $229,000 and $461,000 to other multi-employer plans in 2016 and 2015, respectively, which are excluded from the table above as they are not individually significant.
Based on information as of April 30, 2016 and 2015, the year end of the Local 324 Plan, the Company's contributions made to the Local 324 Plan represented less than 5% of total contributions received by the Local 324 Plan during the 2016 and 2015 plan years.
The certified zone status in the table above is defined by the Department of Labor and the Pension Protection Act of 2006 and represents the level at which the plan is funded. Plans in the red zone are less than 65% funded; plans in the yellow zone are less than 80% funded; and plans in the green zone are at least 80% funded. The certified zone status is as of the Local 324 Plan's year end of April 30, 2016 and 2015.
A financial improvement or rehabilitation plan, as defined under ERISA, was adopted by the Local 324 Plan on March 17, 2011 and the Rehabilitation Period began May 1, 2013.
As of December 31, 2016, 137 employees were employed under union collective bargaining agreements with the Local 324 Operating Engineers union. Our three remaining collective bargaining agreements expire on April 30, 2017, May 31, 2018 and November 30, 2020.
NOTE 14. CLOSURE AND POST-CLOSURE OBLIGATIONS
Our accrued closure and post-closure liability represents the expected future costs, including corrective actions, associated with closure and post-closure of our operating and non-operating disposal facilities. We record the fair value of our closure and post-closure obligations as a liability in the period in which the regulatory obligation to retire a specific asset is triggered. For our individual landfill cells, the required closure and post-closure obligations under the terms of our permits and our intended operation of the landfill cell are triggered and recorded when the cell is placed into service and waste is initially disposed in the landfill cell. The fair value is based on the total estimated costs to close the landfill cell and perform post-closure activities once the landfill cell has reached capacity and is no longer accepting waste. We perform periodic reviews of both non-operating and operating facilities and revise accruals for estimated closure and post-closure, remediation or other costs as necessary. Recorded liabilities are based on our best estimates of current costs and are updated periodically to include the effects of existing technology, presently enacted laws and regulations, inflation and other economic factors.
We do not presently bear significant financial responsibility for closure and/or post-closure care of the disposal facilities located on state-owned land at our Beatty, Nevada site; Provincial-owned land in Blainville, Québec; or state-leased federal land on the Department of Energy Hanford Reservation near Richland, Washington. The States of Nevada and Washington and the Province of Québec collect fees from us based on the waste received on a quarterly or annual basis. Such fees are deposited in dedicated, government-controlled funds to cover the future costs of closure and post-closure care and maintenance. Such fees are periodically reviewed for adequacy by the governmental authorities. We also maintain a surety bond for closure costs associated with the Stablex facility. Our lease agreement with the Province of Québec requires that the surety bond be maintained for 25 years after the lease expires. At December 31, 2016 we had $686,000 in commercial surety bonds dedicated for closure obligations.
91
US ECOLOGY, INC.
NOTES TO CONSOLIDATED FINANCIAL STATEMENTS (Continued)
NOTE 14. CLOSURE AND POST-CLOSURE OBLIGATIONS (Continued)
In accounting for closure and post-closure obligations, which represent our asset retirement obligations, we recognize a liability as part of the fair value of future asset retirement obligations and an associated asset as part of the carrying amount of the underlying asset. This obligation is valued based on our best estimates of current costs and current estimated closure and post-closure costs taking into account current technology, material and service costs, laws and regulations. These cost estimates are increased by an estimated inflation rate, estimated to be 2.6% at December 31, 2016. Inflated current costs are then discounted using our credit-adjusted risk-free interest rate, which approximates our incremental borrowing rate, in effect at the time the obligation is established or when there are upward revisions to our estimated closure and post-closure costs. Our weighted-average credit-adjusted risk-free interest rate at December 31, 2016 approximated 5.9%.
Changes to reported closure and post-closure obligations for the years ended December 31, 2016 and 2015, were as follows:
$s in thousands
|
2016 | 2015 | |||||
|---|---|---|---|---|---|---|---|
Closure and post-closure obligations, beginning of year |
$ | 71,154 | $ | 72,870 | |||
Accretion expense |
3,953 | 4,584 | |||||
Payments |
(1,754 | ) | (5,679 | ) | |||
Adjustments |
1,697 | (349 | ) | ||||
Foreign currency translation |
32 | (272 | ) | ||||
| | | | | | | | |
Closure and post-closure obligations, end of year |
75,082 | 71,154 | |||||
Less current portion |
(2,256 | ) | (2,787 | ) | |||
| | | | | | | | |
Long-term portion |
$ | 72,826 | $ | 68,367 | |||
| | | | | | | | |
| | | | | | | | |
| | | | | | | | |
Adjustment to the obligations represents changes in the expected timing or amount of cash expenditures based upon actual and estimated cash expenditures. The adjustments in 2016 were primarily attributable to a $1.3 million increase in post-closure obligations for our non-operating facilities due to changes in estimated post-closure costs and a $496,000 increase to the obligation for our Blainville, Quebec, Canada operating facility associated with a newly-constructed disposal cell. The adjustments in 2015 were primarily attributable to a $945,000 decrease to the obligation for our Grand View, Idaho facility due to changes in the timing of estimated closure activities, partially offset by a $545,000 increase to the obligation for our Belleville, Michigan facility due to changes in estimated closure and post-closure costs.
Changes in the reported closure and post-closure asset, recorded as a component of Property and equipment, net, in the consolidated balance sheet, for the years ended December 31, 2016 and 2015 were as follows:
$s in thousands
|
2016 | 2015 | |||||
|---|---|---|---|---|---|---|---|
Net closure and post-closure asset, beginning of year |
$ | 23,043 | $ | 24,651 | |||
Additions or adjustments to closure and post-closure asset |
426 | (349 | ) | ||||
Amortization of closure and post-closure asset |
(1,128 | ) | (836 | ) | |||
Foreign currency translation |
67 | (423 | ) | ||||
| | | | | | | | |
Net closure and post-closure asset, end of year |
$ | 22,408 | $ | 23,043 | |||
| | | | | | | | |
| | | | | | | | |
| | | | | | | | |
92
US ECOLOGY, INC.
NOTES TO CONSOLIDATED FINANCIAL STATEMENTS (Continued)
NOTE 15. DEBT
Long-term debt consisted of the following:
| |
December 31, | ||||||
|---|---|---|---|---|---|---|---|
$s in thousands
|
2016 | 2015 | |||||
Term loan |
$ | 283,040 | $ | 300,994 | |||
Unamortized discount and debt issuance costs |
(5,678 | ) | (7,254 | ) | |||
| | | | | | | | |
Total debt |
277,362 | 293,740 | |||||
Current portion of long-term debt |
(2,903 | ) | (3,056 | ) | |||
| | | | | | | | |
Long-term debt |
$ | 274,459 | $ | 290,684 | |||
| | | | | | | | |
| | | | | | | | |
| | | | | | | | |
Future maturities of long-term debt, excluding unamortized discount and debt issuance costs, as of December 31, 2016 consist of the following:
$s in thousands
|
Maturities | |||
|---|---|---|---|---|
2017 |
$ | 2,903 | ||
2018 |
2,903 | |||
2019 |
2,903 | |||
2020 |
2,903 | |||
2021 |
271,428 | |||
Thereafter |
— | |||
| | | | | |
|
$ | 283,040 | ||
| | | | | |
| | | | | |
| | | | | |
On June 17, 2014, in connection with the acquisition of EQ, the Company entered into a new $540.0 million senior secured credit agreement (the "Credit Agreement") with a syndicate of banks comprised of a $415.0 million term loan (the "Term Loan") with a maturity date of June 17, 2021 and a $125.0 million revolving line of credit (the "Revolving Credit Facility") with a maturity date of June 17, 2019. Upon entering into the Credit Agreement, the Company terminated its existing credit agreement with Wells Fargo, dated October, 29, 2010, as amended (the "Former Agreement"). Immediately prior to the termination of the Former Agreement, there were no outstanding borrowings under the Former Agreement. No early termination penalties were incurred as a result of the termination of the Former Agreement.
Term Loan
The Term Loan provided an initial commitment amount of $415.0 million, the proceeds of which were used to acquire 100% of the outstanding shares of EQ and pay related transaction fees and expenses. The Term Loan bears interest at a base rate (as defined in the Credit Agreement) plus 2.00% or LIBOR plus 3.00%, at the Company's option. The Term Loan is subject to amortization in equal quarterly installments in an aggregate annual amount equal to 1.00% of the original principal amount of the Term Loan. At December 31, 2016, the effective interest rate on the Term Loan, including the impact of our interest rate swap, was 4.76%. Interest only payments are due either monthly or on the last day of any interest period, as applicable. As set forth in the Credit Agreement, the Company is required to enter into one or more interest rate hedge agreements in amounts sufficient to fix the interest rate on at least 50% of the principal amount of the $415.0 million Term Loan. In October 2014, the Company entered into an interest rate swap
93
US ECOLOGY, INC.
NOTES TO CONSOLIDATED FINANCIAL STATEMENTS (Continued)
NOTE 15. DEBT (Continued)
agreement with Wells Fargo, effectively fixing the interest rate on $210.0 million, or 74%, of the Term Loan principal outstanding as of December 31, 2016.
Revolving Credit Facility
The Revolving Credit Facility provides up to $125.0 million of revolving credit loans or letters of credit with the use of proceeds restricted solely for working capital and other general corporate purposes. Under the Revolving Credit Facility, revolving loans are available based on a base rate (as defined in the Credit Agreement) or LIBOR, at the Company's option, plus an applicable margin which is determined according to a pricing grid under which the interest rate decreases or increases based on our ratio of funded debt to consolidated earnings before interest, taxes, depreciation and amortization (as defined in the Credit Agreement). At December 31, 2016, the effective interest rate on the Revolving Credit Facility was 5.50%. The Company is required to pay a commitment fee of 0.50% per annum on the unused portion of the Revolving Credit Facility, with such commitment fee to be reduced based upon the Company's total leverage ratio as defined in the Credit Agreement. The maximum letter of credit capacity under the Revolving Credit Facility is $50.0 million and the Credit Agreement provides for a letter of credit fee equal to the applicable margin for LIBOR loans under the Revolving Credit Facility. Interest payments are due either monthly or on the last day of any interest period, as applicable. At December 31, 2016, there were $2.2 million of working capital borrowings outstanding on the Revolving Credit Facility. These borrowings are due "on demand" and presented as short-term debt in the consolidated balance sheets. As of December 31, 2016, the availability under the Revolving Credit Facility was $116.8 million with $6.0 million of the Revolving Credit Facility issued in the form of standby letters of credit utilized as collateral for closure and post-closure financial assurance and other assurance obligations.
Except as set forth below, the Company may prepay the Term Loan or permanently reduce the Revolving Credit Facility commitment under the Credit Agreement at any time without premium or penalty (other than customary "breakage" costs with respect to the early termination of LIBOR loans). Subject to certain exceptions, the Credit Agreement provides for mandatory prepayment upon certain asset dispositions, casualty events and issuances of indebtedness. The Credit Agreement is also subject to mandatory annual prepayments commencing in December 2015 if our total leverage (defined as the ratio of our consolidated funded debt as of the last day of the applicable fiscal year to our adjusted EBITDA for such period) exceeds certain ratios as follows: 50% of our adjusted excess cash flow (as defined in the Credit Agreement and which takes into account certain adjustments) if our total leverage ratio is greater than 2.50 to 1.00, with step-downs to 0% if our total leverage ratio is equal to or less than 2.50 to 1.00.
Pursuant to (i) an unconditional guarantee agreement and (ii) a collateral agreement, each entered into by the Company and its domestic subsidiaries on June 17, 2014, the Company's obligations under the Credit Agreement are jointly and severally and fully and unconditionally guaranteed on a senior basis by all of the Company's existing and certain future domestic subsidiaries and the Credit Agreement is secured by substantially all of the Company's and its domestic subsidiaries' assets except the Company's and its domestic subsidiaries' real property.
The Credit Agreement contains customary restrictive covenants, subject to certain permitted amounts and exceptions, including covenants limiting the ability of the Company to incur additional indebtedness, pay dividends and make other restricted payments, repurchase shares of our outstanding stock and create certain liens. We may only declare quarterly or annual dividends if on the date of declaration, no event of
94
US ECOLOGY, INC.
NOTES TO CONSOLIDATED FINANCIAL STATEMENTS (Continued)
NOTE 15. DEBT (Continued)
default has occurred and no other event or condition has occurred that would constitute default due to the payment of the dividend.
The Credit Agreement also contains a financial maintenance covenant, which is a maximum Consolidated Senior Secured Leverage Ratio, as defined in the Credit Agreement, and is only applicable to the Revolving Credit Facility. Our consolidated senior secured leverage ratio as of the last day of any fiscal quarter may not exceed the ratios indicated below:
Fiscal Quarters Ending
|
Maximum Ratio | |||
|---|---|---|---|---|
December 31, 2016 through September 30, 2017 |
3.50 to 1.00 | |||
December 31, 2017 through September 30, 2018 |
3.25 to 1.00 | |||
December 31, 2018 and thereafter |
3.00 to 1.00 | |||
At December 31, 2016, we were in compliance with all of the financial covenants in the Credit Agreement.
NOTE 16. INCOME TAXES
The components of the income tax expense consisted of the following:
$s in thousands
|
2016 | 2015 | 2014 | |||||||
|---|---|---|---|---|---|---|---|---|---|---|
Current: |
||||||||||
U.S. Federal |
$ | 17,866 | $ | 17,818 | $ | 13,767 | ||||
State |
3,324 | 2,830 | 2,492 | |||||||
Foreign |
2,459 | 3,279 | 4,521 | |||||||
| | | | | | | | | | | |
Total current |
23,649 | 23,927 | 20,780 | |||||||
Deferred: |
||||||||||
U.S. Federal |
(1,790 | ) | (2,355 | ) | 2,721 | |||||
State |
(275 | ) | 125 | (155 | ) | |||||
Foreign |
(535 | ) | (453 | ) | (532 | ) | ||||
| | | | | | | | | | | |
Total deferred |
(2,600 | ) | (2,683 | ) | 2,034 | |||||
| | | | | | | | | | | |
Income tax expense |
$ | 21,049 | $ | 21,244 | $ | 22,814 | ||||
| | | | | | | | | | | |
| | | | | | | | | | | |
| | | | | | | | | | | |
A reconciliation between the effective income tax rate and the applicable statutory federal and state income tax rate is as follows:
| |
2016 | 2015 | 2014 | |||||||
|---|---|---|---|---|---|---|---|---|---|---|
Taxes computed at statutory rate |
35.0 | % | 35.0 | % | 35.0 | % | ||||
Impairment and loss on divestiture |
— | 5.7 | — | |||||||
State income taxes (net of federal income tax benefit) |
3.3 | 4.0 | 2.7 | |||||||
Non-deductible transaction costs |
0.2 | 0.3 | 1.5 | |||||||
Foreign rate differential |
(1.1 | ) | (1.8 | ) | (2.0 | ) | ||||
Other |
0.7 | 2.1 | 0.2 | |||||||
| | | | | | | | | | | |
|
38.1 | % | 45.3 | % | 37.4 | % | ||||
| | | | | | | | | | | |
| | | | | | | | | | | |
| | | | | | | | | | | |
95
US ECOLOGY, INC.
NOTES TO CONSOLIDATED FINANCIAL STATEMENTS (Continued)
NOTE 16. INCOME TAXES (Continued)
The components of the total net deferred tax assets and liabilities as of December 31, 2016 and 2015 consisted of the following:
$s in thousands
|
2016 | 2015 | |||||
|---|---|---|---|---|---|---|---|
Deferred tax assets: |
|||||||
Net operating loss, foreign tax credit and capital loss carry forwards |
$ | 3,307 | $ | 5,215 | |||
Accruals, allowances and other |
5,269 | 5,021 | |||||
Environmental compliance and other site related costs |
12,479 | 7,924 | |||||
Unrealized foreign exchange gains and losses |
2,153 | 2,101 | |||||
Unrealized gains and losses on interest rate hedge |
1,119 | 1,637 | |||||
| | | | | | | | |
Total deferred tax assets |
24,327 | 21,898 | |||||
Less: valuation allowance |
(3,058 | ) | (4,645 | ) | |||
| | | | | | | | |
Net deferred tax assets |
21,269 | 17,253 | |||||
Deferred tax liabilities: |
|||||||
Property and equipment |
(26,258 | ) | (23,898 | ) | |||
Intangible assets |
(74,731 | ) | (74,451 | ) | |||
Other |
(1,613 | ) | (1,526 | ) | |||
| | | | | | | | |
Total deferred tax liabilities |
(102,602 | ) | (99,875 | ) | |||
| | | | | | | | |
Net deferred tax liability |
$ | (81,333 | ) | $ | (82,622 | ) | |
| | | | | | | | |
| | | | | | | | |
| | | | | | | | |
We consider the undistributed earnings of our foreign subsidiaries as of December 31, 2016 to be indefinitely reinvested. Accordingly, no U.S. income and foreign withholding taxes have been provided on such earnings. We have not, nor do we anticipate the need to, repatriate funds to the U.S. to satisfy domestic liquidity needs; however, in the event that we need to repatriate all or a portion of our foreign cash to the U.S., we would be subject to additional U.S. income taxes, which could be material. The amount of temporary differences for which no deferred tax liability has been recognized totaled $36.7 million as of December 31, 2016. We do not believe it is practicable to calculate the potential tax impact of repatriation, as there is a significant amount of uncertainty around the calculation, including the availability and amount of foreign tax credits at the time of repatriation, tax rates in effect and other indirect tax consequences associated with repatriation.
As of December 31, 2016, we have federal net operating loss carry forwards ("NOLs") of approximately $17,000. The NOLs relate to losses incurred by EQ prior to our acquisition of EQ on June 17, 2014 and expire in 2026. U.S. income tax law limits the amount of losses that we can use on an annual basis. We believe it is more likely than not the entire balance of federal NOLs will be utilized before expiration.
As of December 31, 2016, we have approximately $12.7 million in state and local NOLs for which we maintain a valuation allowance on the majority of the balance. We have historically recorded a valuation allowance for certain deferred tax assets due to uncertainties regarding future operating results and limitations on utilization of state and local NOLs for tax purposes. State and local NOLs expire between 2019 and 2036. At December 31, 2016 and 2015, we maintained a valuation allowance of approximately $278,000 and $1.9 million, respectively, for state NOLs that are not expected to be utilizable prior to expiration.
96
US ECOLOGY, INC.
NOTES TO CONSOLIDATED FINANCIAL STATEMENTS (Continued)
NOTE 16. INCOME TAXES (Continued)
As of December 31, 2016, we have foreign tax credit carry forwards of approximately $1.8 million that expire in 2024. As of December 31, 2016, we have capital loss carry forwards of approximately $2.6 million that expire in 2020. We believe it is more likely than not the foreign tax credit and capital loss carry forwards will not be utilized and therefore maintain a valuation allowance on the entire balance.
The domestic and foreign components of Income (loss) before income taxes consisted of the following:
$s in thousands
|
2016 | 2015 | 2014 | |||||||
|---|---|---|---|---|---|---|---|---|---|---|
Domestic |
47,859 | 36,367 | 46,017 | |||||||
Foreign |
7,442 | 10,488 | 15,033 | |||||||
| | | | | | | | | | | |
Income before income taxes |
$ | 55,301 | $ | 46,855 | $ | 61,050 | ||||
| | | | | | | | | | | |
| | | | | | | | | | | |
| | | | | | | | | | | |
The changes to unrecognized tax benefits (excluding related penalties and interest) consisted of the following:
$s in thousands
|
2016 | 2015 | 2014 | |||||||
|---|---|---|---|---|---|---|---|---|---|---|
Unrecognized tax benefits, beginning of year |
$ | — | $ | — | $ | 438 | ||||
Gross increases in tax positions in prior periods |
— | — | — | |||||||
Gross increases during the current period |
— | — | — | |||||||
Settlements |
— | — | — | |||||||
Lapse of statute of limitations |
— | — | (438 | ) | ||||||
| | | | | | | | | | | |
Unrecognized tax benefits, end of year |
$ | — | $ | — | $ | — | ||||
| | | | | | | | | | | |
| | | | | | | | | | | |
| | | | | | | | | | | |
We apply the provisions of ASC 740 related to income tax uncertainties which clarifies the accounting for income taxes by prescribing a minimum recognition threshold a tax position is require to meet before being recognized in the consolidated financial statements. As of December 31, 2016 we have no material unrecognized tax benefits.
We file a consolidated U.S. federal income tax return with the IRS as well as income tax returns in various states and Canada. During 2016, the US Ecology, Inc. IRS examination for the 2012 tax year concluded with no material changes. US Ecology, Inc. is subject to examination by the IRS for tax years 2013 through 2016. During 2016, the EQ IRS examination for the 2013 tax year concluded with no material changes, however, the statute of limitations remains open. EQ is also subject to examination by the IRS for the 2014 tax year. We may be subject to examinations by the Canada Revenue Agency as well as various state and local taxing jurisdictions for tax years 2012 through 2016. We are currently not aware of any other examinations by taxing authorities.
NOTE 17. COMMITMENTS AND CONTINGENCIES
Litigation and Regulatory Proceedings
In the ordinary course of business, we are involved in judicial and administrative proceedings involving federal, state, provincial or local governmental authorities, including regulatory agencies that oversee and enforce compliance with permits. Fines or penalties may be assessed by our regulators for non-compliance. Actions may also be brought by individuals or groups in connection with permitting of planned facilities, modification or alleged violations of existing permits, or alleged damages suffered from exposure to
97
US ECOLOGY, INC.
NOTES TO CONSOLIDATED FINANCIAL STATEMENTS (Continued)
NOTE 17. COMMITMENTS AND CONTINGENCIES (Continued)
hazardous substances purportedly released from our operated sites, as well as other litigation. We maintain insurance intended to cover property and damage claims asserted as a result of our operations. Periodically, management reviews and may establish reserves for legal and administrative matters, or other fees expected to be incurred in relation to these matters.
We are not currently a party to any material pending legal proceedings and are not aware of any other claims that could, individually or in the aggregate, have a materially adverse effect on our financial position, results of operations or cash flows.
Operating Leases
Lease agreements primarily cover railcars, the disposal site at our Stablex facility and corporate office space. Future minimum lease payments on non-cancellable operating leases as of December 31, 2016 are as follows:
$s in thousands
|
Payments | |||
|---|---|---|---|---|
2017 |
$ | 6,189 | ||
2018 |
3,897 | |||
2019 |
2,349 | |||
2020 |
303 | |||
2021 |
127 | |||
Thereafter |
329 | |||
| | | | | |
|
$ | 13,194 | ||
| | | | | |
| | | | | |
| | | | | |
Rental expense under operating leases was $7.8 million, $8.2 million and $3.9 million for the years ended December 31, 2016, 2015 and 2014, respectively.
NOTE 18. EQUITY
Stock Repurchase Program
On June 1, 2016, the Company's Board of Directors authorized the repurchase of $25.0 million of the Company's outstanding common stock. Repurchases may be made from time to time in the open market or through privately negotiated transactions. The timing of any repurchases will be based upon prevailing market conditions and other factors. The Company did not repurchase any shares of common stock under the repurchase program during 2016. The repurchase program will remain in effect until June 2, 2018, unless extended by our Board of Directors.
Omnibus Incentive Plan
On May 27, 2015, our stockholders approved the Omnibus Incentive Plan ("Omnibus Plan"), which was approved by our Board of Directors on April 7, 2015. The Omnibus Plan was developed to provide additional incentives through equity ownership in US Ecology and, as a result, encourage employees and directors to contribute to our success. The Omnibus Plan provides, among other things, the ability for the Company to grant restricted stock, performance stock, options, stock appreciation rights, restricted stock units, performance stock units ("PSUs") and other stock-based awards or cash awards to officers, employees, consultants and non-employee directors. Subsequent to the approval of the Omnibus Plan in
98
US ECOLOGY, INC.
NOTES TO CONSOLIDATED FINANCIAL STATEMENTS (Continued)
NOTE 18. EQUITY (Continued)
May 2015, we stopped granting equity awards under our 2008 Stock Option Incentive Plan and our 2006 Restricted Stock Plan ("Previous Plans"), and the Previous Plans will remain in effect solely for the settlement of awards granted under the Previous Plans. No shares that are reserved but unissued under the Previous Plans or that are outstanding under the Previous Plans and reacquired by the Company for any reason will be available for issuance under the Omnibus Plan. The Omnibus Plan expires on April 7, 2025 and authorizes 1,500,000 shares of common stock for grant over the life of the Omnibus Plan. As of December 31, 2016, 1,266,624 shares of common stock remain available for grant under the Omnibus Plan.
Performance Stock Units
On January 4, 2016 and May 27, 2015, the Company granted 16,000 PSUs and 6,929 PSUs, respectively, to certain employees. Each PSU represents the right to receive, on the settlement date, one share of the Company's common stock. The total number of PSUs each participant is eligible to earn ranges from 0% to 200% of the target number of PSUs granted. The actual number of PSUs that will vest and be settled in shares is determined at the end of a three-year performance period beginning January 1, 2015 for the May 27, 2015 granted PSUs and January 1, 2016 for the January 4, 2016 granted PSUs, based on total stockholder return relative to a set of peer companies. The fair value of the 2016 and 2015 PSUs estimated on the grant date using a Monte Carlo simulation were $41.22 and $65.78 per unit, respectively. Compensation expense is recorded over the awards' vesting period.
Assumptions used in the Monte Carlo simulation to calculate the fair value of the PSUs granted in 2016 and 2015 are as follows:
| |
2016 | 2015 | ||
|---|---|---|---|---|
Stock price on grant date |
$35.05 | $46.89 | ||
Expected term |
3.0 years | 2.6 years | ||
Expected volatility |
29% | 29% | ||
Risk-free interest rate |
1.3% | 0.9% | ||
Expected dividend yield |
2.1% | 1.5% |
Stock Options
We have stock option awards outstanding under the 1992 Stock Option Plan for Employees ("1992 Employee Plan") and the 2008 Stock Option Incentive Plan ("2008 Stock Option Plan"). Subsequent to the approval of the Omnibus Plan in May 2015, we stopped granting equity awards under the 2008 Stock Option Plan. The 2008 Stock Option Plan will remain in effect solely for the settlement of awards previously granted. In April 2013, the 1992 Employee Plan expired and was cancelled except for options then outstanding. Stock options expire ten years from the date of grant and vest over a period ranging from one to three years from the date of grant. Vesting requirements for non-employee directors are contingent on attending a minimum of 75% of regularly scheduled board meetings during the year. Upon the exercise of stock options, common stock is issued from treasury stock or, when depleted, from new stock issuances.
99
US ECOLOGY, INC.
NOTES TO CONSOLIDATED FINANCIAL STATEMENTS (Continued)
NOTE 18. EQUITY (Continued)
A summary of our stock option activity is as follows:
$s in thousands, except per share amounts
|
Shares | Weighted Average Exercise Price |
Aggregate Intrinsic Value |
Weighted Average Remaining Contractual Term (Years) |
|||||||||
|---|---|---|---|---|---|---|---|---|---|---|---|---|---|
Outstanding as of December 31, 2015 |
336,417 | $ | 35.83 | ||||||||||
Granted |
147,660 | 37.83 | |||||||||||
Exercised |
(13,939 | ) | 23.25 | ||||||||||
Cancelled, expired or forfeited |
(23,640 | ) | 43.27 | ||||||||||
| | | | | | | | | | | | | | |
Outstanding as of December 31, 2016 |
446,498 | $ | 36.49 | $ | 5,651 | 7.6 | |||||||
| | | | | | | | | | | | | | |
| | | | | | | | | | | | | | |
| | | | | | | | | | | | | | |
Exercisable as of December 31, 2016 |
153,535 | $ | 33.33 | $ | 2,430 | 6.5 | |||||||
The weighted average grant date fair value of all stock options granted during 2016, 2015 and 2014 was $8.19, $11.83 and $9.78 per share, respectively. The total intrinsic value of stock options exercised during 2016, 2015 and 2014 was $307,000, $2.0 million and $3.5 million, respectively. During 2016, option holders exercised 7,873 options via net share settlement.
The fair value of each stock option is estimated as of the date of grant using the Black-Scholes option-pricing model. Expected volatility is estimated based on an average of actual historical volatility and implied volatility corresponding to the stock option's estimated expected term. We believe this approach to determine volatility is representative of future stock volatility. The expected term of a stock option is estimated based on analysis of stock options already exercised and foreseeable trends or changes in behavior. The risk-free interest rates are based on the U.S. Treasury securities maturities as of each applicable grant date. The dividend yield is based on analysis of actual historical dividend yield.
The significant weighted-average assumptions relating to the valuation of each option grant are as follows:
| |
2016 | 2015 | 2014 | |||
|---|---|---|---|---|---|---|
Expected life |
3.8 years | 3.6 years | 3.6 years | |||
Expected volatility |
31% | 35% | 36% | |||
Risk-free interest rate |
1.1% | 1.2% | 0.8% | |||
Expected dividend yield |
1.7% | 1.6% | 2.0% |
Restricted Stock
We have restricted stock awards outstanding under the 2006 Restricted Stock Plan and the Omnibus Plan. Subsequent to the approval of the Omnibus Plan in May 2015, we stopped granting equity awards under the 2006 Restricted Stock Plan. The 2006 Restricted Stock Plan will remain in effect solely for the settlement of awards previously granted. Generally, restricted stock awards vest annually over a three-year period. Vesting of restricted stock awards to non-employee directors is contingent on the non-employee director attending a minimum of 75% of regularly scheduled board meetings and 75% of the meetings of each committee of which the non-employee director is a member during the year. Upon the vesting of restricted stock awards, common stock is issued from treasury stock or, when depleted, from new stock issuances.
100
US ECOLOGY, INC.
NOTES TO CONSOLIDATED FINANCIAL STATEMENTS (Continued)
NOTE 18. EQUITY (Continued)
A summary of our restricted stock plan activity is as follows:
| |
Shares | Weighted Average Grant Date Fair Value |
|||||
|---|---|---|---|---|---|---|---|
Outstanding as of December 31, 2015 |
59,413 | $ | 42.67 | ||||
Granted |
55,130 | 38.35 | |||||
Vested |
(32,279 | ) | 37.83 | ||||
Cancelled, expired or forfeited |
(7,133 | ) | 40.33 | ||||
| | | | | | | | |
Outstanding as of December 31, 2016 |
75,131 | $ | 41.80 | ||||
| | | | | | | | |
| | | | | | | | |
| | | | | | | | |
The total fair value of restricted stock vested during 2016, 2015 and 2014 was $1.4 million, $1.4 million and $975,000, respectively.
Treasury Stock
During 2016, the Company issued 10,412 shares of restricted stock, under the Omnibus Plan, from our treasury stock at an average cost of $39.82 per share and repurchased 6,589 shares of the Company's common stock in connection with the net share settlement of employee equity awards at an average cost of $40.95 per share.
Share-Based Compensation Expense
All share-based compensation is measured at the grant date based on the fair value of the award, and is recognized as an expense in earnings over the requisite service period. The components of pre-tax share-based compensation expense (primarily included in Selling, general and administrative expenses in our consolidated statements of operations) and related tax benefits were as follows:
$s in thousands
|
2016 | 2015 | 2014 | |||||||
|---|---|---|---|---|---|---|---|---|---|---|
Share-based compensation from: |
||||||||||
Stock options |
$ | 1,123 | $ | 808 | $ | 442 | ||||
Restricted stock |
1,488 | 1,375 | 808 | |||||||
Performance stock units |
314 | 114 | — | |||||||
| | | | | | | | | | | |
Total share-based compensation |
2,925 | 2,297 | 1,250 | |||||||
Income tax benefit |
(1,113 | ) | (1,041 | ) | (467 | ) | ||||
| | | | | | | | | | | |
Share-based compensation, net of tax |
$ | 1,812 | $ | 1,256 | $ | 783 | ||||
| | | | | | | | | | | |
| | | | | | | | | | | |
| | | | | | | | | | | |
Unrecognized Share-Based Compensation Expense
As of December 31, 2016, there was $3.9 million of unrecognized compensation expense related to unvested share-based awards granted under our share-based award plans. The expense is expected to be recognized over a weighted average remaining vesting period of approximately two years.
101
US ECOLOGY, INC.
NOTES TO CONSOLIDATED FINANCIAL STATEMENTS (Continued)
NOTE 19. EARNINGS PER SHARE
| |
2016 | 2015 | 2014 | ||||||||||||||||
|---|---|---|---|---|---|---|---|---|---|---|---|---|---|---|---|---|---|---|---|
$s and shares in thousands, except per share amounts
|
Basic | Diluted | Basic | Diluted | Basic | Diluted | |||||||||||||
Net income |
$ | 34,252 | $ | 34,252 | $ | 25,611 | $ | 25,611 | $ | 38,236 | $ | 38,236 | |||||||
| | | | | | | | | | | | | | | | | | | | |
| | | | | | | | | | | | | | | | | | | | |
| | | | | | | | | | | | | | | | | | | | |
Weighted average basic shares outstanding |
21,704 | 21,704 | 21,637 | 21,637 | 21,537 | 21,537 | |||||||||||||
Dilutive effect of stock options and restricted stock |
85 | 96 | 118 | ||||||||||||||||
| | | | | | | | | | | | | | | | | | | | |
Weighted average diluted shares outstanding |
21,789 | 21,733 | 21,655 | ||||||||||||||||
Earnings per share |
$ | 1.58 | $ | 1.57 | $ | 1.18 | $ | 1.18 | $ | 1.78 | $ | 1.77 | |||||||
| | | | | | | | | | | | | | | | | | | | |
| | | | | | | | | | | | | | | | | | | | |
| | | | | | | | | | | | | | | | | | | | |
Anti-dilutive shares excluded from calculation |
249 | 192 | 58 | ||||||||||||||||
| | | | | | | | | | | | | | | | | | | | |
| | | | | | | | | | | | | | | | | | | | |
| | | | | | | | | | | | | | | | | | | | |
NOTE 20. SEGMENT REPORTING
Financial Information by Segment
Our operations are managed in two reportable segments reflecting our internal reporting structure and nature of services offered as follows:
Environmental Services—This segment provides a broad range of hazardous material management services including transportation, recycling, treatment and disposal of hazardous and non-hazardous waste at Company-owned landfill, wastewater and other treatment facilities.
Field & Industrial Services—This segment provides packaging and collection of hazardous waste and total waste management solutions at customer sites and through our 10-day transfer facilities. Services include on-site management, waste characterization, transportation and disposal of non-hazardous and hazardous waste. This segment also provides specialty services such as high-pressure cleaning, tank cleaning, decontamination, remediation, transportation, spill cleanup and emergency response and other services to commercial and industrial facilities and to government entities.
The operations not managed through our two reportable segments are recorded as "Corporate." Corporate selling, general and administrative expenses include typical corporate items such as legal, accounting and other items of a general corporate nature. Income taxes are assigned to Corporate, but all other items are included in the segment where they originated. Inter-company transactions have been eliminated from the segment information and are not significant between segments.
Effective January 1, 2016, we changed our internal reporting structure by moving the financial results of our Sulligent, Alabama and Tampa, Florida facilities from our Environmental Services segment to our Field & Industrial Services segment. The purpose of this change is to align our internal reporting structure with how we manage our business based on the primary service offering of each facility. Throughout this Annual Report on Form 10-K, our segment results for all periods presented have been recast to reflect this change.
102
US ECOLOGY, INC.
NOTES TO CONSOLIDATED FINANCIAL STATEMENTS (Continued)
NOTE 20. SEGMENT REPORTING (Continued)
Summarized financial information of our reportable segments for the years ended December 31, 2016, 2015 and 2014 is as follows:
| |
2016 | ||||||||||||
|---|---|---|---|---|---|---|---|---|---|---|---|---|---|
$s in thousands
|
Environmental Services |
Field & Industrial Services |
Corporate | Total | |||||||||
Treatment & Disposal Revenue |
$ | 275,236 | $ | 12,582 | $ | — | $ | 287,818 | |||||
Services Revenue: |
|||||||||||||
Transportation and Logistics(1) |
62,535 | 17,839 | — | 80,374 | |||||||||
Industrial Cleaning(2) |
— | 21,021 | — | 21,021 | |||||||||
Technical Services(3) |
— | 74,191 | — | 74,191 | |||||||||
Remediation(4) |
— | 11,600 | — | 11,600 | |||||||||
Other(5) |
— | 2,661 | — | 2,661 | |||||||||
| | | | | | | | | | | | | | |
Total Revenue |
$ | 337,771 | $ | 139,894 | $ | — | $ | 477,665 | |||||
| | | | | | | | | | | | | | |
| | | | | | | | | | | | | | |
| | | | | | | | | | | | | | |
Depreciation, amortization and accretion |
$ | 33,839 | $ | 5,481 | $ | 512 | $ | 39,832 | |||||
Capital expenditures |
$ | 30,098 | $ | 2,572 | $ | 3,026 | $ | 35,696 | |||||
Total assets |
$ | 599,300 | $ | 119,198 | $ | 57,902 | $ | 776,400 | |||||
| |
2015 | ||||||||||||
|---|---|---|---|---|---|---|---|---|---|---|---|---|---|
$s in thousands
|
Environmental Services |
Field & Industrial Services(6) |
Corporate | Total | |||||||||
Treatment & Disposal Revenue |
$ | 291,062 | $ | 12,911 | $ | — | $ | 303,973 | |||||
Services Revenue: |
|||||||||||||
Transportation and Logistics(1) |
67,978 | 29,060 | — | 97,038 | |||||||||
Industrial Cleaning(2) |
— | 85,783 | — | 85,783 | |||||||||
Technical Services(3) |
— | 67,479 | — | 67,479 | |||||||||
Remediation(4) |
— | 6,734 | — | 6,734 | |||||||||
Other(5) |
— | 2,063 | — | 2,063 | |||||||||
| | | | | | | | | | | | | | |
Total Revenue |
$ | 359,040 | $ | 204,030 | $ | — | $ | 563,070 | |||||
| | | | | | | | | | | | | | |
| | | | | | | | | | | | | | |
| | | | | | | | | | | | | | |
Depreciation, amortization and accretion |
$ | 34,870 | $ | 9,425 | $ | 527 | $ | 44,822 | |||||
Capital expenditures |
$ | 29,823 | $ | 7,513 | $ | 2,034 | $ | 39,370 | |||||
Total assets |
$ | 586,561 | $ | 124,127 | $ | 61,299 | $ | 771,987 | |||||
103
US ECOLOGY, INC.
NOTES TO CONSOLIDATED FINANCIAL STATEMENTS (Continued)
NOTE 20. SEGMENT REPORTING (Continued)
| |
2014 | ||||||||||||
|---|---|---|---|---|---|---|---|---|---|---|---|---|---|
$s in thousands
|
Environmental Services |
Field & Industrial Services(6) |
Corporate | Total | |||||||||
Treatment & Disposal Revenue |
$ | 252,471 | $ | 6,859 | $ | — | $ | 259,330 | |||||
Services Revenue: |
|||||||||||||
Transportation and Logistics(1) |
59,015 | 24,585 | — | 83,600 | |||||||||
Industrial Cleaning(2) |
— | 49,823 | — | 49,823 | |||||||||
Technical Services(3) |
— | 37,415 | — | 37,415 | |||||||||
Remediation(4) |
— | 16,410 | — | 16,410 | |||||||||
Other(5) |
— | 833 | — | 833 | |||||||||
| | | | | | | | | | | | | | |
Total Revenue |
$ | 311,486 | $ | 135,925 | $ | — | $ | 447,411 | |||||
| | | | | | | | | | | | | | |
| | | | | | | | | | | | | | |
| | | | | | | | | | | | | | |
Depreciation, amortization and accretion |
$ | 28,130 | $ | 6,843 | $ | 303 | $ | 35,276 | |||||
Capital expenditures |
$ | 19,656 | $ | 7,870 | $ | 908 | $ | 28,434 | |||||
Total assets |
$ | 618,524 | $ | 219,815 | $ | 71,708 | $ | 910,047 | |||||
- (1)
- Includes
such services as collection, transportation and disposal of non-hazardous and hazardous waste. Prior to the acquisition of EQ on June 17, 2014,
services within Environmental Services included transportation services.
- (2)
- Includes
such services as industrial cleaning and maintenance for refineries, chemical plants, steel and automotive plants, and refinery services such as tank
cleaning and temporary storage.
- (3)
- Includes
such services as Total Waste Management ("TWM") programs, retail services, laboratory packing, less-than-truck-load ("LTL") service and
Household Hazardous Waste ("HHW") collection.
- (4)
- Includes
such services as site assessment, onsite treatment, project management and remedial action planning and execution.
- (5)
- Includes
such services as emergency response and marine.
- (6)
- Financial data includes the operations of our Allstate business. We completed the divestiture of Allstate on November 1, 2015.
The primary financial measure used by management to assess segment performance is Adjusted EBITDA. Adjusted EBITDA is defined as net income before interest expense, interest income, income tax expense, depreciation, amortization, stock based compensation, accretion of closure and post-closure liabilities, foreign currency gain/loss, non-cash impairment charges, loss on divestiture and other income/expense. Adjusted EBITDA is a complement to results provided in accordance with accounting principles generally accepted in the United States ("GAAP") and we believe that such information provides additional useful information to analysts, stockholders and other users to understand the Company's operating performance. Since Adjusted EBITDA is not a measurement determined in accordance with GAAP and is thus susceptible to varying calculations, Adjusted EBITDA as presented may not be comparable to other similarly titled measures of other companies. Items excluded from Adjusted EBITDA are significant components in understanding and assessing our financial performance. Adjusted EBITDA should not be considered in isolation or as an alternative to, or substitute for, net income, cash flows generated by operations, investing or financing activities, or other financial statement data presented in the consolidated financial statements as indicators of financial performance or liquidity. Adjusted EBITDA has limitations
104
US ECOLOGY, INC.
NOTES TO CONSOLIDATED FINANCIAL STATEMENTS (Continued)
NOTE 20. SEGMENT REPORTING (Continued)
as an analytical tool and should not be considered in isolation or a substitute for analyzing our results as reported under GAAP. Some of the limitations are:
- •
- Adjusted EBITDA does not reflect changes in, or cash requirements for, our working capital needs;
- •
- Adjusted EBITDA does not reflect our interest expense, or the requirements necessary to service interest or principal payments on our debt;
- •
- Adjusted EBITDA does not reflect our income tax expenses or the cash requirements to pay our taxes;
- •
- Adjusted EBITDA does not reflect our cash expenditures or future requirements for capital expenditures or contractual commitments; and
- •
- Although depreciation and amortization charges are non-cash charges, the assets being depreciated and amortized will often have to be replaced in the future, and Adjusted EBITDA does not reflect any cash requirements for such replacements.
A reconciliation of Net Income to Adjusted EBITDA for the years ended December 31, 2016, 2015 and 2014 is as follows:
$s in thousands
|
2016 | 2015 | 2014 | |||||||
|---|---|---|---|---|---|---|---|---|---|---|
Net income |
$ | 34,252 | $ | 25,611 | $ | 38,236 | ||||
Income tax expense |
21,049 | 21,244 | 22,814 | |||||||
Interest expense |
17,317 | 23,370 | 10,677 | |||||||
Interest income |
(96 | ) | (65 | ) | (107 | ) | ||||
Foreign currency loss |
138 | 2,196 | 1,499 | |||||||
Loss (gain) on divestiture |
(2,034 | ) | 542 | — | ||||||
Other income |
(597 | ) | (1,267 | ) | (669 | ) | ||||
Impairment charges |
— | 6,700 | — | |||||||
Depreciation and amortization of plant and equipment |
25,304 | 27,931 | 24,413 | |||||||
Amortization of intangibles |
10,575 | 12,307 | 8,207 | |||||||
Stock-based compensation |
2,925 | 2,297 | 1,250 | |||||||
Accretion and non-cash adjustment of closure & post-closure liabilities |
3,953 | 4,584 | 2,656 | |||||||
| | | | | | | | | | | |
Adjusted EBITDA: |
$ | 112,786 | $ | 125,450 | $ | 108,976 | ||||
| | | | | | | | | | | |
| | | | | | | | | | | |
| | | | | | | | | | | |
Adjusted EBITDA, by operating segment, for the years ended December 31, 2016, 2015 and 2014 is as follows:
$s in thousands
|
2016 | 2015 | 2014 | |||||||
|---|---|---|---|---|---|---|---|---|---|---|
Adjusted EBITDA: |
||||||||||
Environmental Services |
$ | 139,698 | $ | 150,067 | $ | 123,086 | ||||
Field & Industrial Services |
16,342 | 21,388 | 8,638 | |||||||
Corporate |
(43,254 | ) | (46,005 | ) | (22,748 | ) | ||||
| | | | | | | | | | | |
Total |
$ | 112,786 | $ | 125,450 | $ | 108,976 | ||||
| | | | | | | | | | | |
| | | | | | | | | | | |
| | | | | | | | | | | |
105
US ECOLOGY, INC.
NOTES TO CONSOLIDATED FINANCIAL STATEMENTS (Continued)
NOTE 20. SEGMENT REPORTING (Continued)
Revenue and Long-Lived Assets Outside of the United States
We provide services in the United States and Canada. Revenues by geographic location where the underlying services were performed for the years ended December 31, 2016, 2015 and 2014 were as follows:
$s in thousands
|
2016 | 2015 | 2014 | |||||||
|---|---|---|---|---|---|---|---|---|---|---|
United States |
$ | 428,778 | $ | 521,092 | $ | 388,084 | ||||
Canada |
48,887 | 41,978 | 59,327 | |||||||
| | | | | | | | | | | |
|
$ | 477,665 | $ | 563,070 | $ | 447,411 | ||||
| | | | | | | | | | | |
| | | | | | | | | | | |
| | | | | | | | | | | |
Long-lived assets, comprised of property and equipment and intangible assets net of accumulated depreciation and amortization, by geographic location as of December 31, 2016 and 2015 are as follows:
$s in thousands
|
2016 | 2015 | |||||
|---|---|---|---|---|---|---|---|
United States |
$ | 405,767 | $ | 400,320 | |||
Canada |
54,826 | 49,585 | |||||
| | | | | | | | |
|
$ | 460,593 | $ | 449,905 | |||
| | | | | | | | |
| | | | | | | | |
| | | | | | | | |
NOTE 21. QUARTERLY FINANCIAL DATA (unaudited)
The unaudited consolidated quarterly results of operations for 2016 and 2015 were as follows:
| |
Three-Months Ended | |
||||||||||||||
|---|---|---|---|---|---|---|---|---|---|---|---|---|---|---|---|---|
$s and shares in thousands, except per share amounts
|
Mar. 31, | June 30, | Sept. 30, | Dec. 31, | Year | |||||||||||
2016 |
||||||||||||||||
Revenue |
$ | 113,318 | $ | 122,351 | $ | 124,824 | $ | 117,172 | $ | 477,665 | ||||||
Gross profit |
35,208 | 36,906 | 39,354 | 36,127 | 147,595 | |||||||||||
Operating income |
15,783 | 17,087 | 20,915 | 16,244 | 70,029 | |||||||||||
Net income |
7,517 | 8,938 | 10,114 | 7,683 | 34,252 | |||||||||||
Earnings per share—diluted(1) |
$ | 0.35 | $ | 0.41 | $ | 0.46 | $ | 0.35 | $ | 1.57 | ||||||
Weighted average common shares outstanding used in the diluted earnings per share calculation |
21,745 | 21,790 | 21,804 | 21,814 | 21,789 | |||||||||||
Dividends paid per share |
$ | 0.18 | $ | 0.18 | $ | 0.18 | $ | 0.18 | $ | 0.72 | ||||||
2015 |
||||||||||||||||
Revenue |
$ | 136,651 | $ | 139,732 | $ | 148,414 | $ | 138,273 | $ | 563,070 | ||||||
Gross profit |
39,844 | 41,470 | 45,940 | 44,156 | 171,410 | |||||||||||
Operating income |
14,951 | 12,095 | 22,433 | 22,152 | 71,631 | |||||||||||
Net income |
5,865 | 2,138 | 9,904 | 7,704 | 25,611 | |||||||||||
Earnings per share—diluted(1) |
$ | 0.27 | $ | 0.10 | $ | 0.46 | $ | 0.35 | $ | 1.18 | ||||||
Weighted average common shares outstanding used in the diluted earnings per share calculation |
21,689 | 21,748 | 21,749 | 21,748 | 21,733 | |||||||||||
Dividends paid per share |
$ | 0.18 | $ | 0.18 | $ | 0.18 | $ | 0.18 | $ | 0.72 | ||||||
- (1)
- Diluted earnings per common share for each quarter presented above are based on the respective weighted average number of common shares for the respective quarter. The dilutive potential common shares outstanding for each period and the sum of the quarters may not necessarily be equal to the full year diluted earnings per common share amount.
106
US ECOLOGY, INC.
NOTES TO CONSOLIDATED FINANCIAL STATEMENTS (Continued)
NOTE 22. SUBSEQUENT EVENT
On January 3, 2017 the Company declared a dividend of $0.18 per common share for stockholders of record on January 20, 2017. The dividend was paid from cash on hand on January 27, 2017 in an aggregate amount of $3.9 million.
107
ITEM 9. CHANGES IN AND DISAGREEMENTS WITH ACCOUNTANTS ON ACCOUNTING AND FINANCIAL DISCLOSURE
None
ITEM 9A. CONTROLS AND PROCEDURES
An evaluation was performed under the supervision and with the participation of the Company's management, including both the Chief Executive Officer and Chief Financial Officer, of the effectiveness of the Company's disclosure controls and procedures, as such term is defined under Rule 13a-15e under the Securities Exchange Act of 1934, as amended (the "Exchange Act") as of December 31, 2016. Based on that evaluation, the Company's management, including the Chief Executive and Chief Financial Officer, concluded that the Company's disclosure controls and procedures are effective to provide reasonable assurance that information required to be disclosed by the Company in reports that it files or submits under the Exchange Act is recorded, processed, summarized and reported as specified in SEC rules and forms and that such information is accumulated and communicated to the Company's management, including the Chief Executive Officer and Chief Financial Officer, or persons performing similar functions, as appropriate to allow timely decisions regarding required disclosure.
There were no changes in the Company's internal control over financial reporting identified in connection with the evaluation of such controls that occurred during the Company's most recent fiscal quarter that has materially affected, or is reasonably likely to materially affect, the Company's internal control over financial reporting.
Management's Annual Report on Internal Controls over Financial Reporting.
Management is responsible for and maintains a system of internal controls over financial reporting that is designed to provide reasonable assurance that its records and filings accurately reflect the transactions engaged in Section 404 of Sarbanes-Oxley Act of 2002 and related rules issued by the SEC requiring management to issue a report on its internal controls over financial reporting.
There are inherent limitations in the effectiveness of any internal control, including the possibility of human error and the circumvention or overriding of controls. Accordingly, even effective internal control can provide only reasonable assurance with respect to financial statement preparation. Further, because of changes in conditions, the effectiveness of internal controls may vary over time.
Management has conducted an assessment of its internal controls over financial reporting as of December 31, 2016 based on criteria established in Internal Control—Integrated Framework (2013) issued by the Committee of Sponsoring Organizations ("COSO") of the Treadway Commission. Based on this assessment, management concluded that our internal controls over financial reporting, excluding ESI and the Vernon, California facility, were effective to provide reasonable assurance regarding the reliability of financial reporting. Under guidelines established by the SEC, companies are permitted to exclude certain acquisitions from their first assessment of internal control over financial reporting following the date of an acquisition. Based on those guidelines, management's assessment of the effectiveness of the Company's internal control over financial reporting as of December 31, 2016 excluded ESI and the Vernon, California facility, which were acquired by the Company in purchase business combinations on May 2, 2016 and October 1, 2016, respectively. Total assets for ESI and the Vernon, California facility constituted approximately 1% and 1%, respectively, of the Company's total consolidated assets at December 31, 2016. For ESI, this includes $1.0 million of goodwill and $1.5 million of acquired intangible assets. For the Vernon, California facility, this includes $354,000 of goodwill and $3.2 million of acquired intangible assets. Total revenues of ESI constituted 1% of the consolidated financial statement revenues for the year ended December 31, 2016. Total revenues of the Vernon, California facility constituted less than 1% of the consolidated financial statement revenues for the year ended December 31, 2016.
108
Our independent registered public accounting firm, Deloitte and Touche LLP, has audited the effectiveness of internal control over financial reporting as of December 31, 2016, as stated in their report, which is included in Part II, Item 8 of this Annual Report on Form 10-K.
None
109
ITEM 10. DIRECTORS, EXECUTIVE OFFICERS AND CORPORATE GOVERNANCE
The information regarding directors and nominees for directors of the Company, including identification of the members of the audit committee and audit committee financial expert, is presented under the headings "Corporate Governance—Committees of the Board of Directors," and "Election of Directors—Nominees For Directors" in the Company's definitive proxy statement for use in connection with the 2016 Annual Meeting of Stockholders (the "Proxy Statement") to be filed within 120 days after the end of the Company's fiscal year ended December 31, 2016. The information contained under these headings is incorporated herein by reference. Information regarding the executive officers of the Company is included in this Annual Report on Form 10-K under Item 1 of Part I as permitted by Instruction 3 to Item 401(b) of Regulation S-K.
We have adopted a code of ethics that applies to our Chief Executive Officer and Chief Financial Officer. This code of ethics is available on our Web site at www.usecology.com. If we make any amendments to this code other than technical, administrative or other non-substantive amendments, or grant any waivers, including implicit waivers, from a provision of this code to our Chief Executive Officer or Chief Financial Officer, we will disclose the nature of the amendment or waiver, its effective date and to whom it applies in a report filed with the SEC.
ITEM 11. EXECUTIVE COMPENSATION
Information concerning executive and director compensation is presented under the heading "Compensation Discussion and Analysis" in the Proxy Statement. The information contained under these headings is incorporated herein by reference.
ITEM 12. SECURITY OWNERSHIP OF CERTAIN BENEFICAL OWNERS AND MANAGEMENT AND RELATED STOCKHOLDER MATTERS
Information with respect to security ownership of certain beneficial owners and management is set forth under the heading "Security Ownership of Certain Beneficial Owners and Directors and Officers" in the Proxy Statement. The information contained under these headings is incorporated herein by reference.
The following table provides information as of December 31, 2016, about the common stock that has been issued under all of our equity compensation plans, including the Omnibus Plan, the 1992 Employee Plan, the 2006 Restricted Stock Plan and the 2008 Stock Option Plan. All of these plans have been approved by our stockholders. The Omnibus Plan, approved in May 2015, superseded our Previous Plans, and the Previous Plans remain in effect solely for the settlement of awards granted under the Previous Plans. The number of securities remaining available for future issuance presented in column (c) in the table below represents securities available under the Omnibus Plan only. No shares that are reserved but unissued
110
under the Previous Plans or that are outstanding under the Previous Plans and reacquired by the Company for any reason will be available for issuance under the Omnibus Plan.
| |
Number of securities to be issued upon exercise of outstanding options, warrants and rights (a)(1) |
Weighted-average exercise price of outstanding options, warrants and rights (b)(2) |
Number of securities remaining available for future issuance under equity compensation plans (excluding securities reflected in column (a)) (c) |
|||||||
|---|---|---|---|---|---|---|---|---|---|---|
Equity compensation plans approved by security holders |
541,092 | $ | 36.49 | 1,266,624 | ||||||
Equity compensation plans not approved by security holders |
— | — | — | |||||||
| | | | | | | | | | | |
Total |
541,092 | $ | 36.49 | 1,266,624 | ||||||
| | | | | | | | | | | |
| | | | | | | | | | | |
| | | | | | | | | | | |
- (1)
- Includes
75,131 shares of unvested restricted stock awards and 19,463 performance stock units outstanding under the Omnibus Plan and 2006 Restricted Stock Plan.
- (2)
- The weighted-average exercise price does not take into account the shares issuable upon vesting of outstanding restricted stock awards, which have no exercise price.
ITEM 13. CERTAIN RELATIONSHIPS AND RELATED TRANSACTIONS, AND DIRECTOR INDEPENDENCE
Information concerning related transactions is presented under the heading "Certain Relationships and Related Transactions" in the Proxy Statement. The information contained under this heading is incorporated herein by reference.
ITEM 14. PRINCIPAL ACCOUNTING FEES AND SERVICES
Information concerning principal accounting fees and services is presented under the heading "Ratification of Appointment of Independent Registered Public Accounting Firm" in the Proxy Statement. The information contained under this heading is incorporated herein by reference.
ITEM 15. EXHIBITS, FINANCIAL STATEMENTS AND SCHEDULES
- (a)
- The
following documents are filed as part of this report:
- 1)
- Consolidated
Financial Statements: See Index to Consolidated Financial Statements at Item 8 of this Annual Report.
- 2)
- Financial
Statement Schedules. Schedules have been omitted because they are not required or because the information is included in the financial statements at
Item 8 of this Annual Report.
- 3)
- Exhibits are incorporated herein by reference or are filed with this Annual Report as set forth in the Index to Exhibits on page 113 hereof.
None
111
Pursuant to the requirements of Section 13 or 15(d) of the Securities Exchange Act of 1934, the registrant has duly caused this report to be signed on its behalf by the undersigned, thereunto duly authorized.
| US ECOLOGY, INC. | ||||
By: |
/s/ ERIC L. GERRATT Eric L. Gerratt Executive Vice President, Chief Financial Officer and Treasurer |
|||
Date: February 27, 2017
Pursuant to the requirements of the Securities Exchange Act of 1934, this report has been signed below by the following persons on behalf of the registrant and in the capacities indicated as of February 27, 2017.
| /s/ JEFFREY R. FEELER Jeffrey R. Feeler (Director) President and Chief Executive Officer |
/s/ ERIC L. GERRATT Eric L. Gerratt Executive Vice President, Chief Financial Officer and Treasurer (Principal Financial Officer and Principal Accounting Officer) |
|
/s/ SIMON G. BELL Simon G. Bell. Executive Vice President and Chief Operating Officer |
/s/ STEVEN D. WELLING Steven D. Welling. Executive Vice President of Sales and Marketing |
|
/s/ STEPHEN A. ROMANO Stephen A. Romano (Director) |
/s/ JOE F. COLVIN Joe F. Colvin (Director) |
|
/s/ DANIEL FOX Daniel Fox (Director) |
/s/ KATINA DORTON Katina Dorton (Director) |
|
/s/ JOHN T. SAHLBERG John Sahlberg (Director) |
112
| Exhibit No. |
Description | Incorporated by Reference from Registrant's |
||||
|---|---|---|---|---|---|---|
| 2.2 | Stock Purchase Agreement among EQ Parent Company, Inc., EQ Group, LLC and US Ecology, Inc. dated April 6, 2014 | 2nd Qtr 2014 Form 10-Q filed 8-11-14 | ||||
3.1 |
Restated Certificate of Incorporation |
2009 Form 10-K |
||||
3.3 |
Amended and Restated Bylaws |
Form 8-K filed 12-11-2007 |
||||
10.1 |
Sublease dated July 27, 2005, between the State of Washington and US Ecology Washington, Inc. |
Form 8-K filed 7-27-05 |
||||
10.2 |
Lease Agreement as amended between American Ecology Corporation and the State of Nevada |
2nd Qtr 2007 Form 10-Q filed 8-7-2007 |
||||
10.3 |
*Amended and Restated American Ecology Corporation 1992 Employee Stock Option Plan |
Proxy Statement dated 4-16-03 |
||||
10.4 |
*Management Incentive Plan Effective January 1, 2013 |
2nd Qtr 2013 Form 10-Q filed 8-1-13 |
||||
10.5 |
*2006 Restricted Stock Plan |
Proxy Statement dated 3-31-06 |
||||
10.6 |
*2008 Stock Option Incentive Plan |
Proxy Statement dated 4-10-2008 |
||||
10.7 |
*Omnibus Incentive Plan |
Proxy Statement dated 4-15-2015 |
||||
10.8 |
*Executive Employment Agreement, dated February 25, 2016, between Jeffrey R. Feeler and US Ecology, Inc. |
2015 Form 10-K |
||||
10.9 |
Amended and Restated 2005 Non-Employee Director Compensation Plan |
2012 Form 10-K |
||||
10.10 |
*Employment Agreement, effective February 25, 2016, between the Company and Eric L. Gerratt |
2015 Form 10-K |
||||
10.11 |
*Employment Agreement, effective February 25, 2016, between the Company and Steven D. Welling |
2015 Form 10-K |
||||
10.12 |
*Employment Agreement, effective February 25, 2016, between the Company and Simon G. Bell |
2015 Form 10-K |
||||
10.13 |
*Employment Agreement, effective February 25, 2016, between the Company and Mario H. Romero |
2015 Form 10-K |
||||
10.14 |
*US Ecology, Inc. 2014 Management Incentive Plan (Executive) |
1st Qtr 2014 Form 10-Q filed 5-7-14 |
||||
113
| Exhibit No. |
Description | Incorporated by Reference from Registrant's |
||||
|---|---|---|---|---|---|---|
| 10.15 | Credit Agreement, dated June 17, 2014, by and among US Ecology, Inc., the lenders referred to therein, Wells Fargo Bank, N.A., as administrative agent, Wells Fargo Securities, LLC and Credit Suisse Securities (USA) LLC, as joint lead arrangers and joint bookrunners, and Comerica Bank, as documentation agent | 2nd Qtr 2014 Form 10-Q filed 8-11-14 | ||||
10.16 |
Guaranty Agreement, dated June 17, 2014, by and among the guarantors from time to time party thereto and Wells Fargo Bank, N.A. |
2nd Qtr 2014 Form 10-Q filed 8-11-14 |
||||
10.17 |
Collateral Agreement, dated June 17, 2014, by and among US Ecology, Inc., the other grantors from time to time party thereto and Wells Fargo Bank, N.A. |
2nd Qtr 2014 Form 10-Q filed 8-11-14 |
||||
10.18 |
*Form of Indemnification Agreement between US Ecology, Inc. and each of the Company's Directors and Officers |
Form 8-K filed 11-12-2014 |
||||
12.1 |
Ratio of Earnings to Fixed Charges |
|||||
21 |
List of Subsidiaries |
|||||
23.1 |
Consent of Deloitte and Touche LLP |
|||||
31.1 |
Certifications of December 31, 2016 Form 10-K by Chief Executive Officer dated February 27, 2017 |
|||||
31.2 |
Certifications of December 31, 2016 Form 10-K by Chief Financial Officer dated February 27, 2017 |
|||||
32.1 |
Certifications of December 31, 2016 Form 10-K by Chief Executive Officer dated February 27, 2017 |
|||||
32.2 |
Certifications of December 31, 2016 Form 10-K by Chief Financial Officer dated February 27, 2017 |
|||||
114
| Exhibit No. |
Description | Incorporated by Reference from Registrant's |
||||
|---|---|---|---|---|---|---|
| 101 | The following materials from the Annual Report on Form 10-K of US Ecology, Inc. for the fiscal year ended December 31, 2016 formatted in Extensible Business Reporting Language (XBRL): (i) Consolidated Balance Sheets, (ii) Consolidated Statements of Operations, (iii) Consolidated Statements of Comprehensive Income, (iv) Consolidated Statements of Cash Flows, (v) Consolidated Statements of Stockholders' Equity, and (vi) Notes to the Consolidated Financial Statements | |||||
- *
- Identifies management contracts or compensatory plans or arrangements required to be filed as an exhibit hereto.
115